Local Characterization of Precipitation and Correlation with the Prior Austenitic Microstructure in Nb-Ti-Microalloyed Steel by SEM and AFM Methods


Department for Materials Science and Engineering, Saarland University, 66123 Saarbrücken, Germany
*
Author to whom correspondence should be addressed.
Metals 2018, 8(8), 636; https://doi.org/10.3390/met8080636
Submission received: 30 July 2018
/
Revised: 8 August 2018
/
Accepted: 8 August 2018
/
Published: 13 August 2018
(This article belongs to the Special Issue Advances in Microalloyed Steels)
Abstract
:Precipitation is one of the most important influences on microstructural evolution during thermomechanical processing (TMCP) of micro-alloyed steels. Due to precipitation, pinning of prior austenite grain (PAG) boundaries can occur. To understand the mechanisms in detail and in relation to the thermomechanical treatment, a local characterization of the precipitation state depending on the microstructure is essential. Commonly used methods for the characterization, such as transmission electron microscopy (TEM) or matrix dissolution techniques, only have the advantage of local or statistically secured characterization. By using scanning electron microscopy (SEM) and atomic force microscopy (AFM) techniques, both advantages could be combined. In addition, in the present work a correlation of the precipitation conditions with the prior austenite grain structure for different austenitization states could be realized by Electron Backscatter Diffraction (EBSD) measurement and reconstruction methods using the reconstruction software Merengue 2.
1. Introduction
The microstructural evolution during thermomechanical processing (TMCP) is not only determined by temperature and deformation, but also by the steel composition. If precipitation and grain boundary pinning occurs during TMCP because of the addition of micro-alloying elements such as titanium and niobium, the driving force for grain boundary motion is reduced by the Zener pinning force [1,2,3,4]. Furthermore, during hot-deformation processing strain-induced precipitation can also occur. This precipitation process results in a retardation of the recrystallization [5,6,7]. In addition to the thermomechanical processing, precipitation formation can occur during welding processes in the heat-affected zone. This leads to an improvement in the fracture toughness and precipitation strengthening, but the precipitates can also act as cleavage initiators [8,9,10,11]. To describe all the mechanisms due to precipitation, many investigations were made using different characterization methods [3,7,12,13,14,15,16].
Sha et al. [3] used TEM to locally characterize larger precipitations in the range of 20–150 nm in a coarse-grained austenitic microstructure in Nb-V-Ti microalloyed steel. A characterization of strain-induced precipitations due to torsion tests was made for Nb-microalloyed steel by Badiola et al. using TEM on carbon extraction replicas. They found Nb(C, N) precipitations less than 10 nm in size and Ti-Nb-rich precipitations between 20 and 60 nm. The smaller ones were determined to be the ones with the higher influence on the recrystallization behavior [12]. TEM methods were also used to characterize strain-induced precipitation behavior in hot-deformed steel by many others [7,13].
Using the matrix dissolution technique proposed by Lu et al. [14] and Hegetschweiler et al. [15] provides the opportunity to analyze a large amount of particles, extracted from the steel matrix. Lu et al. characterized more than 2000 precipitates by TEM measurements. Based on this technique, there is the potential that extracted particles could not only be analyzed and characterized by TEM measurements but also by colloidal methods like field-flow fractionation methods. This offers new chances for a statistically satisfying analysis of the size distribution of a very high amount (>2000) of precipitates.
Rentería-Borja et al. [16] developed a method for the quantification of nanometer-sized precipitates in microalloyed steels using the AFM and an etching with 0.5%-Nital for the selective preparation of the particles. Precipitate size distribution was obtained for three different steels. By chemical etching, the microstructure could also be etched selectively and therefore, the detection possibility of precipitates by AFM measurements could be influenced.
As precipitates influence the recrystallization behavior and the grain growth, their local distribution in the austenitic grain structure is important. Due to the low amount of residual elements as sulfur or phosphorus in low-carbon steel grades, the reconstruction of the PAG structure by chemical etching is not a reliable method [17]. Therefore, the correlation of the prior austenite grain structure with the detected precipitations was made by reconstructing the PAG by EBSD and reconstruction method using the software Merengue 2 [18].
2. Materials and Methods
The investigated steel grade is a low-carbon steel, containing a small amount of the micro-alloying elements niobium (Nb) and titanium (Ti). The chemical composition is presented in Table 1. During reheating of the samples (as-rolled condition), carbides, nitrides and carbo-nitrides will form due to the micro-alloying contents and pre-existing precipitations will grow.
For the investigations, samples with a diameter of 8 mm and a height of 5 mm were used. The heat treatment for the setup of two different prior austenite grain structures and corresponding precipitation conditions consists of three main segments. First, the samples were heated to an austenitization temperature = 1000 °C and then held for a specific time (min). After the holding time, the austenitic samples were water-quenched to produce a fully martensitic microstructure with very thin laths. This is important for the reconstruction of the PAGs out of orientation measurement data (EBSD) because it results in more variants for the reconstruction and therefore increases the reliability of the reconstruction process with Merengue 2. The different applied heat treatment parameters are summarized in Table 2. The expected mean particle diameter from MatCalc 6.01 (MatCalc Engineering GmbH, Vienna, Austria) simulations for both heat treatments is also listed in Table 2, where significant differences can be seen.
After the sample fabrication, the samples were cut in the middle, to avoid influences of decarburization on the edge of the samples. Then the metallographic preparation was applied to the samples, as listed in Table 3. The last step of polishing with the Masterprep® Polishing Suspension (Buehler, ITW Test & Measurement GmbH European Headquarters, Esslingen am Neckar, Germany) is essential for the separation of the precipitations from the steel matrix by AFM analysis and the reduction of remaining surface artifacts due to the previous preparation steps. Subsequently, an area of about 100 × 100 µm2 was marked on the sample surface using the micro-indentation method. This marking is essential for the correlation of the AFM measurements with the reconstructed austenitic microstructure.
If the samples are prepared as described before, the precipitation detection with AFM is possible. The AFM measurements were made using a Dimension Fast Scan AFM (Bruker Corporation, Billerica, MA, USA) with Scan Asyst. One part of this work was to optimize the AFM detection parameters and to find the mode of operation which gives the best results. The parameters used are listed in Table 4. Using the Bruker Peak-Force Tapping Mode with the Scan Asyst-Air Tip gave the best results.
Before correlating the PAG structure with the precipitation state, it is necessary to be sure that the detected particles really are precipitates and that there are no artifacts of the microstructure or preparation method. Therefore, all the particles of an area of 50 × 25 µm2 detected by AFM were chemically analyzed in a Zeiss Sigma SEM (Carl Zeiss Microscopy GmbH, Jena, Germany) using energy dispersive X-ray spectroscopy (EDX, X-Max, Oxford Instruments, Witney, Oxon, UK) measurements.
Afterwards an area of 100 × 100 µm2 was investigated for both samples using the final preparation and AFM detection parameters. Then the sample was transferred to the SEM to perform the EBSD scan using an Oxford EBSD system (Nord-Lys, Oxford Instruments, Witney, Oxon, UK) and the AZtecHKL software (3.1 SP1, Oxford Instruments, Witney, Oxon, UK). The step size was adapted mainly to the martensitic microstructure to a value of 0.075 µm but also to get a high resolution of the prior austenitic grain boundaries after the reconstruction step. By using the CHANNEL5 data processing software (5.12.61.0, Oxford Instruments, Witney, Oxon, UK), the EBSD maps were slightly smoothed and zero-solutions were excluded.
In the following step, the austenite microstructures were reconstructed from the martensitic EBSD measurements. The reconstruction of the parent austenite phase from martensitic EBSD orientation maps is based on two assumptions. First, there must be an orientation relationship (OR) between the parent and the daughter phase, which is strictly respected. In addition, the parents must have a unique local crystallographic orientation. Different ORs between parent (face-centered cubic) and daughter (body-centered cubic) phase were figured out depending on the investigated material and its microstructural condition [19]. Besides the Kurdjumov-Sachs and Nishiyama-Wassermann ORs, there is the OR of Greninger and Troiano (GT), which was applied in this work. The reconstruction method used in this work was also successfully applied in other works to investigate other mechanisms such as grain growth behavior or recrystallization mechanisms in microalloyed steels [20,21,22].
As other studies have shown, using the Merengue 2 reconstruction software with assuming the GT Orientation Relationship as the starting OR gives very good results for the used steel grade [21]. The chosen OR was refined during the reconstruction using local misorientations [23]. The reconstruction method with Merengue 2 is explained in detail in [18].
Basically, it involves two main steps:
- Identification of clusters of at least three neighboring domains related to a unique parent orientation within a tolerance of 3°, called fragments.
- All child domains were browsed recursively starting from a fragment within a tolerance of 3°, from neighbor to neighbor. If they share the parent orientation of the fragment, they were assigned to the according parent.
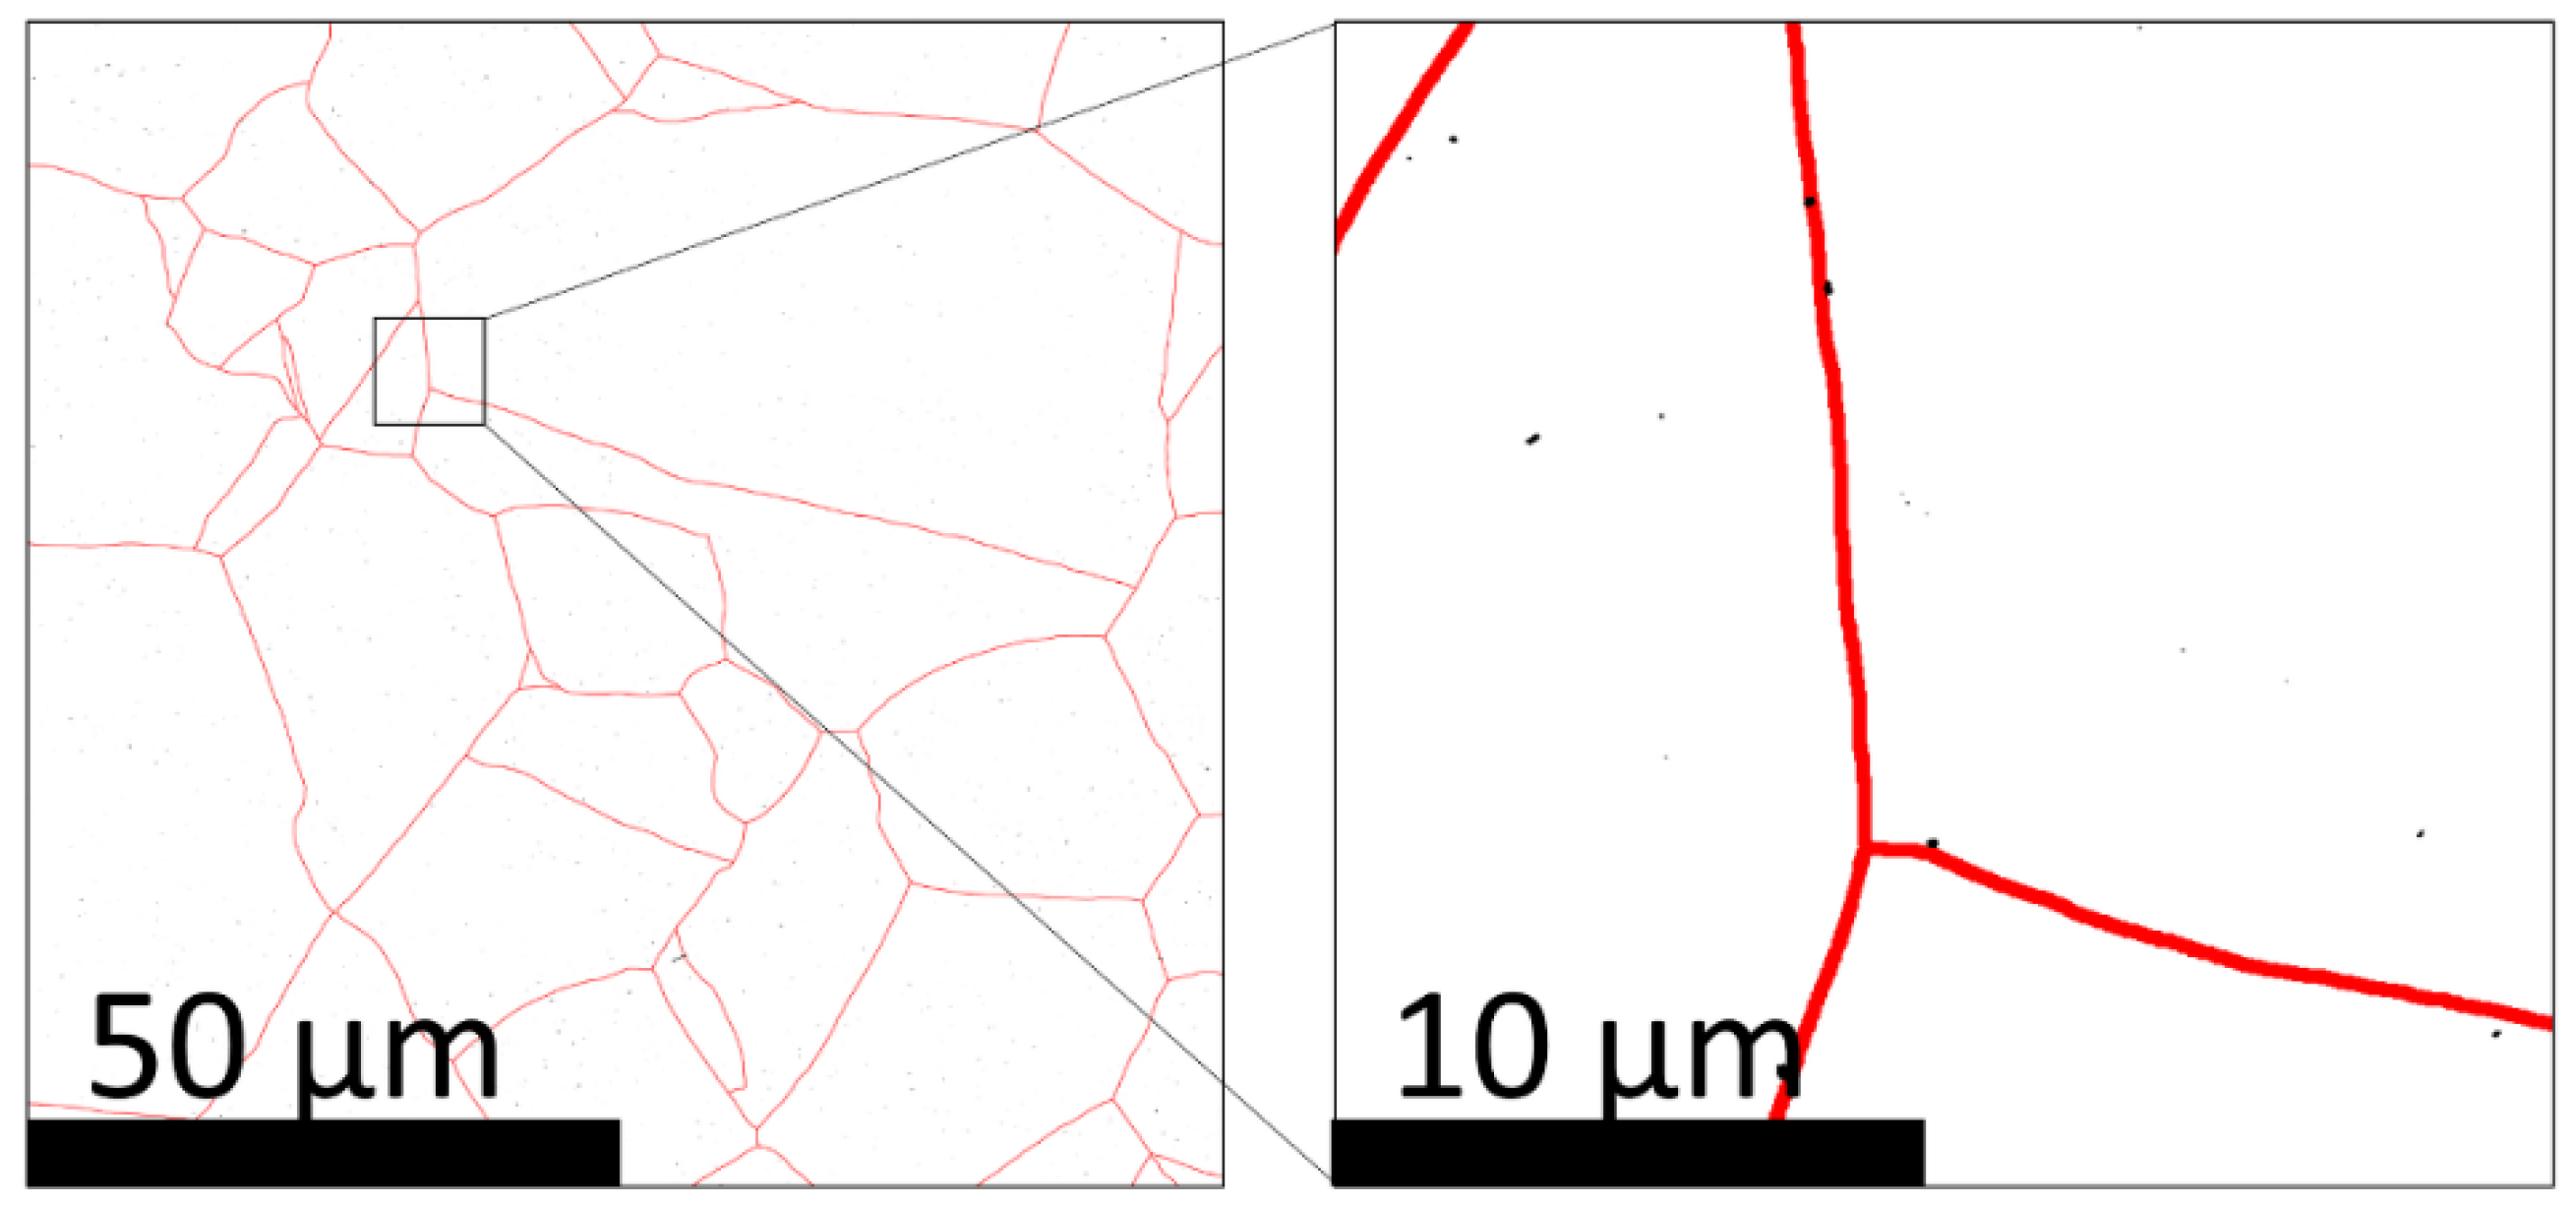
Then the austenite grains could be detected in the CHANNEL5 data processing software by defining a misorientation angle for the separation of two grains. The detected grain boundaries were segmented and aligned to a SE-image to correct the drift that may occur during the long duration of the EBSD measurement. The overall reconstruction process is schematically shown in Figure 1. Figure 1a,b show the unreconstructed and corresponding reconstructed EBSD map. Figure 1c only contains the segmented grain boundaries that were finally aligned to the corresponding SE-image to correct possible errors due to thermal drift.
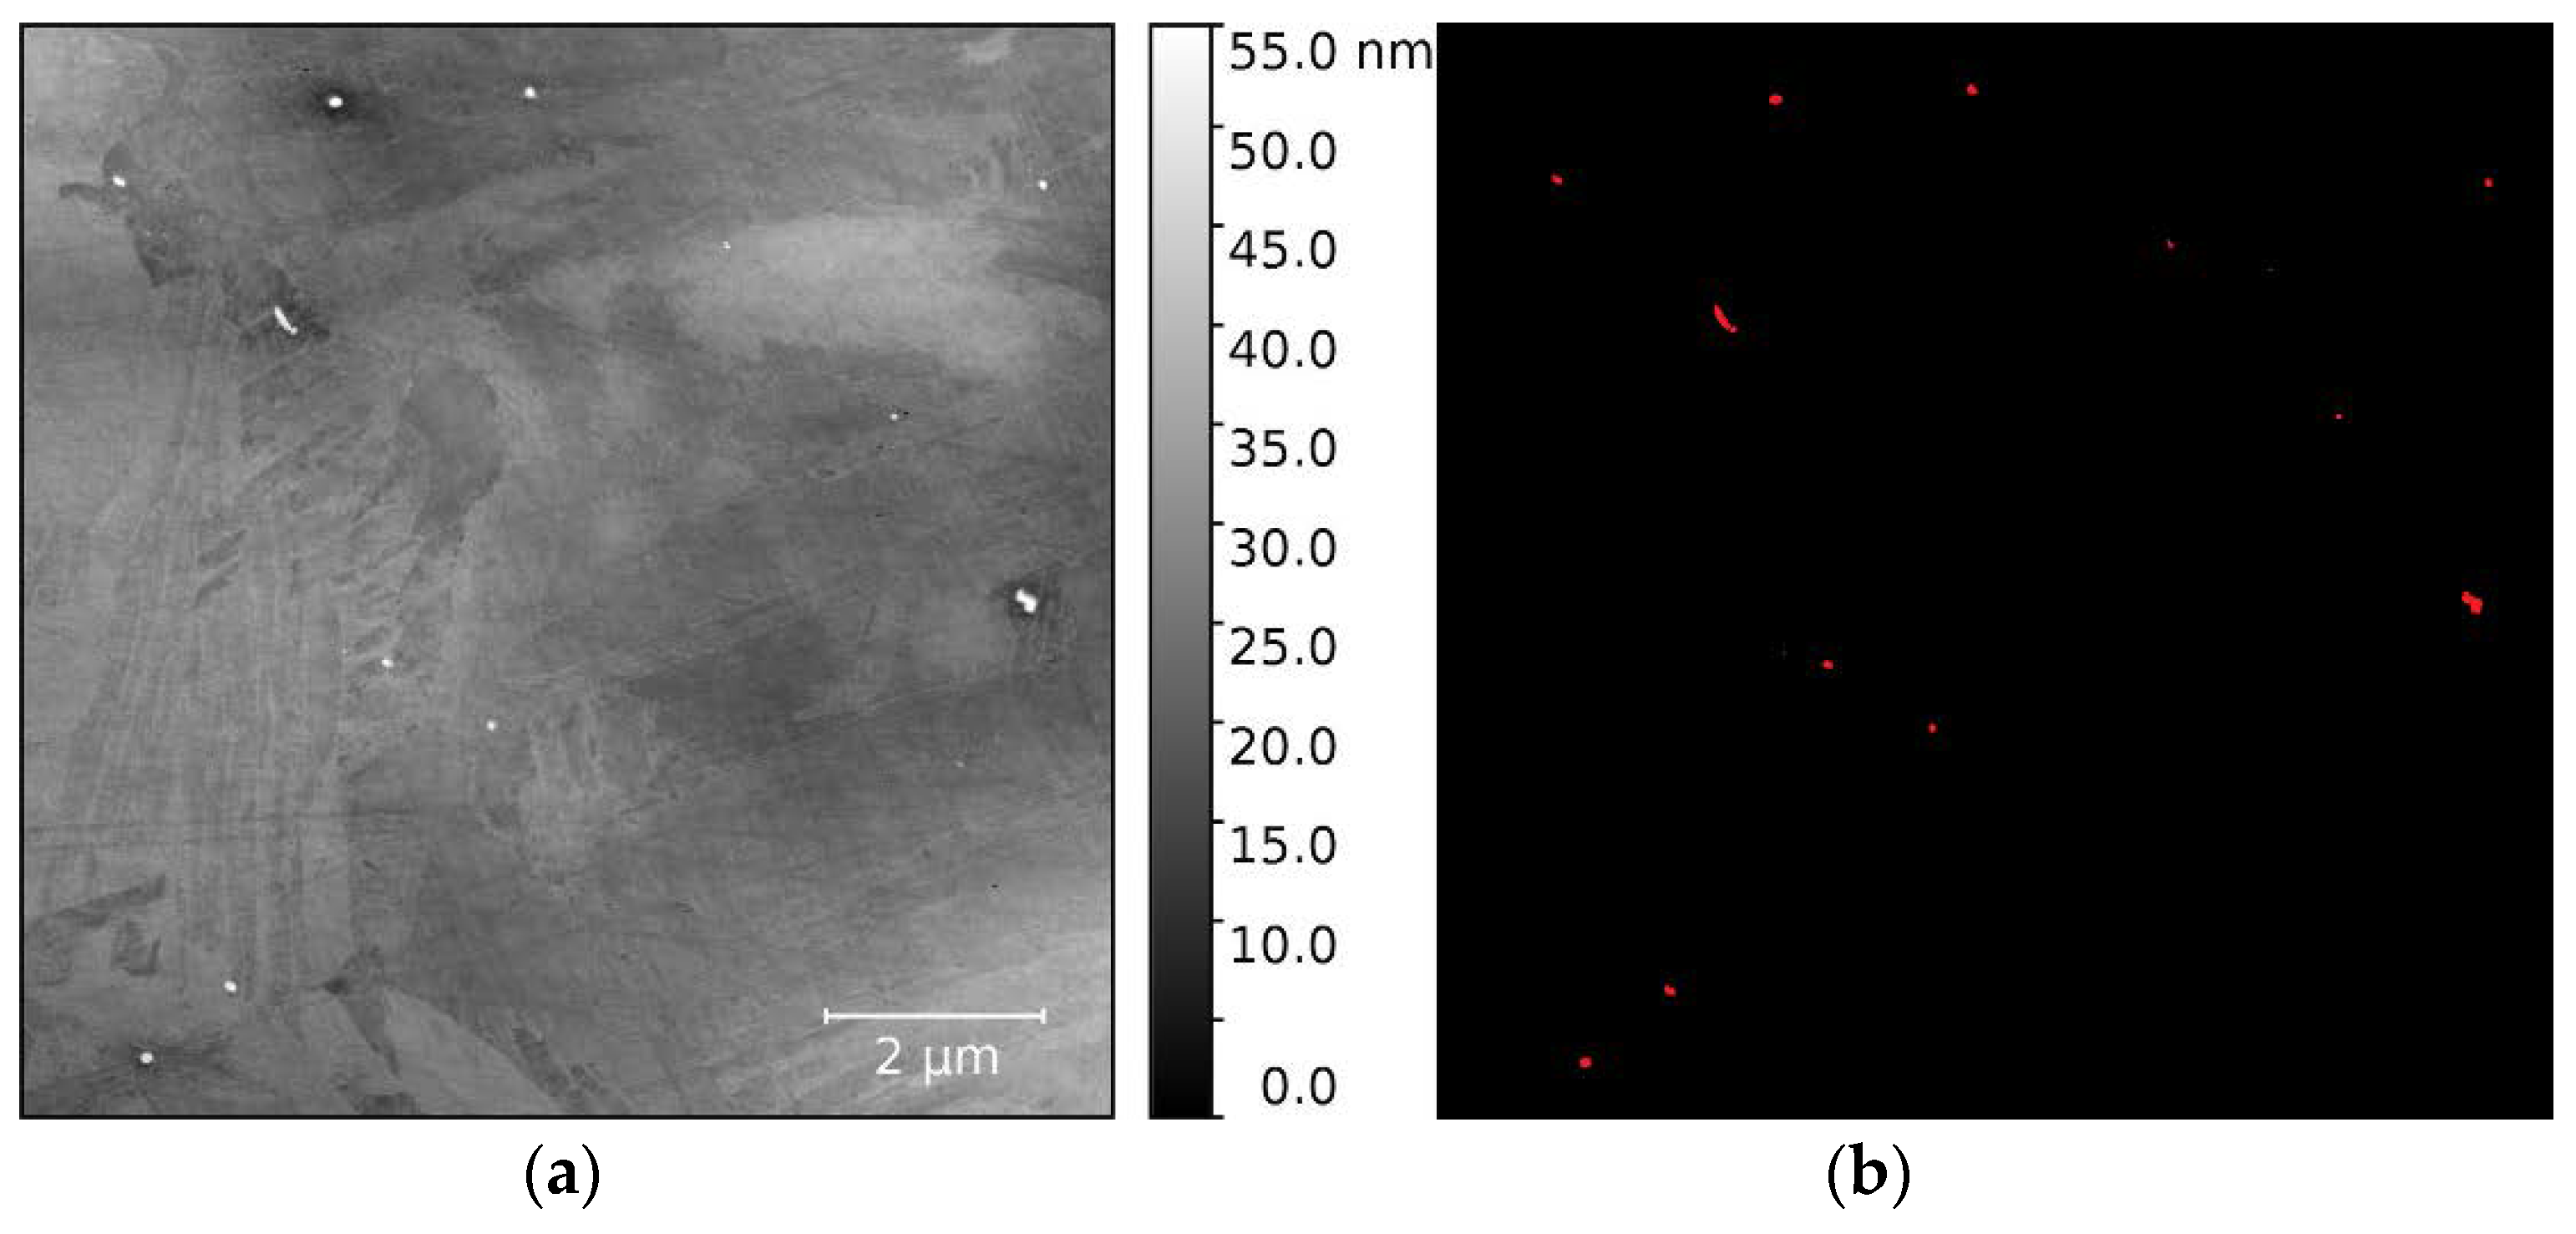
In addition to the segmentation of the grain boundaries, the precipitations have to be extracted from the AFM measurements. This was made with the Axio Vision 4.8 analyzing software (Carl Zeiss Microscopy GmbH, Jena, Germany) by a segmentation of the particles from the matrix. Figure 2 shows an original AFM image (a) and the corresponding image with the segmented particles in red (b). For the segmentation of the particles a shading correction or a high-pass filter is applied to the AFM images. In a second step the contrast, brightness and gamma values have to be optimized. Then the segmentation takes places by defining a threshold to the grayscale values that excludes the background (matrix). All grayscale values that are higher than this threshold are defined as particles and statistically evaluated.
Now it was possible to correlate the grain boundaries and the particle distribution by adjusting both resulting maps based on the micro-indents. After the alignment, a statistical evaluation was carried out including the total number of precipitates, the number of precipitates on the grain boundary, and the size distribution of the particles depending on the austenitization state.
3. Results
3.1. Precipitation Detection with AFM and Chemical Verification by EDX
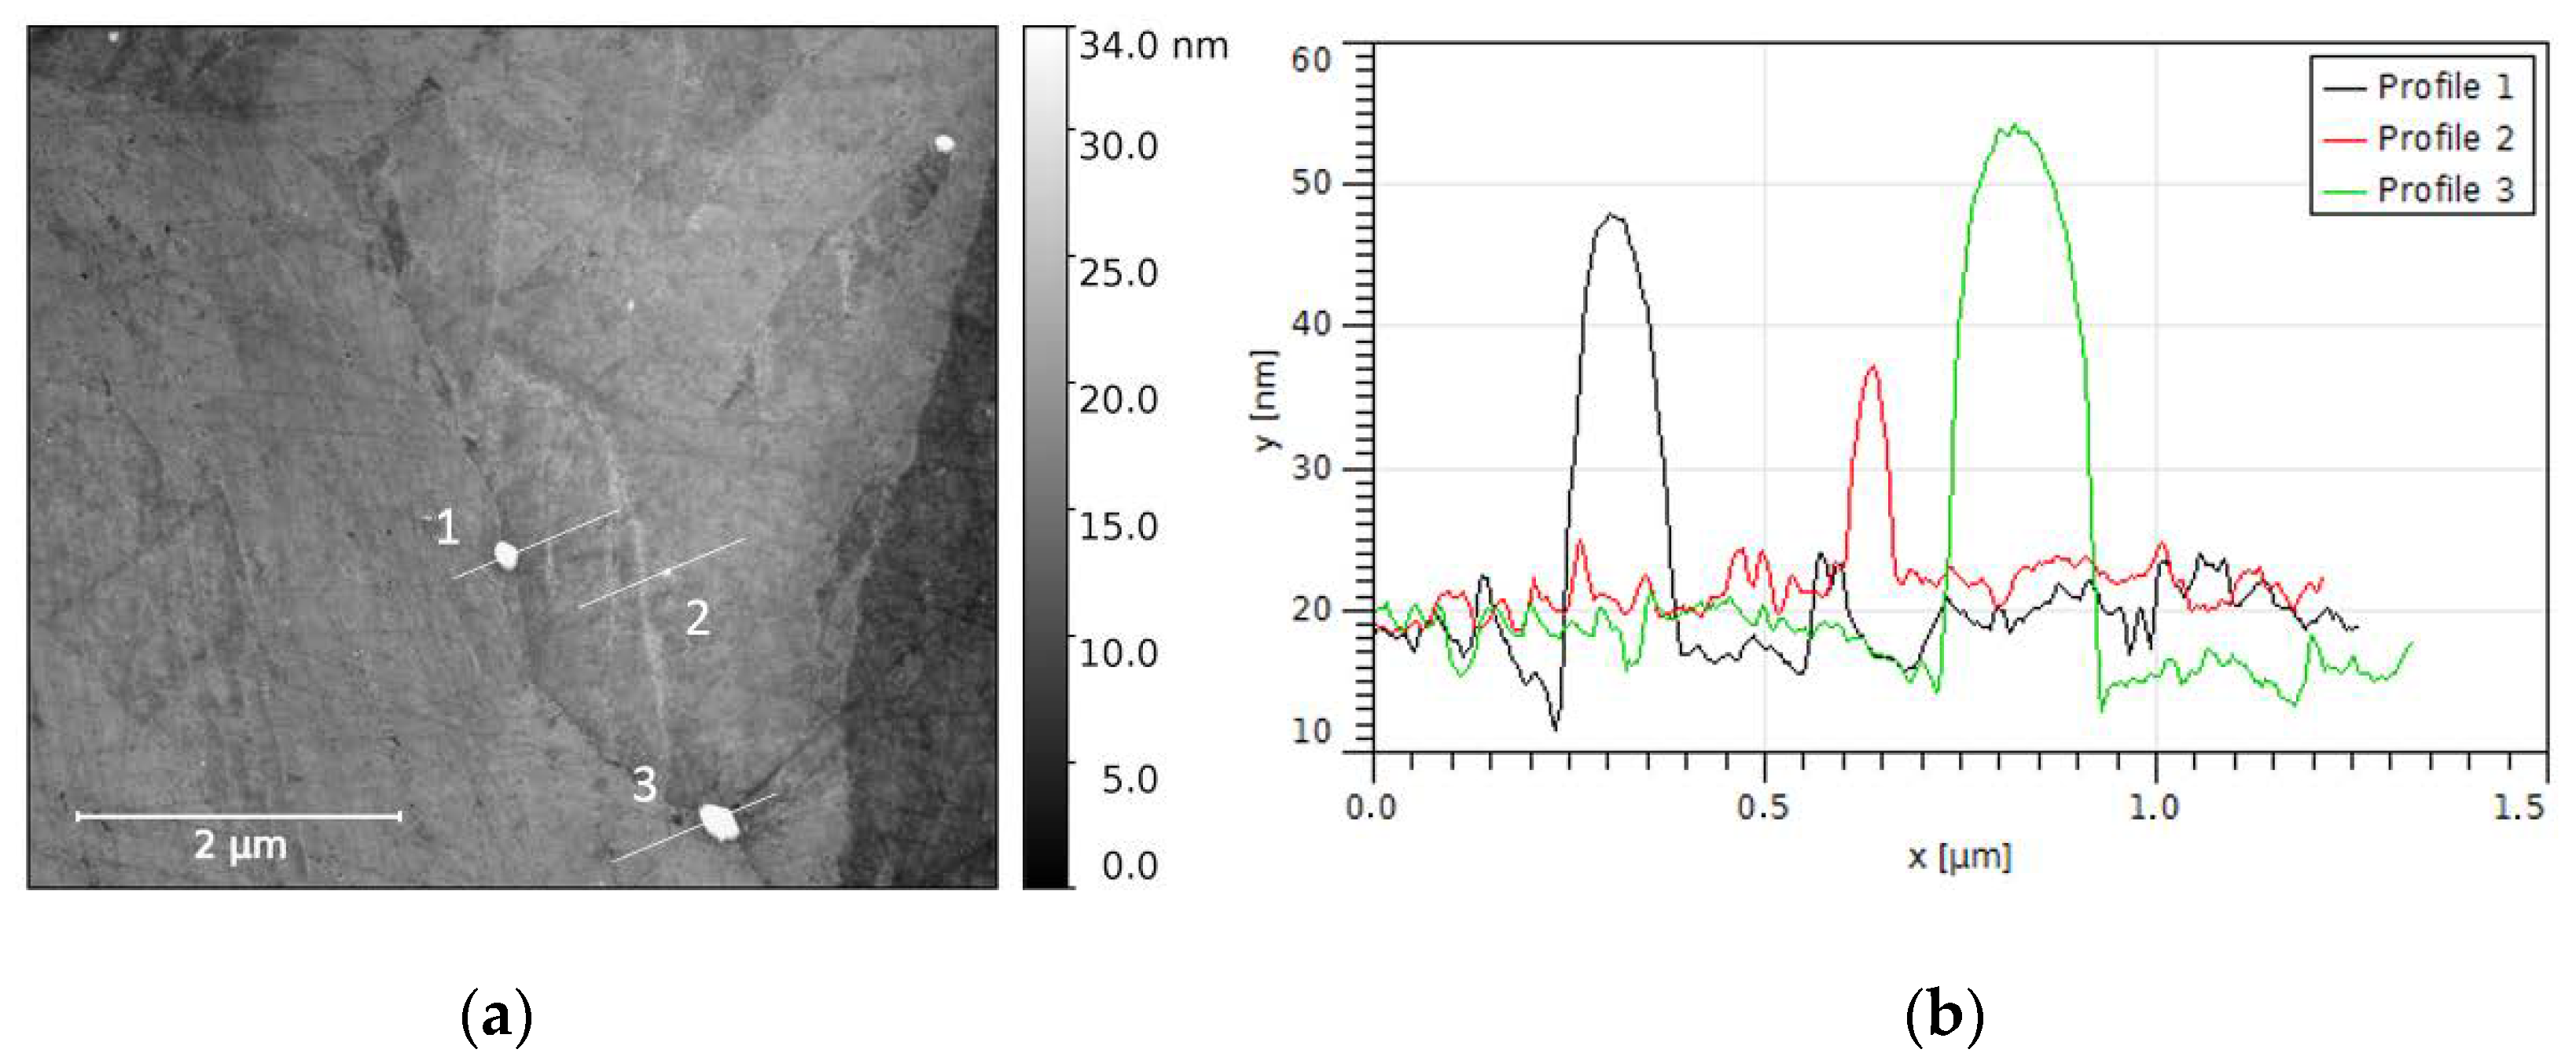
Figure 3a shows a typical result of the AFM measurements. Different particles in different size ranges could be detected within the grains as well as on grain boundaries. The line profile of the height for three different particles exemplifies the difference between matrix and particles in height due to the selective erosion by preparation (Figure 3b). This difference increases with the particle diameter, but is also big enough to be used for smaller particles (~10 nm) as a good indicator for the differentiation from the matrix.
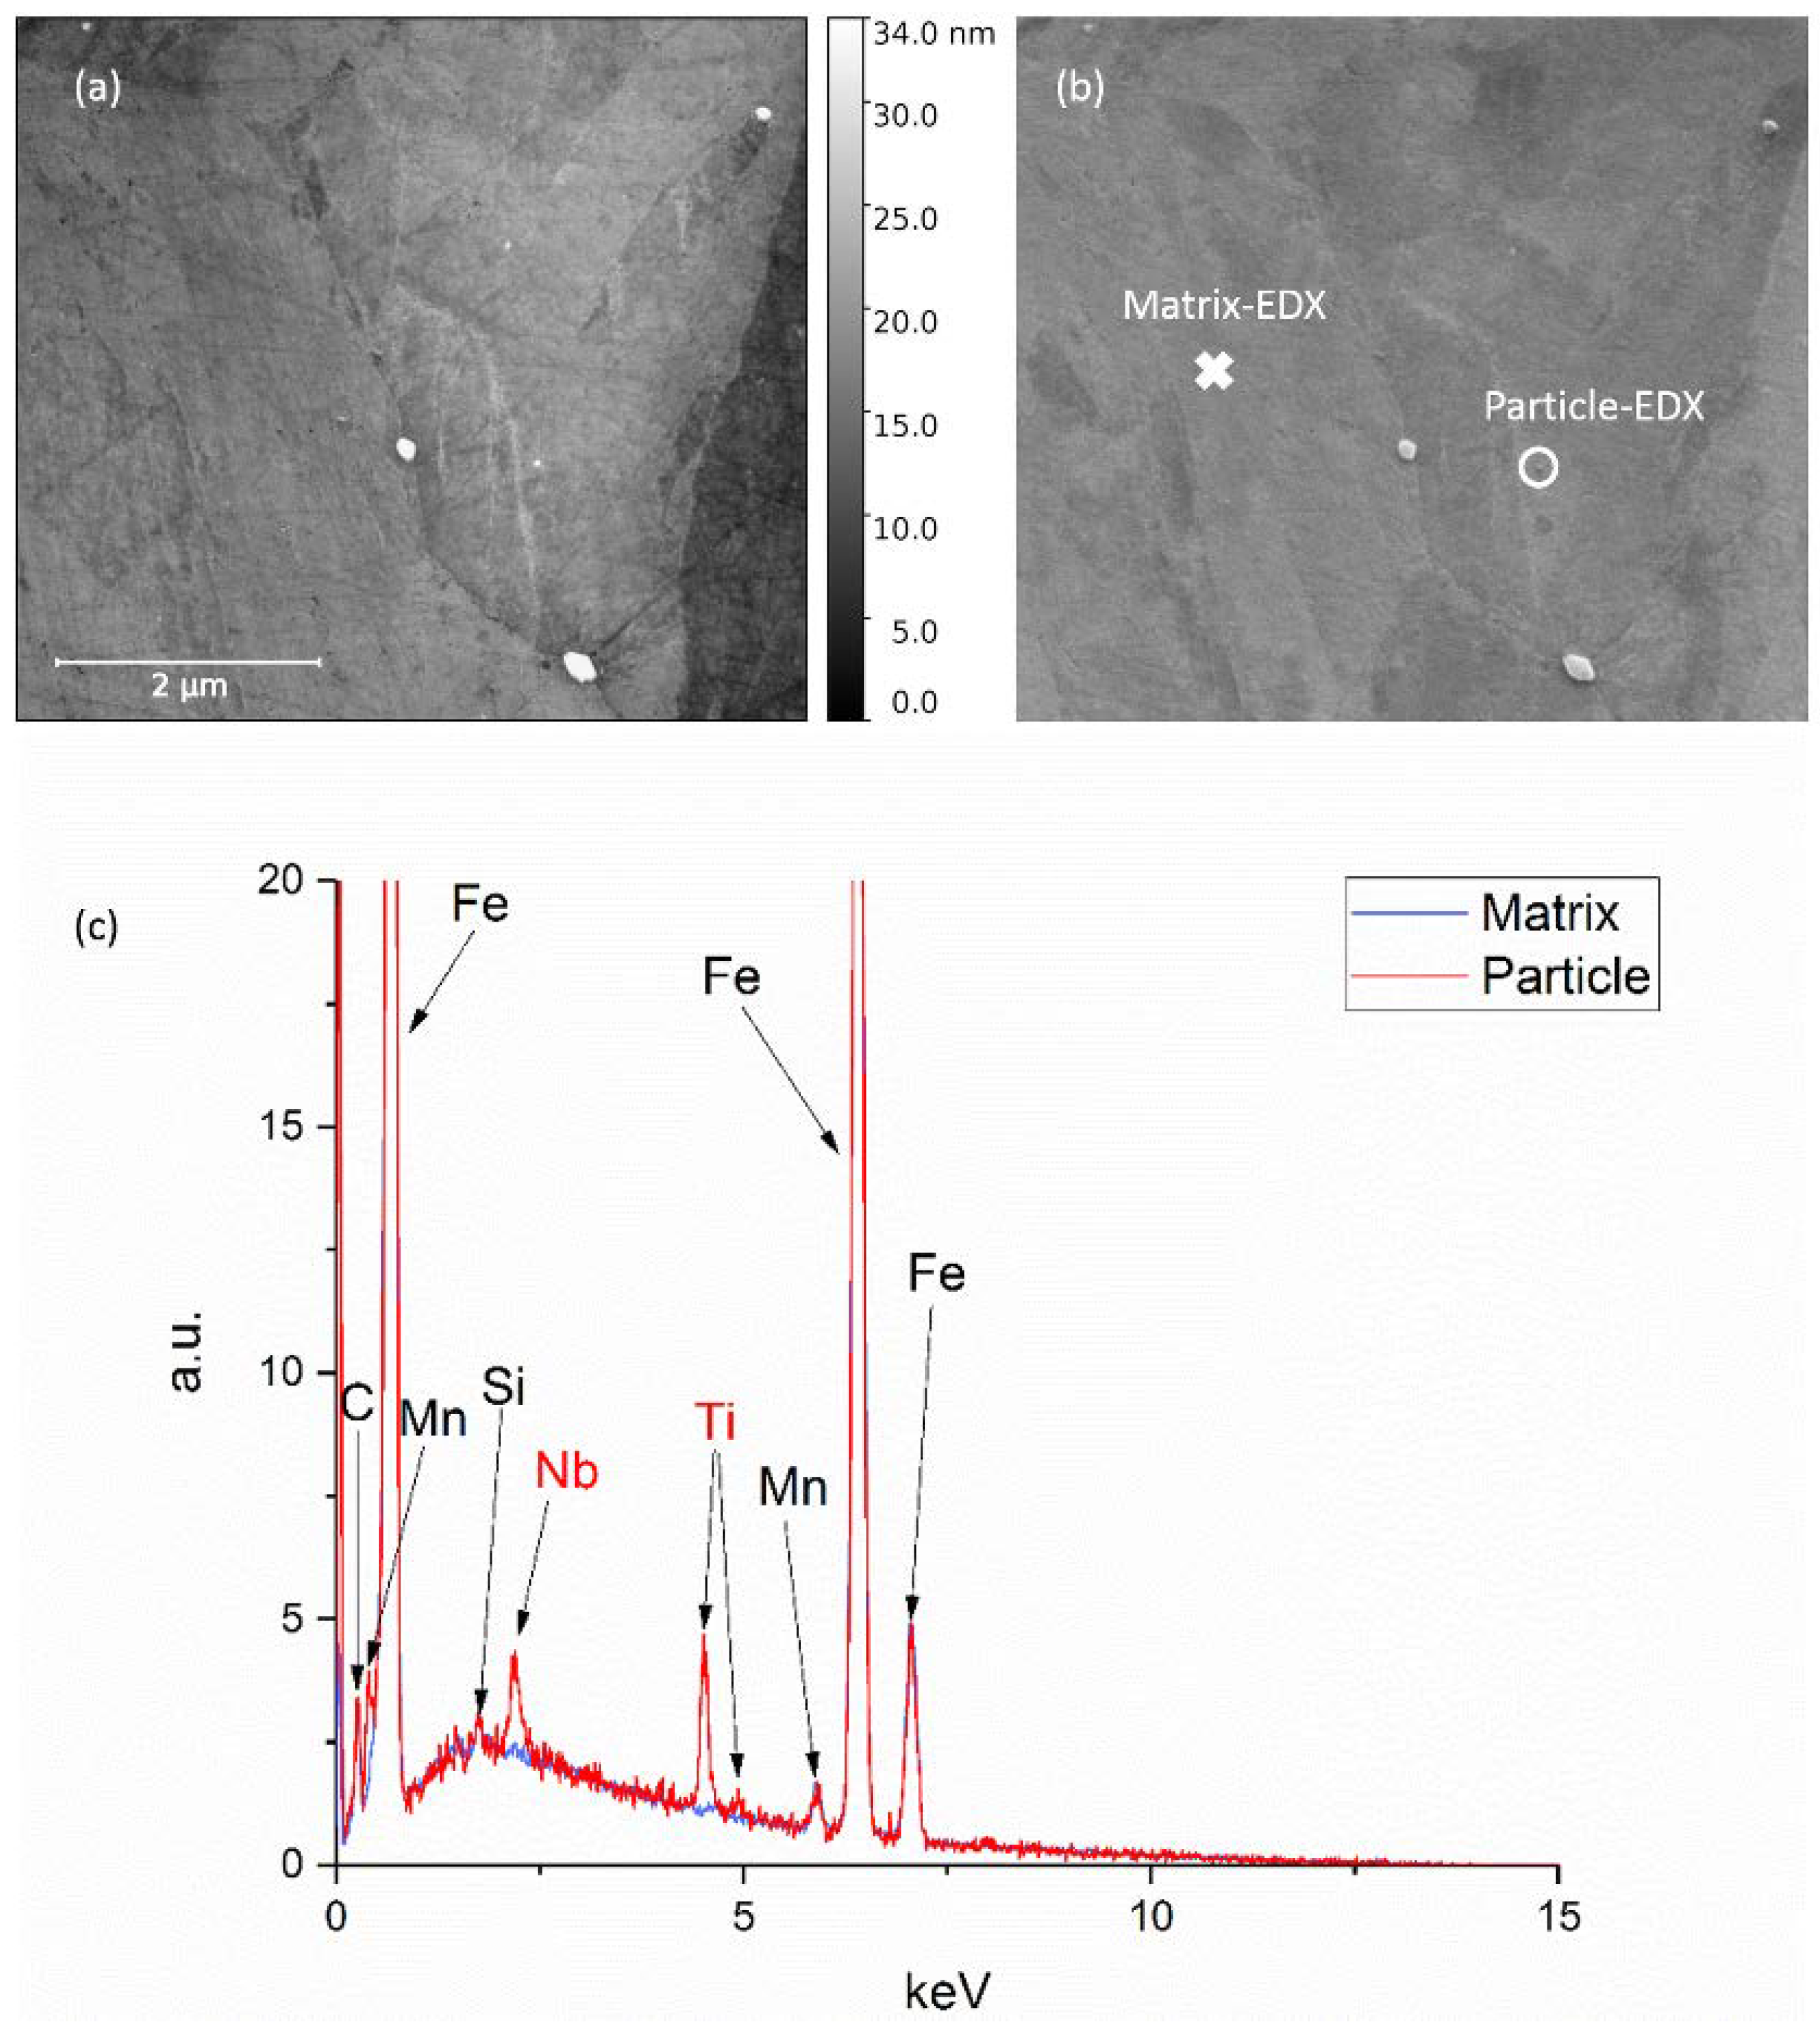
The precipitates detected by AFM were verified by chemical analysis with EDX, as shown in Figure 4. The comparison of one AFM and SE image is shown where the particles and matrix can be easily distinguished because of their differences in contrast and brightness. The EDX verification measurement is also displayed for one particle and one point in the steel matrix. The occurrence and height of the titanium and niobium peaks in the EDX spectrum of the particle is the most obvious difference compared to the spectrum of the matrix. This peak is the basis for the definition of the measured particles as precipitates. Although a quantitative determination of the titanium or niobium content of one particle is not possible, there are differences between titanium and titanium-free precipitates. In total, this verification was made for an area of 50 × 25 µm2 with at least 200 particles. This verification showed that 97.5% of all analyzed particles were precipitates containing titanium and/or niobium. Hence, the chemical analysis of the precipitations confirms the assumption that all detected particles are indeed precipitations and there are no artifacts from the microstructure or preparation method.
Figure 5 shows the result of an AFM measurement at a very high resolution of 1280 lines per µm. At this resolution, particles in the size range of around 10 nm in diameter could also be detected. The diameter of the four biggest particles of this map was measured as 9.1 to 13.3 nm, but the detection of even smaller particles should be possible by modifying the AFM parameters and the preparation method.
3.2. Correlation of Precipitates with the PAG Structure and Comparison of Two Austenitization States
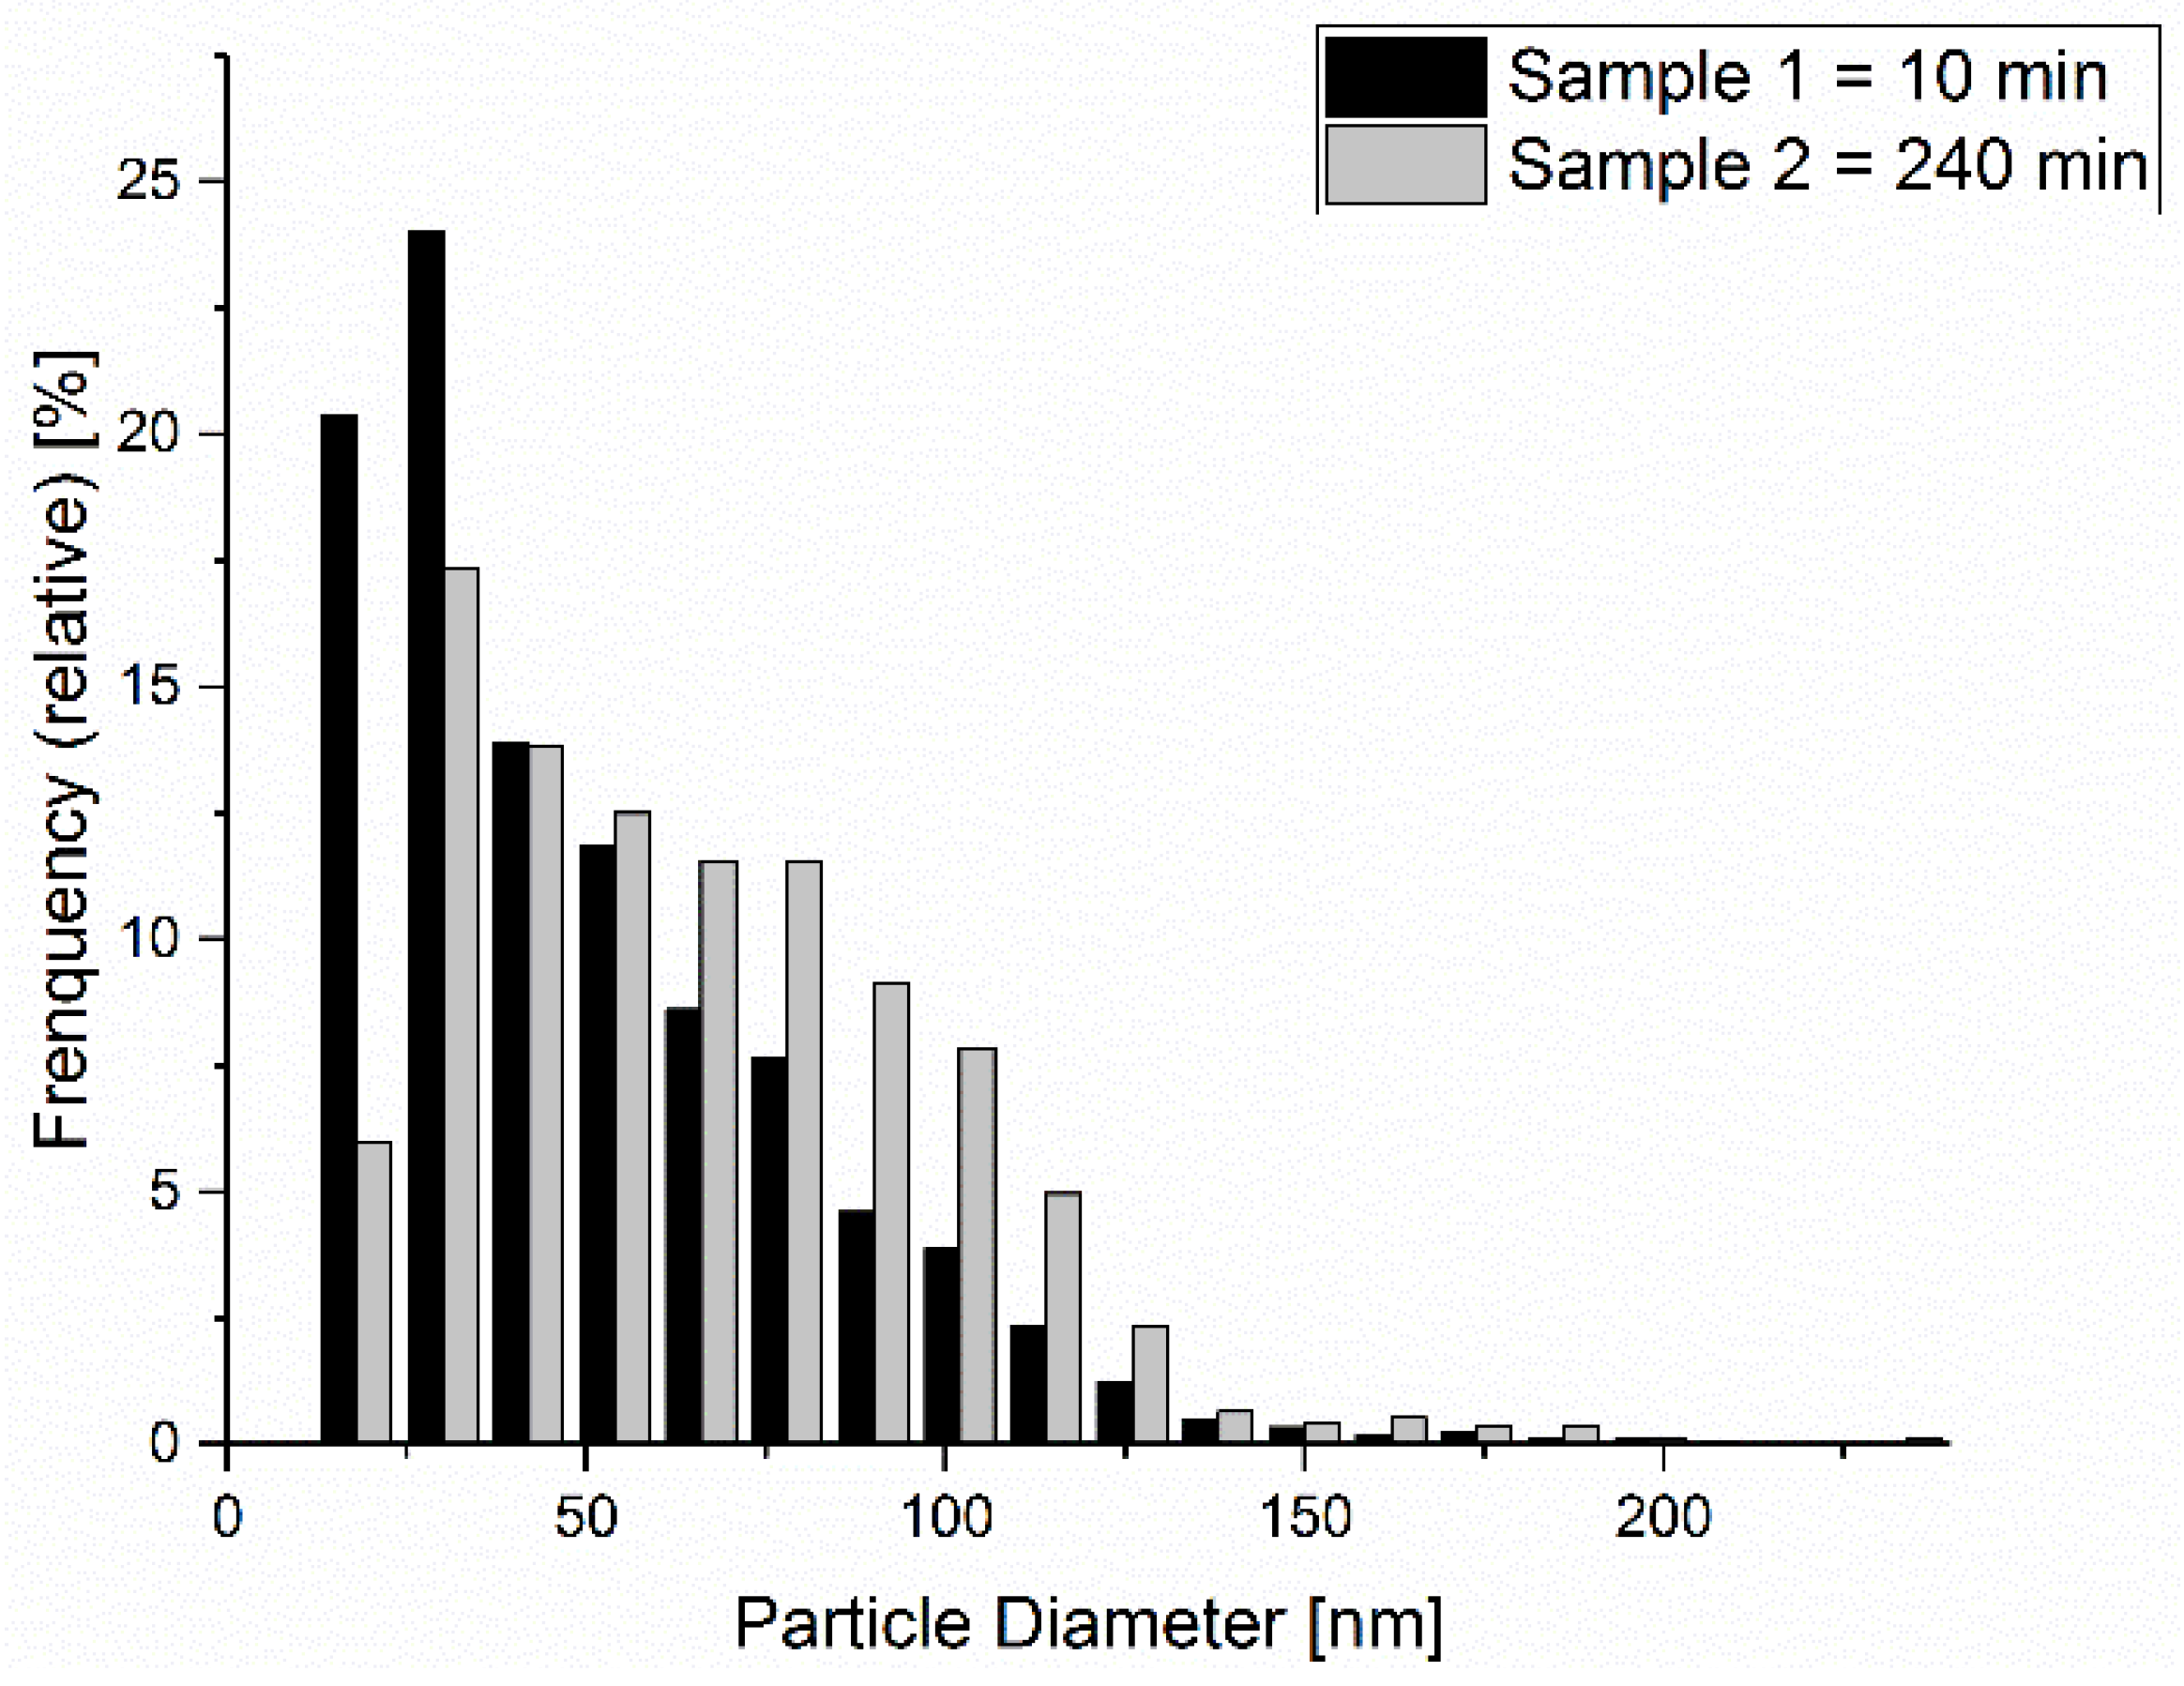
Figure 6 shows the correlation of the segmented PAG with the segmented precipitates for the austenitization state of 10 min austenitization time at 1000 °C austenitization temperature. The size distribution of the mean particle diameter for both samples is compared in Figure 7. One aim of the present study was to analyze differences between these two microstructures, depending on their precipitation state. Table 5 summarizes the results of the statistical analysis for both samples.
For both samples, a comparable number of particles could be detected by AFM measurements. Comparing the particle size distribution of both samples (Figure 7), the mean particle diameter of the sample with 10-min austenitization time is lower than the particle diameter for long austenitization times. This confirms the presumption that the particle diameter will increase with a longer austenitization time and also confirms our expectations after the pre-simulations with MatCalc. The simulations with MatCalc were only slightly optimized for the used steel grade and only made for a simple pre-estimation of the particle diameters depending on different heat treatments. The difference in the mean diameter in the experimental results is much smaller than in the simulations. One reasonable explanation is that in the simulations only two particle classes of pure TiN and pure NbC particles are assumed. In the real material complex particles, containing both Ti and Nb, may also occur. The size range of the investigated and simulated mean particle sizes is comparable.
Comparing the number of particles on the PAG boundaries by the correlation of the microstructure and the precipitation states shows that for Sample 1 the number of particles on the grain boundary is higher than for Sample 2. In both cases, around 5% of all detected particles are lying on the PAG. Differences arise when comparing the number of particles on the grain boundaries relative to the whole grain boundary lengths, which could be measured after reconstruction. Therefore, the number of particles on the PAG for Sample 1 is about 11 per 100 µm grain boundary length and for Sample 2 only five. Because of holding Sample 2 at high temperatures for a longer period of time, the total number of precipitates is reduced. During holding the bigger particles grow whereas the smaller ones will dissolve.
4. Discussion
With this preparation and characterization method, precipitates on the boundaries of different shapes and sizes could have been detected. The size of precipitates that could be detected with this method is 10 nm or even smaller.
The comparison of AFM and SE images and the chemical verification by EDX measurements ensures that nearly all particles detected by AFM are indeed precipitates containing niobium and/or titanium. The advantage of the method developed in this work is the detection of a high number of particles, comparable to other methods such as the matrix dissolution technique, with a comparatively low effort of sample preparation and implementation.
By correlating the PAG structure with the measured precipitation state, not only statistical assumptions related to the total number of particles could be made. This way to investigate the precipitation state retains its local resolution and enables a clear statement about how many of the detected particles are placed on the PAG boundaries and within the grains.
To avoid errors due to the PAG reconstruction, the quality of EBSD measurements was verified by the MAD (mean angular deviation) value, which is the quality parameter of the Oxford EBSD system and also the indexing rate of the EBSD depending on this MAD value (MAD > 1: no indexing, zero solution). The maximum value of the MAD was 0.42 and the indexing rate 97.57% at the minimum. In addition, small grains (below 3 pixels) were removed before reconstruction and single-pixel grains were removed prior to the reconstruction step. Because the reconstruction step is very sensitive to the microstructure, very high cooling rates were realised by water quenching. This leads to a fully martensitic microstructure with more variants available for the reconstruction step [24]. The best OR was found by avoiding local minima, which is described in detail in [23]. The angular tolerance for the reconstruction was set to 3°, which is smaller than other authors have reported [25].
However, due to possible errors in the EBSD and reconstruction step, the statistical evaluation could be influenced. There can be particles that are lying on the PAG boundary but do not occur in the corresponding statistical values due to possible reconstruction and correlation errors. Especially for Sample 2, the reconstruction of the PAG structure from the orientation data was not reliable in every part of the map. Therefore, a manual correction under consideration of the real microstructure measured in AFM was made.
Possible errors because of the thermal drift of the samples in the AFM and SEM were corrected by adjusting the different measurements on the micro-indents before the statistical evaluation of the correlation was made. Even this method only delivers insights in two dimensions; the results are statistically secured by investigating a minimal area of 100 × 100 µm2 with a relatively high number of more than 1500 particles for each sample.
5. Conclusions
The presented AFM method in synergy with EBSD/SEM methods may be used to analyze and understand the precipitation states in different microstructures depending on the processing parameters. Moreover, a statistical evaluation of the mean particle size and the number of particles on the grain boundaries is possible. By refining the detection parameters and increasing resolution of the AFM scan, particles smaller than 10 nm in diameter could also be detected, which also makes it possible to characterize other precipitation states in future projects as strain induced precipitation. By using EBSD and PAG reconstruction methods, recrystallized and unrecrystallized grains can be distinguished and then correlated with very small, strain-induced precipitations detected by the AFM. In future investigations, the three-dimensional precipitation state including the correlation with the prior austenitic microstructure could also be investigated using tomographic methods.
Author Contributions
Conceptualization, L.E. and J.F.; Methodology, J.F.; Validation, J.F., L.E.; Formal Analysis, J.F., L.E.; Investigation, J.F.; Writing-Original Draft Preparation, L.E.; Writing-Review & Editing, L.E.; Visualization, L.E. and J.F.; Supervision, L.E.; Project Idea: C.M.; Project Administration, C.M.; Funding Acquisition, C.M.
Funding
This research received no external funding.
Acknowledgments
The authors would like to thank Dillinger for providing the sample material and Lionel Germain for providing the reconstruction software Merengue 2. They also acknowledge the Deutsche Forschungsgemeinschaft (German Research Foundation, DFG) and the state of Saarland for the financial support for the atomic force microscope (INST 256/455-1) and the scanning electron microscope (INST 256/340-1 FUGG) used in this work.
Conflicts of Interest
The authors declare no conflict of interest.
References
- Chapa, M.; Medina, S.F.; Lopez, V.; Fernandez, B. Influence of Al and Nb on Optimum Ti/N Ratio in Controlling Austenite Grain Growth at Reheating Temperatures. ISIJ Int. 2002, 42, 1288–1296. [Google Scholar] [CrossRef]
- Manohar, P.A.; Ferry, M.; Chandra, T. Five Decades of the Zener Equation. ISIJ Int. 1998, 38, 913–924. [Google Scholar] [CrossRef]
- Sha, Q.Y.; Sun, Z.Q. Grain growth behavior of coarse-grained austenite in a Nb-V-Ti microalloyed steel. Mater. Sci. Eng. A 2009, 523, 77–84. [Google Scholar] [CrossRef]
- Medina, S.F.; Chapa, M.; Valles, P.; Quispe, A.; Vega, M.I. Influence of Ti and N contents on austenite grain control and precipitate size in structural steels. ISIJ Int. 1999, 39, 930–936. [Google Scholar] [CrossRef]
- Dutta, B.; Valdes, E.; Sellars, C.M. Mechanism and kinetics of strain induced precipitation of Nb(C, N) in austenite. Acta Metall. Mater. 1992, 40, 653–662. [Google Scholar] [CrossRef]
- Le Bon, A.; Rofes-Vernis, J.; Rossard, C. Recrystallization and Precipitation during Hot Working of a Nb-Bearing HSLA Steel. Met. Sci. 1975, 9, 36–40. [Google Scholar] [CrossRef]
- Pereloma, E.V.; Crawford, B.R.; Hodgson, P.D. Strain-induced precipitation behaviour in hot rolled strip steel. Mater. Sci. Eng. A 2001, 299, 27–37. [Google Scholar] [CrossRef]
- Shanmugam, S.; Ramisetti, N.K.; Misra, R.D.K.; Hartmann, J.; Jansto, S.G. Microstructure and high strength-toughness combination of a new 700 MPa Nb-microalloyed pipeline steel. Mater. Sci. Eng. A 2008, 478, 26–37. [Google Scholar] [CrossRef]
- Shanmugam, S.; Misra, R.D.K.; Hartmann, J.; Jansto, S.G. Microstructure of high strength niobium-containing pipeline steel. Mater. Sci. Eng. A 2006, 441, 215–229. [Google Scholar] [CrossRef]
- Charleux, M.; Poole, W.J.; Militzer, M.; Deschamps, A. Precipitation behavior and its effect on strengthening of an HSLA-Nb/Ti steel. Metall. Mater. Trans. A 2001, 32, 1635–1647. [Google Scholar] [CrossRef]
- Zhang, L.P.; Davis, C.L.; Strangwood, M. Effect of TiN particles and microstructure on fracture toughness in simulated heat-affected zones of a structural steel. Metall. Mater. Trans. A 1999, 30, 2089–2096. [Google Scholar] [CrossRef]
- Jorge-Badiola, D.; Gutiérrez, I. Study of the strain reversal effect on the recrystallization and strain-induced precipitation in a Nb-microalloyed steel. Acta Mater. 2004, 52, 333–341. [Google Scholar] [CrossRef]
- Jia, Z.; Misra, R.D.K.; O’Malley, R.; Jansto, S.J. Fine-scale precipitation and mechanical properties of thin slab processed titanium-niobium bearing high strength steels. Mater. Sci. Eng. A 2011, 528, 7077–7083. [Google Scholar] [CrossRef]
- Lu, J.F.; Wiskel, J.B.; Omotoso, O.; Henein, H.; Ivey, D.G. Matrix dissolution techniques applied to extract and quantify precipitates from a microalloyed steel. Metall. Mater. Trans. A 2011, 42, 1767–1784. [Google Scholar] [CrossRef]
- Hegetschweiler, A.; Kraus, T.; Staudt, T. Colloidal analysis of particles extracted from microalloyed steel. Metall. Ital. 2017, 3, 23–28. [Google Scholar]
- Rentería-Borja, L.; Hurtado-Delgado, E.; Garnica-González, P.; Domínguez-López, I.; García-García, A.L. Atomic force microscopy applied to the quantification of nano-precipitates in thermo-mechanically treated microalloyed steels. Mater. Charact. 2012, 69, 9–15. [Google Scholar] [CrossRef]
- Weyand, S.; Britz, D.; Rupp, D.; Mücklich, F. Investigation of Austenite Evolution in Low-Carbon Steel by Combining Thermo-Mechanical Simulation and EBSD Data. Mater. Perform. Charact. 2015, 4, 322–340. [Google Scholar] [CrossRef]
- Germain, L.; Gey, N.; Mercier, R.; Blaineau, P.; Humbert, M. An advanced approach to reconstructing parent orientation maps in the case of approximate orientation relations: Application to steels. Acta Mater. 2012, 60, 4551–4562. [Google Scholar] [CrossRef]
- Nolze, G. Improved determination of FCC/BCC orientation relationships by use of high-indexed pole figures. Cryst. Res. Technol. 2006, 41, 72–74. [Google Scholar] [CrossRef]
- Humbert, M.; Germain, L.; Gey, N.; Boucard, E. Evaluation of the orientation relations from misorientation between inherited variants: Application to ausformed martensite. Acta Mater. 2015, 82, 137–144. [Google Scholar] [CrossRef]
- Krämer, T.; Eisenhut, L.; Germain, L.; Rupp, D.; Detemple, E.; Motz, C. Assessment of EBSD Analysis and Reconstruction Methods as a Tool for the Determination of Recrystallized Fractions in Hot-Deformed Austenitic Microstructures. Metall. Mater. Trans. A 2018, 49, 2795–2802. [Google Scholar] [CrossRef]
- Eisenhut, L.; Rupp, D.; Motz, C. Evolution of the austenitic grain growth of micro-alloyed steels was studied by metallography and EBSD analysis and compared to a grain growth model. In Proceedings of the 5th International Conference on Thermomechanical Processing (TMP), Milan, Italy, 26–28 October 2016; p. 5026. [Google Scholar]
- Humbert, M.; Blaineau, P.; Germain, L.; Gey, N. Refinement of orientation relations occurring in phase transformation based on considering only the orientations of the variants. Scr. Mater. 2011, 64, 114–117. [Google Scholar] [CrossRef]
- Blaineau, P.; Germain, L.; Humbert, M.; Gey, N. A New Approach to Calculate the γ Orientation Maps in Steels. Solid State Phenom. 2010, 160, 203–210. [Google Scholar] [CrossRef]
- Bernier, N.; Bracke, L.; Malet, L.; Godet, S. An alternative to the crystallographic reconstruction of austenite in steels. Mater. Charact. 2014, 89, 23–32. [Google Scholar] [CrossRef]
Figure 1.
Maps for the steps of the PAG (prior austenite grain) boundary segmentation: (a) EBSD map of the martensitic microstructure; (b) reconstructed map of the prior austenitic grain structure; (c) segmented PAG boundaries.
Figure 1.
Maps for the steps of the PAG (prior austenite grain) boundary segmentation: (a) EBSD map of the martensitic microstructure; (b) reconstructed map of the prior austenitic grain structure; (c) segmented PAG boundaries.
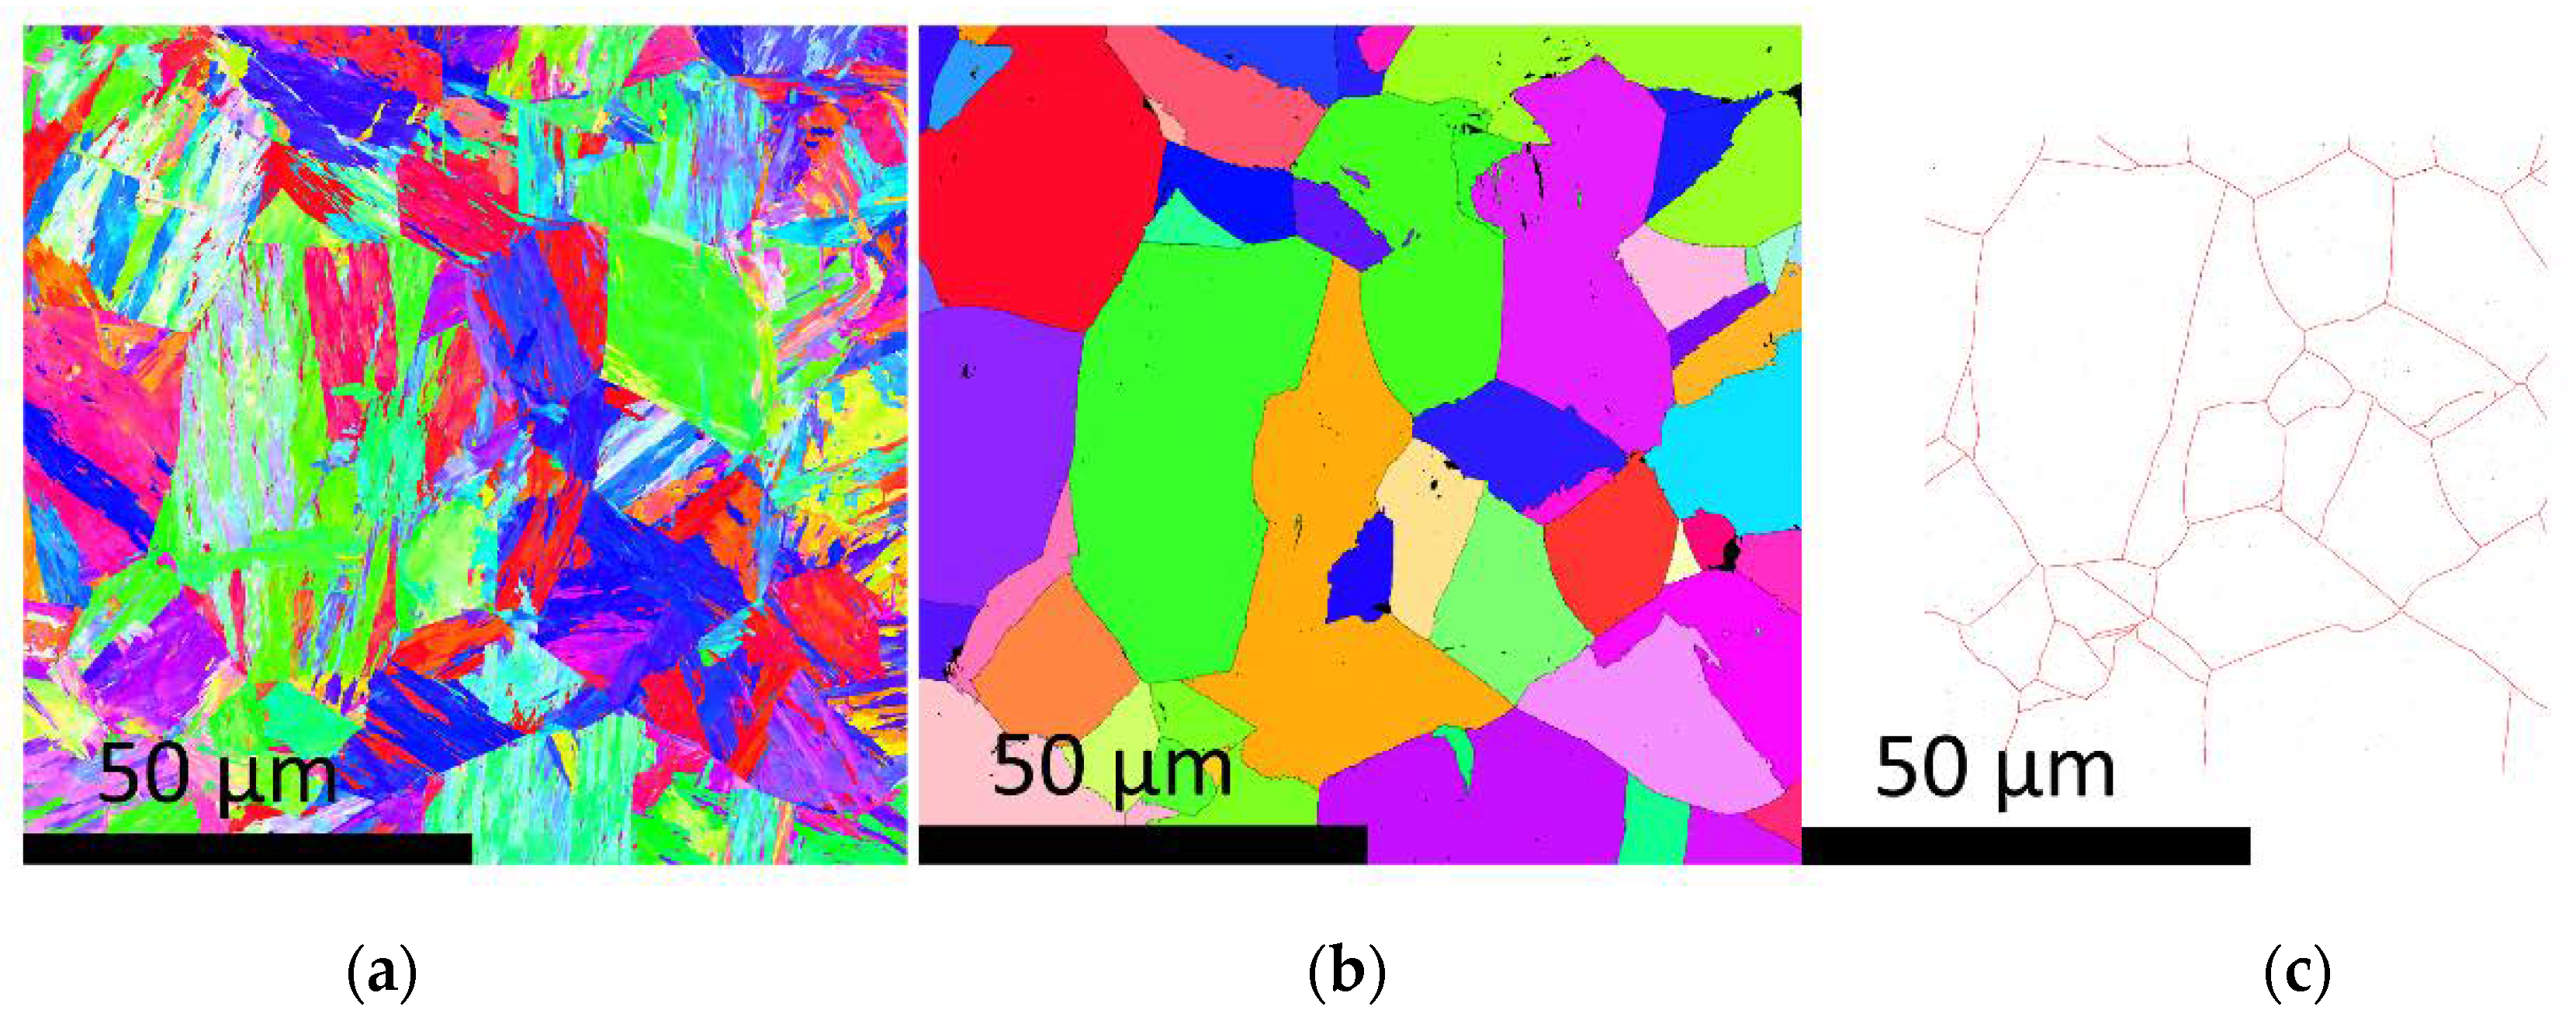
Figure 2.
Maps of the two steps of the particle segmentation: (a) original AFM map; (b) segmented particles.
Figure 2.
Maps of the two steps of the particle segmentation: (a) original AFM map; (b) segmented particles.

Figure 3.
AFM (atomic force microscopy) measurement of particles in a martensitic microstructure with particles on grain boundaries and within the grains (a) and the corresponding line profiles of three selected particles of different sizes (b).
Figure 3.
AFM (atomic force microscopy) measurement of particles in a martensitic microstructure with particles on grain boundaries and within the grains (a) and the corresponding line profiles of three selected particles of different sizes (b).

Figure 4.
AFM map (a) and corresponding SE image (b); spectrum of the chemical analysis of the matrix (c) and one precipitate, which is shown for all other measured particles.
Figure 4.
AFM map (a) and corresponding SE image (b); spectrum of the chemical analysis of the matrix (c) and one precipitate, which is shown for all other measured particles.

Figure 5.
AFM map with very high resolution and four particles with their corresponding diameter.
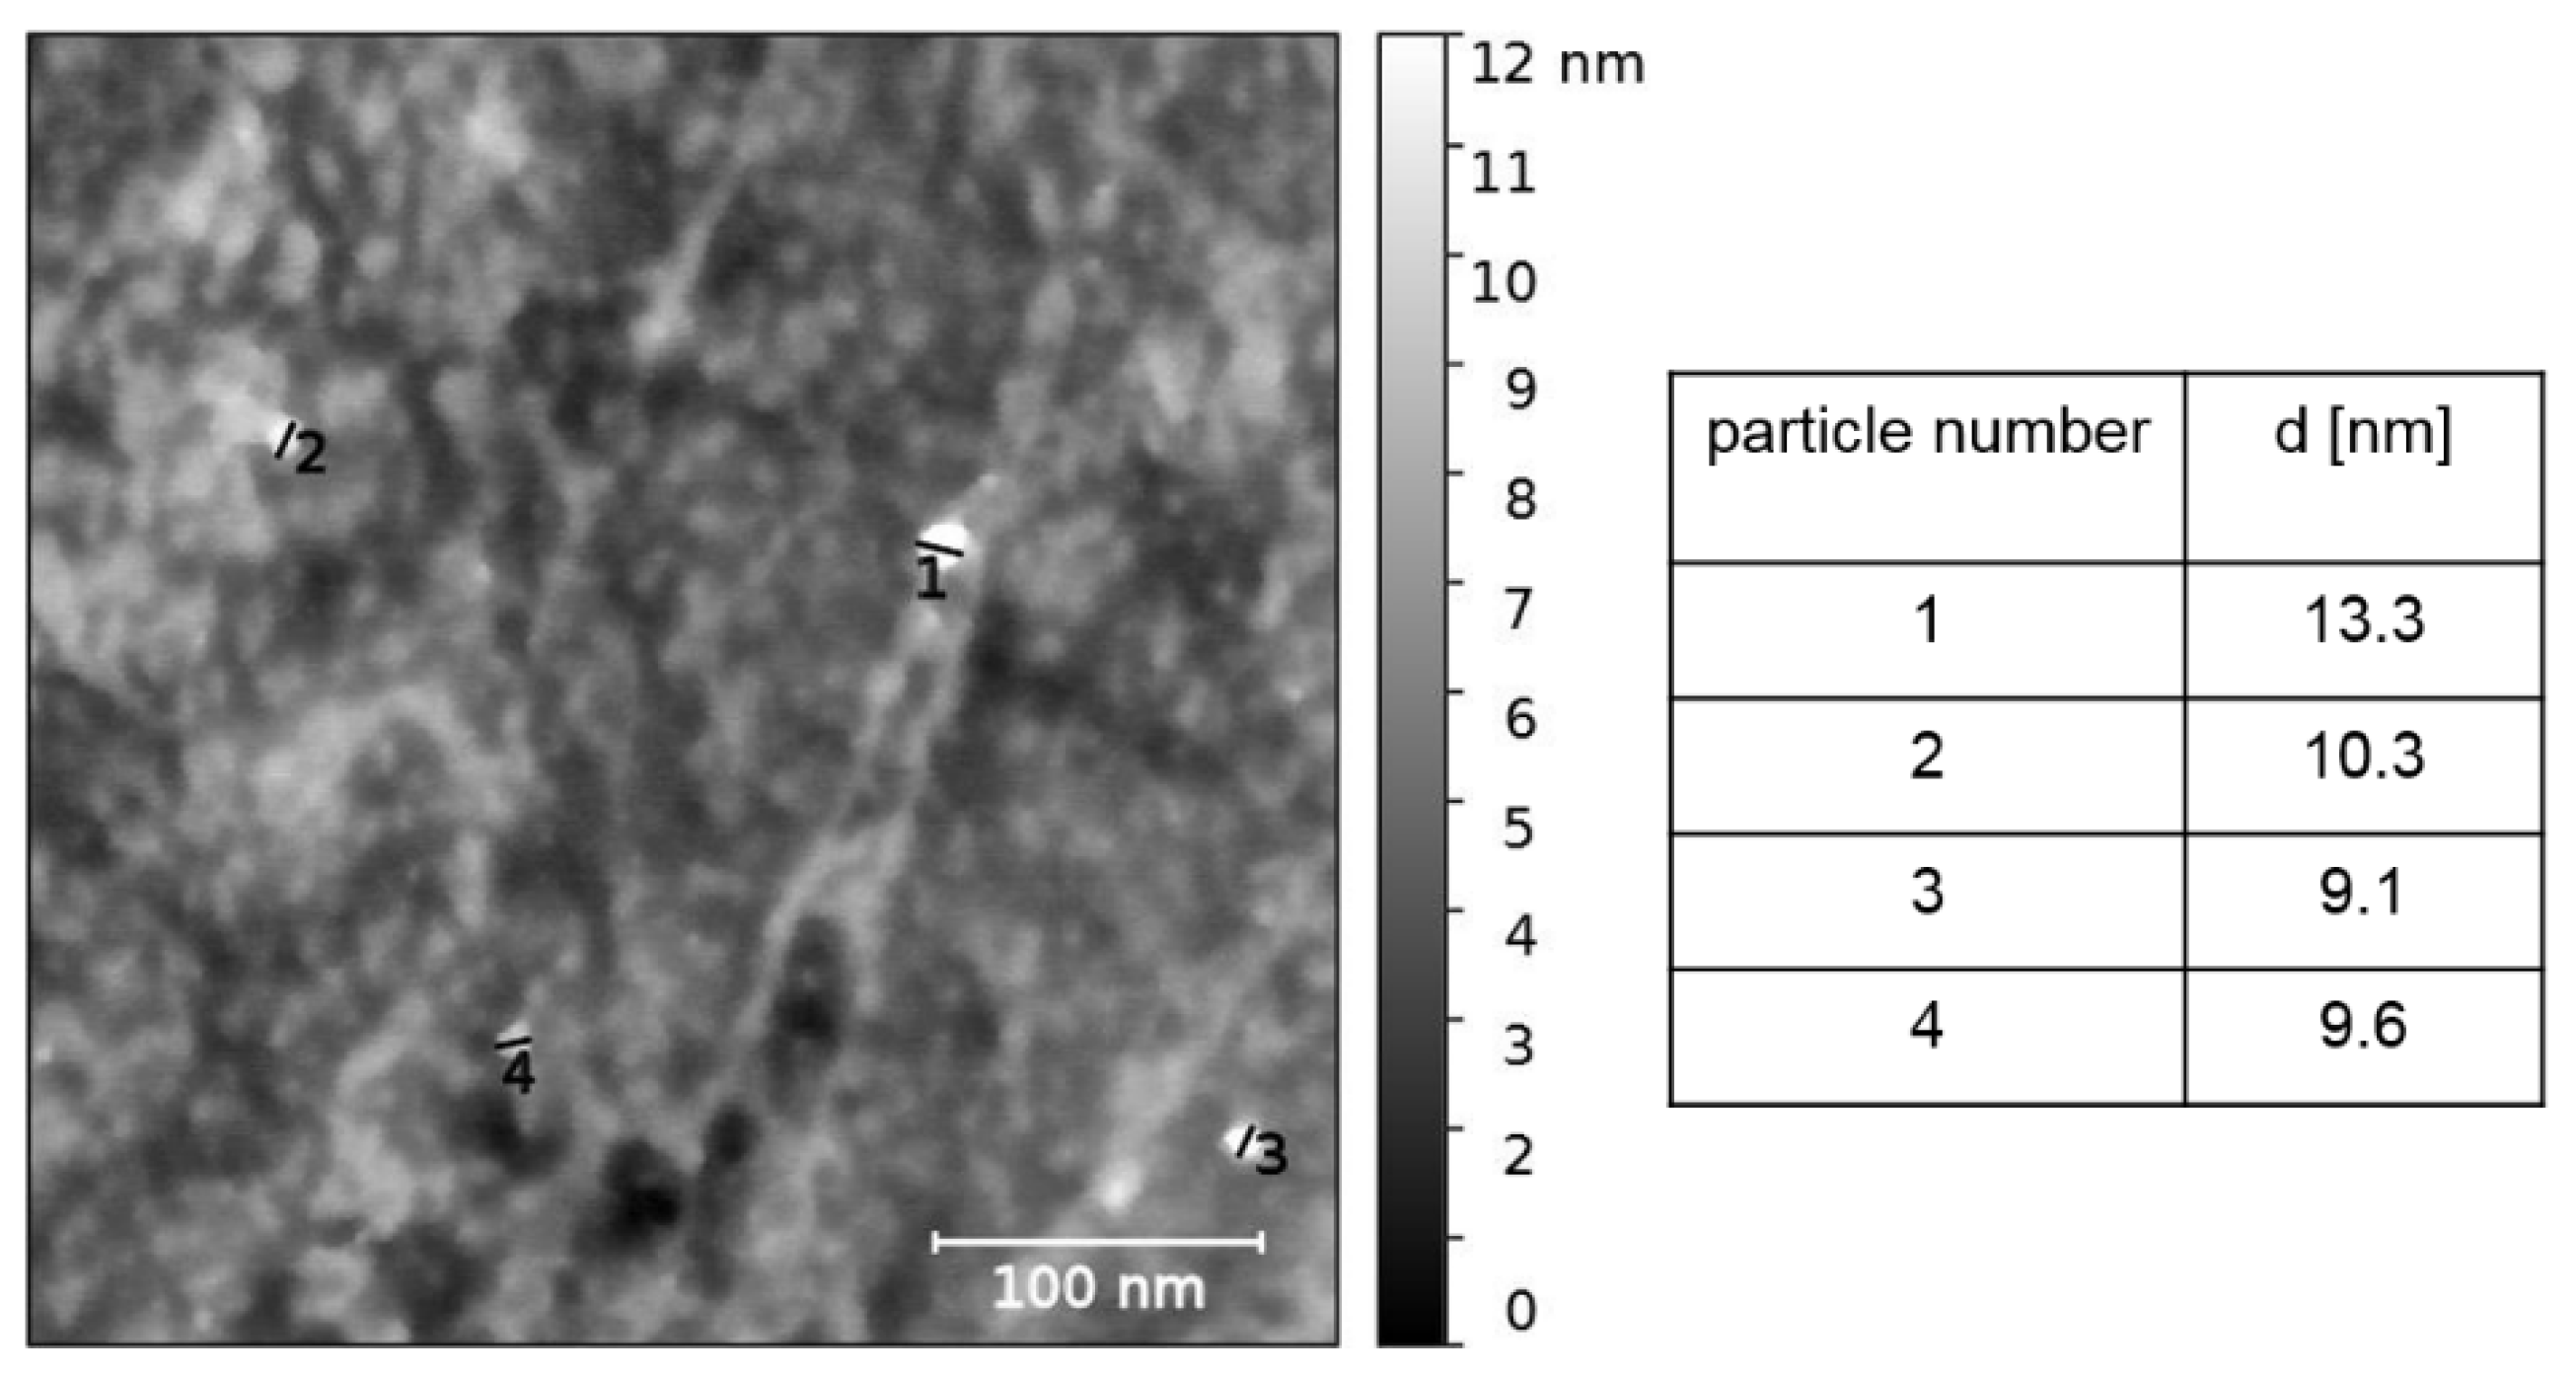
Figure 6.
Correlation of precipitates and prior austenitic microstructure for Sample 1.

Figure 7.
Precipitation size distribution compared for both austenitization states.


Table 1.
Chemical composition of the low carbon steel (wt %).
| C | Mn | Si | Nb | Ti |
|---|---|---|---|---|
| 0.09 | 1.6 | 0.2 | 0.038 | 0.015 |
Table 2.
Heat treatments of the sample fabrication.
| Sample | (°C) | (min) | Expected Mean Particle Diameter (MatCalc Simulations) (nm) |
|---|---|---|---|
| 1 | 1000 | 10 | 25 |
| 2 | 1000 | 240 | 45.4 |
Table 3.
Metallographic sample preparation.
| Step | Characteristics | Time |
|---|---|---|
| Grinding | 800, 1200, 2500 | - |
| Polishing | 6, 3, 1, 0.25 µm | 5 min |
| Final Polishing | Masterprep® (Buehler), 0.05 µm | 180 s |
Table 4.
AFM detection parameters.
| Parameter | Value |
|---|---|
| Scan Size | 100 × 100 µm2 |
| Scan Rate | 0.0494 Hz |
| Samples/Line | 10,240 |
| Peak Force Amplitude | 150 nm |
| Peak Force Frequency | 2 kH |
| Lift Height | 47.9 nm |
| Spring Constant | 0.4 N/m |
Table 5.
Statistical evaluation and comparison of both austenitization states.
| Sample | Mean Prior Austenite Grain Size (µm) | # of Measured Particles | Mean Particle Diameter (nm) | # of Particles on the PAG |
|---|---|---|---|---|
| 1 | 30 | 2090 | 50 | 111 |
| 2 | 32.6 | 1670 | 65.3 | 79 |
© 2018 by the authors. Licensee MDPI, Basel, Switzerland. This article is an open access article distributed under the terms and conditions of the Creative Commons Attribution (CC BY) license (http://creativecommons.org/licenses/by/4.0/).
Share and Cite
MDPI and ACS Style
Eisenhut, L.; Fell, J.; Motz, C. Local Characterization of Precipitation and Correlation with the Prior Austenitic Microstructure in Nb-Ti-Microalloyed Steel by SEM and AFM Methods. Metals 2018, 8, 636. https://doi.org/10.3390/met8080636
AMA Style
Eisenhut L, Fell J, Motz C. Local Characterization of Precipitation and Correlation with the Prior Austenitic Microstructure in Nb-Ti-Microalloyed Steel by SEM and AFM Methods. Metals. 2018; 8(8):636. https://doi.org/10.3390/met8080636
Chicago/Turabian StyleEisenhut, Lena, Jonas Fell, and Christian Motz. 2018. "Local Characterization of Precipitation and Correlation with the Prior Austenitic Microstructure in Nb-Ti-Microalloyed Steel by SEM and AFM Methods" Metals 8, no. 8: 636. https://doi.org/10.3390/met8080636
Note that from the first issue of 2016, this journal uses article numbers instead of page numbers. See further details here.