1. Introduction
H13 is one of the most widely used hot-work tool steels applied to casting molds, extrusion tools, forging dies, etc. due to its strong temper resistance and ability to maintain high hardness and strength at elevated temperatures [
1,
2,
3,
4,
5,
6,
7,
8]. During working processes such as die casting, tool steel molds are heated using molten metals, which is then followed by cooling. Because the hardness in particular and the mechanical behavior in general vary with temperature for metals and alloys, this characteristic of tool steels, including H13, is very important. In such working conditions, it may cause plastic deformation, leading to further heat crack initiation. It is known that the strain-rate sensitivity (creep deformation) becomes critical for H13 at elevated temperatures, and especially, supper plasticity was shown at 1123 K [
5]. It is therefore important to gain an insight into the creep behavior of H13 at room temperature as well as elevated temperatures, which will directly influence the lifetime of H13 steel molds.
Hot-work tool steels fabricated by conventional methods require expensive dedicated tools and thus are not suitable for small-scale production and the production of complex shapes [
5,
6,
7]. An additive manufacturing (AM) technique, which builds parts from 3D digital models typically by a layer additive process, has been an effective method to solve these problems [
9,
10,
11,
12,
13,
14]. Accordingly, AM of hot-work steels, including H13, has attracted increasing attention due to the potential of AM to transform the die-making industry, i.e., greatly shortened time for mold making, positive mechanical properties, and an advantage to realize conformal cooling [
9,
10,
11,
12,
13,
14].
Selective laser melting (SLM), which is a powder-bed-fusion-based AM process, has been widely used due to its ability to produce intricate molds with not only near-full density but also a refined microstructure [
10,
11,
12,
13,
14]. The effects of the SLM process on the microstructure and properties of H13 have been reported using scanning electron microscopy (SEM) [
1,
2,
3,
10,
12]. Specifically, Yan reported that SLM resulted in martensite formation, which was mainly caused by the high residual stresses and also its partial decomposition into fine α-Fe and Fe
3C precipitates along with retained austenite for H13 [
3]. In our recent study, the density measured by the Archimedes method was 7.64 g/cm
3, similar to the powder density of 7.68 g/cm
3 [
10]. In addition to density, the microstructures and hardness of H13 fabricated by SLM were studied [
10]. However, the H13 hardness conventionally was determined from indentation tests at low loading rates (static). Considerably less work has been conducted in studying the dynamic hardness of the material using relatively higher loading rates. The lack of a systematic study on the dynamic hardness of the SLM H13 steel using relatively high loading rates was the motivation for the present study. It is accordingly indispensable to investigate SLM H13 materials to improve our knowledge of their mechanical characteristics.
Nanoindentation is increasingly becoming the technique of choice to assess the mechanical behavior of tiny materials, particularly to measure the strain rate sensitivity exponent [
12,
15,
16,
17,
18,
19,
20,
21,
22,
23,
24]. Different types of nanoindentation loading conditions are often used to determine the relationship between the indentation strain rate and hardness, including constant rate of loading (CRL), constant load and hold (CLH), constant strain rate (CSR), and strain rate jump (SRJ) nanoindentations [
20,
21,
22,
23,
24]. Each method of measuring the strain rate of nanoindentation has advantages and disadvantages [
20]. For example, the CRL and CSR methods require a large sample to have enough of area for conducting many indents, while the SRJ and CLH methods can be used for smaller samples because two methods can overcome this weakness [
20]. For the CRL method, where a steady loading rate is used until the tip depth rate becomes nearly constant, both indentation hardness and strain rate are not constant under CRL loading, making it difficult to determine the consistent creep exponent from a single CRL nanoindentation experiment [
20,
21,
22,
23,
24]. However, if only the indentation hardness and indentation strain rate at the maximum load point are used, the strain-rate sensitivity can be determined from a group of CRL nanoindentation tests under different loading rates [
23]. In this study, the CRL is used to measure the strain rate not only because the CRL allows for the simple calculation of strain rates, but it has also been proven to be more suitable to correlate with the conventional constant strain rate tests [
12,
17,
18,
20,
21,
23].
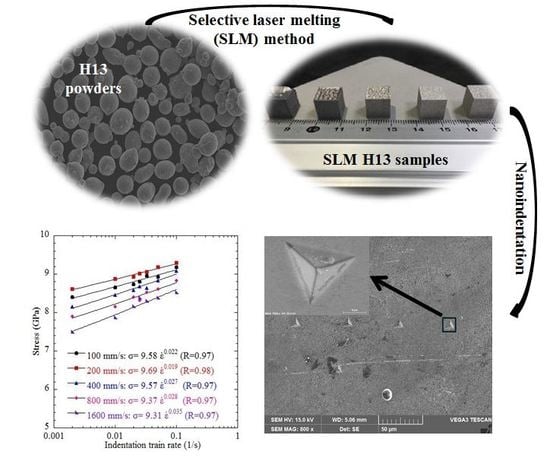
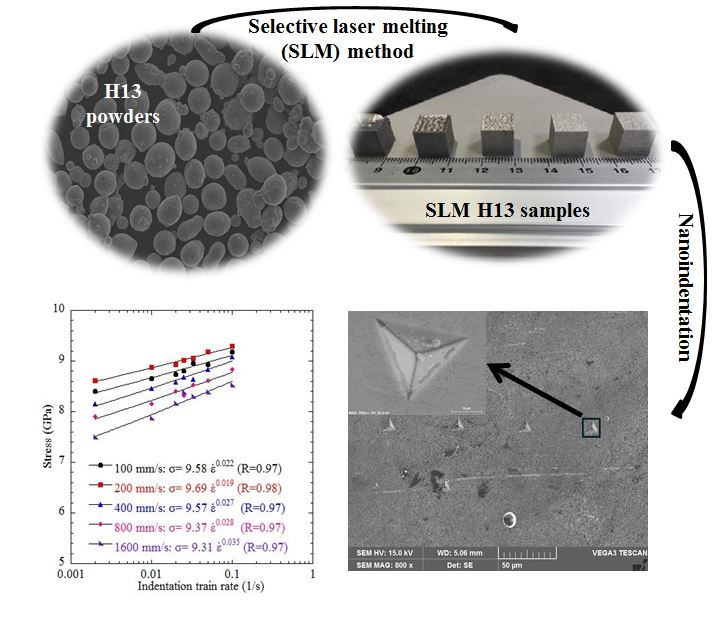
This study expands on recently reported findings by using nanoindentation tests to probe mechanical properties of H13 produced by SLM at different laser scan speeds from 200 to 1600 mm/s [
10,
12]. The results of SLM-processed H13 steel at 100 mm/s of laser scan speed sourced from the literature were used in the evaluation conducted here [
12]. We also demonstrate that the SLM processing of this material provides a further increase of the mechanical behavior compared to the as-cast state, where the optimal condition of the SLM process is around 200 mm/s laser scan speed for the H13 steel [
10,
12].
2. Experimental Procedure
The powder materials used in this study were commercially available H13 steel powders (Osprey Metals, Sandvik Osprey Ltd., Neath SA11 1NJ, UK) in a size range of 10–45 μm with chemical compositions of (mass, %): C 0.32–0.45, Cr 4.75–5.5, Mo 1.10–1.75, Mn 1.10–1.75, Si 0.80–1.20, and V 0.80–1.20. The feedstock powders were processed by the SLM process using a commercial machine (model name: a Concept LaserMlab-Cusing system, CONCEPT LASER, Deutschland, Germany) equipped with a Nb:YAG fiber laser (wavelength = 1064 nm) to manufacture cuboid specimens (10 mm × 10 mm × 10 mm). These specimens were thereby produced at a laser power of 90 W, a hatching spacing of 80 μm, a layer thickness of 25 μm, and laser scanning speeds (v) from 200 to 1600 mm/s under argon (Ar). The detailed preparation of the SLM process of this material can also be found in [
10,
12,
25].
The cuboid specimens prepared by SLM were mounted in epoxy resin and then cross-sectioned to permit their microstructural observations. To be specific, mounted samples were polished on different sand papers with successively fine grits of mesh of 220, 400, and 600, followed by polishing with Al2O3 paste, and finally diamond polished on an auto-disc polishing machine (Struers LaboForce-100, Ballerup, Denmark) until a mirrorlike surface was obtained. They were then cleaned using lab detergent and etched for about 10 s using 5% HNO3 solution. The samples were immediately rinsed using running water and dried using hot air. The surface roughness of the samples was measured using the surface roughness measuring instrument (Mitutoyo, SV-3200S4, Illinois, USA), after which the samples with a surface roughness of lower than 50 nm were chosen for next steps. An optical microscope (OM), supplied by Nikon ECLIPSE MA200, Tokyo, Japan, and a scanning electron microscope (SEM), supplied by TESCAN, VEGA3, (Brno-Kohoutovice, Czech Republic) were also used to observe the microstructure on the surface samples.
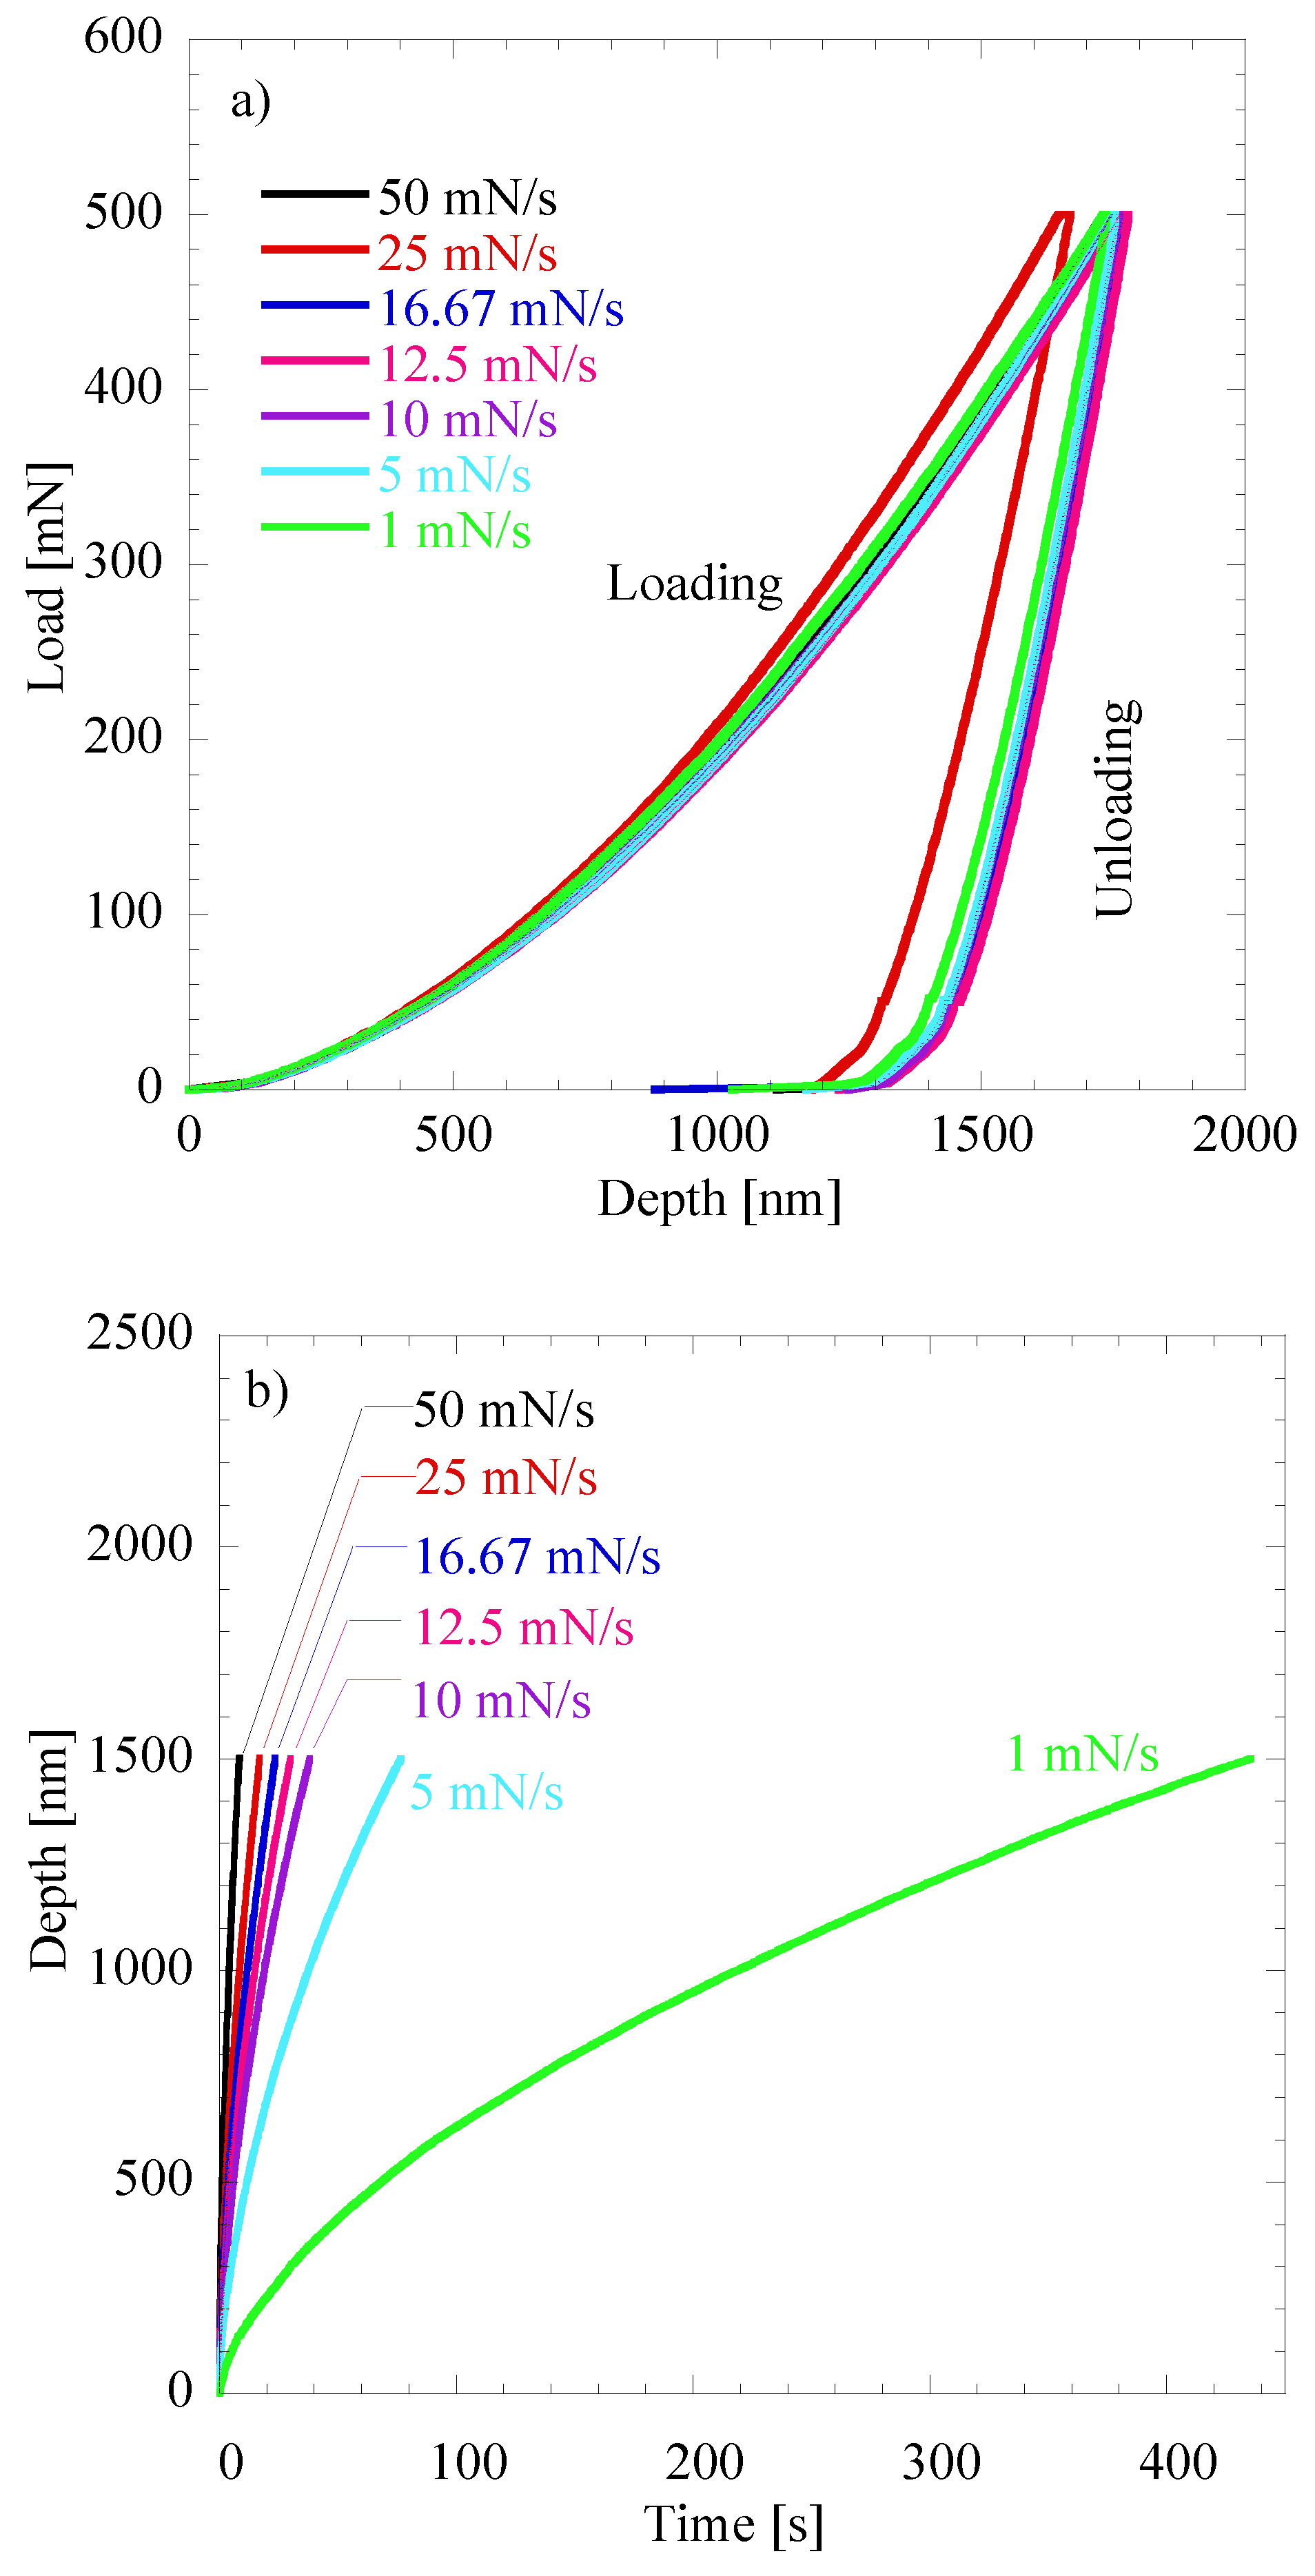
Nanoindentation tests were then performed for samples at room temperature on a NanoTest nanoindenter, supplied by Micro Materials Ltd., Wrexham, UK, using a three-sided Berkovich diamond indenter with a nominal angle of 120° and a radius of 100 nm. Specifically, all nanoindentation tests were carried out at the same maximum load (500 mN) and with loading rates of 50, 25, 16.67, 12.5, 10, 5, and 1 mN/s. The indenter was then held at the maximum load for 5 s, which was followed by unloading at a rate of 50 mN/s for all tests. At least 10 indentation points at each loading rate were carried out and the results were averaged.
3. Results and Discussion
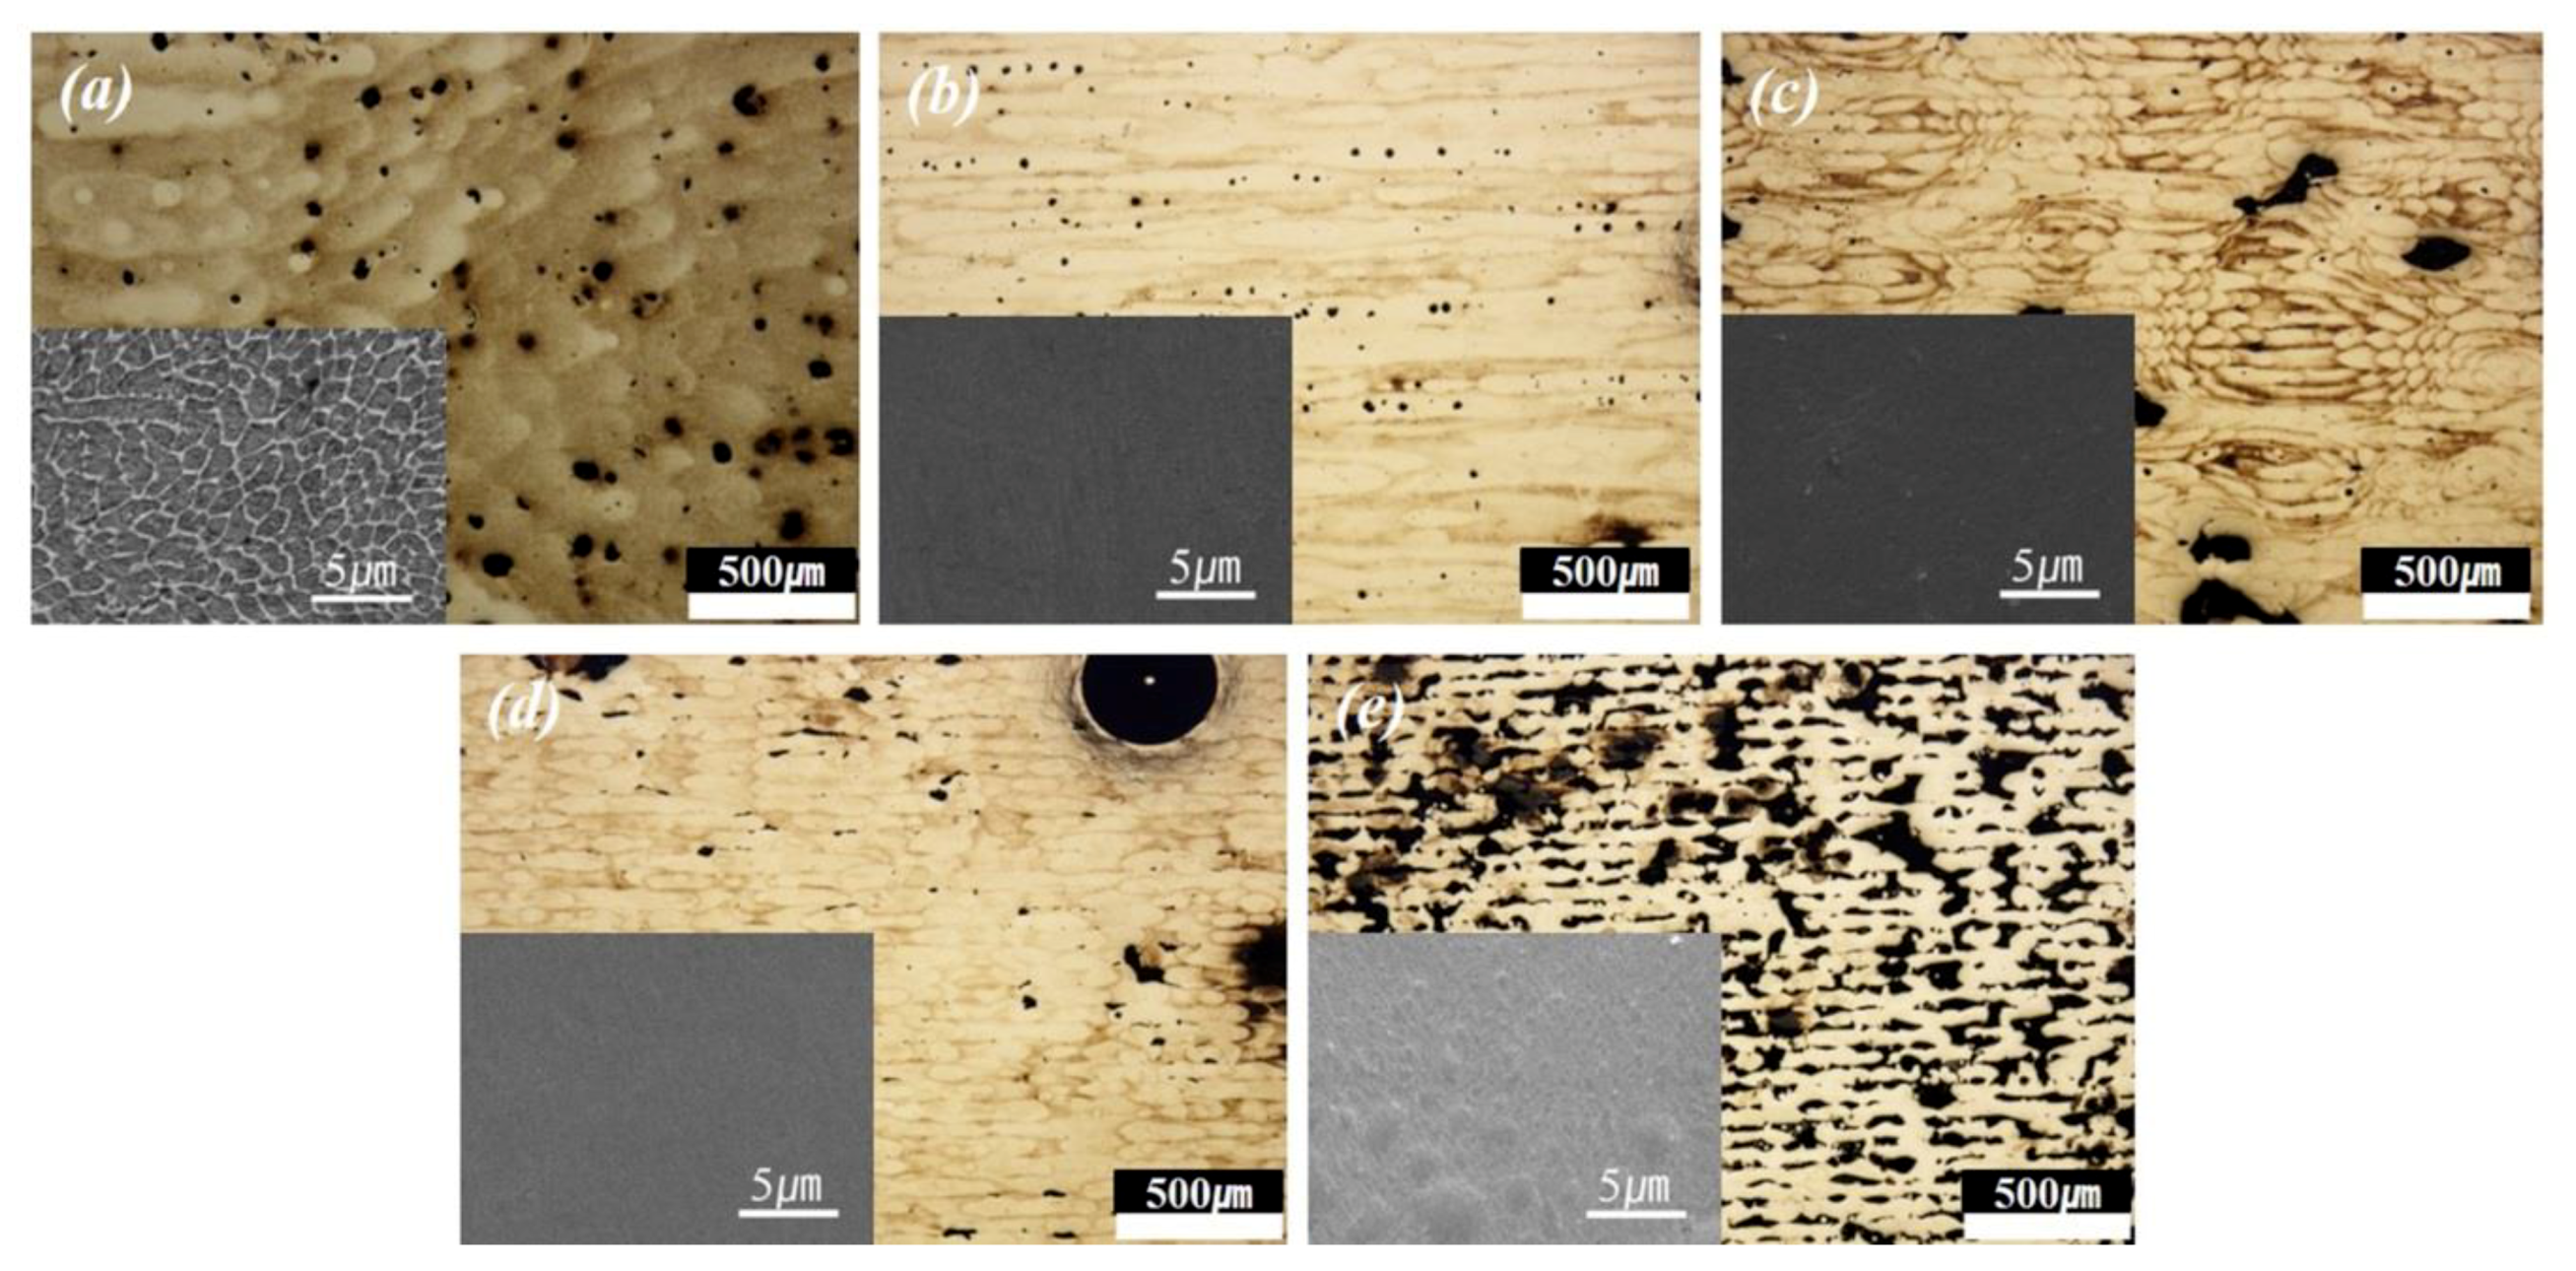
Figure 1 shows OM pictures of the SLM H13 samples after etching in the same magnification (× 50) at various laser scanning speeds, and the insets show SEM micrographs of these samples. The microstructure results for the SLM H13 at a scanning speed of 100 mm/s, shown in
Figure 1a, are sourced from the literature [
12].
Figure 1a shows black phases with a near-spherical shape that were observed over the sample. Meanwhile, smaller pores with the spherical shape were observed over the entire surface of the sample for the SLM H13 at a scanning speed of 200 mm/s, as shown in
Figure 1b. Using image analyzing software (Photoshop) for the SEM results, the volume fraction of the black phase was calculated to decrease from 3.5% to 1.9% as the scanning speed increased between 100 and 200 mm/s. For the microstructure of the SLM H13 at higher scanning speeds of 400 and 800 mm/s, larger pores and a few cracks and microvoids were detected, as shown in
Figure 1c,d, where the number of pores of SLM H13 at a scan speed of 400 mm/s was lower than that at 800 mm/s. In other words, the volume fraction of pores increased from 3.2% to 5.2% as the scanning speed increased from 400 to 800 mm/s. For the H13 manufactured by SLM at a scan speed of 1600 mm/s, discontinuous laser scan tracks were observed throughout the sample surface, along with a large number of irregularly shaped pores, and elongated pores formed along the laser scanning direction (the volume fraction of porosity was estimated to be approximately 21%).
In the previous work, for the SLM H13 at a scan speed of 100 mm/s, excessive energy input induced by the very low scanning speed caused overmelting on the powder bed [
10,
12]. This results in powder vaporization, spatter generation, or gases being trapped within the melt pool. As a result, spherical pores were formed during the solidification process of SLM samples, and the microstructure was composed of a granular phase surrounded by a cellular-shape phase due to spatter generation [
10,
12]. As the scanning speed was increased from 100 to 200 mm/s, the sufficiently high energy induced by a proper scanning speed leads to more sufficient melting of powders on the bed within the melt pool and less solidification shrinkage. This effectively improves the wettability and metallurgical bonding between the adjacent scan tracks or layers, leading to fewer pores with smaller size. Meanwhile, the microstructure of the SLM H13 obtained at a scanning speed of higher than 200 mm/s may stem from insufficient laser energy to melt powder materials within the melt pool [
25,
26]. Specifically, as the scanning speed increases, the laser energy decreases, leading to a decrease in the laser energy penetration on the powder bed. This causes not only an increase in the unmelted powder but also a decline in the size of the melt pool, thus exacerbating insufficient metallurgical bonding between the adjacent scan tracks and the neighboring layers. As a result, the insufficient melting on the powder bed within the melt pool could cause gas porosity and solidification shrinkage (black phases in the OM graphs of
Figure 1) as imperfections in the microstructure.
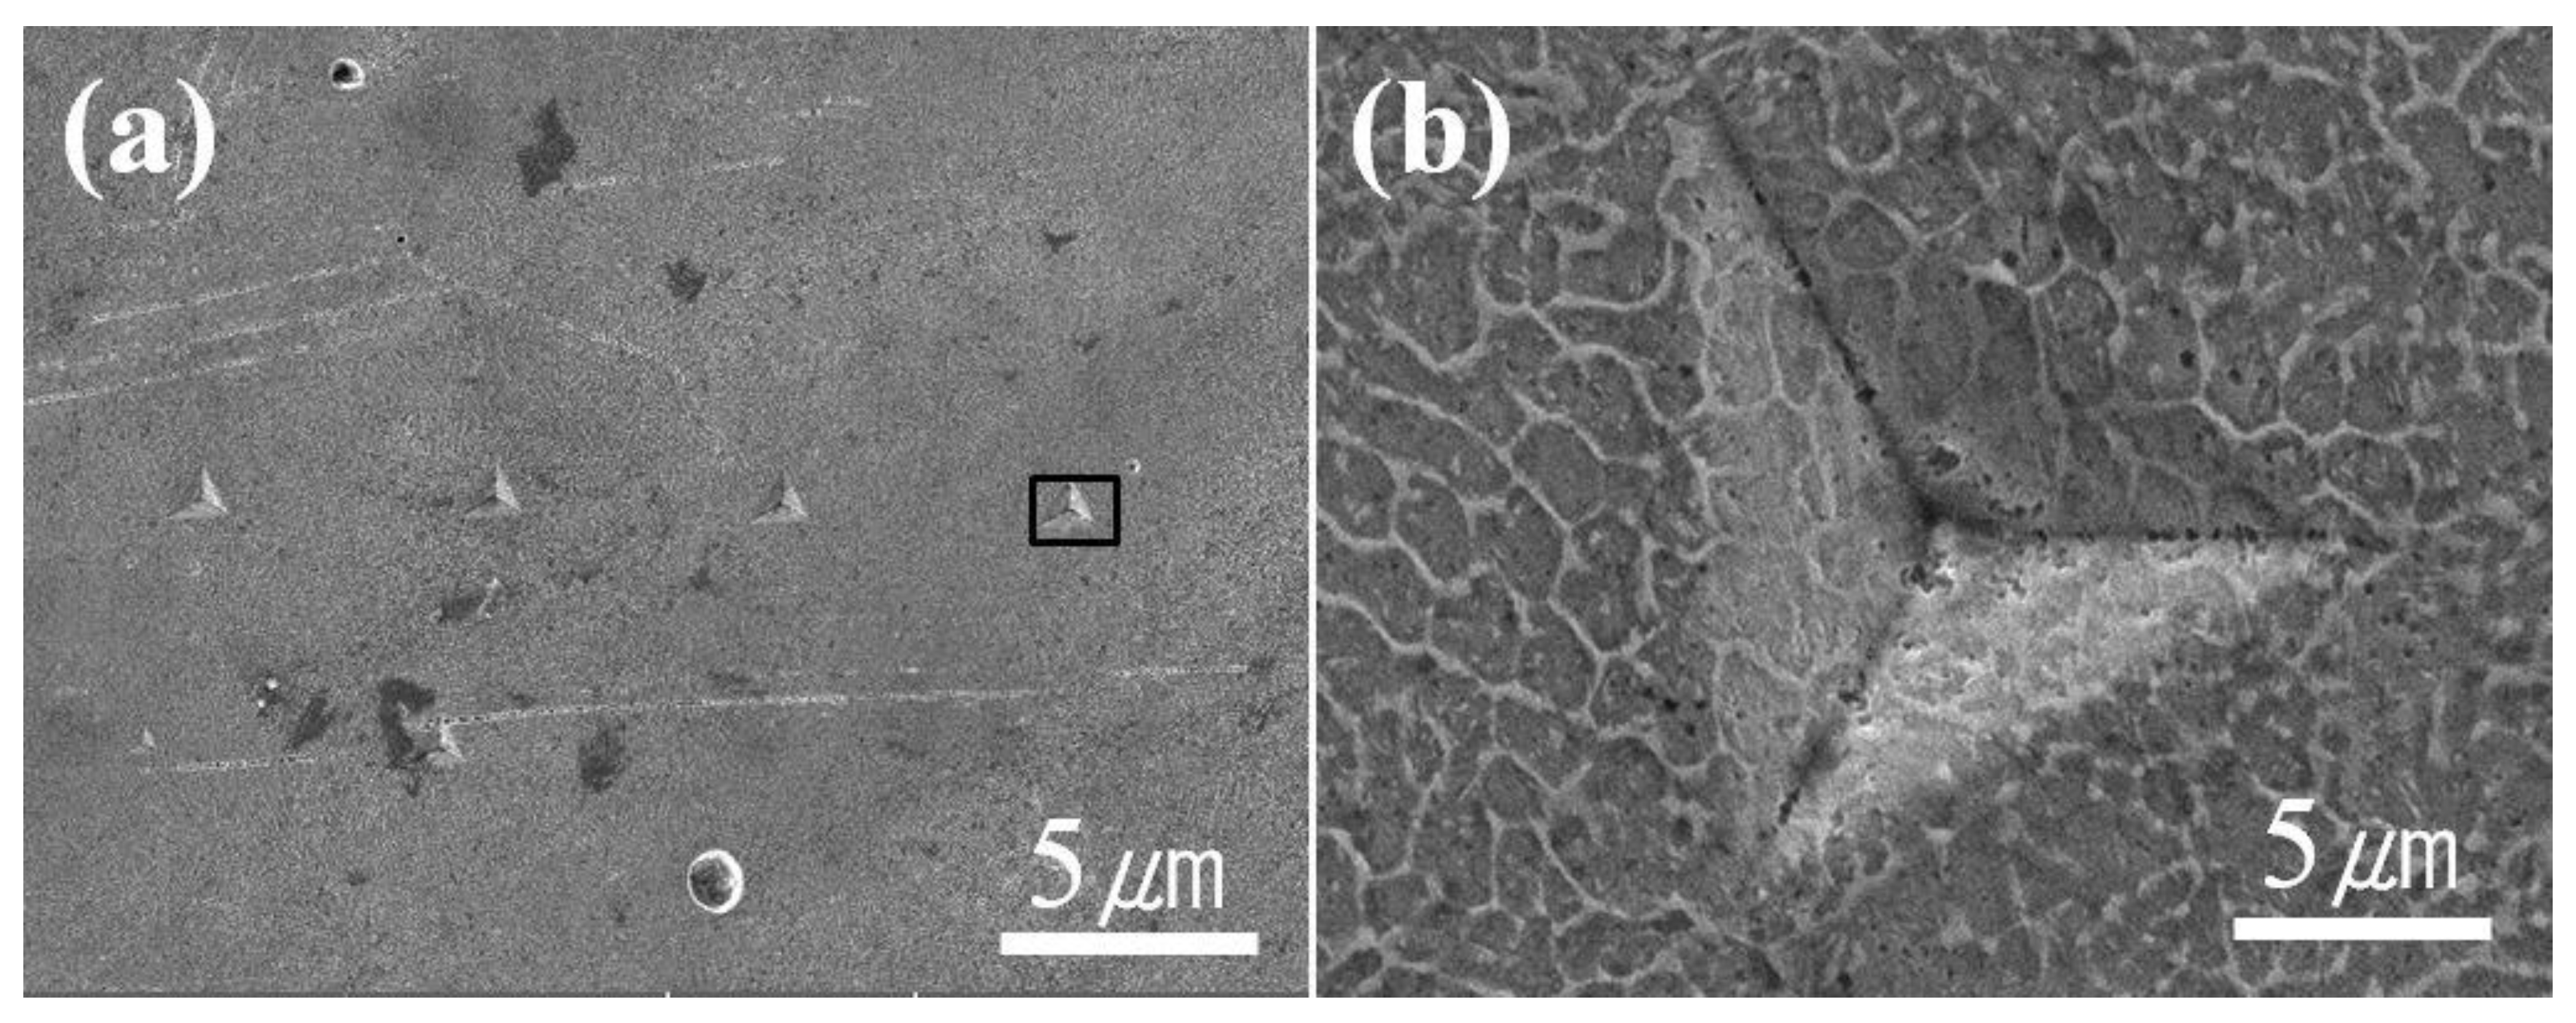
Figure 2a presents a SEM micrograph of an SLM H13 sample at the laser scanning speed of 100 mm/s. In this study, it was very difficult to conduct nanoindentation tests on only the aforementioned pore locations for the SLM material, especially at 200 mm/s of the laser scanning speed, due to the tiny sizes of pores. Therefore, the results of nanoindentation tests are reported here regardless of the location of the aforementioned pores.
Figure 2b is a typical example of an indenter on an SLM H13 sample surface. No cracking is observed on sample surfaces for all indenters, indicating that the SLM H13 material has low crack sensitivity.
Figure 3a shows the load–depth curves and
Figure 3b presents the typical depth–time curves for the SLM specimens as obtained from the nanoindentation tests under various loading rates. As shown in
Figure 3a, the load–depth curves at different loading rates almost overlapped due to mostly similar energy during nanoindentation tests at the same maximum load. In addition, the results show that the ratio of the residual depth (
hf) and the maximum depth (
hmax) in all nanoindentation tests is lower than 0.7. This agrees with the SEM results of the indenter points on all sample surfaces, which show that no obvious pile-up is observed, as shown in
Figure 2b [
15]. Therefore, the Oliver and Pharr method can be adopted to extract the mechanical properties of the material here [
27]. To be specific, the hardness (
H) can be determined by the load-depth curve in
Figure 2a as the following formula [
27]:
where
P is the applied load,
A(
hc) is the projected contact area, and
hc is the contact depth.
Since the Oliver method assumes that the contact periphery sinks in,
hc is always smaller than
hmax:
where ε is a constant with a value of 0.75 and
S is the contact stiffness at the initial unloading that can be obtained by
where
α and
m are power law fitting contacts and
hr is the residual depth after unloading.
As the indenter generally deviates from perfect geometry, the area function is usually fitted by
where C
0…C
8 are fitting constants obtained from the calibrated procedures.
Once the contact area is determined, the hardness can be calculated by Equation (1). For an ideal Berkovich tip, the area relative to the indent penetration depth can be expressed by the following:
Zhu et al. reported that higher residual stress would lead to larger indentation depth and contact area at the same indentation load and would thus decrease the hardness of the materials that do not pile-up in nanoindentation tests [
28]. It may be concluded that the hardness is affected by the residual stress in this work. However, as indentation deformation proceeds, exactly how much the size of the hardness impression is actually affected by the residual stress is difficult to predict because of the complex nature of the changes in stress state accompanying localized plastic deformation in the vicinity of the indenter [
29]. This study focuses on effects of strain rate on mechanical behavior; the impact of residual stress is something that ought to be examined in further research.
The indentation strain rates were calculated from the depth–time data at a steady stage in the dwell time after the load reached the maximum (
Figure 3b). The results were found to be 0.1, 0.05, 0.033, 0.025, 0.02, 0.01, and 0.002 s
−1, corresponding to 50, 25, 16.67, 12.5, 10, 5, and 1 mN/s, respectively. The results from nanoindentation tests at different strain rates for the average hardness values of H13 fabricated by the SLM process at various scanning speeds are also presented in
Table 1.
It can be seen from
Table 1 that as the strain rate increases, the hardness of the SLM H13 material at each scanning speed increases. In addition, the hardness values increase as the laser scanning speed increases between 100 and 200 mm/s, and then these values decrease with increasing laser scanning speed at each the strain rate. Especially, the hardness values of SLM H13 at the 200 mm/s scanning speed are greater compared to those at other scanning speeds. Particularly, the hardness of H13 fabricated by SLM at 100 mm/s was reported to increase between 8.41 and 9.18 GPa at strain rates in the range of 0.002 and 0.1 s
−1 [
12]. In this work, the hardness increased in ranges of 8.61–9.29, 8.15–9.09, 7.91–8.84, and 7.49–8.51 GPa for the H13 prepared by SLM at scanning speeds of 200, 400, 800, and 1600 mm/s, respectively, at the same strain rate range as SLM H13 at 100 mm/s, as shown in
Table 1. In other words, the results in this work show that the hardness of SLM H13 at scanning speeds of 100, 200, 400, 800, and 1600 mm/s increases by approximately 9.2%, 7.9%, 11.5%, 11.8%, and 13.6%, respectively. This indicates that the mechanical behavior is least sensitive to the strain rate for the H13 prepared by SLM at a 200 mm/s scanning speed and is less susceptible to the strain rate as the laser scan speed is reduced below 200 mm/s but is more critically affected by the strain rate as the laser scan speed exceeds 200 mm/s.
All nanoindentation hardness values in the present study are higher than the hardness value of as-built H13 steel without the SLM process (6.6 GPa) obtained from results of Mencin et al. [
2]. This further demonstrates that the SLM process leads to an improvement in the mechanical properties of a material, which is caused by the refined microstructure in the SLM state [
9,
10,
12,
25,
26]. Meanwhile, Gu et al. [
11] reported that the nanoindentation hardness of H13 fabricated by a laser cladding process (9 ± 2 GPa) is similar to the hardness values of H13 produced by SLM at scanning speeds lower than 400 mm/s, as the nanoindentation strain rate is 0.1 s
−1. Therefore, the results of this study are in good agreement with those in previous experimental reports on nanoindentation tests of H13 material.
Figure 4 is plotted to evaluate the effects of the nanoindentation strain rate on the effective stress of SLM H13 at different scan speeds with respect to the (log
σ–log
) form. Experimental results from nanoindentation tests of H13 prepared by SLM at 100 mm/s, obtained from the literature, are included for comparison [
12].
Figure 4 is consistent with previous research, showing that the effective stress of SLM H13 has an approximately linear relationship with the logarithmic strain rate, which implies the hardness increases as the strain rate increases. Accordingly, the function between the effective stress (
σ) and the nanoindentation strain rate (
) for the SLM H13 material can be determined from
Figure 4 as follows:
+ At 100 mm/s scanning speed:
[
12];
+ At 200 mm/s scanning speed: ;
+ At 400 mm/s scanning speed: ;
+ At 800 mm/s scanning speed: ;
+ At 1600 mm/s scanning speed: .
Therefore, the strain-rate sensitivity (
m) can be determined by the slope of a log
σ versus a log
plot, as indicated in
Figure 4.
The five equations indicate that the relationship between these two parameters has high correlation coefficients (R ≥ 0.97), implying that these functions can properly measure the dependence of nanoindentation stress on the strain rate. Error bars on the data reflect the standard deviation calculated for hardness from the multiple indentations for each sample. As shown by the functions in
Figure 4, these
m values were found to decrease from 0.022 to 0.019 with an increase in the scanning speed between 100 and 200 mm/s, but then this value increased to 0.035 as the scanning speed was increased from 200 to 1600 mm/s. As a result, the mechanical behavior is less susceptible to the strain rate as the laser scan speed is reduced below 200 mm/s but is more critically affected by the strain rate as the laser scan speed exceeds 200 mm/s.

 ,
, 


