Local Monte Carlo Method for Fatigue Analysis of Coarse-Grained Metals with a Nanograined Surface Layer


1
School of Mechanical Engineering, Tianjin University, Tianjin 300354, China
2
Tianjin Key Laboratory of Dynamics and Control, Tianjin 300072, China
3
State Key Laboratory for Strength and Vibration of Mechanical Structures, Xi’an Jiaotong University, Xi’an 710049, China
4
Department of Mechanical and Aerospace Engineering, Rutgers University, New Brunswick, NJ 08903, USA
5
AML, Department of Engineering Mechanics, Tsinghua University, Beijing 100084, China
*
Author to whom correspondence should be addressed.
Metals 2018, 8(7), 479; https://doi.org/10.3390/met8070479
Submission received: 24 May 2018
/
Revised: 18 June 2018
/
Accepted: 18 June 2018
/
Published: 22 June 2018
(This article belongs to the Special Issue Kinetic Surface Treatments)
Abstract
:The fatigue resistance of coarse-grained (CG) metals can be greatly improved by introducing a nanograined surface layer. In this study, the Weibull distribution is used to characterize the spatially-random fracture properties of specimens under axial fatigue. For the cylindrical solid specimen, the heterogeneity of element sizes may lead to unfavorable size effects in fatigue damage initiation and evolution process. To alleviate the size effects, a three-dimensional cohesive finite element method combined with a local Monte Carlo simulation is proposed to analyze fatigue damage evolution of solid metallic specimens. The numerical results for the fatigue life and end displacement of CG specimens are consistent with the experimental data. It is shown that for the specimens after surface mechanical attrition treatment, damage initiates from the subsurface and then extends to the exterior surface, yielding an improvement in the fatigue life. Good agreement is found between the numerical results for the fatigue life of the specimens with the nanograined layer and experimental data, demonstrating the efficacy and accuracy of the proposed method.
1. Introduction
Since the fatigue resistance of metal is strongly dependent on its surface properties, much attention has been paid to the surface modification [1]. Metals with finer grains usually have greater resistance to fatigue crack initiation. The way that microstructures affect the growth of both small and long fatigue cracks can be captured by changing the fatigue threshold term in the Hartman–Schijve variant of the NASGRO crack growth equation [2]. For small fatigue cracks, both fine-grained metals and coarse-grained (CG) metals have a small fatigue threshold and thus a similar crack growth rate [3,4]. Equivalently, microstructural effects often vanish for small, naturally-occurring cracks [3,4]. For long fatigue cracks, compared with fine-grained metals, CG metals possess a larger fatigue threshold and thus a lower crack growth rate [3,4]. Therefore, metals with a nanograined surface layer and coarse-grained (CG) interior hold promise for applications against fatigue failure. At present, the surface mechanical attrition treatment (SMAT) technique uses a large quantity of smooth balls to hit the specimen surface so that such a surface layer can be created [5]. It can achieve a nanograined layer (NGL) in various metals including Inconel 600 alloy [6], 304 stainless steel (SS) [7], Fe [8], and Co [9]. Dewo et al. refined the grain size of osteosynthesis plates’ surfaces by SMAT so that the plates had a significant improvement in strength [10]. Recently, Sun and Bailey found that much of the improved corrosion behavior of the SMATed 304 SS was attributed to the NGL [11]. The same phenomenon was also observed in the SMATed Pb-Sn alloy [12]. Kargar et al. found that the SMATed Cu specimen exhibited greater hardness [13]. Furthermore, Jin et al. fabricated NGL on biomedical TiNbZrFe alloy by SMAT and found that the micro-hardness of the surface layer was enhanced with treatment duration [14]. Huang et al. found the Ti alloy grains in the NGL generated by SMAT had good thermal stability [15]. The SMAT was employed to generate a gradient structure which exhibited high yield strength and good uniform elongation simultaneously [16,17]. So far, with the emergence of SMATed materials, the improved mechanical properties of such nanostructured metals have been well investigated; the NGL also has a beneficial effect on the fatigue life.
A number of experiments have been conducted to investigate the effects of the NGL on the fatigue behavior of SMATed metallic specimens. This is of importance for the practical applications of nanostructured metals. For instance, Kumar et al. found that the SMATed Ti–6Al–4V specimens treated for 30 min exhibited superior fatigue strength compared to untreated specimens and specimens treated for 60 min [18]. From the viewpoint of engineering, it is important to study the failure mode of fatigue and the approach to improve the corresponding fatigue strength. However, the combination of limited facilities, high cost, and the long period of experimental tests has placed a significant constraint on fatigue study. To meet this challenge, here we perform a systematic numerical investigation and a brief experimental verification. A valid three-dimensional (3D) numerical investigation on the axial fatigue life and damage evolution can provide valuable insights.
In this paper, we will use the cohesive finite element method (CFEM), which has proven to be effective in studying the fatigue failure of structural materials. For instance, Brinckmann and Siegmund adopted it to study the fatigue crack growth in metals successfully [19]. Gong et al. implemented the CFEM to uncover the damage evolution of a double cantilever beam [20]. Ghovanlou et al. applied the CFEM to investigate the fatigue crack growth of the brazed joints and showed that the results agreed well with the experiments [21]. Using the CFEM, Puigvert et al. well predicted the fatigue behavior of adhesively-bonded anchorages [22]. Kim and Yoon employed the CFEM to model the high-cycle fretting fatigue of Al alloy [23]. Furthermore, the CFEM was used to analyze the plasticity-induced crack closure of aluminum alloy and numerical analysis was correlated with the fatigue tests [24]. As a common phenomenon, fatigue test data tend to scatter widely due to internal defects, unavoidable wear, and processing errors. Experiments revealed that test data scattered for nominally identical specimens under the same fatigue load. Therefore, it is necessary to perform probabilistic or statistical analysis to fully understand the fatigue problems. To this end, we will also take a statistical approach in this work.
On the one hand, the damage tolerance method in Ref. [25,26] treats the defects as growing cracks under various load histories in service. On the other hand, statistical distributions can describe the internal grain microstructure or material defects [27]. In recent years, Monte Carlo simulation (MCS) has been widely used to investigate the fracture properties of the material and it is an effective approach to simulate the accumulation of large quantities of random incidents. It uses random variables to establish a simple but effective statistical model according to the statistical law of practical problems. For instance, Bouhamida et al. combined MCS to study the distribution of stress concentration for each fiber [28]. Campanile et al. applied MCS with Weibull distribution to investigate statistical properties of the hull girder section modulus and ultimate strength [29]. Based on the scatter of concrete tensile strength and bond strength, Hartig and Häussler-Combe employed MCS to study the statistics of crack widths [30]. It is quite difficult for the MCS to deal with the high nonlinearity related to the fracture process because of the high computational cost associated with a large number of finite elements [31]. However, it is still an effective method to estimate the uncertainty of structural response. So far, only limited studies have combined MCS with CFEM to study fracture behavior [31,32]. The MCS can be employed to study the fatigue failure process [33,34]. So far, 2D models employed by most of the researchers have not been able to fully capture the complexity in the intrinsic 3D phenomena in the fatigue failure. It is also the intent here that we will undertake a 3D analysis.
Recently, Guo et al. combined the CFEM with the MCS to simulate the fatigue crack propagation of hollow tubular specimens under torsional load successfully [35]. Furthermore, Sun et al. employed this approach to study the fatigue life and damage evolution of hollow tubular specimens subjected to combined axial–torsional loads [36]. In the above two papers, the global MCS (i.e., the fracture properties of all cohesive elements are considered to be spatially random and thus characterized by MCS) is applicable to the hollow tubular specimens. Here, a cylindrical solid is used in our axial-fatigue experiments and simulation; the heterogeneity of the element sizes will cause unfavorable results on fatigue damage initiation and evolution. In real materials, the length scale for variation in the local resistance to fatigue damage initiation and evolution generally scales with the grain size or other microstructural parameter. Indeed, the meshes in our cylindrical specimens have a hub-and-spoke topology and all hexahedron solid elements have the same central angle. This suggests that the “random” fracture properties vary much more rapidly at the interior of the cylinder compared to the exterior surface. Therefore, in order to reduce the element size effects, we performed a local MCS (i.e., the fracture properties of local/partial cohesive elements are considered to be spatially random and thus characterized by MCS, while the other elements are homogenized).
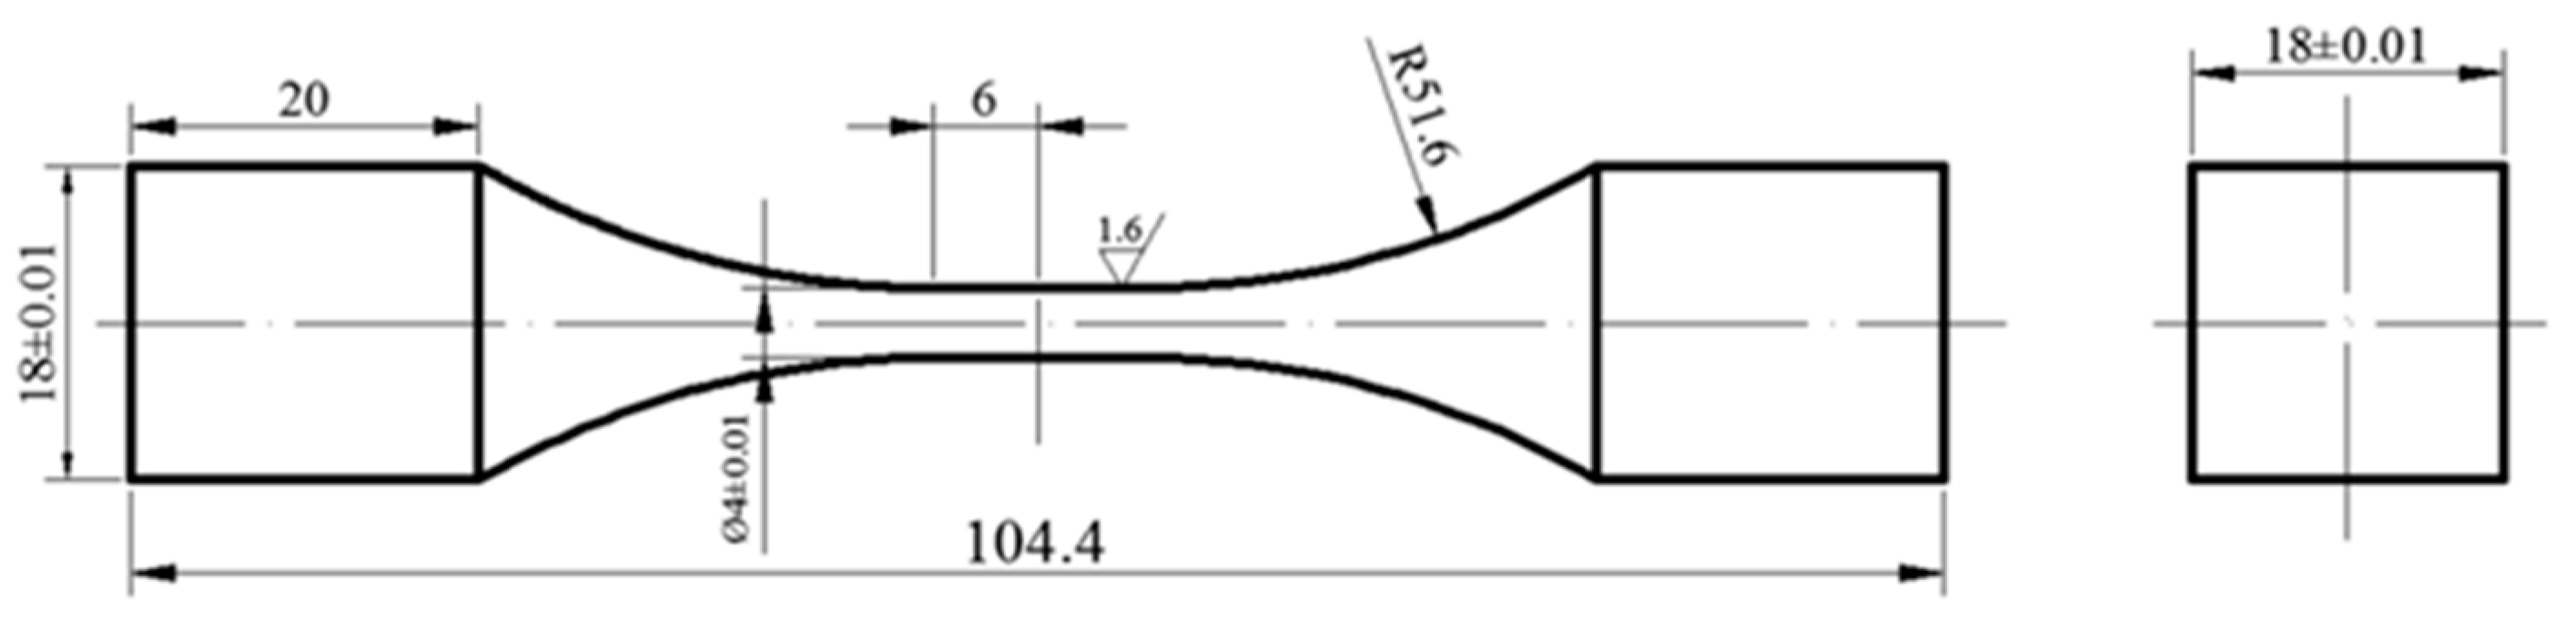
In this study, we will develop the local MCS together with a 3D CFEM model to simulate axial fatigue life and damage evolution. The geometry of the specimen is shown in Figure 1. It is based on our recent fatigue experiments conducted via BOSE ElectroForce 3550 (Bose Corporation ElectroForce Systems Group 10250 Valley View Road, Eden Prairie, MN, USA) under sinusoidal load with the frequency of 10 Hz and stress ratio of 0.1. In Section 2, the CFEM, together with geometric modeling and quantization of the constitutive parameters, will be briefly specified, and the Weibull cumulative distribution function will be introduced to represent the statistical fracture properties. In Section 3, the effects of the random fields and loads on the fatigue life and damage evolution of both the CG and the SMATed specimens will be investigated. The main findings will be summarized in Section 4.
2. Numerical Framework
2.1. Cohesive Finite Element Method
The CFEM is formulated via the principle of virtual work [37]. The internal work by the virtual strain and that by the virtual crack opening displacement equal the external work by the virtual displacement. The CFEM has been successfully applied to predict the damage initiation and evolution explicitly. Furthermore, it can model spontaneous multiple crack behavior, so it has been widely used to investigate damage process [38,39,40,41,42,43]. Here, our interest is in the high nonlinearity involving the interaction of multiple microcracks, and thus the CFEM is particularly appealing.
The cohesive law, i.e., the traction–separation relation, can describe the cohesion of the material in the CFEM. Thereby, the damage initiation and evolution together with the subsequent cracking process in the fatigue and fracture failure is a natural outcome of the computational framework for a specimen with or without preexisting cracks. Our experiments showed that the tensile fatigue-fractured specimen had predominant mode-I cracks. Therefore, we use the following quadratic stress criterion of damage initiation [32,41]:
where is the Macaulay bracket, defined as
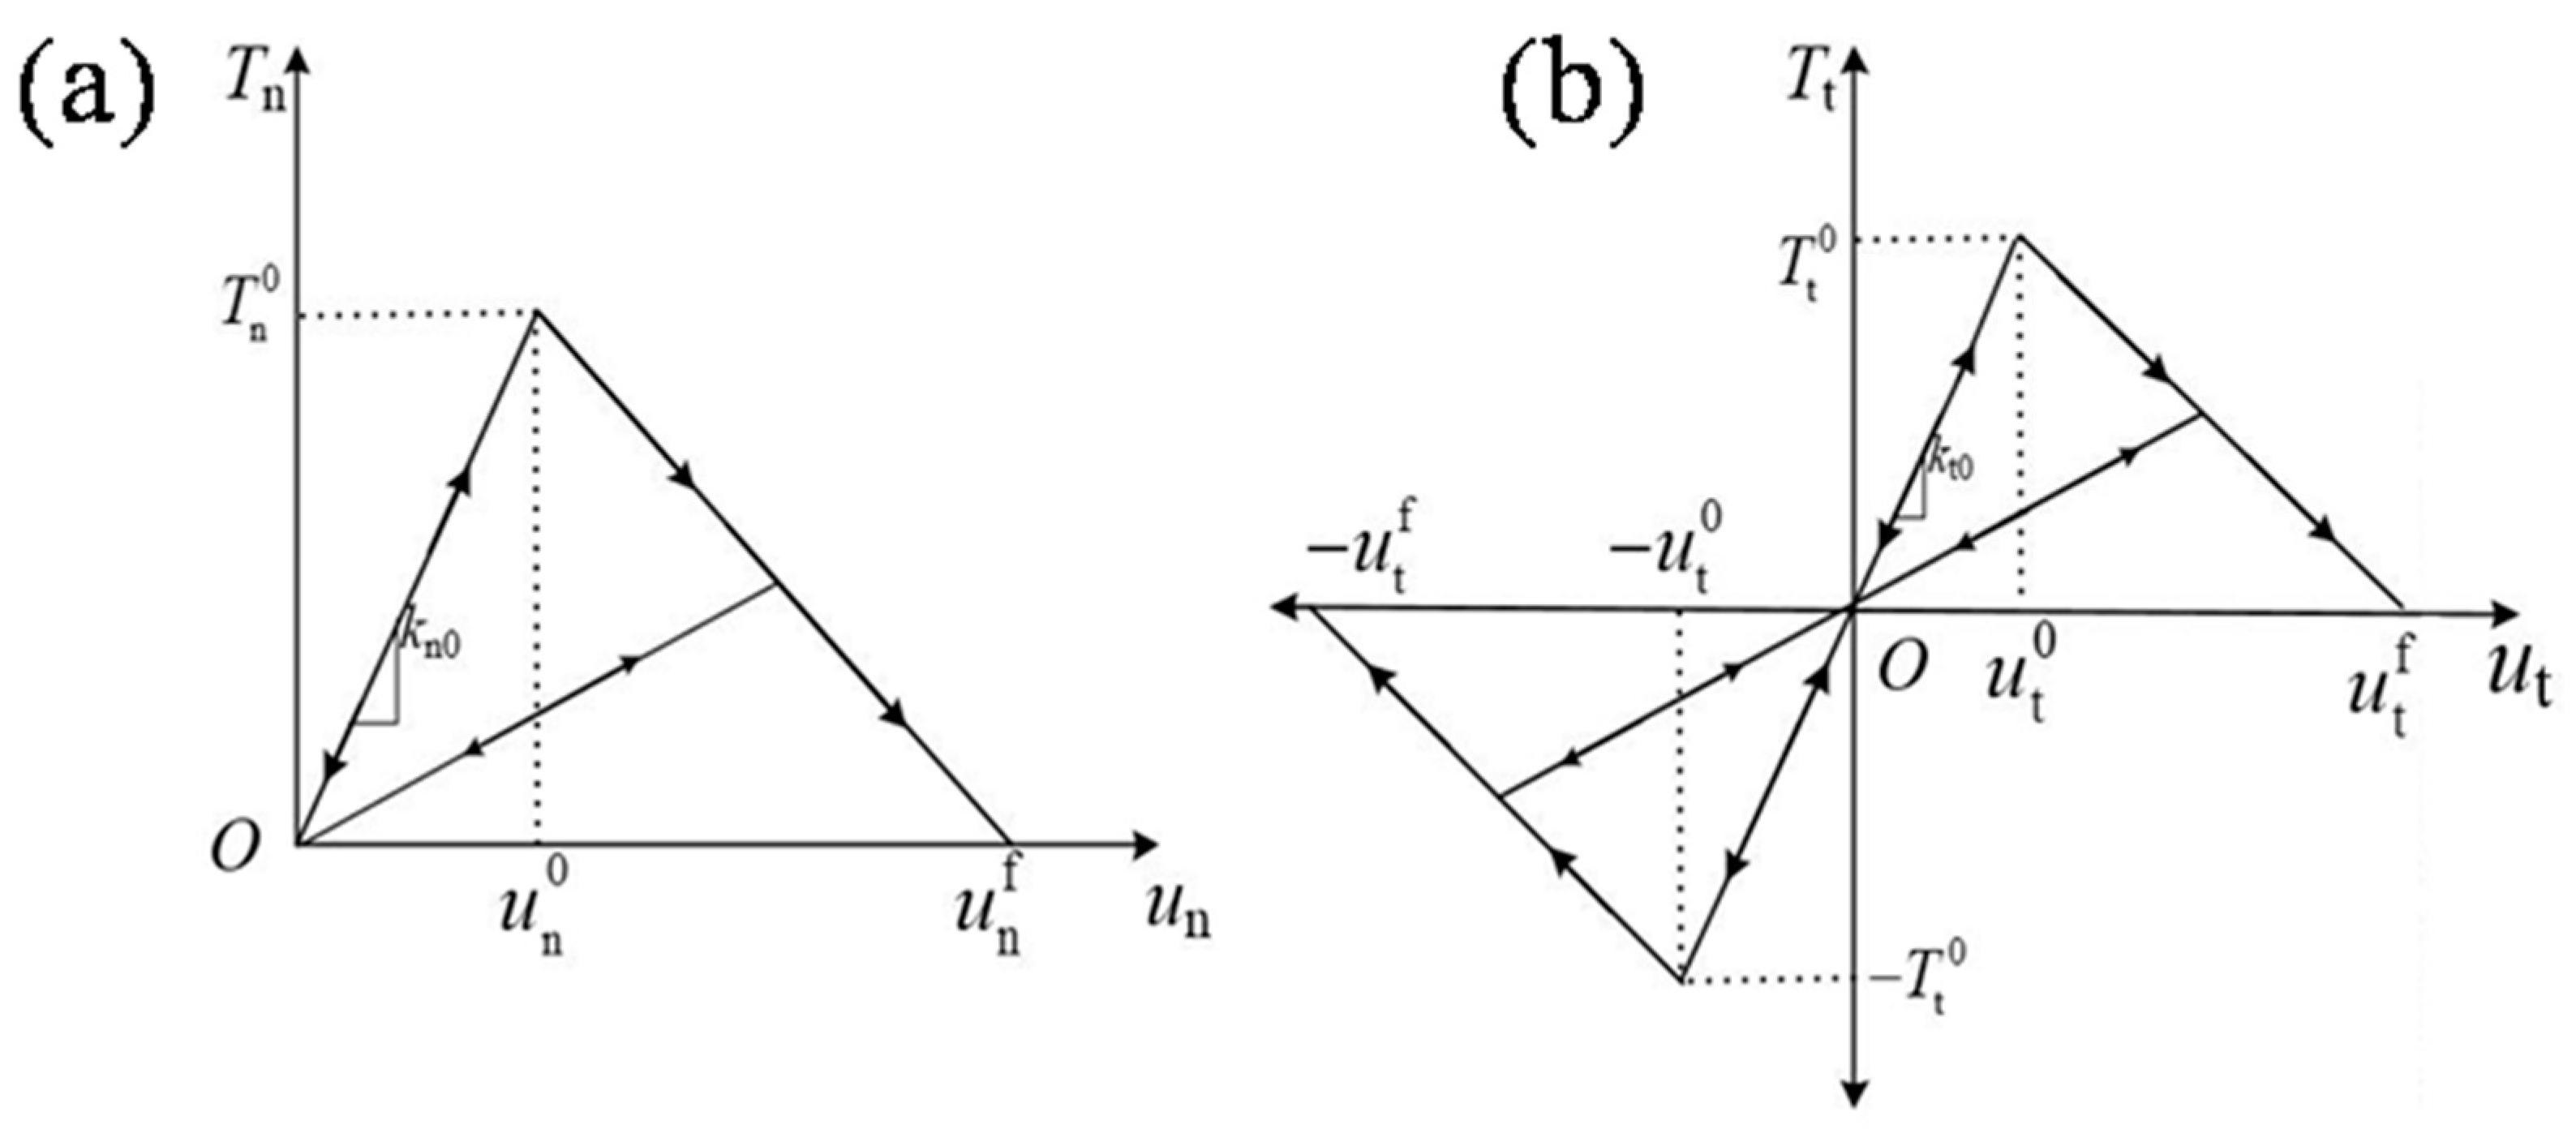
where , , and represent the normal and two shear tractions, respectively. denotes the maximum of the nominal normal traction, and () denotes the maximums of the nominal shear traction, as shown in Figure 2a,b.
The damage evolution can be characterized by the scalar stiffness degradation (SDEG), D, representing the overall damage of the cohesive element caused by all active mechanisms. It depends on the effective separation combining , , and as
For the bilinear cohesive law in Figure 2, the damage evolves according to
where is the maximum effective separation attained during the loading history. and are the characteristic separation where the damage initiates and critical separation where the cohesive element fails, respectively. Equation (4) indicates that D monotonically evolves from 0 to 1 upon further loading after damage initiation [44].
2.2. 3D CFE Geometric Modeling and Quantification of Constitutive Parameters
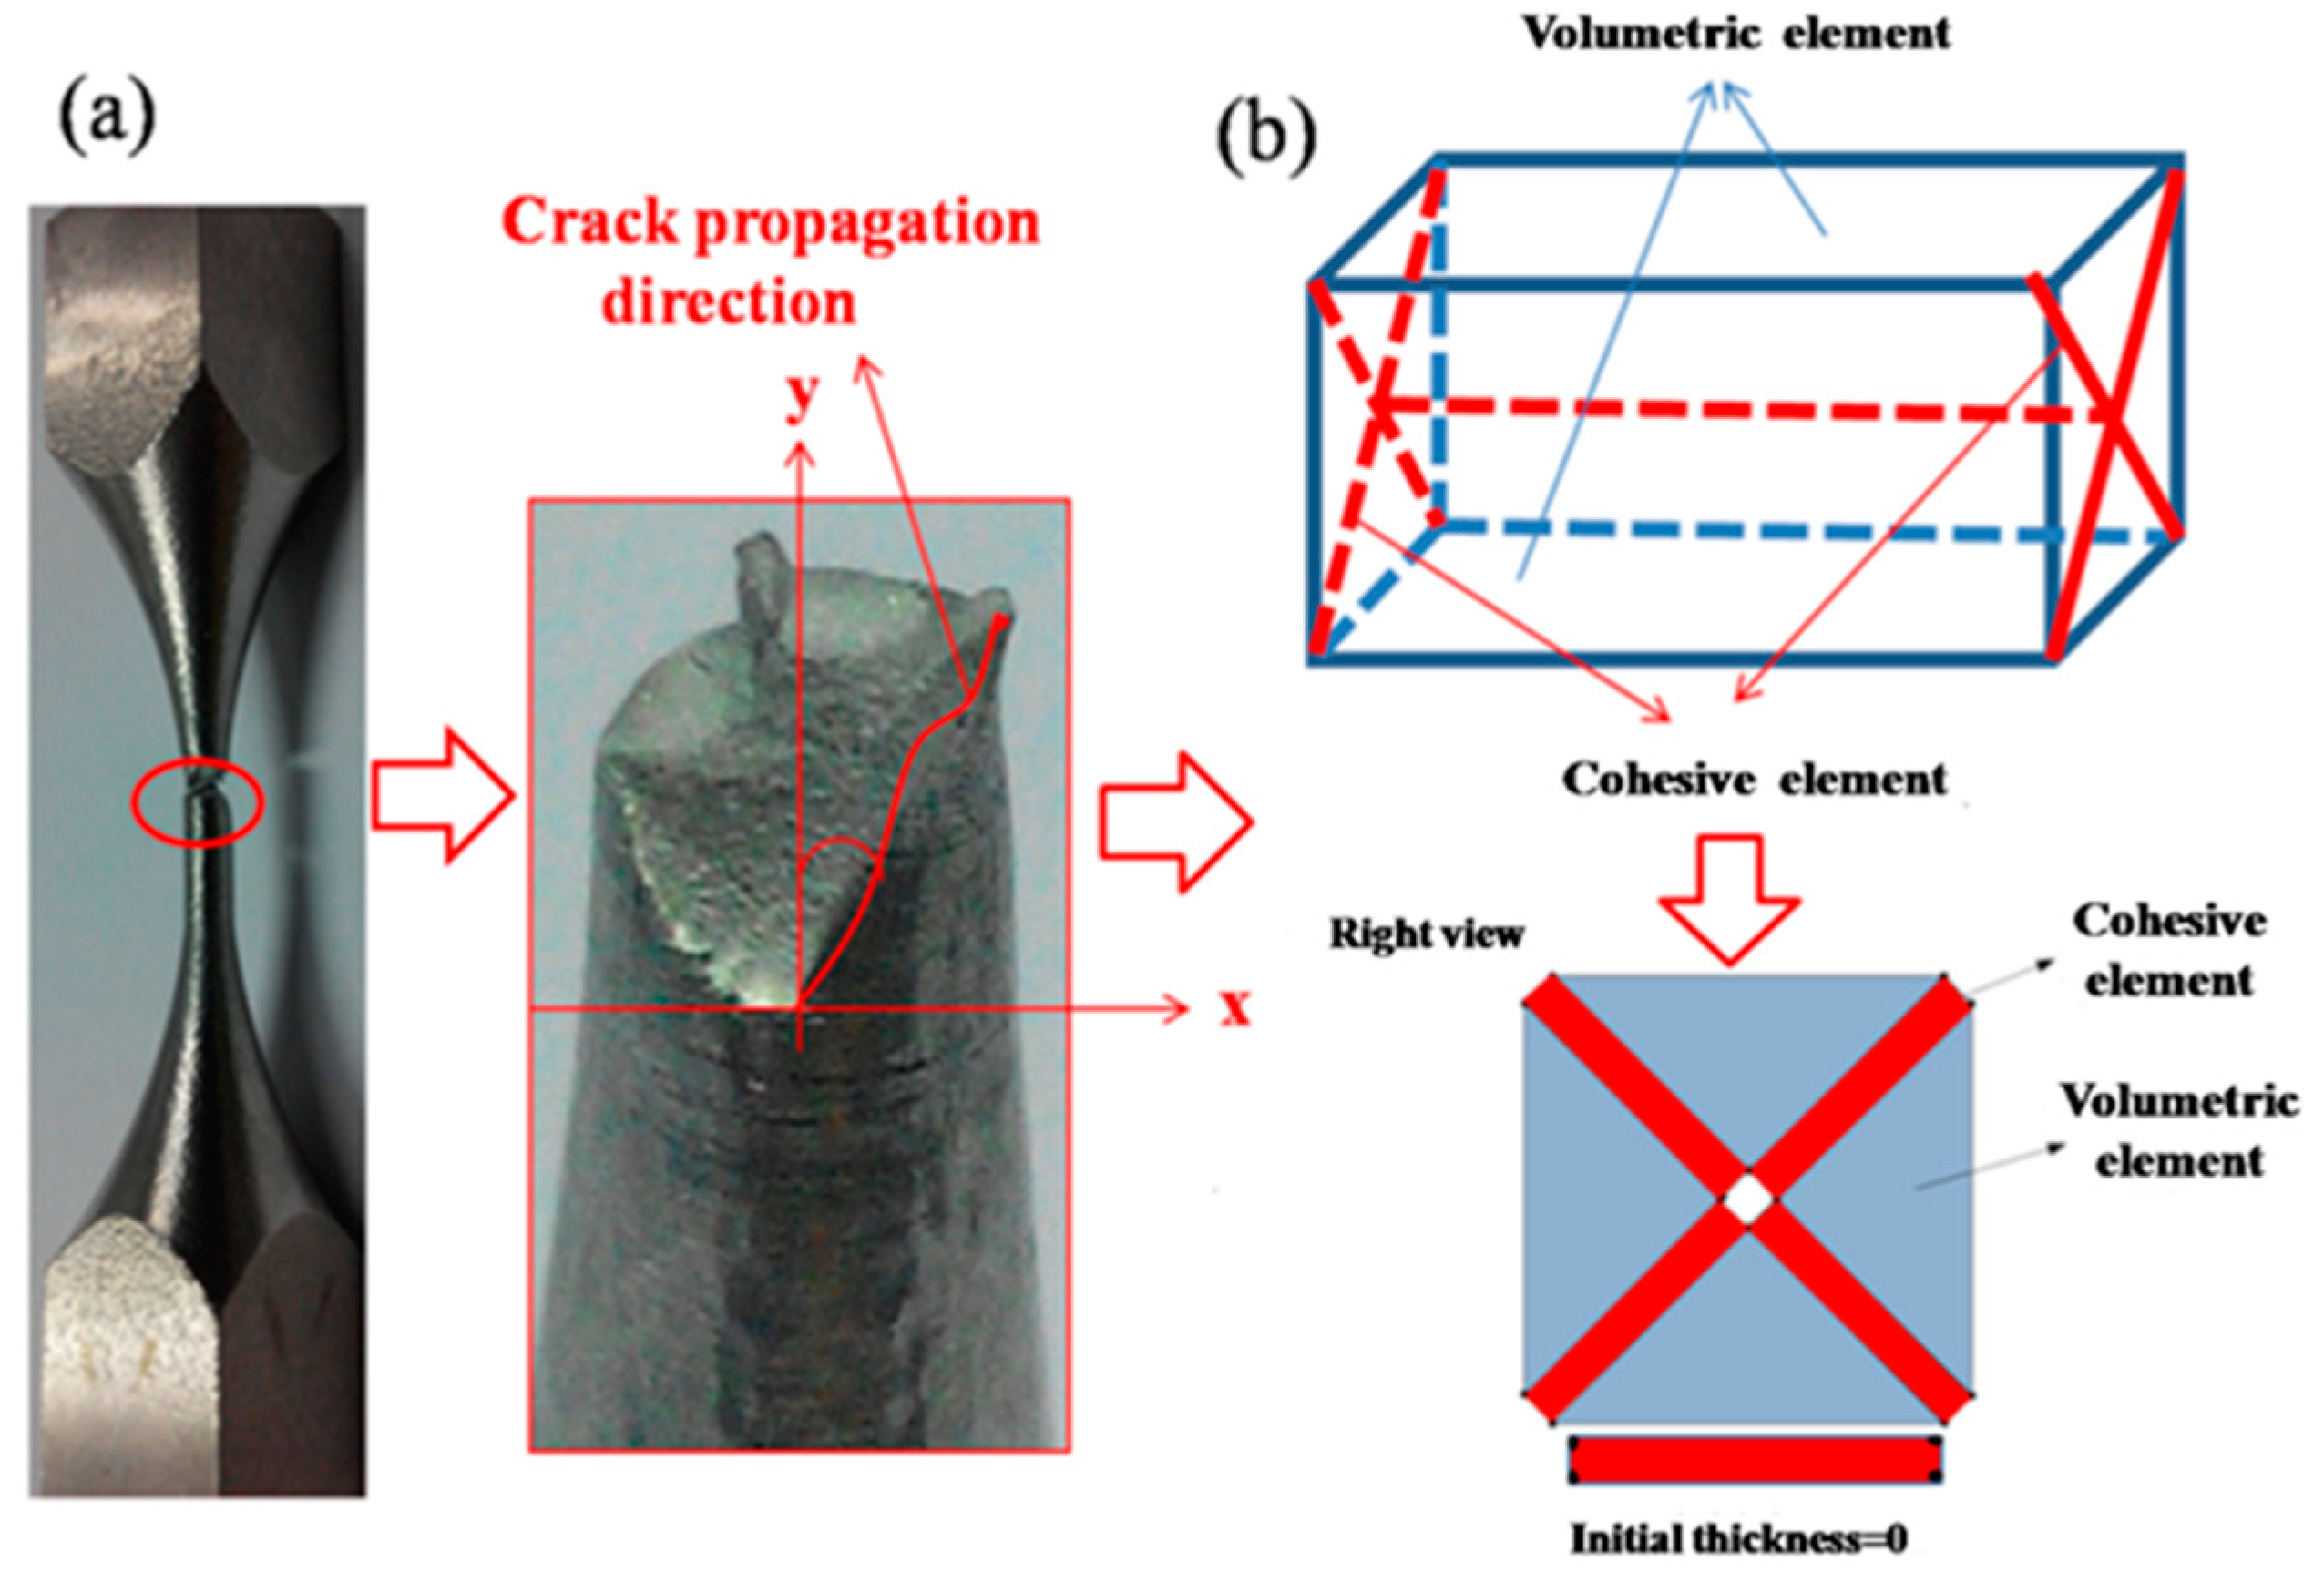
The solid dumbbell-shaped specimens are used in our axial fatigue experiments. As illustrated in Figure 3a, the cracks in the fractured specimen propagate from the exterior surface to the interior. In the present paper, therefore, a 3D CFE geometric model is established by using an embedding algorithm. The approach contains the following three main steps:
- (i)
- Mesh the circular cross section of the 3D specimen. The initial mesh consists of triangular elements in the core location and quadrilateral elements in the surrounding area;
- (ii)
- Generate 3D solid meshes. Read the nodal coordinates and the nodal connectivity of the 2D elements, and then renumber them to establish the index between each new element and the corresponding nodal number. The 2D indices can be extended to 3D so that wedge elements (C3D6) in the core location and hexahedron elements in the surrounding area can be generated;
- (iii)
- Insert cohesive elements. Partition every hexahedron element into four wedge elements along the left and right surfaces, as shown in Figure 3b. One node is replaced by eight separate nodes at the same position at the diagonal center, and four 8-noded cohesive elements (COH3D8 in [44]) and four 6-noded cohesive elements (COH3D6) are generated. The right view of this insertion model is also presented in Figure 3b. COH3D8 can be inserted between the frontal and rear surfaces of the wedge elements, COH3D6 and COH3D8 can be inserted between the left and right surfaces of the wedges and between the upper and lower surfaces of the wedge elements, respectively.
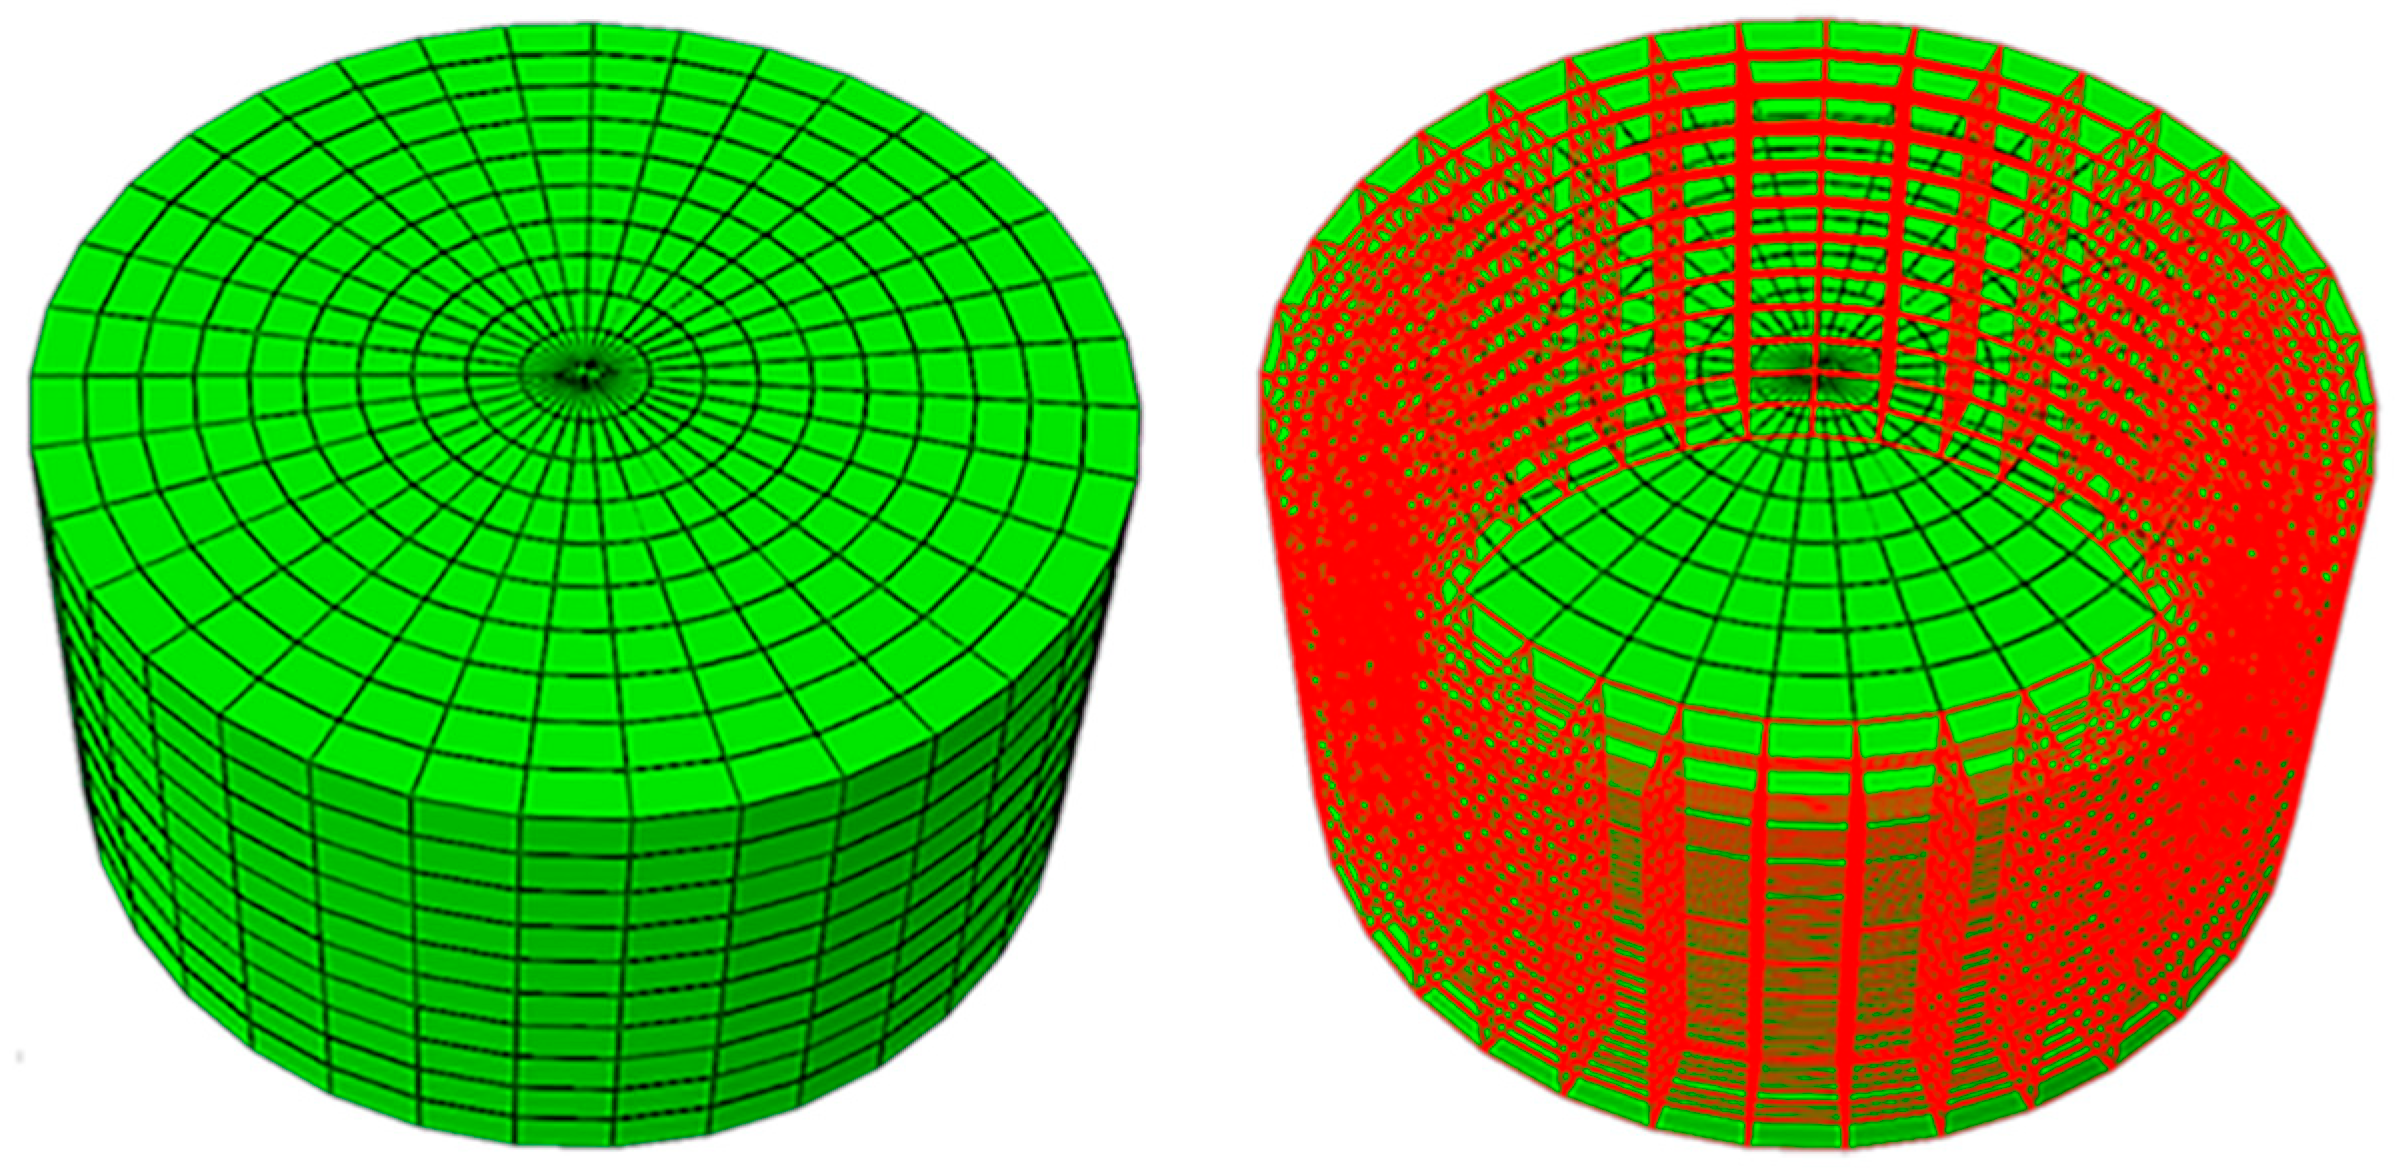
To save computational cost, we consider one sixth of the test section in the axial direction and remove fixture part and transitional arcs of the specimen. Figure 4 shows the CG CFE model, while only the highlighted elements are characterized by the MCS. The number of the MCSed and all discretized elements of CG models are listed in Table 1. Note that the MCSed elements refer to the elements where the MCS is performed.
For the SMATed specimen, we choose an NGL with a thickness of 20 µm. The modeling approach is similar to that for the CG specimen. Specifically, the circumferential and axial dimensions of NGL elements are the same as those of CG elements, while the thickness of the NGL elements (10 µm) is much thinner than that of the nearby CG elements (~180 µm). The corresponding geometric model of the SMATed specimen is illustrated in Figure 5. The number of the MCSed and discretized elements of SMATed models are listed in Table 1.
A bilinear cohesive law has two important parameters, namely the cohesive strength and fracture energy . The fracture energy of the CG 304 SS is obtained from in terms of its fracture toughness , which is taken as 75 MPa [45]. For the NGL, is taken as 36 MPa. Young’s modulus E and Poisson’s ratio v of both the CG and the NGL are taken as 200 GPa and 0.33, respectively [46]. The flow stress of the CG specimen is from the experiments [46], while that of the NGL is estimated from experiments of the SMATed 316L SS [47]. The kinematic hardening model is used to describe the cyclic plastic behavior of the metals. Additionally, the initial stiffness k should be large enough to alleviate the inherent mesh dependence, while too large value may cause numerical ill-conditioning [38,41]. It is determined as .
2.3. Weibull Random Field
Based on the weakest link model, the Weibull distribution assumes that strength is connected with flaws randomly distributed in the materials. Here, the cohesive strength is modeled by Weibull random fields, while the effective separation at failure is taken as a constant. Therefore, the fracture energy is also a random field. The Weibull cumulative distribution function of failure of the material subjected to a stress can be formulated into
where the material parameter, m the Weibull modulus, the threshold stress below which the failure will not occur, V the sample volume, and the reference one. Its mean and standard variance depend on , , and m. Here, we take the Weibull modulus m as 50 [48]. The threshold stress is taken as the yield strength , and the material parameter as the ultimate strength [48].
3. Results for CG and SMATed Specimens
3.1. Cohesive Strength Effects on the Fatigue Life for the CG Specimens
As described in Section 2, to relate the mean cohesive strength with yield strength of the CG 304 SS, = 8 , 10 , and 13 , the corresponding , are selected to investigate its effect on the fatigue life under the asymmetric sinusoidal forces, namely, 893.6–8936 N (the corresponding stress amplitude Δσ is 320 MPa), 868.5–8685 N (Δσ = 311 MPa), and 843.3–8433 N (Δσ = 302 MPa). As depicted in Figure 6, when = 8, the predicted fatigue life is lower than the experimental results; when = 13, the predicted fatigue life is higher. Therefore, is calibrated as 10, as listed in Table 2.
3.2. Random Field Effects on the Fatigue Life and Damage Evolution of CG Specimens
Three loads used in the experiments are selected, namely 8936 N, 8685 N, and 8433 N. Figure 7a–e illustrates five Weibull random distributions of cohesive strength with a mean of 2949 MPa and a standard variance of 74 MPa. There are various weak areas that indicate various fatigue sources in different random fields.
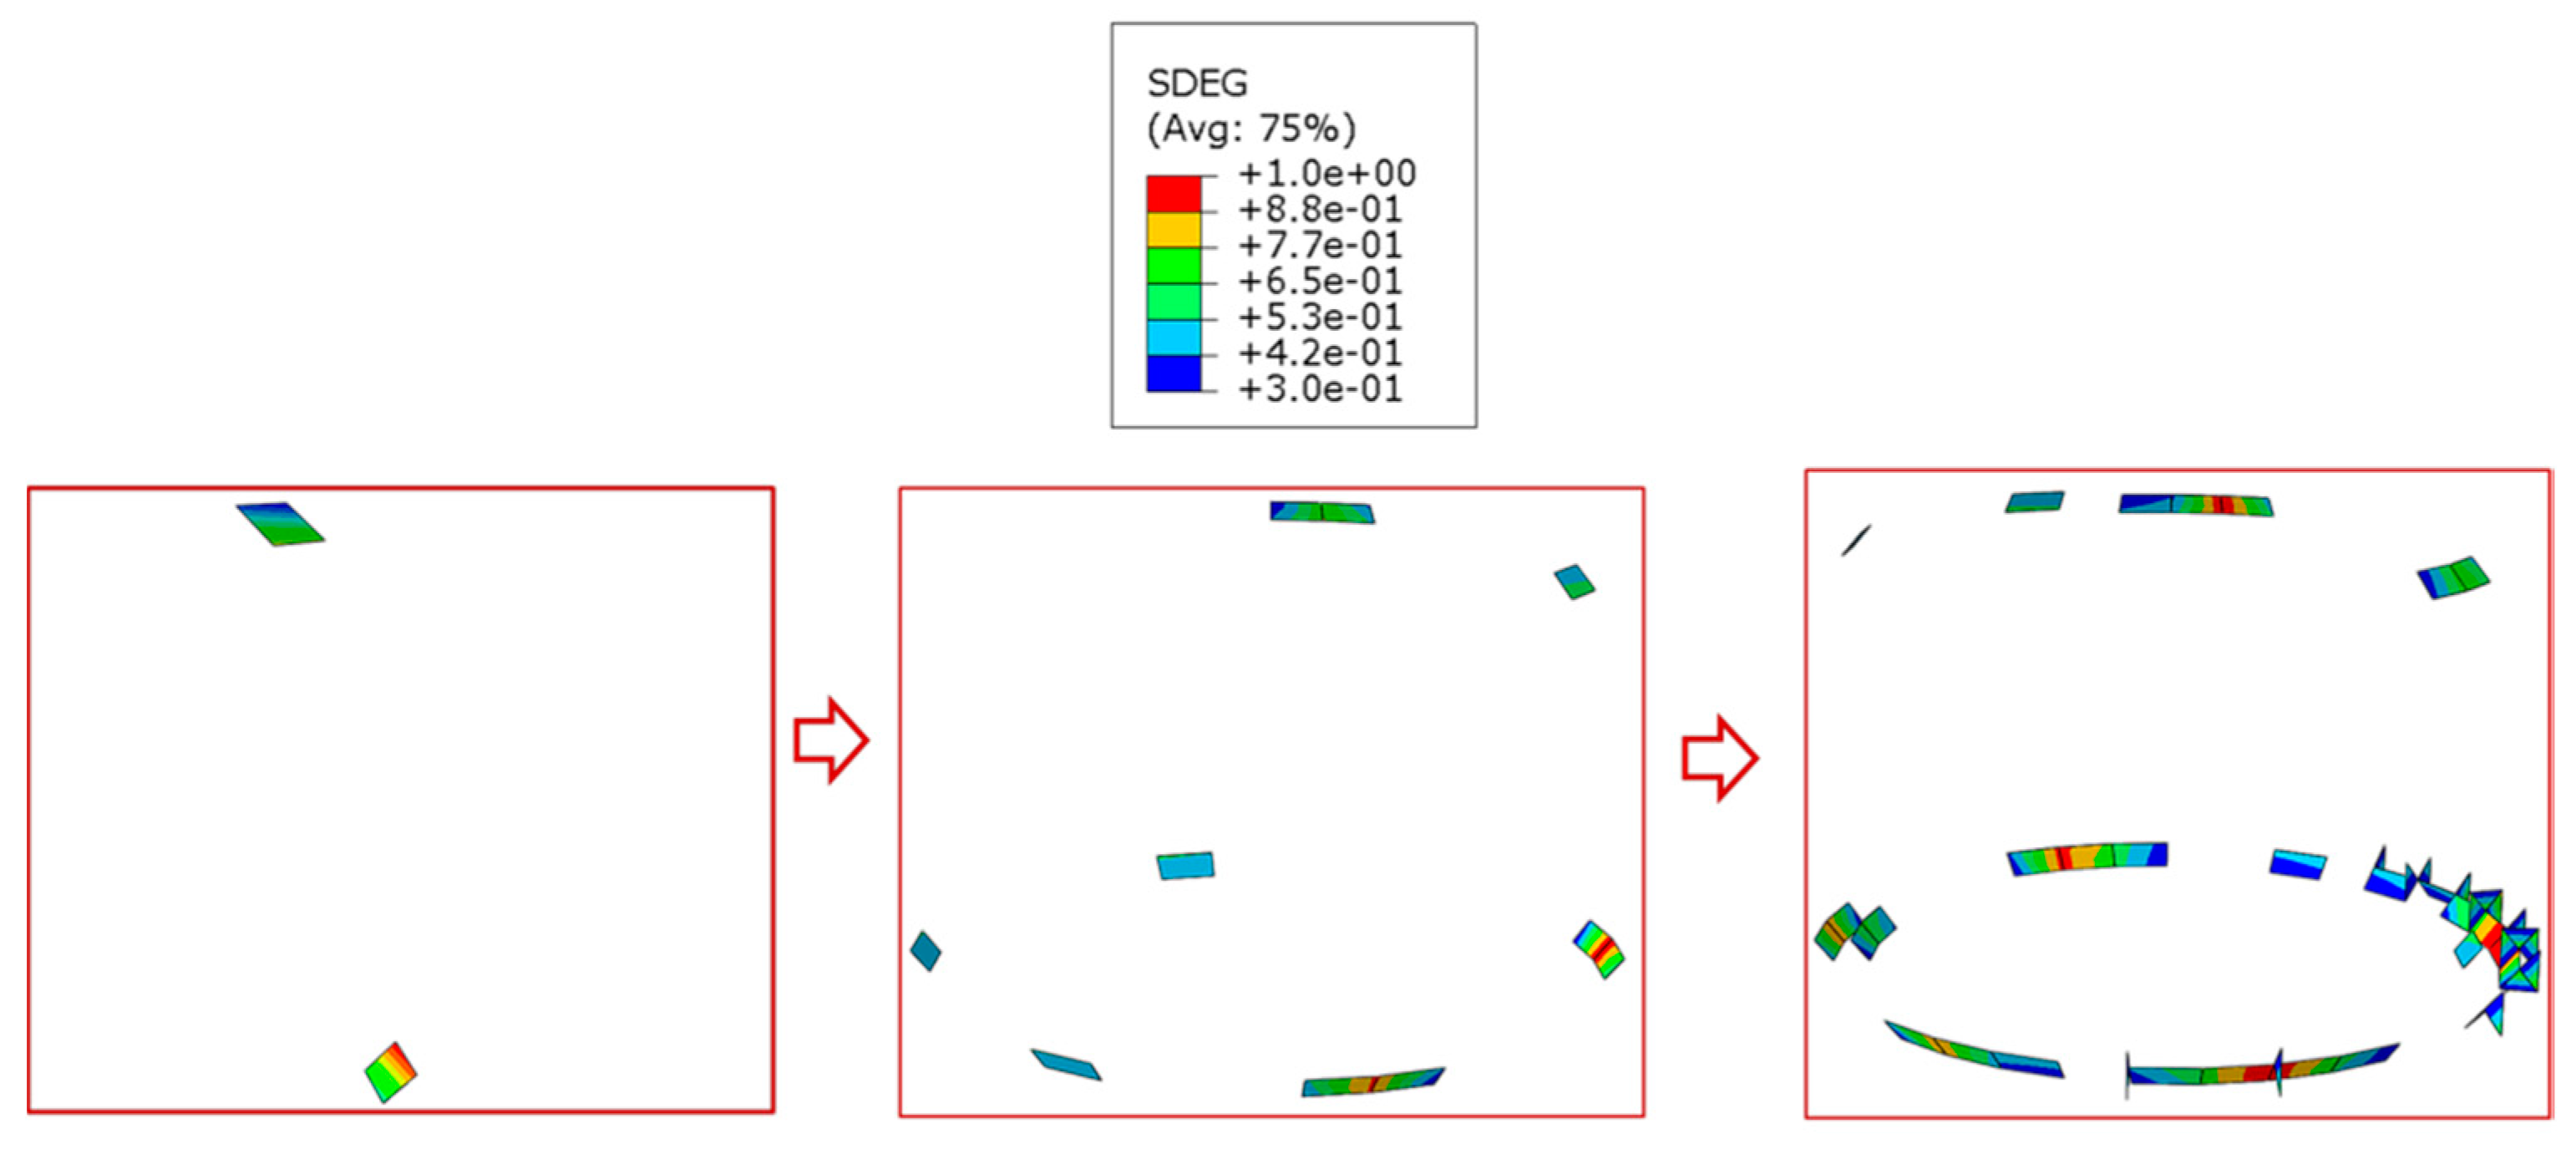
By fixing the axial load 8936 N, we investigate the end displacement and damage evolution of the CG specimen under five random fields. As an example, Figure 8 shows the end displacement of the specimen under No. 2 random field. In the early stage, since the material constitutive relation has a stabilization process in the experiment, the experimental value will be smoothly transitioned. After the stabilization, the mean and amplitude of the simulated end displacement are consistent with the experimental results. The damage in the CG specimens is evaluated by the SDEG. All elements in Figure 9 are severely damaged (i.e., SDEG > 0.3). It can be seen that the damage initiates from the exterior surface of the specimen. With the increase in the cycle number, the damage propagates circumferentially and ultimately fails the specimen. Figure 10 shows the damage evolution under the same axial load and the different random fields at the same cycle number (16,000). The severely damaged elements (i.e., SDEG > 0.5) are shown in Figure 10. It shows that the number and the distribution of severely damaged elements vary from each other. In this case, different random fields have various weakened zones, which leads to the different damage degree and distribution during the fatigue loading. The damaged elements are mainly distributed along the circumferential direction.
3.3. Load Effects on the Fatigue Life and Damage Evolution of CG Specimens
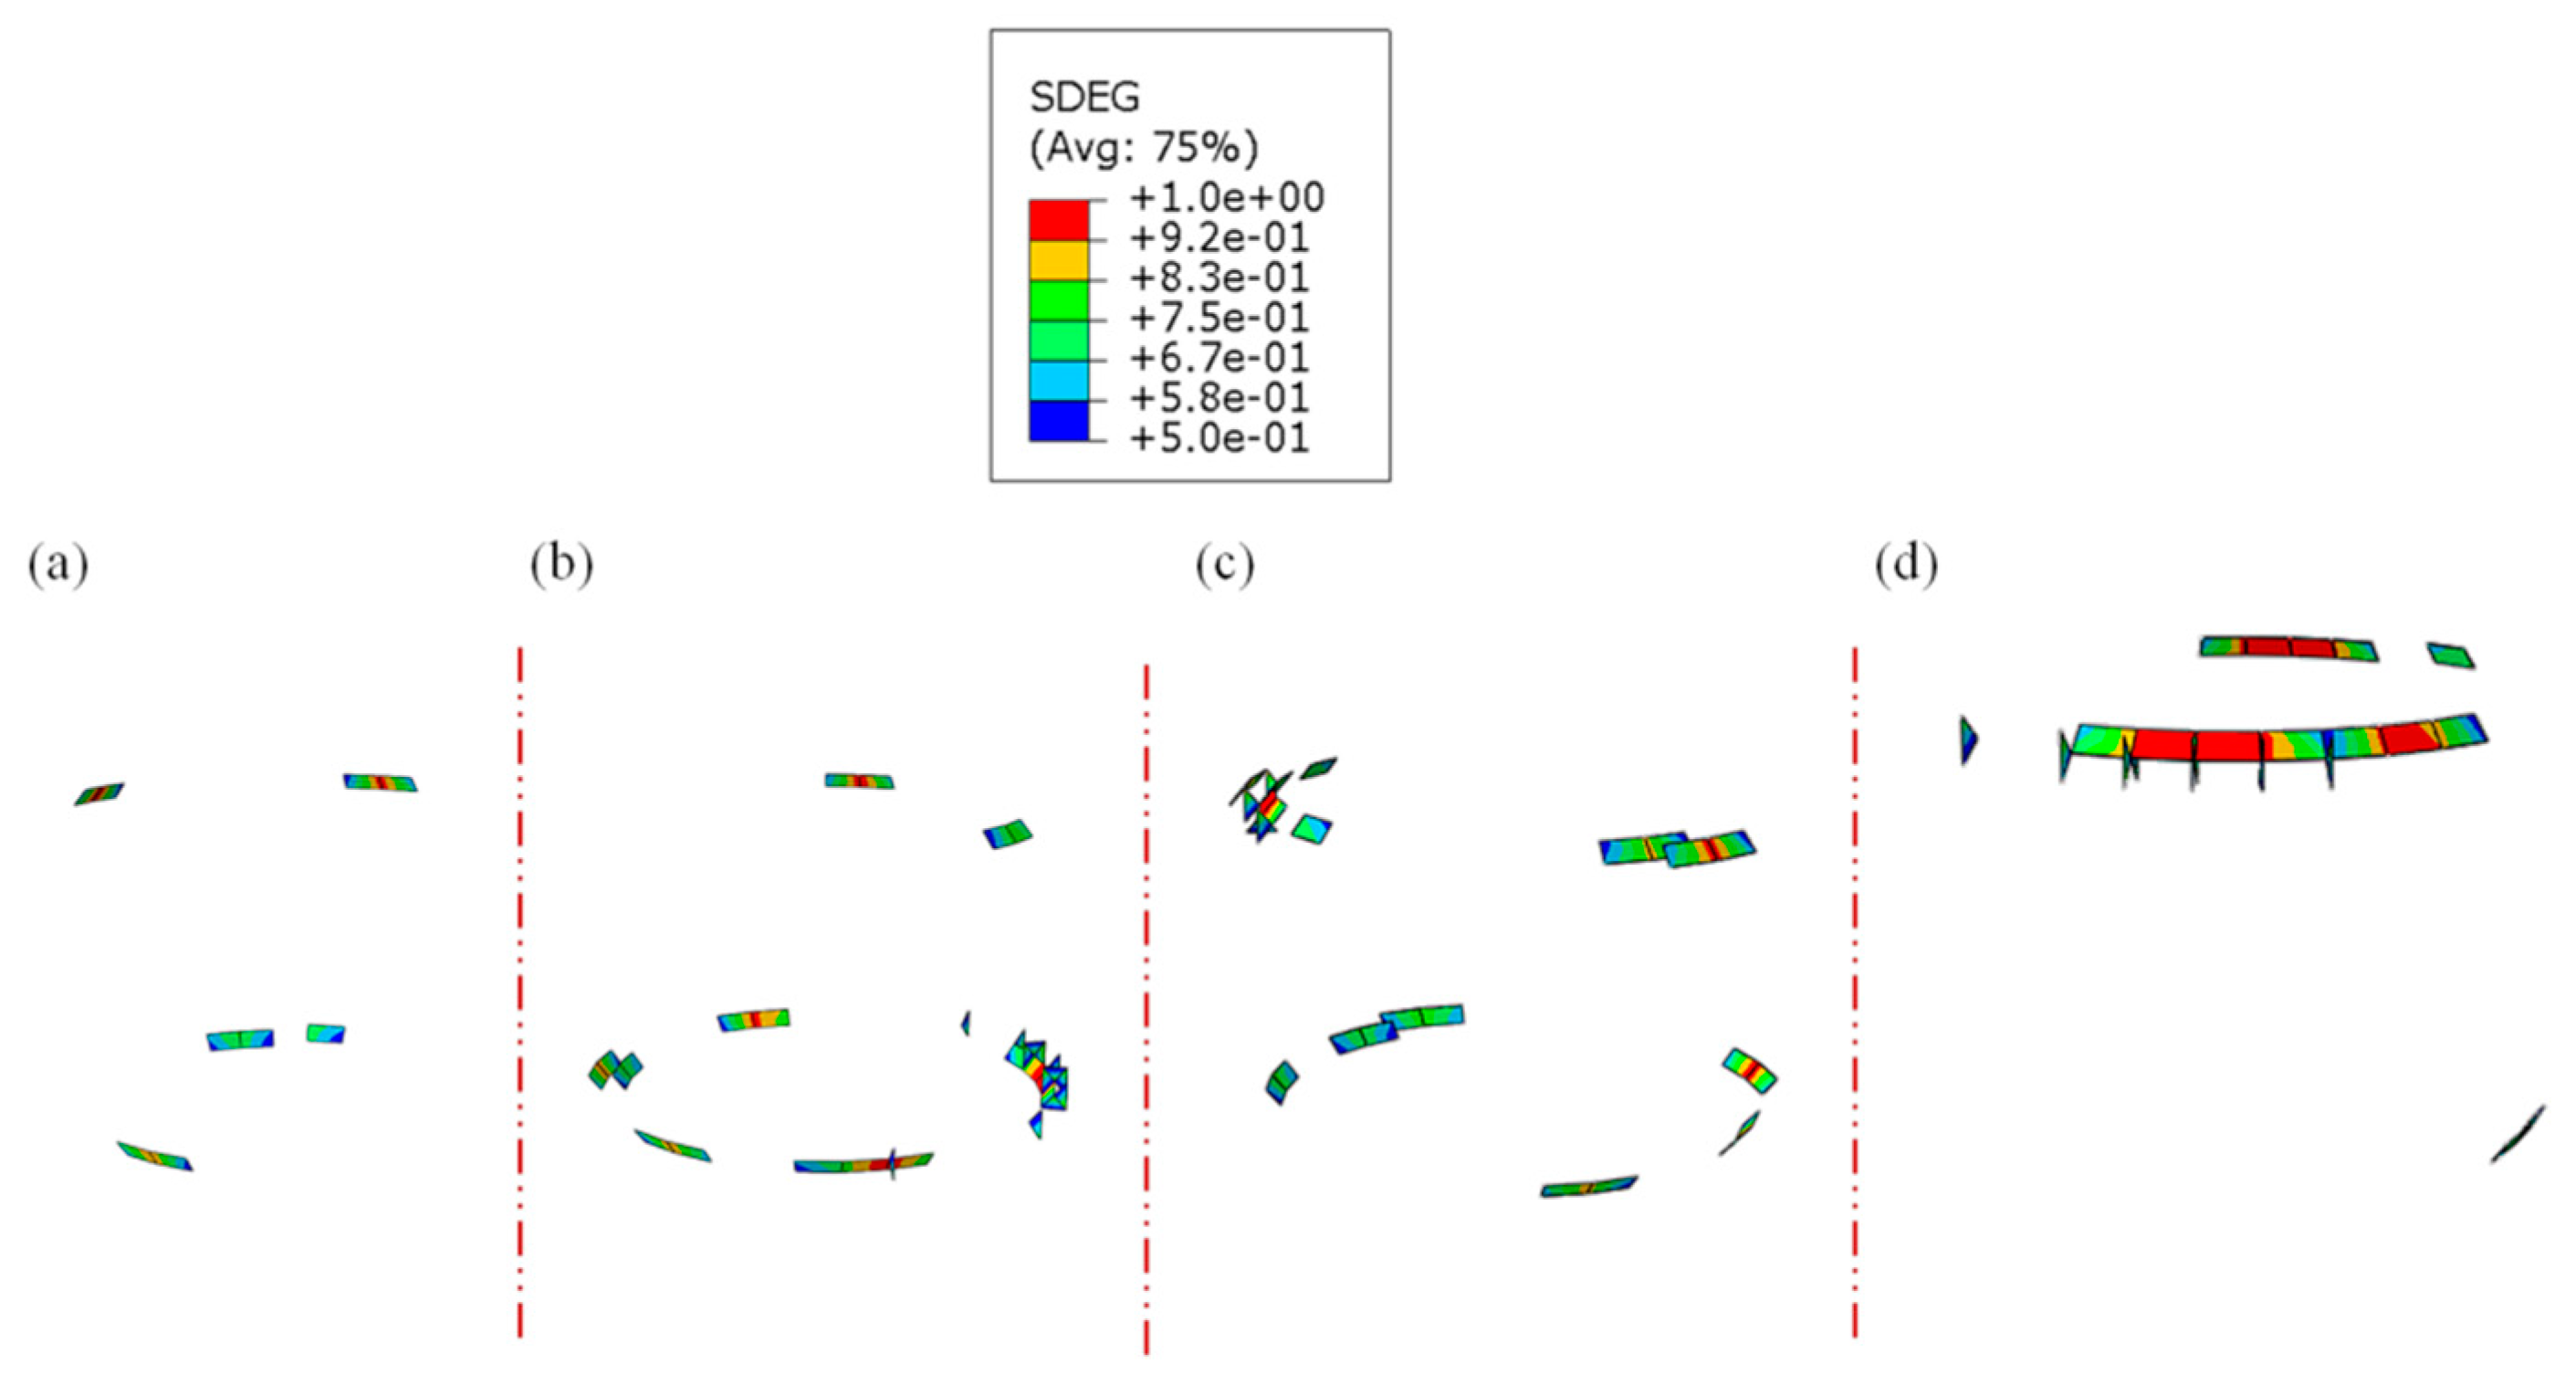
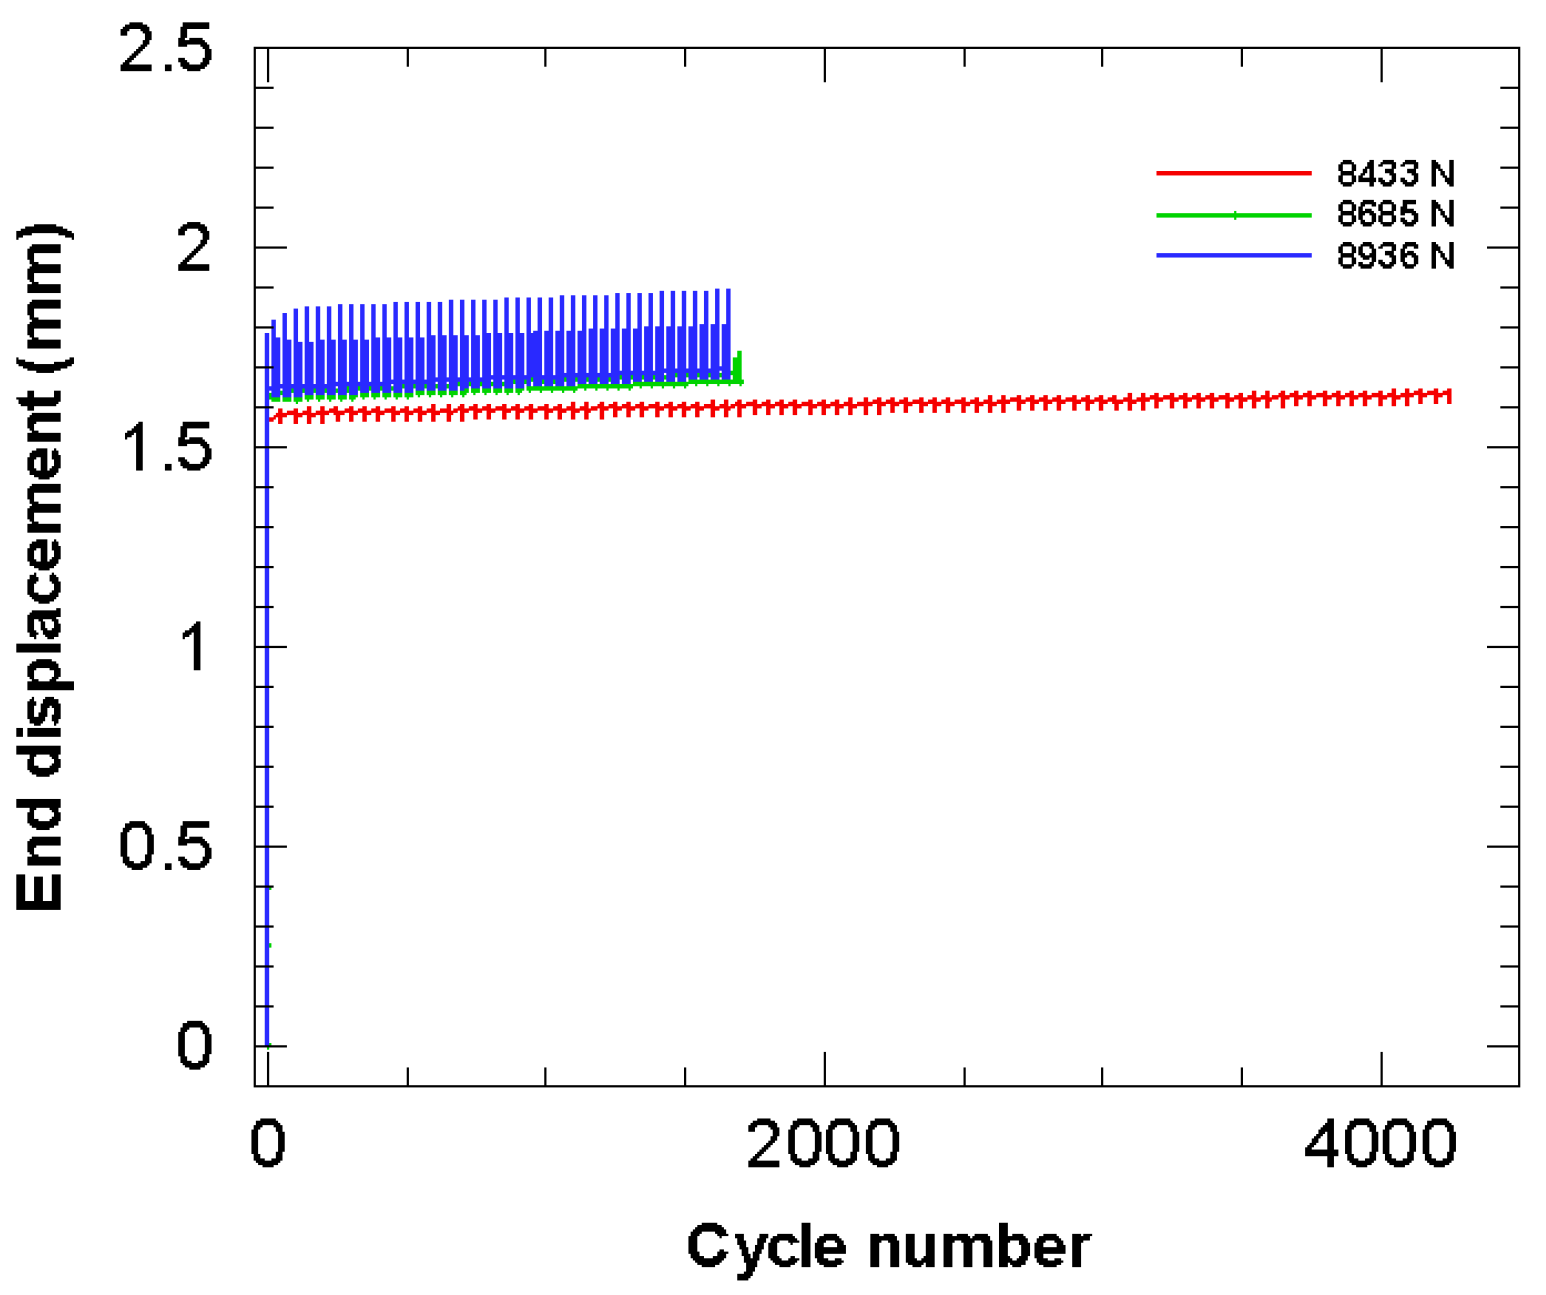
Figure 11 shows the end displacement of specimens associated with No. 2 random field under the above three axial cyclic loads. It can be seen that both the amplitude and the mean of the end displacement under higher axial stress is larger. This is due to the fact that the higher axial stress generates larger deformation, which results in the larger amplitudes and higher mean of end displacement. On the other hand, when the stress is lower, the amplitude of the displacement is relatively smaller. The elements in Figure 12 are severely damaged (i.e., SDEG > 0.5). The number of damaged elements increases with the stress and the damage is more serious under higher stress. Here, although the current model can simulate the damage process reasonably, the end effect exists, i.e., some severe damage occurs in the end zones due to the limitation on the length of the computational specimens. In the future study, we will further improve the model.
3.4. Fatigue Life and Damage Evolution of the SMATed Specimens
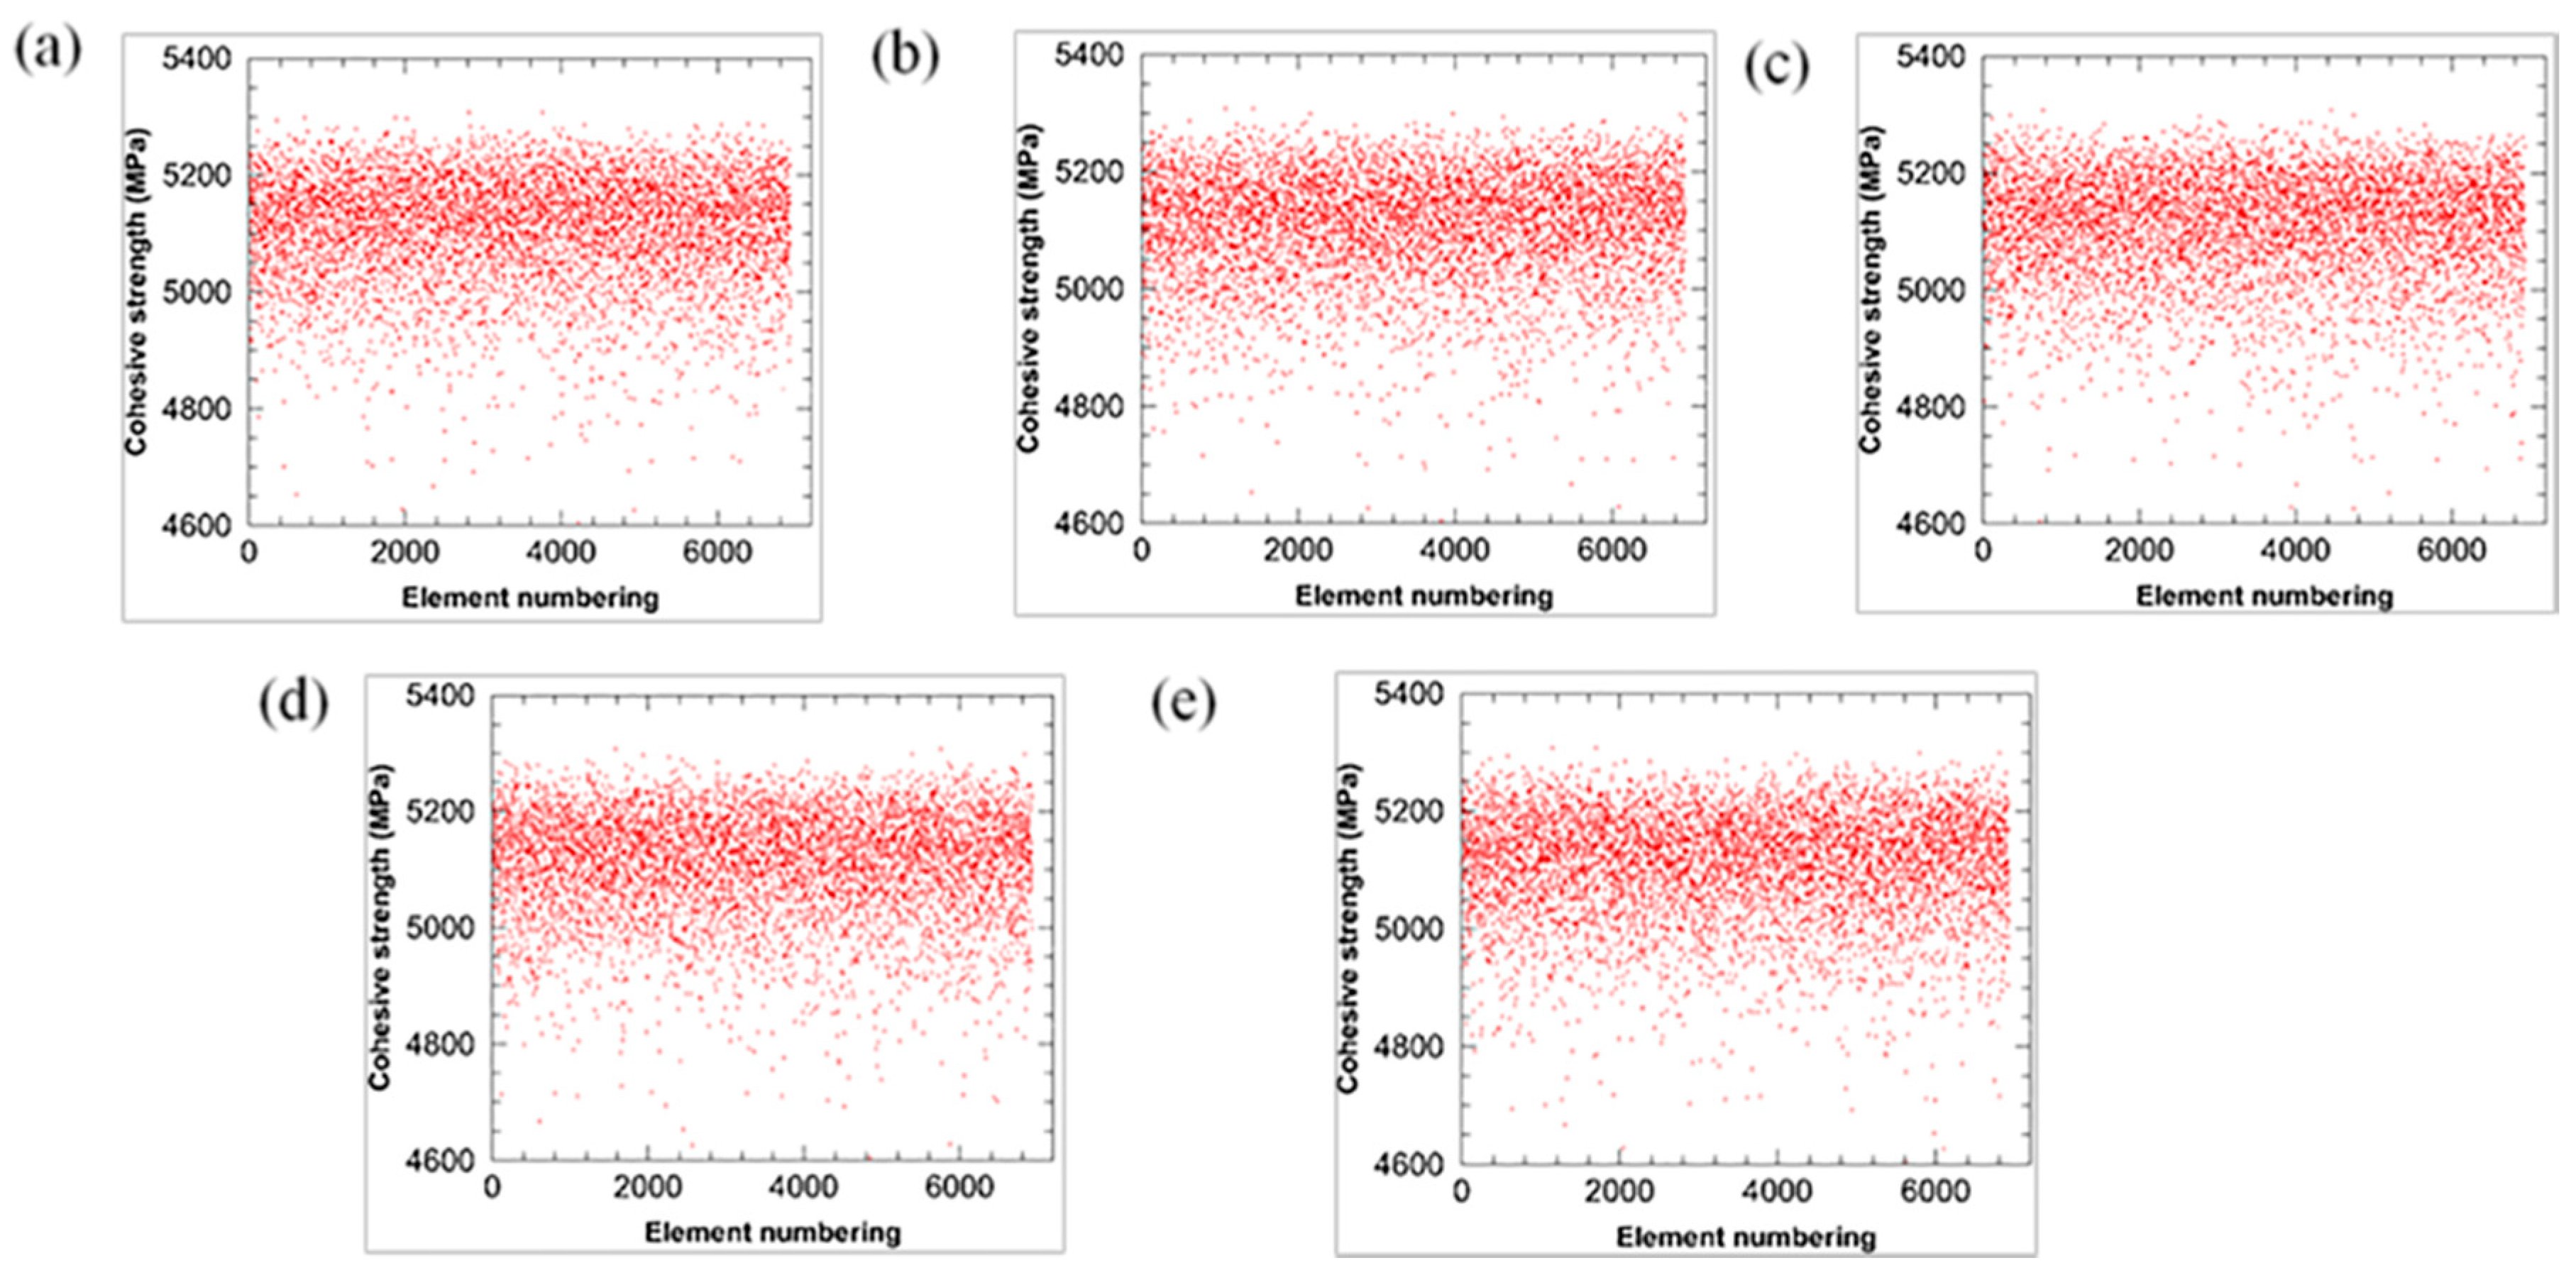
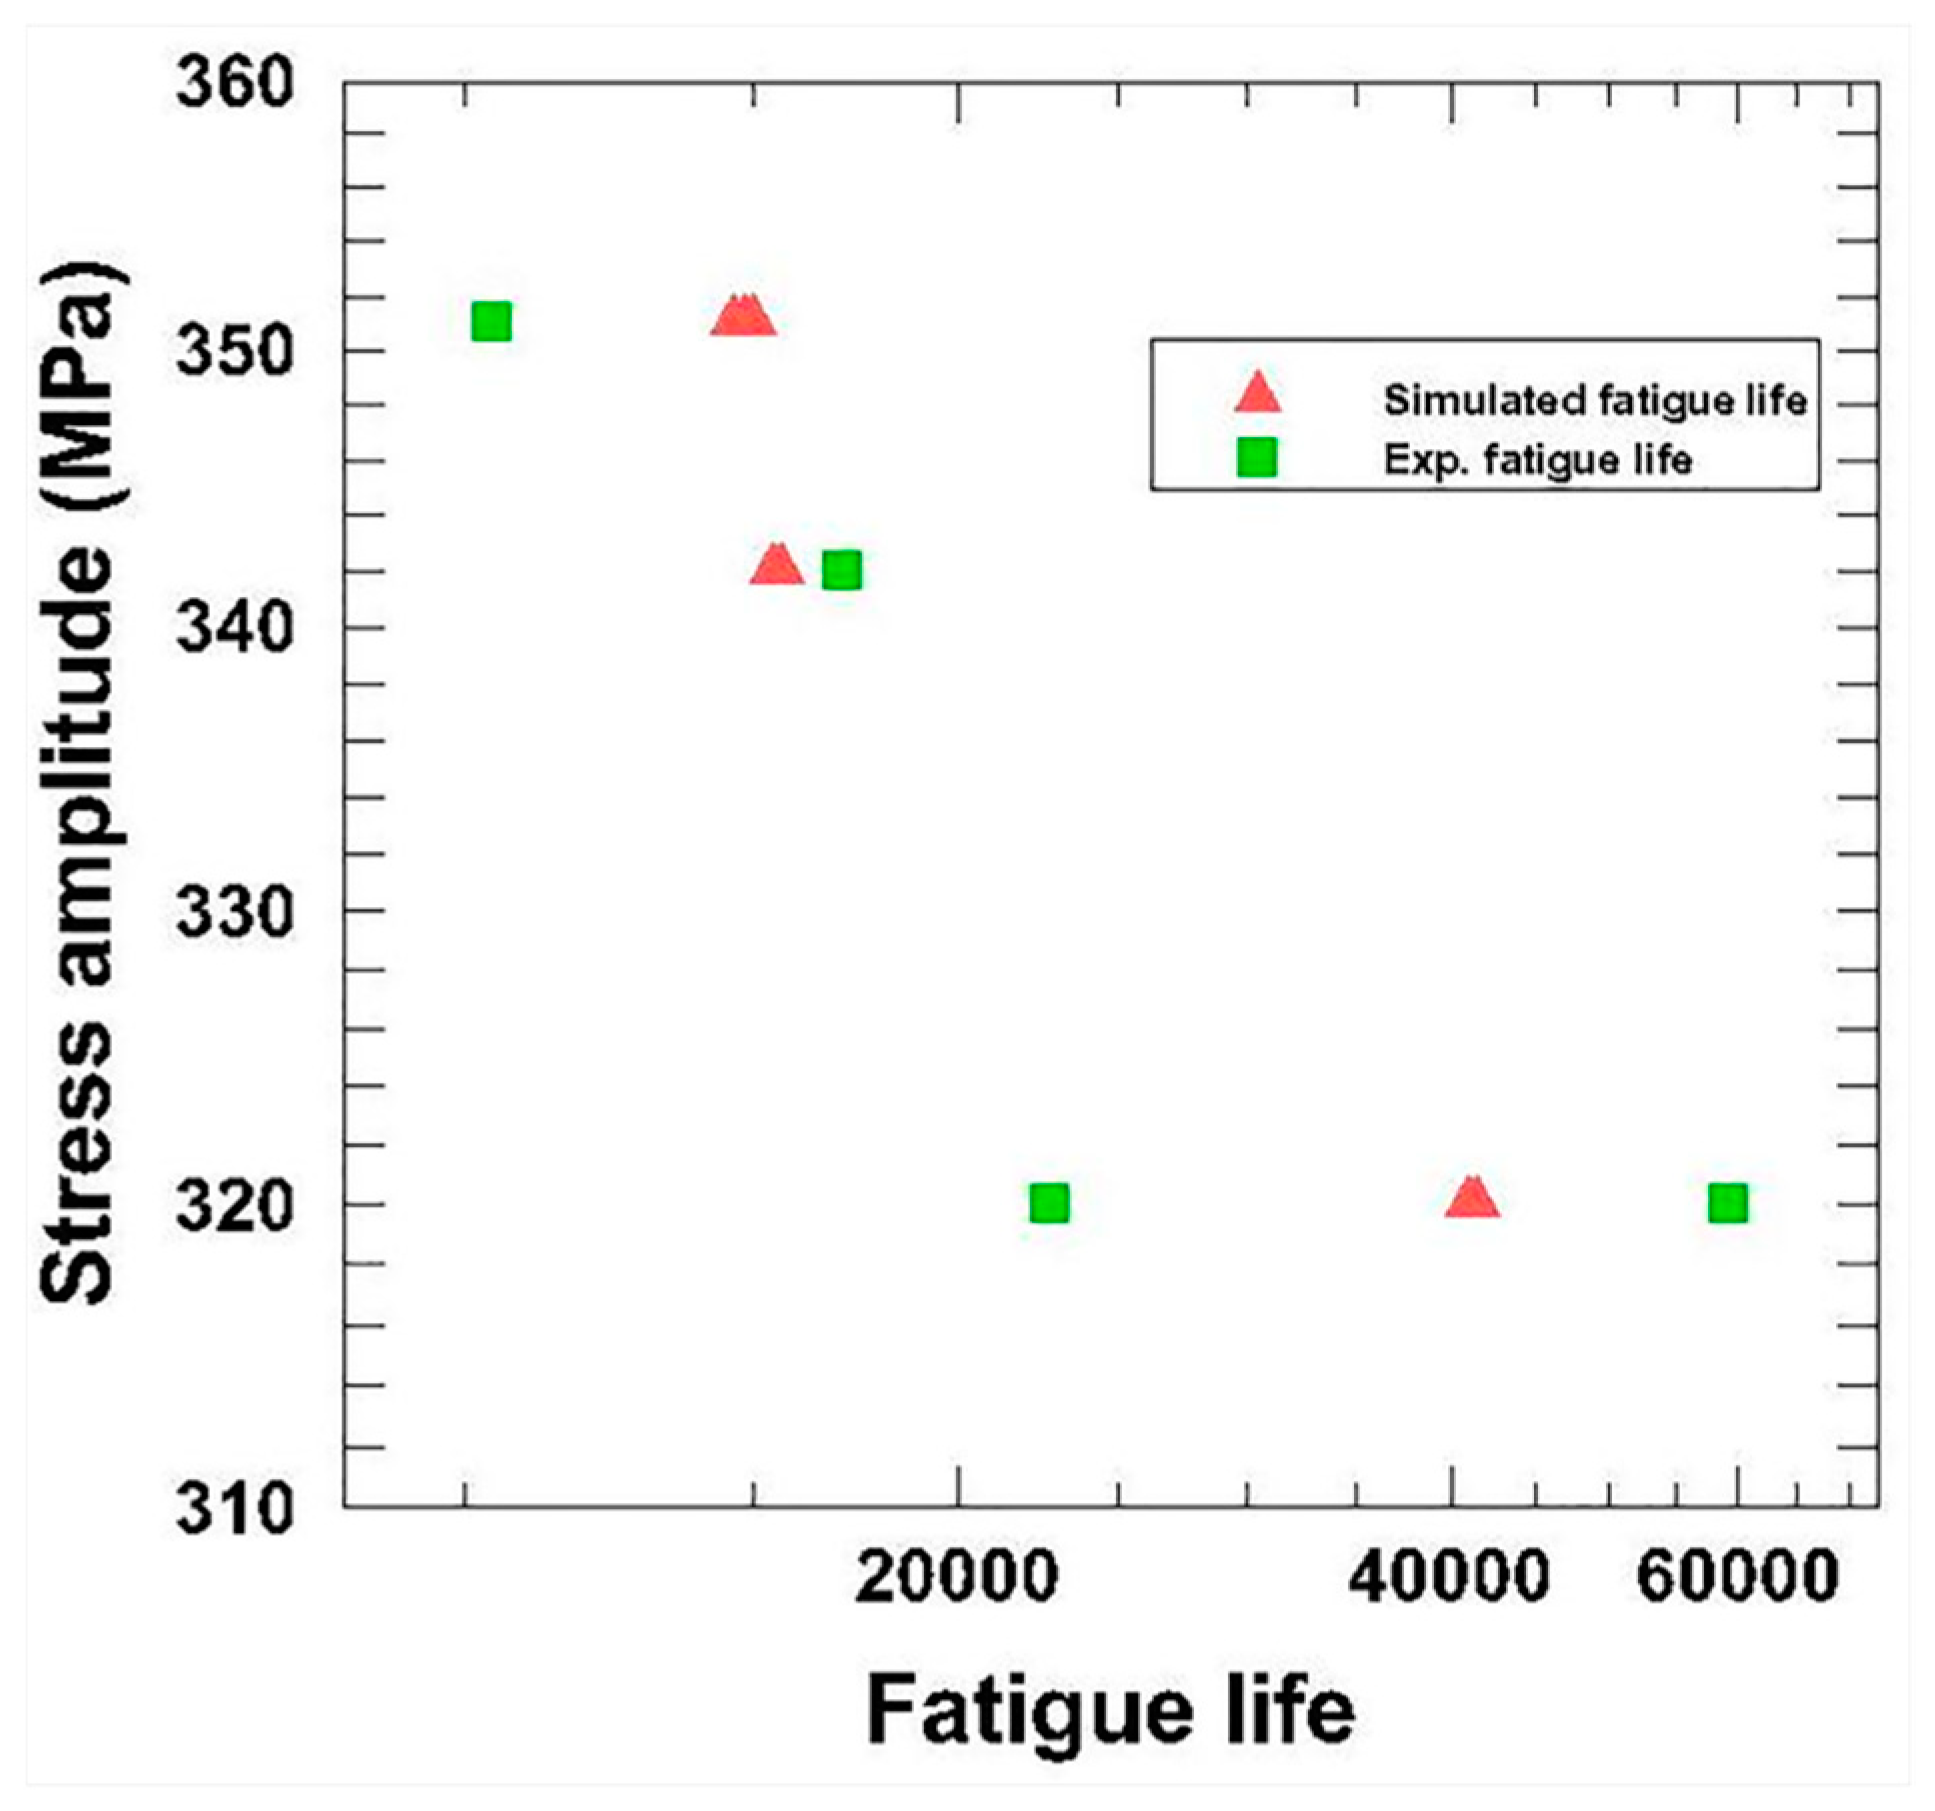
The material properties of the nanocrystalline SS are assigned to the elements in the NGL. The other elements have the same material properties of the CG 304 SS, as listed in Table 2. To reduce the element size effects, the local MCS is adopted to all of the elements in the NGL and the outer two layers of CG elements, while the other elements have homogenized properties. In our experiments, the SMATed 304 SS exhibits an enhancement of the fatigue life. Therefore, three elevated force ranges are selected, namely 979.6–9796 N (Δσ = 351 MPa), 942–9420 N (Δσ = 342 MPa), and 893.6–8936 N (Δσ = 320 MPa). According to Weibull distribution, five random fields are generated under each load. Figure 13 shows five random distributions for the cohesive strength of the elements in the NGL with the thickness 20 μm. The mean and standard deviation of the cohesive strength are 5109 MPa and 88 MPa, respectively. As shown in Figure 14, the predicted fatigue life is in a good agreement with the experimental results.
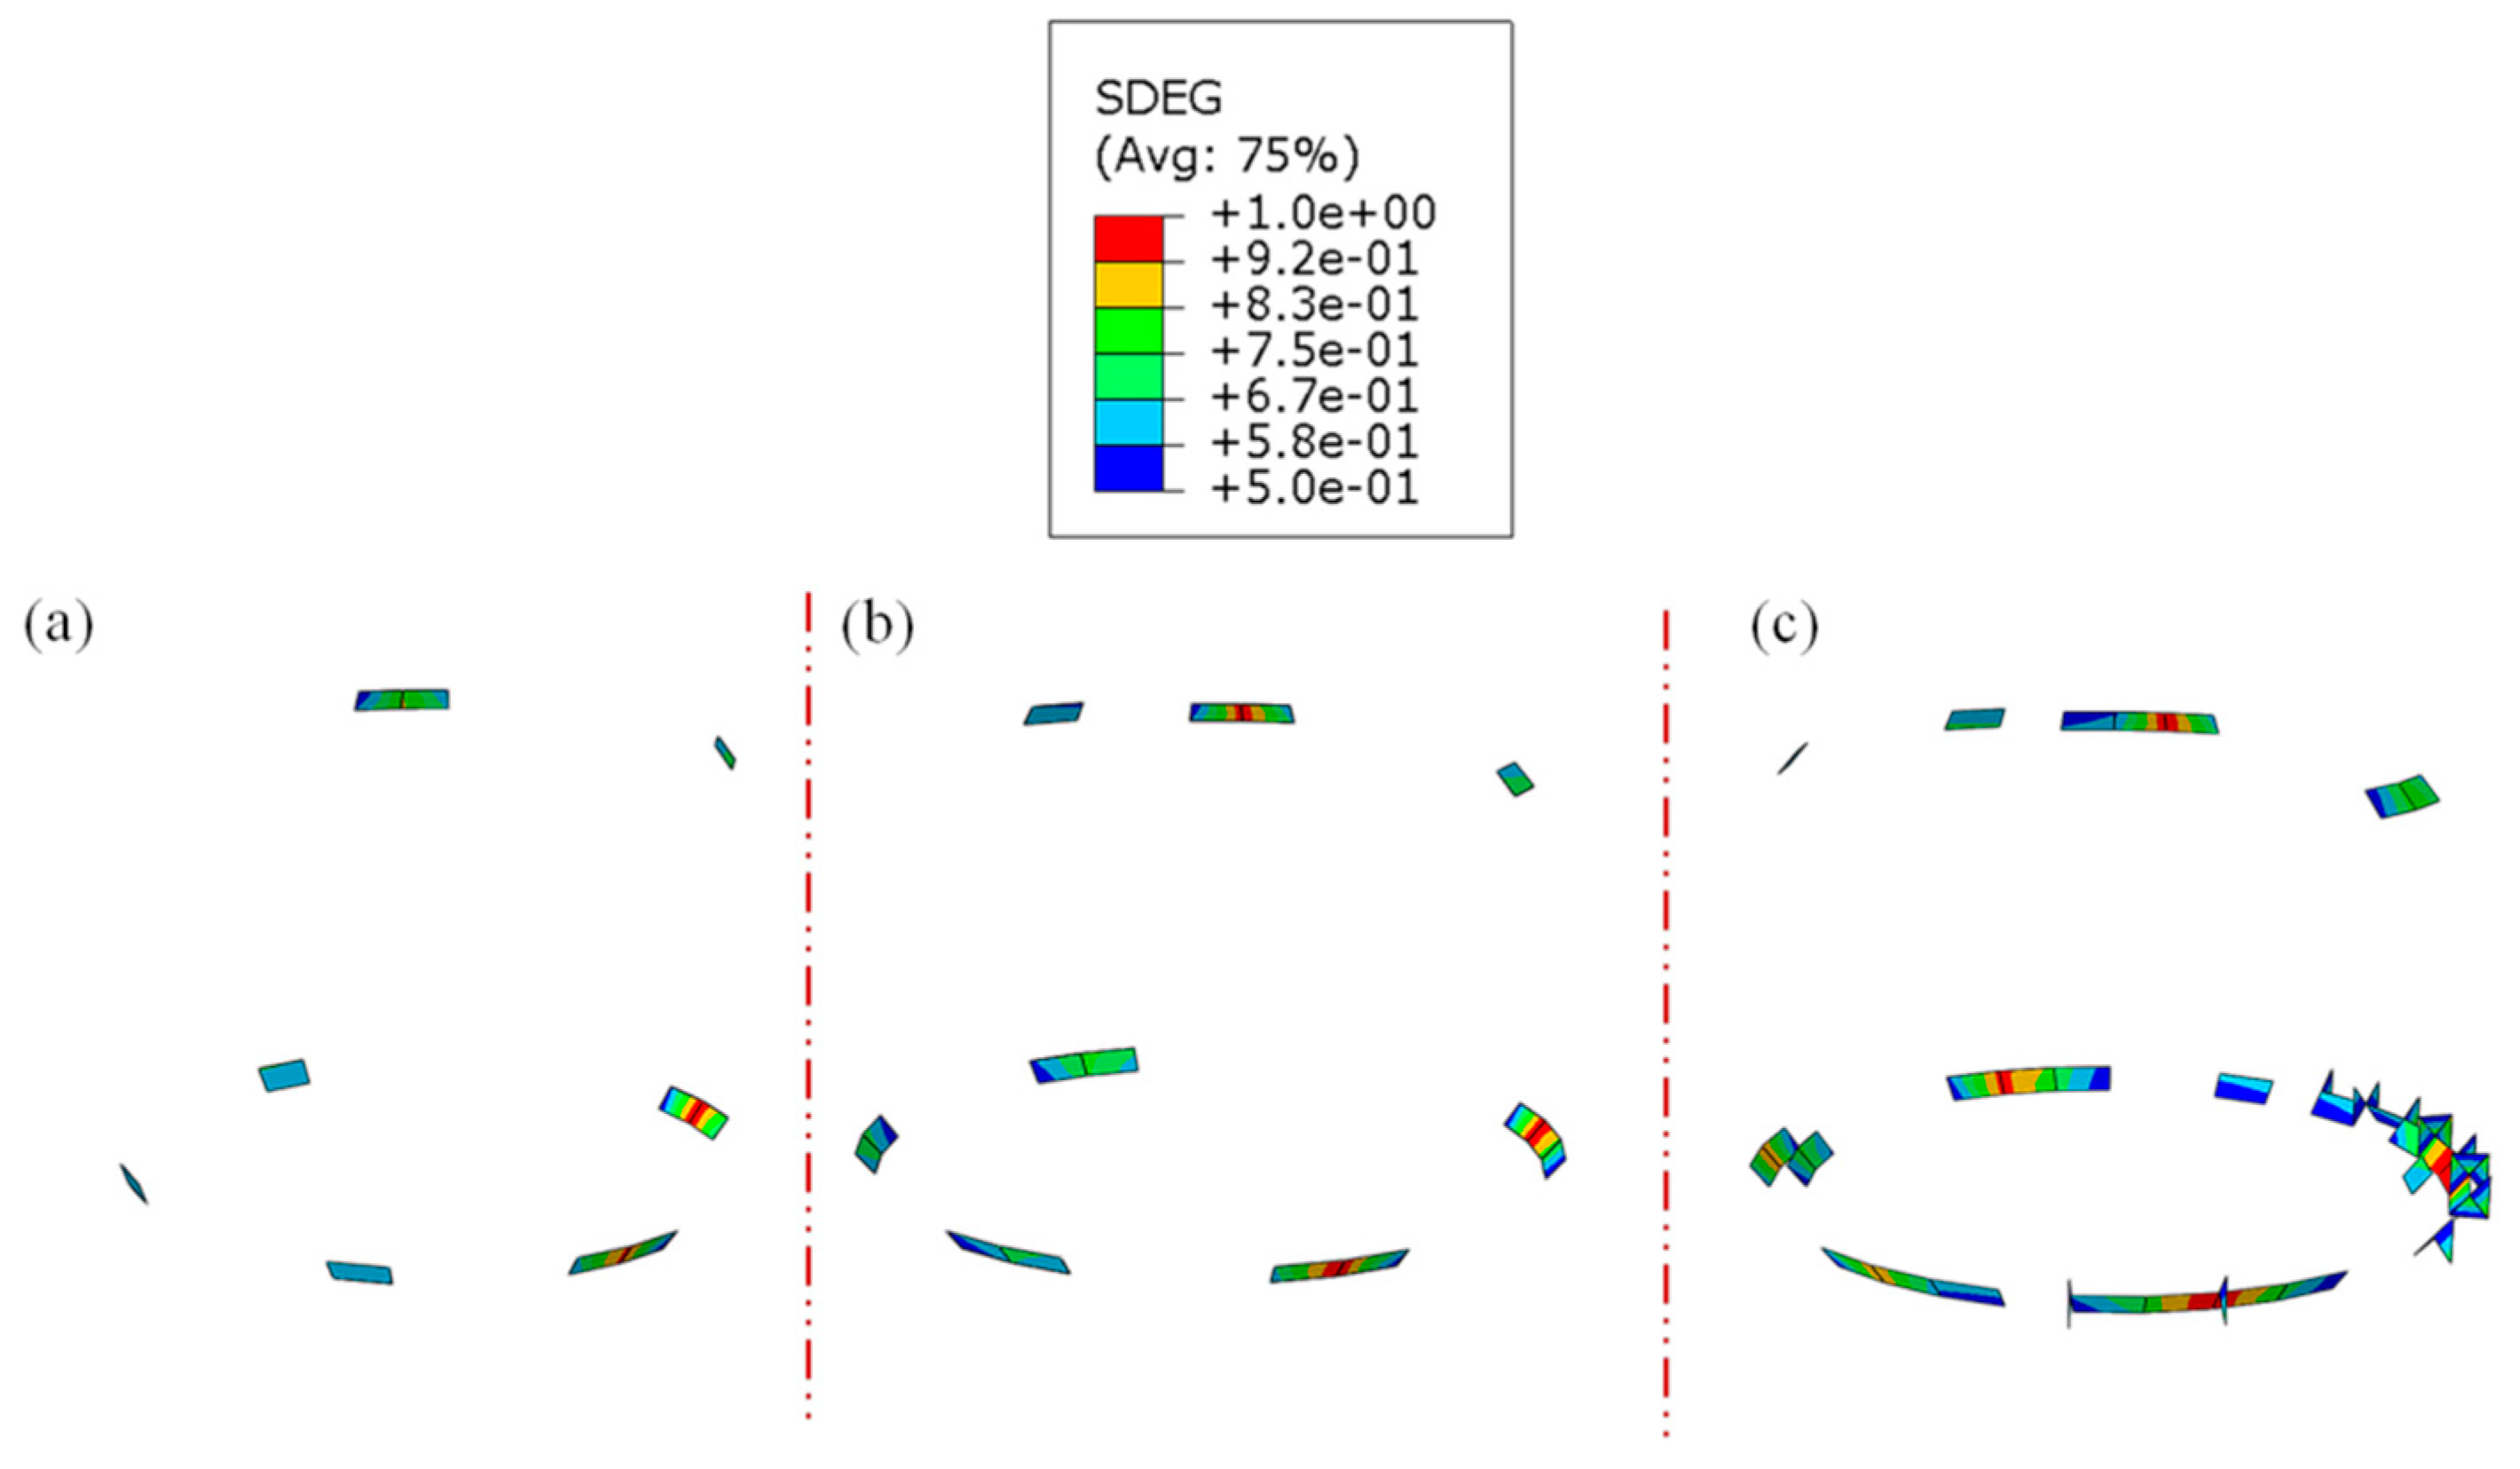
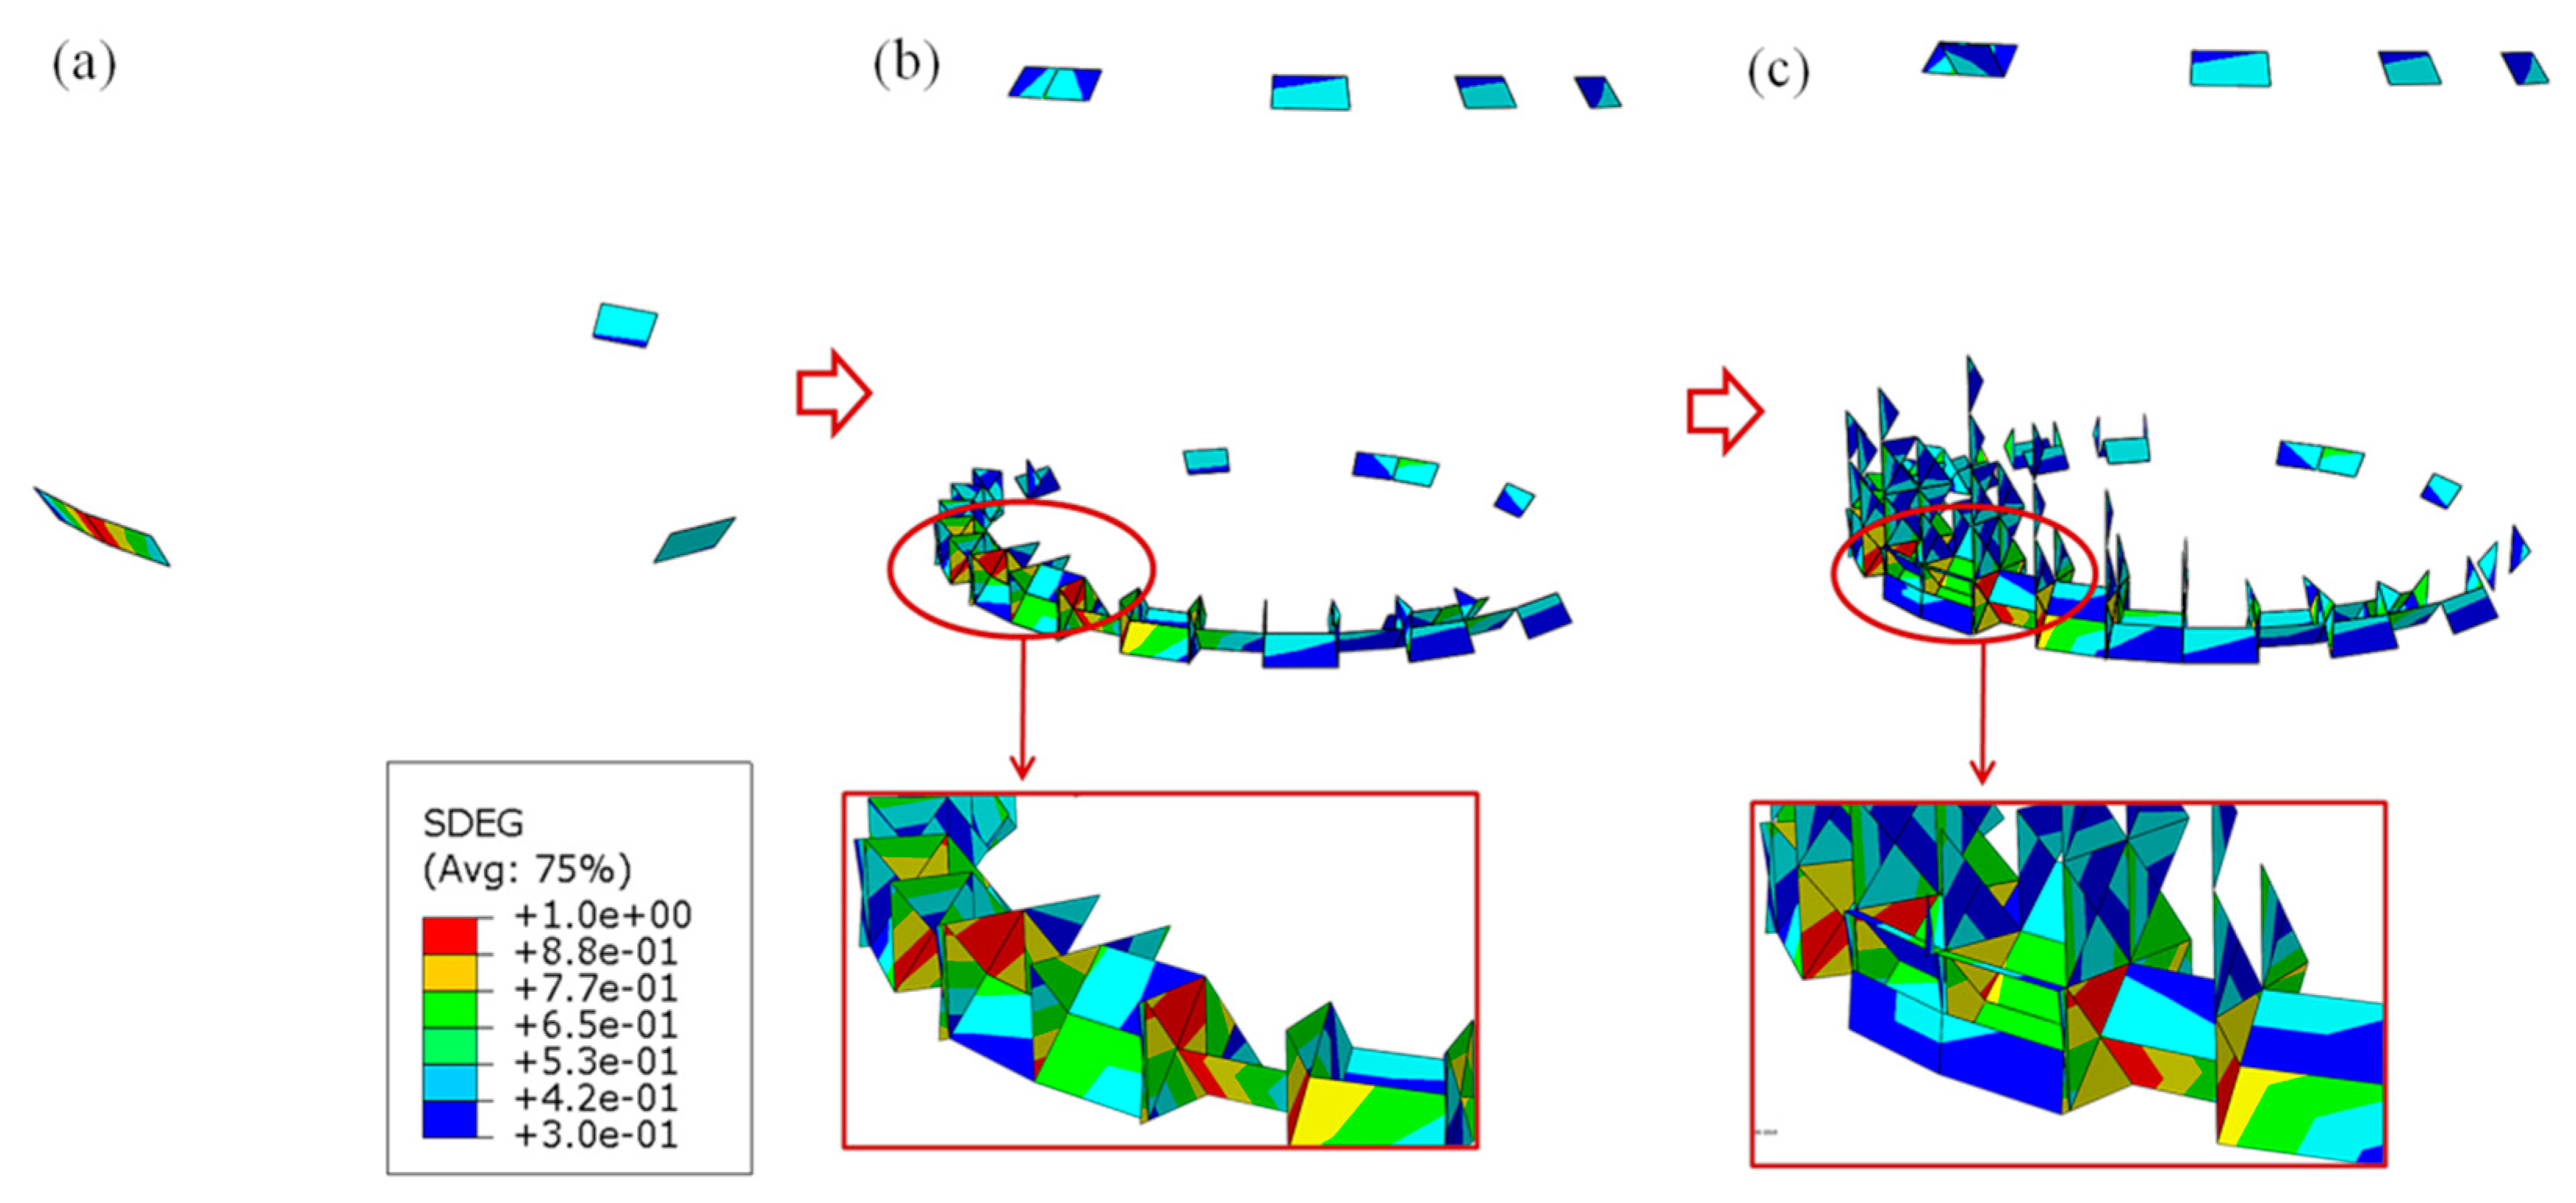
The damage in the SMATed specimens is quantified by the SDEG. Figure 15 depicted the damage evolution of the SMATed specimen associated with No. 2 random field under 9796 N. The illustrated elements are severely damaged (i.e., SDEG > 0.3) and the damaged elements initially occur in the CG layer in Figure 15b. With an increase in the cycle number, the elements in the NGL also get damaged gradually, as shown in Figure 15c, and the specimen fails ultimately, which indicates that the damage initiates from the subsurface and extends to the exterior surface. SMAT improves the strength of the exterior surface so that the damage initiation site can transition from the exterior surface to the subsurface of the specimen, which is the intrinsic mechanism for the enhanced fatigue resistance of the SMATed specimens. A similar phenomenon has also been found in axial fatigue tests of other types of surface-treated specimens [49,50]. The number and the distribution of severely damaged elements vary from different random fields. In addition, the higher stress generates more severe damage and also leads to much more damaged elements.
4. Conclusions and Outlooks
The heterogeneity of element sizes in a cylindrical solid may result in size effects in the fatigue process when the conventional global Monte Carlo method is employed. To alleviate the size effects, the local Monte Carlo method together with a 3D cohesive finite element method for solid metallic specimens is proposed to investigate the axial fatigue life and damage evolution. Our model has been verified by comparing the simulated fatigue life and end displacement with relevant experiments. After the surface mechanical attrition treatment, the damage of specimens initiates from the subsurface and extends to the exterior surface, leading to an increase in the fatigue resistance and the fatigue life. Therefore, this study shows that the proposed numerical approach can well predict the axial fatigue failure. Furthermore, it can also be employed to study the effects of other surface treatment on the fatigue life and thus provide guidelines for future experimental investigation.
Currently, fracture mechanics tools coupled with valid small crack growth equations can well compute the life of structural members with complex shapes under variable amplitude load spectra [2,51,52,53,54,55,56,57]. At present, it is not a trivial task for the numerical model based on the cohesive finite element method and Monte Carlo method to accurately compute the fatigue crack growth history of realistic 3D structures under complex load histories. Therefore, further development of the cohesive finite element method and Monte Carlo method is of great interest.
For a given surface roughness, the probability distribution of lead crack growth rate and hence fatigue life can be determined by that of the local fatigue threshold, and the role of the fatigue threshold is the effect of surface roughness [58,59]. Linking the probability distribution of the local fatigue threshold in Ref. [58,59] with that of the local fracture properties in our numerical model and to establish the relationship between the parameters in the above two probability distributions is stimulating to provide more insights into the fatigue life of metallic materials or structures.
Author Contributions
X.G. conceived this study and made a plan for the simulations; Q.S., T.Y., and C.Z. prepared the numerical framework; Q.S. performed the simulations; X.G., Q.S., T.Y., G.J.W., and X.F. wrote the paper together.
Funding
This work was supported by the National Natural Science Foundation of China (Project nos. 11372214 and 11432008) and the opening project of State Key Laboratory of Explosion Science and Technology (Beijing Institute of Technology) (Project no. KFJJ17-10M). G.W. thanks the support of NSF Mechanics of Materials and Structures Program under CMMI-1162431.
Acknowledgments
We wish to thank two anonymous reviewers for their helpful comments.
Conflicts of Interest
The authors declare no conflict of interest.
References
- Azadmanjiri, J.; Berndt, C.C.; Kapoor, A.; Wen, C. Development of surface nano-crystallization in alloys by surface mechanical attrition treatment (SMAT). Crit. Rev. Solid State Mater. Sci. 2015, 40, 164–181. [Google Scholar] [CrossRef]
- Jones, R. Fatigue crack growth and damage tolerance. Fatigue Fract. Eng. Mater. Struct. 2014, 37, 463–483. [Google Scholar] [CrossRef]
- Ritchie, R.O.; Yu, W.; Blom, A.F.; Holm, D.K. An analysis of crack tip shielding in aluminium alloy 2124: A comparison of large, small through-crack and surface fatigue cracks. Fatigue Fract. Eng. Mater. Struct. 1987, 10, 343–363. [Google Scholar] [CrossRef]
- Jones, R.; Singh Raman, R.K.; McMillan, A.J. Crack growth: Does microstructure play a role? Eng. Fract. Mech. 2018, 187, 190–210. [Google Scholar] [CrossRef]
- Lu, K.; Lu, J. Nanostructured surface layer on metallic materials induced by surface mechanical attrition treatment. Mater. Sci. Eng. A 2004, 375, 38–45. [Google Scholar] [CrossRef] [Green Version]
- Tao, N.R.; Zhang, H.W.; Lu, K.; Lu, J. Development of nanostructures in metallic materials with low stacking fault energies during surface mechanical attrition treatment (SMAT). Mater. Trans. 2003, 44, 1919–1925. [Google Scholar] [CrossRef]
- Zhang, H.W.; Hei, Z.K.; Liu, G.; Lu, J.; Lu, K. Formation of nanostructured surface layer on AISI 304 stainless steel by means of surface mechanical attrition treatment. Acta Mater. 2003, 51, 1871–1881. [Google Scholar] [CrossRef]
- Tao, N.R.; Wang, Z.B.; Tong, W.P.; Sui, M.L.; Lu, J.; Lu, K. An investigation of surface nanocrystallization mechanism in Fe induced by surface mechanical attrition treatment. Acta Mater. 2002, 50, 4603–4616. [Google Scholar] [CrossRef]
- Wu, X.; Tao, N.R.; Hong, Y.; Liu, G.; Xu, B.; Lu, J.; Lu, K. Strain-induced grain refinement of cobalt during surface mechanical attrition treatment. Acta Mater. 2005, 53, 681–691. [Google Scholar] [CrossRef] [Green Version]
- Dewo, P.; van de Houwen, E.B.; Suyitno; Marius, R.; Magetsari, R.; Verkerke, G.J. Redesign of Indonesian-made osteosynthesis plates to enhance their mechanical behavior. J. Mech. Behav. Biomed. 2015, 42, 274–281. [Google Scholar] [CrossRef] [PubMed]
- Sun, Y.; Bailey, R. Improvement in tribocorrosion behavior of 304 stainless steel by surface mechanical attrition treatment. Surf. Coat. Technol. 2014, 253, 284–291. [Google Scholar] [CrossRef]
- Balusamy, T.; Venkateswarlu, M.; Murthy, K.S.N.; Vijayanand, S.; Narayanan, T.S.N.S. Effect of surface mechanical attrition treatment (SMAT) on the surface and electrochemical characteristics of Pb-Sn alloy. Int. J. Electrochem. Sci. 2014, 9, 96–108. [Google Scholar]
- Kargar, F.; Laleh, M.; Shahrabi, T.; Rouhaghdam, A.S. Effect of treatment time on characterization and properties of nanocrystalline surface layer in copper induced by surface mechanical attrition treatment. Bull. Mater. Sci. 2014, 37, 1087–1094. [Google Scholar] [CrossRef]
- Jin, L.; Cui, W.F.; Song, X.; Liu, G.; Zhou, L. The formation mechanisms of surface nanocrystallites in β-type biomedical TiNbZrFe alloy by surface mechanical attrition treatment. Appl. Surf. Sci. 2015, 347, 553–560. [Google Scholar] [CrossRef]
- Huang, R.; Han, Y. Structure evolution and thermal stability of SMAT-derived nanograined layer on Ti–25Nb–3Mo–3Zr–2Sn alloy at elevated temperatures. J. Alloy. Compd. 2013, 554, 1–11. [Google Scholar] [CrossRef]
- Yin, Z.; Yang, X.; Ma, X.; Moering, J.; Yang, J.; Gong, Y.L. Strength and ductility of gradient structured copper obtained by surface mechanical attrition treatment. Mater. Des. 2016, 105, 89–95. [Google Scholar] [CrossRef]
- Chen, A.Y.; Liu, J.B.; Wang, H.T.; Lu, J.; Wang, Y.M. Gradient twinned 304 stainless steels for high strength and high ductility. Mater. Sci. Eng. A 2016, 667, 179–188. [Google Scholar] [CrossRef] [Green Version]
- Kumar, S.A.; Raman, S.G.S.; Narayanan, T.S.N.S. Influence of surface mechanical attrition treatment duration on fatigue lives of Ti–6Al–4V. Trans. Indian Inst. Met. 2014, 67, 137–141. [Google Scholar] [CrossRef]
- Brinckmann, S.; Siegmund, T. A cohesive zone model based on the micromechanics of dislocations. Model. Simul. Mater. Sci. Eng. 2008, 16, 065003. [Google Scholar] [CrossRef]
- Gong, B.M.; Paggi, M.; Carpinteri, A. A cohesive crack model coupled with damage for interface fatigue problems. Int. J. Fract. 2012, 173, 91–104. [Google Scholar] [CrossRef]
- Ghovanlou, M.K.; Jahed, H.; Khajepour, A. Cohesive zone modeling of fatigue crack growth in brazed joints. Eng. Fract. Mech. 2014, 120, 43–59. [Google Scholar] [CrossRef] [Green Version]
- Puigvert, F.; Crocombe, A.D.; Gil, L. Fatigue and creep analyses of adhesively bonded anchorages for CFRP tendons. Int. J. Adhes. Adhes. 2014, 54, 143–154. [Google Scholar] [CrossRef] [Green Version]
- Kim, K.; Yoon, M.J. Fretting fatigue simulation for aluminium alloy using cohesive zone law approach. Int. J. Mech. Sci. 2014, 85, 30–37. [Google Scholar] [CrossRef]
- García-Collado, A.; Vasco-Olmo, J.M.; Díaz, F.A. Numerical analysis of plasticity induced crack closure based on an irreversible cohesive zone mode. Theor. Appl. Fract. Mech. 2017, 89, 52–62. [Google Scholar] [CrossRef]
- Naval Publications and Form Center (NPFC). Military Specification Airplane Damage Tolerance Requirements; Military and Government Specs & Standards, MIL-A-83444 (USAF); NPFC: Englewood, CO, USA, 1974. [Google Scholar]
- Berens, A.P.; Hovey, P.W.; Skinn, D.A. Risk Analysis for Aging Aircraft Fleets—Volume 1: Analysis; WL-TR-91-3066; Flight Dynamics Directorate, Wright Laboratory, Air Force Systems Command, Wright-Patterson Air Force Base: Dayton, OH, USA, 1991. [Google Scholar]
- Rahman, S.; Rao, B.N. An element-free Galerkin method for probabilistic mechanics and reliability. Int. J. Solids Struct. 2001, 38, 9313–9330. [Google Scholar] [CrossRef] [Green Version]
- Bouhamida, B.; Sereir, Z.; Chateauneuf, A. Uncertainties of stress intensification near broken fibers of unidirectional composite with random fiber spacing. Theor. Appl. Fract. Mech. 2013, 65, 1–7. [Google Scholar] [CrossRef]
- Campanile, A.; Piscopo, V.; Scamardella, A. Statistical properties of bulk carrier longitudinal strength. Mar. Struct. 2014, 39, 438–462. [Google Scholar] [CrossRef]
- Hartig, J.U.; Häussler-Combe, U. Numerical stochastic analysis of RC tension bar cracking due to restrained thermal loading. Theor. Appl. Fract. Mech. 2014, 74, 39–47. [Google Scholar] [CrossRef]
- Su, X.T.; Yang, Z.J.; Liu, G.H. Monte Carlo simulation of complex cohesive fracture in random heterogeneous quasi-brittle materials: A 3D study. Int. J. Solids Struct. 2010, 47, 2336–2345. [Google Scholar] [CrossRef]
- Yang, Z.J.; Su, X.T.; Chen, J.F.; Liu, G.H. Monte Carlo simulation of complex cohesive fracture in random heterogeneous quasi-brittle materials. Int. J. Solids Struct. 2009, 46, 3222–3234. [Google Scholar] [CrossRef] [Green Version]
- Cetin, A.; Harkegard, G.; Naess, A. The fatigue limit: An analytical solution to a Monte Carlo problem. Int. J. Fatigue 2013, 55, 194–201. [Google Scholar] [CrossRef]
- Pashah, S.; Arif, A.F.M. Fatigue life prediction of adhesive joint in heat sink using Monte Carlo method. Int. J. Adhes. Adhes. 2014, 50, 164–175. [Google Scholar] [CrossRef]
- Guo, X.; Yang, T.; Weng, G.J. 3D cohesive modeling of nanostructured metallic alloys with a Weibull random field in torsional fatigue. Int. J. Mech. Sci. 2015, 101, 227–240. [Google Scholar] [CrossRef]
- Sun, Q.Q.; Guo, X.; Weng, G.J.; Chen, G.; Yang, T. Axial-torsional high-cycle fatigue of both coarse-grained and nanostructured metals: A 3D cohesive finite element model with uncertainty characteristics. Eng. Fract. Mech. 2018, 195, 30–43. [Google Scholar] [CrossRef]
- Roesler, J.; Paulino, G.H.; Park, K.; Gaedicke, C. Concrete fracture prediction using bilinear softening. Cem. Concr. Compos. 2007, 29, 300–312. [Google Scholar] [CrossRef]
- Guo, X.; Leung, A.Y.T.; Chen, A.Y.; Ruan, H.H.; Lu, J. Investigation of non-local cracking in layered stainless steel with nanostructured interface. Scr. Mater. 2010, 63, 403–406. [Google Scholar] [CrossRef]
- Agnihotri, P.K.; Kar, K.K.; Basu, S. Cohesive zone model of carbon nanotube-coated carbon fiber/polyester composites. Model. Simul. Mater. Sci. Eng. 2012, 20, 035014. [Google Scholar] [CrossRef]
- Carpinteri, A.; Gong, B.M.; Corrado, M. Hardening cohesive/overlapping zone model for metallic materials: The size-scale independent constitutive law. Eng. Fract. Mech. 2012, 82, 29–45. [Google Scholar] [CrossRef]
- Guo, X.; Zhang, W.J.; Zhu, L.L.; Lu, J. Mesh dependence of transverse cracking in laminated metals with nanograined interface layers. Eng. Fract. Mech. 2013, 105, 211–220. [Google Scholar] [CrossRef]
- May, M.; Holger, V.; Hiermaier, S. Predictive modeling of damage and failure in adhesively bonded metallic joints using cohesive interface elements. Int. J. Adhes. Adhes. 2014, 49, 7–17. [Google Scholar] [CrossRef]
- Shao, Y.; Zhao, H.P.; Feng, X.Q.; Gao, H.J. Discontinuous crack-bridging model for fracture toughness analysis of nacre. J. Mech. Phys. Solids 2012, 60, 1400–1419. [Google Scholar] [CrossRef]
- ABAQUS User’s Manual, version 6.10; Dassault: Providence, RI, USA, 2015.
- Oshida, Y.; Deguchi, A. Martensite formation and the related toughness in 304 stainless steel during low temperature fatigue. Fatigue Fract. Eng. Mater. Struct. 1987, 10, 363–372. [Google Scholar] [CrossRef]
- Frontan, F.; Zhang, Y.M.; Dao, M.; Lu, J.; Galvez, F.; Jerusalem, A. Ballistic performance of nanocrystalline and nanotwinned ultrafine crystal steel. Acta Mater. 2012, 60, 1353–1367. [Google Scholar] [CrossRef] [Green Version]
- Chen, X.H.; Lu, J.; Lu, L.; Lu, K. Tensile properties of a nanocrystalline 316L austenitic stainless steel. Scr. Mater. 2005, 52, 1039–1044. [Google Scholar] [CrossRef]
- Cias, A.; Wronski, A.S. Mechanical properties distributions of PM manganese steels analysed by Gaussian and Weibull statistics. Powder Metall. 2010, 53, 328–335. [Google Scholar] [CrossRef]
- Yang, L.; Tao, N.R.; Lu, K.; Lu, L. Enhanced fatigue resistance of Cu with a gradient nanograined surface layer. Scr. Mater. 2013, 68, 801–804. [Google Scholar] [CrossRef]
- Wang, Q.; Sun, Q.; Xiao, L.; Sun, J. Effect of surface nanocrystallization on fatigue behavior of pure titanium. J. Mater. Eng. Perform. 2015, 25, 1–9. [Google Scholar] [CrossRef]
- Jones, R.; Huang, P.; Peng, D. Practical computational fracture mechanics for aircraft structural integrity. In Aircraft Sustainment and Repair; Jones, R., Matthews, N., Baker, A.A., Champagne, V., Jr., Eds.; Butterworth-Heinemann Press: Oxford, UK, 2018; Chapter 4; pp. 67–128. ISBN 978-0081005408. [Google Scholar]
- Miedlar, P.C.; Berens, A.P.; Gunderson, A.; Gallagher, J.P. Analysis and Support Initiative for Structural Technology (ASIST); AFRL-VA-WP-TR-2003-3002; Defense Technical Information Center: Fort Belvoir, VA, USA, 2003. [Google Scholar]
- Tiffany, C.F.; Gallagher, J.P.; Babish, I.V.C.A. Threats to Aircraft Structural Safety, Including a Compendium of Selected Structural Accidents/Incidents; ASC-TR-2010-5002; Aeronautical Systems Center, Engineering Directorate, Wright-Patterson Air Force Base: Dayton, OH, USA, 2010. [Google Scholar]
- Jones, R.; Peng, D.; Huang, P.; Singh, R.R. Crack growth from naturally occurring material discontinuities in operational aircraft. Procedia Eng. 2015, 101, 227–234. [Google Scholar] [CrossRef]
- Jones, R.; Huang, P.; Peng, D. Crack growth from naturally occurring material discontinuities under constant amplitude and operational loads. Int. J. Fatigue 2016, 91, 434–444. [Google Scholar] [CrossRef]
- Lo, M.; Jones, R.; Bowler, A.; Dorman, M.; Edwards, D. Crack growth at fastener holes containing intergranular cracking. Fatigue Fract. Eng. Mater. Struct. 2017, 40, 1664–1675. [Google Scholar] [CrossRef]
- Jones, R.; Peng, D.; McMillan, A. Crack growth from naturally occurring material discontinuities. In Aircraft Sustainment and Repair; Jones, R., Matthews, N., Baker, A.A., Champagne, V., Jr., Eds.; Butterworth-Heinemann Press: Oxford, UK, 2018; Chapter 5; pp. 129–190. ISBN 978-0081005408. [Google Scholar]
- Molent, L.; Barter, S.A.; Wanhill, R.J.H. The lead crack fatigue lifing framework. Int. J. Fatigue 2011, 33, 323–331. [Google Scholar] [CrossRef]
- Molent, L.; Jones, R. The influence of cyclic stress intensity threshold on fatigue life scatter. Int. J. Fatigue 2016, 82, 748–756. [Google Scholar] [CrossRef]
Figure 1.
Geometry of the axial fatigue specimen (in mm).

Figure 2.
Schematics of the traction–separation relations in the (a) normal direction and (b) shear direction.
Figure 2.
Schematics of the traction–separation relations in the (a) normal direction and (b) shear direction.

Figure 3.
Cohesive elements insertion approach: (a) experimental observation of fatigue failure, (b) cohesive elements insertion.
Figure 3.
Cohesive elements insertion approach: (a) experimental observation of fatigue failure, (b) cohesive elements insertion.

Figure 4.
Cohesive finite element (CFE) model for the coarse-grained (CG) specimen.

Figure 5.
CFE model for the SMATed specimen with a nanograined layer (NGL) thickness of 20 µm.

Figure 6.
Cohesive strength effects on the fatigue life.

Figure 7.
Weibull random fields: (a) No. 1, (b) No. 2, (c) No. 3, (d) No. 4, and (e) No. 5.

Figure 8.
End displacement of the CG specimen associated with No. 2 random field.

Figure 9.
Fatigue damage progress of the CG specimen under 8936 N.

Figure 10.
Fatigue damage patterns under 8936 N, (a) No. 1, (b) No. 2, (c) No. 3, and (d) No. 4.

Figure 11.
End displacement of the CG specimen under three axial loads.

Figure 12.
Fatigue damage associated with No. 2 random field and under axial load (a) 8433 N, (b) 8685 N, and (c) 8936 N.
Figure 12.
Fatigue damage associated with No. 2 random field and under axial load (a) 8433 N, (b) 8685 N, and (c) 8936 N.

Figure 13.
Weibull random fields of the NGL, (a) No. 1, (b) No. 2, (c) No. 3, (d) No. 4, and (e) No. 5.
Figure 13.
Weibull random fields of the NGL, (a) No. 1, (b) No. 2, (c) No. 3, (d) No. 4, and (e) No. 5.

Figure 14.
Simulated fatigue life of the SMATed specimen.

Figure 15.
Fatigue damage progress of the SMATed specimen under 9796 N.


Table 1.
The number of the different elements for the coarse-grained (CG) and surface mechanical attrition treatment (SMAT)-ed 304 SS.
Table 1.
The number of the different elements for the coarse-grained (CG) and surface mechanical attrition treatment (SMAT)-ed 304 SS.
| 304 SS | C3D6 | COH3D6 | COH3D8 | Total Elements | |
|---|---|---|---|---|---|
| CG | MCSed | - | 2800 | 3780 | 6580 |
| Total | 12,950 | 12,915 | 18,935 | 44,800 | |
| SMATed | MCSed | - | 5600 | 7910 | 13,510 |
| Total | 15,750 | 15,715 | 23,065 | 54,530 | |
Table 2.
Material parameters for the CG and SMATed 304 SS.
| 304 SS | (MPa) | (MPa) | (MPa) | (MPa) | (J m−2) |
|---|---|---|---|---|---|
| CG | 295 | 2949 | 2949 | 2949 | 25,592 |
| NGL | 1278 | 5109 | 5109 | 5109 | 5896 |
© 2018 by the authors. Licensee MDPI, Basel, Switzerland. This article is an open access article distributed under the terms and conditions of the Creative Commons Attribution (CC BY) license (http://creativecommons.org/licenses/by/4.0/).
Share and Cite
MDPI and ACS Style
Guo, X.; Sun, Q.; Yang, T.; Weng, G.J.; Zhang, C.; Feng, X. Local Monte Carlo Method for Fatigue Analysis of Coarse-Grained Metals with a Nanograined Surface Layer. Metals 2018, 8, 479. https://doi.org/10.3390/met8070479
AMA Style
Guo X, Sun Q, Yang T, Weng GJ, Zhang C, Feng X. Local Monte Carlo Method for Fatigue Analysis of Coarse-Grained Metals with a Nanograined Surface Layer. Metals. 2018; 8(7):479. https://doi.org/10.3390/met8070479
Chicago/Turabian StyleGuo, Xiang, Qiuqiu Sun, Tao Yang, George J. Weng, Cunbo Zhang, and Xiqiao Feng. 2018. "Local Monte Carlo Method for Fatigue Analysis of Coarse-Grained Metals with a Nanograined Surface Layer" Metals 8, no. 7: 479. https://doi.org/10.3390/met8070479
Note that from the first issue of 2016, this journal uses article numbers instead of page numbers. See further details here.