Prediction of Resistance Spot Weld Quality of 780 MPa Grade Steel Using Adaptive Resonance Theory Artificial Neural Networks


Abstract
:1. Introduction
2. Experimental Procedures
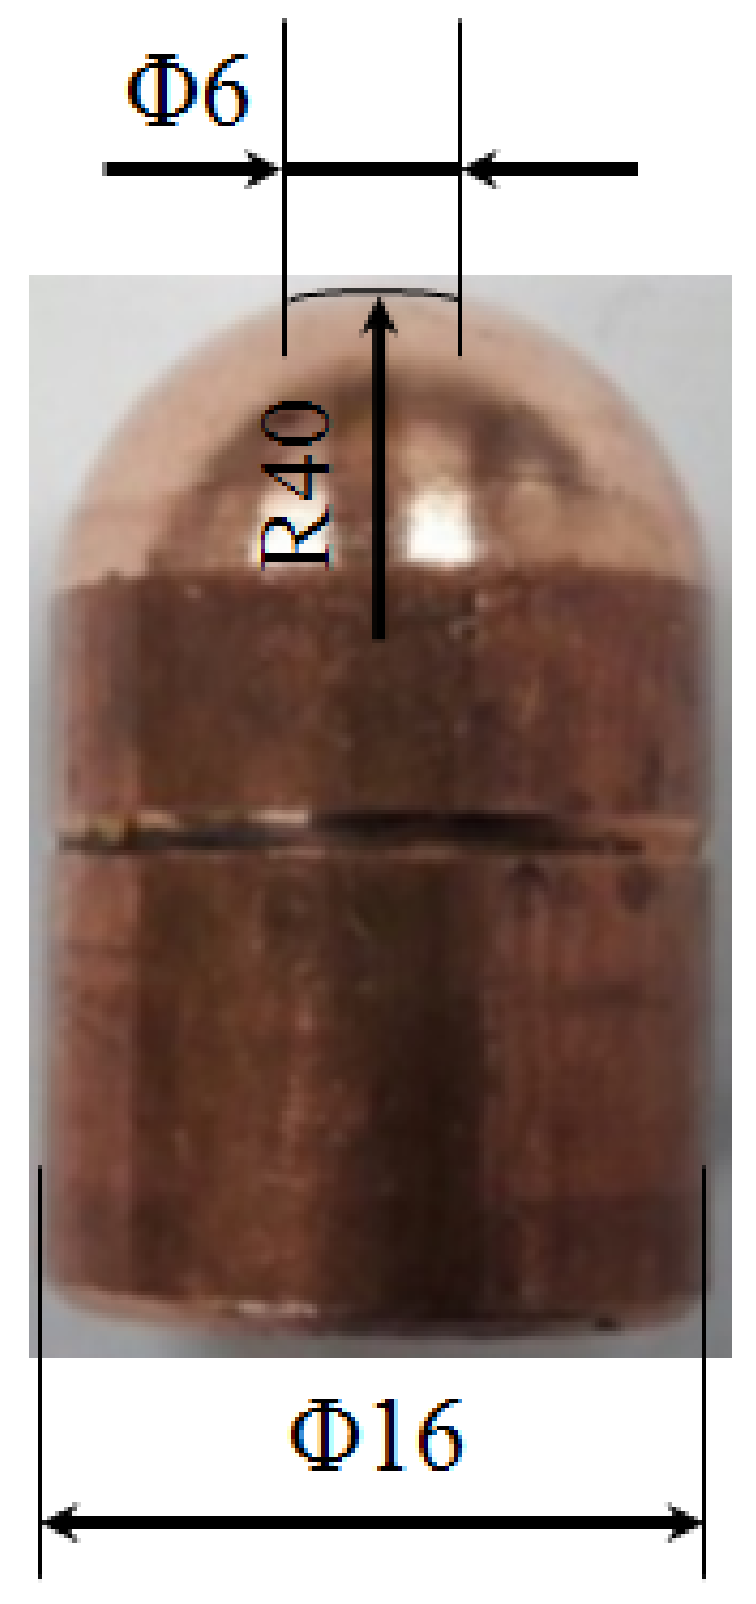
2.1. Base Materials, Welding Equipment, and Conditions
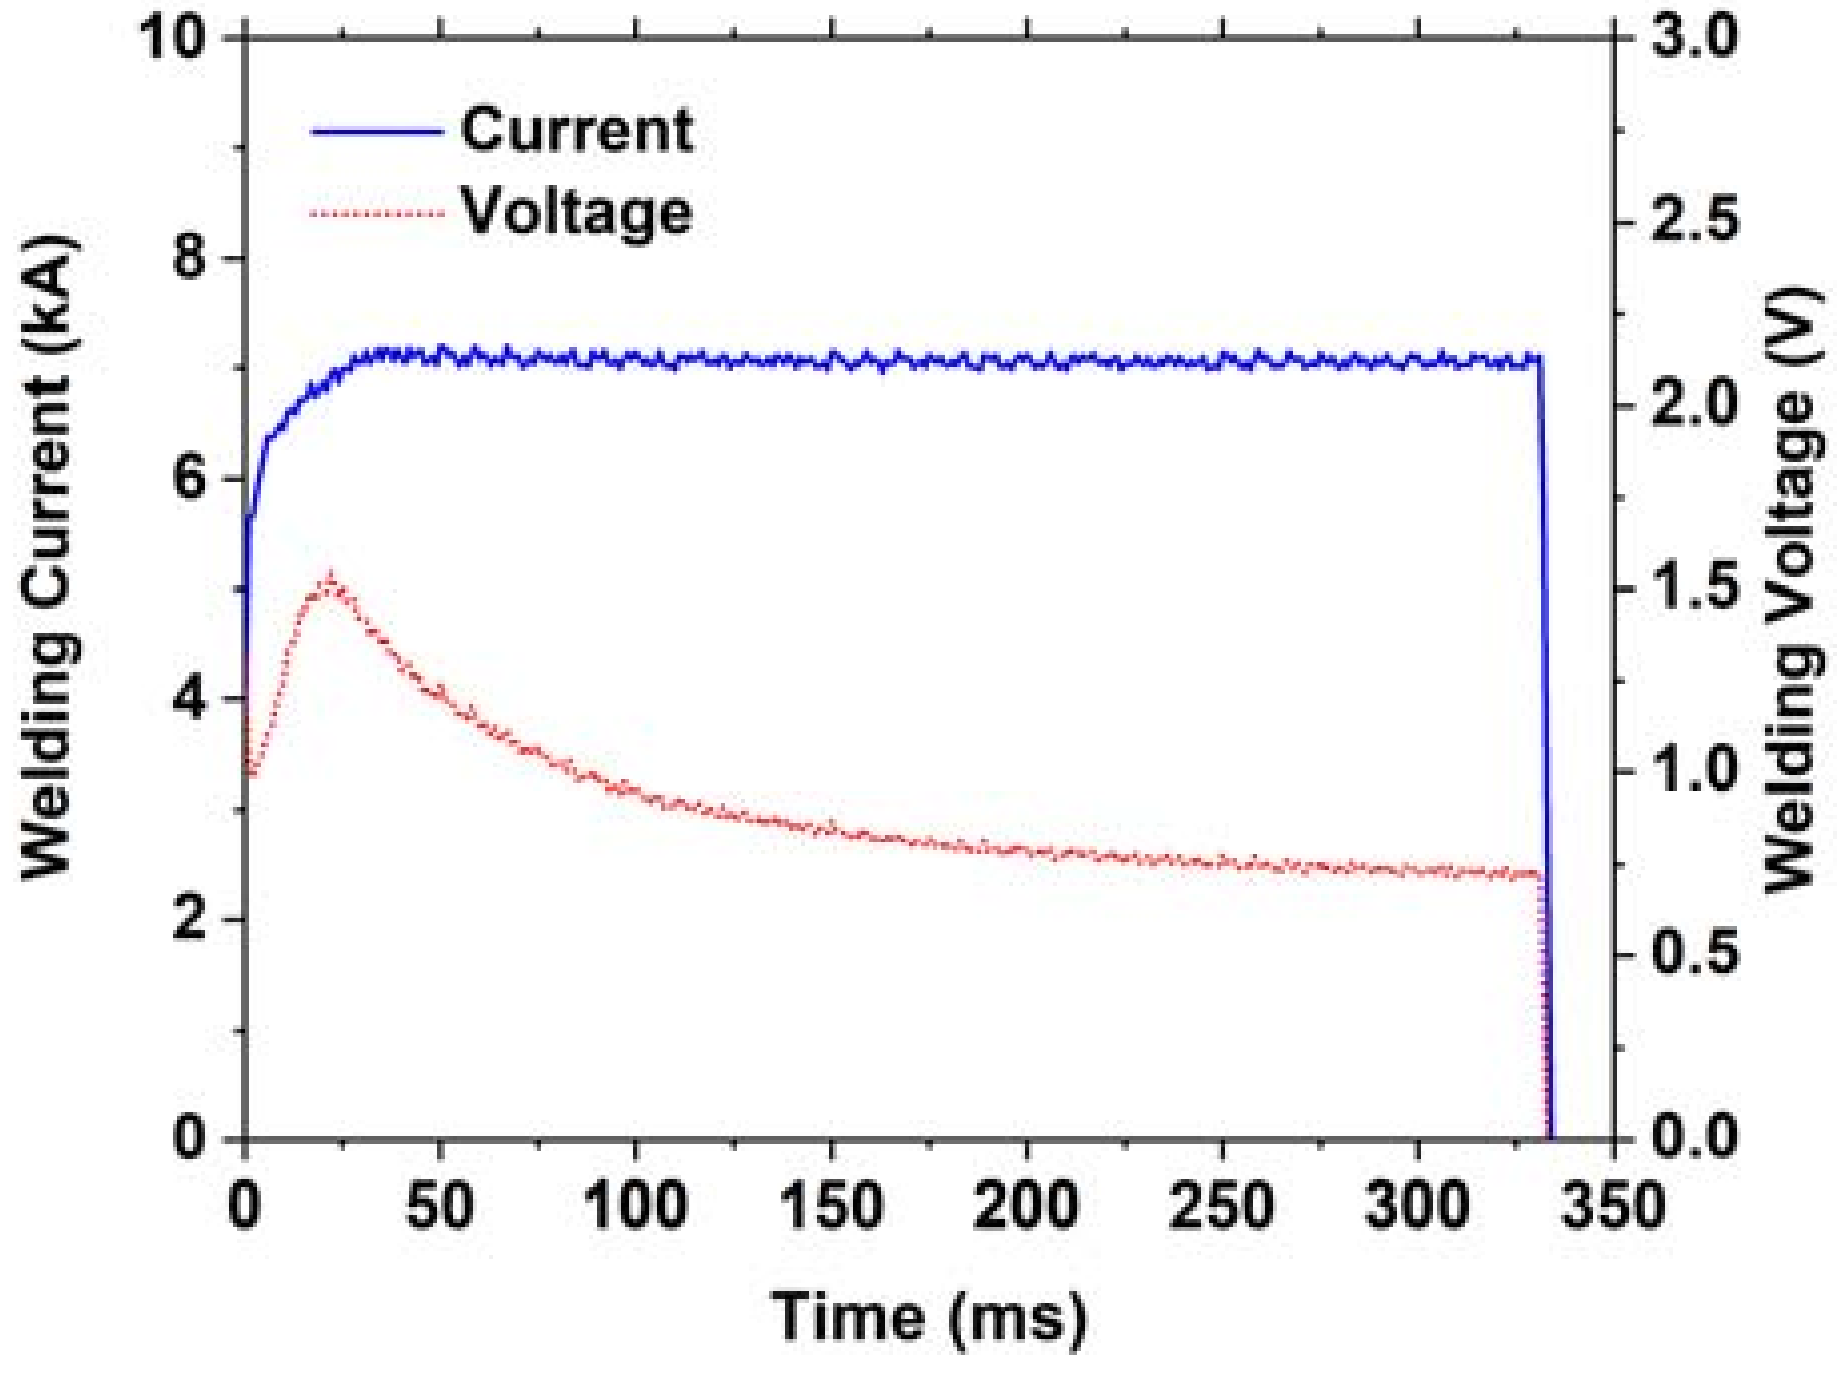
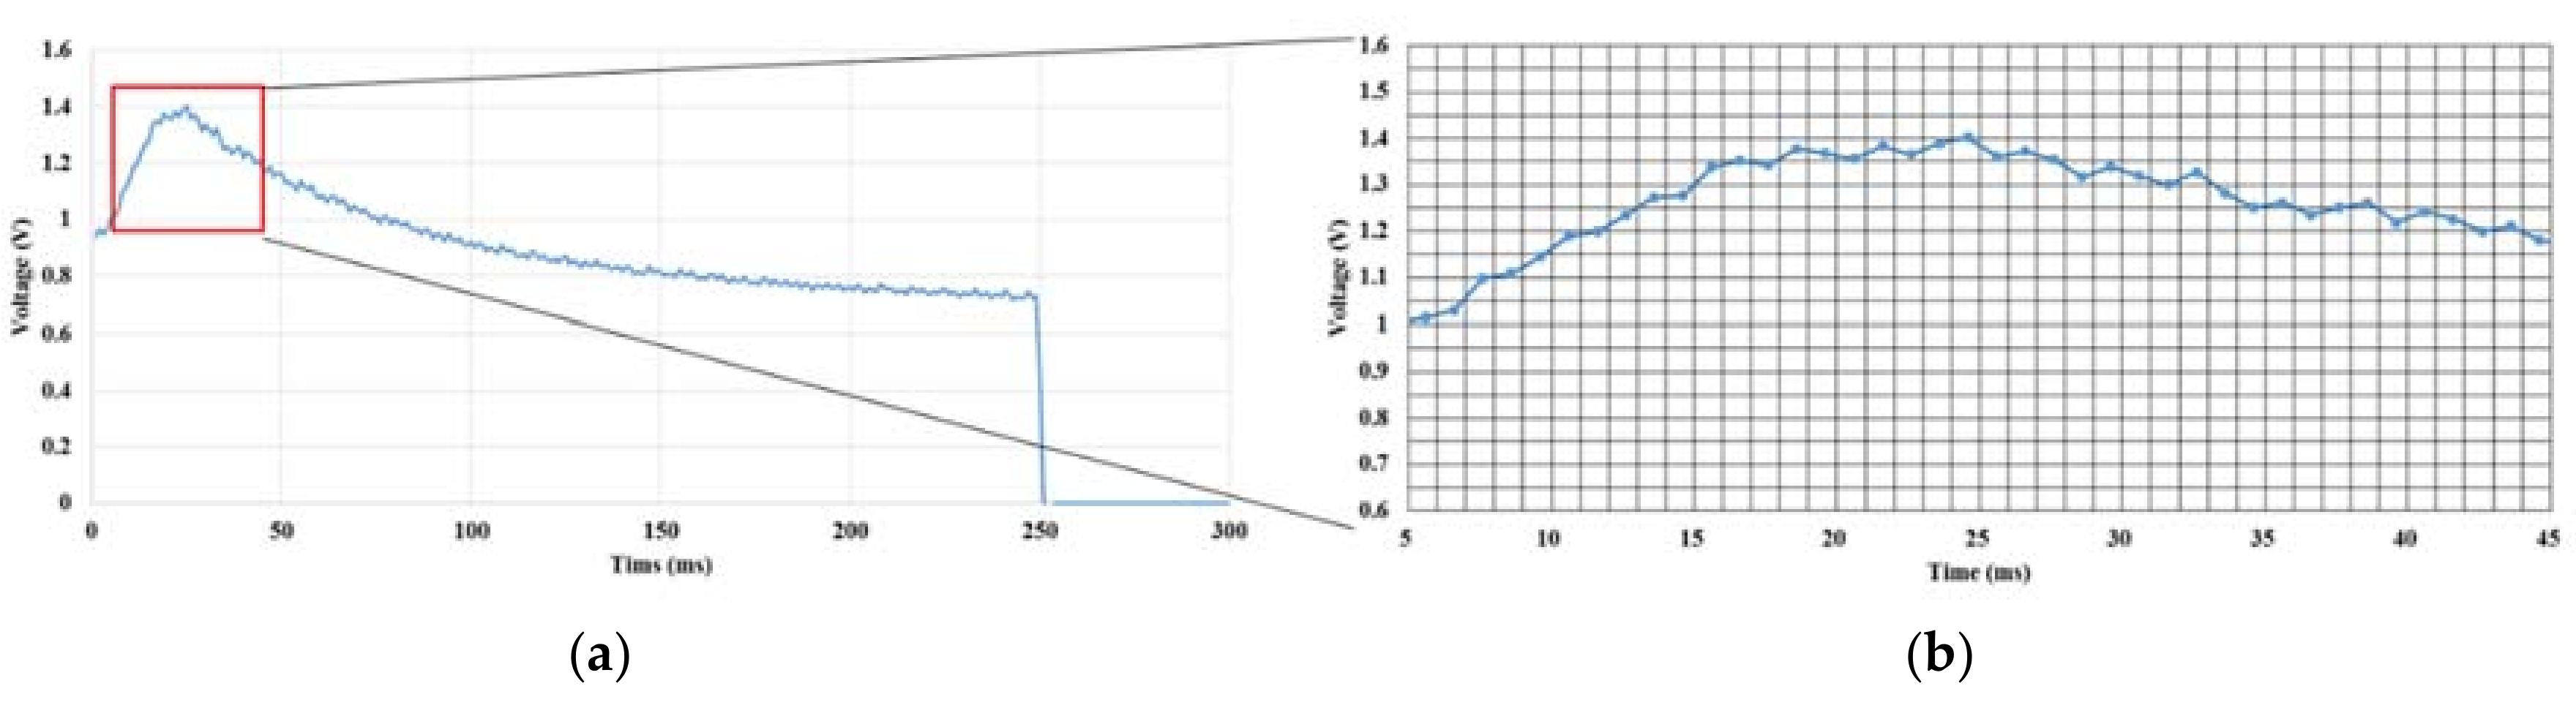
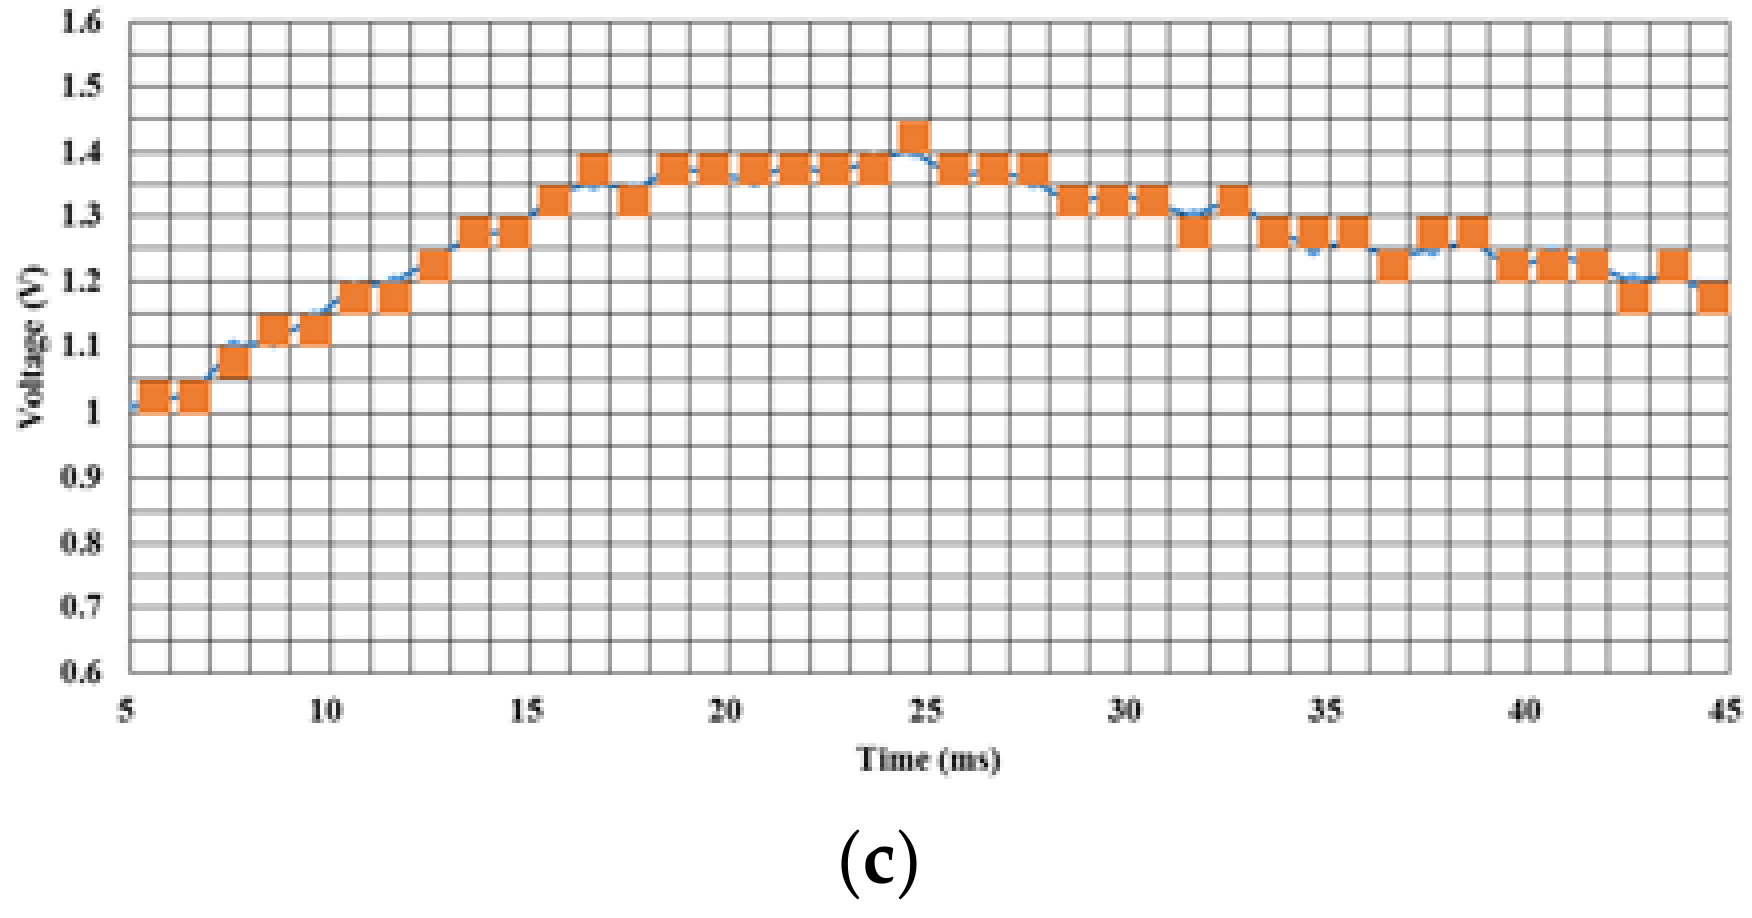
2.2. Measurement of the Welding Voltage and Current Signal
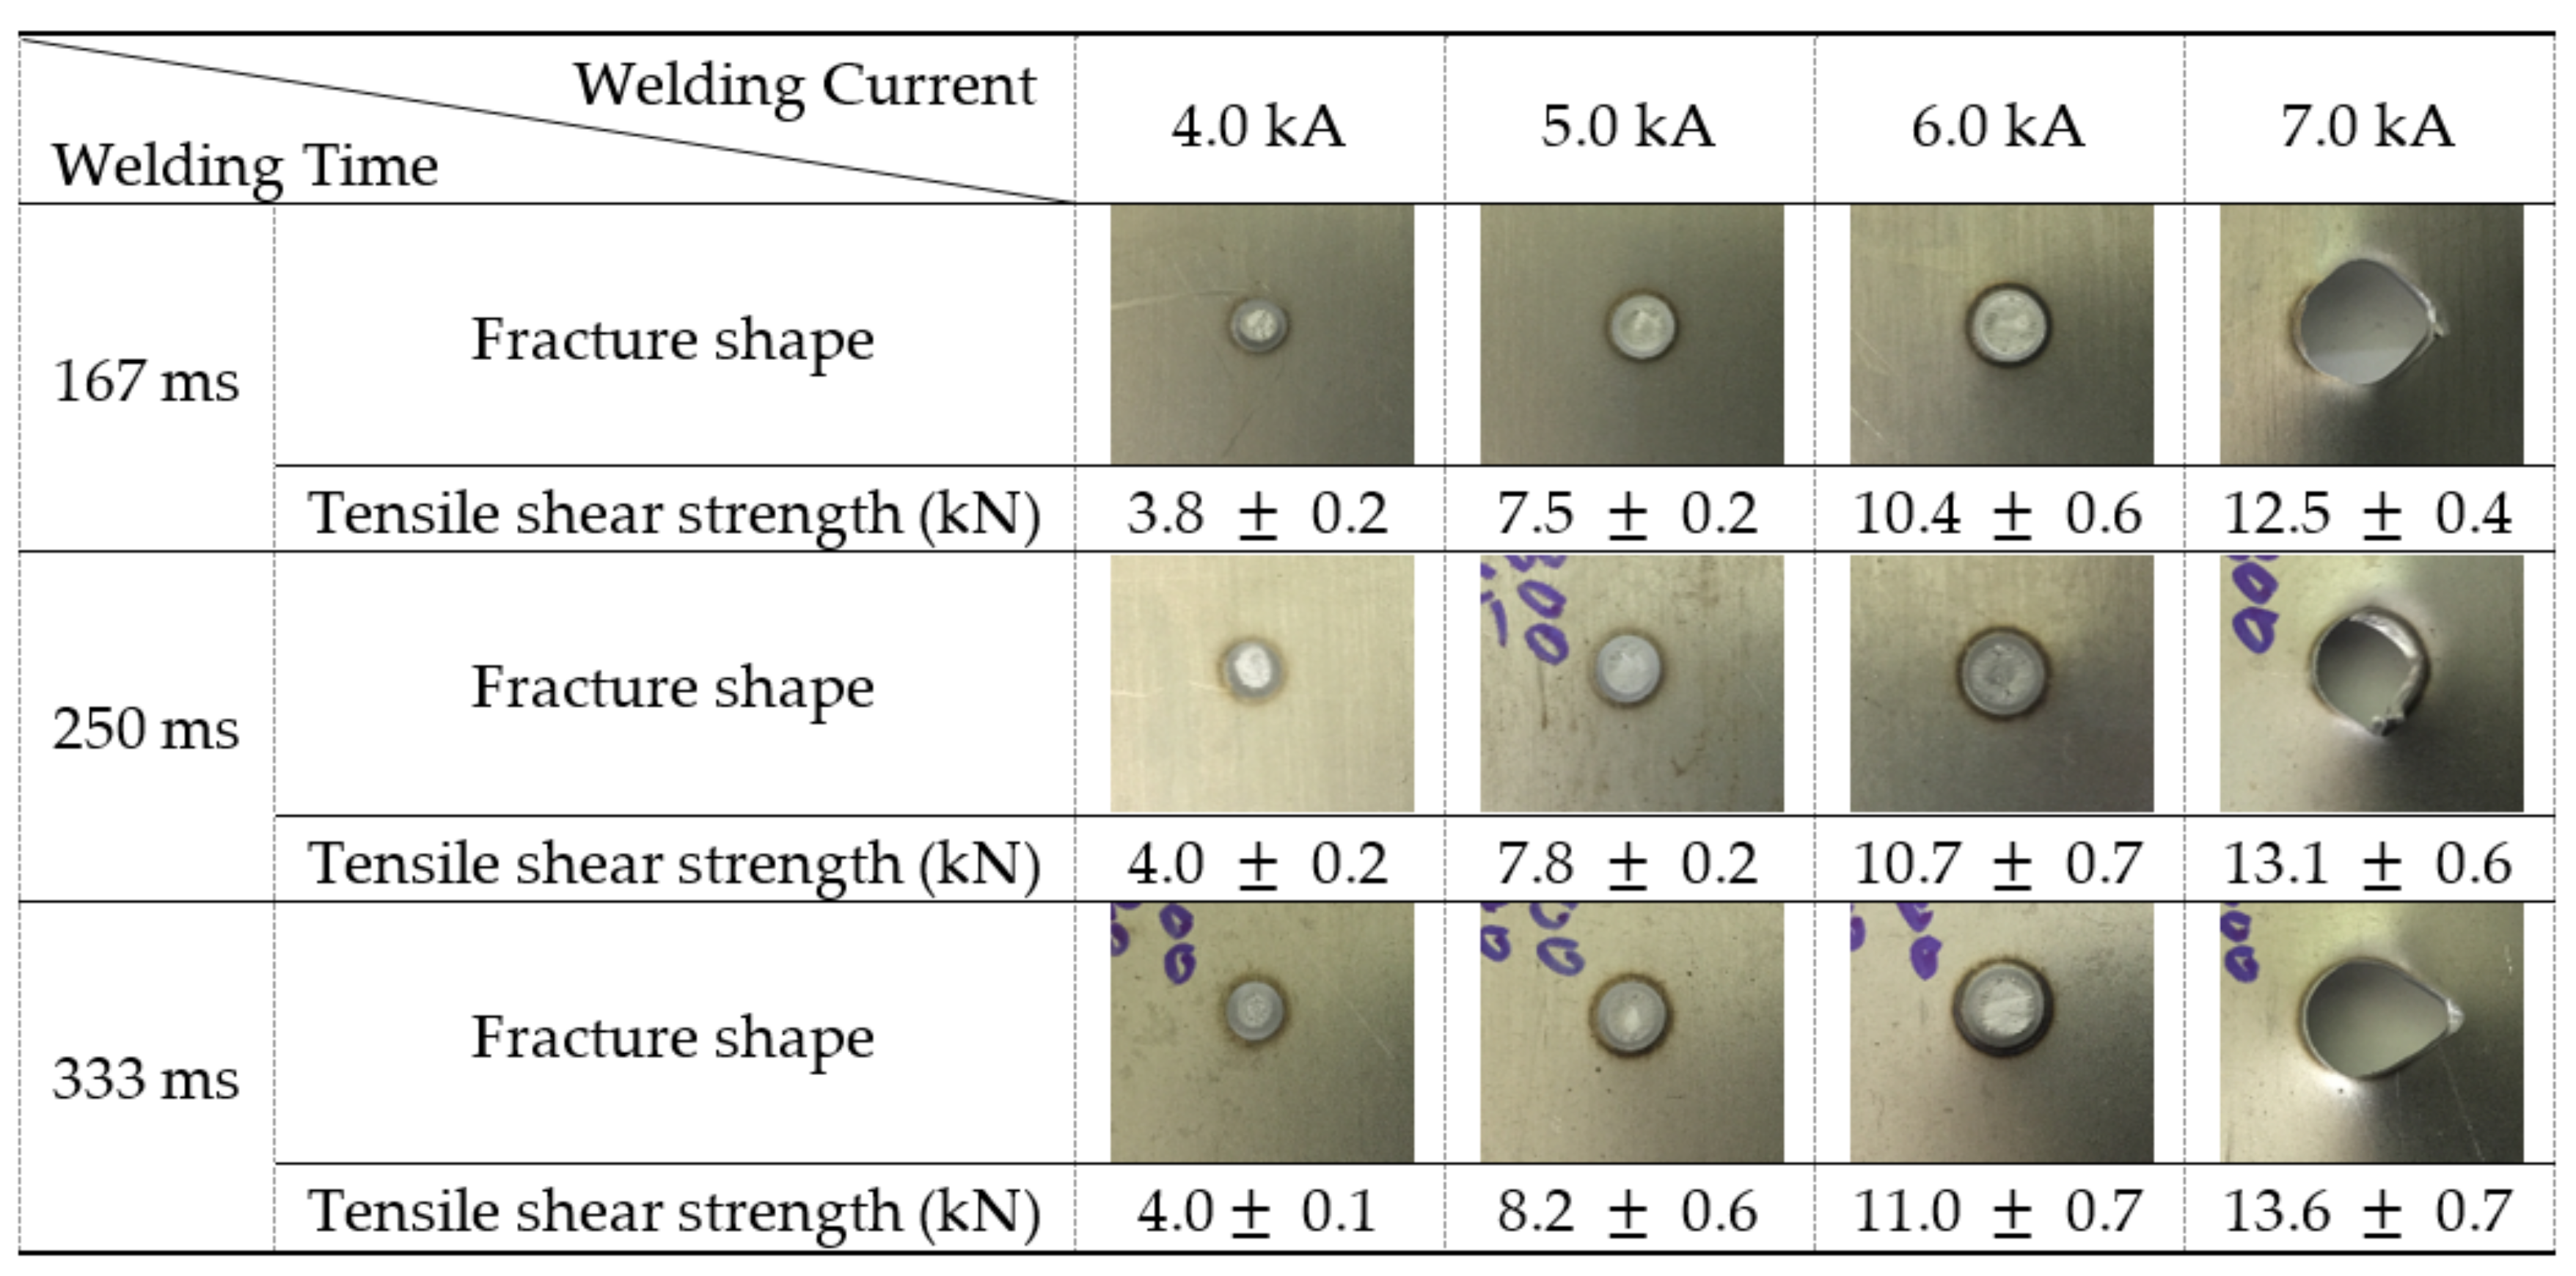
2.3. Evaluation of the Weld Quality
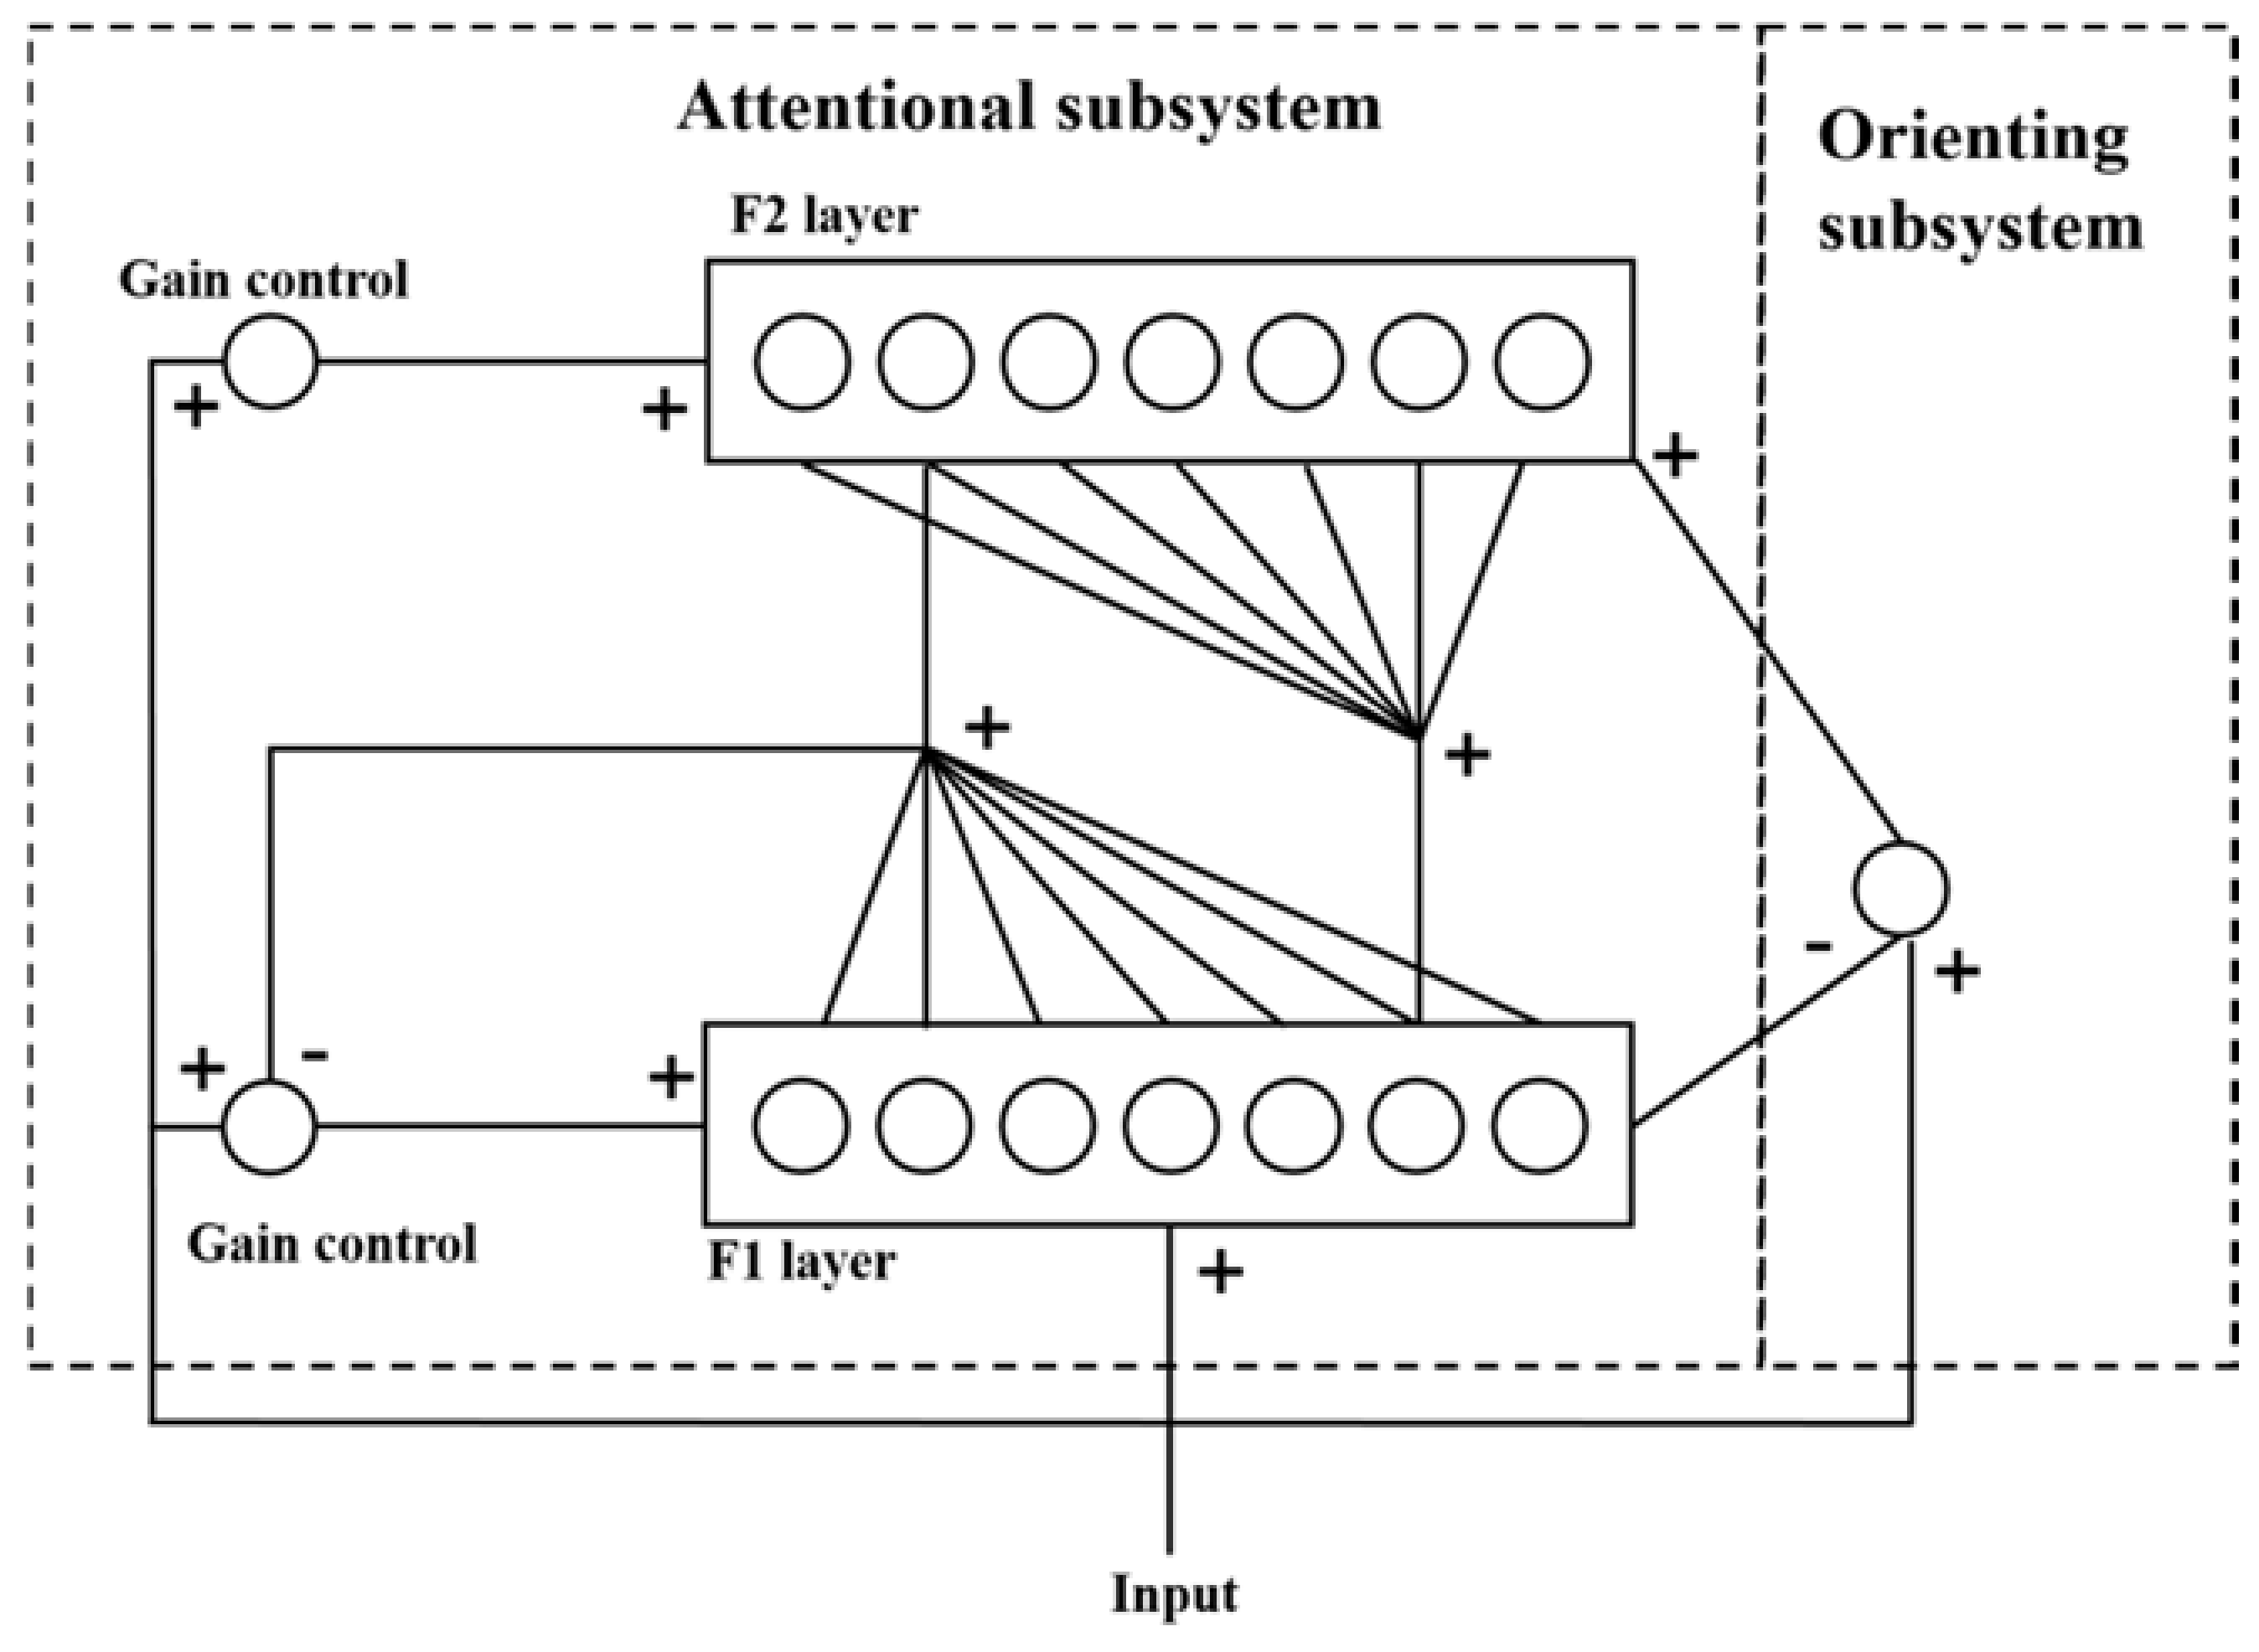
2.4. Adaptive Resonance Theory
2.5. Conversion of the Input Layer Data for ART Artificial Neural Networks
3. Results and Discussion
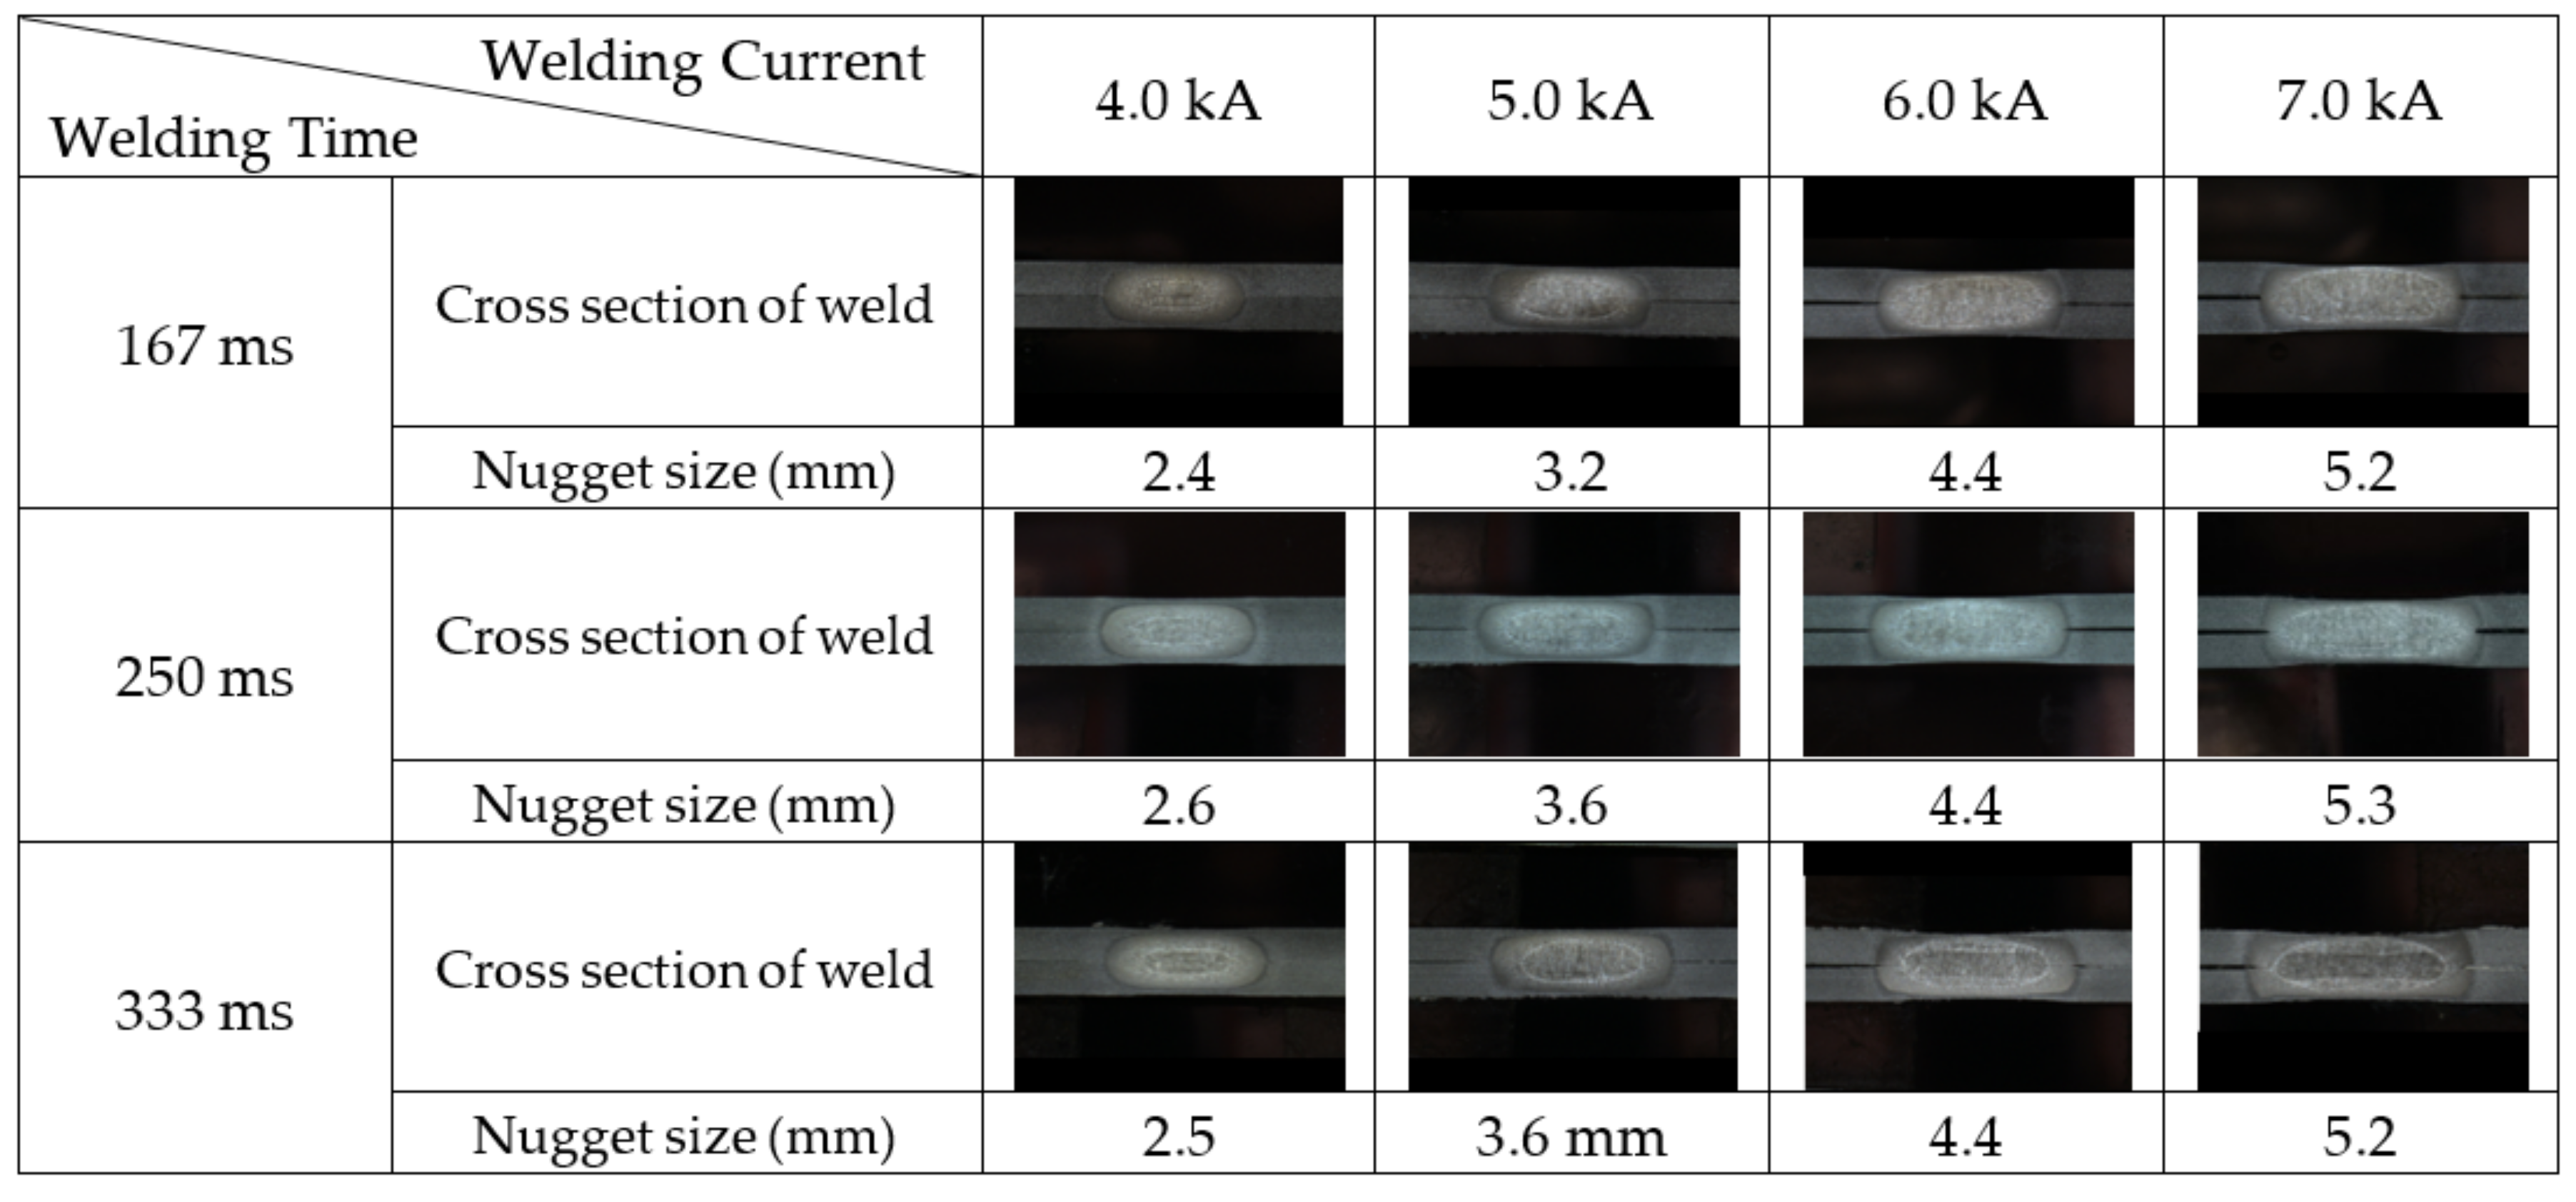
3.1. Weld Quality of RSW for 780 MPa Grade DP Steel
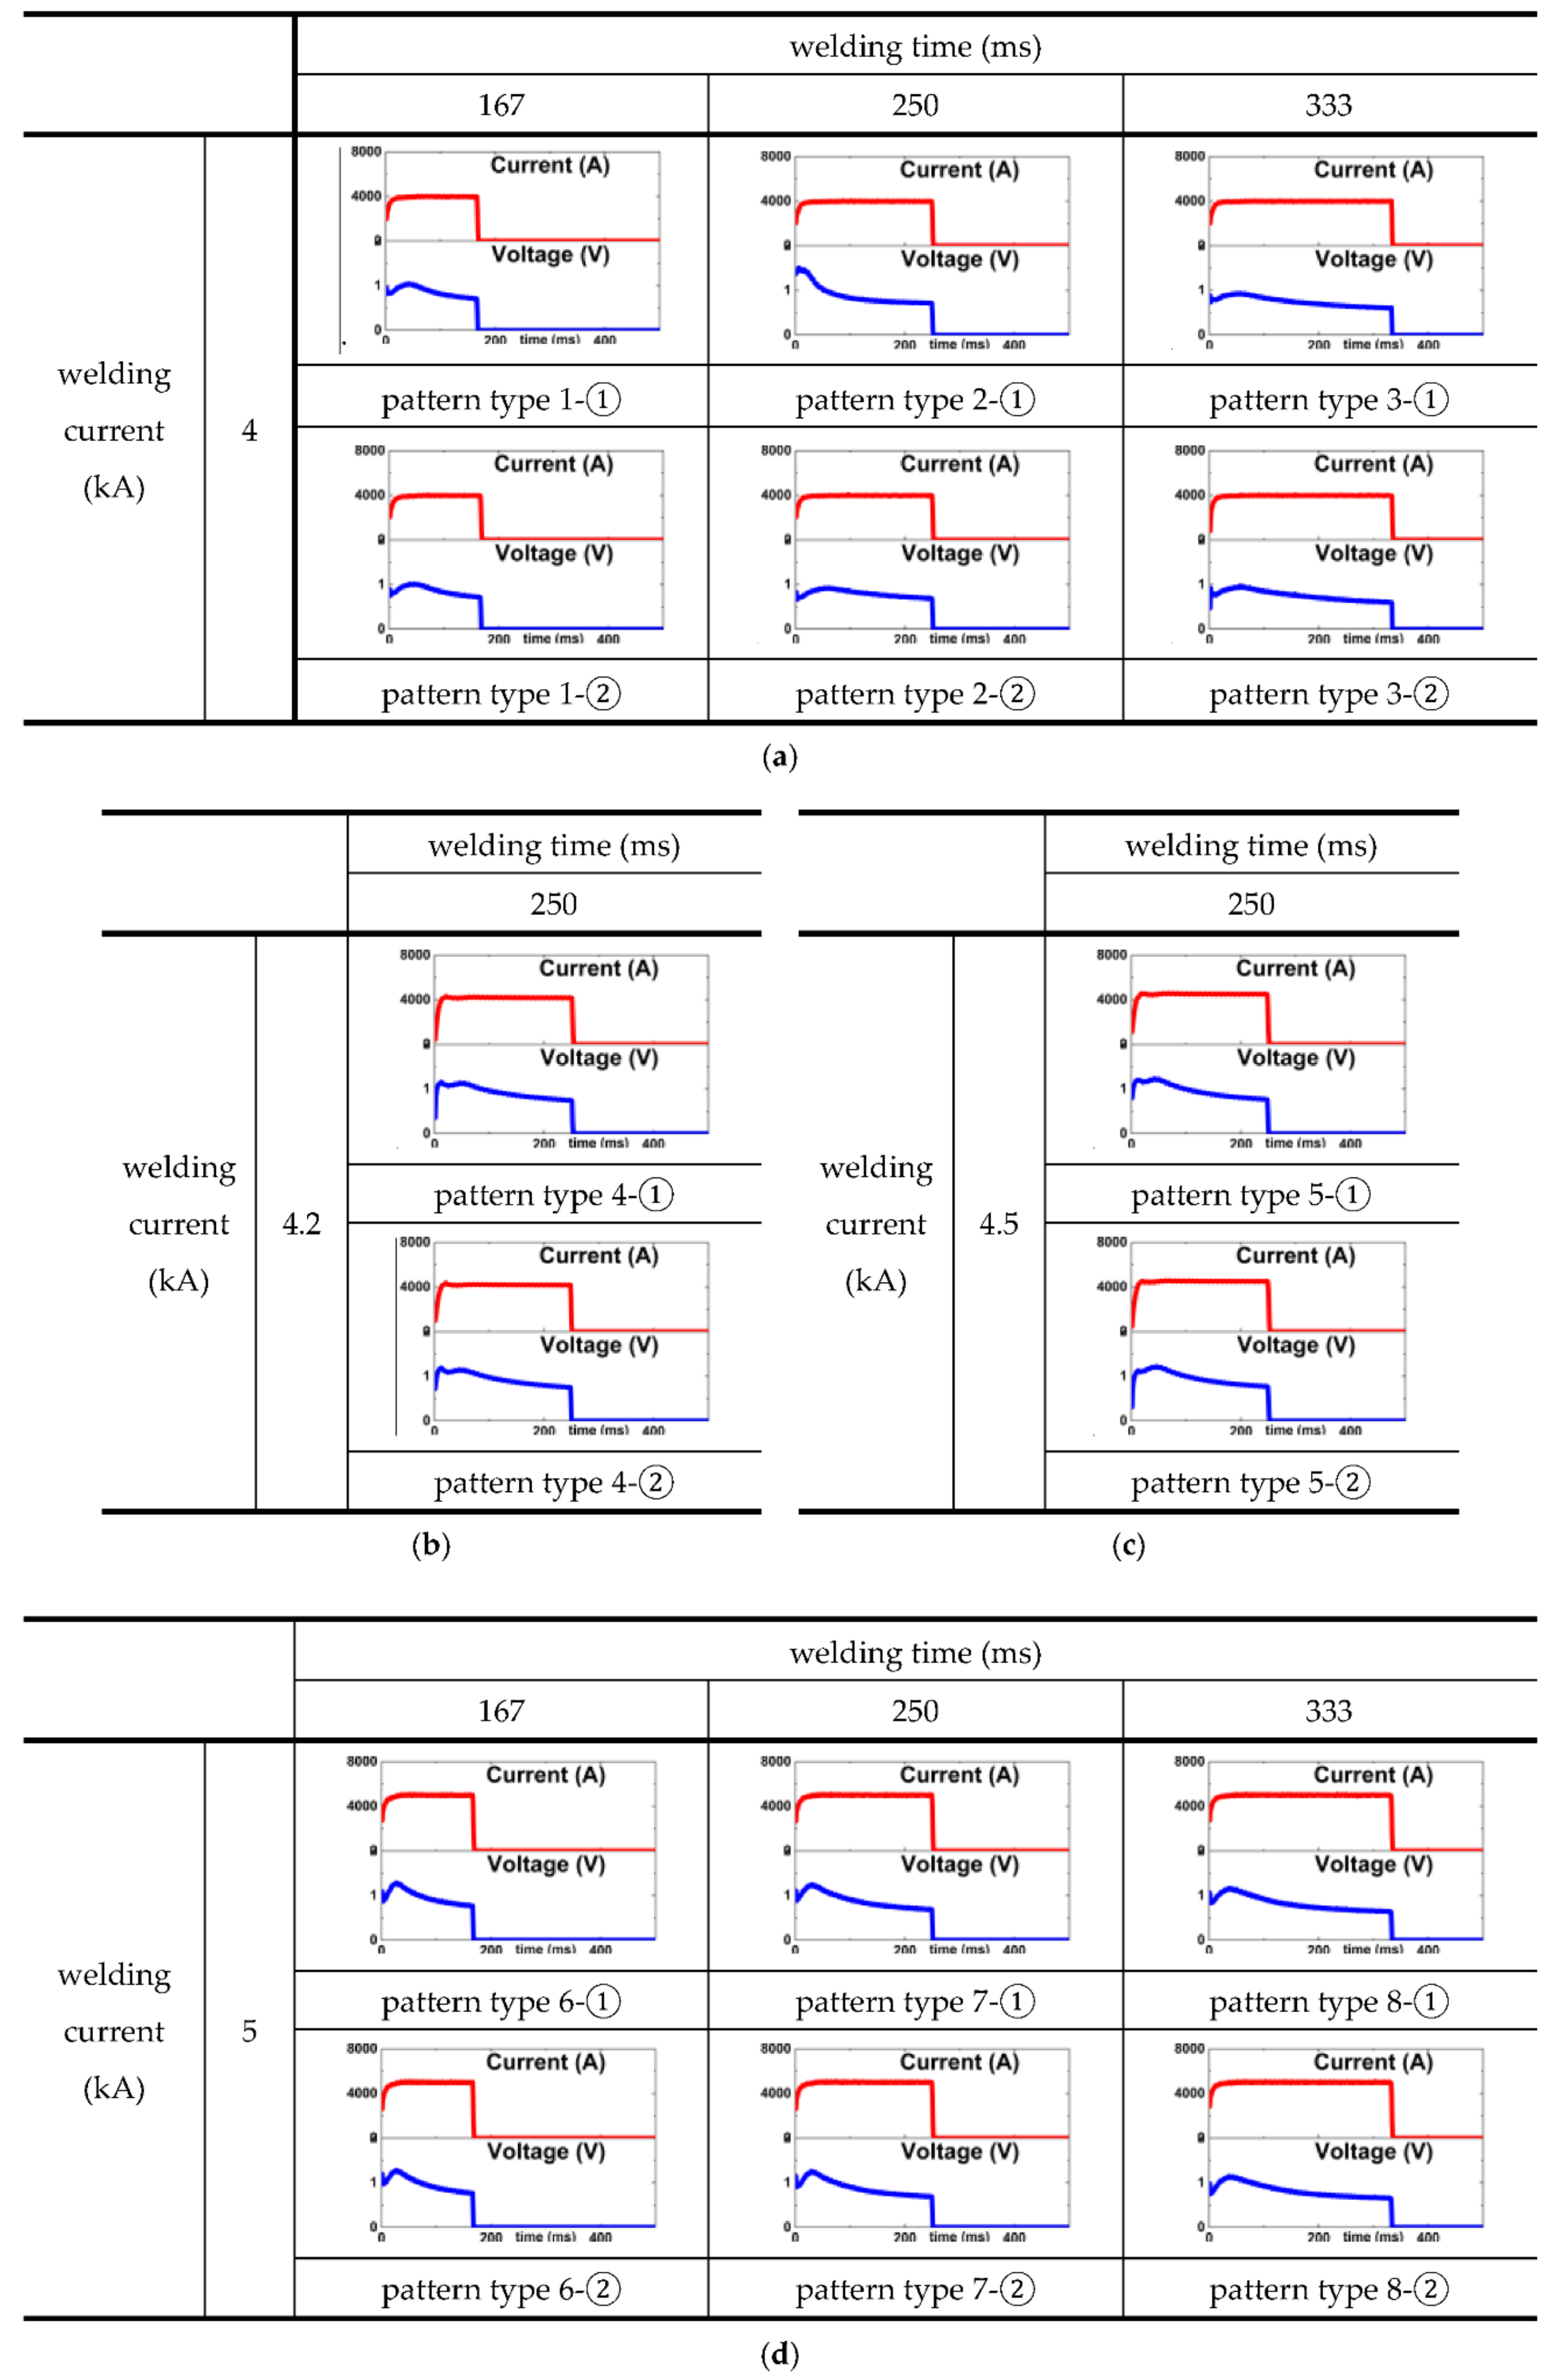
3.2. Optimal Pattern Classification Using ART Artificial Neural Networks
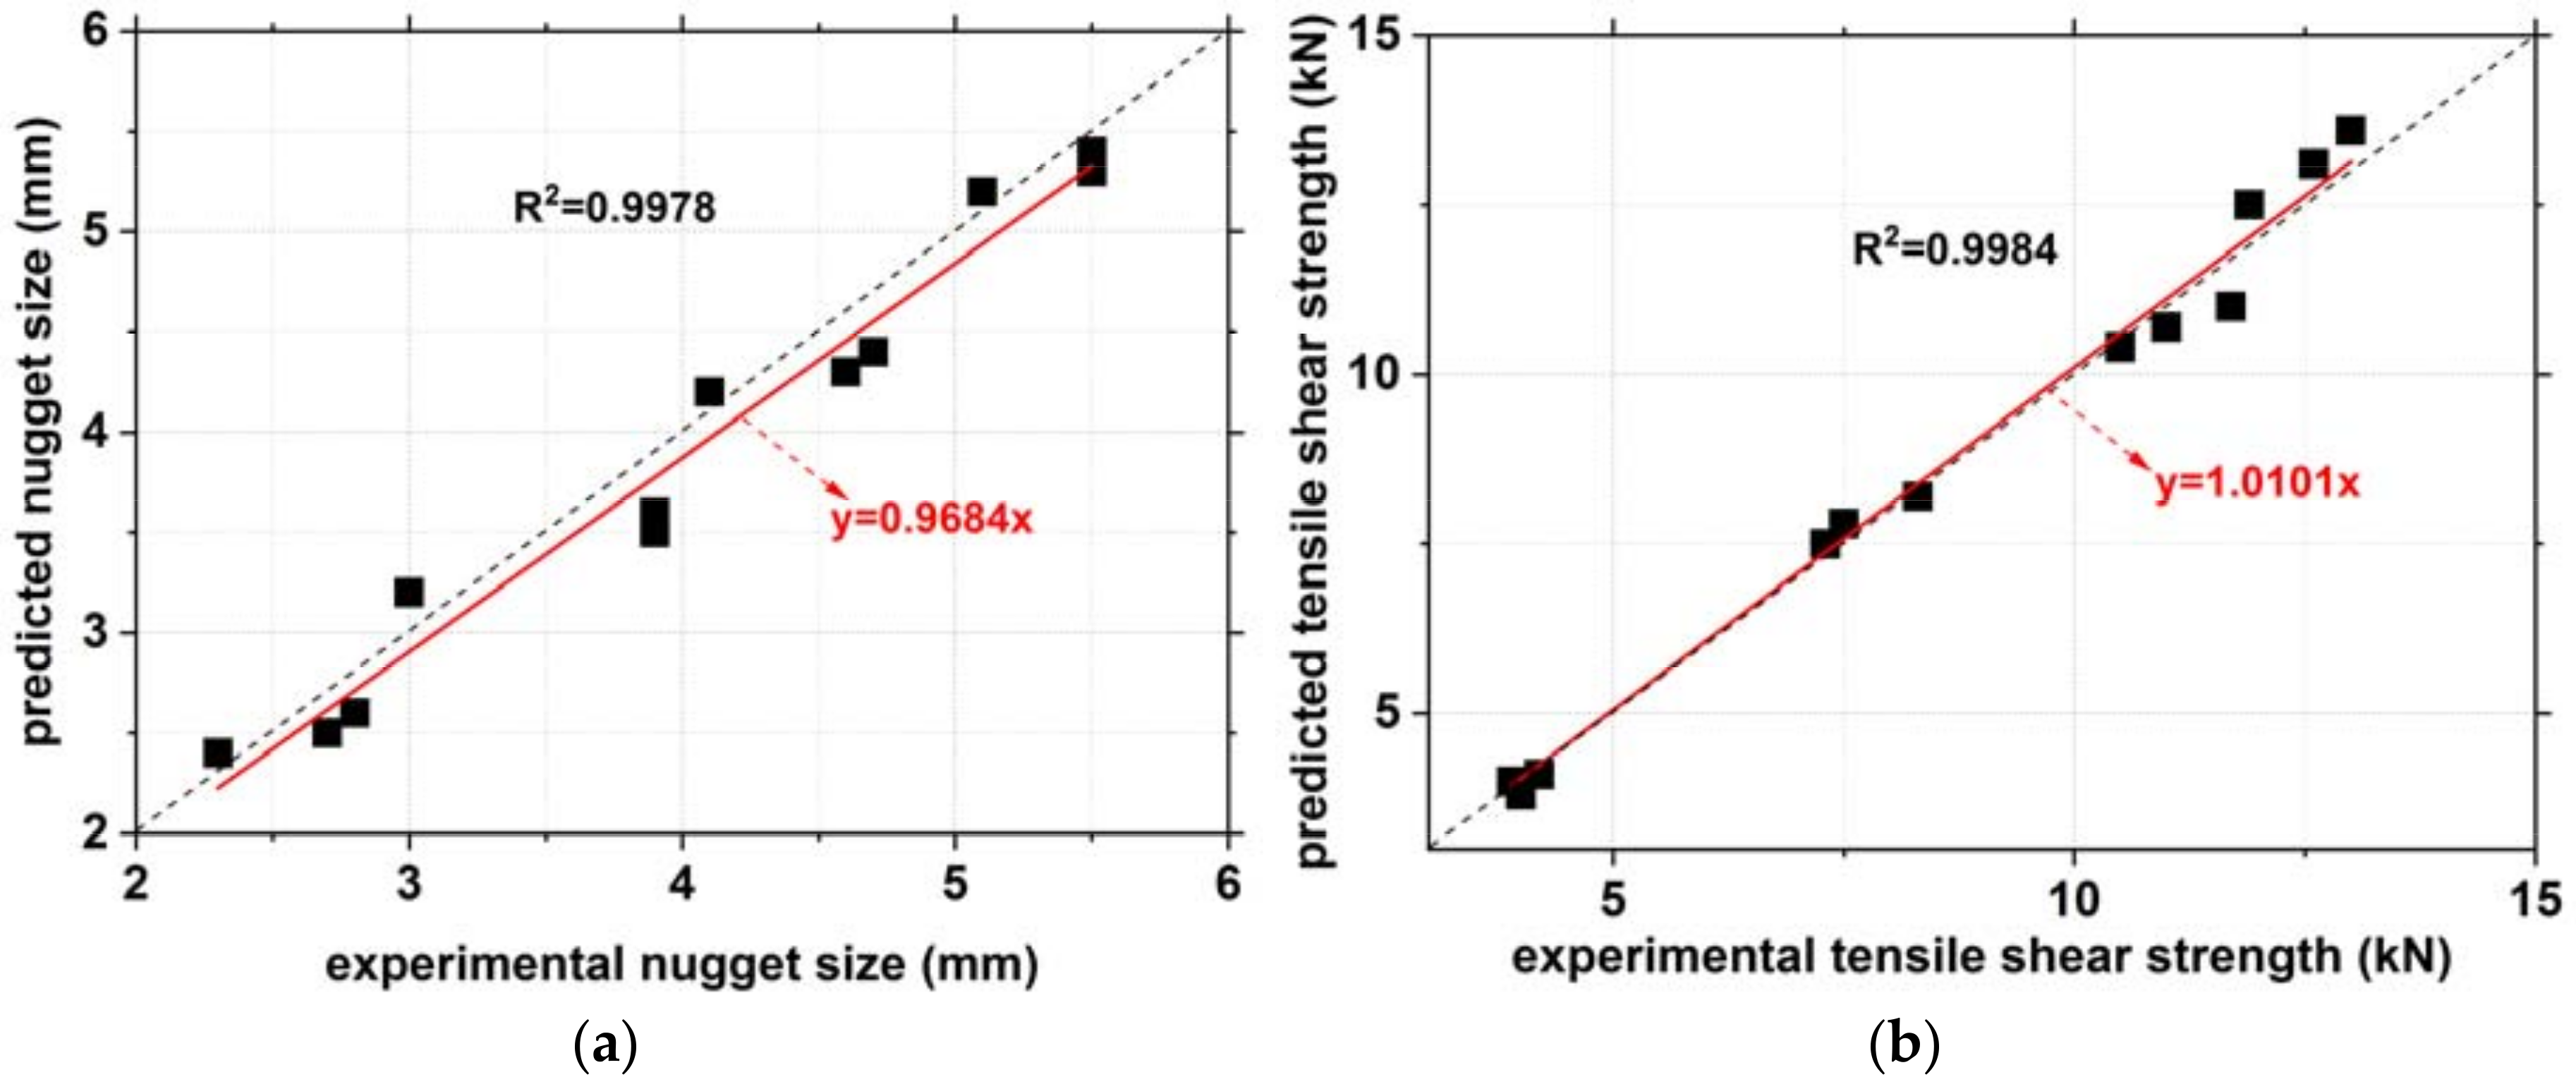
3.3. Prediction of Weld Quality Using ART Artificial Neural Networks
4. Conclusions
Author Contributions
Funding
Acknowledgments
Conflicts of Interest
References
- Schubert, E.; Klassen, M.; Zerner, I.; Walz, C.; Sepold, G. Light-weight structures produced by laser beam joining for future applications in automobile and aerospace industry. J. Mater. Process. Technol. 2001, 115, 2–8. [Google Scholar] [CrossRef]
- Yamane, K.; Furuhama, S. A study on the effect of the total weight of fuel and fuel tank on the driving performances of cars. Int. J. Hydrog. Energy 1998, 23, 825–831. [Google Scholar] [CrossRef]
- Suh, D.W.; Park, S.J.; Lee, T.H.; Oh, C.S.; Kim, S.J. Influence of Al on the microstructural evolution and mechanical behavior of low-carbon, manganese transformation-induced-plasticity steel. Metall. Mater. Trans. A 2010, 41, 397–408. [Google Scholar] [CrossRef]
- Bouaziz, O.; Allain, S.; Scott, C.P.; Cugy, P.; Barbier, D. High manganese austenitic twinning induced plasticity steels: A review of the microstructure properties relationships. Curr. Opin. Solid State Mater. Sci. 2011, 15, 141–168. [Google Scholar] [CrossRef]
- Lim, N.S.; Park, H.S.; Kim, S.I.; Park, C.G. Effects of aluminum on the microstructure and phase transformation of TRIP steels. Metals Mater. Int. 2012, 18, 647–654. [Google Scholar] [CrossRef]
- Kim, H.; Suh, D.W.; Kim, N.J. Fe–Al–Mn–C lightweight structural alloys: A review on the microstructures and mechanical properties. Sci. Tech. Adv. Mater. 2013, 14, 014205–1-10. [Google Scholar] [CrossRef] [PubMed]
- Kah, P.; Suoranta, R.; Martikainen, J.; Magnus, C. Techniques for joining dissimilar materials: Metals and polymers. Rev. Adv. Mater. Sci. 2014, 36, 152–164. [Google Scholar]
- Haque, R. Quality of self-piercing riveting (SPR) joints from cross-sectional perspective: A review. Arch. Civil Mech Eng. 2018, 18, 83–93. [Google Scholar] [CrossRef]
- Ramazani, A.; Mukherjee, K.; Abdurakhmanov, A.; Abbasi, M.; Prahl, U. Characterization of Microstructure and Mechanical Properties of Resistance Spot Welded DP600 Steel. Metals 2015, 5, 1704–1716. [Google Scholar] [CrossRef] [Green Version]
- Jia, Q.; Liu, L.; Guo, W.; Peng, Y.; Zou, G.; Tian, Z.; Zhou, Y.N. Microstructure and Tensile-Shear Properties of Resistance Spot-Welded Medium Mn Steel. Metals 2018, 8, 48. [Google Scholar] [CrossRef]
- Russo Spena, P.; Rossi, S.; Wurzer, R. Effects of Welding Parameters on Strength and Corrosion Behavior of Dissimilar Galvanized Q&P and TRIP Spot Welds. Metals 2017, 7, 534. [Google Scholar] [Green Version]
- Tutar, M.; Aydin, H.; Bayram, A. Effect of Weld Current on the Microstructure and Mechanical Properties of a Resistance Spot-Welded TWIP Steel Sheet. Metals 2017, 7, 519. [Google Scholar] [CrossRef]
- Chabok, A.; van der Aa, E.; De Hosson, J.T.M.; Pei, Y.T. Mechanical behavior and failure mechanism of resistance spot welded DP1000 dual phase steel. Mater. Des. 2017, 124, 171–182. [Google Scholar] [CrossRef]
- Chen, Z.; Shi, Y.; Jiao, B.; Zhao, H. Ultrasonic nondestructive evaluation of spot welds for zinc-coated high strength steel sheet based on wavelet packet analysis. J. Mater. Process. Technol. 2009, 209, 2329–2337. [Google Scholar] [CrossRef]
- Lee, S.; Nam, J.; Hwang, W.; Kim, J.; Lee, B. A study on integrity assessment of the resistance spot weld by infrared thermography. Procedia Eng. 2011, 10, 1748–1753. [Google Scholar] [CrossRef]
- Ji, C.T.; Zhou, Y. Dynamic electrode force and displacement in resistance spot welding of aluminum. J. Manuf. Sci. Eng. 2004, 126, 605–610. [Google Scholar] [CrossRef]
- El-Banna, M.; Filev, D.; Chinnam, R.B. Online qualitative nugget classification by using a linear vector quantization neural network for resistance spot welding. Int. J. Adv. Manuf. Technol. 2008, 36, 237–248. [Google Scholar] [CrossRef]
- Zhao, D.; Wang, Y.; Lin, Z.; Sheng, S. An effective quality assessment method for small scale resistance spot welding based on process parameters. NDT&E Int. 2013, 55, 36–41. [Google Scholar]
- Kim, T.; Lee, Y.; Lee, J.; Rhee, S. A study of nondestructive weld quality inspection and estimation during resistance spot welding. Key Eng. Mater. 2004, 270–273, 2338–2344. [Google Scholar] [CrossRef]
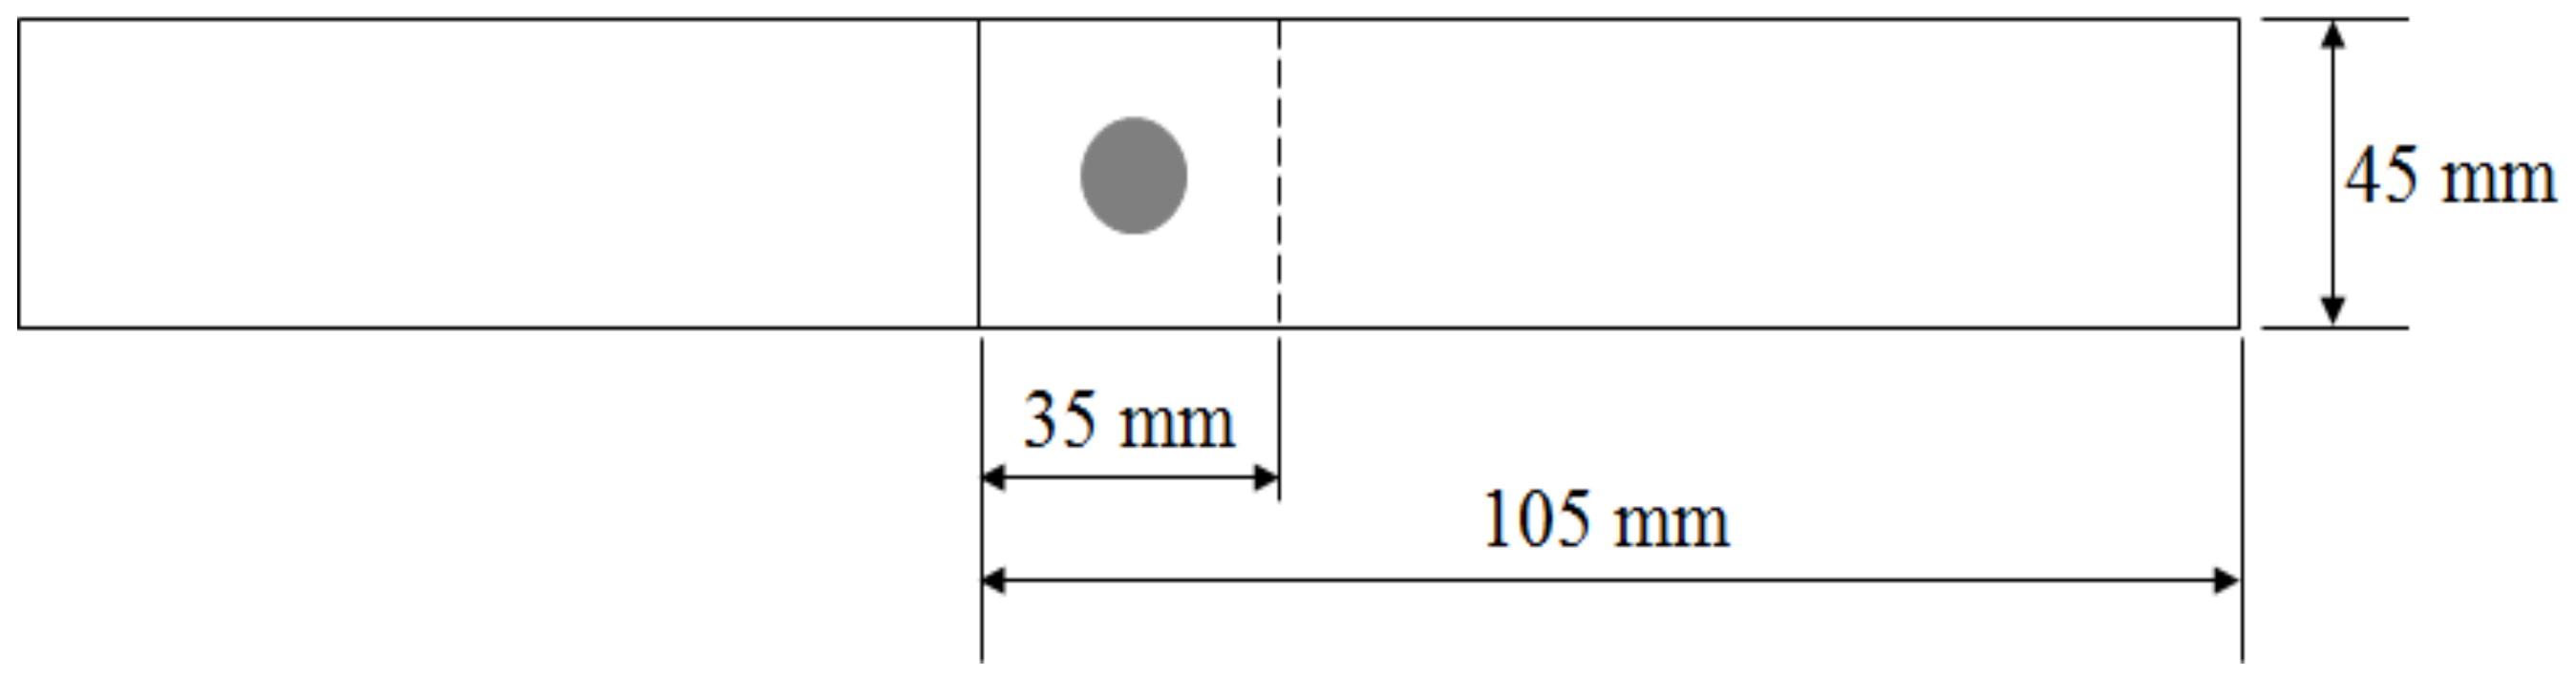
- AWS D8.9M. Test Methods for Evaluating the Resistance Spot Welding Behavior of Automotive Sheet Steel Materials; American Welding Society (AWS): Miami, FL, USA, 2012. [Google Scholar]


| Chemical Composition (wt. %) | Mechanical Properties | |||||||
|---|---|---|---|---|---|---|---|---|
| C | Si | Mn | P | S | Fe | Tensile Strength (MPa) | Yield Strength (MPa) | Elongation (%) |
| 0.073 | 0.996 | 2.271 | 0.01 | 0.001 | Bal. | 813 | 508 | 21 |
| Welding Current (kA) | Welding Time (ms) | Electrode Force (kgf) |
|---|---|---|
| 4.0, 5.0, 6.0, 7.0 | 167, 250, 333 | 300 |
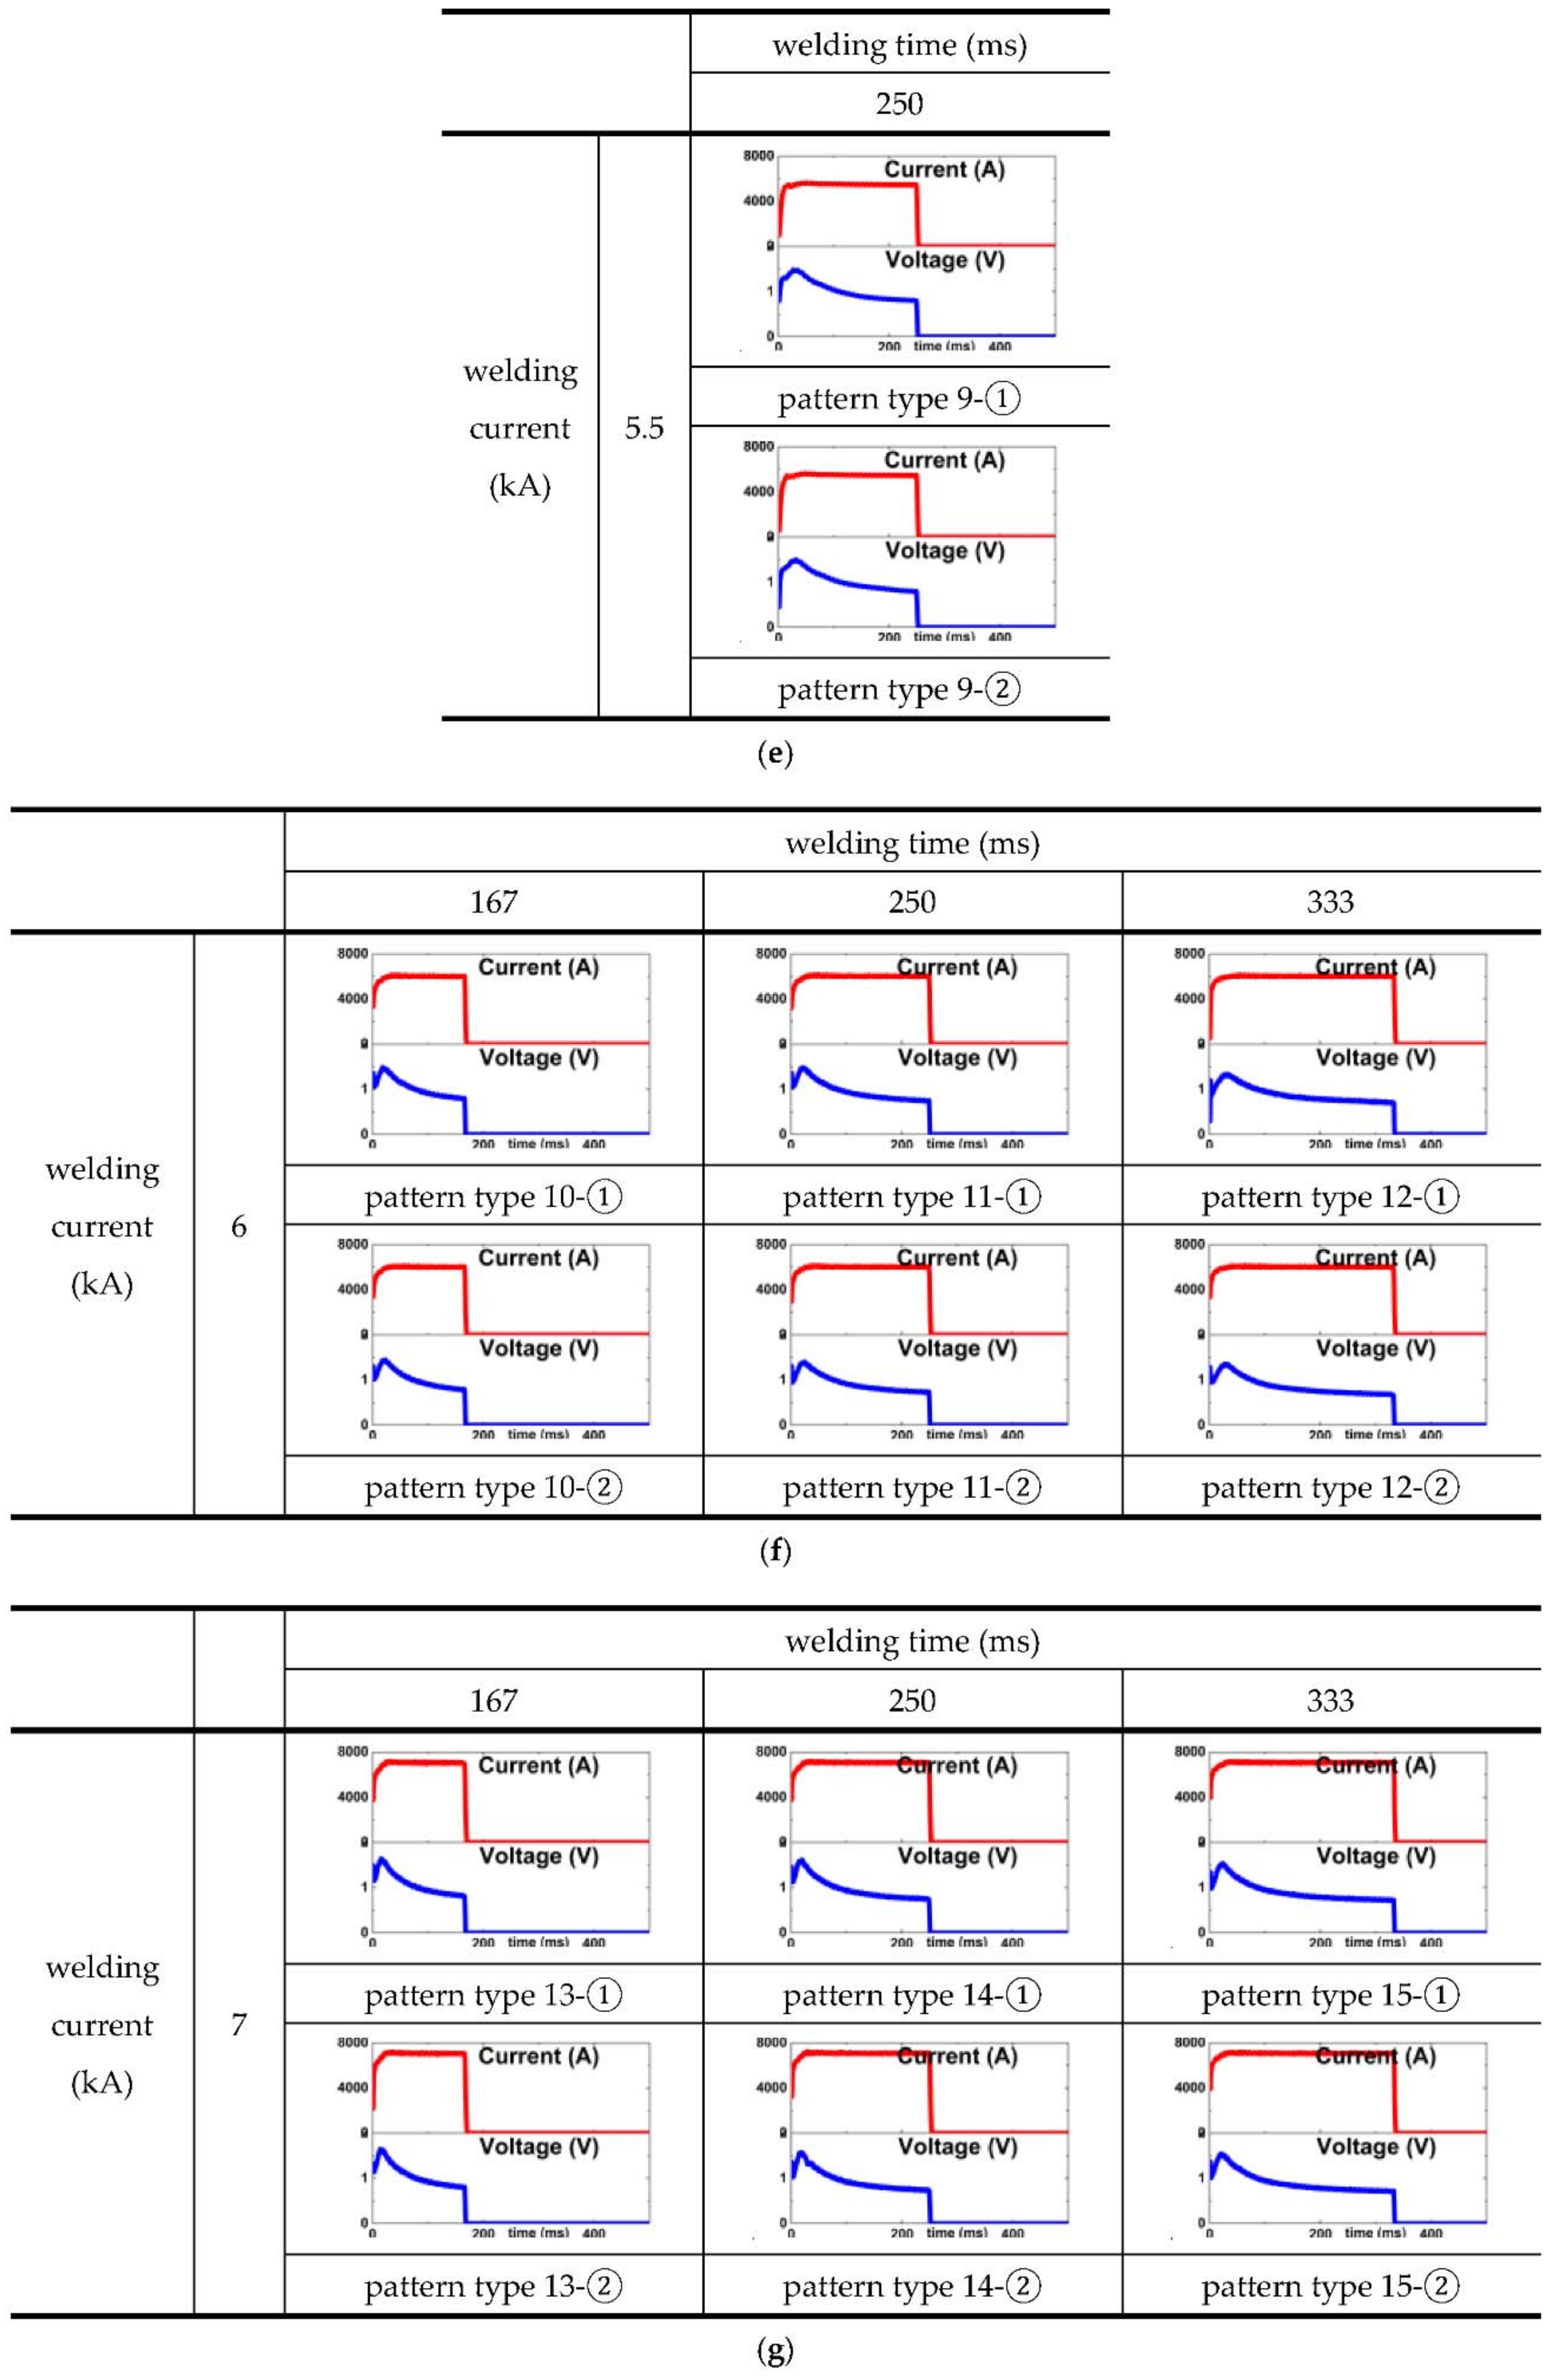
| Clusters No. | Tensile Shear Strength (kN) | Nugget Size (mm) | Fracture Shape | CLASSIFIED patterns of Input Signal Parameters |
|---|---|---|---|---|
| 1 | 3.8 | 2.4 | interfacial | 1-①, 1-② |
| 2 | 4.0 | 2.5 | interfacial | 2-①, 2-② |
| 3 | 4.1 | 2.6 | interfacial | 3-①, 3-② |
| 4 | 5.6 | 3.0 | interfacial | 4-①, 4-② |
| 5 | 6.5 | 3.1 | interfacial | 5-①, 5-② |
| 6 | 7.5 | 3.2 | interfacial | 6-①, 6-② |
| 7 | 7.8 | 3.5 | interfacial | 7-①, 7-② |
| 8 | 8.2 | 3.6 | interfacial | 8-①, 8-② |
| 9 | 9.8 | 4.0 | interfacial | 9-①, 9-② |
| 10 | 10.4 | 4.2 | interfacial | 10-①, 10-② |
| 11 | 10.7 | 4.3 | interfacial | 11-①, 11-② |
| 12 | 11.0 | 4.4 | interfacial | 12-①, 12-② |
| 13 | 12.5 | 5.2 | pull-out | 13-①, 13-② |
| 14 | 13.1 | 5.3 | pull-out | 14-①, 14-② |
| 15 | 13.6 | 5.4 | pull-out | 15-①, 15-② |
© 2018 by the authors. Licensee MDPI, Basel, Switzerland. This article is an open access article distributed under the terms and conditions of the Creative Commons Attribution (CC BY) license (http://creativecommons.org/licenses/by/4.0/).
Share and Cite
Hwang, I.; Yun, H.; Yoon, J.; Kang, M.; Kim, D.; Kim, Y.-M. Prediction of Resistance Spot Weld Quality of 780 MPa Grade Steel Using Adaptive Resonance Theory Artificial Neural Networks. Metals 2018, 8, 453. https://doi.org/10.3390/met8060453
Hwang I, Yun H, Yoon J, Kang M, Kim D, Kim Y-M. Prediction of Resistance Spot Weld Quality of 780 MPa Grade Steel Using Adaptive Resonance Theory Artificial Neural Networks. Metals. 2018; 8(6):453. https://doi.org/10.3390/met8060453
Chicago/Turabian StyleHwang, Insung, Hyeonsang Yun, Jinyoung Yoon, Munjin Kang, Dongcheol Kim, and Young-Min Kim. 2018. "Prediction of Resistance Spot Weld Quality of 780 MPa Grade Steel Using Adaptive Resonance Theory Artificial Neural Networks" Metals 8, no. 6: 453. https://doi.org/10.3390/met8060453