Article

Grain Scale Representative Volume Element Simulation to Investigate the Effect of Crystal Orientation on Void Growth in Single and Multi-Crystals

1
Materials Science and Engineering, Korea University, Seoul 02841, Korea
2
Korea Institute of Materials Science, Changwon 51508, Korea
3
Nuclear and Quantum Engineering, Korea Advanced Institute of Science and Technology, Daejeon 34141, Korea
4
Materials Science and Engineering & Research Institute of Advanced Materials, Seoul National University, Seoul 08829, Korea
*
Author to whom correspondence should be addressed.
Metals 2018, 8(6), 436; https://doi.org/10.3390/met8060436
Submission received: 27 April 2018 / Revised: 30 May 2018 / Accepted: 5 June 2018 / Published: 8 June 2018
(This article belongs to the Special Issue Constitutive Modelling for Metals)

Abstract

:
Crystal plasticity finite element (CPFE) simulations were performed on the representative volume elements (RVE) modeling body centered cubic (bcc) single, bi- and tri-crystals. The RVE model was designed to include a void inside a grain, at a grain boundary and at a triple junction. The effect of single crystal orientation on the flow strength and growth rate of the void was discussed under prescribed boundary conditions for constant stress triaxialities. CPFE analyses could explain the effect of inter-grain orientations on the anisotropic growth of the void located at the grain boundaries. The results showed that the rate of void growth had preferred orientation in a single crystal, but the rate could be significantly different when other orientations of neighboring crystals were considered.

1. Introduction

Engineering structure materials used for the manufacturing processes generally require higher strength, prolonged plasticity with good ductility, weldability, creep resistance and enhanced fatigue properties among others. In general, the strength and ductility (or formability) of materials have an inverse relationship, which results from the higher possibility of the initiation of microscopic fracture along precipitate, grain and phase boundaries being responsible for the strengthening of materials. Therefore, modern structure material design aims to increase the ductility or to delay the fracture without deteriorating strength by controlling microstructures of materials.
The challenge confronted during the shaping and forming of metallic materials is the fracture of materials. In ductile metals, the common observation is that cracks initiate at some critical locations such as at the interface between secondary particles and base matrix materials or existing voids introduced during the processing. These cracks grow in specific directions depending on the microstructure and external loading conditions. For example, Gurland [1] observed that the cracks grow in a perpendicular direction to the maximum tensile strain direction. In the review paper of Takuda et al. [2], the prediction capability of the frequently adopted ductile fracture criteria was evaluated based on the sheet formability. Four classical ductile fracture models were considered in their paper: Clift [3], Cockcroft and Latham [4], Brozzo [5] and Oyane model [6]. In these models, the plasticity and ductile fracture criteria are fully uncoupled, which can be used for criteria to estimate the initiation of the fracture after certain amount of plastic deformation. According to their works, all criteria except the Clift model could predict fracture initiations successfully for an axisymmetric deep drawing test when the models incorporated the dependence of fracture on plastic strain and stress state. More recently, a criterion named the Mohr–Coulomb model was proposed by Bao and Wierzbicki [7] to consider dependence of fracture initiation on the stress triaxiality and Lode angle parameter, which improved the prediction for the initiation of ductile fracture with different types of materials [8,9].
Gurson [10] proposed a constitutive law, which combines plastic strain and damage, based on plastic flow rule by considering voids in ductile steel for predicting fracture of material. Nucleation, growth and coalescence of voids in metals are the major sequence of the ductile failure. Voids can nucleate near secondary particles including precipitates during plastic deformation by decohesion caused by lattice mismatch between the secondary particles and base material. In the process of plastic deformation, a ligament between closely located voids causes coalescence, which repeatedly occurs until fracture. To simplify the constitutive modeling, Gurson assumed that the shape of a void is spherical. The Gurson model has no consideration of void nucleation and coalescence of voids. If initial void volume fraction is zero, the evolution of void volume fraction is not considered in the Gurson model. After Gurson’s pioneering work, Tvergaard and Needleman [11] further improved the original model by introducing new material parameters. For describing a void nucleation, they adopted the laws proposed by Chu and Needleman [12]. The so-called Gurson–Tvergaard–Needleman (GTN) model needs another parameter describing the coalescence of void when material reaches a critical void volume fraction. Usually, the critical void volume fraction is obtained by a numerical fit to the tensile test and has been assumed to be a constant independent of stress state. They analyzed ductile fracture model incorporating the concept of volume fraction with void growth and loss of load carrying capacity for axisymmetric tensile specimens. The GTN model doesn’t consider the microstructural features such as crystal orientation surrounding the void.
Contrary to the phenomenological approaches for the determination of ductile fracture initiation and its propagation, analyses based on microscopic characteristics of materials are sometimes very useful for understanding the mechanism of the ductile fracture. For example, Yerra et al. [13] investigated the behavior of void in the material under different stress states (or different stress triaxiality) in a single crystal level. They simulated void coalescence behavior in the single crystal with different characteristic orientations using the crystal plasticity finite element method. Liu et al. [14] and Potirniche et al. [15] also studied the behavior of voids in single crystals with one or two idealized voids under prescribed boundary conditions. Their results showed that the rate of void growth and the onset of coalescence were dependent on the crystal orientation, which cannot be simulated using the conventional finite element approach. Srivastava and Needleman also adopted crystal plasticity and the RVE model with a single void to study the effect of crystal orientation on porosity and evolution of creep strain evolution. They found that the Lode parameter as a measure of stress state considerably affected the creep strain [16]. Similar work by Tekoglu studied the effect of stress triaxiality on the deformation behavior of the unit cell, but he additionally investigated the effect of shear ratio [17]. Lebensohn et al. proposed a new modeling approach with FFT (Fast Fourier Transformation)-based crystal plasticity to investigate the growth of multiple voids in the face centered cubic (fcc) polycrystals [18]. The hardening model used for crystal plasticity was usually a power-law type, but detailed study on the effect of stage III and IV strain hardening on the void growth and coalescence was provided by Lecarme et al., where they found that the stage IV hardening had significant influence in delaying fracture [19].
Along with numerous simulation based studies, there were experiment-based investigations on the void growth and its relationship with microstructure, especially with the grain orientations. Recently, Pushkareva et al. [20] and Nemcko et al. [21] studied the fracture process of pure titanium and magnesium, respectively, using experimentally introduced voids (or holes). They observed that the orientation effect was much stronger than other effects such as intervoid spacing. The numerical method was also accompanied to validate their experimental observations in both works [20,21].
The present study aims to investigate the effects of crystal orientation and existence of grain boundary or triple junction on the rate of void growth. The effect of grain boundaries on the void growth has not been well understood in the aspect of microstructural features such as grain orientations and slip activities. In fact, most of the existing works including the above-mentioned literature studied the growth and coalescence of a single void inside grains under different stress states. Therefore, different combinations of the crystal orientations are considered to study the preferred growth direction of void (or anisotropy of the void growth) to mimic the growth of void located at the grain boundary in polycrystalline metals. Three different characteristic grain orientations (100), (110) and (111) are introduced to the rate-dependent crystal plasticity finite element simulations under different constant stress triaxialities. Analyses are made by the results for flow strength of single crystals, slip activities of each constituent crystal and void growth rates between the bi- or tri-crystals.

2. Motivation, Assumptions and Limitation of the Work

Figure 1 shows the measured microstructures of a ferritic base steel. The EBSD (Electron backscatter diffraction) image in Figure 1a shows the orientation distribution of the constituent grains and Figure 1b represents a detailed TEM image showing the second phase particles distributed both inside grains and at grain boundaries. These two figures became the motivation for the present study. The fundamental assumption is that the fracture can be initiated from the second phase particles located either inside the grain or at the grain boundaries, and there is a strong relationship between void growth and orientations of the neighboring grains. To simulate the effect of grain orientations, the crystal plasticity simulation was adopted. Though there are many similar crystal plasticity based approaches on characterizing the fracture behavior of single or polycrystalline metals, the present study might be able to contribute by including the effect of multi-crystals in which the idealized void is located at the boundary of grains.
Because the mechanical deformation of real polycrystalline metals is complex, several simplifying assumptions and limitations in the present study are stated as following:
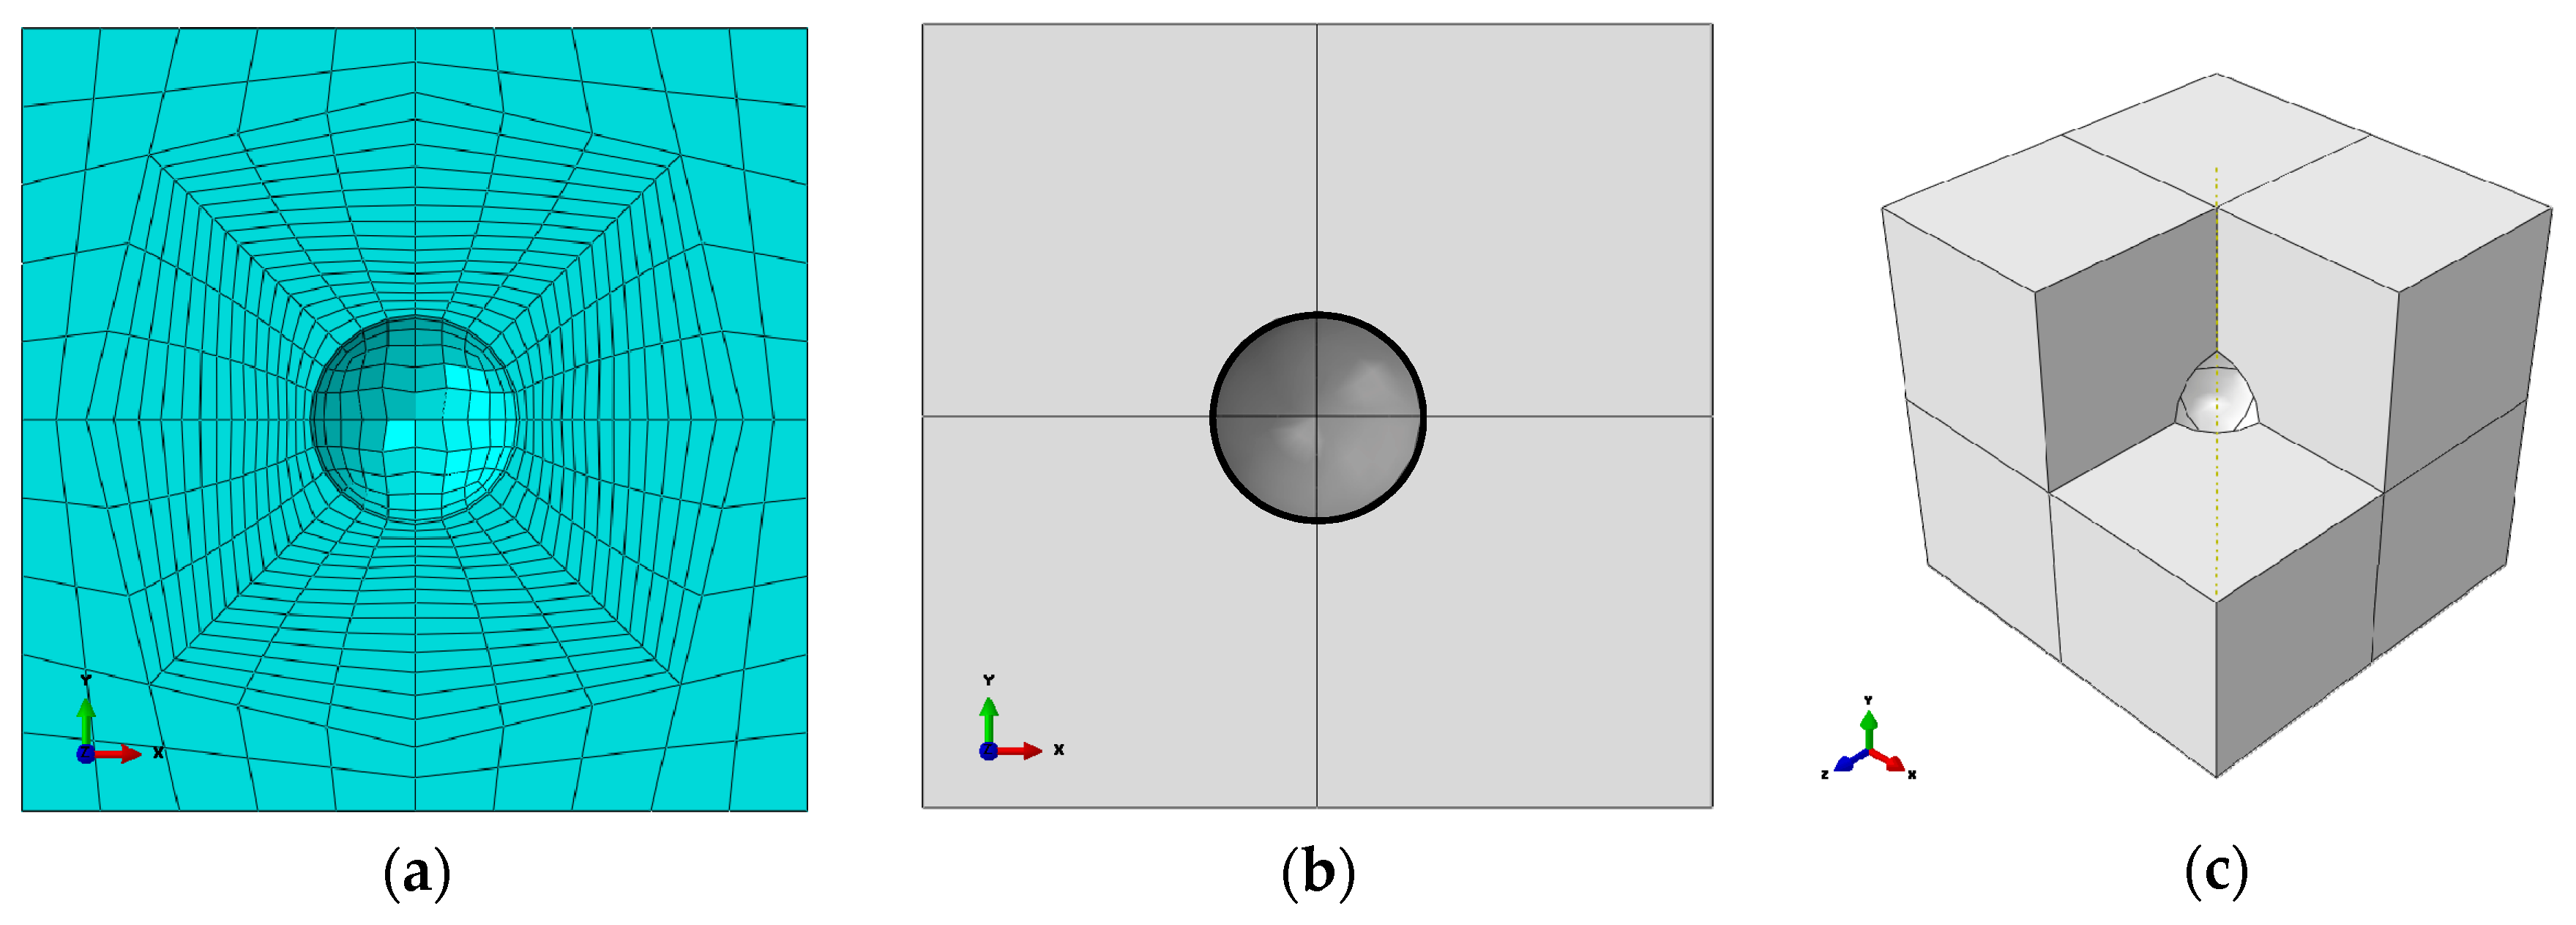
  • The microstructure of the single or multi-crystal is simplified as a representative volume element (RVE) in which an idealized spherical void is located at the center of a single crystal or at the grain boundary of multi-crystals.
  • It is assumed that the initiation of void originates from the second phase particle (or precipitate), thus only void growth is considered from the initial size of the second phase particle.
  • The crystallographic orientations of the microstructure are simplified as three characteristics primary orientations, (100), (110), and (111) along the normal direction of a sample.
  • In real crystalline metals, there are complex interactions among grain boundaries and dislocations, which is highly dependent on the grain boundary characteristics. To simplify this, the perfect bonding between neighboring grains at the grain boundary is assumed and no special interactions such as transmission and absorption of dislocations at the boundary are considered.
  • The material is assumed as a body centered cubic (bcc) crystal and a power-law type single crystal hardening model is adopted. In addition, the loading condition is quasi-static and isothermal at room temperature without strong strain rate and temperature effects.
The present work provides simulation based investigation, which should be further validated by experiments. However, even with this limitation, the current work is still meaningful considering recent advances in the computational approach based on crystal plasticity, which accurately predicts the anisotropic deformation response of cubic crystals under complex loading conditions [7,13,14,15,16,17,18,19].

3. Crystal Plasticity Constitutive Equation

Finite element simulations based on the crystal plasticity can represent the single and polycrystalline mechanical behaviors of metallic materials by considering their microstructure such as orientation and slip system of crystalline structures. In this study, the crystal plasticity based on rate-dependent elastic-viscoplasticity was adopted and implemented in the finite element code using a user material subroutine in ABAQUS.
In the user material subroutine, a prescribed deformation gradient tensor at each time step is multiplicatively decomposed into its elastic F e , and plastic part F p [22] (see Figure 2)
F = F e F p ,
where the elastic part of the deformation gradient accounts for elastic rotation and distortion, while the plastic part is activated by the dislocation slip on preferred slip systems. The second Piola–Kirchhoff stress T e can be calculated by the generalized Hooke’s law for anisotropic elastic materials as follows:
T e = C E e ,   T e = det ( F e ) F e 1 T F e T ,
where C is a fourth order anisotropic elasticity tensor, and T is the Cauchy stress tensor. The elastic Lagrangian strain tensor E e is calculated from the elastic part of the deformation gradient tensor as
E e = 1 2 ( F e T F e I ) .
The rate of plastic deformation gradient is expressed as follows:
F ˙ p = L p F p ,
where L p is the velocity gradient tensor that is calculated by the shear strain rates on preferred slip systems associated with slip direction d 0 α and slip plane normal n 0 α . If the dislocation glide on the activated slip systems can be represented by the shear strain rate γ ˙ α for the slip system α , the velocity gradient tensor can be expressed as
L p = α γ ˙ α d 0 α n 0 α .
Under the visco-plasticity scheme, the shear strain rate is expressed as an exponential function of the resolved shear stress and flow stress of the single crystal [23]:
γ ˙ α = γ ˙ 0 | τ α s α | 1 m s i g n ( τ α ) ,
where γ ˙ 0 is a reference slip rate, s α is a slip resistance, m is the strain rate sensitive exponent and τ α is the resolved shear stress on the slip system α .
To complete the constitutive equation for the single crystal plasticity, the rate of slip resistance equivalent to the flow stress hardening in the macroscopic stress–strain curve is formulated as below [24]:
s ˙ α = β h α β | γ ˙ β | ,
where h α β = q α β h β , and h α β is the hardening matrix that describes the latent hardening by q α β . The function h β is a power-law function as below with self-hardening coefficient h 0 , saturated slip resistance s s and strain hardening exponent a [25]:
h β = h 0 ( 1 s β s s ) a .
The power-law type hardening for single crystals has been well adopted in the crystal plasticity simulation under quasi-static loading at room temperature. More detailed description on the single crystal constitutive equations can be referred to [26].

4. Model Material and Identification of Crystal Plasticity Parameters

The purpose of the present study is to explore the relationship between grain scale deformation and the growth of voids embedded in single or multiple crystalline solids. Therefore, for simplistic numerical study, the existing material parameters for the crystal plasticity constitutive law were adopted. The model material is selected from one of ferritic steel that has body centered cubic crystal (bcc) structure. The anisotropic elastic properties for typical iron are referred to the material’s handbook [27] and the three anisotropic constants are C11 = 230.4 GPa, C12 = 134.2 GPa and C44 = 115.9 GPa. The slip systems for the bcc crystal have been often assumed to be 12 {110} <111> and 12 {112} <111> slip systems as listed in Table 1. The number of slip systems for the bcc crystal is chosen based on the previous work by Lee et al. [28] in which the additional {123} <111> slip systems played a minor role in the deformation texture. The single crystal properties in Equations (6)–(8) were identified as the best fitting parameters to the macroscopic stress–strain curve of polycrystalline steel assuming random orientations, which were adopted in the previous works [26,29,30]. The determined parameters are listed in Table 2.

5. Finite Element Modelling for RVE Analysis

In this study, a representative volume element (RVE) analysis was conducted using the finite element simulations. A unit cell containing a void was modeled in the finite element simulations and different boundary conditions were applied to investigate the void behavior during plastic deformation. An implicit finite element software ABAQUS/Standard 6.12 was used to model the growth of the void in the RVE. The single crystal constitutive equations were coded in the user material subroutine, UMAT. The three-dimensional continuum element C3D8 was used to model the RVE and the total number of elements was 4024.
In the RVE, a spherical void with an initial volume fraction of 0.01 is located in the single or multi-grain matrix as shown in Figure 3a. Each crystal has representative orientation among (100), (110) and (111) orientations. To represent the bi- or tri- crystals, the cell is divided into two or three regions with different crystal orientations. It is assumed that the boundary between two different orientations is perfectly bonded, which represents the grain boundary as the simplest approach without considering complex interactions among dislocations and grain boundaries. Therefore, the current RVE model can investigate the void behavior under plastic deformation when it is located at the center of single crystal, at the grain boundary of bi-crystal, and at the triple junction of the tri-crystal.
In the RVE model, [0-10], [00-1], [100] in (100) orientation are set to coincide with global X, Y, Z coordinates, respectively. Likewise, [100], [01-1], [011] in (110) orientation and [1-10], [11-2], [111] in (111) orientation coincide with X, Y, Z direction, respectively. The RVE cell is divided into four regions in the global XY-plane. Each region is assigned with single crystal orientation to allocate a void either at the center of single crystal, grain boundary or triple junction of bi- and tri-crystals, respectively. By the modeling approach, the effect of various combinations of primary orientations on the void behavior can be investigated efficiently.
To obtain the different stress states, displacement boundary conditions were applied. For this, the same magnitude of displacement along X and Y directions were prescribed, while the displacement along Z direction was iteratively controlled to maintain constant stress state during the deformation. Though the matrix material is incompressible, the volume of the RVE increased due to the growth of the void in the unit cell.
As a measure of stress state, the stress triaxiality of the RVE was calculated. The stress triaxiality η is defined as
η = Σ h Σ ¯   and   Σ h = 1 3 ( Σ 11 + Σ 22 + Σ 33 ) ,
where Σ h is macroscopically averaged hydrostatic stress and Σ ¯ is an equivalent stress. Two representative stress triaxialities, 1 and 3, were selected in this study.

6. Result and Discussion

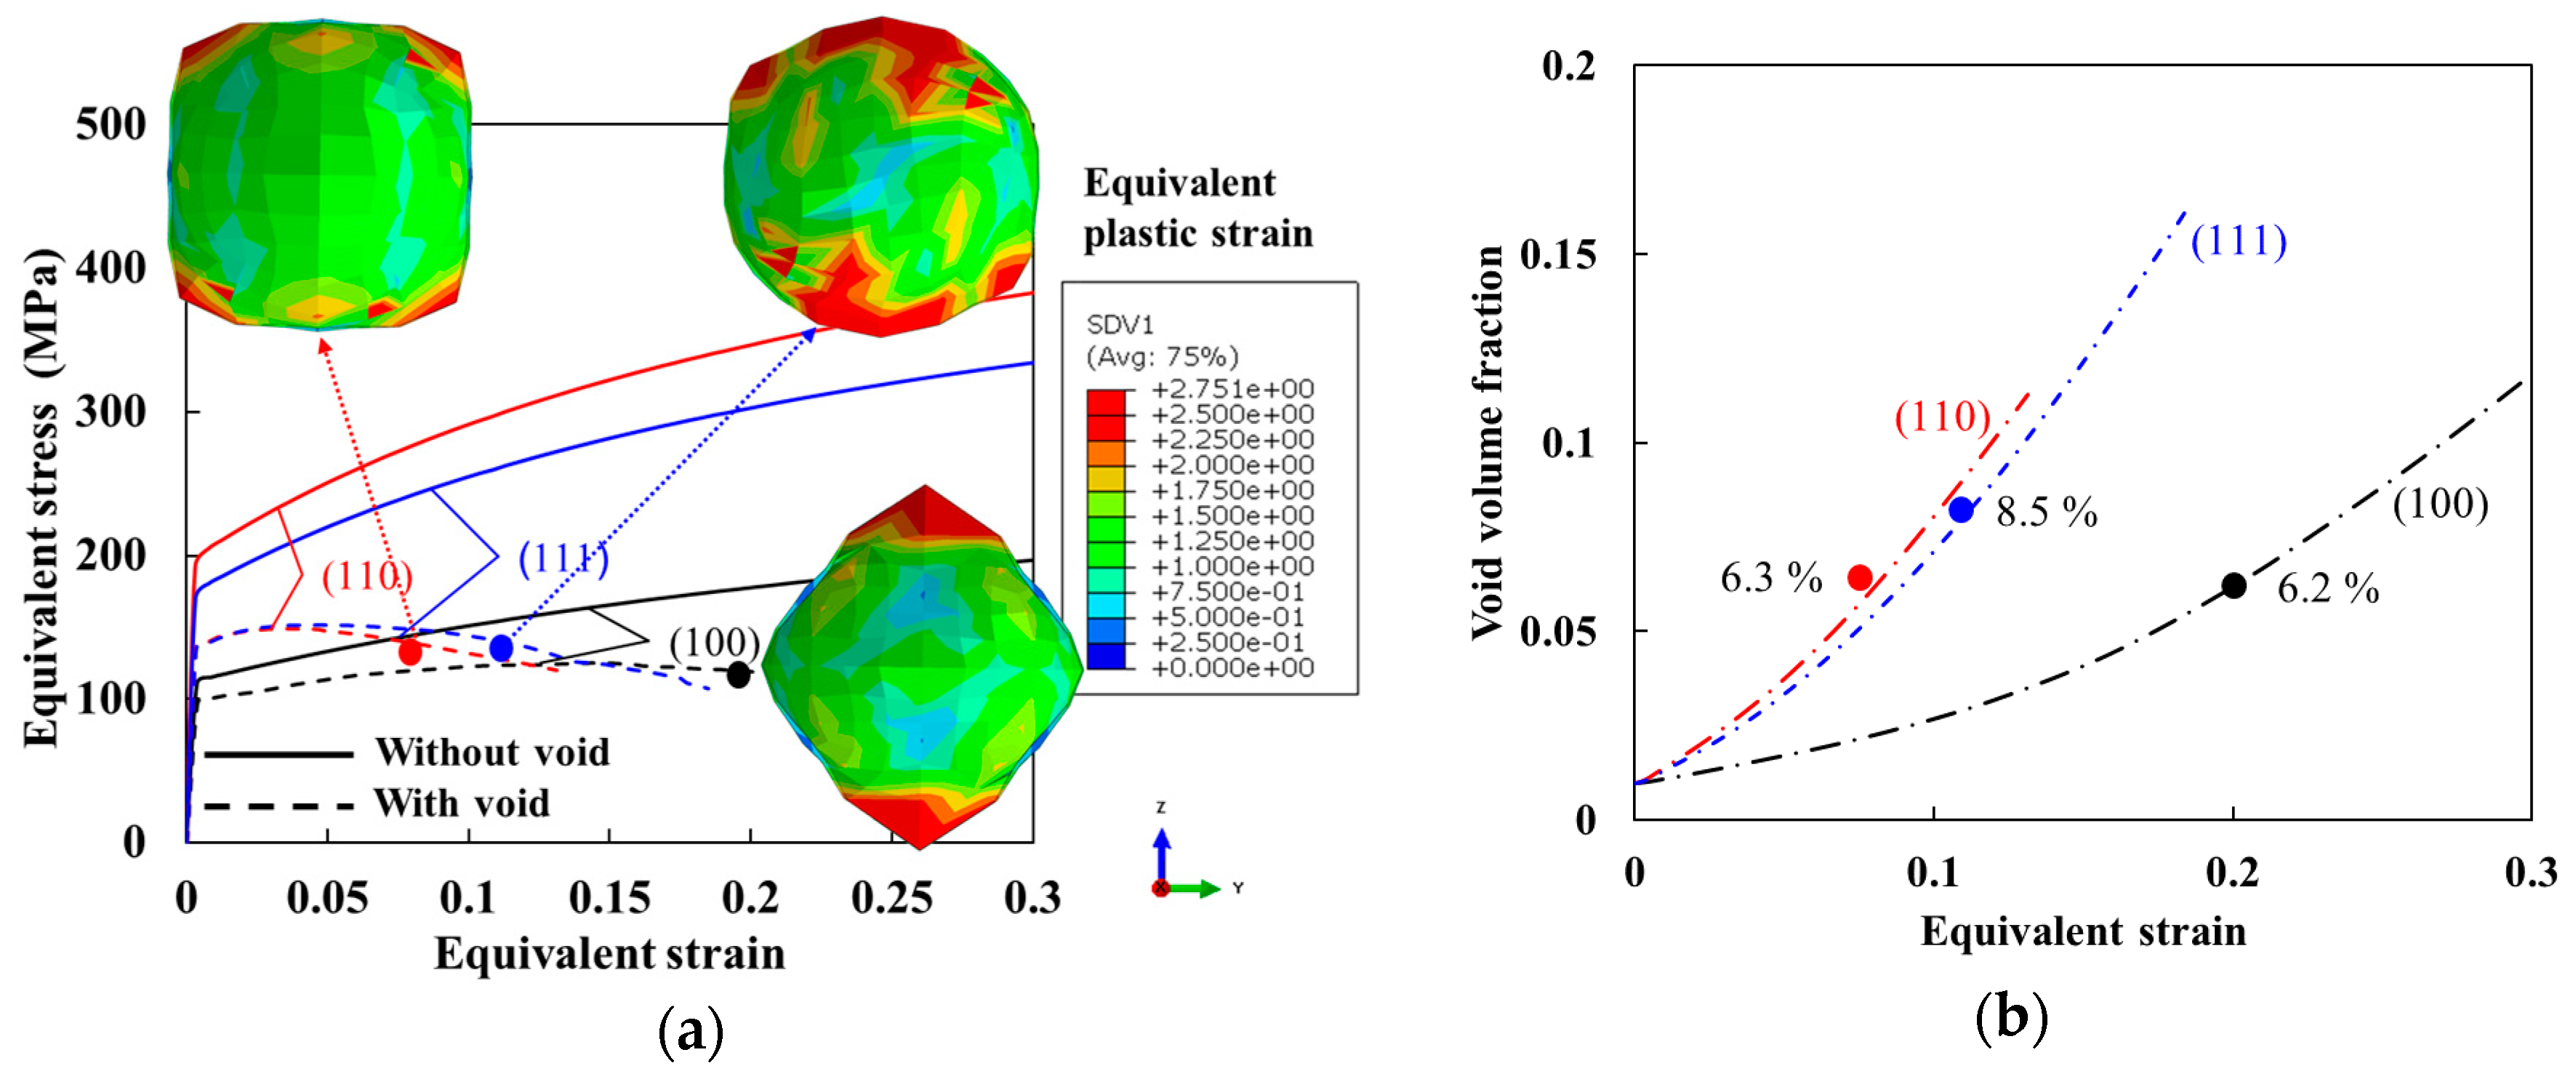
6.1. Effect of Grain Orientation on the Void Growth in Single Crystals

Figure 4a shows calculated stress–strain curves of single crystals with different orientations under a constant stress triaxiality of 1. For comparison purposes, the stress–strain curves of matrix (or those without a void) are also presented in the figure. All three stress–strain curves corresponding to (100), (110) and (111) orientations exhibited softening by the inclusion of the void. However, this softening is more pronounced on the order of (110), (111) and (100) orientations. Interestingly, almost negligible softening is observed for (100) orientation by the void inclusion. The order of softening is also correlated with the order of overall strength; i.e., if the strength of a grain (or single crystal) is higher, more softening is predicted. In the figure, the ultimate tensile strength (UTS) where the localization begins is also marked and the configuration of void at the UTS point is shown for each orientation of crystal. The configuration of void is represented by one layer elements that surround the void. The color in the figure represents the equivalent plastic strain. In Figure 4b, the rate of void growth is calculated by the void volume fraction change as a function of RVE equivalent strain in the loading direction. The RVE strain is defined as the nominal displacement divided by the initial length in the loading direction. From the figure, the rate of void growth is larger on the order of (110), (111) and (100) orientations. In addition, it is shown that the rate of void growth is accelerated after the UTS point and will result in failure by the coalescence with neighboring voids. The UTS points for (110), (111) and (100) crystals are 0.3, 0.4, and 0.6, respectively, which has an inverse relationship with the void growth rate.
In the simulation, the constant stress triaxiality was controlled by adjusting displacement boundary conditions along Z (loading) direction, which increased the RVE volume. Since the volume of the matrix is conserved during the plastic deformation, most of the volume change is subject to the void except small changes in the matrix by elastic deformation. For the three primary orientations, the amount of displacement along the loading direction was on the order of (110), (111) and (100), which corresponds to the order of void growth rate for the oriented crystals.
Similar observations were made for the void growths of the three considered orientations from the stress-strain curves with the stress triaxiality of 3 as shown in Figure 5a. However, the growth rate is much faster than those with the triaxiality of 1. The softening of crystal with (100) orientation is also critical compared to that with the triaxiality of 1, and the strain at the UTS point is much decreased. The order of growth rate for the three orientations is similar, but the difference between (110) and (111) orientations is not very distinctive compared to that for the stress triaxiality of 1.
Regarding the principal direction of the void growth, the current simulations resulted in the same observation as the previous work of Gurland (1972) [1], in which the void growth rate is fastest in the direction perpendicular to loading direction; i.e., Z direction in this study. As shown in Figure 4 and Figure 5, there is no outstanding void growth along the Z direction. However, note that the relative lengths of the cell along X, Y and Z directions differ according to the prescribed boundary condition and the length of the cell along Z direction is the shortest.

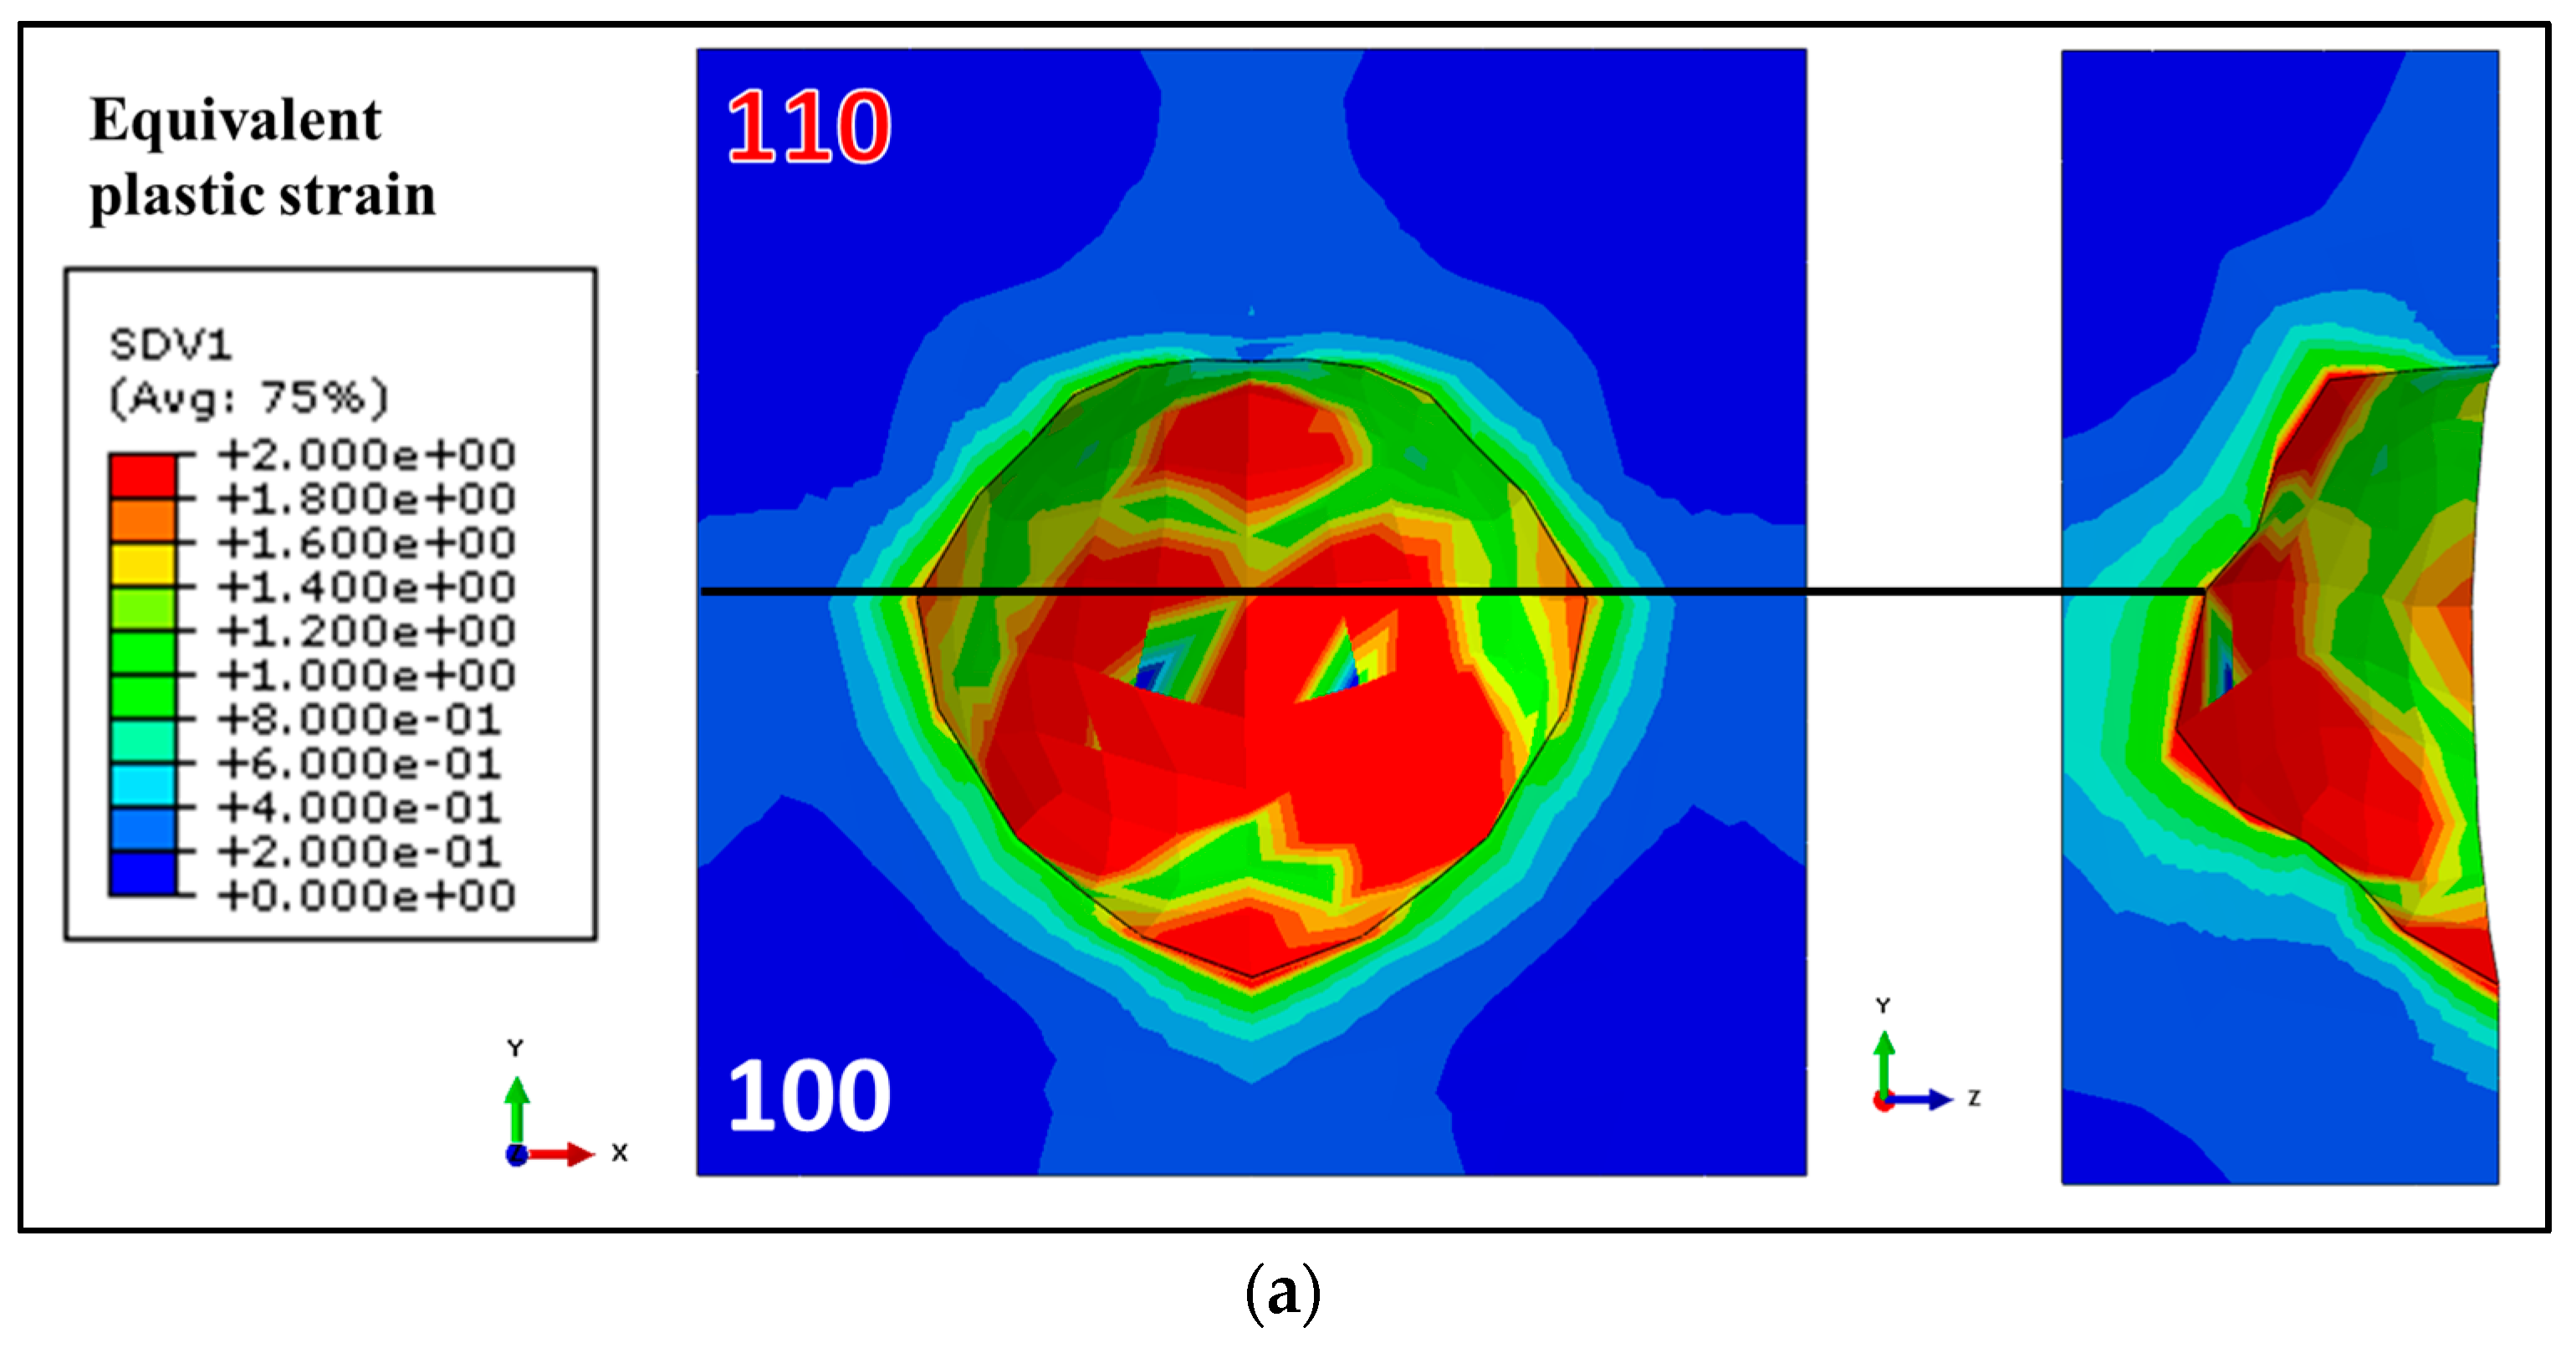
6.2. Effect of Inter-Grain Orientation on the Growth of Void Located at Grain Boundaries

To investigate the effect of inter-grain orientation difference on the growth of void, the void is located at the grain boundaries among three primary orientations as explained in the previous section. Figure 6 shows the deformed shapes of voids for different arrays of crystals in the XY plane, which is the plane normal to the loading direction Z in this study. Both loading conditions with triaxialities of 1 and 3 were simulated. The orientation of each crystal region is indicated in the figure. The various grain configurations consist of three or two different orientations, which is intentionally designed to represent voids located either at the grain boundary of bi-crystal or at the triple junction of tri-crystal. In the figures, the arrows with dots and solid lines indicate the directions for minimum and maximum void growth rates, respectively. For all cases, the void grows slowest toward (110) grain, which is the opposite observation compared to the single crystal case with void located inside the grain. Note that the (110) grain showed the maximum growth rate among the three orientations. Another interesting observation is that the maximum growth rate is always in the direction toward the (100) crystal, if included in the RVE. For the (111) crystals, it shows intermediate growth rate for the tri-crystals. The color in Figure 6 represents the equivalent plastic strain.
In Figure 7, the flow stresses simulated with the RVEs for different fractions of (100) orientation are shown for both triaxialities 1 and 3. As the volume fraction of the (100) crystal increases, the strength of the RVE decreases, while the void growth in (110) crystal is delayed. Therefore, the strain at the UTS point is elongated as the void growth is concentrated in the portion of (100) crystal that has the minimum growth rate in the single crystal simulation. The result is consistent with a commonly observed inverse relationship between strength and ductility of metallic materials.
For detailed analysis, the idealized bi-crystal, in which the (110) crystal is in the upper region, while (100) crystal is in the lower region of the considered RVE, was chosen. The shape and void growth rate were compared in the two orientations in Figure 8 where the solid line indicates the boundary between the two regions. Figure 8a shows the amount of deformation in the Z direction (loading direction) of the void in the RVE. Figure 8b represents elements surrounding the void in the RVE in 3D view after deformation. The grain boundary region was excluded for a better geometrical comparison between upper (110) and lower (100) crystals. Figure 8c shows the void growth rate of each crystal region in the bi-crystal RVE. The void growth rate in (100) crystal is almost two times higher than that of (110) crystal. Again, the color represents the equivalent plastic strain where the red color denotes the high strain region.
Figure 9a shows the growth rate of void embedded in (110) single crystal, (100) single crystal and (110)-(100) bi-crystal as a function of RVE macroscopic strain. For voids in single crystals, the growth rate of void in (110) crystal is much higher than that of (100) crystal, which was already observed in the previous result. Figure 9b shows the averaged effective strains in single layer elements surrounding each void with respect to the RVE macroscopic strain for the stress triaxiality of 3. The average strains of elements surrounding the voids are significantly larger than that of corresponding macroscopic strain, which explains considerable local deformation due to the void growth effect. The average strains in surrounding elements of both (100) and (110) crystal regions in the (110)-(100) bi-crystal were also calculated as shown in Figure 9b. As clearly indicated in the figure, considerable increase of deformation in (100) crystal could be observed when the crystal co-exists with (110) crystal. On the contrary, the deformation of (110) decreased in the (110)-(100) bi-crystal compared to that in (110) single crystal. As previously discussed, the flow stress (or strength) of (110) single crystal is larger than that of (100) crystal for a given triaxiality and boundary condition. Therefore, the deformation in the bi-crystal consisting of orientations for two distinct strengths was accelerated in the softer grain, which increased the relative growth rate in (100) crystal. Note that the overall growth rate in the bi-crystal did not exceed the growth rate in (110) single crystal. The results from the current numerical analysis have great importance in understanding the void growth mechanism in polycrystalline metals: the void grows due to the hydrostatic stress component of the prescribed stress state, but it is highly cross-linked with the crystallographic orientation of surrounding crystals. In general, the rate of void growth has preferred orientation in a single crystal, for example, (110) orientation in this study, but the rate can be significantly different when other orientations of neighboring crystals, especially (100) orientation, are considered.

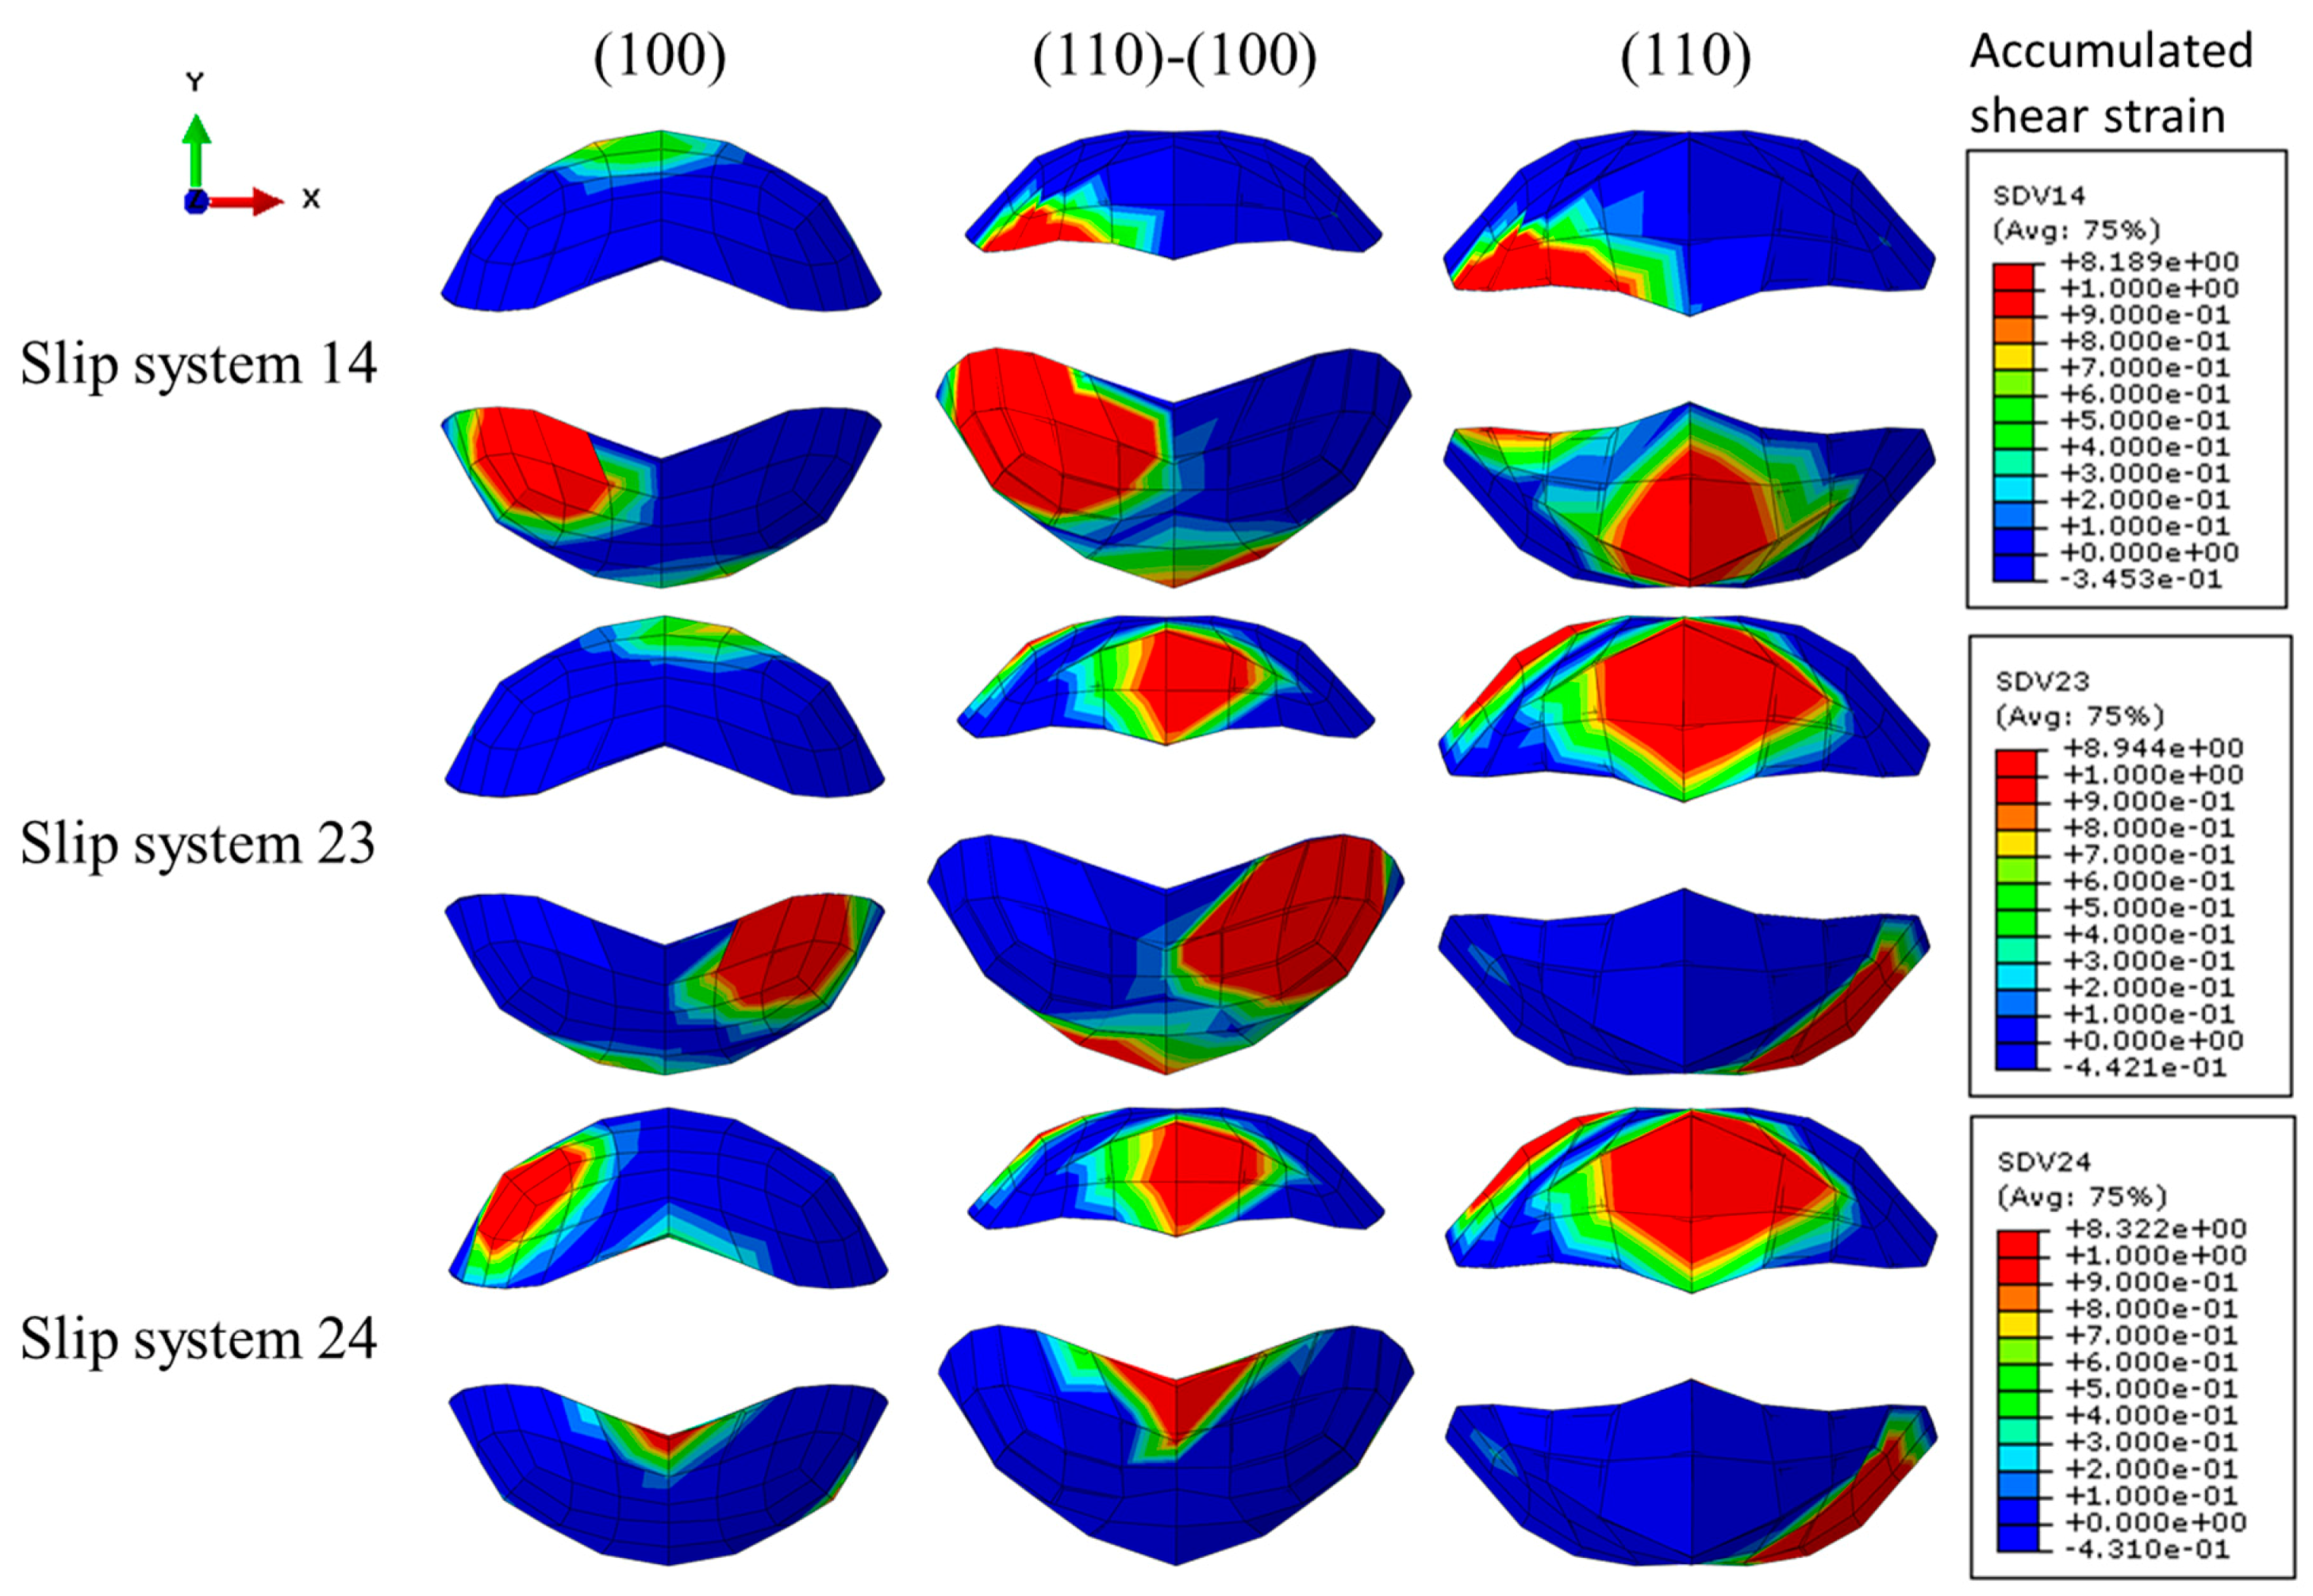
6.3. Slip System Activity (Resolved Sheaer Strain on the Slip Systems) in the RVE

The flow stress of (110) single crystal in the simple tension is not higher than that of (100) single crystal. However, the boundary condition applied in this study is different from the simple tension. That is, a tensile load is prescribed along the Z direction, while the strain in the Y direction is negligible and the strain in the X direction is negative. Thus, the deformation mode is similar to the plane strain condition. This boundary condition was intentionally adopted to represent the favorable fracture at higher stress triaxiality. Unfavorable slip systems under simple tension for (110) crystal are activated to satisfy the prescribed boundary condition, which increases the flow stress of (110) single crystal under the considered constant stress triaxiality.
Further analysis is provided here by investigating the slip activities (or activation of shear stress on preferred slip systems) in different crystals neighboring the embedded void. For simple compression along the Z direction for (110) crystal without a void, six slip systems (5, 6, 11, 12, 16, 22 slip systems in Table 1) are activated with the highest Schmid factor for the slip systems 16 and 22. The number of the activated slip systems increases as the stress triaxiality increases. For example, additional six slip systems (2, 3, 8, 9, 13, 19 slip systems in Table 1) are activated when the stress triaxiality is increased to 1. The activation of the slip system is further complicated when the void is embedded in the single crystal or at the boundary of bi-crystal. Almost all slip systems among 24 bcc slip systems are activated near the void region. For more detailed analysis on the deformation behavior in the RVE, cumulative shear strains by the slip system activation in the elements surrounding a void are analyzed. Three cases—(100) single crystal, (110) single crystal and (110)-(100) bi-crystal—are considered. In Figure 10, accumulated shear strains of all 24 slip systems are presented in the elements surrounding the void for the similar value of averaged RVE strain in the single and bi-crystals under the stress triaxiality of 3. Figure 10a,c show the accumulated shear strains of the elements along a void in (100) and (110) single crystals, respectively, while Figure 10b,d show those for the elements along a void in (100) and (110) crystals in the (100)-(110) bi-crystal, respectively. The figures show that the slip systems activated in the same crystal orientation, that is the (100) or (110) crystals in both single crystal and bi-crystal, are the same, but the absolute magnitudes are quite different whether it is included in the single or bi-crystal. An interesting observation is that the magnitude of the accumulated shear strains of (110) region in single crystal and (100) region in the bi-crystal are similar in an average sense. This elucidates that slip activities in the multi-crystals can be different from those in single crystals due to the relative difference in strength, and softer crystal accommodates a larger part of plastic deformation corresponding to the prescribed macroscopic deformation. Figure 11 also supports the fact that the preferred slip systems in single crystals are preserved in the region of the same orientation of the bi-crystal. In this figure, as an example, the accumulated shear strains in three slip systems, 14, 23 and 24 are shown in the elements surrounding a void for (100), (110) single crystals and (100)-(110) bi-crystal. It is clear that the intensity of the slip activity is different, but the activated slip systems are almost the same between single and bi-crystal.

7. Conclusions

In this study, an RVE approach incorporating the rate-dependent crystal plasticity finite element simulation was introduced to explore the characteristics of the void growth embedded in the ductile metal matrix. Unlike the previous similar numerical studies, the current study investigated the effect of orientation relationship between two or three adjacent crystals on the growth of void during large plastic deformation. Two different stress triaxialities were considered as boundary conditions, which were maintained as constants during the deformation of the RVE. The simulations showed that the rate of void growth had preferred orientation when embedded in a single crystal, while it could be significantly deviated when other orientations of neighboring crystals were included. The followings are detailed conclusions made from the numerical simulations for a generic bcc model material.
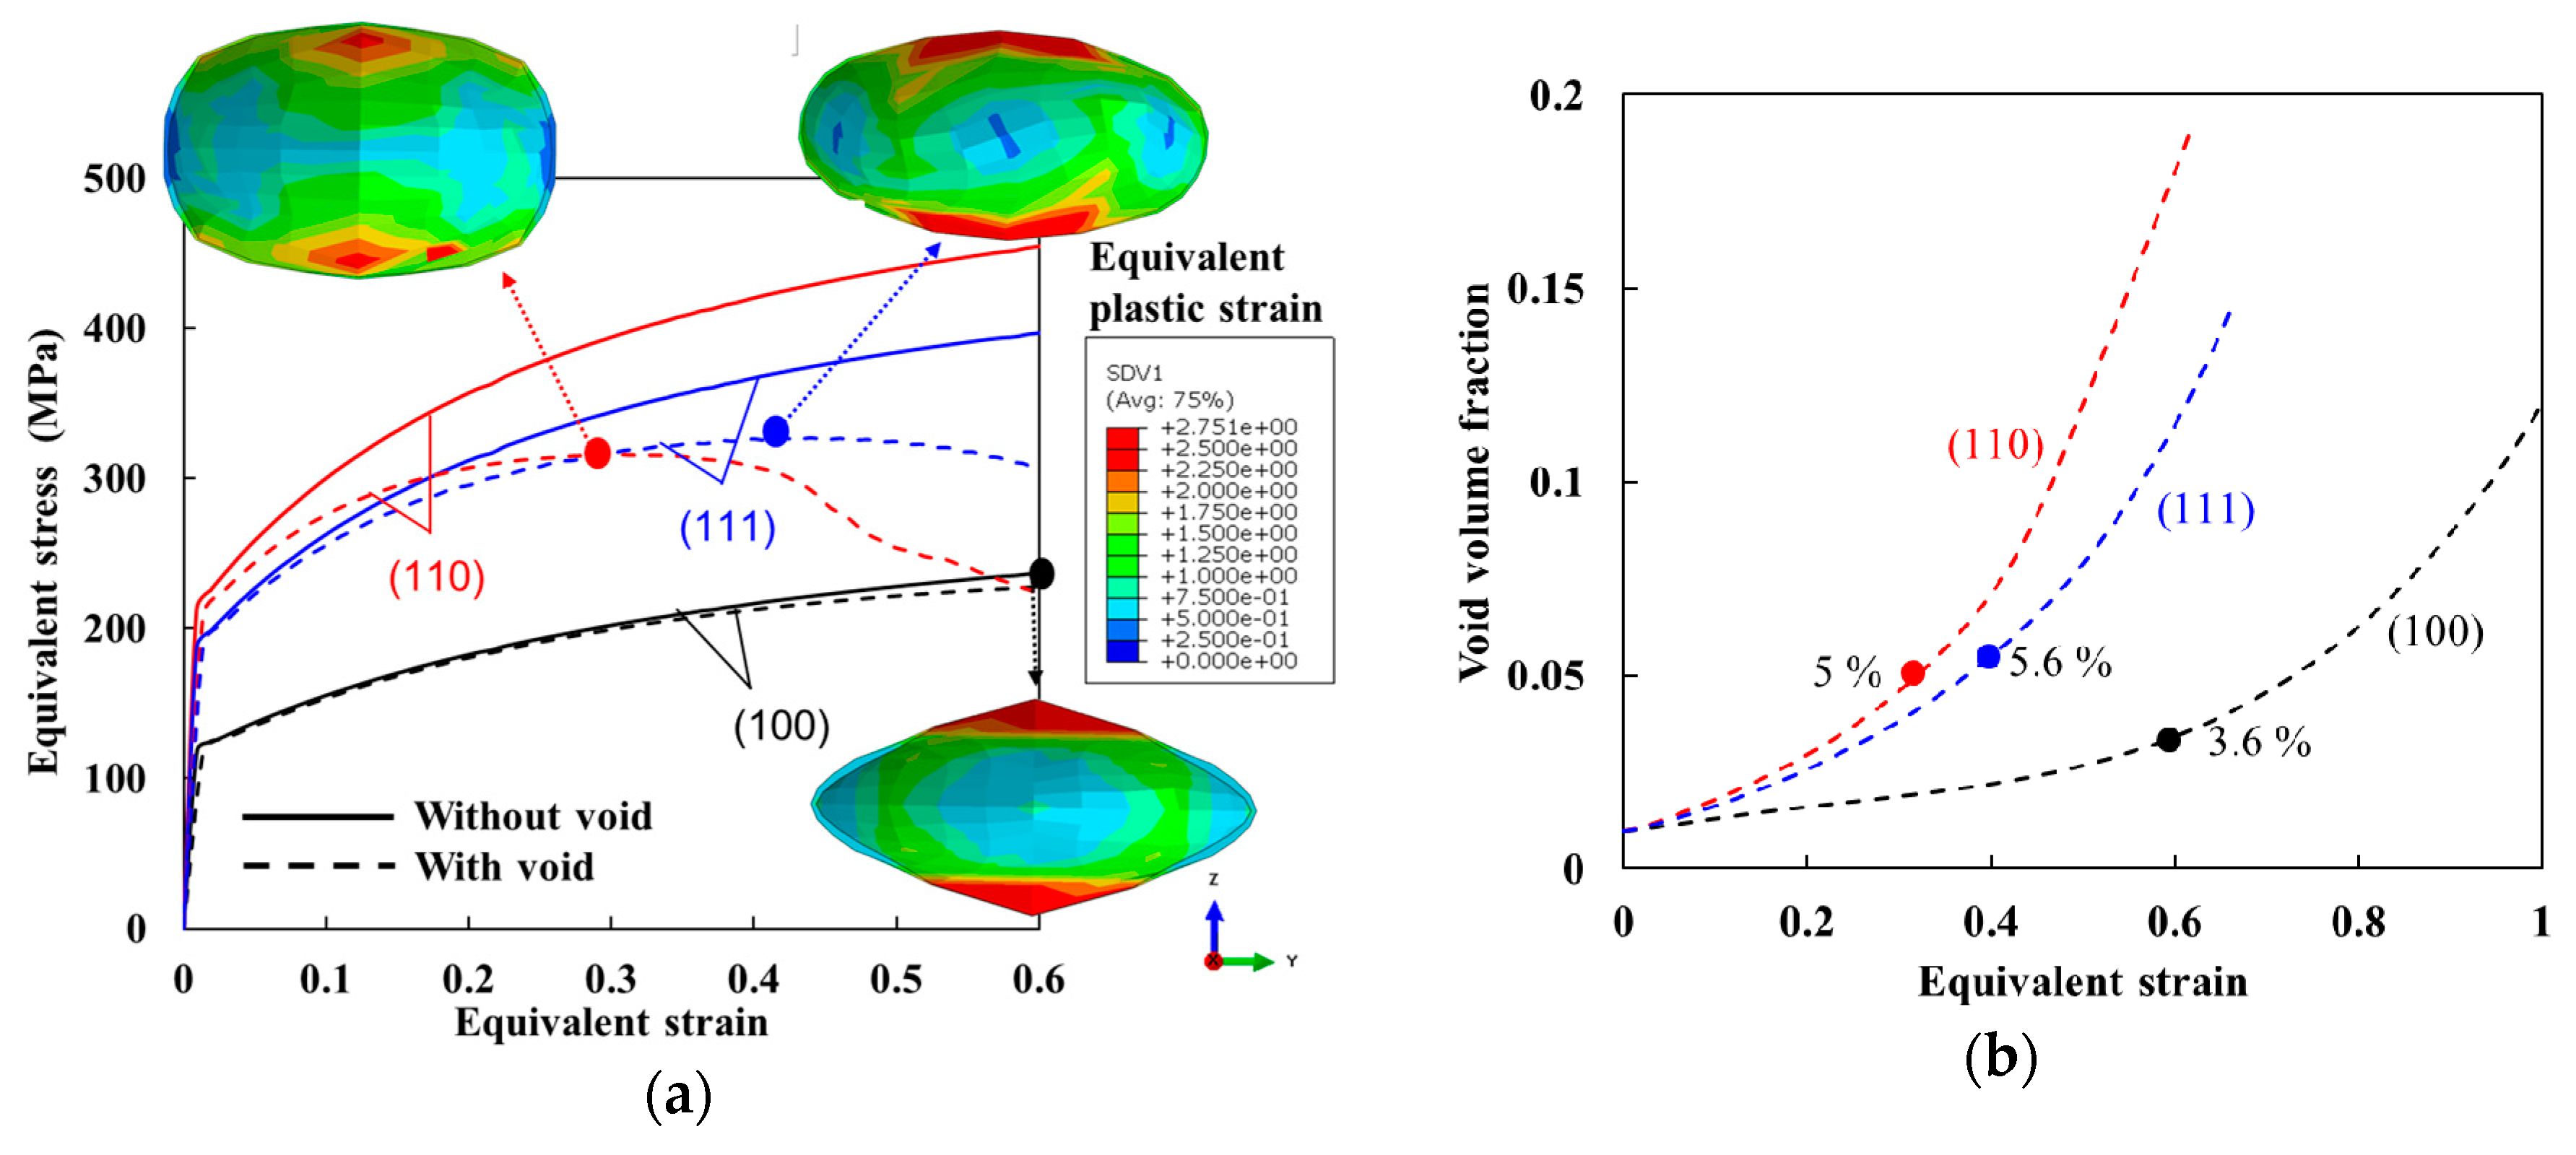
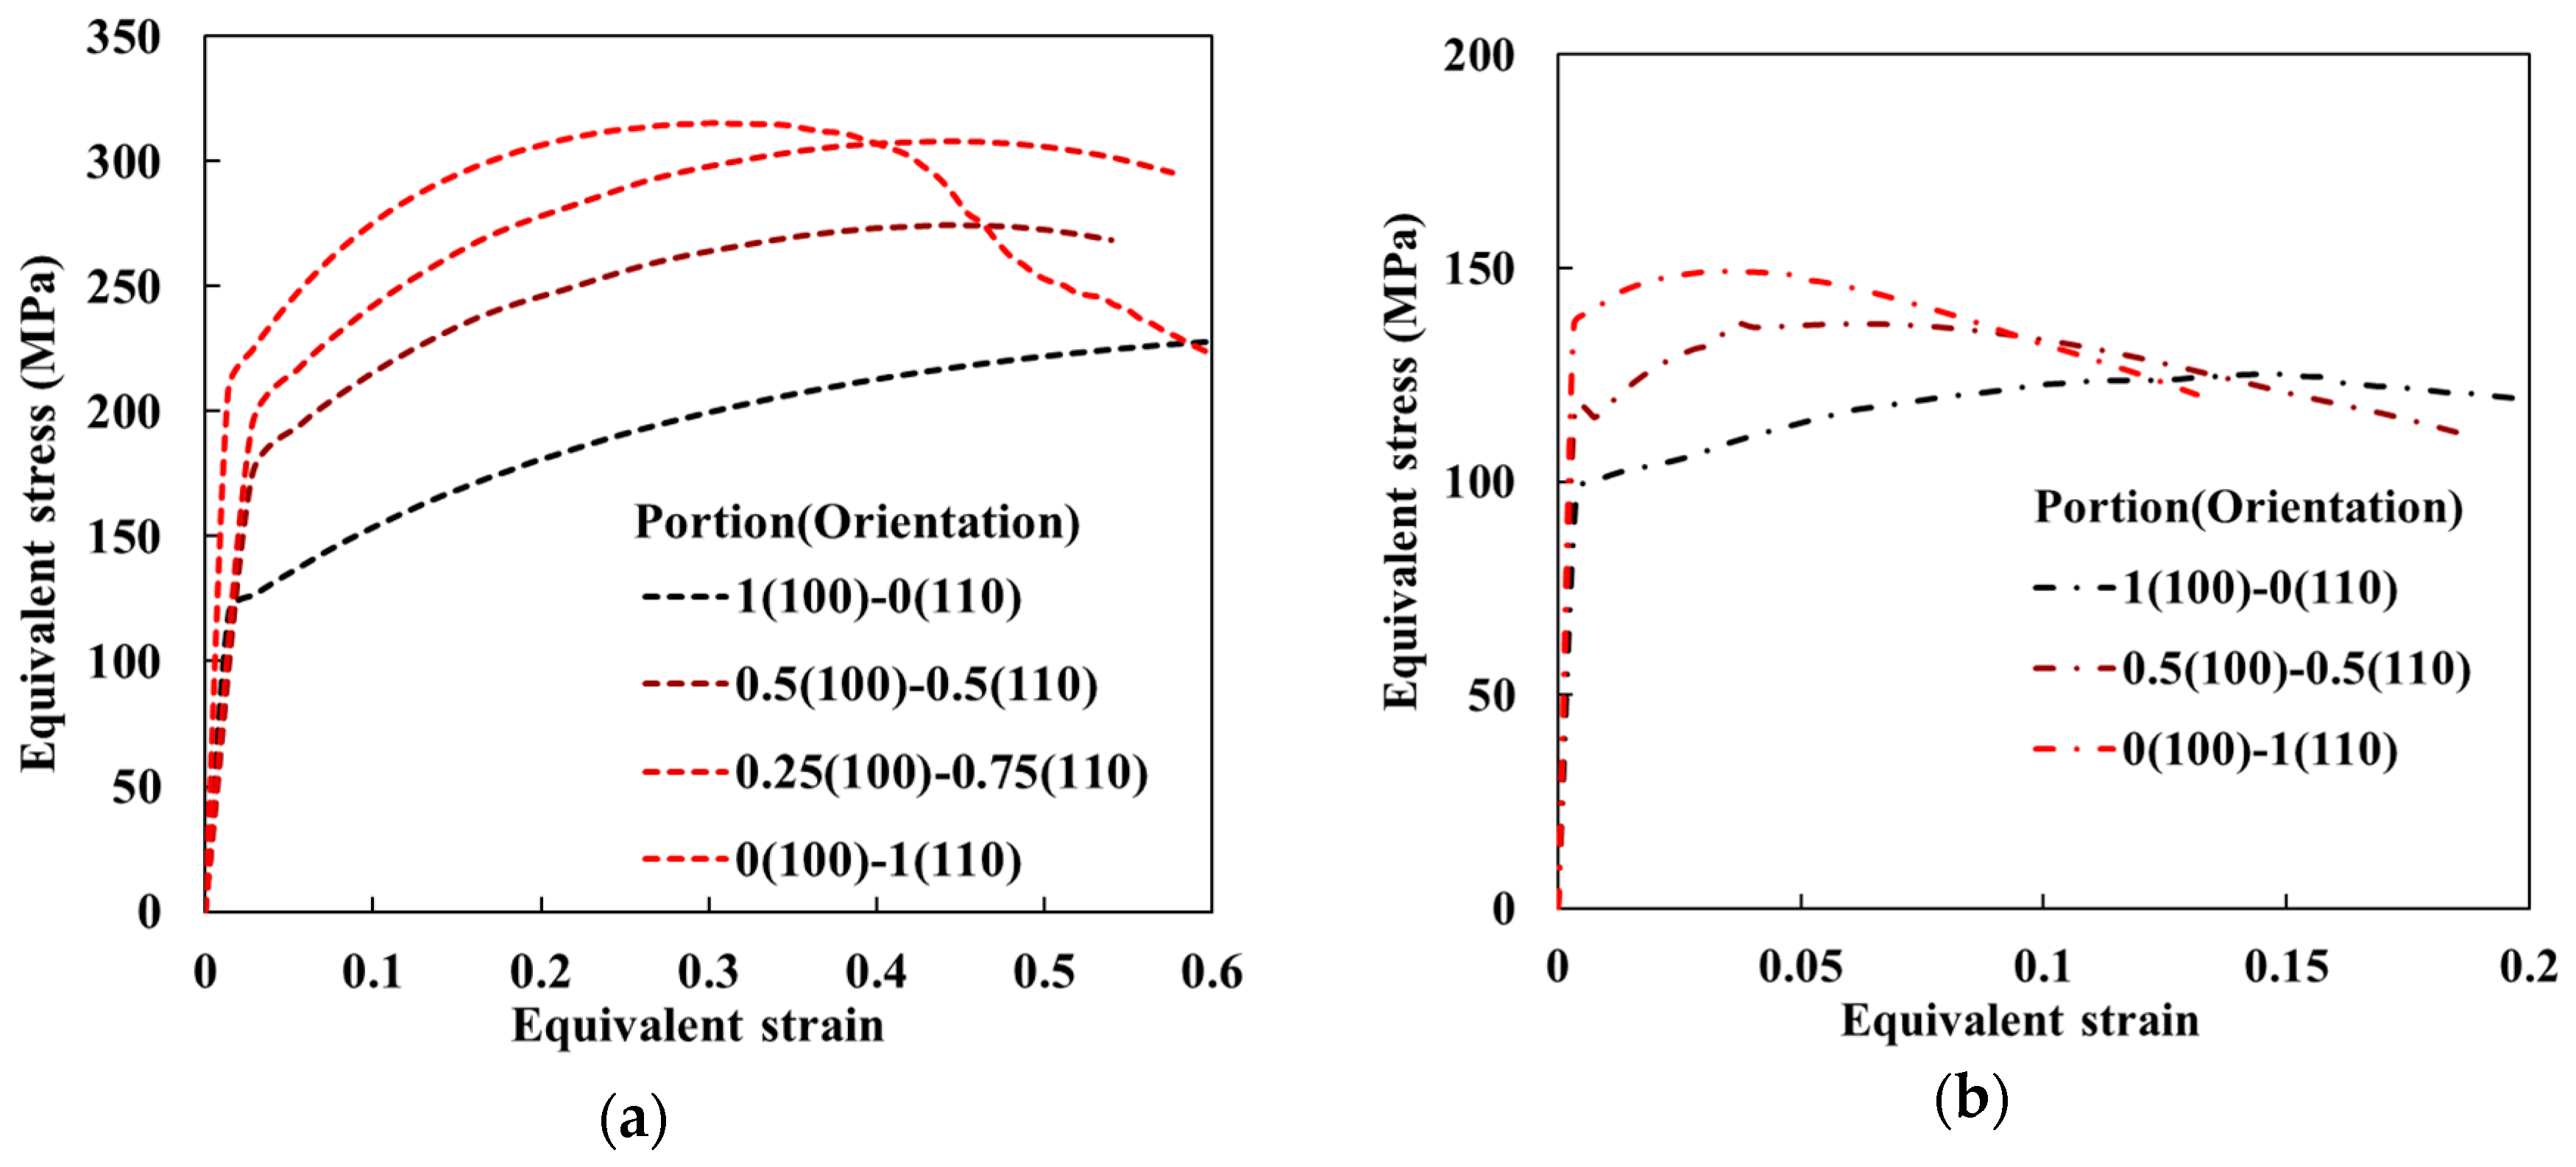
  • The RVE simulations with a rate-dependent crystal plasticity model could reproduce the orientation dependent single crystal flow stress behavior of the bcc metal under two distinct constant stress triaxialities as reported in the previous work by Yerra et al. [13] and as observed in general bcc metals. In other words, the crystal with the highest flow stress resulted in the earliest localization (or least uniform elongation corresponding to UTS point), while delayed localization for the lower flow stress when a void is included in the RVE.
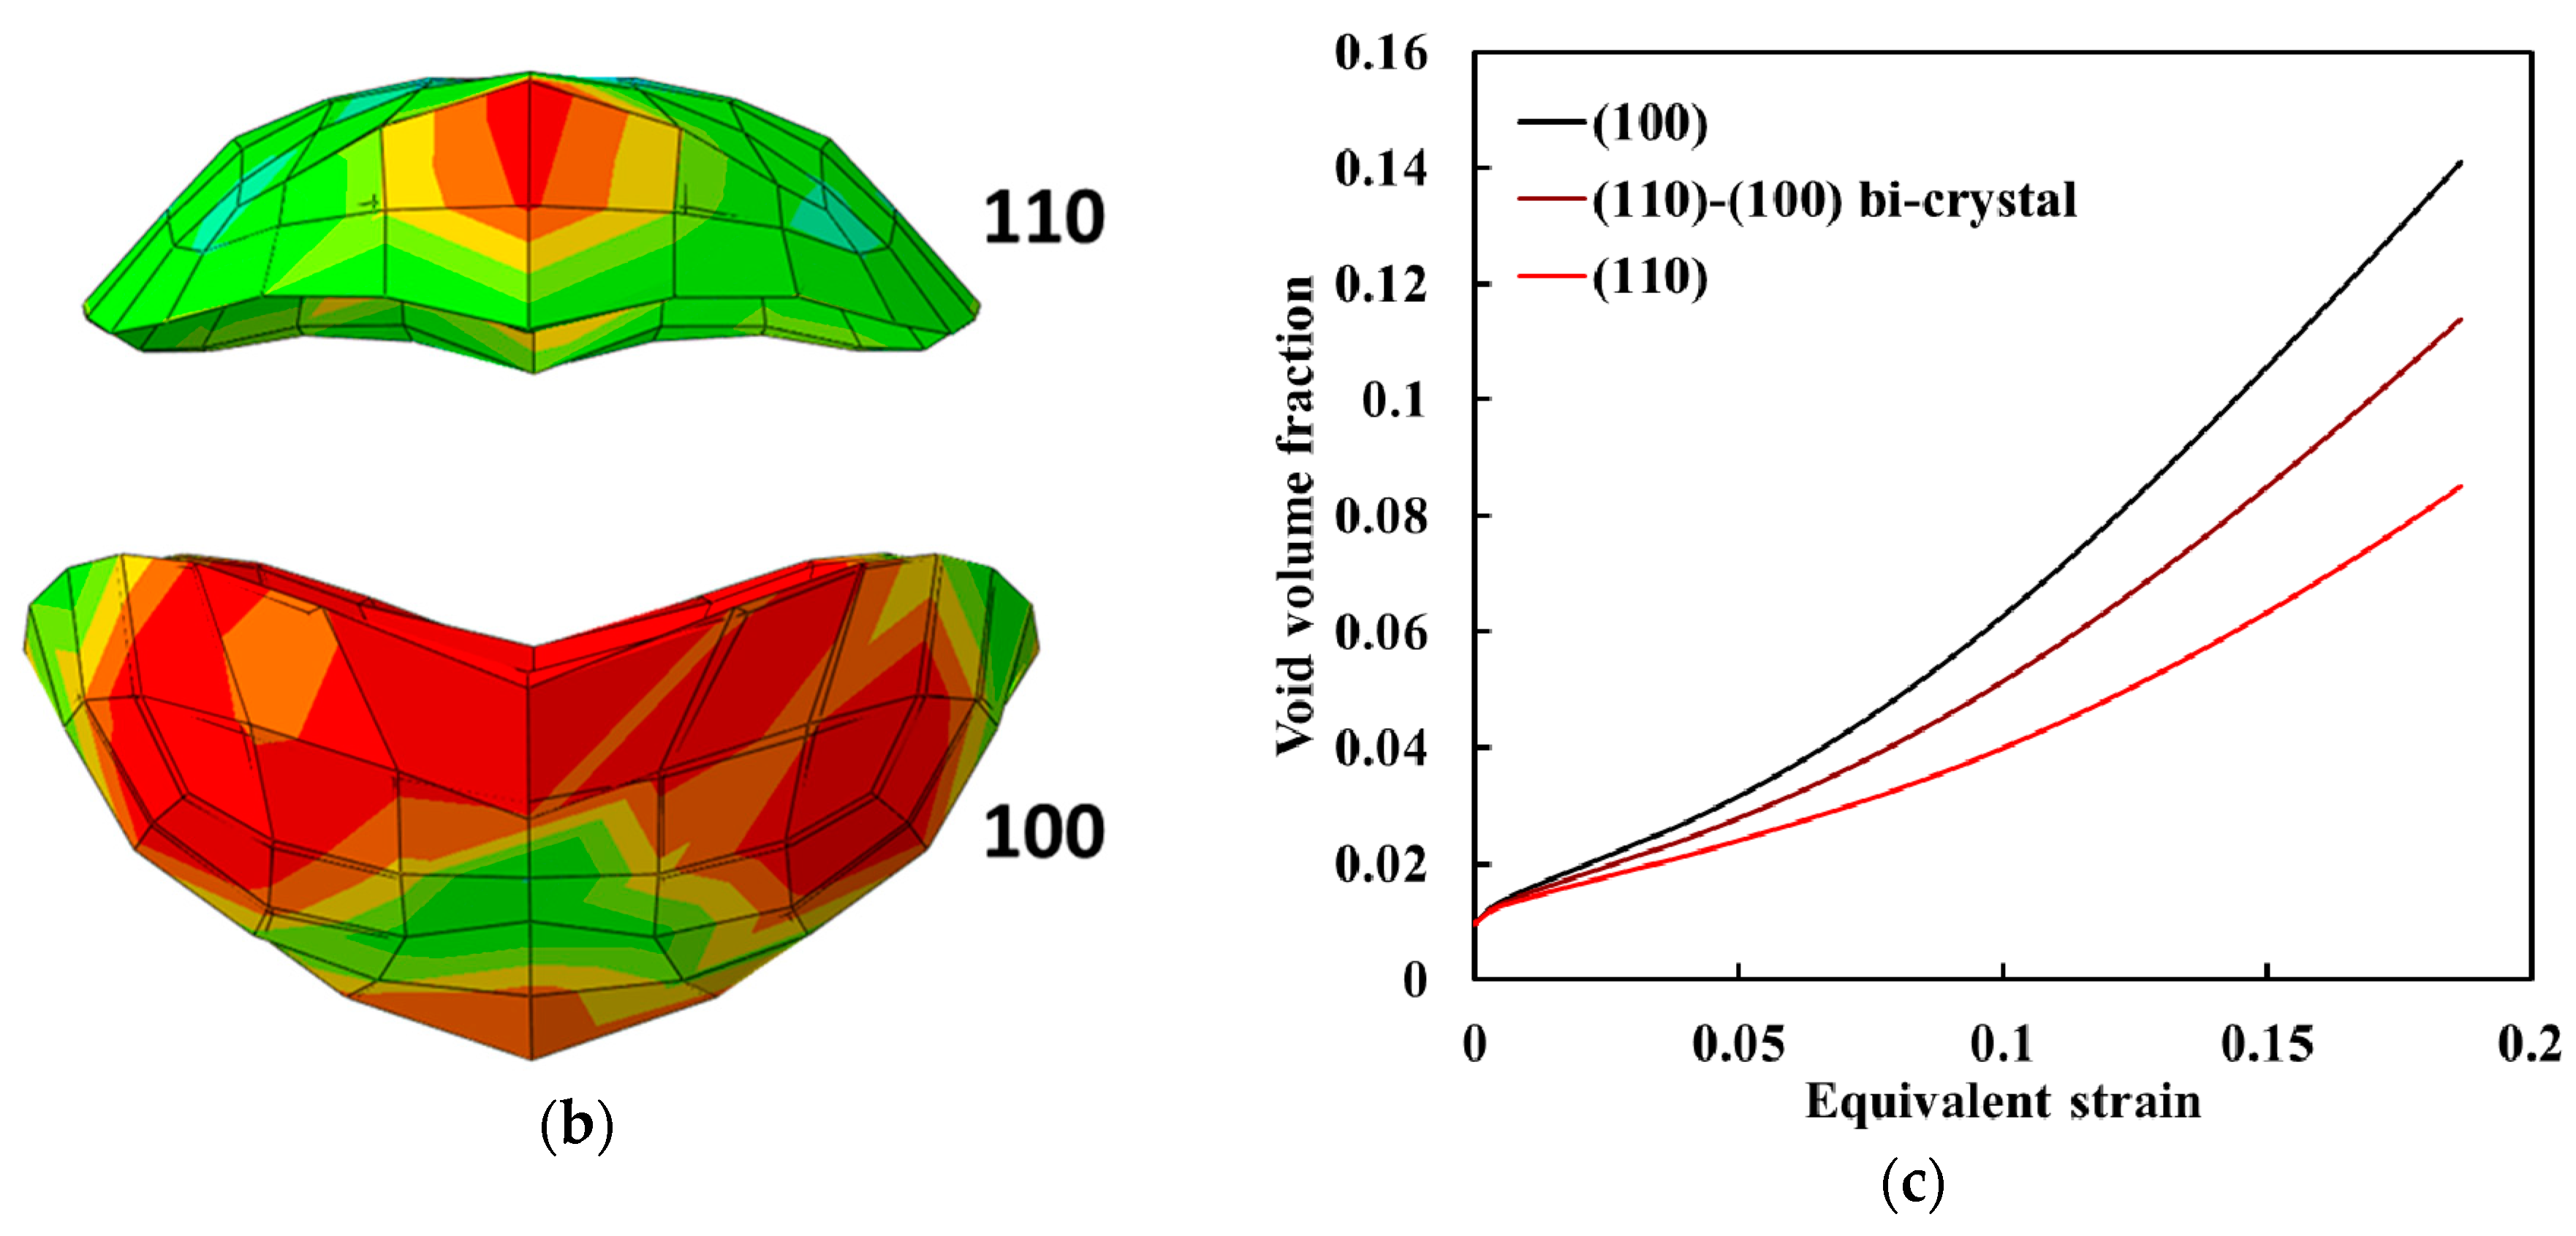
  • The growth rate of a void in the single crystal is highly dependent on the crystal orientation and the rate is on the order of (110), (111) and (100) orientations for the present study. The growth rate is accelerated as the stress triaxiality increases, which has been commonly known in the ductile fracture analysis.
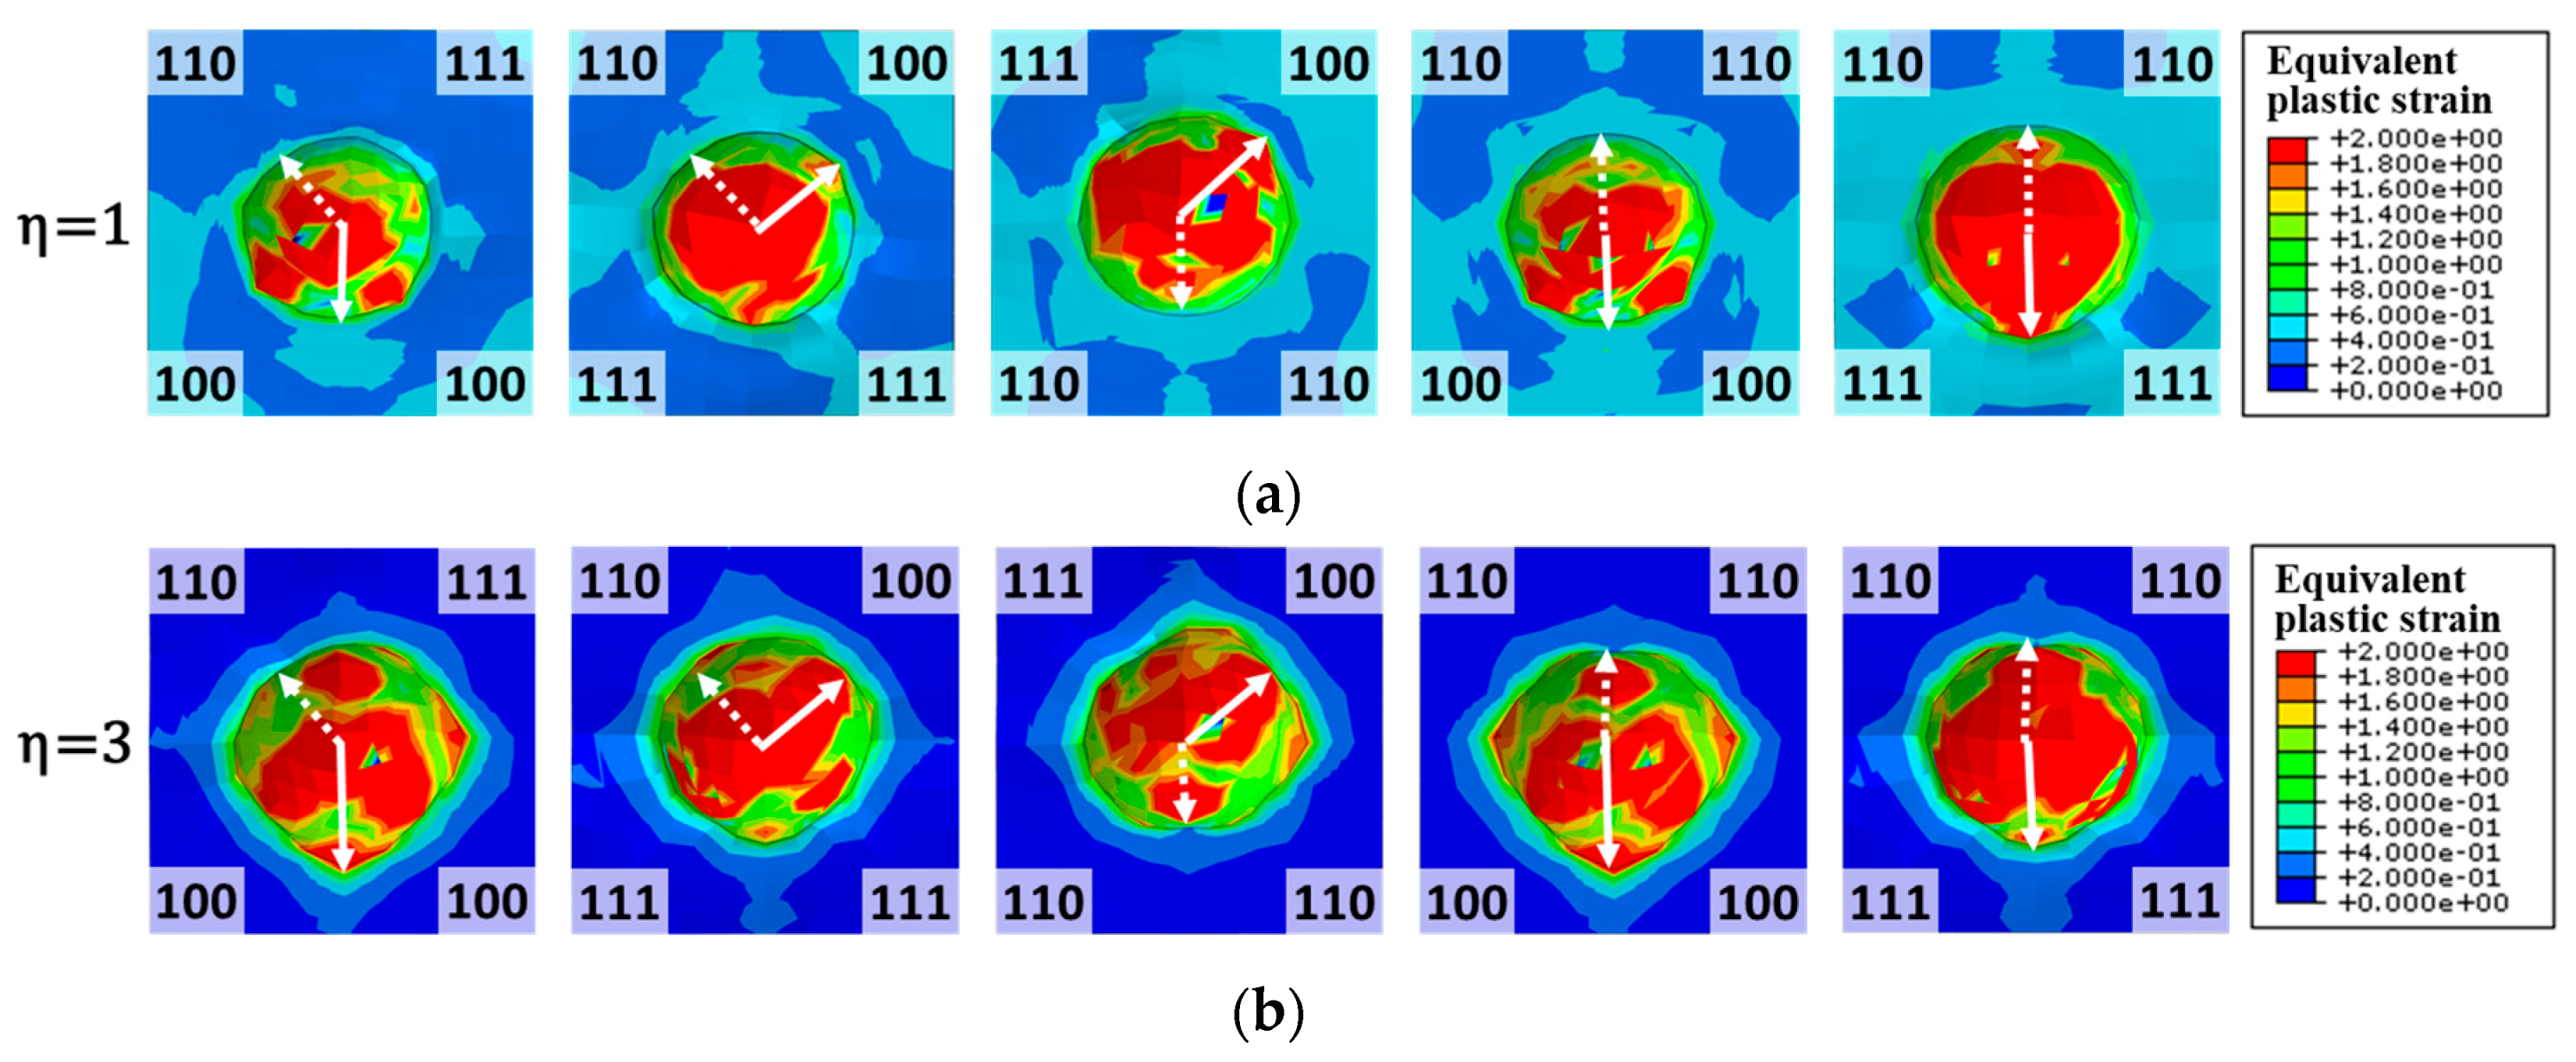
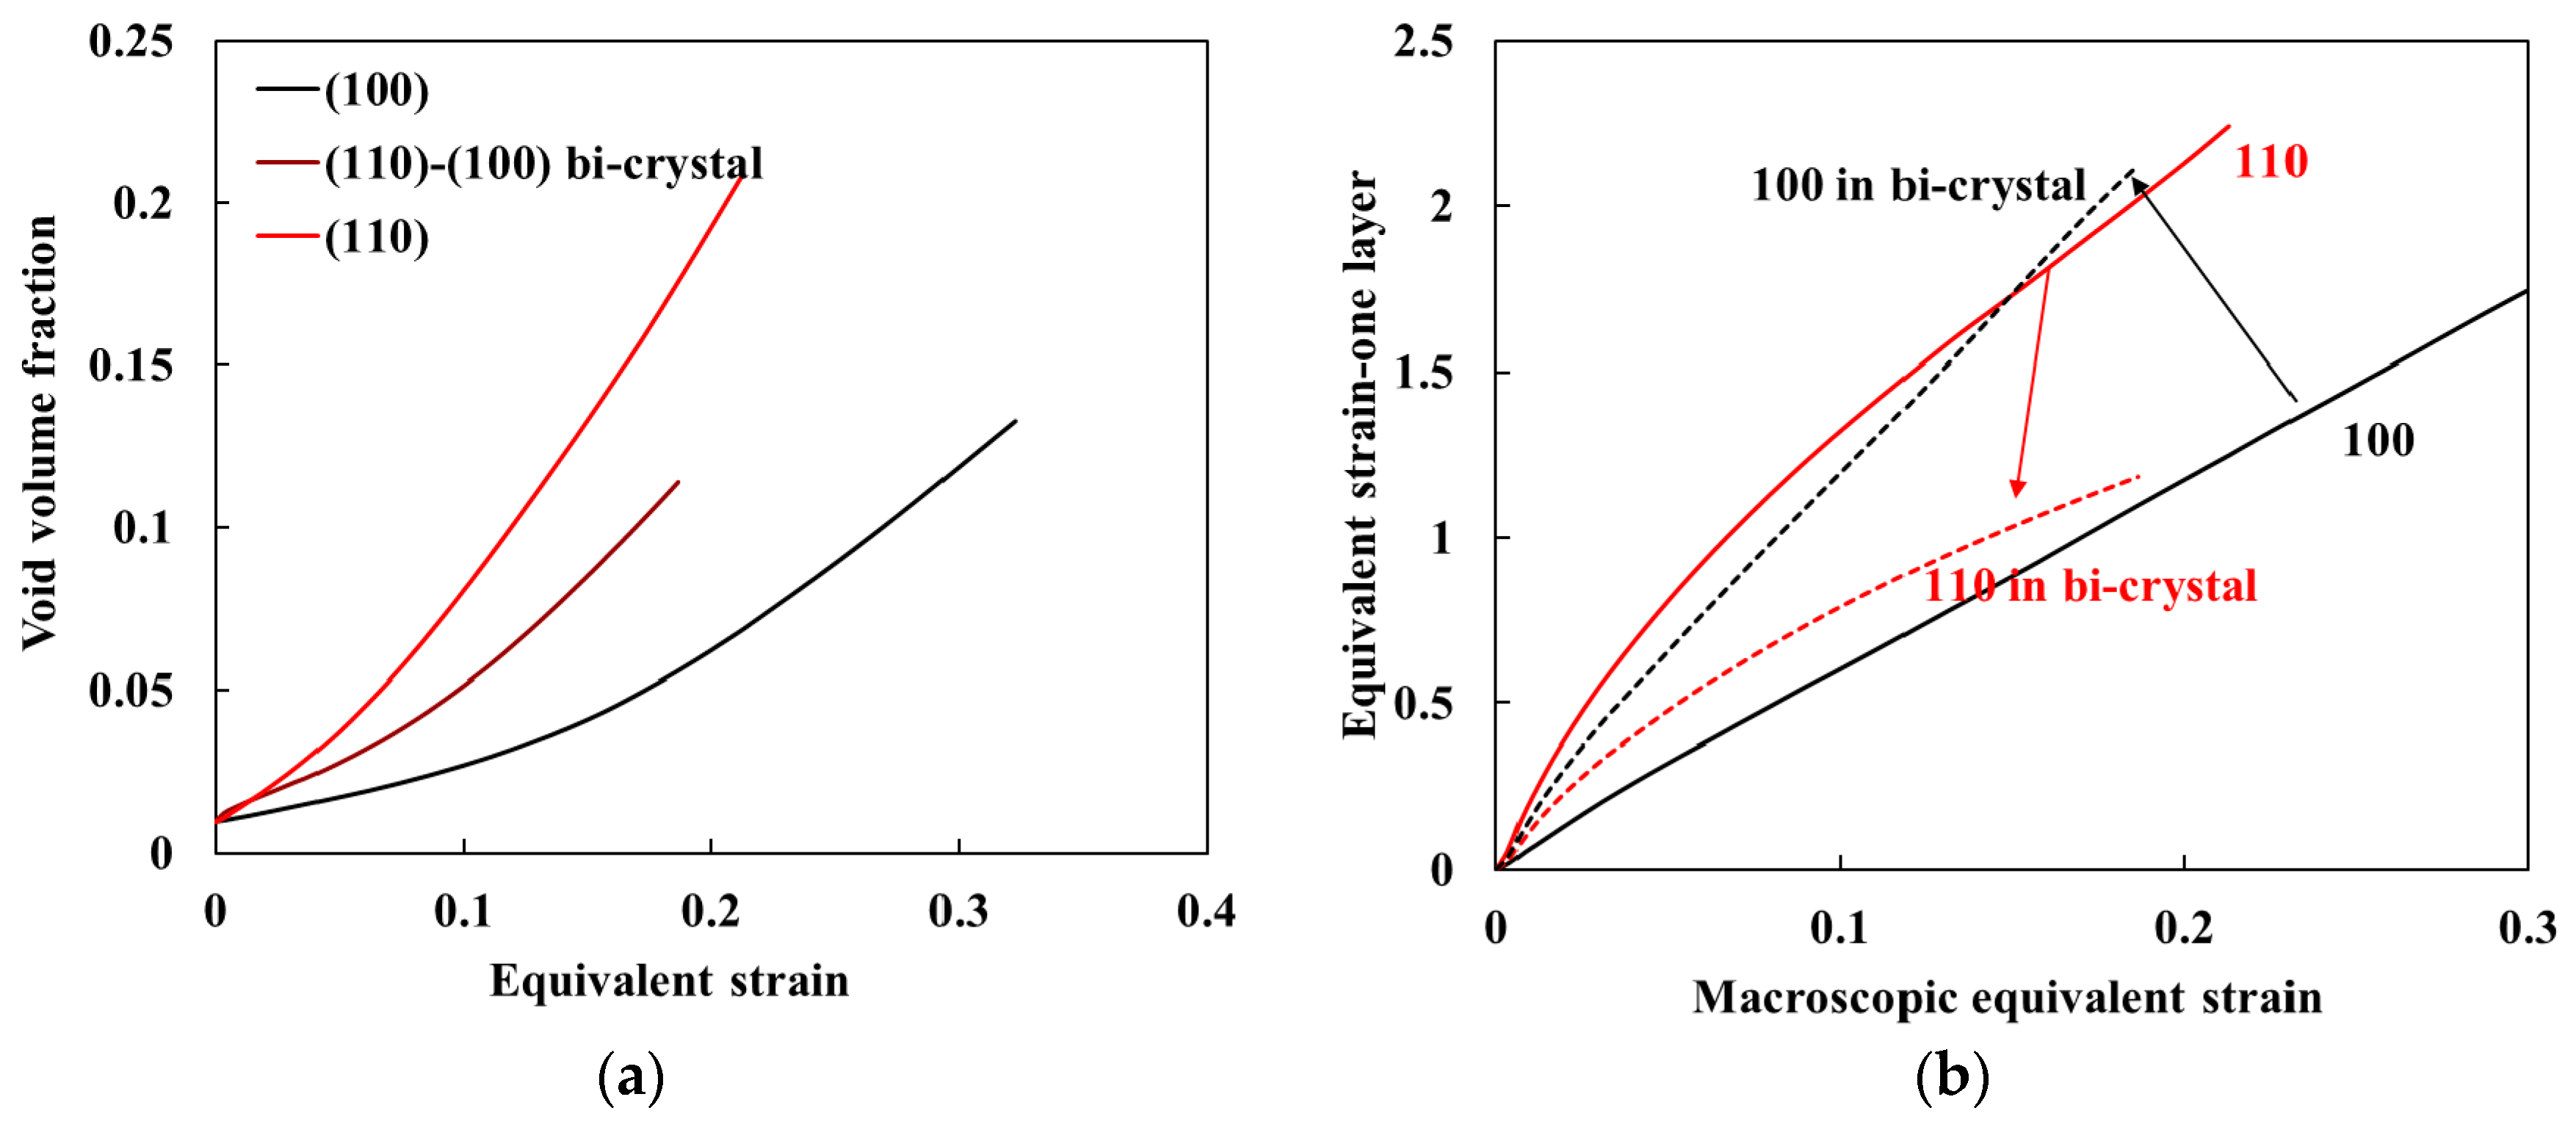
  • When a void is located at the boundary of bi-crystal or at the triple junction of a tri-crystal, the growth rate of a void shows considerable dependence on the orientation relationship among constituent crystals. For all cases with mixed (100), (111), and (110) orientations, the maximum growth rate of a void is in the (100) crystal and the lowest is in the (110) direction, which contradicts the single crystal cases. This difference of void growth rate in single crystal and multi-crystal is attributed to the relative strength differential between grains with specific orientations. For example, for the given boundary conditions, the flow stresses of (110) and (100) crystals represent highest and lowest values and the deformation is highly concentrated in the softer (100) crystal when the two crystals co-existed.
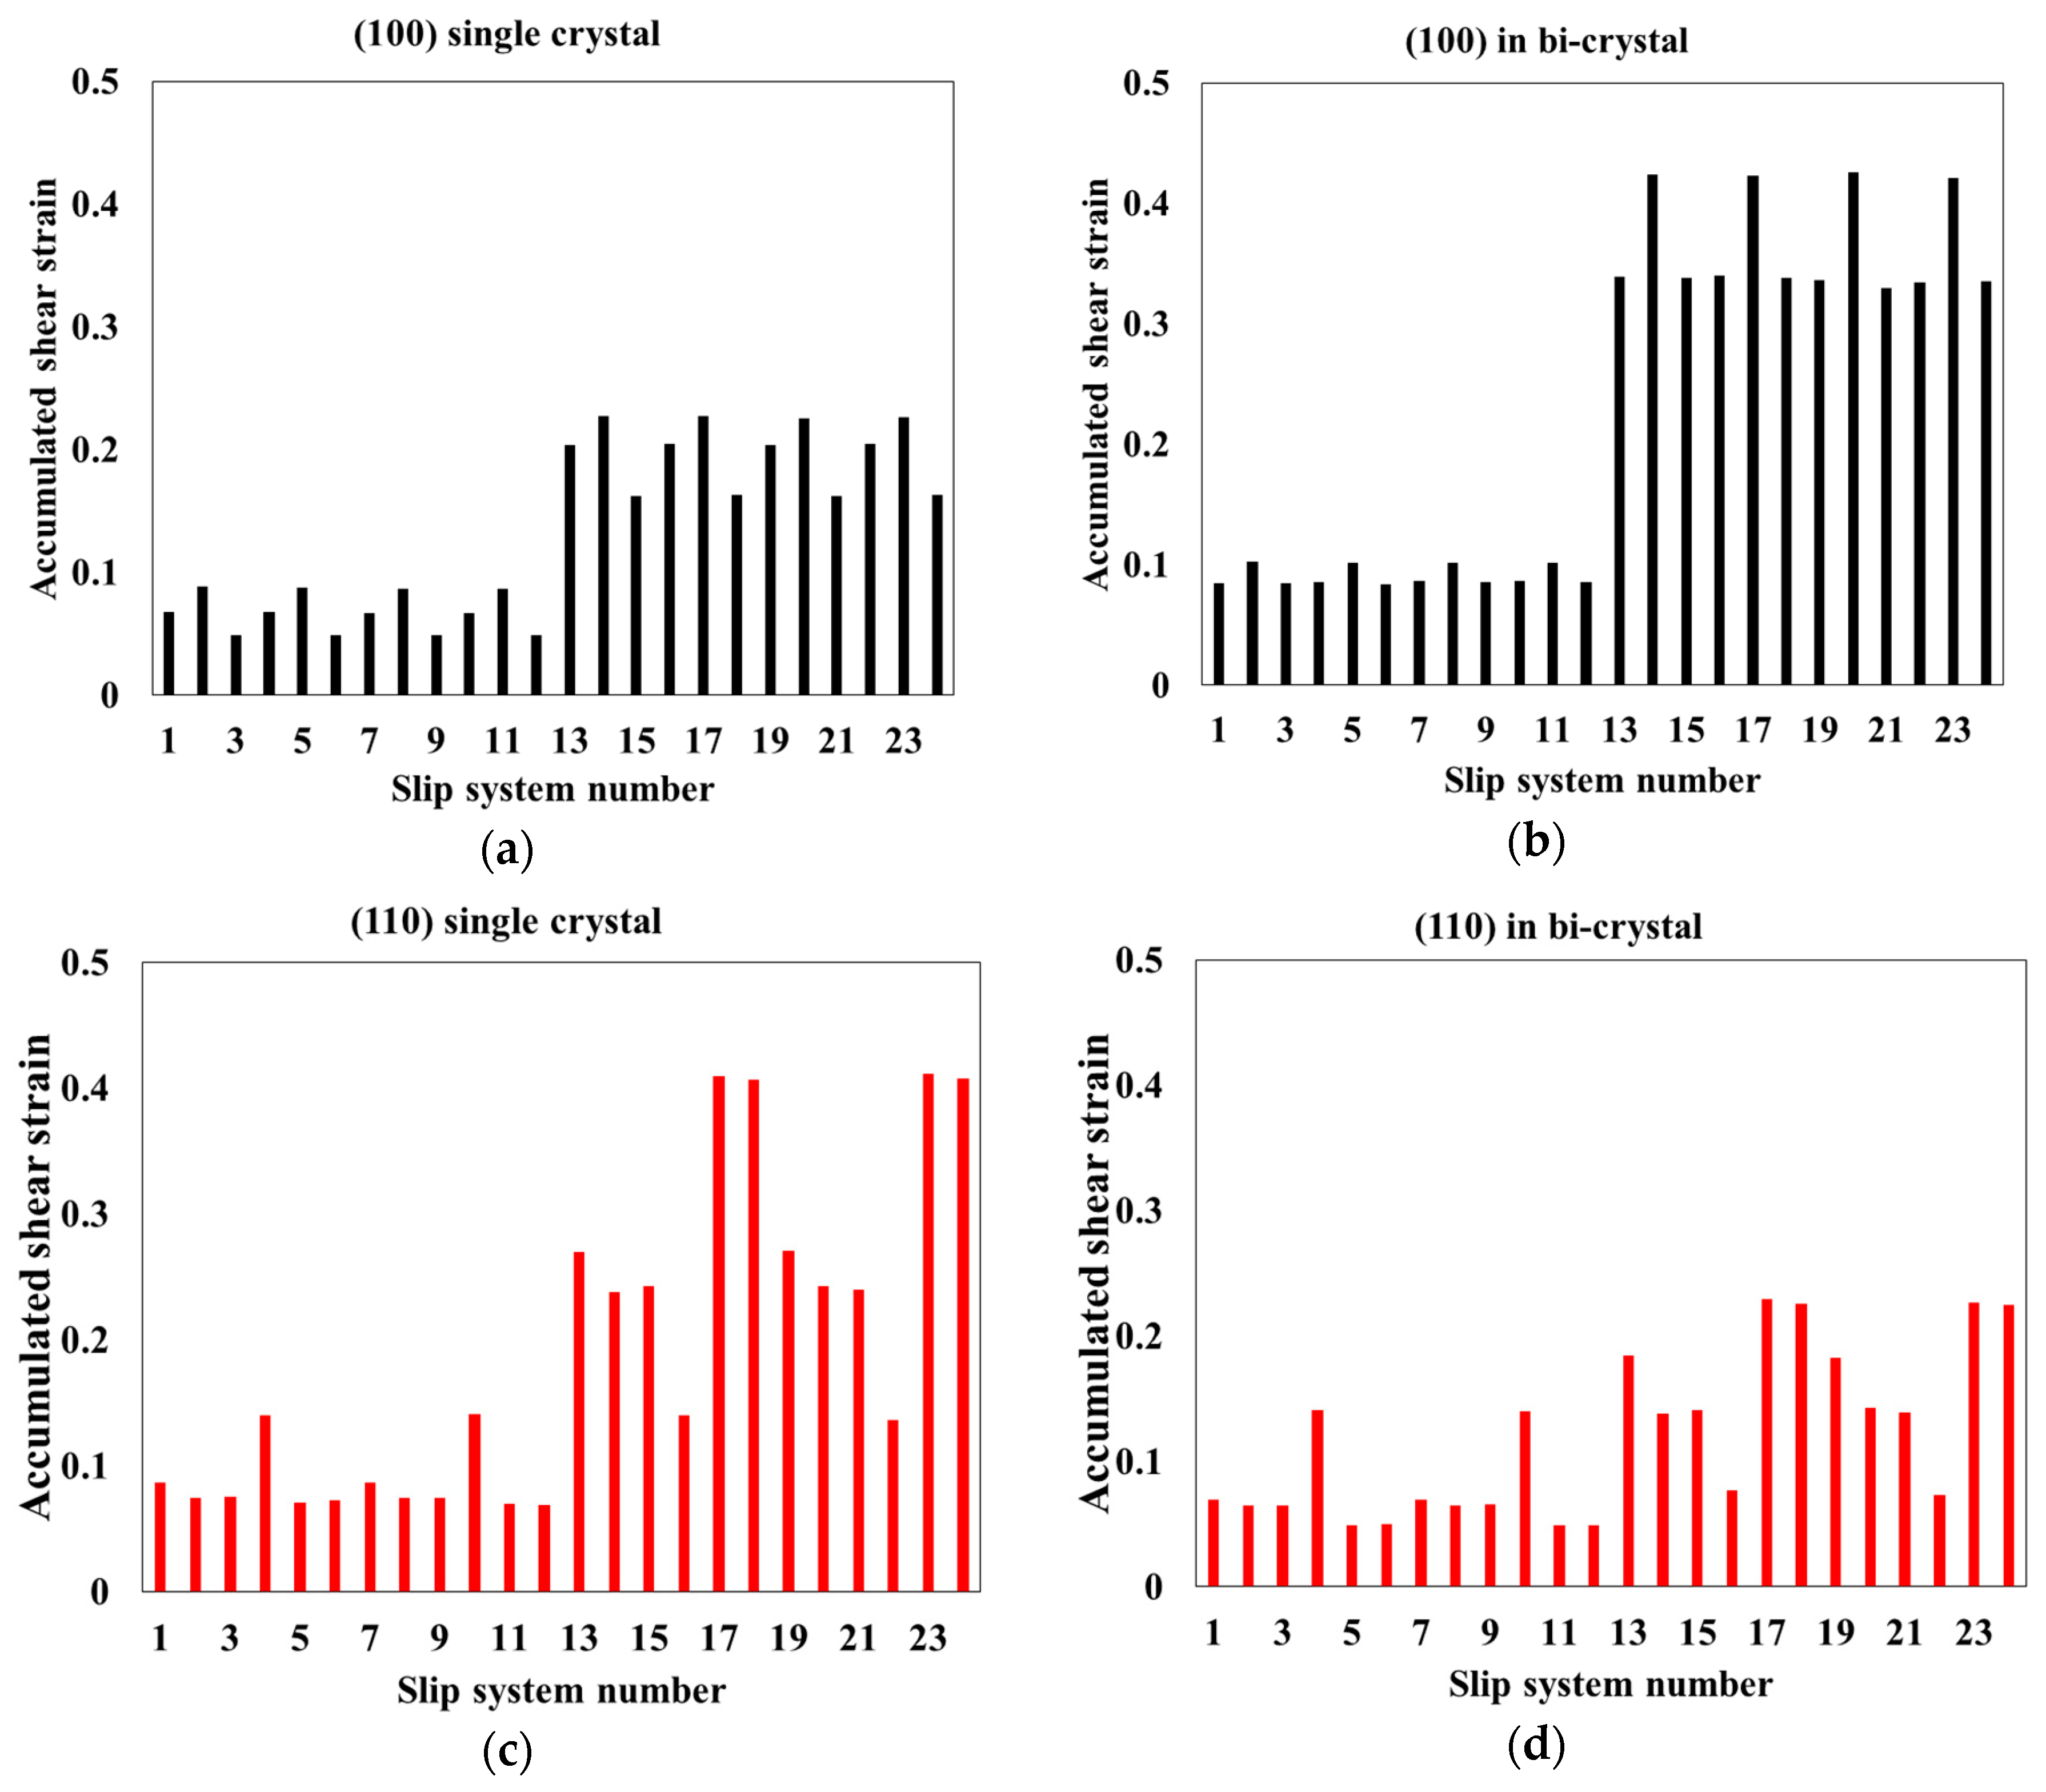
  • For the prescribed macroscopic strain (in averaged sense), the strains of elements surrounding a void between (100) and (110) regions are significantly increased and decreased, respectively. The average strains of (100) and (110) portions in the bi-crystal are equivalent to those of (110) and (100) single crystals. This result could be explained by the analysis of slip system activation (or accumulated shear strain in the activated slip systems) in which the overall activation pattern of multiple slips is similar between the single and bi-crystal, but the magnitudes of the shear strains are quite different.
The present study focused on the numerical parametric study with a generic bcc metal, and limited experimental validation was provided based on results in the published references. However, considering the high fidelity of the modern crystal plasticity simulations, the results discussed in this study might be well applied to the fundamental material design stage to optimize the formability and strength. As a future work, this approach can be further extended to the polycrystalline case where the distribution of orientations or texture effect should be investigated.

Author Contributions

M.G.L. and W.J. conceived and designed the computational modeling; C.-H.L., J.M., and D.J. analyzed the data; M.-G.L. and W.J. wrote the paper.

Funding

This research was funded by the National Research Foundation of Korea grant number (NRF-2016M1A7A1A01005904).

Acknowledgments

The EBSD and TEM works have been discussed with Prof. Hong at Changwon National University, and Prof. Shin at Myoungji University, which is highly acknowledged.

Conflicts of Interest

The authors declare no conflict of interest.

References

  1. Gurland, J. Observations on the fracture of cementite particles in a spheroidized 1.05% c steel deformed at room temperature. Acta Metall. 1972, 20, 735–741. [Google Scholar] [CrossRef]
  2. Takuda, H.; Mori, K.; Hatta, N. The application of some criteria for ductile fracture to the prediction of the forming limit of sheet metals. J. Mater. Process. Technol. 1999, 95, 116–121. [Google Scholar] [CrossRef]
  3. Clift, S.E.; Hartley, P.; Sturgess, C.; Rowe, G. Fracture prediction in plastic deformation processes. Int. J. Mech. Sci. 1990, 32, 1–17. [Google Scholar] [CrossRef]
  4. Cockcroft, M.; Latham, D. Ductility and the workability of metals. J. Inst. Met. 1968, 96, 33–39. [Google Scholar]
  5. Brozzo, P.; Deluca, B.; Rendina, R. A new method for the prediction of formability limits in metal sheets. In Proceedings of the 7th Biennial Conference of the International Deep Drawing Research Group (IDDR), Amsterdam, The Netherlands, 9–13 October 1972. [Google Scholar]
  6. Oyane, M.; Sato, T.; Okimoto, K.; Shima, S. Criteria for ductile fracture and their applications. J. Mech. Work. Technol. 1980, 4, 65–81. [Google Scholar] [CrossRef]
  7. Bao, Y.; Wierzbicki, T. On fracture locus in the equivalent strain and stress triaxiality space. Int. J. Mech. Sci. 2004, 46, 81–98. [Google Scholar] [CrossRef]
  8. Bai, Y.; Wierzbicki, T. A new model of metal plasticity and fracture with pressure and lode dependence. Int. J. Plast. 2008, 24, 1071–1096. [Google Scholar] [CrossRef]
  9. Bai, Y.; Wierzbicki, T. Application of extended mohr–coulomb criterion to ductile fracture. Int. J. Fract. 2010, 161, 1–20. [Google Scholar] [CrossRef]
  10. Gurson, A.L. Continuum theory of ductile rupture by void nucleation and growth: Part I—Yield criteria and flow rules for porous ductile media. J. Eng. Mater. Technol. 1977, 99, 2–15. [Google Scholar] [CrossRef]
  11. Tvergaard, V.; Needleman, A. Analysis of the cup-cone fracture in a round tensile bar. Acta Metall. 1984, 32, 157–169. [Google Scholar] [CrossRef]
  12. Chu, C.; Needleman, A. Void nucleation effects in biaxially stretched sheets. J. Eng. Mater. Technol. (Trans. ASME) 1980, 102, 249–256. [Google Scholar] [CrossRef]
  13. Yerra, S.; Tekog, C.; Scheyvaerts, F.; Delannay, L.; Van Houtte, P.; Pardoen, T. Void growth and coalescence in single crystals. Int. J. Solids Struct. 2010, 47, 1016–1029. [Google Scholar] [CrossRef]
  14. Liu, W.; Zhang, X.; Tang, J.; Du, Y. Simulation of void growth and coalescence behavior with 3D crystal plasticity theory. Comput. Mater. Sci. 2007, 40, 130–139. [Google Scholar] [CrossRef]
  15. Potirniche, G.; Hearndon, J.; Horstemeyer, M.; Ling, X. Lattice orientation effects on void growth and coalescence in fcc single crystals. Int. J. Plast. 2006, 22, 921–942. [Google Scholar] [CrossRef]
  16. Srivastava, A.; Needleman, A. Effect of crystal orientation on porosity evolution in a creeping sinlge crystal. Mech. Mater. 2015, 90, 10–29. [Google Scholar] [CrossRef]
  17. Tekoglu, C. Representative volume element calculations under constant stress triaxiality, Lode parameter, and shear ratio. Int. J. Solids Struct. 2014, 51, 4544–4553. [Google Scholar] [CrossRef]
  18. Lebensohn, R.A.; Escobedo, J.P.; Cerreta, E.K.; Dennis-Koller, D.; Bronkhorst, C.A.; Bingert, J.F. Modeling void growth in polycrystalline materials. Acta Mater. 2013, 61, 6918–6932. [Google Scholar] [CrossRef]
  19. Lecarme, L.; Tekoglu, C.; Pardoen, T. Void growth and coalescence in dutile solids with stage III and stage IV strain hardening. Int. J. Plast. 2011, 27, 1203–1223. [Google Scholar] [CrossRef]
  20. Pushkareva, M.; Adrien, J.; Maire, E.; Segurado, J.; Llorca, J.; Weck, A. Three-dimentional investigation of grain orientation effects on void growth in comercially pure titanium. Mater. Sci. Eng. A 2016, 671, 221–232. [Google Scholar] [CrossRef]
  21. Nemcko, M.J.; Qiao, H.; Wu, P.; Wilkinson, D.S. Effects of void fraction on void growth and linkage in commercially pure magnesium. Acta Mater. 2016, 113, 68–80. [Google Scholar] [CrossRef]
  22. Lee, E.H. In Elastic-plastic deformation at finite strains. J. Appl. Mech. 1969, 36, 1–6. [Google Scholar] [CrossRef]
  23. Hutchinson, J. Bounds and self-consistent estimates for creep of polycrystalline materials. Proc. R. Soc. Lond. A Math. Phys. Eng. Sci. 1976, 348, 101–127. [Google Scholar] [CrossRef]
  24. Asaro, R.J. Micromechanics of crystals and polycrystals. Adv. Appl. Mech. 1983, 23, 1–115. [Google Scholar]
  25. Brown, S.B.; Kim, K.H.; Anand, L. An internal variable constitutive model for hot working of metals. Int. J. Plast. 1989, 5, 95–130. [Google Scholar] [CrossRef] [Green Version]
  26. Kalidindi, S.R.; Bronkhorst, C.A.; Anand, L. Crystallographic texture evolution in bulk deformation processing of fcc metals. J. Mech. Phys. Solids 1992, 40, 537–569. [Google Scholar] [CrossRef]
  27. Adams, J.J.; Agosta, D.; Leisure, R.; Ledbetter, H. Elastic constants of monocrystal iron from 3 to 500 k. J. Appl. Phys. 2006, 100, 3530. [Google Scholar] [CrossRef]
  28. Lee, M.G.; Wang, J.; Anderson, P.M. Texture evolution maps for upset deformation of body centered cubic metals. Mater. Sci. Eng. A 2007, 463, 263–270. [Google Scholar] [CrossRef]
  29. Kalidindi, S.R.; Anand, L. An approximate procedure for predicting the evolution of crystallographic texture in bulk deformation processing of fcc metals. Int. J. Mech. Sci. 1992, 34, 309–329. [Google Scholar] [CrossRef]
  30. Kim, J.H.; Kim, D.; Barlat, F.; Lee, M.-G. Crystal plasticity approach for predicting the bauschinger effect in dual-phase steels. Mater. Sci. Eng. A 2012, 539, 259–270. [Google Scholar] [CrossRef]
Figure 1. (a) EBSD image showing random distribution of grain orientations, and (b) TEM image showing the second phase particles located both inside grains and at grain boundaries. The material is ferritic based steel and both images were taken before deformation.
Metals 08 00436 g001
Figure 2. Schematics of multiplicative decomposition of deformation gradient.
Metals 08 00436 g002
Figure 3. (a) finite element model for an RVE analysis in X–Y plane; (b) cell division for a void crossing the grain boundary or triple junction; (c) 3D view of the RVE cell with a void inclusion.
Metals 08 00436 g003
Figure 4. (a) stress–strain curves of RVEs with a void in a single crystal with different crystal orientations. The figure indicates the deformed voids in which the color code represents the equivalent plastic strain at one-layer elements surrounding void under a constant stress triaxiality of 1; (b) evolution of void volume fraction (or void growth rate) as a function of macroscopic RVE equivalent strain with different crystal orientations under a constant stress triaxiality of 1.
Metals 08 00436 g004
Figure 5. (a) stress–strain curves of RVEs with a void in a single crystal with different crystal orientations. The figure indicates the deformed void in which the color code represents the equivalent plastic strain at one-layer elements surrounding void under a constant stress triaxiality of 3; (b) evolution of void volume fraction (or void growth rate) as a function of macroscopic RVE equivalent strain with different crystal orientations under a constant stress triaxiality of 1.
Metals 08 00436 g005
Figure 6. Growth of voids embedded in bi- and tri- crystals. The dotted arrow indicates the slowest void growth direction, while the solid arrow represents the fastest void growth direction. The orientations are denoted at the corner of each cell: (a) for a constant stress triaxiality of 1, (b) a constant stress triaxiality of 3. The color code represents the equivalent plastic strain (red denotes high strain region).
Metals 08 00436 g006
Figure 7. Stress-strain curves of (110)-(100) bi-crystals with different fraction of (100) portions for the stress triaxiality (a) 1, and (b) 3. The orientations are denoted in the bracket and the number represents the volume fraction. For example, 0.5 (100) means 50% of (100) orientation.
Metals 08 00436 g007
Figure 8. (a) a void located at the grain boundary between (110) and (100) crystal after deformation of a macroscopic strain 0.15: (a) view on XY and YZ planes; (b) 3D representation of the void by drawing one layer elements surrounding the void after the deformation; (c) evolution of void volume fraction (or equivalently the void growth rate) in (110)-(100) bi-crystal. The plots (110) and (100) represent the void volume fraction of each portion in the bi-crystal. The region with the red color represents highly deformed regions.
Metals 08 00436 g008aMetals 08 00436 g008b
Figure 9. (a) evolutions of void volume fractions of (100), (110) single crystals and (100)-(110) bi-crystal as a function of macroscopic RVE strain; (b) average strains of one layer elements surrounding voids as a function of macroscopic RVE strain. Solid lines represent the strains for single crystals, while dotted lines are those in the bi-crystal.
Metals 08 00436 g009
Figure 10. Average accumulated shear on the slip systems at (a) (100) single crystal, (b) (100) portion in (110)-(100) bi-crystal, (c) (110) single crystal and (d) (110) portion in the bi-crystal.
Metals 08 00436 g010
Figure 11. Activities of slip systems 14, 23, 24 for (100) single crystal, (110)-(100) bi-crystal, and (110) single crystal. The color represents the accumulated shear strain in each slip system. The red color denotes highly deformed regions.
Metals 08 00436 g011
Table 1. 24 {110} <111> and {112} <111> slip systems for bcc crystal.
No.Plane NormalSlip DirectionNo.Plane NormalSlip Direction
1 ( 011 ) [ 11 1 ¯ ] 13 ( 2 1 ¯ 1 ) [ 11 1 ¯ ]
2 ( 101 ) [ 11 1 ¯ ] 14 ( 1 ¯ 21 ) [ 11 1 ¯ ]
3 ( 1 1 ¯ 0 ) [ 11 1 ¯ ] 15 ( 112 ) [ 11 1 ¯ ]
4 ( 01 1 ¯ ) [ 1 1 ¯ 1 ¯ ] 16 ( 211 ) [ 1 1 ¯ 1 ¯ ]
5 ( 101 ) [ 1 1 ¯ 1 ¯ ] 17 ( 12 1 ¯ ) [ 1 1 ¯ 1 ¯ ]
6 ( 110 ) [ 1 1 ¯ 1 ¯ ] 18 ( 1 1 ¯ 2 ) [ 1 1 ¯ 1 ¯ ]
7 ( 011 ) [ 1 1 ¯ 1 ] 19 ( 21 1 ¯ ) [ 1 1 ¯ 1 ]
8 ( 10 1 ¯ ) [ 1 1 ¯ 1 ] 20 ( 121 ) [ 1 1 ¯ 1 ]
9 ( 110 ) [ 1 1 ¯ 1 ] 21 ( 1 ¯ 12 ) [ 1 1 ¯ 1 ]
10 ( 01 1 ¯ ) [ 111 ] 22 ( 2 ¯ 11 ) [ 111 ]
11 ( 10 1 ¯ ) [ 111 ] 23 ( 1 2 ¯ 1 ) [ 111 ]
12 ( 1 1 ¯ 0 ) [ 111 ] 24 ( 1 2 ¯ 1 ) [ 111 ]
Table 2. Single crystal parameters fitted for model material.
VariablesValues
Anisotropic elastic property (C11)230.4 GPa
Anisotropic elastic property (C12)134.1 GPa
Anisotropic elastic property (C44)115.9 GPa
Reference shearing rate ( γ ˙ 0 α )0.001/s
Slip rate sensitivity parameter (m)0.05
Initial value of the slip resistance ( s 0 )50 MPa
Value of the initial hardening rate ( h 0 )200 MPa
Saturation value for the slip resistance ( s s )150 MPa
Exponent in hardening equation (a)2.25
Latent hardening parameter ( q α β )1.4

