Article

Combined Galvanostatic and Potentiostatic Plasma Electrolytic Oxidation of Titanium in Different Concentrations of H2SO4

1
Abteilung für Materialwissenschaft, Institut für Experimentelle Physik der kondensierten Materie, Heinrich-Heine-Universität Düsseldorf, Universitätsstraße 1, 40225 Düsseldorf, Germany
2
Institut für Pharmazeutische Technologie und Biopharmazie, Heinrich-Heine-Universität Düsseldorf, Universitätsstraße 1, 40225 Düsseldorf, Germany
3
Abteilung für Bioanorganische Chemie, Institut für Anorganische Chemie und Strukturchemie I, Heinrich-Heine-Universität Düsseldorf, Universitätsstraße 1, 40225 Düsseldorf, Germany
*
Author to whom correspondence should be addressed.
Metals 2018, 8(6), 386; https://doi.org/10.3390/met8060386
Submission received: 29 April 2018 / Revised: 18 May 2018 / Accepted: 21 May 2018 / Published: 26 May 2018
(This article belongs to the Special Issue Plasma Electrolytic Oxidation)

Abstract

:
We report on plasma electrolytic oxidation of titanium, employing a technique with combined potentiostatic and galvanostatic control. The effect of different H 2 SO 4 electrolyte concentrations on the titanium oxide formation was studied sytematically. The titanium oxide consisted of two distinguishable layers. The upper layer is porous, up to few micrometers thick and primarily rutile, while the interlayer is compact, comparatively thin and is associated to anatase formation. The electrolyte concentration changed substantially layer thickness, porosity and phase composition, as deduced from scanning electron microscopy, X-ray diffraction and Raman spectroscopy.

1. Introduction

Microstructured oxide layers on titanium, produced by plasma electrolytic oxidation (PEO), are of great interest for various applications, including bioengineering, architecture, photovoltaic and sensing technology [1,2]. In gas sensors, PEO films on titanium exhibit a number of interesting properties. For example, after coating them with graphite or graphite/catalysts mixtures, various gases can be detected at room temperature with high sensitivity [3,4,5,6]. Galvanostatic, potentiostatic and potentiodynamic operating modes are commonly applied [7] and have been compared with respect to surface morphology, phase composition and electrical properties [8]. Sulphuric acid is frequently used and yields porous oxide layer of certain thickness under PEO conditions [9,10,11,12,13]. Furthermore, previous studies also confirm the growth of a compact interlayer at the metal substrate which is thin compared to the porous layer [8,14,15]. Growth models for lightweight metals have been proposed which explain the relevant structure-determining processes and correlate them with the key influence factors, including electrolyte composition, electrical process parameters, process temperature, oxidation time and additives [16,17]. In most studies, a low electrolyte concentration is used which is often below 2 M. Our process employed an exceptionally high concentration of sulphuric acid of 12.9 M as well as a combination of galvanostatic and potentiostatic PEO. This leads to a remarkable good adhesion, well controlled microstructure and phase composition [18]. In this study, we present the special PEO operation mode and discuss the impact of different H 2 SO 4 electrolyte concentrations on the resulting oxide layers. To determine the microstructure of the surfaces and cross-sections, we used scanning electron microscopy (SEM). The phase composition was investigated quantitatively with two different techniques, i.e., X-ray diffraction (XRD) and Raman spectroscopy.

2. Materials and Methods

Samples (surface area approx. 1990 mm 2 ) were cutted from titanium foil (thermally annealed, 99.6% purity; 125 μ m thickness) by means of a laser (PowerLine F30, ROFIN-SINAR Laser GmbH, Hamburg, Germany). It is cleaned ultrasonically in acetone and in deionized water, each for approximately 15 min.
The electrolytic cell consists of a glass vessel with integrated glass shell, which enables temperature regulation of the electrolyte by pumping cold water through the shell. The water temperature is kept constant at 15 C with a recirculating cooler (FL1201, JULABO GmbH, Seelbach, Germany). The reaction chamber is filled with 150 mL H 2 SO 4 . The concentration varied from 0.5 M up to 12.9 M (which corresponds to 3 wt. % up to 75 wt. % H 2 SO 4 , respectively). A magnetic stirrer is utilized to prevent spatial temperature differences in the electrolyte and also to reduce disturbing gas accumulations on the electrode surfaces. The electrolytic system was completed by the titanium sample as anode and a graphite rod as cathode (area of immersion 3180 ± 120 cm 2 ) at a distance of 23 ± 4 mm. The current in the cell was permanently limited to I max = 200 mA. The voltage V was gradually increased in defined time intervals up to 145 V by a highly stable current power supply (FUG MCP 350-350). The voltage steps were achieved by adjusting the voltage limitation V lim . This means, when I max is reached, V is automatically regulated to a value smaller than or equal to V lim . Voltage and current were adjusted and recorded in 250 ms intervals using an in-house developed LabVIEW program. After treatment the sample was rinsed in deionized water and dried in air.
The microstructure of the oxide layer has been investigated by field emission scanning electron microscopy (Merlin FE-SEM, Zeiss Microscopy GmbH, Jena, Germany). Surface images of secondary electrons were done with 5 kV excitation and at a tilt angle of 38 . Cross-sections were prepared by argon ion milling (Cross Section Polisher SM-09010, JEOL Ltd., Tokyo, Japan). For cross-section images, backscattered electrons were collected with 10 kV at 0 tilt angle. The phase composition was determined by X-ray diffraction (XRD). Diffraction data were collected on a Bruker D2 Phaser diffractometer with Cu-K α radiation ( λ = 1.54184 Å, 30 kV, 10 mA) in Bragg-Brentano geometry and LYNXEYE 1D-detector. XRD patterns were measured with a flat silicon, low background rotating sample holder (5.0 min 1 ) in 10 min duration between 20 < 2 θ < 45 with a scan speed of 1 s/step and a step size of approximately 0.05 per step.
Raman spectra were collected by using a self-built Raman microscope. Samples were excited with a solid-state Nd:YVO 4 laser (Newport Corp., Irvine, CA, USA, Millennia Pro 2 s, wavelength of 532 nm). A Nikon Instruments 100× microscope objective (Nikon, Tokyo, Japan) was used to focus the laser excitation light, delivering in the sample plane a power of 3.2 mW. The spot size was about 2–3 μ m in diameter. The Raman scattered light was collected by the objective and was then diffracted by a monochromator (Kaiser Optical Systems, HoloSpec, Ann Arbor, MI, USA, slit width of 50 μ m) equipped with a CCD camera Newton DU920P-BV (Andor Technology Ltd., Belfast, UK). The average spectral resolution of the Raman system was approximately 6.5 cm 1 . Raman spectra were obtained by single acquisition of 0.5 s at 100 different sample positions from 260–2480 cm 1 .

3. Results

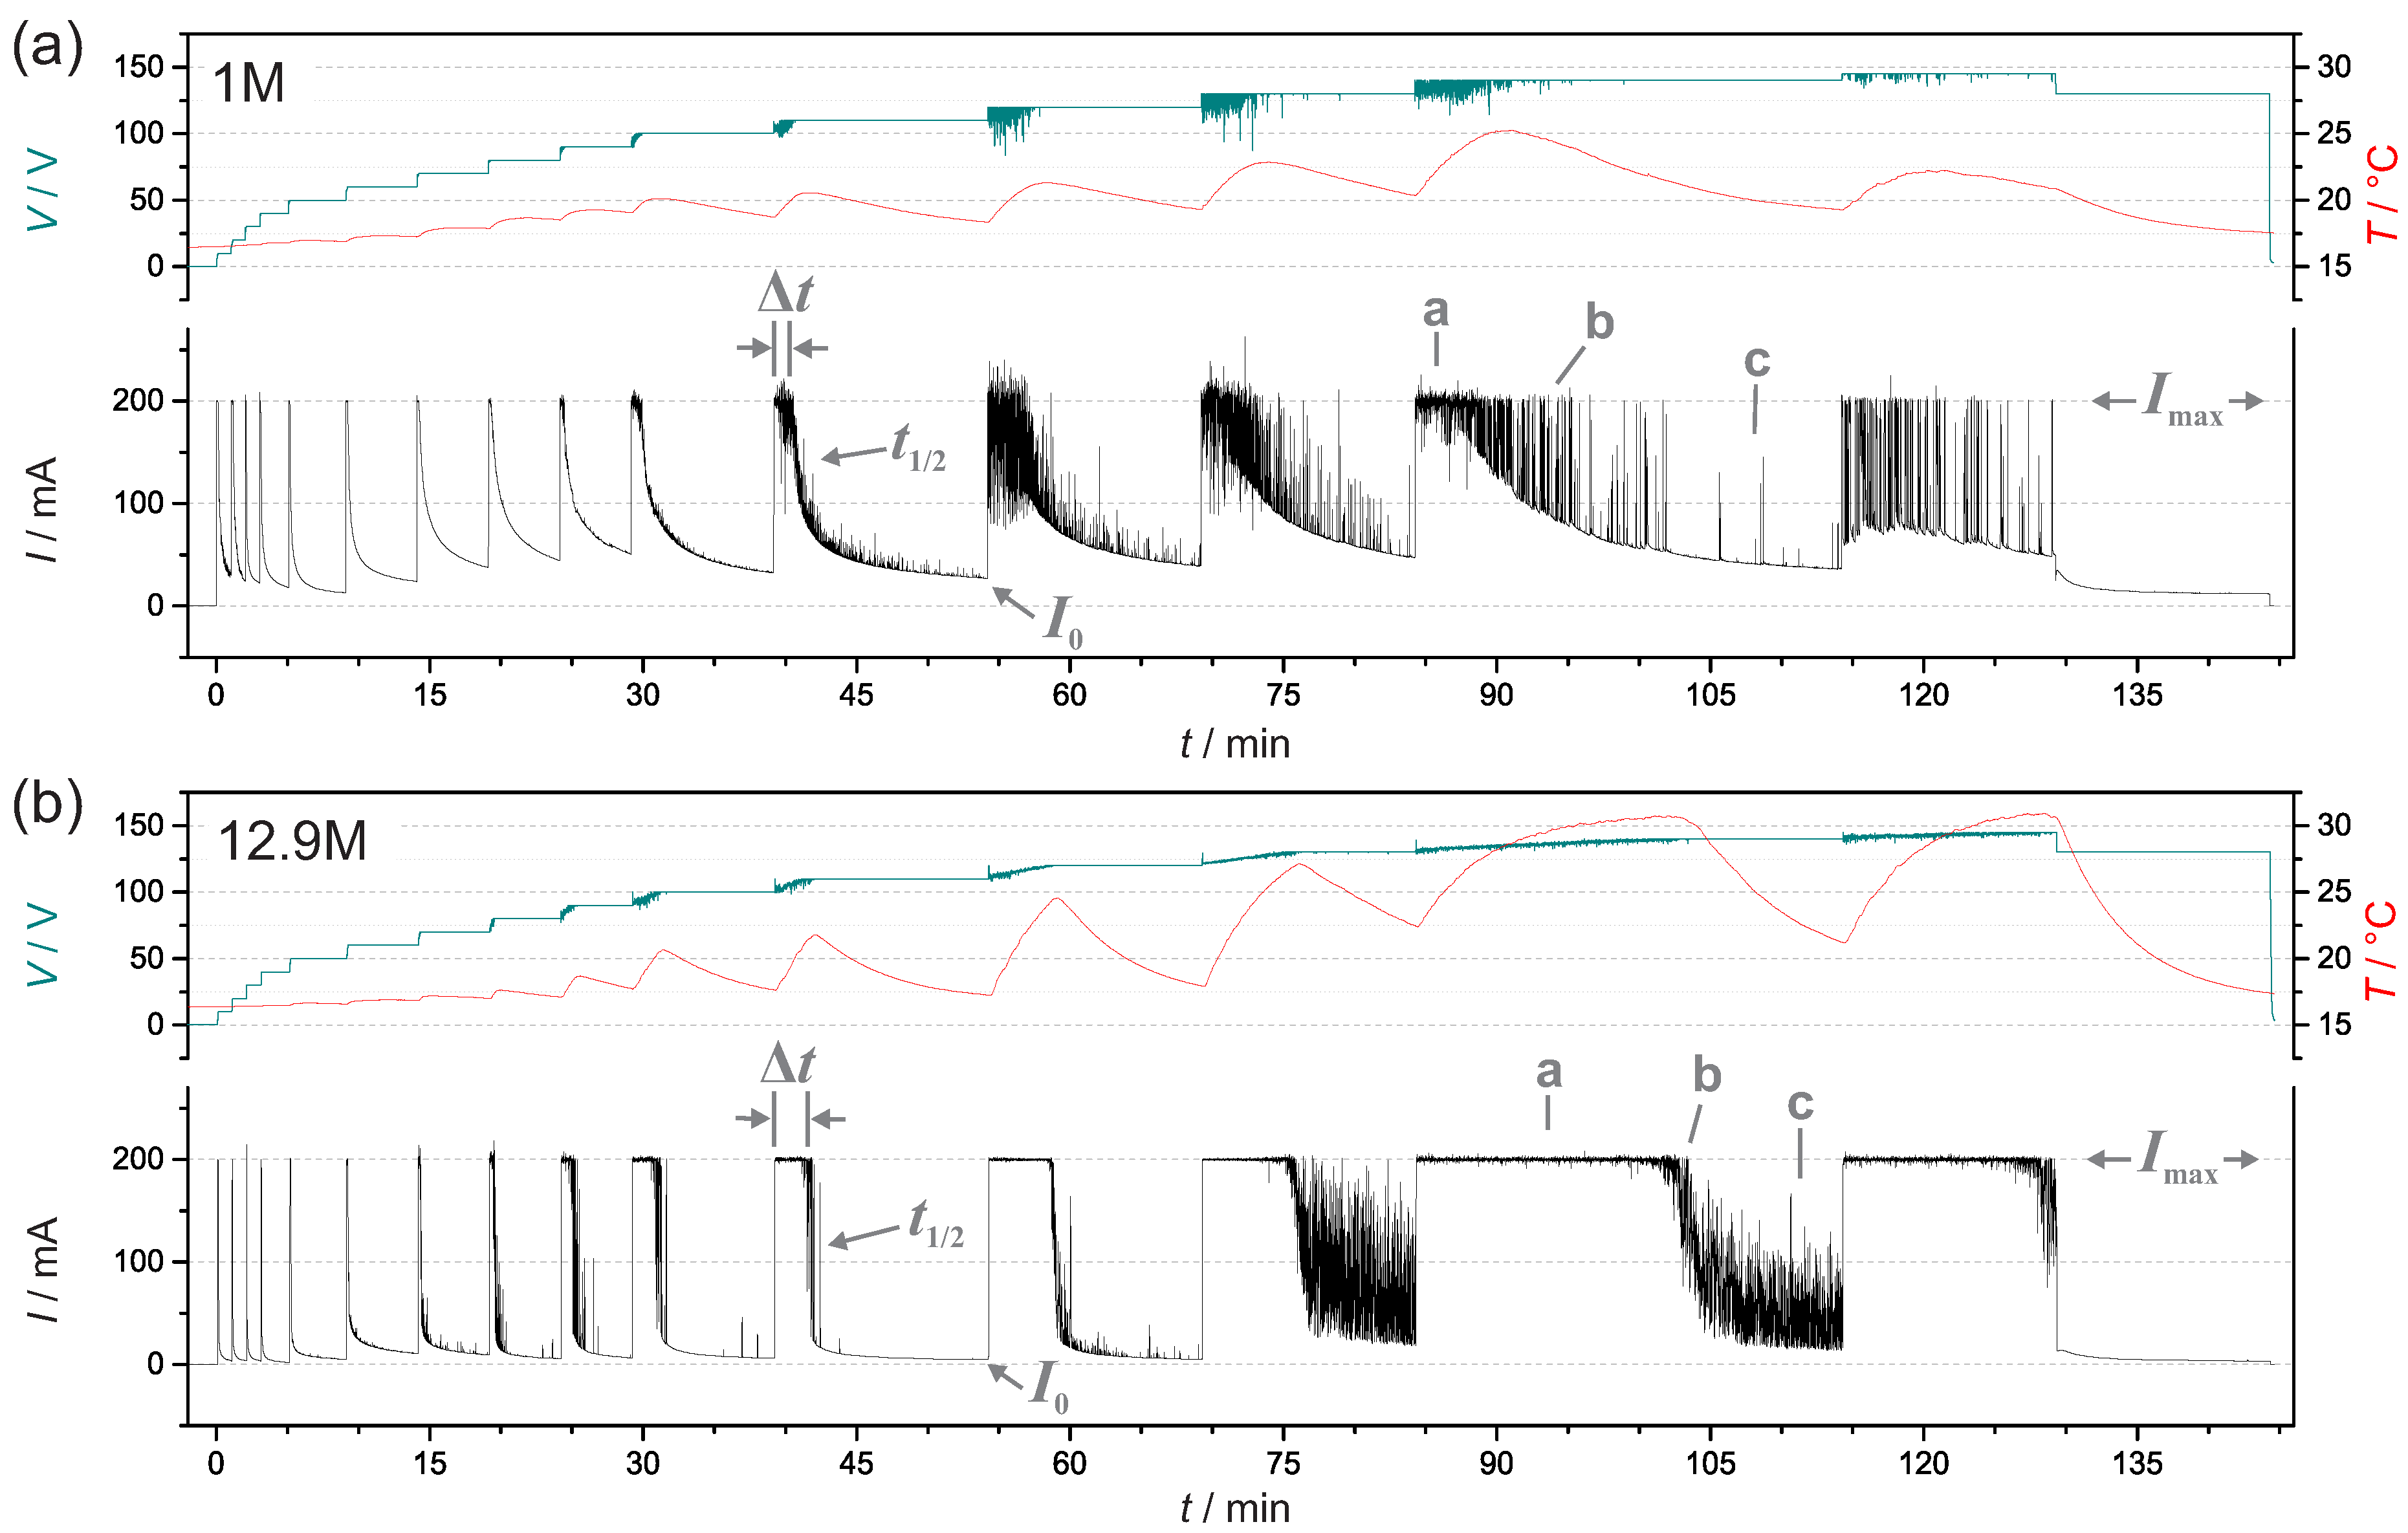
3.1. Current, Voltage and Temperature During PEO
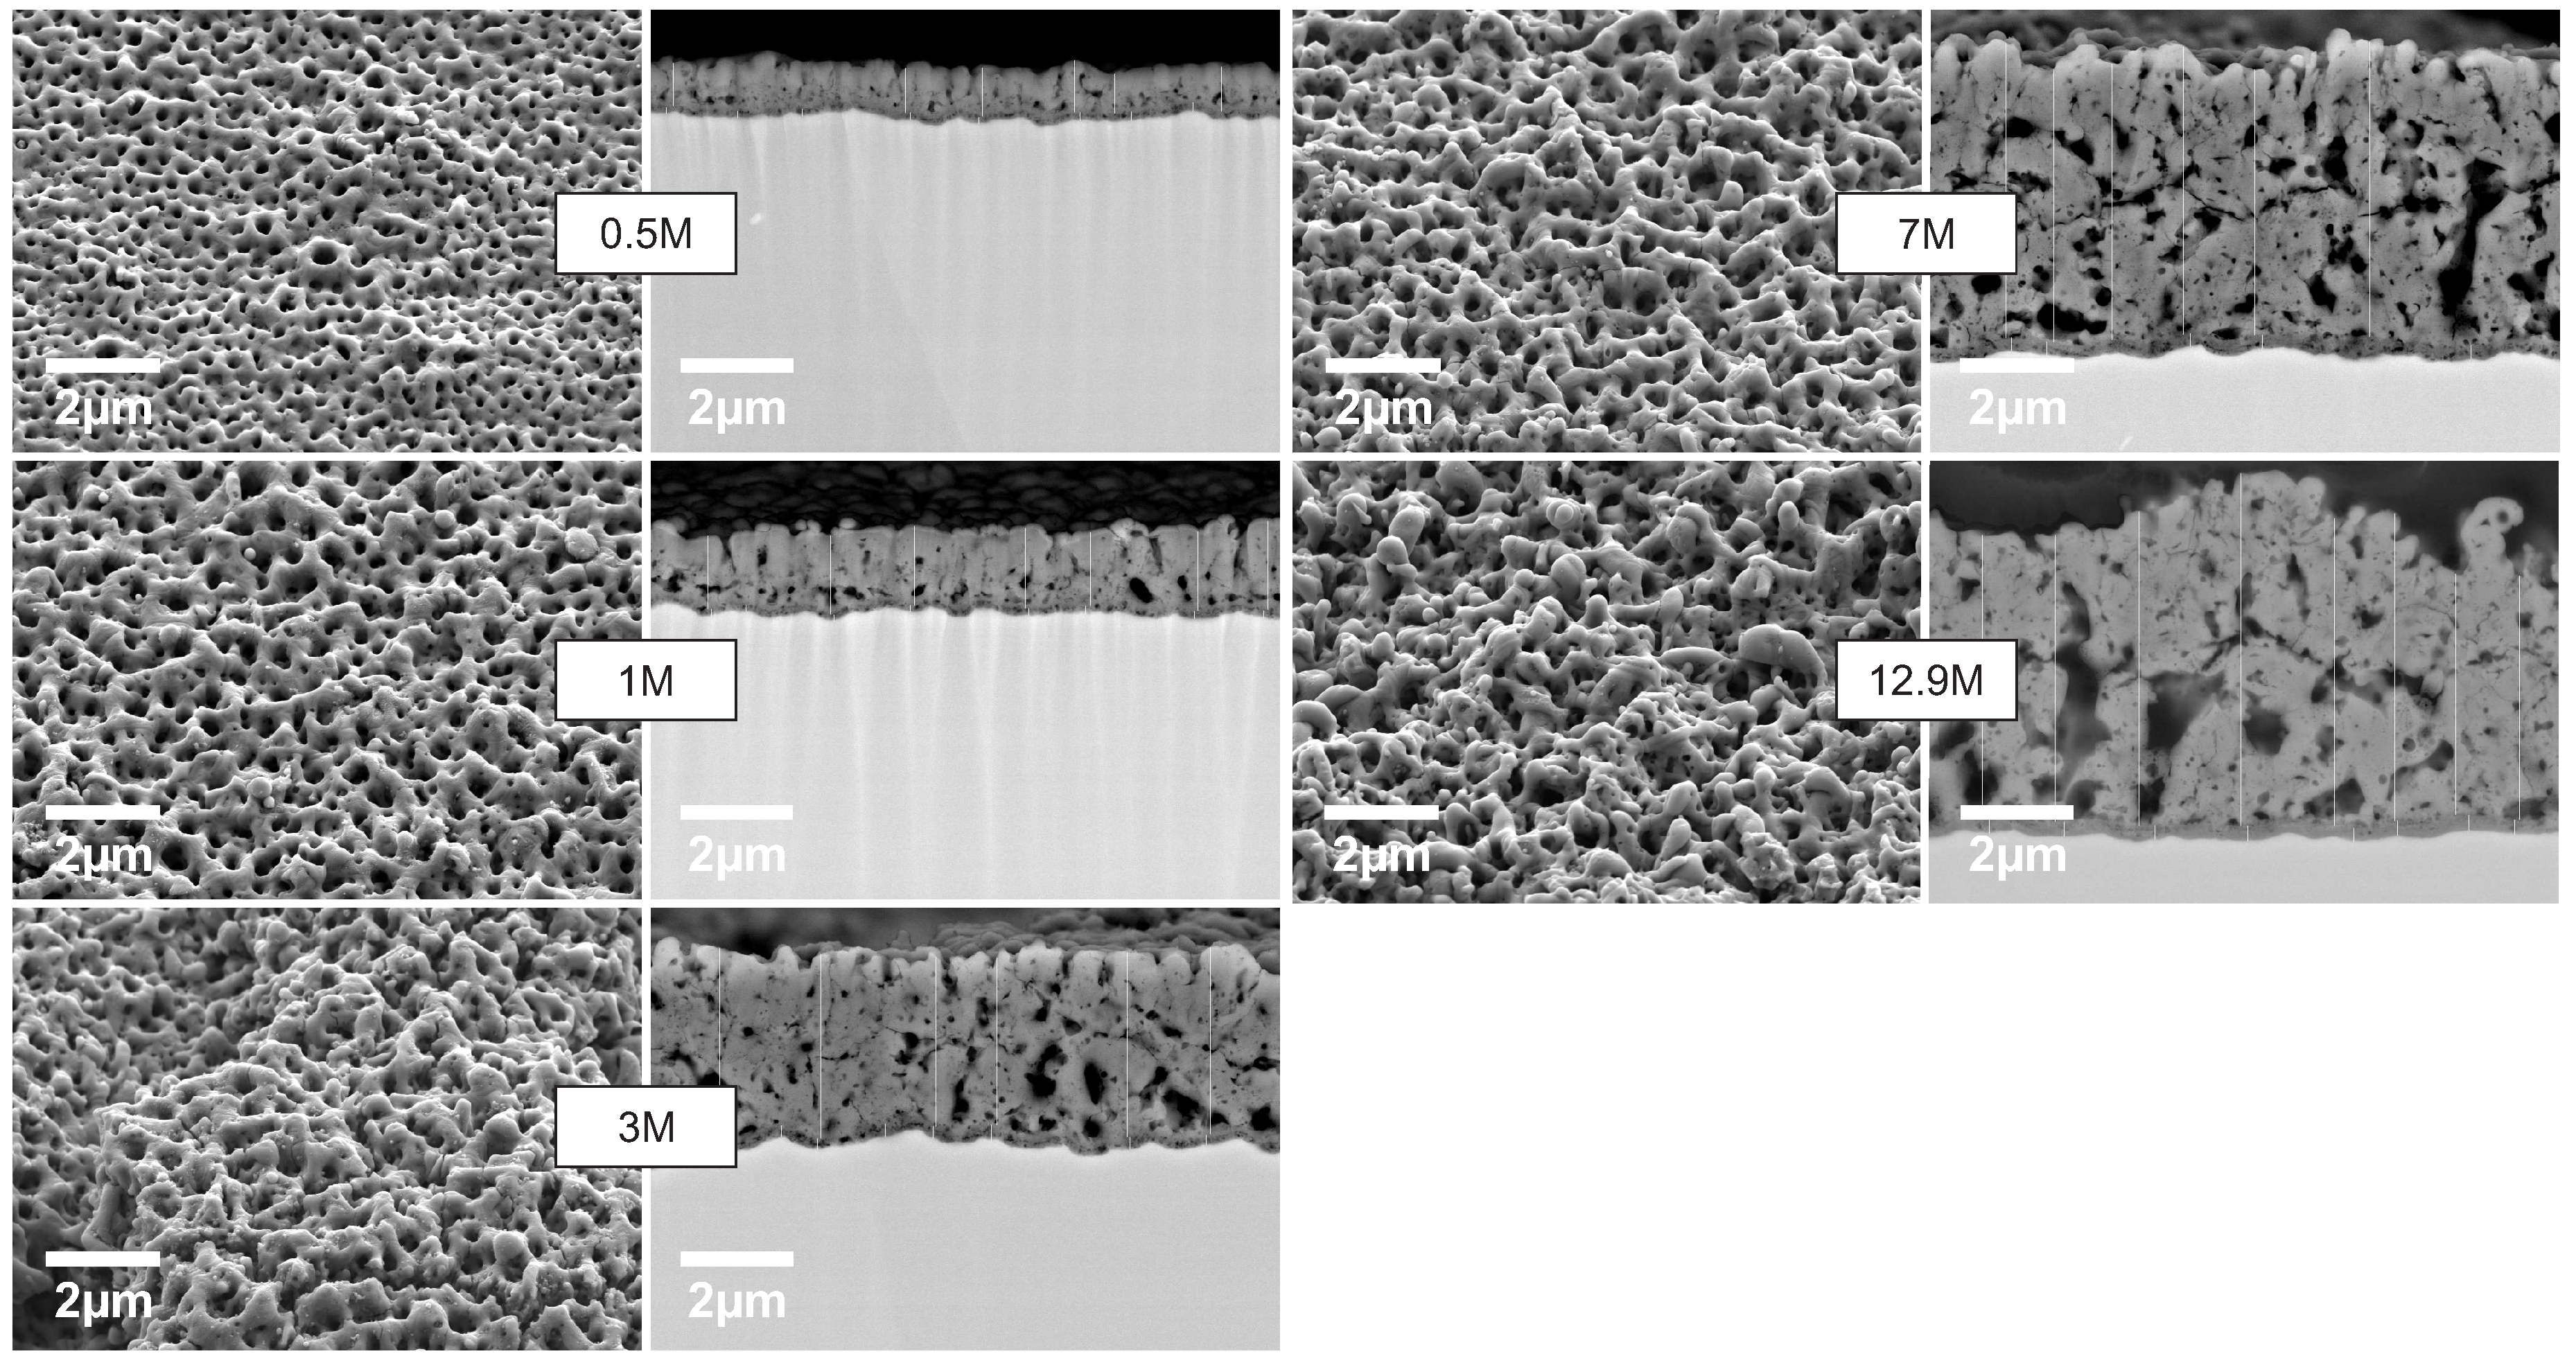
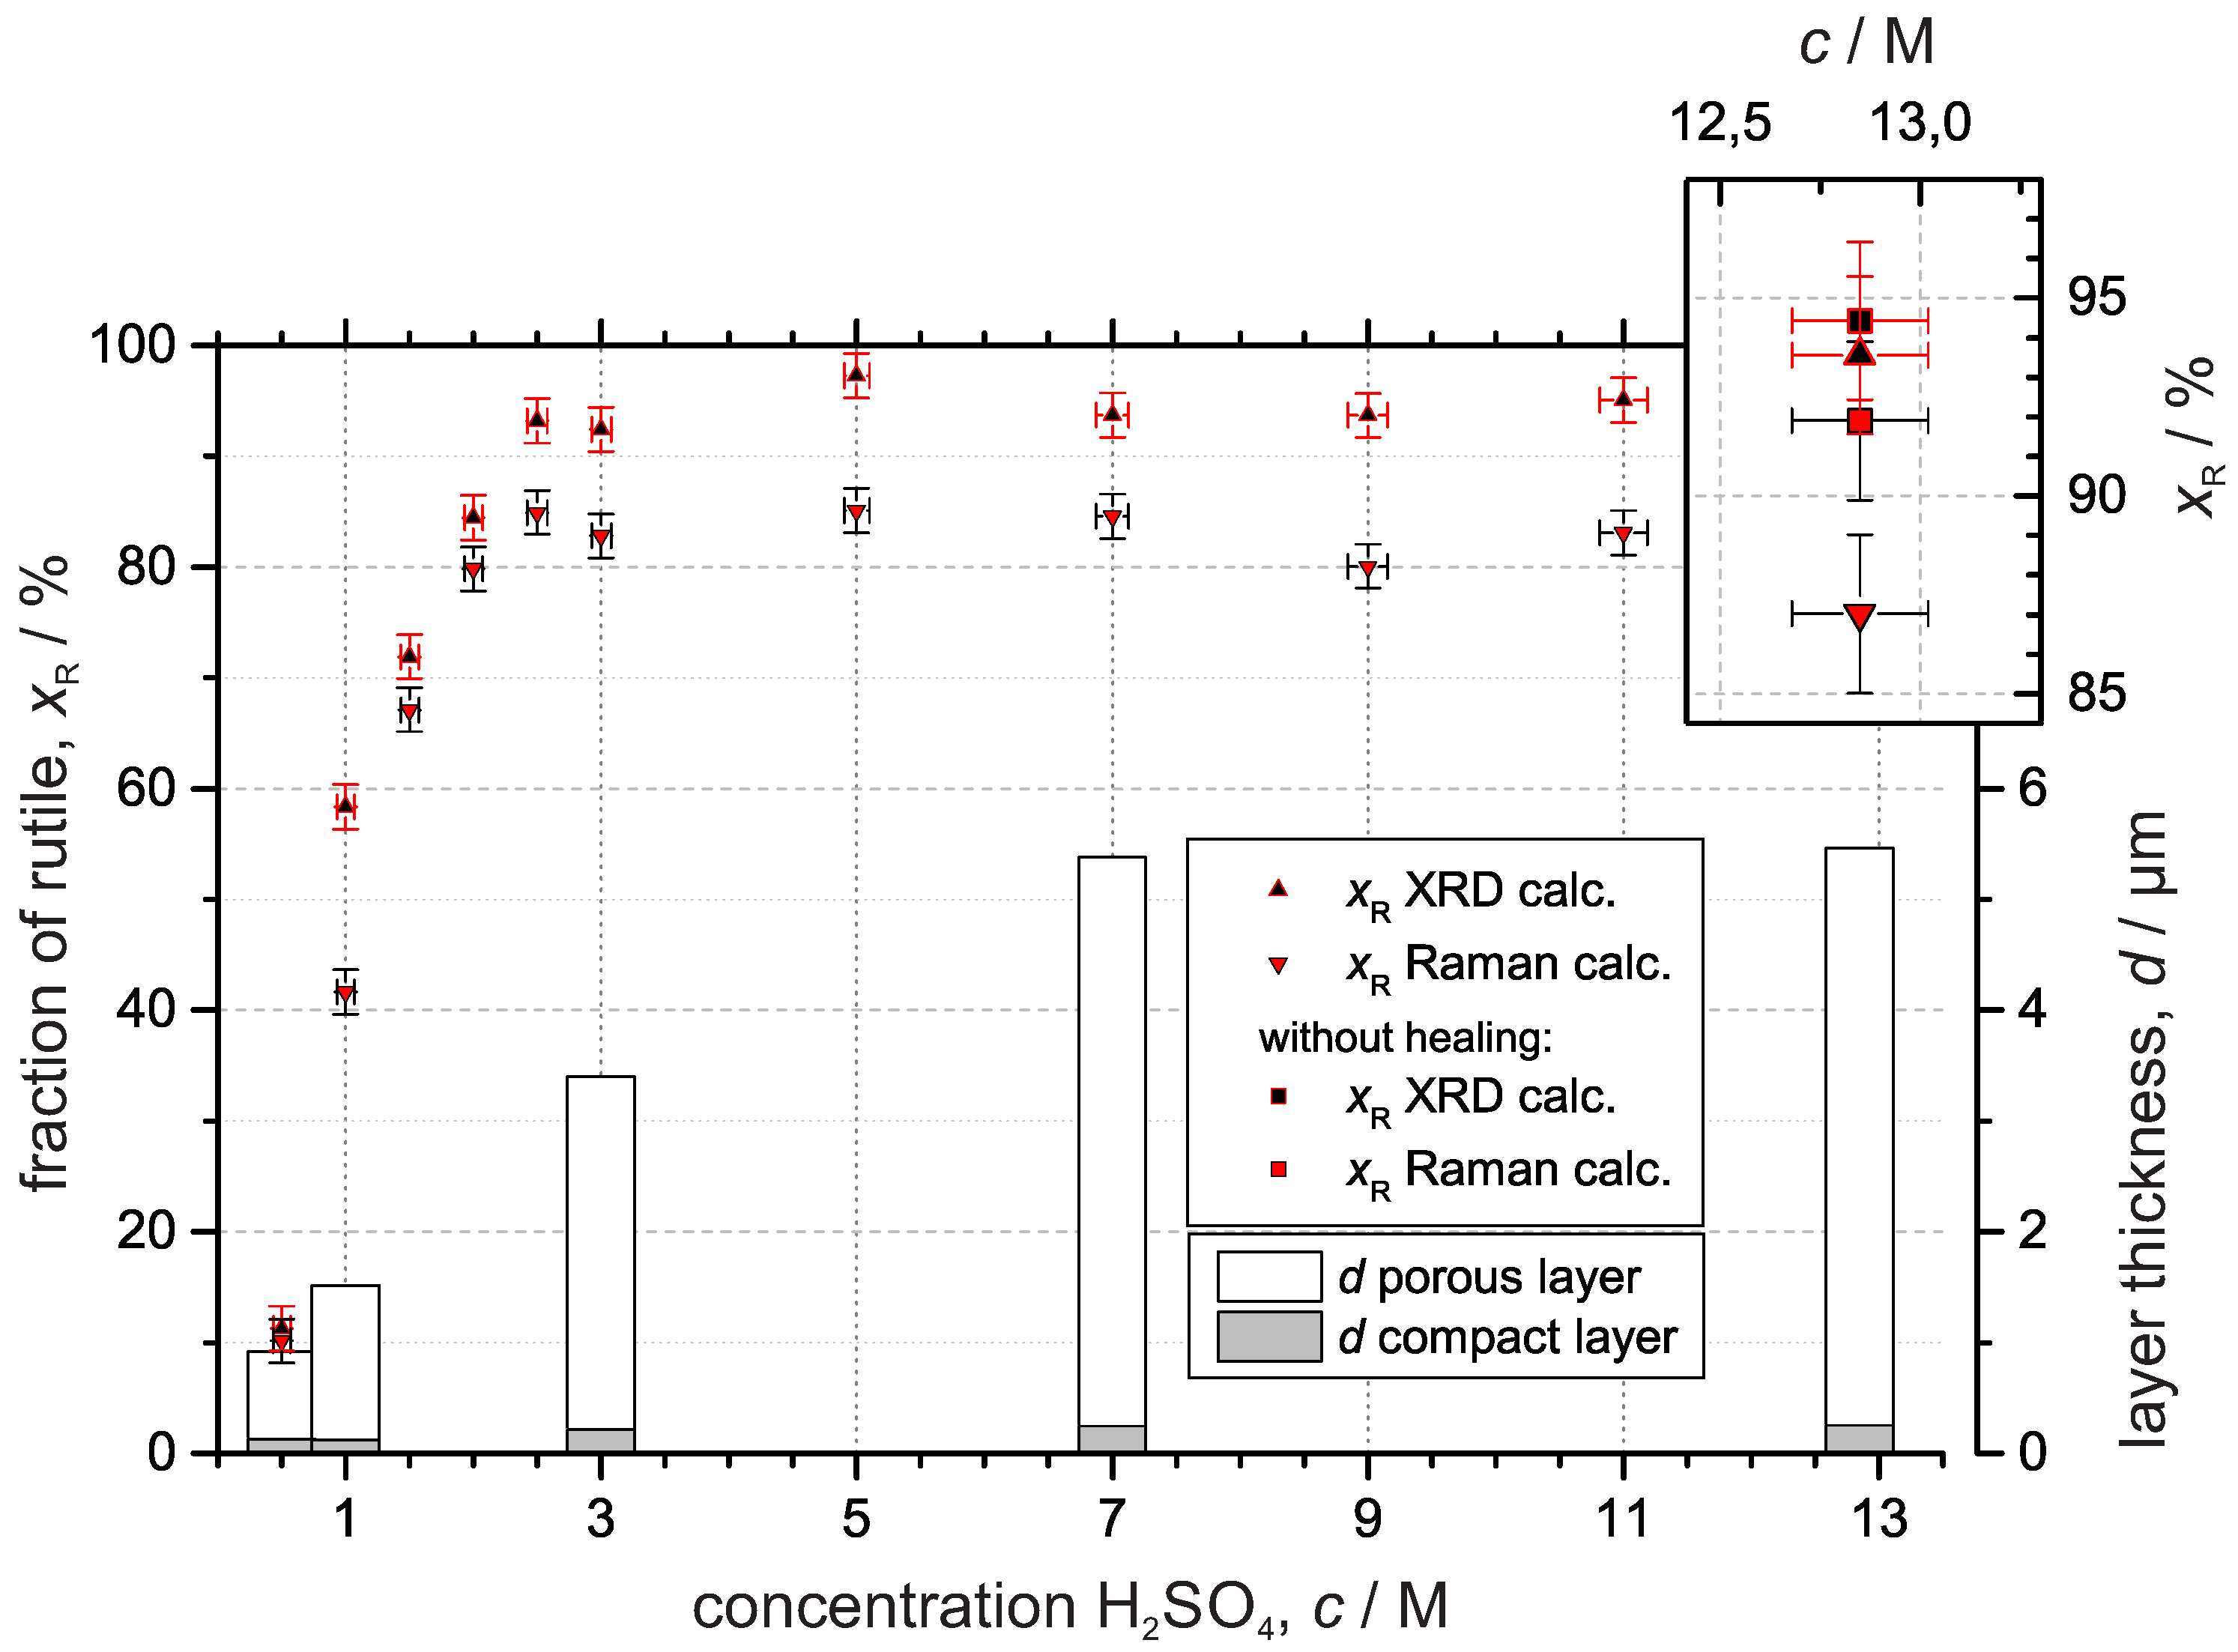
Voltage, current and electrolyte temperature transients for the PEO process with 1 M and 12.9 M H 2 SO 4 concentration are represented in Figure 1, respectively. In comparison with El Achhab et al. [18] the process was further refined by increasing the number of voltage steps and the times per step.
In the beginning of the process, the electrolytic oxidation occurs under potentiostatic control, as confirmed by the exponential decrease of the current immediately after each voltage step. Strong oxide growth occurs only for several seconds and decreases rapidly. Oxide occurs preferentially at surface inhomogeneities, accompanied by the oxidation of the entire surface during the sufficiently long period. This procedure leads to a controlled oxide growth with a good stability and adhesion of the oxide layer to the substrate. In the regime of higher voltages, the current does not drop immediately after a voltage step. Here galvanostatic oxidation at I max = 200 mA takes place during a period Δ t . The current limitation of I max prevents from electrically induced etching. The highest growth rate is expected in this period. After Δ t the current decreases exponentially. The decay, described by the half-life t 1 / 2 , represents the growth rate under potentiostatic conditions. The current I 0 in the end of an interval is determined by the insulating properties of the oxide and is a good indicator for the oxide layer after each voltage step and finally after the entire process.
Distinct peaks in the current transient originate from electrical breakdowns. At higher voltages, breakdowns are accompanied by visible light emission, originating from plasma discharges. Such light emissions have been studied by other groups. It is known that spectra of the emitted light change during the PEO process, due to the specific nature of the discharges [19]. Under galvanostatic control (i.e., at I max ), strong discharges can be visually observed. In these periods (for example period a in Figure 1) dielectric breakdowns affect the entire oxide layer and substrate. Discharges induce plasma conditions and, due to escaping gases, create a micropore structure. Neighboring regions are affected and further discharges are leading to a cascade. They move avalanche-like across the surface for a short duration of time. After Δ t discharges occur less common and less intense (for example period b in Figure 1), due to the increased oxide layer thickness and its improved insulating properties. The oxide growth approaches always a limitation and finally only single discharges occur (for example period c in Figure 1). The corresponding peaks in the current transient are well below 200 mA and are caused by comparably weak discharges. We believe that they correspond to gas discharges, which occur in micropores, as previously investigated for PEO of aluminium [19].
The increase of the electrolyte temperature is a consequence of the electrical power dissipation into heat, especially during the time intervals Δ t (i.e., at I max ). It was experimentally found that the stability and adhesion of the oxide is significantly reduced if the cooling is omitted. This seems to be in line with previous results on light metals, for which a high-temperature process promotes dissolution of the oxide layer [17]. Hence, the control of the electrolyte temperature by cooling is a prerequisite to yield high-quality oxide layers in our PEO process.

3.2. Microstructure

The visual appearance of the PEO samples is of light grey color, which is usually the case for porous titanium oxide. The comparison of all samples produced with different H 2 SO 4 electrolyte concentrations suggests that the oxide thickness increases with the concentration.
Figure 2 presents the SEM images of the surfaces produced with 0.5 M, 1 M, 3 M, 7 M and 12.9 M H 2 SO 4 . All images confirm a porous structure of the oxide films. For 0.5 M, the pore size seems rather small and uniform. With increasing concentrations the pores enlarge and, simultaneously, the surface becomes rougher. The maximum roughness is found for 12.9 M.
To determine the thickness of the oxide layer, cross-sections of the samples were prepared and were imaged with SEM. They are shown in Figure 2. The oxide layer can be distinguished into two layers of different thickness and porosity, in accordance to other studies [8,14,15]. The titanium substrate is coated with a relative compact oxide interlayer. Table 1 summarizes the thicknesses of the porous and compact layers of the samples as well as the mean pore sizes. These data were determined at randomly selected sites of each SEM images.

3.3. Crystal Structure

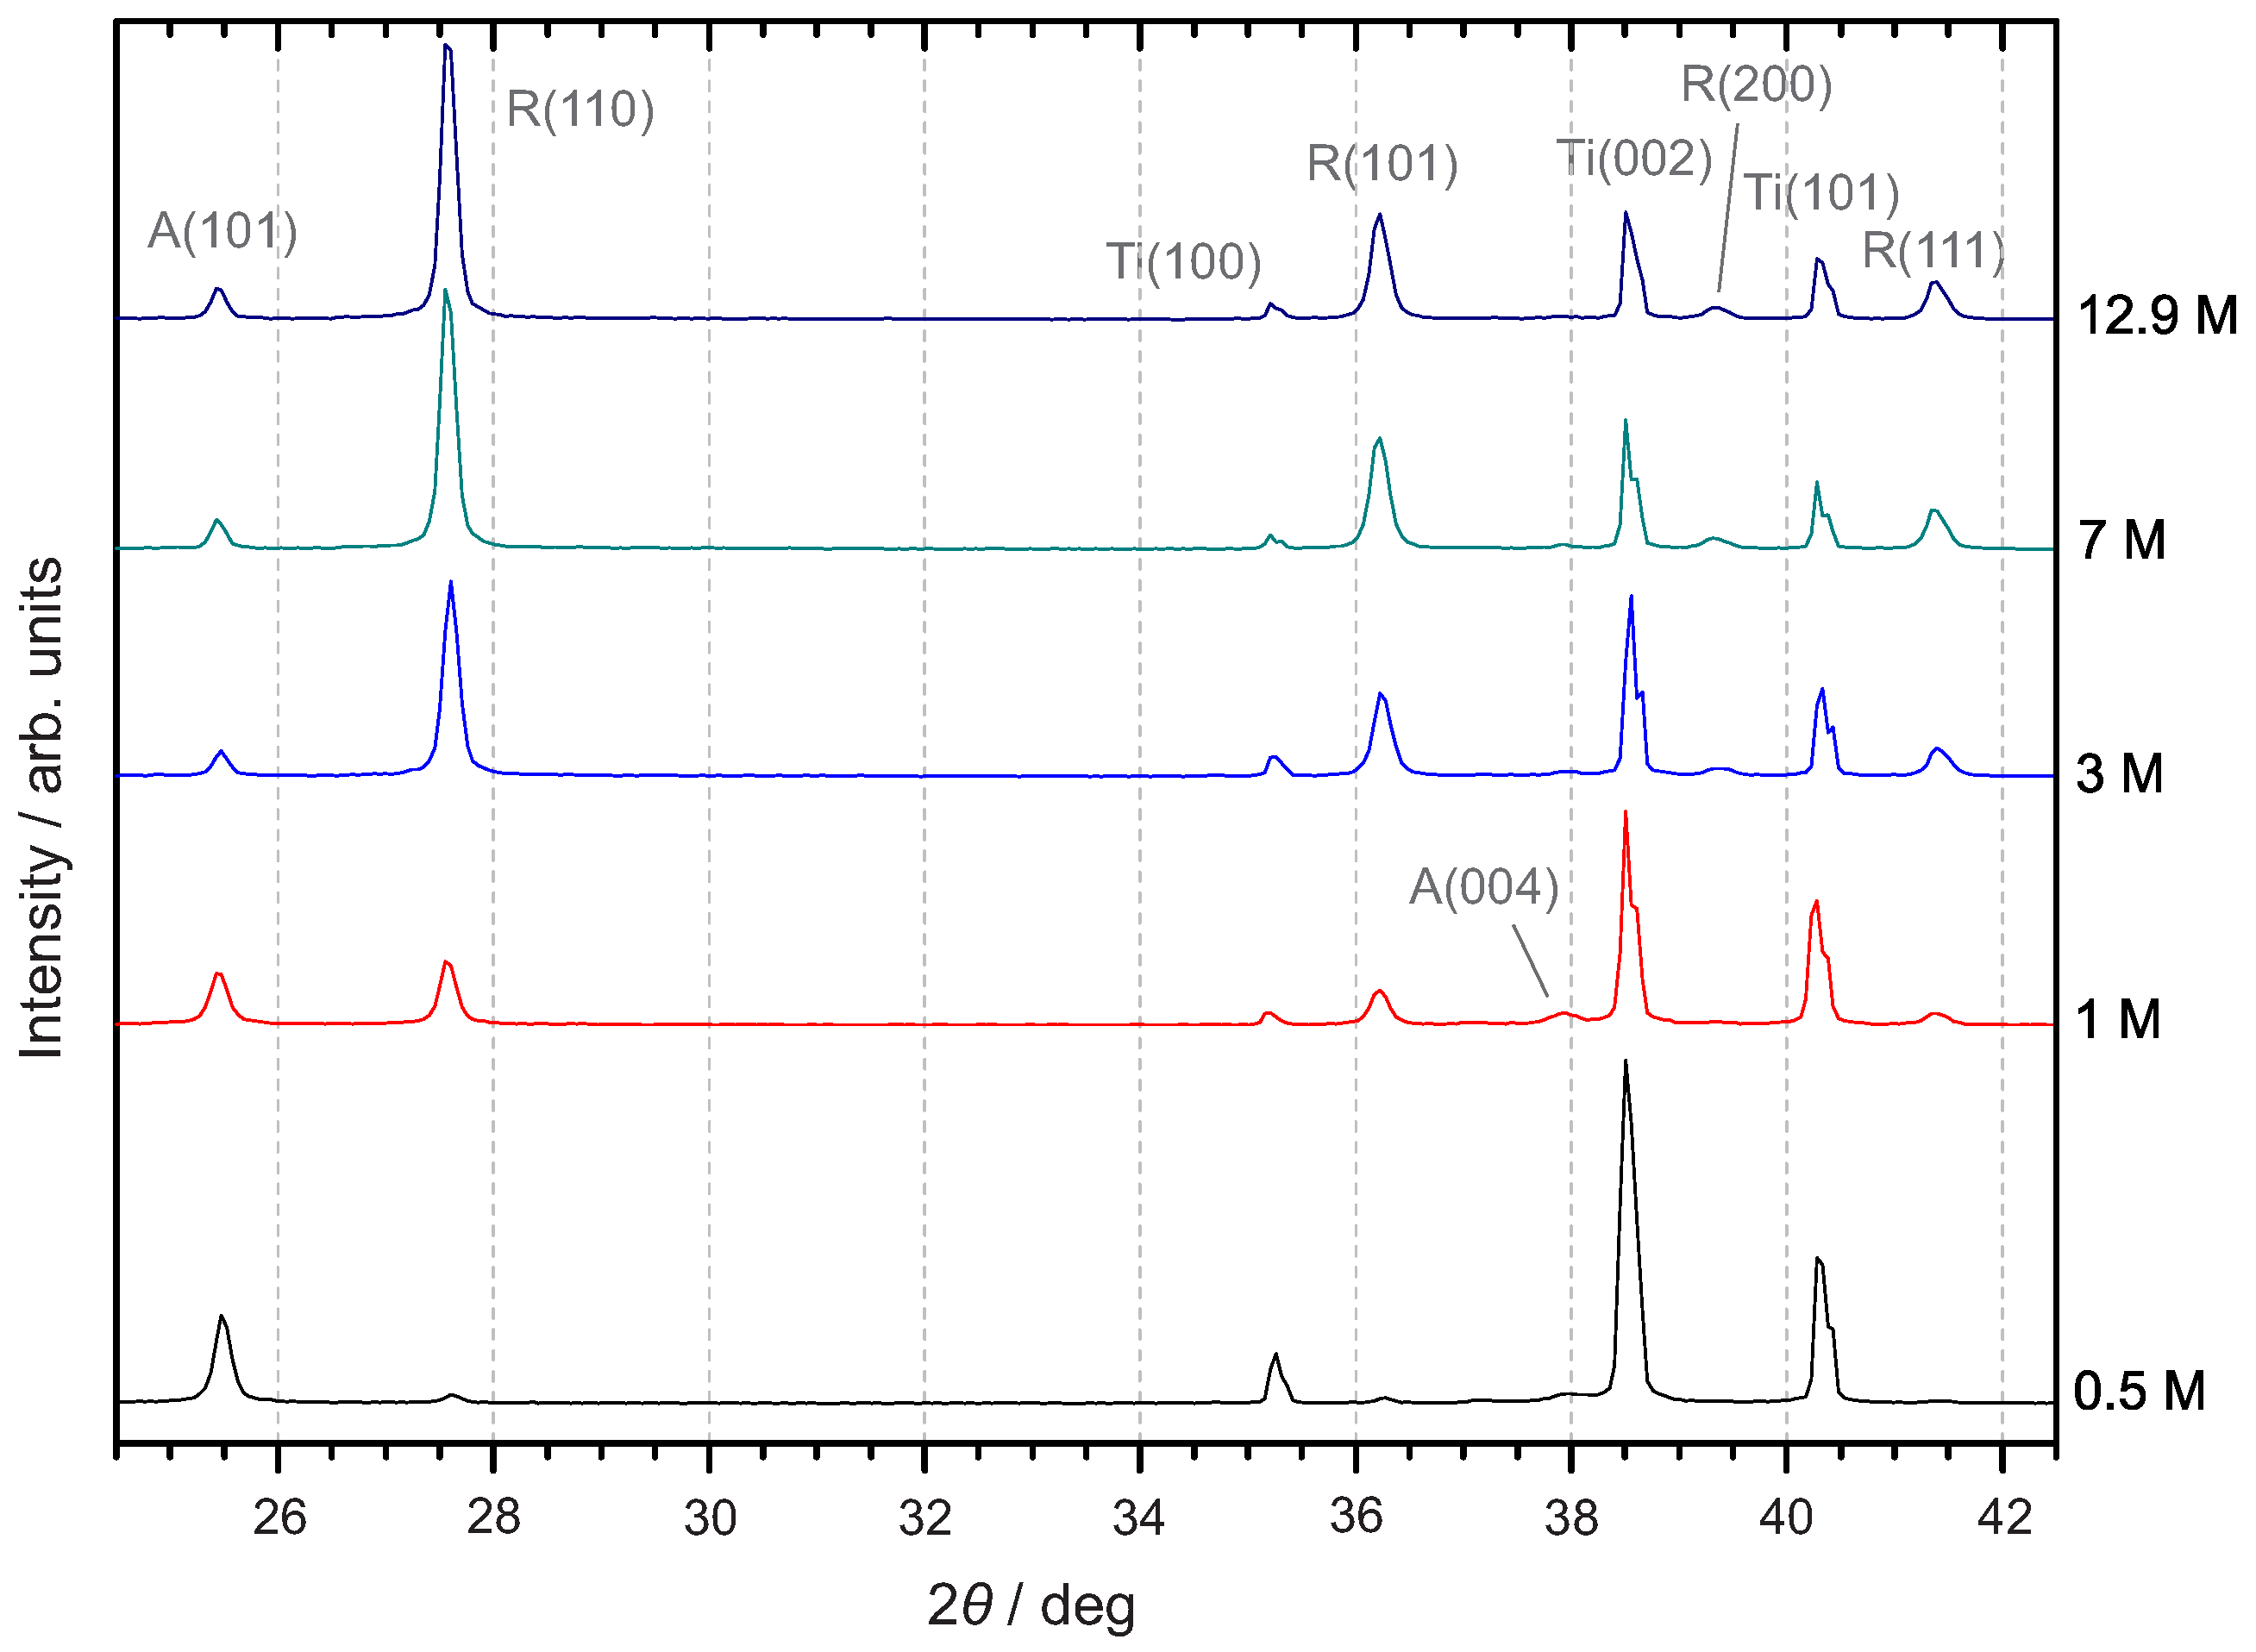
3.3.1. X-ray Diffraction

XRD scans for samples prepared with 0.5 M, 1 M, 3 M, 7 M and 12.9 M are displayed from 24.5 to 42.5 in Figure 3. All marked reflections are assigned by ICDD card numbers 00-001-1198 (hexagonal α -Ti), 01-089-4920 (TiO 2 rutile) and 01-073-1764 (TiO 2 anatase). Reflections derived from brookite are not observed. Because of the increasing thickness of the oxide layer (as found in the SEM images), the reflection intensities derived from α -Ti, for example Ti(002), decrease with the concentration of H 2 SO 4 . At the same time, the intensities of the rutile-derived reflections, i.e., R(110), R(101), R(200) and R(111), increase strongly. In contrast the A(101) and A(004) reflections, that belong to anatase, behave differently. Here the reflections of the 0.5 M sample are significantly larger than for the samples which were prepared in higher concentrated H 2 SO 4 .
Several researchers have calculated x R [12,20,21], the weight fraction of rutile, by comparing the intensities of the most prominent reflections of anatase and rutile, i.e., A(101) and R(110). We determined x R according to
x R = 1 x A = 1 1 + K I A I R
with K = 0.68 for x R 0.8 and K = 0.79 for x R < 0.8 as first suggested by Spurr and Myers [20]. From our data the peak areas I A (101) and I R (110) were determined by deconvolution, using two Voigt functions and a linear background. The coefficient of determination (R 2 ) was ≥0.997.

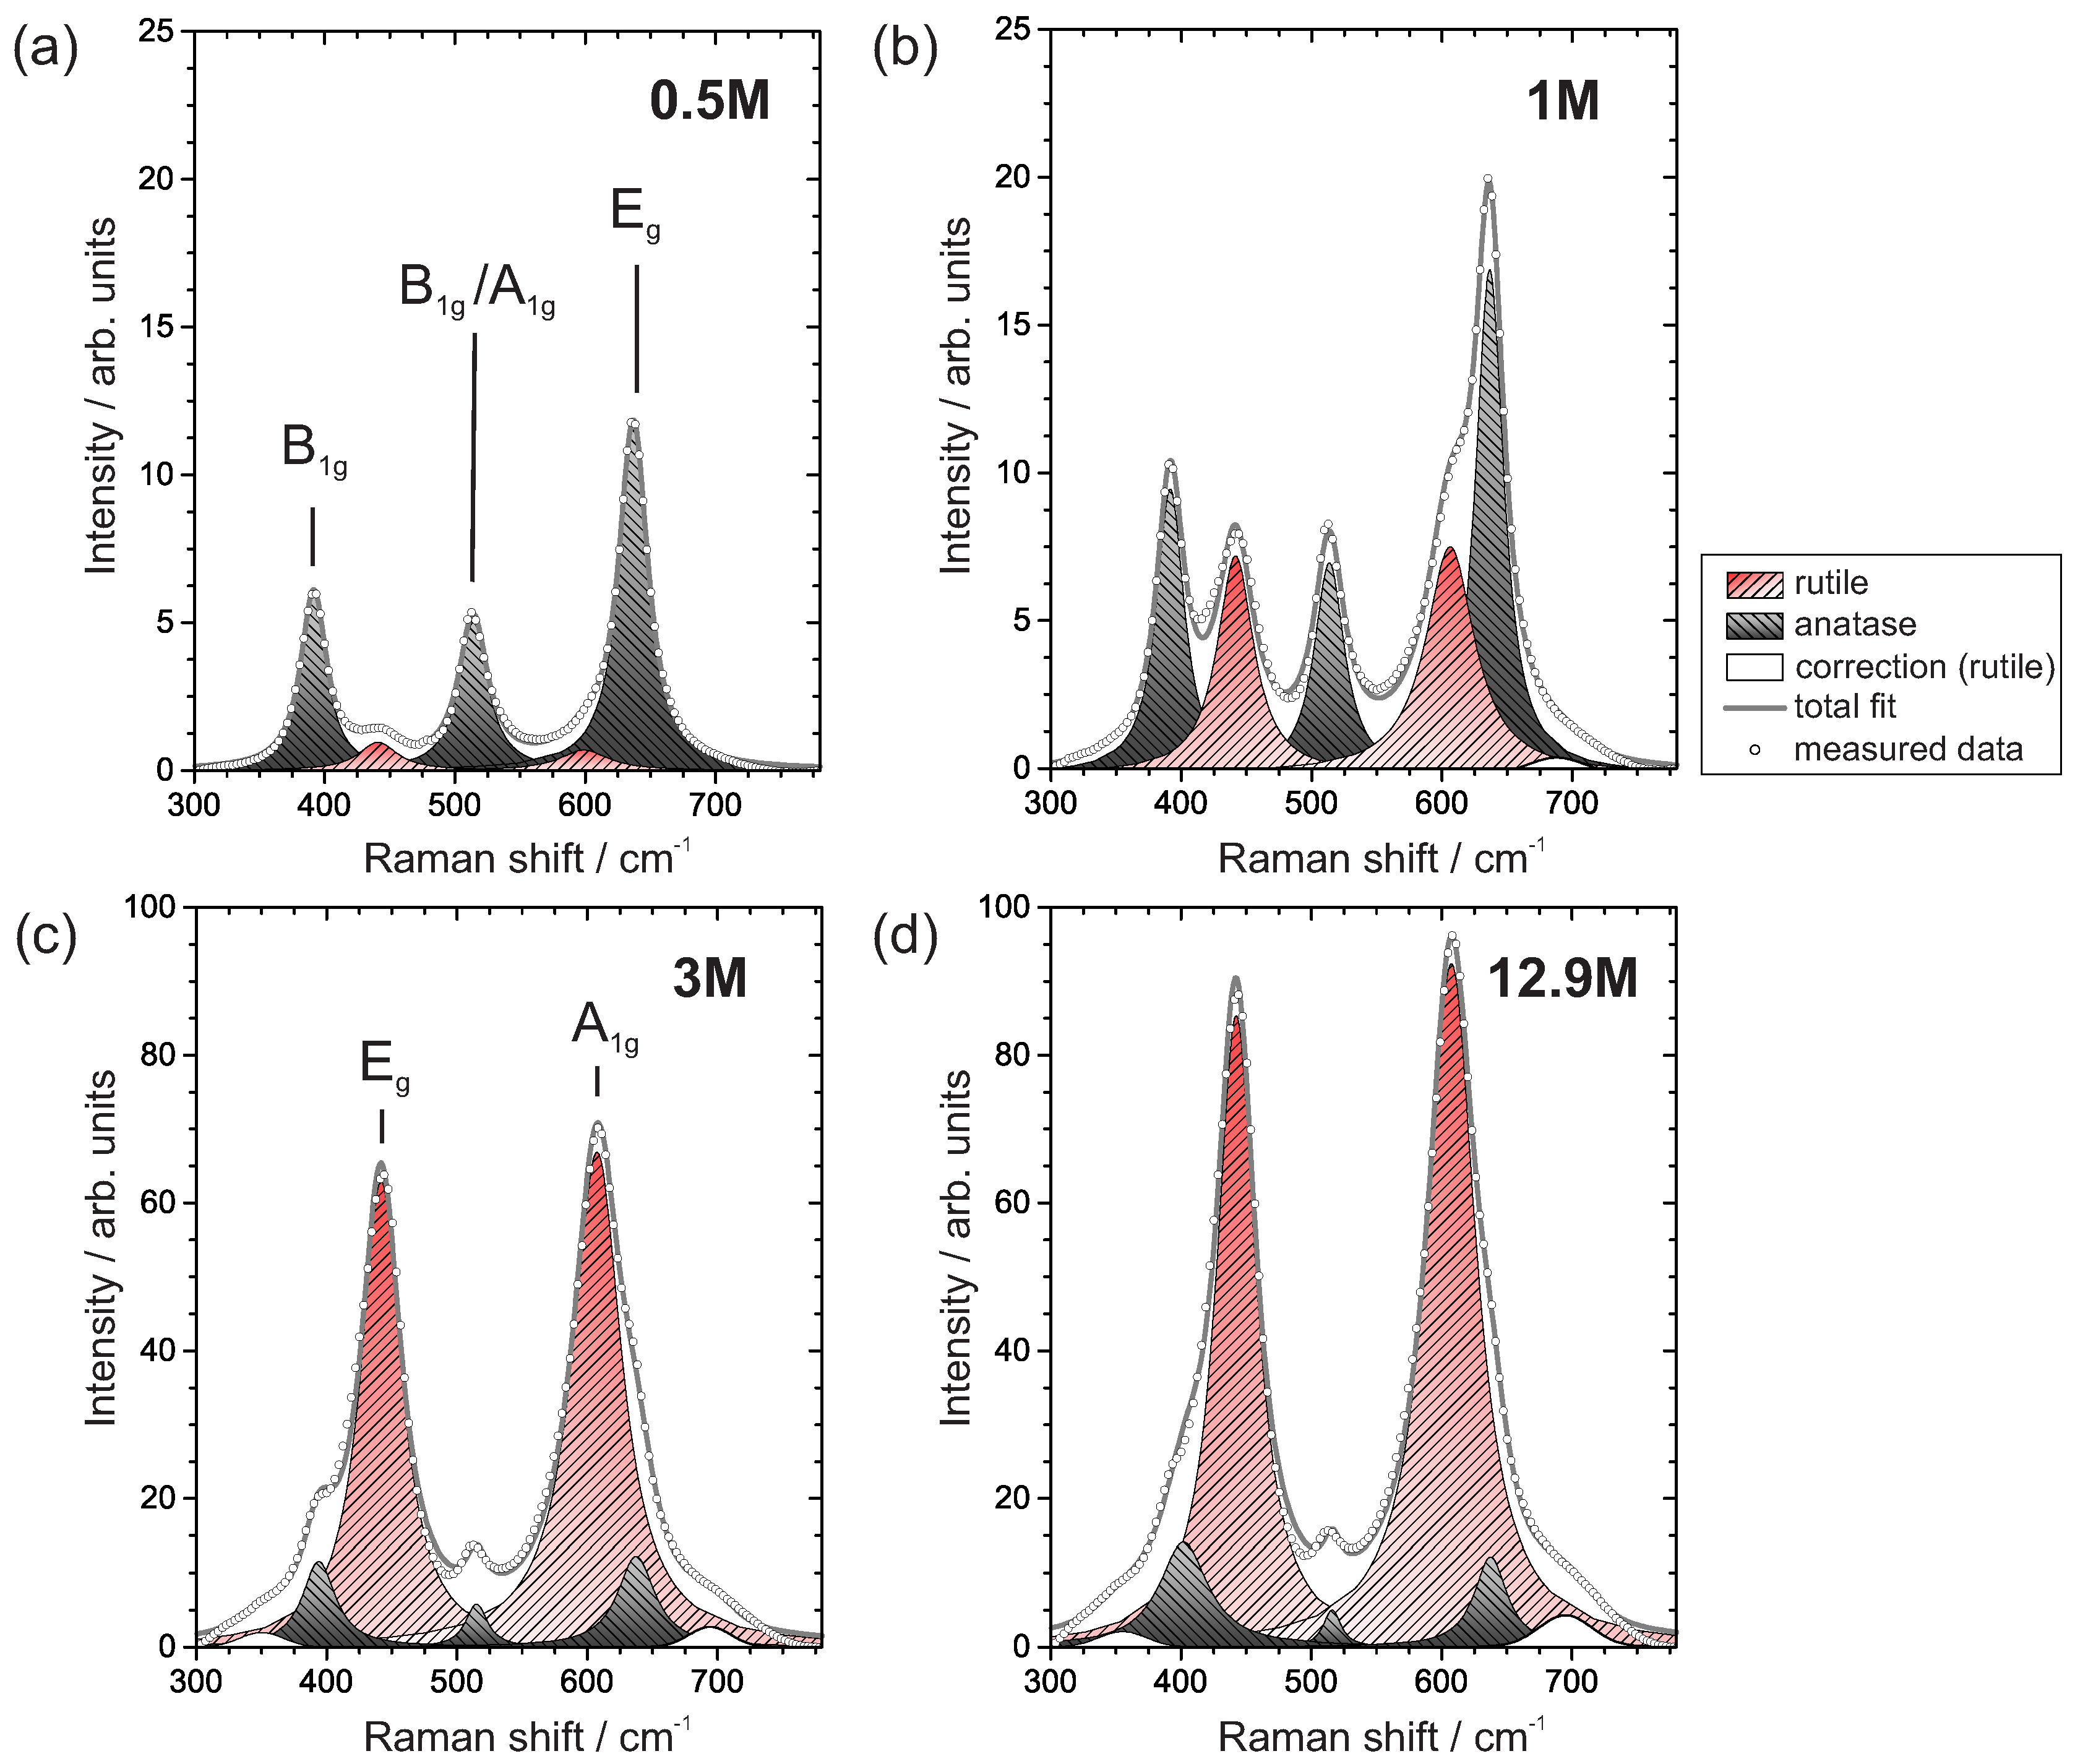
3.3.2. Raman Spectroscopy

Recently, Raman spectroscopy is considered to be an alternative technique to determine rutile and anatase fractions in mixtures [21,22]. Here it is used in additional to XRD. In Figure 4 averaged Raman spectra from samples prepared with 0.5 M, 1 M, 3 M and 12.9 M are presented. Raman-active modes derived from anatase are centered around 395 cm 1 (B 1 g ), 515 cm 1 (B 1 g and A 1 g ) and 637 cm 1 (E g ). two active modes frome the rutile phase around 442 cm 1 (E g ) and 605 cm 1 (A 1 g ) are identified [23,24].
The deconvolution in Figure 4 was done with OriginPro 9.0 (OriginLab Corp., Northampton, MA, USA). A linear background from 300–780 cm 1 was substracted. According to the origin of the Raman modes, we assumed a mainly Lorentian shape with a constant Gaussian contribution (due to instrumental effects), resulting in a Voigt profile. The total FWHM was limited to 50 cm 1 and the Gaussian width was kept constant at 5 cm 1 .
The evaluation shows that the mixed Raman spectra of rutile and anatase in the region 300–780 cm 1 are composed of more than five Raman active modes. The intensity around 515 cm 1 is derived from two single modes, B 1 g and A 1 g , of the anatase phase, but cannot be separated in the fitting procedure. Besides the first-order Raman modes, numerous combination modes contribute to the total spectra [24]. It can be assumed, that contributions of combination modes are mainly induced by the rutile phase. To take into account these combination modes, two corrections, in terms of two additional Voigt profiles, around 330–360 cm 1 and around 680–700 cm 1 were added. The final fit obtained a coefficient of determination (R 2 ) ≥ 0.994.
Zanatta et al. [21] suggested a method to estimate the concentration of rutile in TiO 2 and found
x R = A R A A + A R ,
with A A and A R , representing the total areas of anatase and rutile deconvolutions, respectively. Here the areas of the correction profiles contribute to the total area of rutile.

4. Discussion

We start the discussion of our results with a brief overview of the oxide growth model of the PEO process, previously suggested by El Achhab et al. [18]. It explains qualitatively the formation of the two well distinguishable oxide layers, i.e., the porous and the compact layer that were found in the SEM images of the samples’ cross-sections. In the initial phase of our PEO process (i.e., for an applied voltage less than 90 V for 1 M and less than 70 V for 12.9 M H 2 SO 4 ), potentiostatic conditions prevail and anodic oxidation controls the oxide growth on top of the titanium substrate. Ostwald’s step rule suggests the formation of the less stable crystallite (in our case anatase) in a non-equilibrium situation for entropy reasons [25]. Therefore, we believe, that small nuclei of anatase are favored over rutile formation on the bare titanium surface. They coalesce and continuously grow until a first anatase layer covers the titanium. Each subsequent voltage step induces anatase growth and increases the thickness step-wisely at the surface of the titanium substrate. The growth can be associated with the current decay, seen in the transients of I (compare Figure 1). The evaluation of the decay yields a characteristic half life t 1 / 2 which varies with the electrolyte concentration.
After the initial phase (i.e., at voltages above 90 V for 1 M and 70 V for 12.9 M), the discharges occur and drastically affect the growth. In this regime of the PEO process, the applied voltage exceeds, immediately after a voltage step, the breakdown voltage V B of the oxide layer. The I and V transients reveal galvanostatic conditions (i.e., in the period Δ t , compare Figure 1). The nature of single discharges and their impact have been explained by several researchers for other systems [19,26] and is assumed to be analogous for TiO 2 . These strong discharges degrade the passivation layer of anatase. It is locally destroyed and the bare titanium substrate can be chemically attacked by sulphuric acid. At these sites temporary dissolution occurs. An additional effect results from the plasma which is formed during these discharges and is accompanied by a local temperature rise. The high temperature causes melting, gas evolution and formation of channels in the oxide. Around the discharge channels the temperature is sufficiently high to induce an irreversible transformation of anatase to rutile. In a certain distance from the channel, the transformation temperature is not reached and no conversion of the anatase takes place. Due to the local removal of the passivating layer, the potential barrier breaks down and the discharges at these sites stop. The remaining oxide layer cools rapidly down and further transition of anatase to rutile is inhibited. Simultaneously, the continuous anodic oxidation of titanium to anatase heals the passivation layer and the dissolution gradually stops.
Galvanostatic conditions after a voltage step last, however, only for a short time (i.e., Δ t ) since the passivating property of the oxide layer increases. After Δ t , the PEO process is again under potentiostatic control and the frequency as well as the intensity of discharges decrease over the course of time. The anodic growth of anatase dominates until the next voltage step is applied. Finally, the PEO process is completed when the last voltage step was conducted. Its value equals 130 V and is lower than the preceding value of 145 V.
Our results of SEM, XRD and Raman spectroscopy are summarized in Figure 5. The total layer thickness, derived from the SEM images of cross-sections from selected samples, can be separated into a porous (white column) and compact part (grey column). Both thicknesses increase with increasing H 2 SO 4 electrolyte concentration, but the porous layer is always thicker. We found that the strongest effect in the thickness increase is below an electrolyte concentration of around 7 M. Evidently, higher concentrations lead to only marginally higher layer thicknesses. Compared to the porous layer, the compact oxide interlayer is relatively thin. Its thickness equals 0.12 μ m for 1 M and increases weakly up to 0.25 μ m for 12.9 M.
We found a substantial change of the phase composition between electrolyte concentrations of 0.5 M and 3 M. In samples produced with 0.5 M, anatase dominates and has a fraction of more than 80%. For concentrations above 3 M, the rutile contribution exceeds and has a fraction of over 80%. Since the thickness of the porous layer increases at the same time, we assume that the porous layer is composed mainly of rutile. Both Raman spectroscopy and XRD data (compare Figure 5) indicate an increase of the rutile fraction x R . However, it is evident that XRD-derived values of x R are significantly larger than Raman-derived values (with one exception for 0.5 M). The Equation (1) was derived from XRD analysis of polycrystalline powders. Since the PEO process does not likely produce a random orientation of crystallites the evaluation of XRD data may exhibit a systematic error. Several effects have been discussed in the literature to explain such overestimation of x R fractions from XRD data [21,22]. In our case, non-isotropic growth of the crystallites can also favor certain orientations which may cause larger peak intensities of the corresponding X-ray reflections.
With the help of the oxide growth model, given above, one can rationalize the observed concentration-dependence of thickness, microstructure and phase composition. The thickness of the compact layer, formed as the result of anodic oxidation, is controlled by the corresponding growth rate. The experiment shows that the values of the half life t 1 / 2 , associated with anodic oxidation, decrease with rising electrolyte concentration. Half life times depend slightly on the initial value of each voltage step and may scatter significantly, due to the current spikes at higher voltages, that adversely affect their accurate determination. Quantitative values of t 1 / 2 are given here only for the voltage step 110 V (indicated in Figure 1), which are about 113 ± 20 s for 1 M and 10 ± 5 s for 12.9 M, respectively. In between, they decline monotonously with increasing concentration. It is also found that the values of I 0 are smaller in higher concentrations, which confirms thicker anatase layers. At the same time, the sum of Δ t periods, in which the transformation of anatase to rutile takes place, becomes larger between 0.5 M to 12.9 M. We conclude that the effect of both anatase formation and anatase-to-rutile conversion is more pronounced at high concentrations of H 2 SO 4 . As a result, the total layer thickness increases strongly while the compact layer gets only slightly thicker for rising concentration.
The formation of the porous layer is mainly determined by the number and intensity of discharges that occur above the breakdown voltage V B . Previous research has shown that V B depends on the ion conductivity of the electrolyte, which is a function of the electrolyte concentration [13,27]. In accordance with the theory, V B is smaller in 12.9 M than in 1 M (compare, e.g., the I transients for 12.9 M and 1 M in Figure 1). Correspondingly, discharges appear already around 70 V in 12.9 M while they appear around 90 V in 1 M. Besides the lower breakdown voltage V B , the period of galvanostatic control Δ t (i.e., I = I max ), in which strong discharges predominate, rise with electrolyte concentration. Another concentration-dependent effect arises from the etching of the oxide layer in the sulfuric acid. Since concentrated sulfuric acid reacts stronger than diluted one with respect to its dissolving property, one may assume that the increasing surface density of sites, locally etched by the acid, promote discharges. The combined action of these effects consequently enhances the pore sizes and roughness, at increasing concentrations of H 2 SO 4 . Since discharges also promote the transformation from anatase to rutile, the rutile fraction becomes larger and saturates at 3 M.
The last voltage step of our process is 130 V and is considerably lower than the previous voltage with 145 V. At this voltage, no discharges occur and anodic oxidation produces anatase at the titanium substrate. If the last voltage step is omitted in the PEO process the rutile fraction becomes slightly larger for a preparation in 12.9 M, as indicated in Figure 5. This observation is in line with our growth model of the oxide layer on titanium.

5. Conclusions

We refined a PEO process for titanium, which benefits from the combination of galvanostatic and potentiostatic oxidation. The effect of varying H 2 SO 4 concentrations was investigated from 0.5 M up to 12.9 M. Thickness, porosity and phase composition change drastically. SEM investigations showed that the resulting oxide layer can be distinguished by a thin interlayer at the titanium substrate and a thick porous layer on-top of the interlayer. The former mainly consists of anatase, while the porous structure, greatly influenced by the impact of plasma discharges, reveals a large rutile content. The weight fractions of both modifications have been quantitatively determined by analyzing XRD and Raman spectroscopy data. Based on the experimental results, we gain further insight into the growth mechanism of our PEO-process. It was found that the H 2 SO 4 electrolyte concentration can be used to control the number and intensity of discharges, as well as the anodic oxidation growth rate. Furthermore, it was shown that the concentration also alters the periods of galvanostatic and potentiostatic conditions. Hence, besides the influence of the electrolyte concentration, we believe that the structure of the plasma-electrochemically produced oxide layer can be adjusted by tuning the periods of galvanostatic and potentiostatic control.

Author Contributions

B.E., M.E., K.S. and B.F. conceived and designed the experiments; B.E. and B.F. performed the experiments; B.E. analyzed the data; B.E., M.E., K.S., B.F. and Ü.K.-D. contributed reagents/materials/analysis tools; B.E. wrote the paper.

Acknowledgments

This research was supported by Bundesministerium für Wirtschaft und Energie (BMWi) under project no. ZF4185502ZG6. We gratefully thank Egbert Wessel (Forschungszentrum Jülich, IEK-2, 52425 Jülich) for the SEM measurements. Fruitful discussions with Engin Ciftyürek are gratefully acknowledged.

Conflicts of Interest

The authors declare no conflict of interest.

References

  1. Diamanti, M.V.; Ormellese, M.; Pedeferri, M. Application-wise nanostructuring of anodic films on titanium: A review. J. Exp. Nanosci. 2015, 10, 1285–1308. [Google Scholar] [CrossRef]
  2. Diamanti, M.V.; Del Curto, B.; Pedeferri, M. Anodic oxidation of titanium: From technical aspects to biomedical applications. J. Appl. Biomater. Biomech. 2011, 9. [Google Scholar] [CrossRef] [PubMed]
  3. Schierbaum, K.; El Achhab, M. Generation of an electromotive force by hydrogen-to-water oxidation with Pt-coated oxidized titanium foils. Phys. Status Solidi 2011, 208, 2796–2802. [Google Scholar] [CrossRef]
  4. Karpov, E.G.; Hashemian, M.A.; Dasari, S.K. Chemistry-Driven Signal Transduction in a Mesoporous Pt/TiO2 System. J. Phys. Chem. C 2013, 117, 15632–15638. [Google Scholar] [CrossRef]
  5. Cakabay, Ö.; El Achhab, M.; Schierbaum, K. Thermal properties of solid-state Pt/TiO2/Ti emf cells studied by microcalorimetry. Appl. Phys. A 2015, 118, 1127–1132. [Google Scholar] [CrossRef]
  6. El Achhab, M.; Schierbaum, K. Gas sensors based on plasma-electrochemically oxidized titanium foils. J. Sensors Sensor Syst. 2016, 5, 273–281. [Google Scholar] [CrossRef]
  7. Vanhumbeeck, J.F.; Proost, J. Current understanding of Ti anodisation: Functional, morphological, chemical and mechanical aspects. Corros. Rev. 2009, 27, 117–204. [Google Scholar] [CrossRef]
  8. Quintero, D.; Galvis, O.; Calderón, J.; Castaño, J.; Echeverría, F. Effect of electrochemical parameters on the formation of anodic films on commercially pure titanium by plasma electrolytic oxidation. Surf. Coat. Technol. 2014, 258, 1223–1231. [Google Scholar] [CrossRef]
  9. Sul, Y.T.; Johansson, C.B.; Jeong, Y.; Albrektsson, T. The electrochemical oxide growth behaviour on titanium in acid and alkaline electrolytes. Med. Eng. Phys. 2001, 23, 329–346. [Google Scholar] [CrossRef]
  10. Yang, B.; Uchida, M.; Kim, H.M.; Zhang, X.; Kokubo, T. Preparation of bioactive titanium metal via anodic oxidation treatment. Biomaterials 2004, 25, 1003–1010. [Google Scholar] [CrossRef]
  11. Diamanti, M.V.; Pedeferri, M.P. Effect of anodic oxidation parameters on the titanium oxides formation. Corros. Sci. 2007, 49, 939–948. [Google Scholar] [CrossRef]
  12. Masahashi, N.; Mizukoshi, Y.; Semboshi, S.; Ohtsu, N. Enhanced photocatalytic activity of rutile TiO2 prepared by anodic oxidation in a high concentration sulfuric acid electrolyte. Appl. Catal. B Environ. 2009, 90, 255–261. [Google Scholar] [CrossRef]
  13. Friedemann, A.; Gesing, T.; Plagemann, P. Electrochemical rutile and anatase formation on (PEO) surfaces. Surf. Coat. Technol. 2017, 315, 139–149. [Google Scholar] [CrossRef]
  14. Fadl-Allah, S.A.; El-Sherief, R.M.; Badawy, W.A. Electrochemical formation and characterization of porous titania (TiO2) films on Ti. J. Appl. Electrochem. 2008, 38, 1459. [Google Scholar] [CrossRef]
  15. Sun, C.; Hui, R.; Qu, W.; Yick, S.; Sun, C.; Qian, W. Effects of processing parameters on microstructures of TiO2 coatings formed on titanium by plasma electrolytic oxidation. J. Mater. Sci. 2010, 45, 6235–6241. [Google Scholar] [CrossRef]
  16. Yerokhin, A.; Nie, X.; Leyland, A.; Matthews, A.; Dowey, S. Plasma electrolysis for surface engineering. Surf. Coat. Technol. 1999, 122, 73–93. [Google Scholar] [CrossRef]
  17. Li, Q.; Liang, J.; Wang, Q. Plasma Electrolytic Oxidation Coatings on Lightweight Metals. In Modern Surface Engineering Treatments; Aliofkhazraei, M., Ed.; InTech: Rijeka, Croatia, 2013; Chapter 4. [Google Scholar]
  18. El Achhab, M.; Erbe, A.; Koschek, G.; Hamouich, R.; Schierbaum, K. A microstructural study of the structure of plasma electrolytically oxidized titanium foils. Appl. Phys. A 2014, 116, 2039–2044. [Google Scholar] [CrossRef]
  19. Hussein, R.O.; Nie, X.; Northwood, D.O.; Yerokhin, A.; Matthews, A. Spectroscopic study of electrolytic plasma and discharging behaviour during the plasma electrolytic oxidation (PEO) process. J. Phys. D Appl. Phys. 2010, 43, 105203. [Google Scholar] [CrossRef]
  20. Spurr, R.A.; Myers, H. Quantitative analysis of anatase-rutile mixtures with an X-ray diffractometer. Anal. Chem. 1957, 29, 760–762. [Google Scholar] [CrossRef]
  21. Zanatta, A. A fast-reliable methodology to estimate the concentration of rutile or anatase phases of TiO2. AIP Adv. 2017, 7, 075201. [Google Scholar] [CrossRef]
  22. Hanaor, D.A.H.; Sorrell, C.C. Review of the anatase to rutile phase transformation. J. Mater. Sci. 2011, 46, 855–874. [Google Scholar] [CrossRef]
  23. Balachandran, U.; Eror, N.G. Raman spectra of titanium dioxide. J. Solid State Chem. 1982, 42, 276–282. [Google Scholar] [CrossRef]
  24. Frank, O.; Zukalova, M.; Laskova, B.; Kürti, J.; Koltai, J.; Kavan, L. Raman spectra of titanium dioxide (anatase, rutile) with identified oxygen isotopes (16, 17, 18). Phys. Chem. Chem. Phys. 2012, 14, 14567–14572. [Google Scholar] [CrossRef] [PubMed]
  25. Van Santen, R.A. The Ostwald step rule. J. Phys. Chem. 1984, 88, 5768–5769. [Google Scholar] [CrossRef]
  26. Klapkiv, M.D.; Nykyforchyn, H.M.; Posuvailo, V.M. Spectral analysis of an electrolytic plasma in the process of synthesis of aluminum oxide. Mater. Sci. 1995, 30, 333–343. [Google Scholar] [CrossRef]
  27. Albella, J.; Montero, I.; Martinez-Duart, J. A theory of avalanche breakdown during anodic oxidation. Electrochimica Acta 1987, 32, 255–258. [Google Scholar] [CrossRef]
Figure 1. Voltage, current and temperature transients during the PEO process in (a) 1 M and (b) 12.9 M H 2 SO 4 electrolyte concentration. Further explanation is given in the text.
Metals 08 00386 g001
Figure 2. Scanning electron microscope surface and cross-section images from samples prepared with PEO in 0.5 M, 1 M, 3 M, 7 M and 12.9 M electrolyte concenctration of sulphuric acid.
Metals 08 00386 g002
Figure 3. X-ray diffractograms from 24.5 to 42.5 (2 θ ) of samples produced with different H 2 SO 4 concentrations. Labeled reflections are assigned to α -Ti, TiO 2 rutile and TiO 2 anatase. Most prominent features of the TiO 2 crystallographic phases are the (101) reflection for anatase (2 θ = 25.46 ) and the (110) reflection for rutile (2 θ = 27.59 ).
Metals 08 00386 g003
Figure 4. Raman spectra for TiO 2 samples from 300–780 cm 1 produced in (a) 0.5 M, (b) 1 M, (c) 3 M and (d) 12.9 M H 2 SO 4 . Data points are averaged from 100 single acquisitions along a line. Deconvolution were done with a linear background and voigt profiles. Raman active modes are labeled for anatase in (a) and for rutile in (c).
Metals 08 00386 g004
Figure 5. Experimentally derived weight fraction between TiO 2 crystal phases rutile and anatase in different samples as a function of H 2 SO 4 concentration. The fraction is presented with the estimated uncertainty of each sample and is determined from data acquired with XRD and Raman spectroscopy. The columns represent the thickness of the porous and compact oxide layer, as determined by SEM investigation on selected samples.
Metals 08 00386 g005
Table 1. Pore size, thickness of the porous layer and thickness of the compact layer derived from SEM investigation.
0.5 M1 M3 M7 M12.9 M
Pore size/ μ m0.20 ± 0.090.25 ± 0.070.29 ± 0.080.35 ± 0.060.38 ± 0.07
Thickness porous layer/ μ m0.79 ± 0.061.39 ± 0.093.18 ± 0.205.14 ± 0.205.21 ± 0.62
Thickness compact layer/ μ m0.13 ± 0.030.12 ± 0.030.22 ± 0.040.25 ± 0.030.25 ± 0.03

