DFT Study of Azole Corrosion Inhibitors on Cu2O Model of Oxidized Copper Surfaces: II. Lateral Interactions and Thermodynamic Stability


1
Department of Physical and Organic Chemistry, Jožef Stefan Institute, Jamova 39, SI-1000 Ljubljana, Slovenia
2
Faculty of Chemisty and Chemical Technology, University of Ljubljana, Večna pot 113, SI-1000 Ljubljana, Slovenia
*
Author to whom correspondence should be addressed.
Metals 2018, 8(5), 311; https://doi.org/10.3390/met8050311
Submission received: 21 February 2018
/
Revised: 16 April 2018
/
Accepted: 25 April 2018
/
Published: 1 May 2018
(This article belongs to the Special Issue Corrosion Inhibition)
Abstract
:The adsorption of imidazole, triazole, and tetrazole—used as simple models of azole corrosion inhibitors—on various CuO(111)- and CuO(110)-type surfaces was characterized using density functional theory (DFT) calculations with the focus on lateral intermolecular interactions and the thermodynamic stability of various adsorption structures. To this end, an ab initio thermodynamics approach was used to construct two-dimensional phase diagrams for all three molecules. The impact of van der Waals dispersion interactions on molecular adsorption bonding was also addressed. Lateral intermolecular interactions were found to be the most repulsive for imidazole and the least for tetrazole, for which they are usually even slightly attractive. Both non-dissociative and dissociative adsorption modes were considered and although dissociated molecules bind to surfaces more strongly, none of the considered structures that involve dissociated molecules appear on the phase diagrams. Our results show that the three azole molecules display a strong tendency to preferentially adsorb at reactive coordinatively unsaturated (CUS) Cu surface sites and stabilize them. According to the calculated phase diagrams for CuO(111)-type surfaces, the three azole molecules adsorb to specific CUS sites, designated as Cu, under all conditions at which molecular adsorption is stable. This tentatively suggests that their corrosion inhibition capability may stem, at least in part, from their ability to passivate reactive surface sites. We further comment on a specific drawback due to neglect of configurational entropy that is usually utilized within the ab initio thermodynamics approach. We analyze the issue for Langmuir and Frumkin adsorption models and show that when configurational entropy is neglected, the ab initio thermodynamics approach is too hasty to predict phase-transition like behavior.
1. Introduction
This is the second part of the two-part series of articles about the adsorption of three simple azole molecules—imidazole, triazole, tetrazole—on various sites of several CuO(111)- and CuO(110)-type surfaces, including Cu and O vacancies, characterized by means of density functional theory (DFT) calculations. In Part I [1] we focused on the azole–surface bonding described at lower coverage without reference to lateral intermolecular interactions—these are addressed in the current Part II—and compared it to the Cl–surface bonding. While the three azole molecules (their molecular structures are shown in Scheme 1) can be seen as models of azole corrosion inhibitors, chloride is a prototypical corrosion activator. As for molecular adsorption, both non-dissociative and dissociative adsorption modes were considered—the latter involves N1–H bond cleavage—and we showed that intact molecules bind to the surface considerably more weakly in comparison to dissociated molecules, which adsorb strong enough to rival the Cl–surface bonds, although even intact molecules can bind rather strongly to specific coordinatively unsaturated (CUS) Cu sites. Indeed, specific coordinatively unsaturated Cu sites bind adsorbates much more strongly than saturated sites, which is precisely what one would expect. Among them, the O vacancy sites, which consist of a triplet of unsaturated Cu ions, were found particularly reactive for the dissociation of the N1–H bond. While non-dissociative adsorption energies were found similar for all three molecules, significant difference between them appeared for the dissociative adsorption mode, i.e., dissociated triazole and tetrazole bind considerably stronger than dissociated imidazole, because the former two can form two strong N–Cu bonds, but imidazole cannot due to its incompatible molecular geometry. Dissociative adsorption is consequently favorable only for triazole and tetrazole, but only at the aforementioned oxygen vacancy sites, where it proceeds without barrier (or nearly so).
In the current paper, we first address the lateral intermolecular interactions as a function of molecular surface coverage and then consider thermodynamic stability of various adsorption structures using the method known as ab initio thermodynamics [2]. Due to obvious modeling reasons the adsorption is considered at a solid/vacuum interface in the current two-part series of articles, although in the context of corrosion inhibition it would be more appropriate to consider adsorption at a solid/water interface. We further comment on a specific drawback concerning the way the ab initio thermodynamics approach is usually employed, which is due to neglect of configurational entropy and present an analysis of how this neglect affects the adsorption isotherms in the case of Langmuir and Frumkin adsorption models.
This paper is organized as follows: the next section presents technical details, which include computational method, description of the surface models and surface sites thereon, definition of various adsorption modes as well as the utilized thermodynamic framework. Results are presented in Section 3, whereas in Section 4 we discuss our results and analyze the above-mentioned drawback related to neglect of configurational entropy in approximate ab initio thermodynamics treatment. Finally, Section 5 contains our conclusions.
2. Technical Details and Definitions
2.1. Computational Details
DFT calculations were performed with the generalized gradient approximation (GGA) of Perdew–Burke–Ernzerhof (PBE) [3]. The reason for this choice is motivated by the observation that the GGA+U method, which is often used for the description of transition-metal oxides, does not substantially improve the band-gap of CuO [4,5]. Nevertheless, the effect of the +U correction on the adsorption properties of current molecules on CuO surfaces was evaluated to some extent and the comparison between the PBE and PBE+U methods is provided in Appendix A of Part I [1].
To better describe lateral intermolecular interactions, we also utilized the functional, which includes a reparametrized empirical dispersion correction of Grimme [6,7] that consists of a damped CR like energy term on top of PBE. The double prime in the label indicates the reparametrization of the original method. The reason for the reparametrization is that the original PBE-D overestimates molecular bonding tocopper surfaces [8,9,10,11], which can be attributed to a too large value of the Cu atom [10]. The is reparametrized so as to match the experimental adsorption energy of a flat lying benzene on Cu(111) (for details, see our previous publication [12]). In particular, the parameter of Cu was set to the value of 140 Ry/Bohr (the original value is 375 Ry/Bohr).
The pseudopotential method with ultrasoft pseudopotentials was used [13,14]. The Kohn–Sham orbitals were expanded in a plane-wave basis set up to a kinetic energy cutoff of 30 Ry (240 Ry for the charge density cutoff). Brillouin zone (BZ) integrations were performed employing the special-point technique [15] using Marzari–Vanderbilt cold smearing [16] of 0.01 Ry. All calculations were done using the PWscf code from the Quantum ESPRESSO distribution [17,18].
2.2. CuO as a Model of Oxidized Copper Surface and Description of Considered Surface Models
CuO slabs without a metal support underneath were used as models of oxidized copper surfaces; the justification of this choice is provided in Part I [1]. We use the following surface models (cf. Figure 1; for the more detailed description and graphical representation of considered surfaces, see Figures 1 and 2 in Part I):
- (i)
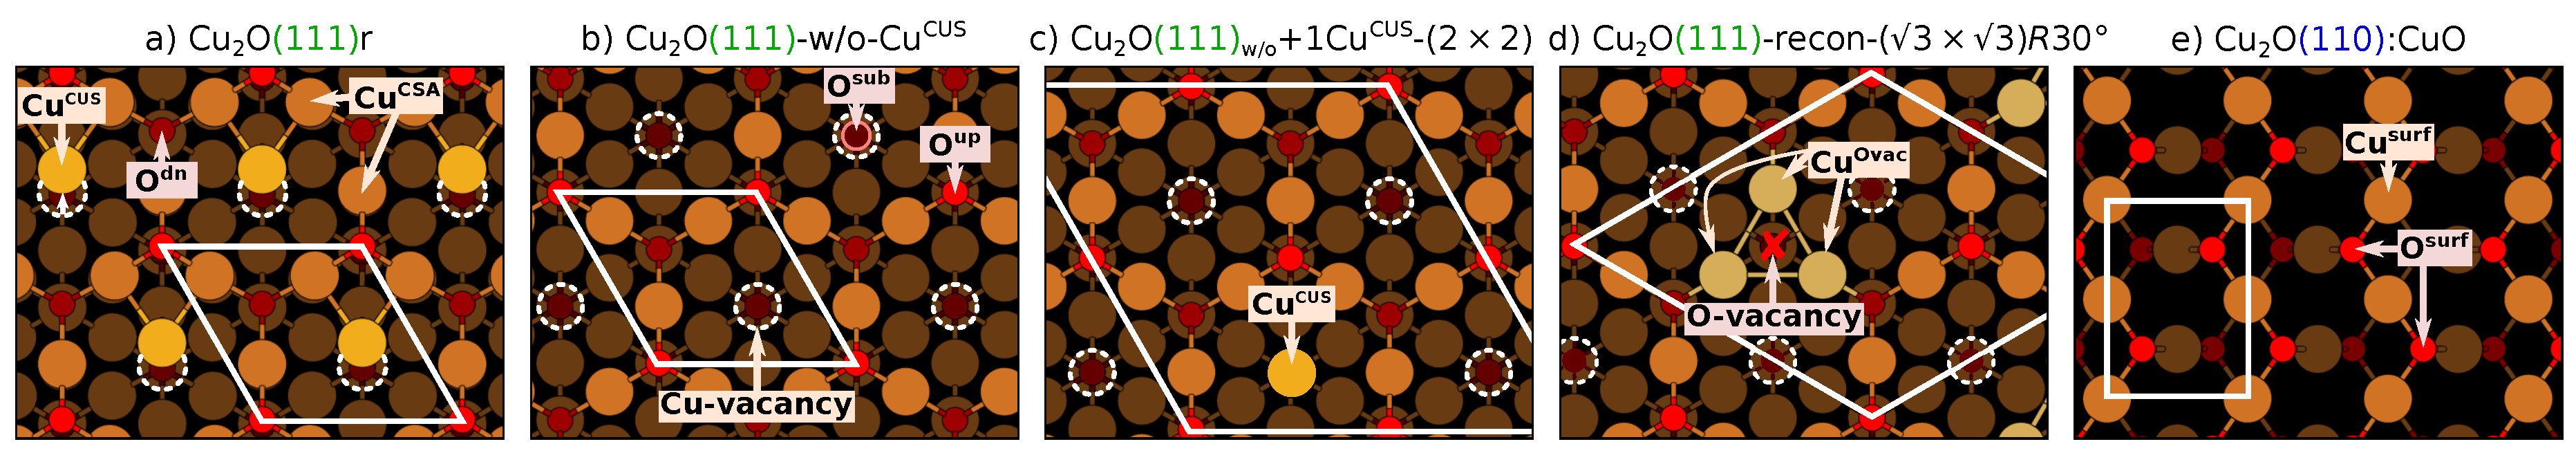
- stoichiometric CuO(111)—this surface contains two distinct copper ions: a coordinatively saturated (CSA) and coordinatively unsaturated (CUS), labeled as Cu and Cu, respectively. It also contains two distinct oxygen ions: O and O located above (up) and below (dn) the surface Cu layer, respectively. Note that the high-symmetry CuO(111) is not stable and when the symmetry is broken the Cu ions relax laterally toward adjacent Cu ions [19]; the corresponding structure is designated as CuO(111)r, where “r” stands for “relaxed”.
- (ii)
- CuO(111)-w/o-Cu—this model is the CuO(111) that lacks all the Cu ions; notation “-w/o-Cu” stands for “CuO(111) without Cu ions”.
- (iii)
- CuO(111)+1Cu—this model is the CuO(111) that lacks all but a single Cu ion either per adsorbed molecule or per supercell; the subscript “w/o” is a shorthand for “w/o-Cu” and the suffix “+1Cu” conveys that one Cu ion is retained.
- (iv)
- CuO(111)-recon-( × )R30—this surface is derived from CuO(111)-w/o-Cu by removing one third of O ions such that the resulting oxygen vacancies form an ordered ( × )R30 pattern. Each O-vacancy is surrounded by three coordinatively unsaturated Cu ions, labeled as Cu. The Cu ions therefore always appear in triplets and we use the term “Cu site” to designate the site composed of these three ions.
- (v)
- CuO(110):CuO—this is the CuO(110) model terminated by a CuO layer on both sides of the slab. Note that the stoichiometric CuO(110) slab consists of CuO–Cu bilayers and is thus polar (terminated with a CuO layer on one side and a Cu layer on the other side). Hence, a symmetric slab terminated with the CuO layer on both sides is used instead; thus the denotation CuO(110):CuO. The surface CuO layer of CuO(110):CuO consists of coordinatively saturated Cu ions, labeled as Cu, and O ions labeled as O.
Note that among the five models only the first one is stoichiometric, while all the others are non-stoichiometric.
The Difference Between CuO(111)+1Cu and CuO(111)+1Cu–(N × N) Designations
The label CuO(111)+1Cu without the postfix specification of the surface supercell designates that the number of Cu ions is equal to the number of adsorbed molecules, i.e., only the Cu ions to which the molecules adsorb are retained. Hence the label CuO(111)+1Cu does not designate a specific model, but rather a series of different surface models, each having a different concentration of Cu ions that matches a given molecular coverage.
In contrast, the label with the postfix specification of the surface supercell, such as CuO(111)+1Cu–(2 × 2) designates that there is only one Cu ion per specified surface supercell. With this designation the number of Cu ions is not related to the number of adsorbed molecules.
2.3. Adsorption Calculations
Adsorption calculations on CuO(111)-type surfaces were modeled with slabs consisting of four O–Cu–O trilayers, whereas CuO(110):CuO was modeled with slabs consisting of five layers, that is, two CuO–Cu bilayers plus an extra CuO layer at the bottom of the slab. For CuO(111)-type surfaces the bottom trilayer and for CuO(110):CuO the bottom bilayer were constrained to bulk positions, while all other degrees of freedom were relaxed. Molecules were adsorbed on the top side of the slab and the thickness of the vacuum region—the distance between the top of the ad-molecule and the adjacent slab—was set to about 20 Å. The dipole correction of Bengtsson [20] was applied to cancel an artificial electric field that develops along the direction normal to the slab due to periodic boundary conditions imposed on the electrostatic potential. In contrast to adsorption calculations, surface energies of clean surfaces were estimated with thicker and fully relaxed symmetric slabs as described below in Section 2.4.
Adsorption properties were calculated with a variety of different supercells so as to model adsorption at different coverages and we used the following uniformly shifted k-meshes for the BZ integrations: (), (), and () k-meshes for ()–CuO(111), ()–CuO(111), and ()–CuO(111) type supercells, respectively; (), (), and () k-meshes for ()–CuO(110):CuO, ()–CuO(110):CuO, and ()–CuO(110):CuO supercells, respectively.
2.3.1. Definition of Surface Coverage
Given the size of the current molecules (and assuming adsorption onto discrete sites), one molecule per ()–CuO(111) or ()–CuO(110):CuO can be reasonably considered as the largest viable coverage before the lateral intermolecular Pauli repulsion sets in. A relative coverage of 1 monolayer (ML) is therefore defined as one molecule per ()–CuO(111) or ()–CuO(110):CuO unit cell; relative coverage will be also designated in percents as, e.g., 1 ML ≡ , where r is used as a mnemonic for “relative”.
2.3.2. Non-Dissociative, Dissociative, Mixed-Site, and Mixed-Mode Adsorption
We consider both non-dissociative and dissociative adsorption of azole molecules. Non-dissociative adsorption means that no molecular bonds are broken upon adsorption, i.e., molecule adsorbs in intact form, whereas dissociative adsorption involves the N1–H bond cleavage upon adsorption (the N1 atom is indicated in Scheme 1).
The term “mixed-site” adsorption implies that in a given adsorption structure the molecules are adsorbed at different types of surface sites, whereas the term “mixed-mode” adsorption designates that some molecules are adsorbed non-dissociatively and others dissociatively. In the current study, mixed-mode adsorption is typically also mixed-site adsorption, because dissociated and intact molecules adsorb to different sites. Hence the term mixed-mode adsorption will also implicitly imply mixed-site adsorption, whereas the term mixed-site adsorption will implicitly pertain to non-dissociative adsorption modes, unless stated otherwise.
2.3.3. Adsorption Equations
The reaction for non-dissociative adsorption of azole molecules can be written as:
whereas dissociative adsorption, which involves N1–H bond cleavage (cf. Scheme 1), can be described as:
where the label MolH stands for an isolated intact molecule, standalone ∗ designates a free adsorption site, while MolH∗, Mol∗, and H∗ denote adsorbed species. Analogously to the MolH labeling, the specific labels for intact imidazole, triazole, and tetrazole are ImiH, TriH, and TetH, whereas dissociated molecules are designated by Imi, Tri, and Tet labels, respectively. The respective non-dissociative and dissociative adsorption energies (per adsorbed molecule) are calculated as:
and
where m and n are the numbers of non-dissociatively and dissociatively adsorbed molecules per supercell, respectively. , , , and are the total energies of isolated intact MolH molecule, clean slab, slab with m adsorbed molecules per supercell, and slab with n coadsorbed Mol+H species per supercell, respectively. Mixed-mode adsorption is described as:
and the respective average adsorption energy per molecule is calculated as:
To estimate how strongly a given species binds to the surface, we will utilize the adsorption bond strength (D), which by convention is positive and hence opposite to the binding energy (); the two quantities are calculated as:
where A stands for adsorbate (MolH or Mol) and the meaning of the energy terms is analogous to those defined above. By this definition the of Mol is calculated with respect to the isolated radical (Mol) and not the anion (Mol); isolated radicals were calculated with spin-polarized calculations. Note that for non-dissociative adsorption at low coverage the binding energy is equivalent to the adsorption energy, i.e.,
The relative stability of molecular vs. dissociative adsorption is evaluated by considering the dissociation reaction on the surface, MolH∗ + ∗⟶ Mol∗ + H∗, and the respective dissociation energy is calculated as (for simplicity of notation we consider one molecule per supercell):
and dissociative adsorption is favored over the non-dissociative adsorption when .
2.4. Thermodynamic Stability
The thermodynamic stability of molecule–surface systems is evaluated by following the treatment from our previous publication [12]. In particular, adsorption surface free energy () is considered to be a two-dimensional function of chemical potentials of oxygen () and azole molecule ():
where is the surface free energy of the pristine surface and it is a function of the oxygen chemical potential, while () is the term due to molecular adsorption and it is a function of the molecular chemical potential. Note that the dependence of on the temperature and partial pressures of oxygen and azole molecules is implicitly taken into account by and parameters; the mapping of and into temperature and partial pressures is described in Appendix A.
To a first approximation, the term due to molecular adsorption (i.e., the adsorption free energy per unit area) can be written as:
where A is the area of the supercell and n is the number of adsorbed molecules per supercell (for mixed-mode adsorption , cf. Equations (5) and (6)), is the molecular chemical potential measured with respect to the total energy of the isolated molecule, , while stands for
We should remark that the current use of the symbol is different from the one used in our previous publication [12], i.e., currently designates adsorption energy per molecule, while in ref [12] it designated total adsorption energy per unit area.
In contrast to molecular adsorption, surface free energies were calculated with symmetric slabs where both surfaces are equivalent. For the (111)-type structures slabs consisting of 6, 7, and 9 O–Cu–O trilayers were used, whereas for the CuO(110):CuO surface, slabs consisting of 4, 5, and 6 CuO–Cu bilayers plus a terminating CuO layer were used. The surface free energy as a function of oxygen chemical potential is evaluated as:
by fitting this equation for several values of , where is the number of either O–Cu–O trilayers in a (111) slab or CuO–Cu bilayers in a (110) slab, is the total energy of a single trilayer or bilayer in the bulk (both trilayer or bilayer are stoichiometric and hence multiples of the CuO formula unit), A is the area spanned by the supercell (factor 2 is due to the two equivalent surfaces of symmetric slab), and is the number of excess O atoms in the slab and accounts for its non-stochiometry; it is given by:
where and are the numbers of O and Cu ions in the slab (for stoichiometric slabs ).
We consider oxygen and copper chemical potentials to be interdependent via the relation:
where is the total energy of the CuO bulk per formula unit. Note that and cannot physically vary without bounds (e.g., if the becomes too low the CuO would decompose into Cu-bulk and oxygen gas), hence the range of viable is defined to be between oxygen-lean (O) and oxygen-rich (O) limits, which are chosen according to Equations (16a) and (16b), respectively:
where is the total energy of Cu atom in the Cu-bulk and is the total energy of isolated O molecule, respectively. Half of the total energy of the O molecule is chosen as the zero reference for , i.e.,
Hence at the O limit eV (calculated value) and at the O limit eV.
3. Results
3.1. The Thermodynamic Stability of Bare CuO Surfaces
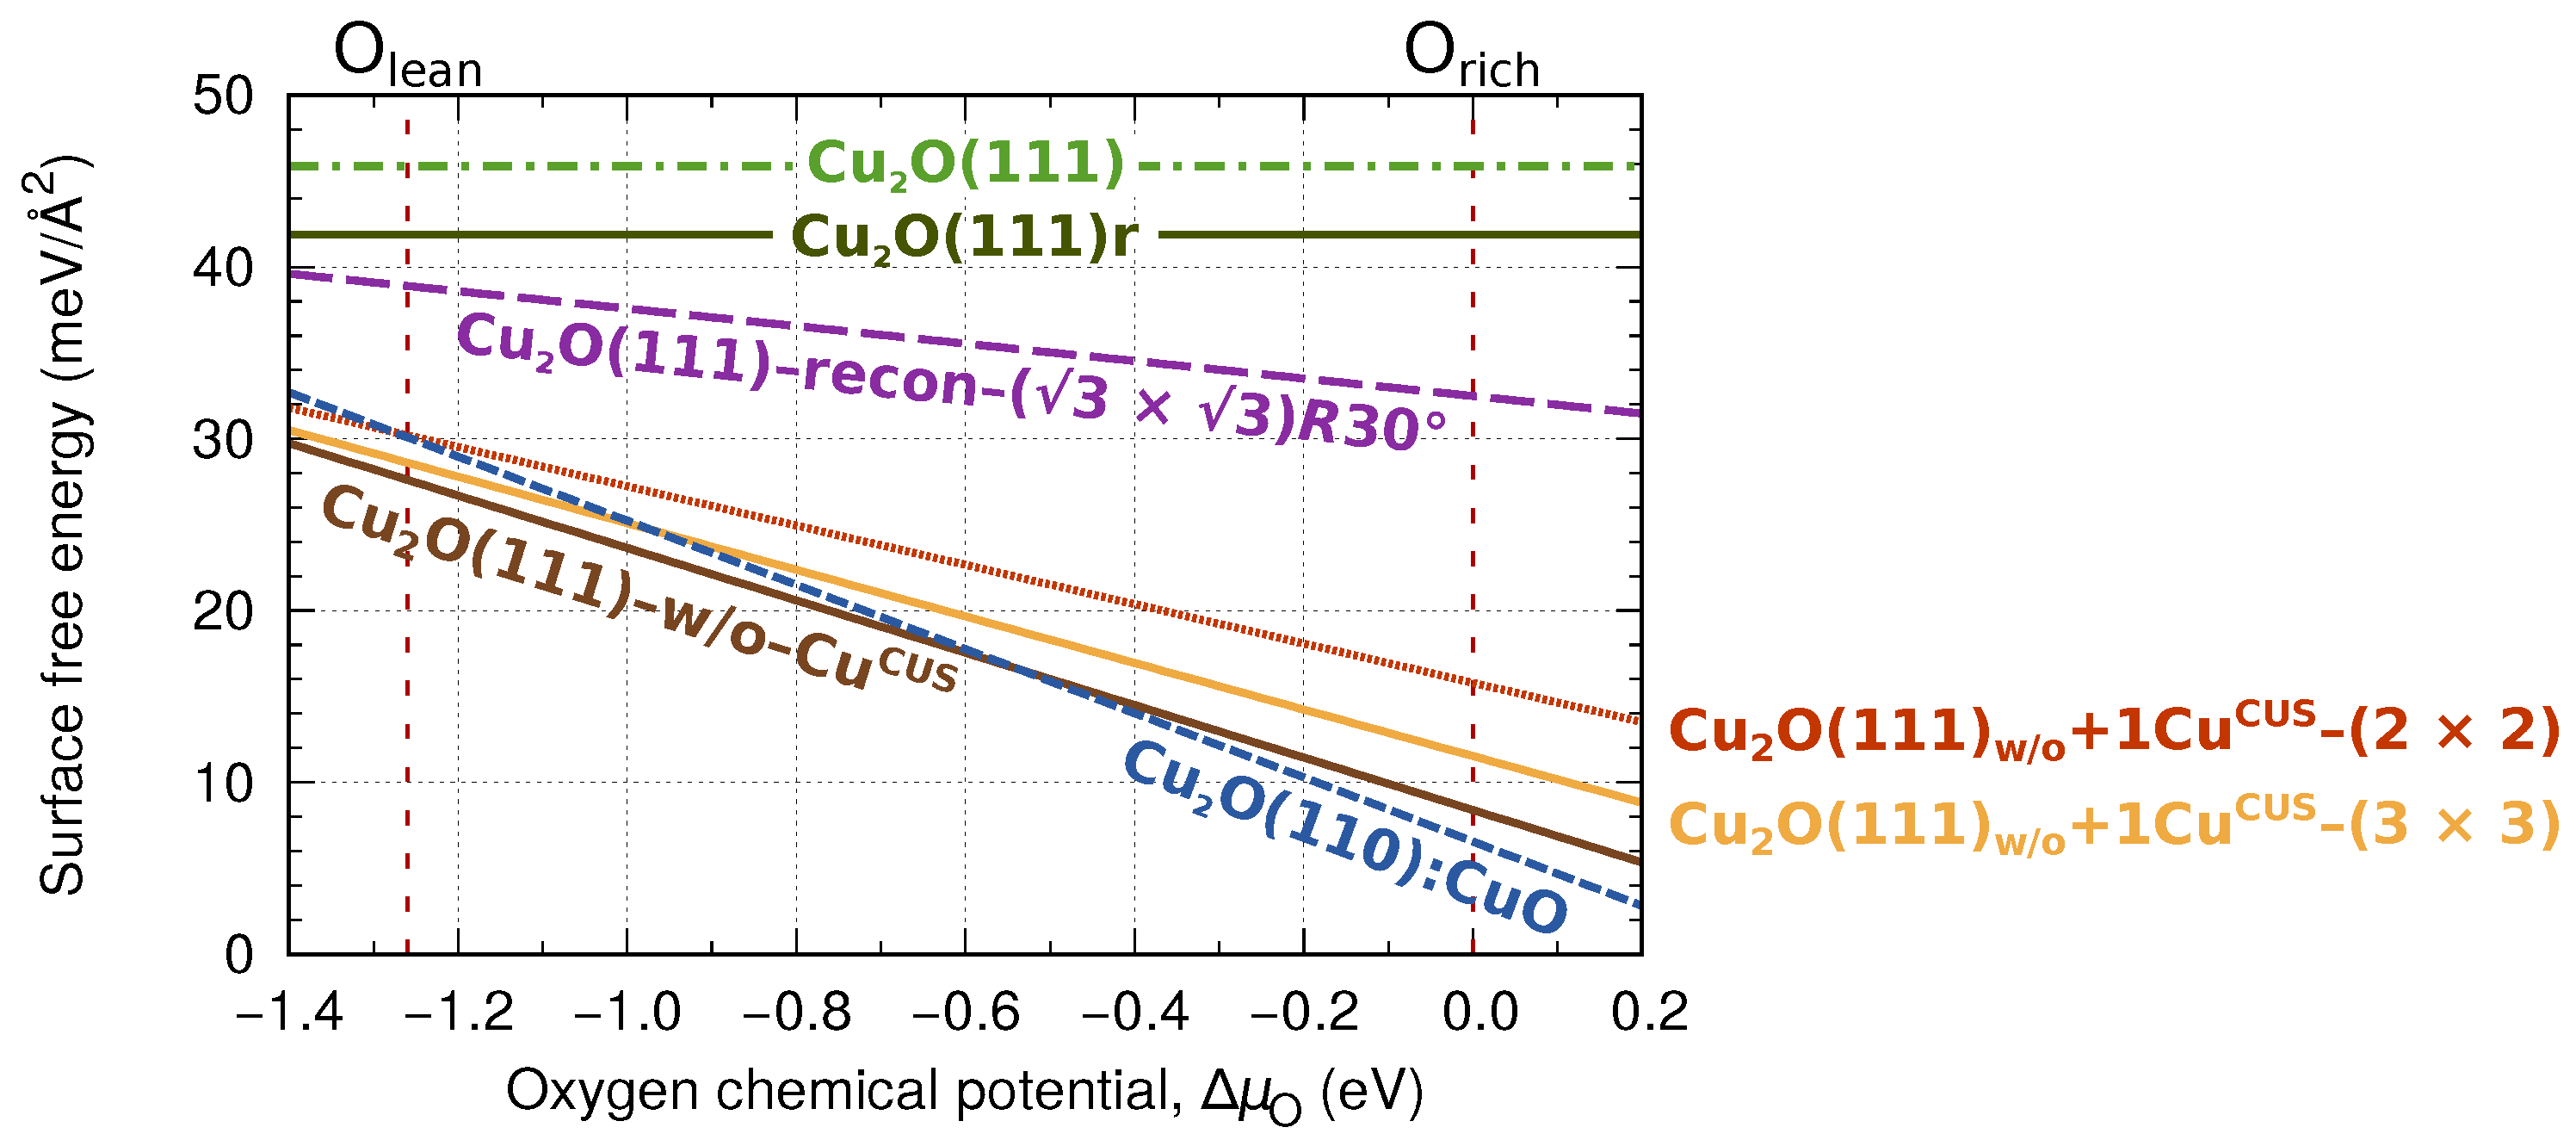
The stability of the currently considered bare CuO surfaces is evaluated in Figure 2 by means of surface free energies as a function of oxygen chemical potential, () of Equation (13); these surfaces are shown graphically in Figure 1. Our calculations reasonably reproduce the results of Soon et al. [21] for CuO(111), CuO(111)-w/o-Cu, and CuO(110):CuO as well as those of Li et al. [22] for the CuO(111), CuO(111)-w/o-Cu, and CuO(111)-recon-( × )R30 surfaces. The stoichiometric high-symmetry CuO(111) and the low-symmetry CuO(111)r display the highest surface free energies and are thus thermodynamically the least stable among the considered surfaces in the whole viable range of . Under oxygen-lean conditions the non-stoichiometric CuO(111)-w/o-Cu is the stablest, whereas under oxygen-rich conditions CuO(110):CuO surface is preferred. As for the reconstructed CuO(111)-recon-( × )R30, observed experimentally by Önsten et al. [23] (their model B), its surface free energy is lower than that of the stoichiometric CuO(111)r, but also significantly higher in comparison to the two non-stoichiometric surfaces, CuO(111)-w/o-Cu and CuO(110):CuO. Önsten’s model A of the ( × )R30 reconstructed surface (the difference between the two models is that model B lacks Cu ions) is currently not considered for the following two reasons: (i) according to DFT calculations the surface free energy of model A is considerably higher than that of model B (see Figure A1 in the Appendix B and also ref [24]) and (ii) no new types of Cu and O ions are introduced in model A.
Finally, let us comment on the stability of CuO(111)+1Cu–(N × N) surface models, which lack all but a single Cu ion per supercell, that is, they lack Cu ions. These models can be seen as a linear combination of CuO(111)r and CuO(111)-w/o-Cu, hence their surface free energies should be in between the values displayed by the latter two. Given that the considered CuO(111)+1Cu–(2 × 2) and CuO(111)+1Cu–(3 × 3) models contain only 25% and 11% of the Cu ions, respectively, their surface free energies should be closer to CuO(111)-w/o-Cu than to CuO(111)r, which is indeed the case as seen in Figure 2; for the comparison between the estimated (via linear combination) and actually calculated surface free energies of the two CuO(111)+1Cu models, see Figure A2 in the Appendix B.
Considering the surface free energies, shown in Figure 2, we should make the following comment. While our results are in good agreement with previous GGA studies, Nilius et al. [25] recently argued that the GGA predicted cost of non-stoichiometry is too small and correspondingly GGA overestimates the stability of non-stoichiometric surfaces. Using the HSE hybrid functional they showed, in agreement with their STM experiments, that stoichiometric CuO(111) becomes more stable than CuO(111)-w/o-Cu under oxygen-lean conditions.
3.2. Molecular Adsorption at Lower Coverage
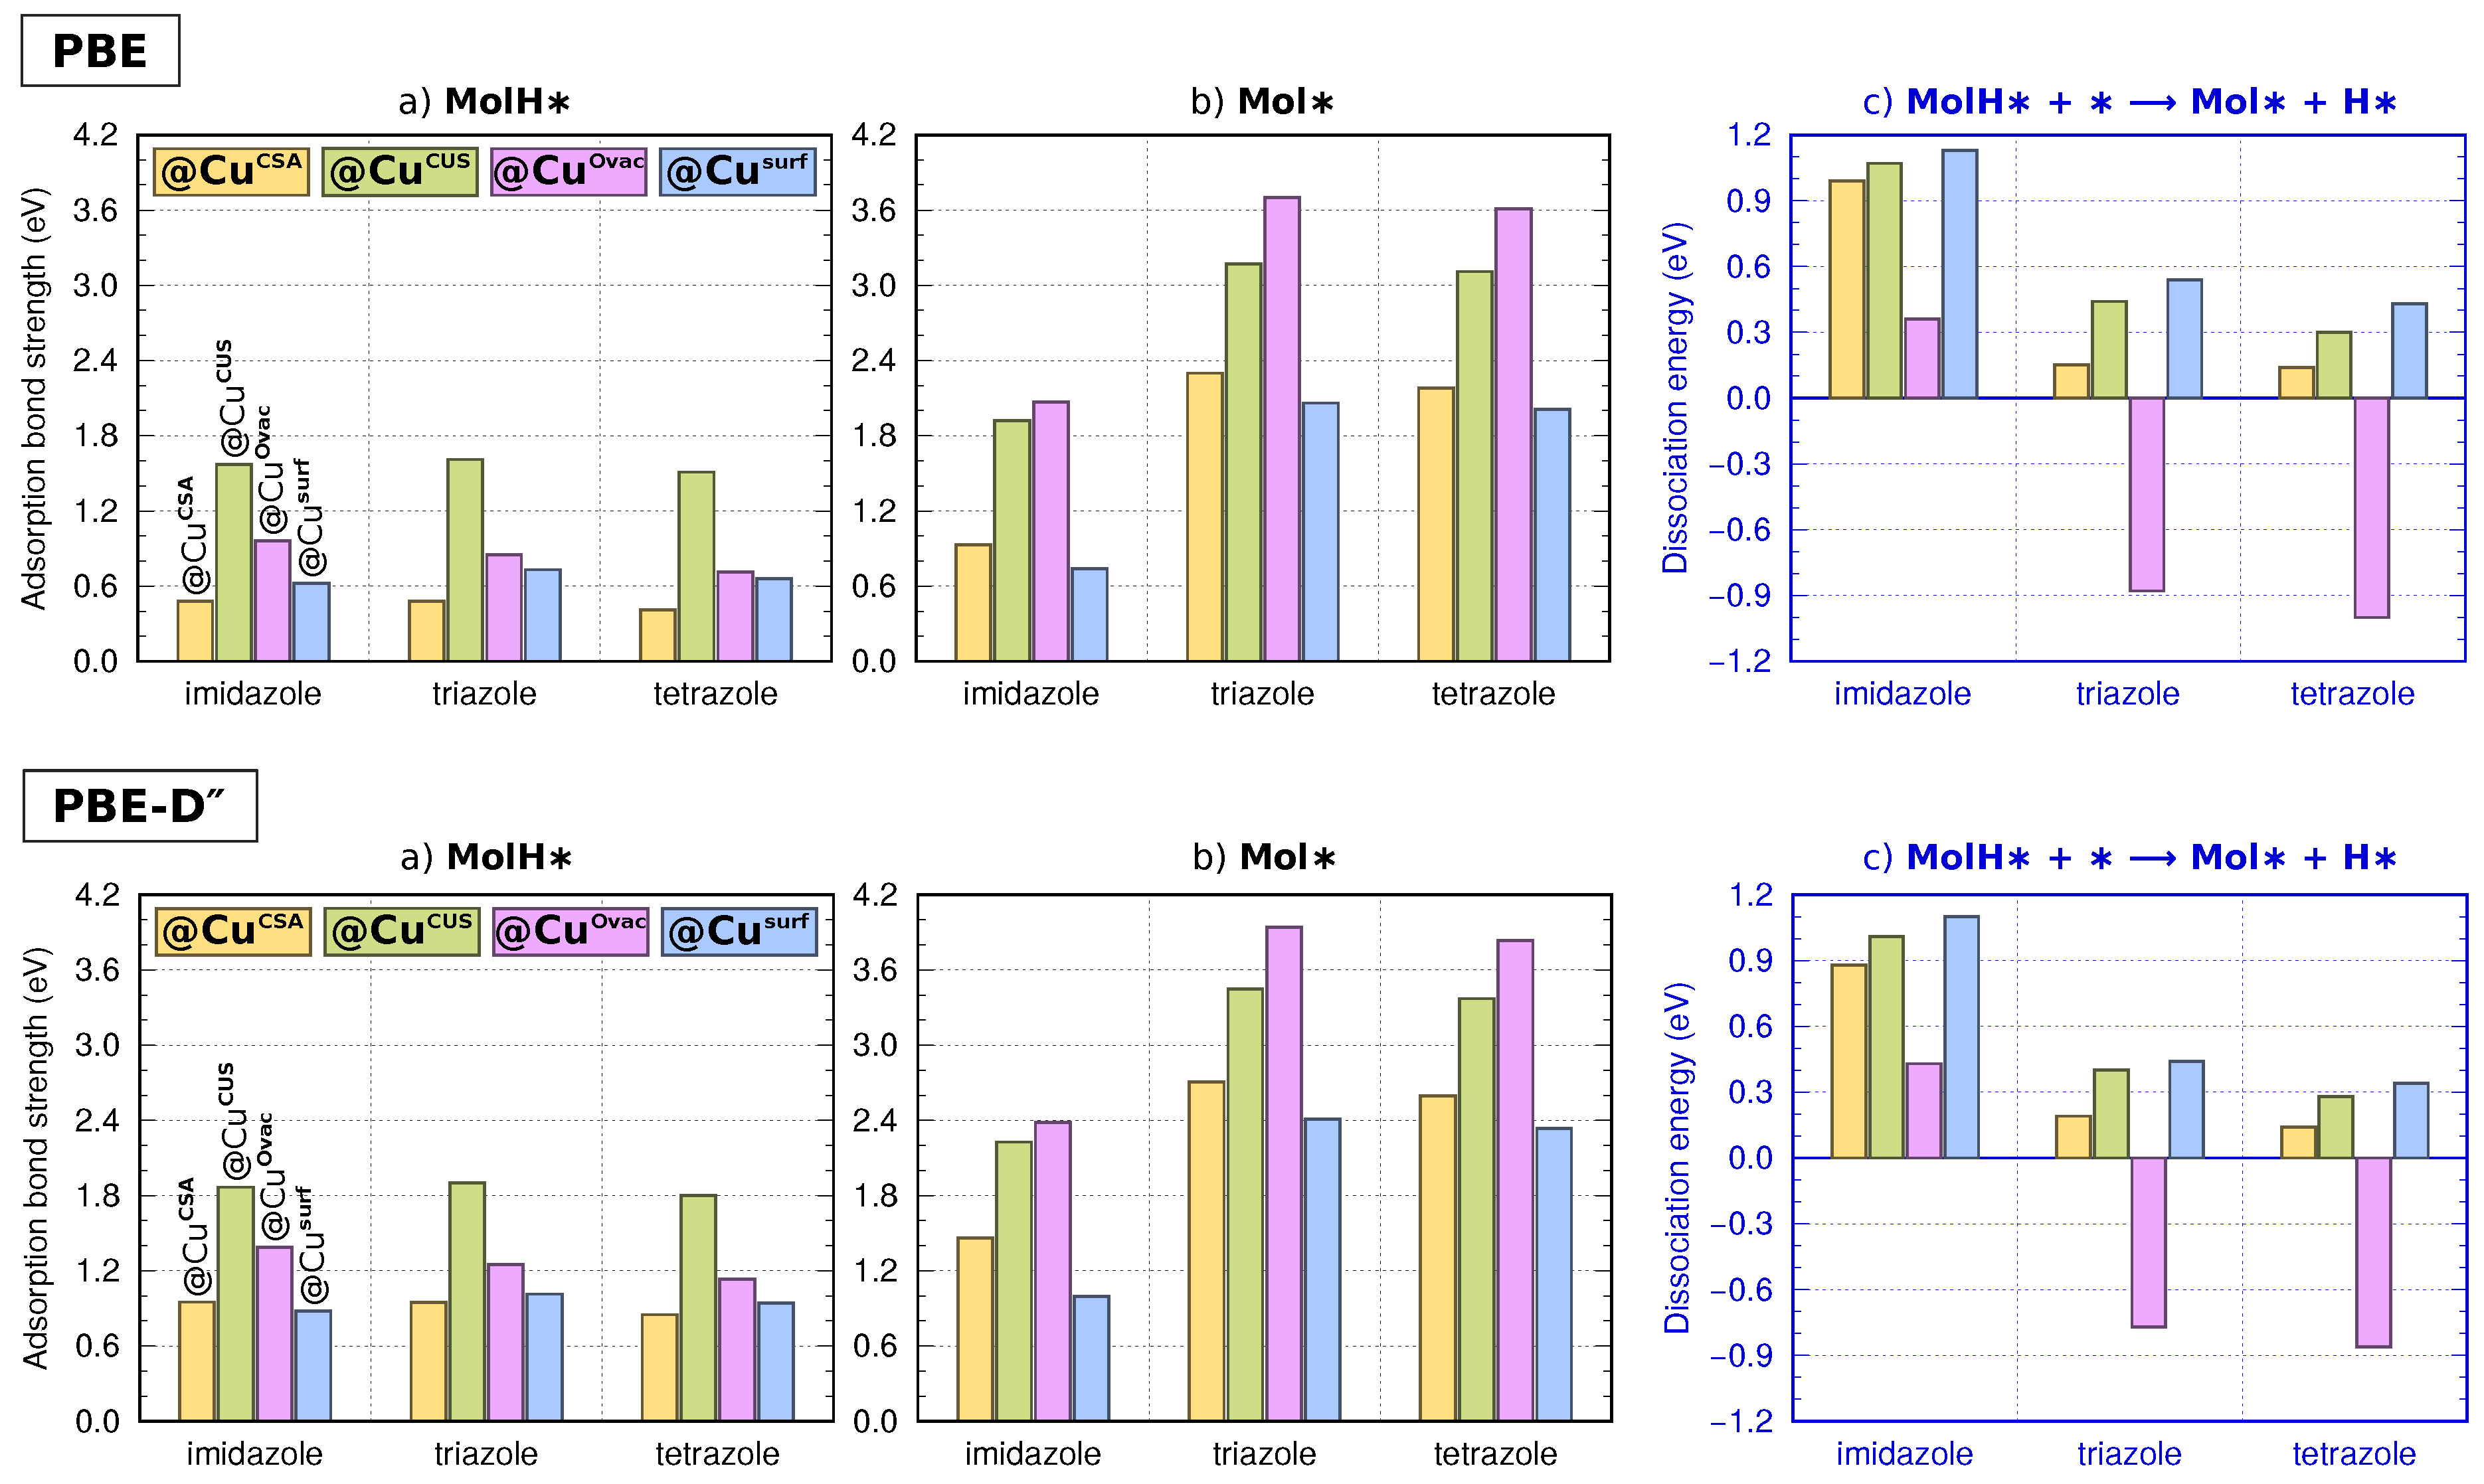
The top row of Figure 3 summarizes the results presented in Part I [1], that is, adsorption bond-strengths for MolH∗ and Mol∗ adsorption modes of imidazole, triazole, and tetrazole at various considered Cu sites on CuO surfaces and the respective reaction energies for MolH∗ + ∗→ Mol∗ + H∗ dissociation. These results were obtained for a coverage, which is low enough that it allows for focussing predominantly on the molecule–surface interactions (see Figure 3 in Part I); currently this coverage can be seen as intermediate, because herein we consider also lower and higher coverages. While in Part I, we focused on the molecule–surface interactions and presented only the PBE results, currently we mainly focus on the lateral intermolecular interactions, hence we utilize a dispersion correction to better describe them ( results, shown in the bottom row of Figure 3). The comparison between PBE and results presented in Figure 3 shows that the two sets of results give the same trends; the main difference is that due to attractive dispersion interactions the adsorption bond-strengths are by about 0.3 to 0.5 eV stronger than the PBE ones.
Figure 3 reveals that (i) intact molecules (MolH∗) bind more weakly to the surface in comparison to dissociated molecules (Mol∗), (ii) coordinatively unsaturated Cu sites (Cu and Cu) bind adsorbates more strongly than saturated Cu sites (Cu and Cu), (iii) on a given site non-dissociative adsorption energies are similar for all three molecules, while dissociated triazole and tetrazole bind much stronger than dissociated imidazole, hence (iv) molecular dissociation is favored just for triazole and tetrazole, but only at Cu oxygen vacancy sites. Note that after dissociation H binds to a nearby lattice O ion thus forming an OH group. Figure 3c therefore reveals that non-dissociative adsorption is usually favored over dissociative adsorption; the only two exceptions are triazole and tetrazole adsorbed at Cu on CuO(111)-recon-( × )R30, for which dissociative adsorption is favored. For benzotriazole, the dissociative adsorption was also found favourable only at oxygen vacancy sites [26] and furthermore oxygen vacancy sites were found reactive for the cleavage of the O–H bond of methanol [27].
3.3. Lateral and Dispersion Interactions: PBE vs.
Azoles are polar molecules with rather large permanent dipole moment—PBE calculated values are 3.79, 4.42, and 5.45 D for imidazole, triazole, and tetrazole, respectively [28]—which can result in rather long ranged dipole–dipole intermolecular interactions between adsorbed molecules. Depending on the orientation of the dipole moment of adsorbed molecules, the interactions can be either attractive (for dipoles pointing parallel to the surface) or repulsive (for perpendicular dipoles) [12,28,29]. In our previous publication [12], we found that lateral interactions are repulsive for imidazole adsorbed at Cu or Cu sites on CuO(111), whereas for triazole and tetrazole they are either less pronounced or even attractive; these dependencies are consistent with the orientation of molecular dipoles in the adsorbed states [12].
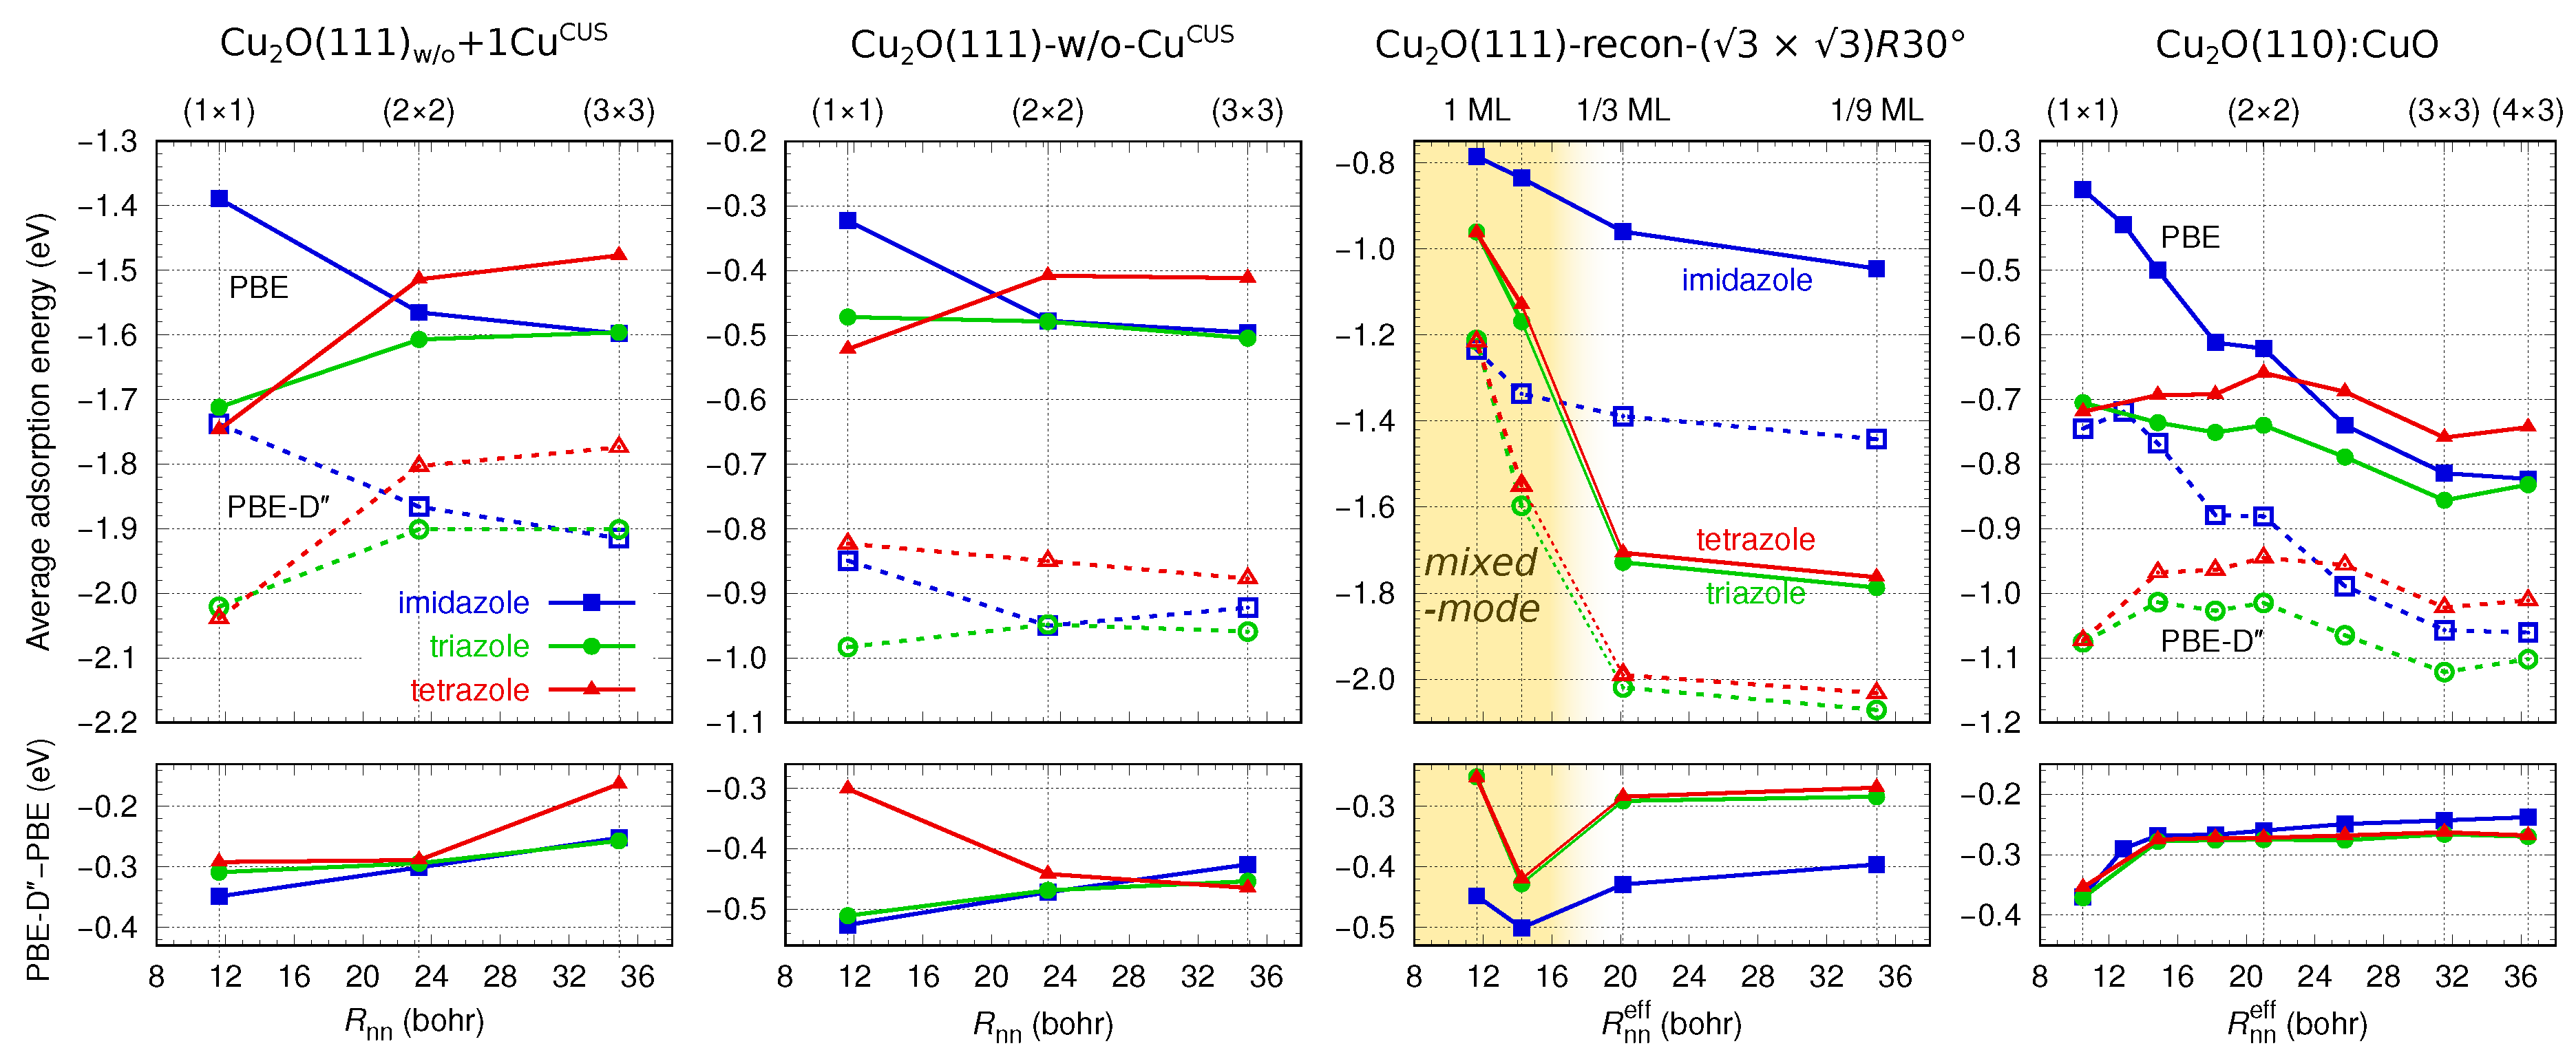
Figure 4 plots the dependence of the average adsorption energy on the nearest-neighbor intermolecular distance, , for imidazole, triazole, and tetrazole adsorbed on CuO(111)+1Cu, CuO(111)-w/o-Cu, CuO(111)-recon-( × )R30, and CuO(110):CuO surfaces as calculated with PBE and functionals. Only the most stable structures for a given molecule at a given surface are considered: this implies non-dissociative adsorption for all but the two cases: triazole and tetrazole at Cu sites on CuO(111)-recon-( × )R30, for which dissociative adsorption is the stablest; notice, however, that beyond the coverage of 1/3 ML, at which all the Cu sites are occupied on CuO(111)-recon-( × )R30, the molecules start to adsorb non-dissociatively, which implies mixed-mode adsorption.
On CuO(111) based models the adsorbed molecules form centered hexagonal patterns (see Figure 3 in Part I), where each molecule has six neighbors at . However, such a high symmetry pattern is not possible for mixed-site and mixed-mode adsorption on CuO(111)-recon-( × )R30 and for CuO(110):CuO, hence the lateral dependence is plotted against the effective nearest-neighbor intermolecular distance, , which is defined as:
where is the surface area per molecule, i.e., , where A is the area of the supercell and n is the number of adsorbed molecules per supercell. This definition stems from the relation between the and on CuO(111) based surface models, where .
Figure 4 reveals that—similarly to the above described lateral dependencies on Cu and Cu sites of CuO(111)-based models—imidazole displays repulsive interactions also on CuO(110):CuO, while the lateral interactions for triazole and tetrazole are less pronounced thereon. On CuO(111)-recon-( × )R30, however, the situation is more complicated due to the presence of 1/3 ML of oxygen vacancies that result in Cu sites and for triazole and tetrazole also due to the mixed-mode adsorption. Notice the pronounced upward shift of the average adsorption energy when the coverage becomes higher than 1/3 ML (or Bohrs; region marked with a yellowish band). This upshift is, however, to a large extent due to mixed-mode adsorption rather than the repulsive intermolecular interactions. Namely, triazole and tetrazole prefer to adsorb dissociatively onto Cu sites, but at a relative coverage of 1/3 ML all Cu sites are occupied. Beyond this coverage the molecules continue to adsorb non-dissociatively onto already singly occupied Cu sites, though in hindered geometry, up to the coverage of 2/3 ML after which imidazole adsorbs to uncovered parts of the surface via the N1–H⋯O hydrogen bond, whereas triazole and tetrazole at 1 ML coverage prefer to singly occupy the Cu sites and the remaining molecules adsorb via N1–H⋯O hydrogen bonds.
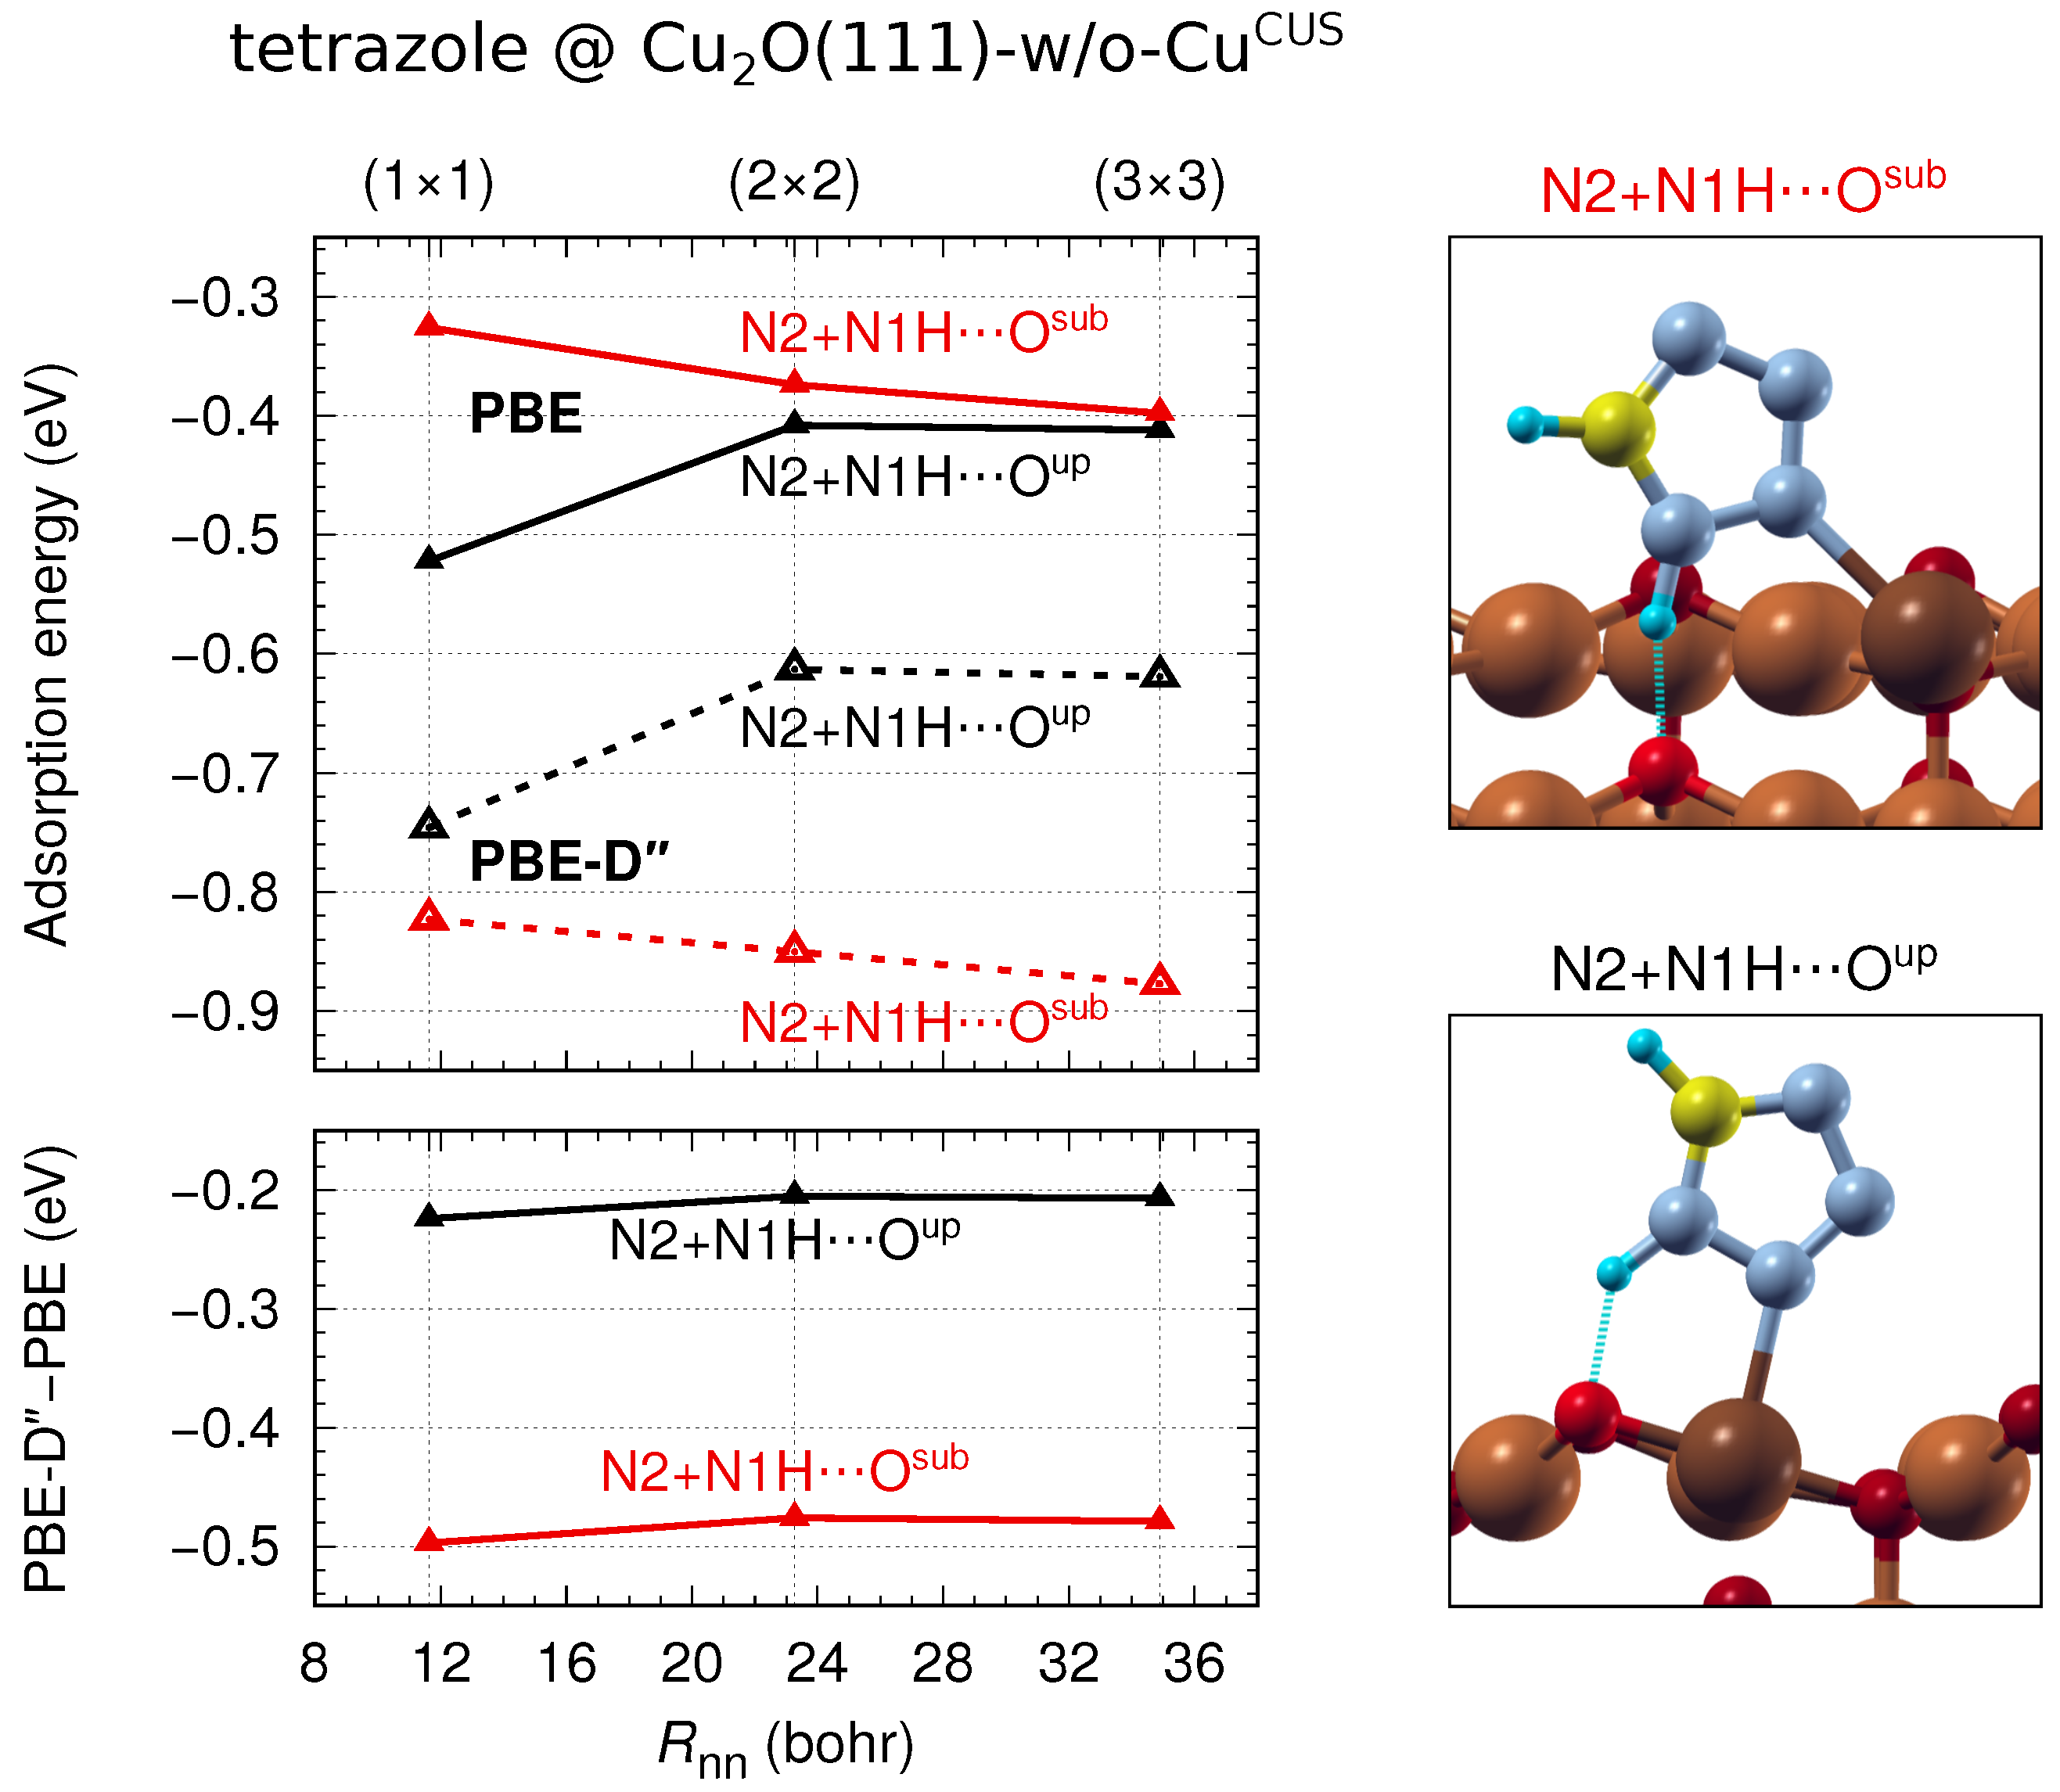
As for the role of dispersion interactions, it can be observed from Figure 4 that dispersion enhances the molecule–surface interactions by about 0.3 to 0.5 eV, depending on the specific case (for the vs. PBE differences see the bottom row plots of Figure 4). Dispersion interactions also stabilize high coverage configurations (in relative sense) due to attractive intermolecular dispersion interactions. This effect is the most clearly seen on CuO(110):CuO, where the largest number of structures is considered: notice that the vs. PBE difference changes from to eV as going from of 16 Bohrs down to about 10 Bohrs. We should comment on the anomalous vs. PBE difference for tetrazole on CuO(111)-w/o-Cu, where the apparently destabilizes the high coverage () phase for tetrazole: the reason is that in this specific case PBE and predict different tetrazole configurations to be the most stable and the two configurations display different lateral dependence. If instead the same configurations are considered for both functionals, then the expected behavior is recovered (see Figure A3 in the Appendix B). The vs. PBE difference also appears anomalous on CuO(111)-recon-( × )R30. The reason is that on this surface various sites are occupied at high coverage and the vs. PBE difference reflects dispersion contributions not only to the lateral intermolecular interactions but also to the molecule–surface interactions.
The corollary of the results presented in Figure 4 is that dispersion interactions stabilize adsorption structures and that imidazole displays the most repulsive lateral interactions among the three considered molecules; note that for triazole or tetrazole on CuO(111)-recon-( × )R30 the large reduction of average adsorption energy magnitude at higher coverages is due to the mixed-mode adsorption rather than intermolecular repulsion.
3.4. Thermodynamic Stability
The fact that we evaluated on the order of a few hundred different adsorption structures implies that their thermodynamic (TD) stability has to be considered in a systematic way. Hence, we will first consider adsorption free energies as a one-dimensional function of molecular chemical potential, () of Equation (11). In this way we can characterize the TD stability of different coverages on a given surface; the condition is that the surface itself is kept the same for all the coverages. This poses a problem for CuO(111)+1Cu model, for which the fraction of Cu ions changes with molecular coverage, i.e., the fraction of Cu ions is the same as the molecular coverage. Hence, we characterize instead the TD stability of adsorption structures on two “fixed” surface models: CuO(111) and CuO(111)+1Cu–(2 × 2). The first contains 100% and the latter 25% of Cu ions, irrespective of the molecular coverage. On the former model the molecules adsorb strictly at Cu sites, whereas on the latter model the molecules adsorb also at Cu sites after all the Cu sites are occupied, which happens at molecular coverage of .
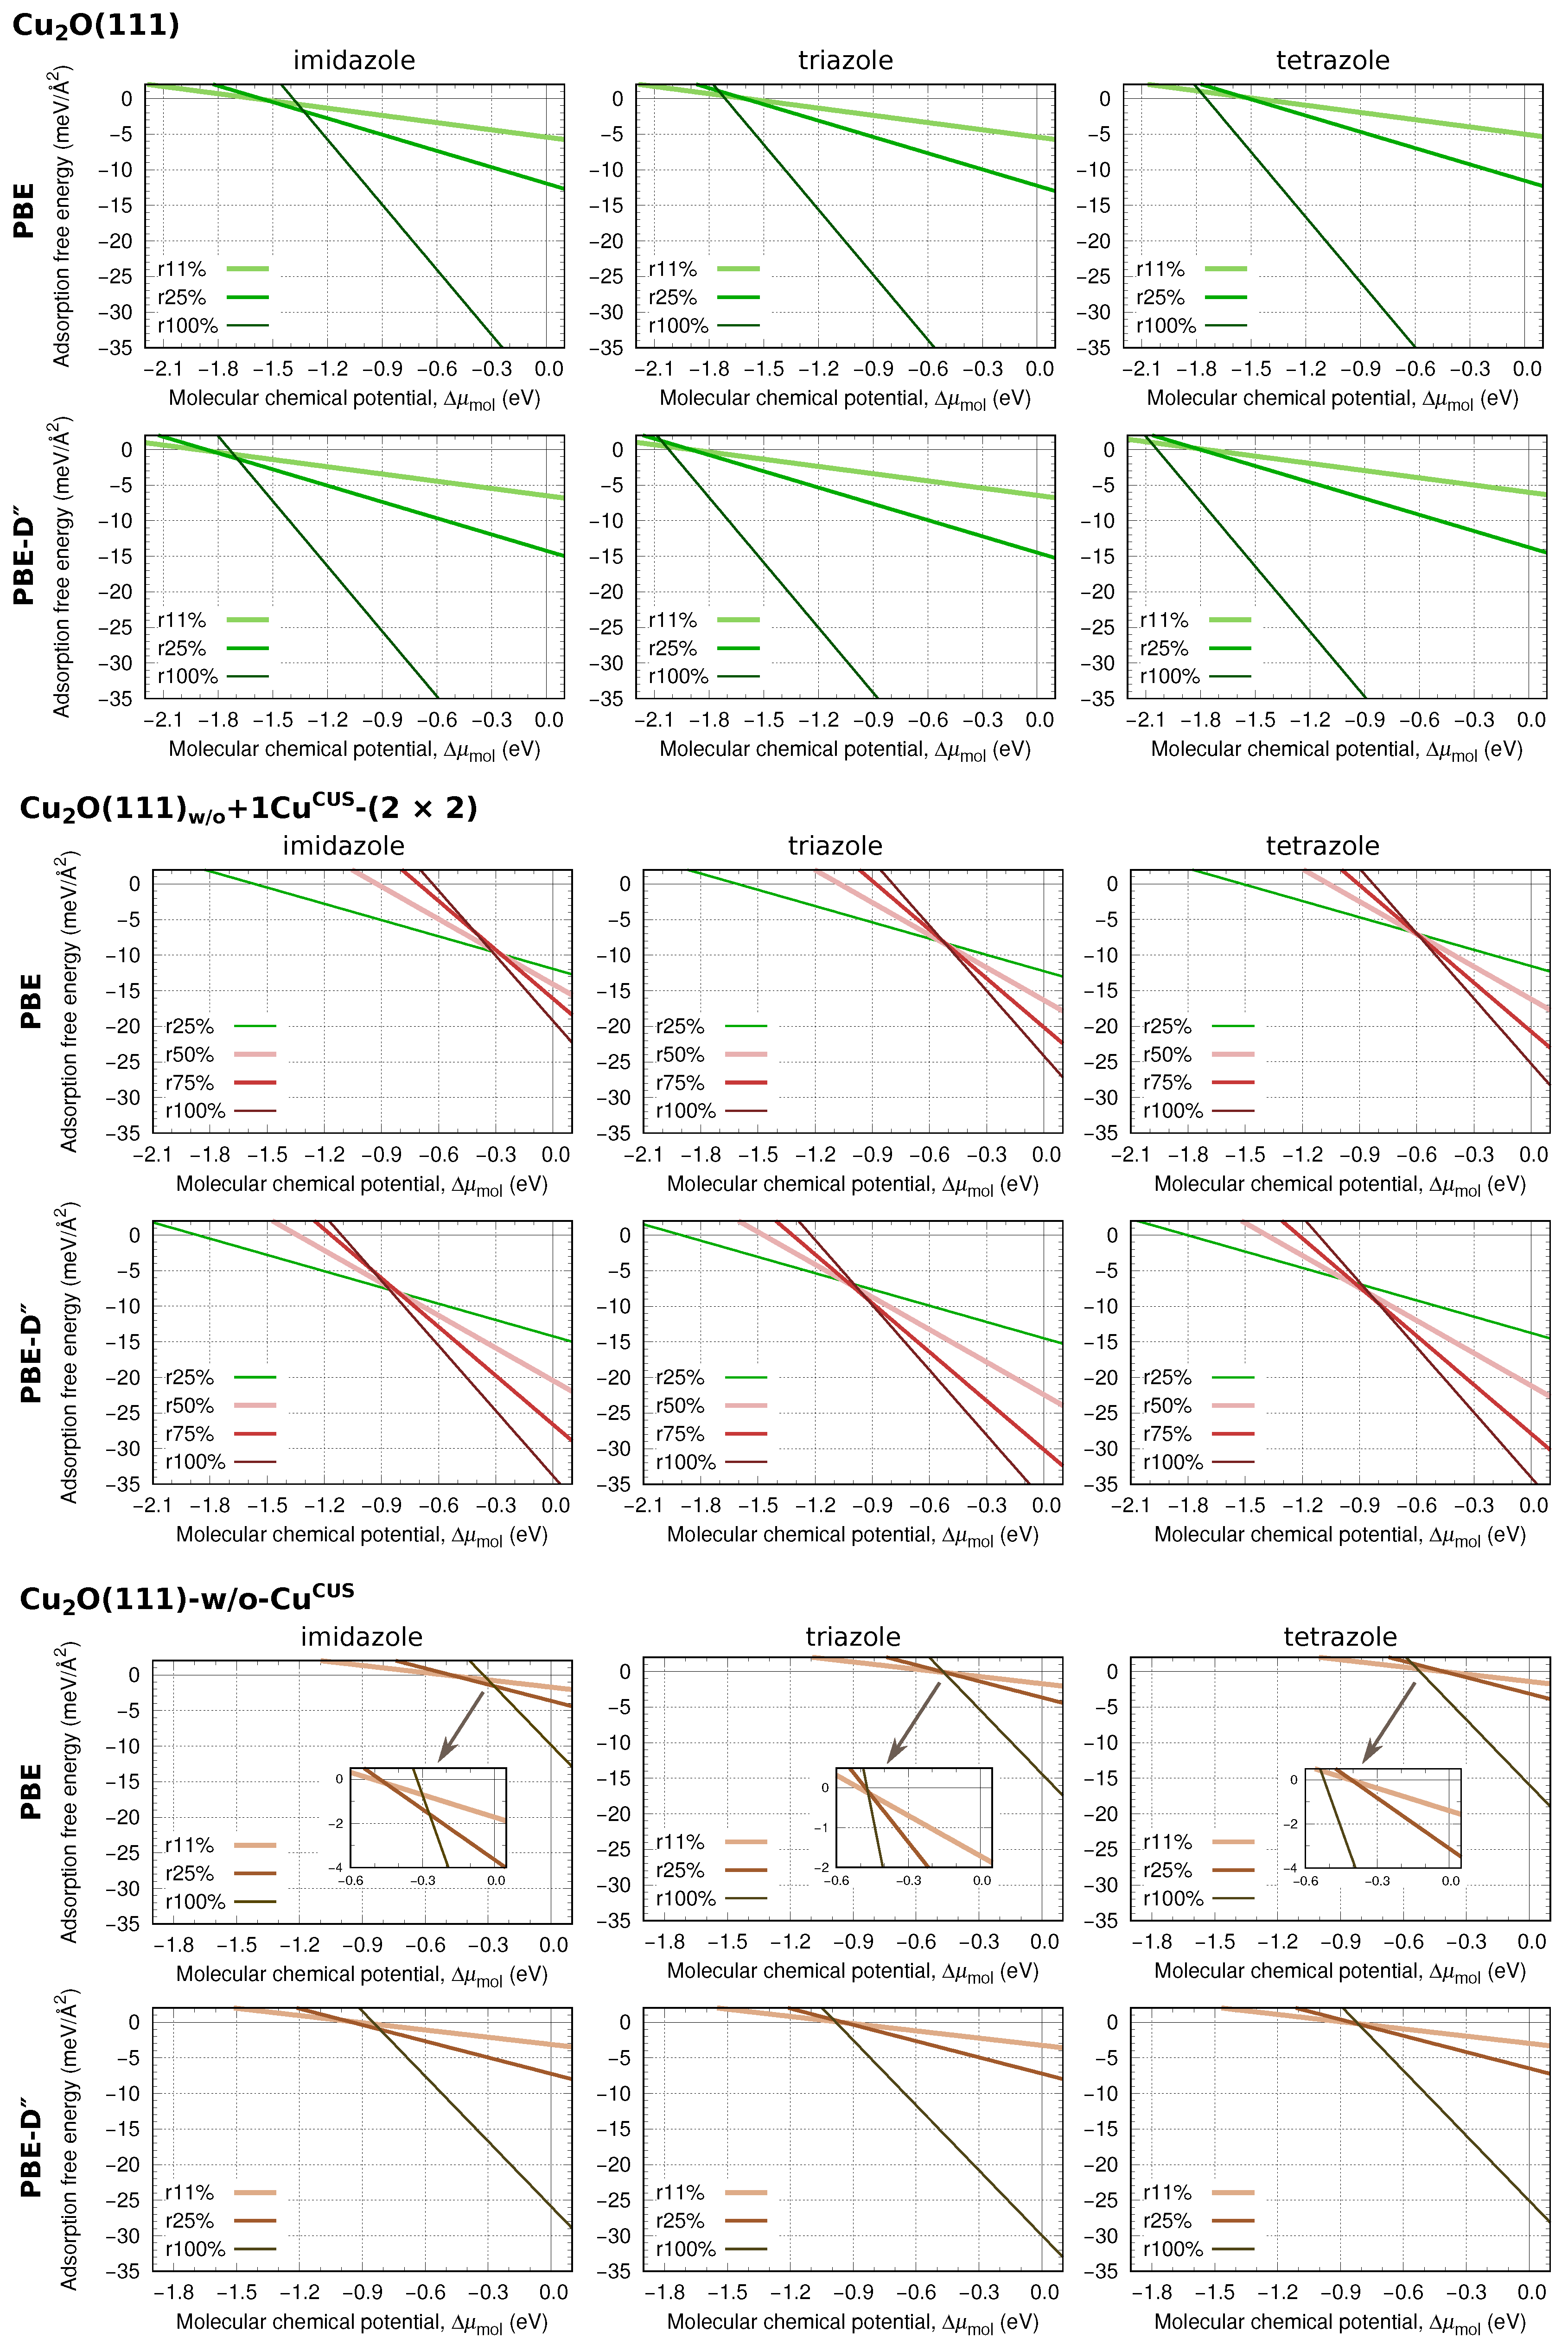
PBE and calculated adsorption surface free energies as functions of the molecular chemical potential are shown in Appendix B: Figure A4 displays surface free energies for CuO(111), CuO(111)+1Cu–(2 × 2), and CuO(111)-w/o-Cu surfaces and Figure A5 for CuO(111)-recon-( × )R30 and CuO(110):CuO. Only the most stable identified adsorption modes at a given coverage on a given surface are considered; these correspond to non-dissociative adsorption for all cases but the triazole and tetrazole at CuO(111)-recon-( × )R30. The most stable structure of a given molecule on a given surface at a given molecular chemical potential is the one that displays the lowest . Figure A4 and Figure A5 thus reveal that high coverage configurations usually dominate, i.e., they are the stablest over the broadest range of the molecular chemical potential. There are only two exceptions for which lower coverage phases are the most stable over a broad range of low molecular chemical potential, i.e., (i) the phases of triazole and tetrazole on CuO(111)-recon-( × )R30 and (ii) the phases of all three molecules on CuO(111)+1Cu–(2 × 2). According to Figure A4 and Figure A5 the largest viable stabilization of surface free energies due to molecular adsorption corresponds to high coverage phases. This reasoning is corroborated by Figure 5, which plots the total adsorption energy per unit area, , for the three molecules on the five considered surfaces. Notice that for all the cases the monotonically decreases as coverage increases, thus being the most exothermic for the phases.
Current results reveal that the molecules bind considerably more strongly to coordinatively unsaturated Cu sites (cf. Figure 3 and Figure 4), which raises the question whether stronger molecular bonding can stabilize them. This issue can be addressed by considering the stabilization of surface free energies due to molecular adsorption, which according to Figure 5 is the strongest for phases, hence Figure 6 compares the surface free energies of pristine surfaces to those that are fully covered with imidazole, triazole, or tetrazole; for this analysis the molecular chemical potential was fixed at = 0. It can be seen that molecular adsorption alters the surface stability trend, because it stabilizes the stoichiometric CuO(111) surface to such an extent that it becomes the stablest under oxygen-lean conditions (prior to molecular adsorption the CuO(111)-w/o-Cu is the most stable). In contrast, under oxygen-rich conditions the CuO(110):CuO is the most stable prior and after molecular adsorption. Figure 6 further reveals that molecular adsorption does not stabilize sufficiently the CuO(111)-recon-( × )R30 surface (this surface is never the stablest), despite the fact that the Cu sites are very reactive toward molecular adsorption and are able to dissociate triazole and tetrazole by cleaving the N1–H bond. This issue will be further commented in the discussion Section 4.1.
Two-Dimensional Phase Diagrams
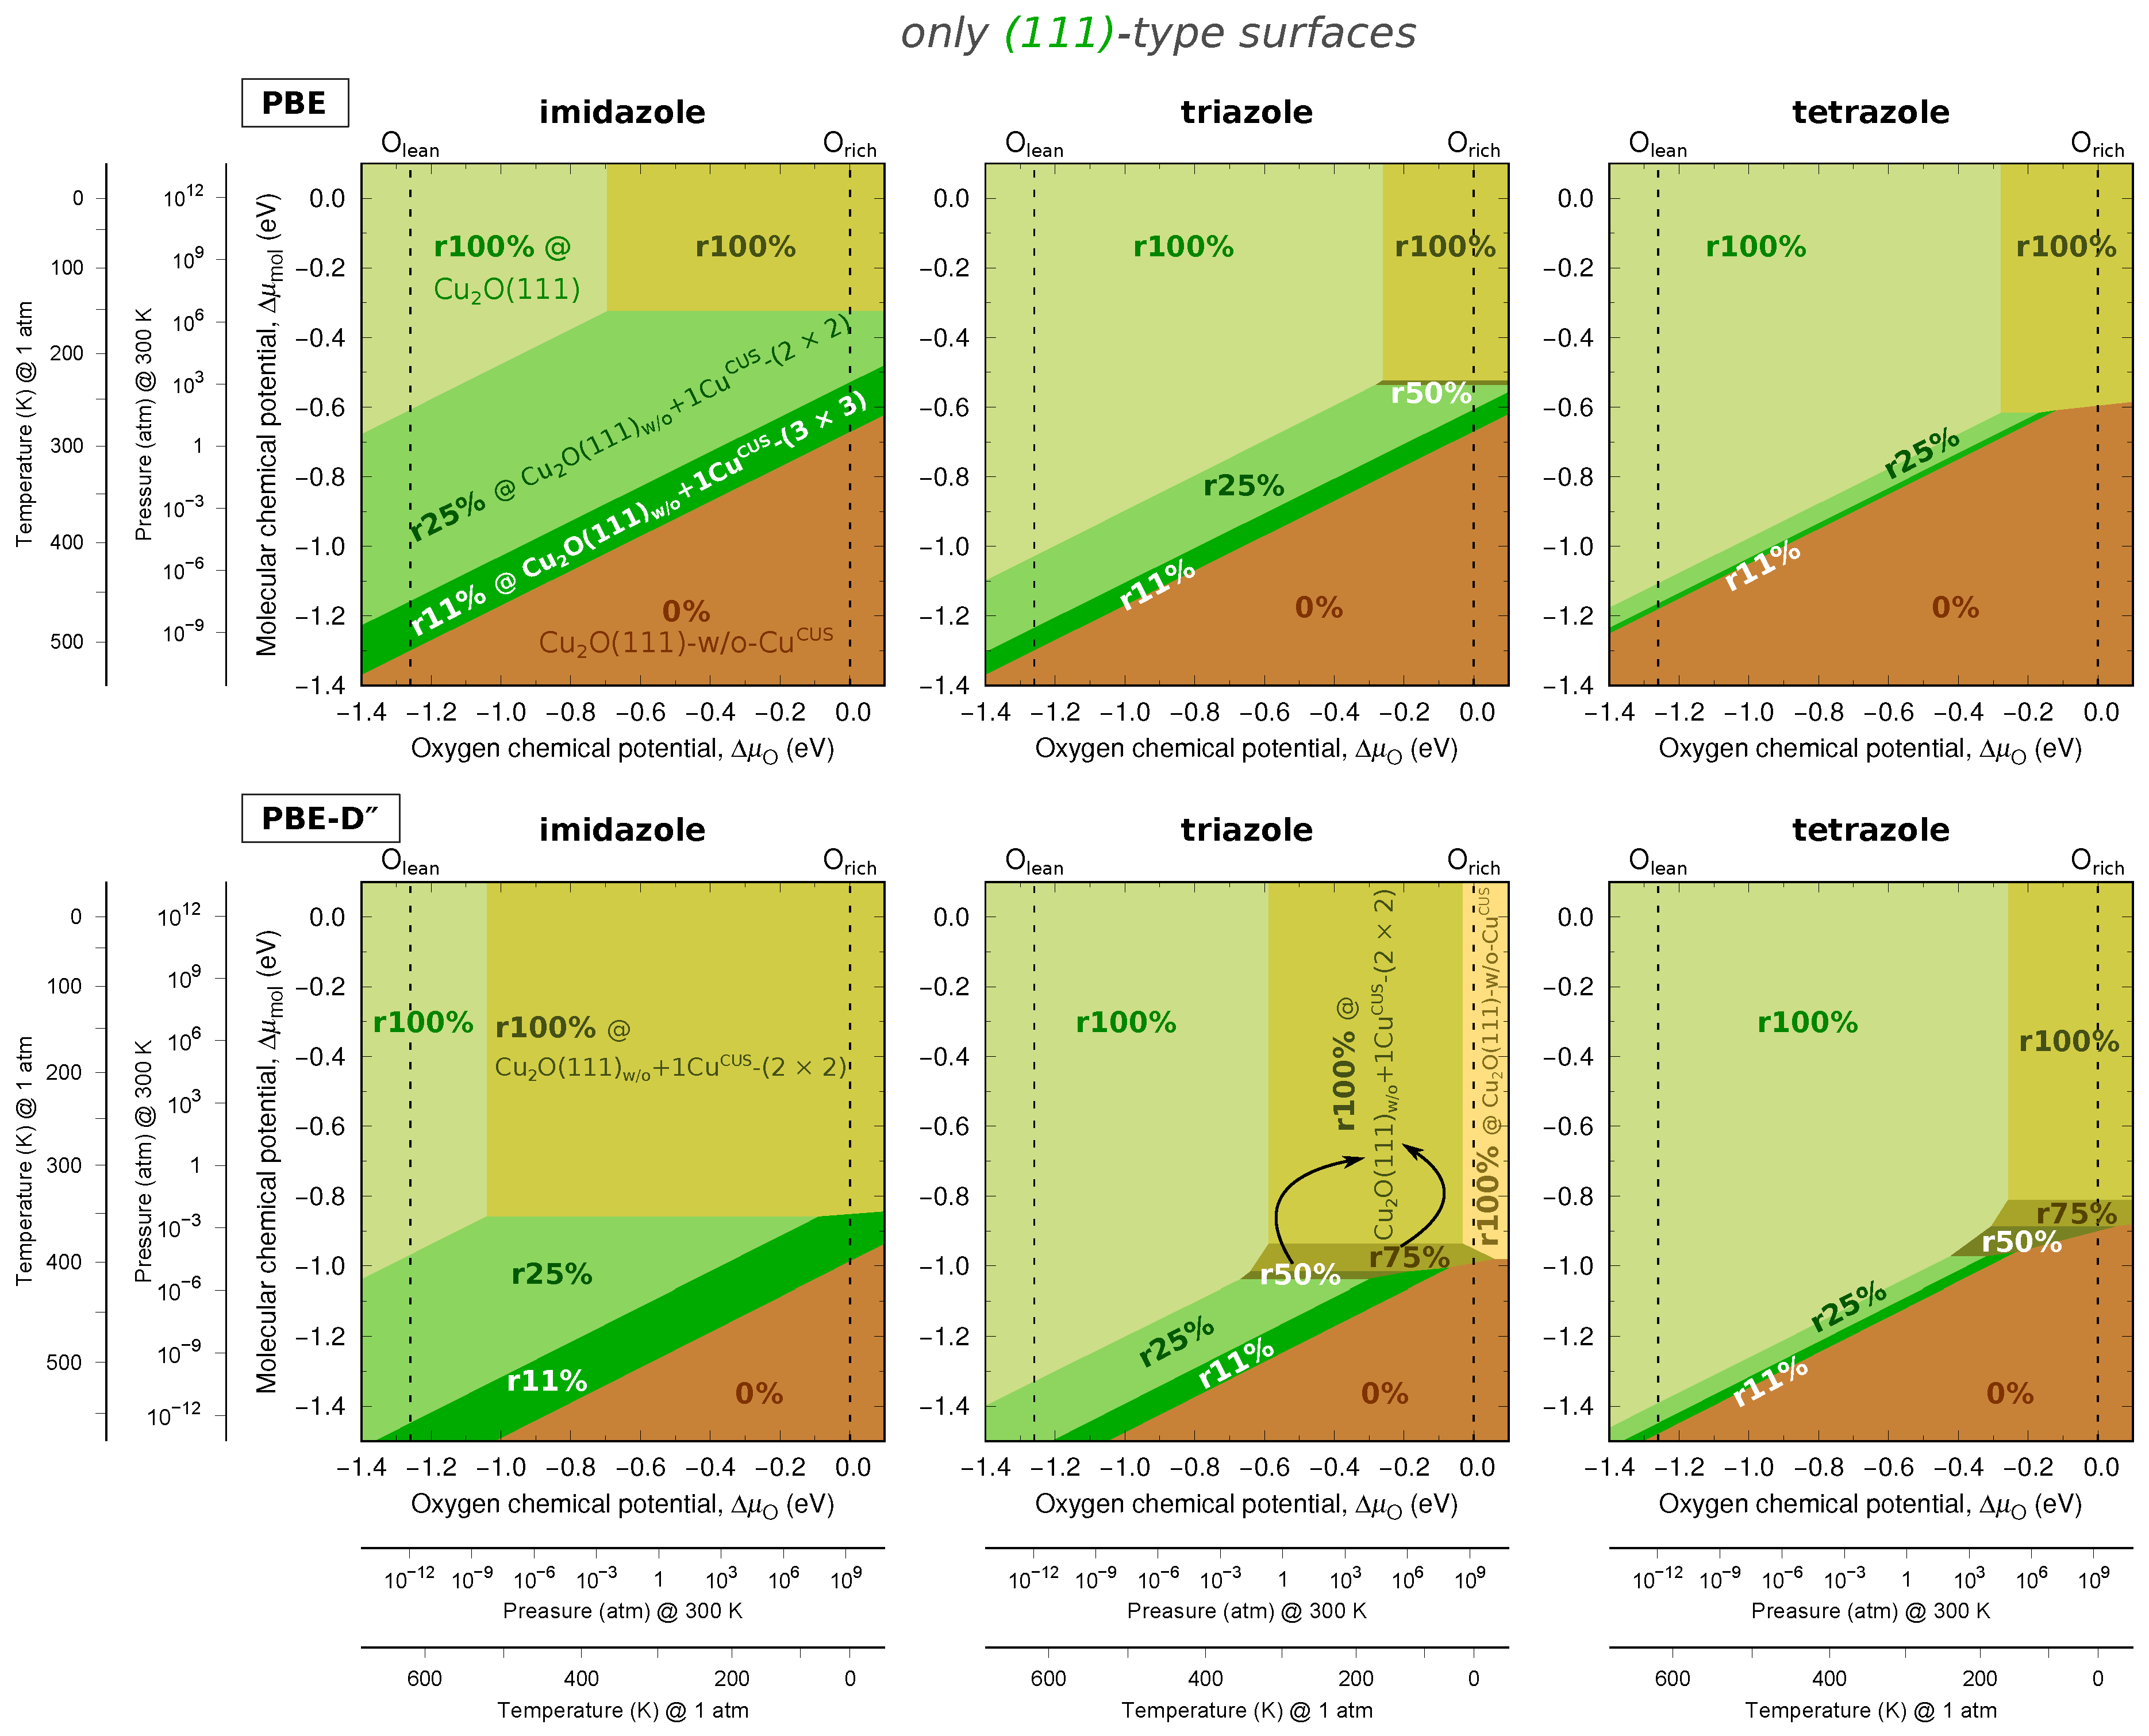
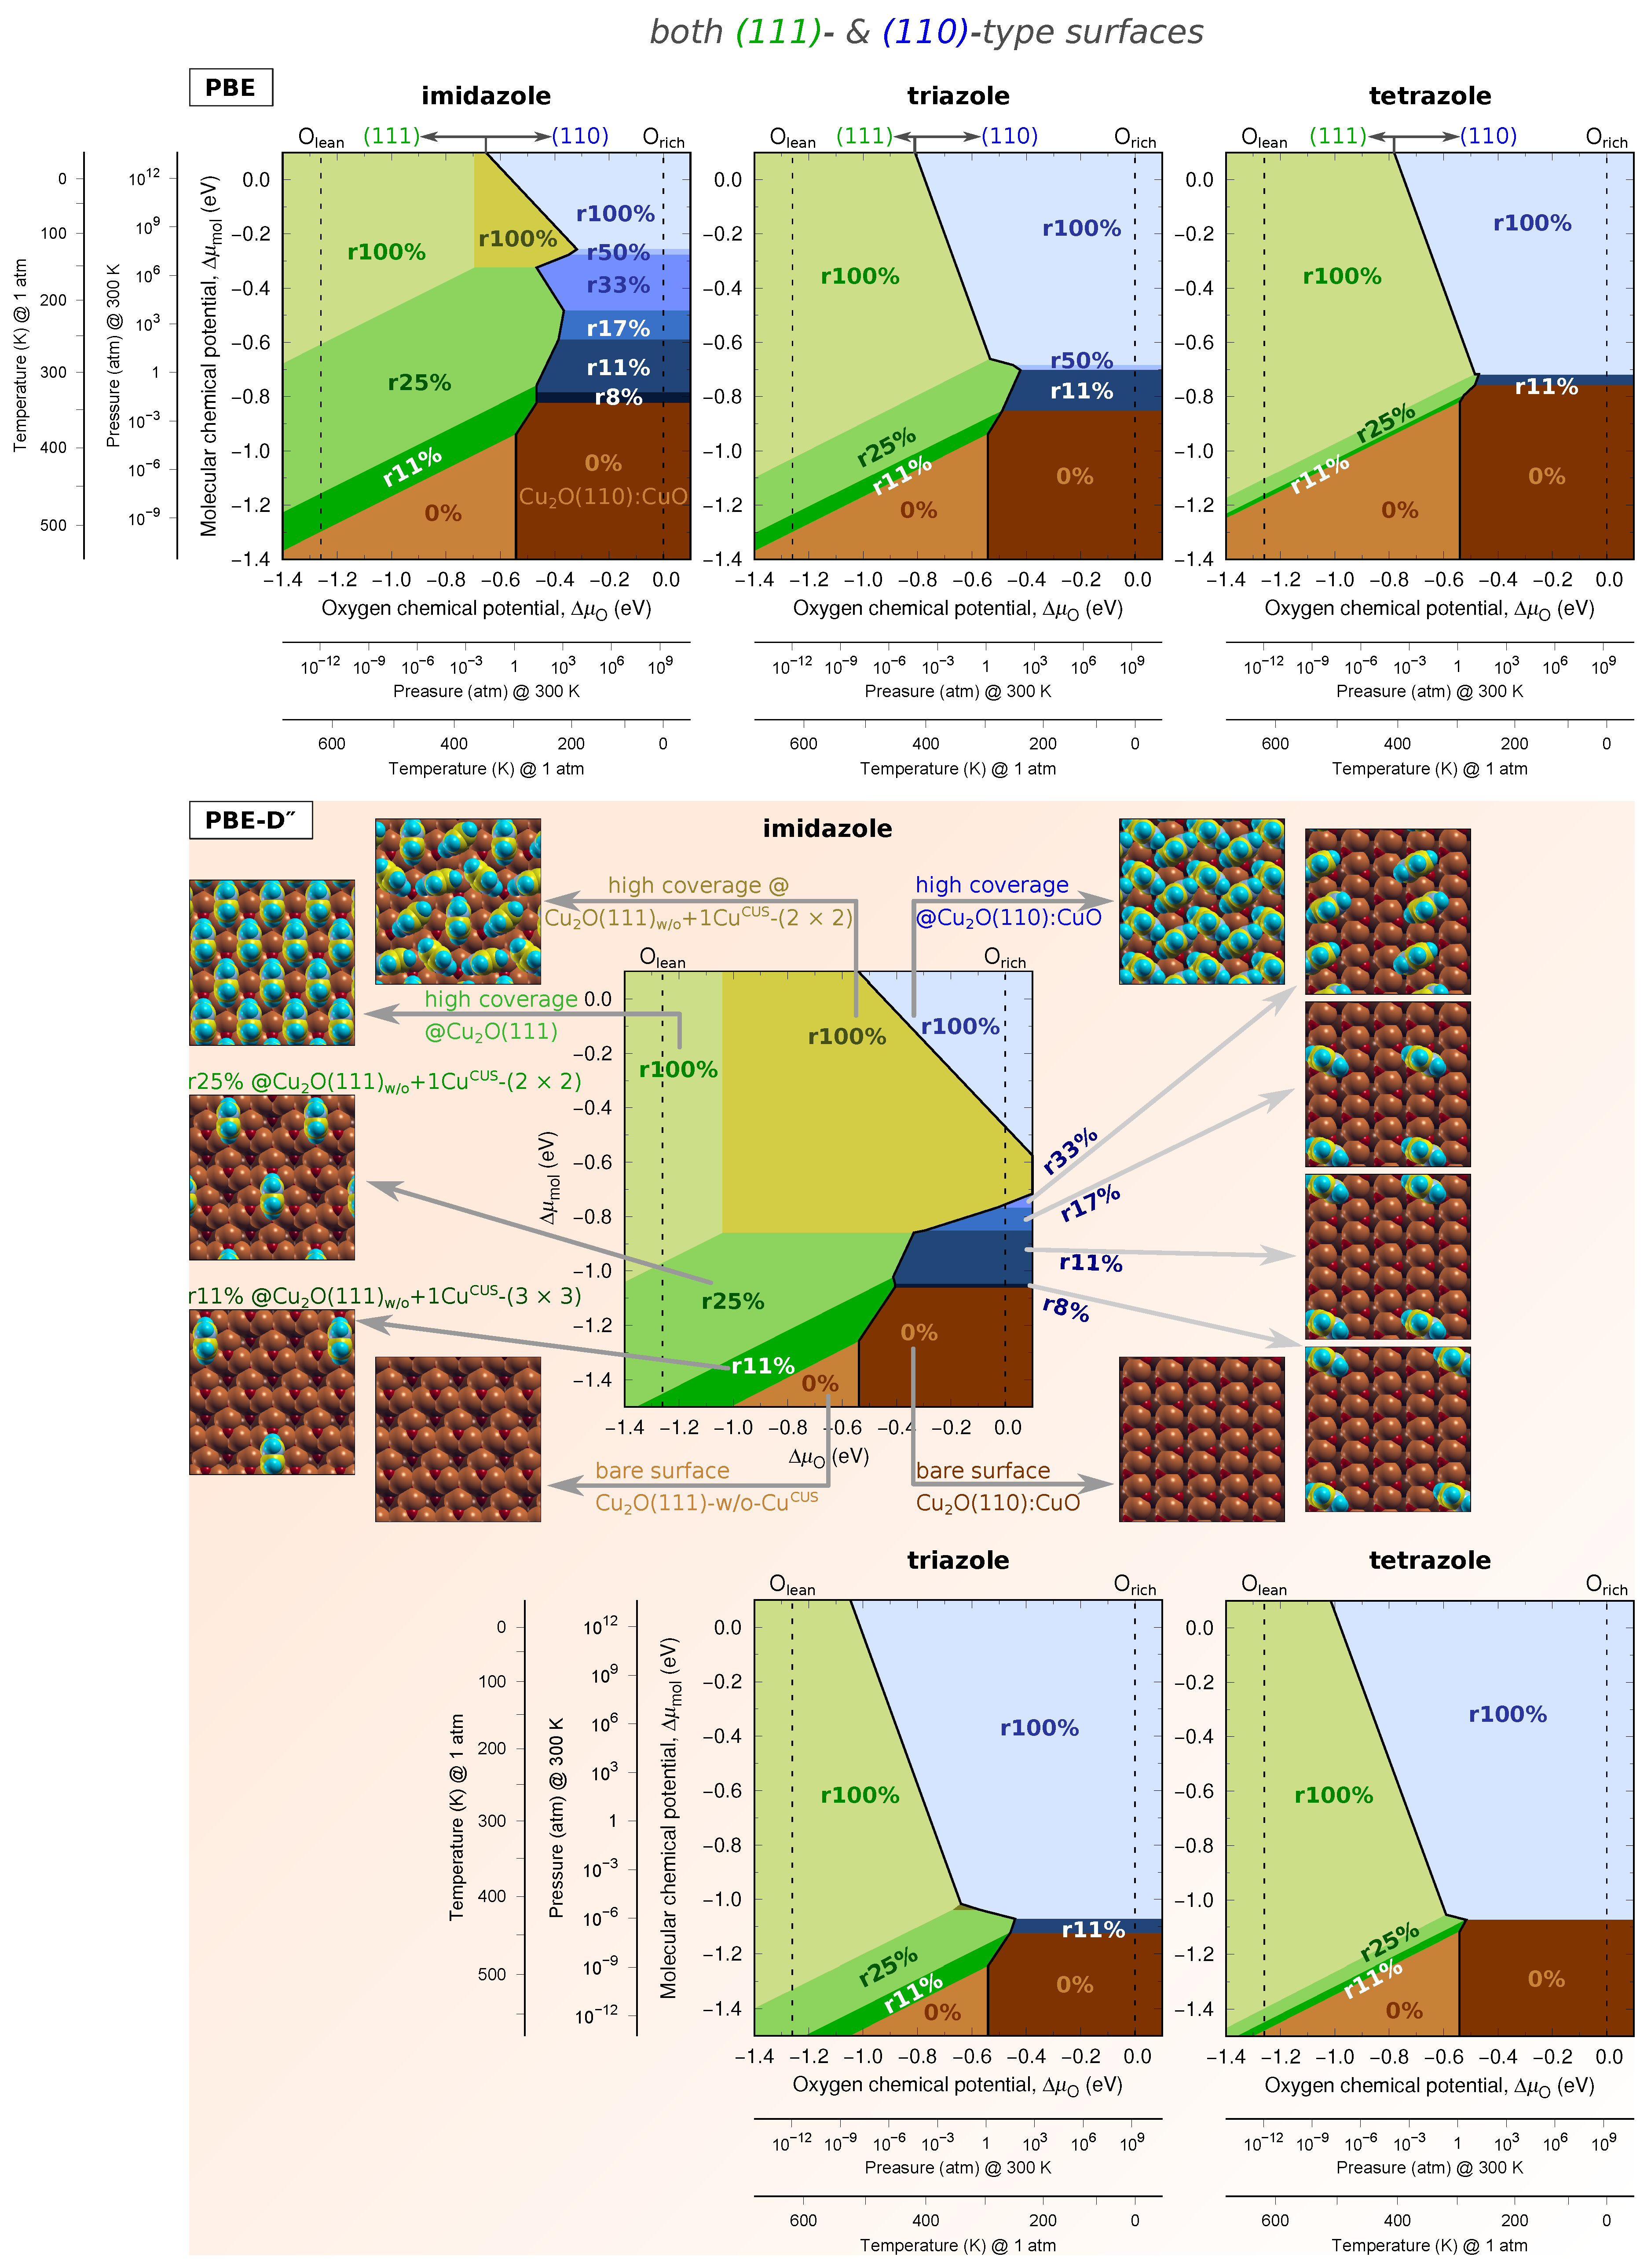
The above one-dimensional treatments (cf. Figure 6, Figure A4 and Figure A5) can be extended by considering the adsorption surface free energy as a two-dimensional (2D) function of and via Equation (10). Such a 2D treatment has already been considered in our previous publication [12], but only for CuO(111) and CuO(111)-w/o-Cu surfaces. However, currently we also consider the CuO(111)+1Cu–(2 × 2), CuO(111)+1Cu–(3 × 3), CuO(111)-recon-( × )R30, and CuO(110):CuO surfaces and the respective 2D phase diagrams are more involved. Figure 7 shows 2D phase diagrams for only CuO(111)-type surfaces, whereas in Figure 8 the CuO(110):CuO structures are superposed with CuO(111)-type structures; snapshots of the structures that appear on these phase diagrams are shown in the middle of Figure 8. In these figures the dependence of each chemical potential was also recast into a temperature scale at partial pressure atm and into a pressure scale at K. Note that each azole molecule should have its own p and T scales, but the scales for the three molecules are so similar that they are visually indistinguishable.
We first comment on the 2D phase diagrams for (111)-type surfaces only (Figure 7). Apart from one exception (i.e., high coverage phase of triazole on CuO(111)-w/o-Cu that appears only on calculated phase-diagram at the oxygen-rich limit), only two high coverage molecular phases appear on the top part of the phase diagrams: @ CuO(111) on the left (oxygen-lean conditions) and @ CuO(111)+1Cu–(2 × 2) on the right (oxygen-rich conditions). Below these high coverage molecular phases, two diagonal stripe like regions appear: the @ CuO(111)+1Cu–(2 × 2) and beneath it the @ CuO(111)+1Cu–(3 × 3). The domains of these two phases are the largest for imidazole and the smallest for tetrazole. In some cases very small regions of and @ CuO(111)+1Cu–(2 × 2) phases also appear in between the respective and phases. Finally, for sufficiently low molecular chemical potentials the bare CuO(111)-w/o-Cu surface is the stablest (bottom part of the phase diagrams).
Comparing the current 2D phase diagrams of only CuO(111)-type surfaces (Figure 7) to those published in our previous publication [12], we note that apart from one exception none of the molecular phases on CuO(111)-w/o-Cu appear on the current phase diagrams. Instead the high coverage phase on CuO(111)+1Cu–(2 × 2) appears on the top-right part of the phase diagrams. The reason for the discrepancy between the current 2D phase-diagrams and those previously published [12] is that we did not consider the CuO(111)+1Cu–() surfaces in our previous publication.
When both (111)- and (110)-type structures are considered together (Figure 8) then CuO(111)-type structures remain on the left part of phase diagrams (oxygen-lean conditions), whereas CuO(110):CuO structures appear on the right (oxygen-rich conditions). As for the latter, high coverage molecular-phase appears at the top-right and bare CuO(110):CuO surface at the bottom-right. The transition between the two—i.e., from high coverage to bare surface—is the broadest and the most continuous-like for imidazole. Namely, one passes from high coverage to lower and lower coverages as decreases: note the various blue band like regions on the PBE phase diagram indicating the , , , , and phases. For triazole this transition is sharper and for tetrazole the transition from to bare CuO(110):CuO is sharp on the diagram, whereas on the PBE diagram there is only a thin dark blue band region corresponding to phase. This trend is due to the intermolecular lateral-interactions, which are the most repulsive for imidazole and slightly attractive for tetrazole (cf. Figure 4).
The comparison between the PBE and calculated phase diagrams shows that the effect of dispersion interactions is mainly twofold: (i) the boundary between molecularly covered and bare surfaces shifts to lower values of due to dispersion enhanced adsorption bonding; (ii) the transition from bare CuO(110):CuO surface to high coverage molecular phase thereon is sharper due to attractive dispersion interactions between molecules at higher coverage (by “sharper” we mean that intermediate coverage blue bands are either narrower (imidazole and triazole) or even disappear (tetrazole) on phase diagrams).
4. Discussion
4.1. On the Role of CuCUS and CuOvac Sites
According to the phase diagrams for CuO(111)-type surfaces (Figure 7), the three azole molecules are able to stabilize the Cu sites under all conditions at which molecular adsorption is stable (the only exception appears for triazole on the phase diagram at the oxygen-rich limit, where the @ CuO(111)-w/o-Cu is the stablest). Cu sites stabilized by molecular adsorption are particularly interesting in view of the observations made recently by Nilius et al. [25], who drew attention to the well-known drawback of GGA related to the underestimation of band-gaps and incorrect predictions of absolute positions of band-edges. Consequently, they showed that GGA too strongly favors non-stoichiometric CuO(111)-w/o-Cu against stoichiometric CuO(111). However, despite the fact that GGA overestimates the instability of Cu sites, it predicts that azole molecules are able to stabilize them (note that currently utilized PBE and are GGA). In this respect we can anticipate two corollaries: (i) GGA may overestimate molecular bonding to Cu sites, which leads to error cancellation, i.e., overestimated Cu instability cancels with overestimated molecular bonding. (ii) GGA may reasonably predict the molecular bonding to Cu sites; in this case the molecular bonding to Cu sites would dominate to an even larger extent as currently predicted. It is worth noting that the comparison between GGA and GGA+U calculations (see Appendix A in Part I [1]) seems to indicate that GGA does not overestimate molecular bonding to Cu sites, because GGA+U predicts slightly stronger bonding. In both aforementioned cases, it is clear that molecular adsorption stabilizes the thermodynamic deficiency of coordinatively unsaturated Cu ions. Furthermore, azole molecules also bind more strongly to undercoordinated defects on metallic Cu surfaces [30,31,32]. Apparently, azoles display a strong tendency to preferentially adsorb at reactive undercoordinated or unsaturated surface sites and to stabilize them, which in turn tentatively suggests that their corrosion inhibition capability may, at least in part, stem from their ability to passivate reactive surface sites.
The observation that the CuCUS sites are stabilized by molecular adsorption is relevant in light of the fact that adsorption data, obtained from combined experimental–computational investigations [27,33], were recently used to evaluate various surface models of CuO surfaces. While such a procedure is elegant and appropriate for inferring the structure of surfaces covered with molecules, current results clearly show that it may not always be possible to correctly deduce the stability of bare surfaces on the basis of adsorption data.
Another notable observation from Figure 7 is that the CuO(111)-recon-( × )R30 surface is not sufficiently stabilized by the strong bonding of dissociated molecules to Cu sites thereon, because no CuO(111)-recon-( × )R30 structure appears on the phase diagrams. Nevertheless, oxygen vacancy Cu sites were observed experimentally [23]. Furthermore, it is in fact very difficult to prepare surfaces with no oxygen vacancies in vacuum [34]. Here several issues should be mentioned. First, it is obvious that oxygen vacancies and other surface defects are (to some extent) stabilized by configurational entropy, which is currently neglected. Secondly, oxygen vacancies are currently considered only at relatively large concentration of 33% using the CuO(111)-recon-( × )R30 model; according to calculations, the surface with such a large concentration of vacancies is too unstable (cf. Figure 2), hence it seems that a lower concentration of vacancies would be more realistic. Thirdly, the comparison between GGA and GGA+U calculations (see Appendix A in Part I [1]) indicates that GGA probably underestimates the dissociation tendency and correspondingly also the stabilization of the CuO(111)-recon-( × )R30 surface. It can be therefore reasonably anticipated that oxygen vacancies may be stabilized at lower concentration due to both configurational entropy effects and strong molecular adsorption. Further support to the presence of oxygen vacancy sites on CuO(111) surfaces was recently provided by means of combined experimental–computational studies of methanol dehydrogenation and adsorption of SO [27,33]. Finally, one also needs to consider non-equilibrium and kinetic aspects, which may be very important for corrosion and in particular for corrosion inhibition. Under such circumstances the reactive oxygen vacancy Cu sites may be passivated by the strongly adsorbed dissociated azole molecules.
4.2. The Relevance of Current Results in the Context of Corrosion Inhibition
The corollary of the above discussion about the inaccuracies introduced by the utilized approximations is that the phase diagrams presented in Figure 7 and Figure 8 should be considered qualitatively rather than quantitatively (note that differences appear already between PBE vs phase diagrams). The two most important points are that the Cu sites are stabilized by molecular adsorption and that azole molecules are able to cover CuO surfaces in high coverage, unless the molecular chemical potential is too low (at a given temperature low molecular chemical potential corresponds to low molecular partial pressure in the gas-phase or low concentration in solution, i.e., the smaller the concentration the smaller the chemical potential). Note that high coverage of the inhibitor on the surface is typically deemed very important to achieve efficient corrosion inhibition, because it is often assumed that inhibitor coverage () is directly related to corrosion inhibition efficiency (), i.e., [35]. However, it should be noted that the current phase diagrams pertain to noncompetitive adsorption, that is, adsorption of a single molecular species at the solid/vacuum interface; this interface was chosen due to obvious modeling reasons. However, in the context of corrosion the solid/water interface is relevant. Adsorption at the latter interface is competitive, because the surface is always covered with solvent molecules and other species, such as hydroxyls and ions from the solution. Correspondingly, a given molecule adsorbs only if its adsorption is competitive enough to substitute other species from the surface. In contrast, for noncompetitive adsorption at the solid/vacuum interface the molecule adsorbs readily, provided that its interaction with the surface is attractive. This point has to be kept in mind when considering the phase diagrams presented above.
The presented phase diagrams therefore reveal that azole molecules are able to cover CuO surfaces in high coverage only in principle. Whether they will really do so under given conditions for a given corrosion medium is an open-question that cannot be answered on the basis of the current results. It is known, though, that the currently considered plain azole molecules are not very good inhibitors [36,37,38], one of the reasons being their too high solubility [36]. However, their functionalized forms are known to be excellent inhibitors, e.g., molecules where the benzene ring is fused with the five-membered azole ring (benzimidazole and benzotriazole) or their mercapto derivatives (e.g., mercapto-benzimidazole).
4.3. Drawbacks of the Approximate Ab Initio Thermodynamics Approach
We would like to comment on two drawbacks of the approximate ab initio thermodynamics (“abTD”) approach used to construct the phase diagrams presented in Figure 6, Figure 7 and Figure 8, Figure A4 and Figure A5. The first is general and not specific to “abTD”, i.e., it is due to the enormous landscape of potential structures. Namely, a given phase diagram can only contain structures that are explicitly considered. If a given structure is not considered—for example, in calculations one can easily fail to identify some very stable structure—then it cannot appear on the phase diagram, even though it may be the most stable. This is why the current phase diagrams for (111)-type surfaces, presented in Figure 7, are different from those reported previously by us [12]. Namely, in our previous publication we did not consider the CuO(111)+1Cu surfaces.
The second drawback is specific to the approximate “abTD” approach, in particular, it is the drawback associated with Equation (11). In this equation the adsorption energy, , is used to represent the chemical potential of adsorbed species, whereas entropic effects, in particular the configurational entropy, are neglected. The consequence is that in some cases the transition between the clean and fully covered phases is discrete, which indicates a phase-transition (see for example the phase diagram of tetrazole in Figure 8). Below we show that such a phase-transition can be an artifact due to the neglect of configurational entropy.
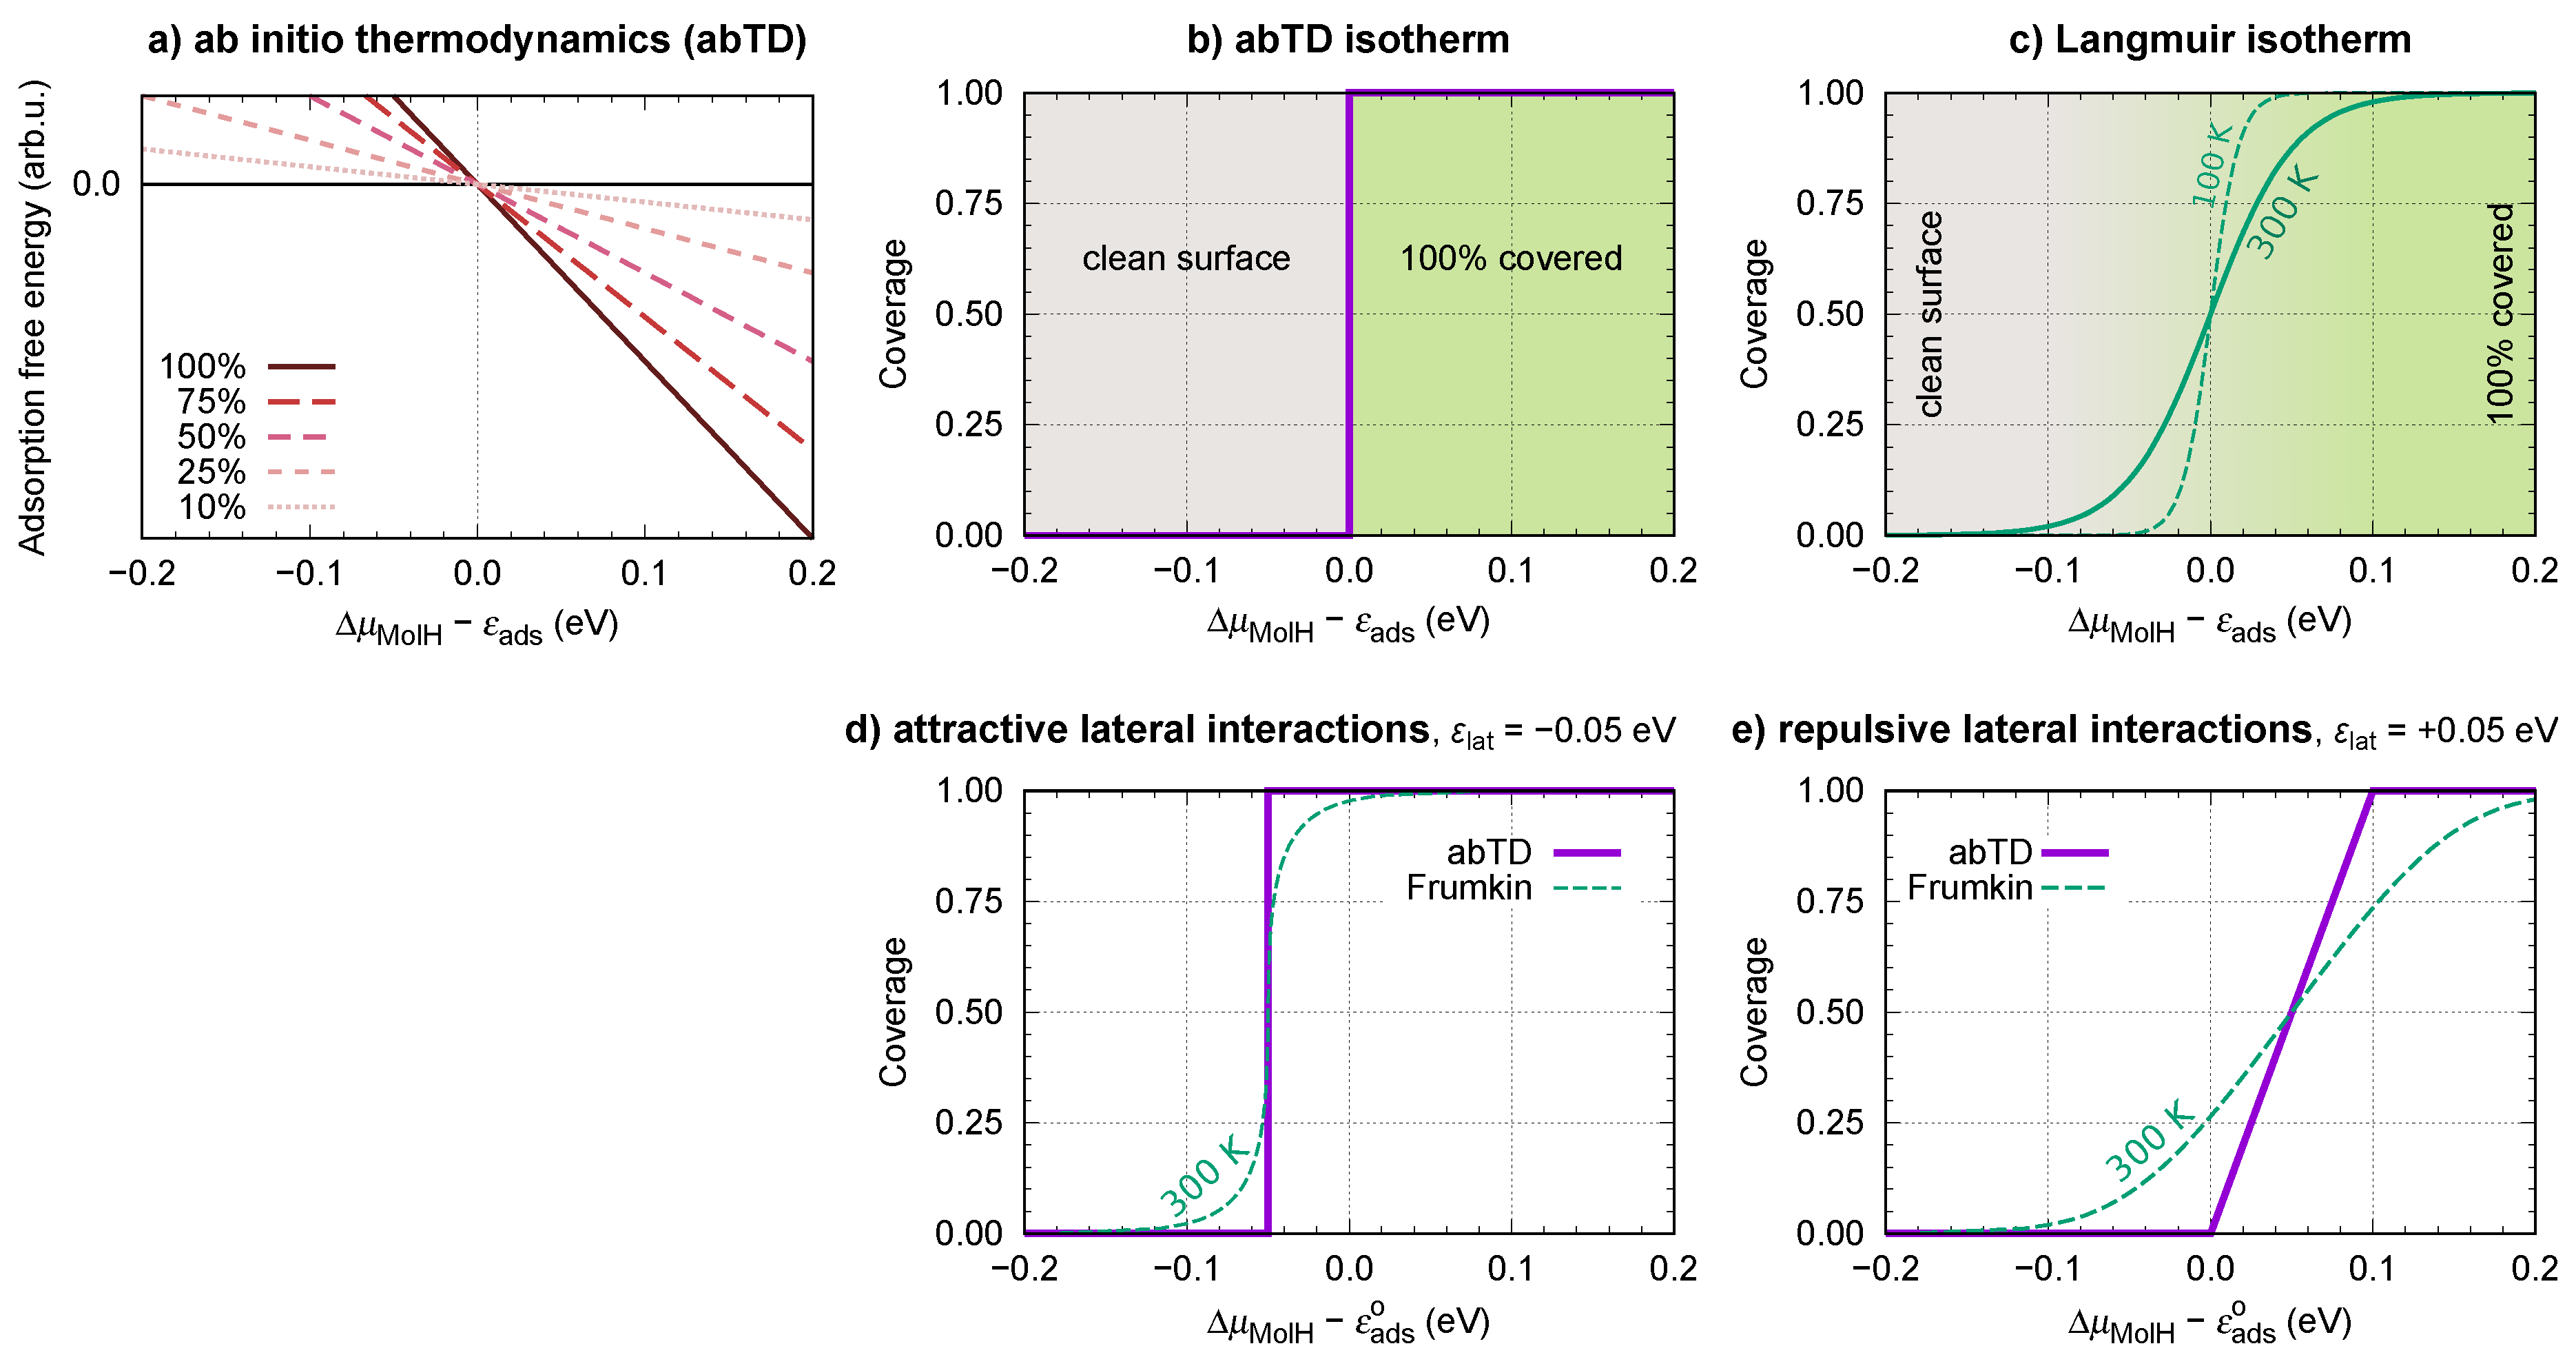
Let us consider a very simple case where the adsorption energy is independent from the coverage, i.e., constant (Langmuir adsorption model). Figure 9a plots the adsorption surface free energies as a function of molecular chemical potential as given by the approximate “abTD” approach, Equation (11). Three regimes are evident, in particular: (i) for the clean surface is the most stable (black horizontal line), (ii) at all lines intersect indicating the degeneracy of coverages, and (iii) at the 100% covered surface is the most stable. This implies that there is a discrete jump (phase-transition) from clean to full covered surface at (Figure 9b). The resulting isotherm can be stated as:
This phase-transition is, however, an artifact due to the neglect of configurational entropy. By taking configuration entropy into account one obtains the Langmuir adsorption isotherm, which can be expressed as a function of molecular chemical potential:
hence,
where T is the temperature and k is the Boltzmann constant. Consequently, the transition from the clean to the fully-covered surface is smooth. Figure 9c plots the Langmuir adsorption isotherm as a function of molecular chemical potential at two different temperatures (100 and 300 K); it can be seen that when the temperature is lower, the curve is steeper; the “abTD” curve therefore corresponds to Langmuir adsorption isotherm at K. This treatment therefore clearly demonstrates that when the is independent from the coverage, the phase-transition, predicted by the “abTD” approach (Figure 9b), is an artifact due to the neglect of configurational entropy.
However, for current molecules the depends on the coverage (cf. Figure 4), hence we also consider how the “abTD” approach performs in such cases. We again consider a very simple model, that is, the Frumkin model, where the adsorption energy linearly depends on the coverage () [39]:
where is the adsorption energy at zero coverage and is the lateral intermolecular energy per molecule at full coverage; for attractive and for repulsive lateral interactions. We will take a relatively small magnitude of eV, which corresponds to about at 300 K. By approximating the configurational entropy with the ideal one, which assumes that all configurations at a given are equally probable (this is currently not the case due to ), the corresponding relation between the coverage and (Frumkin adsorption isotherm) is:
We are only interested in comparing the “abTD” isotherm to the Frumkin isotherm, hence instead of solving this equation for , which is non-trivial, we can plot the Frumkin isotherm parametrically. The origin of the factor 2 in the term in the above equation is the following. The total adsorption energy in the Frumkin model is:
where N is the number of adsorbed molecules and A is the surface area. The chemical potential of the adsorbed molecule is therefore:
where the term was neglected, because this term is negligible for solids at ambient pressures.
In the case of attractive interactions, the “abTD” approach again predicts the phase-transition from clean to fully-covered surface at . However, this time the Frumkin isotherm is much closer to the “abTD” isotherm (Figure 9d) than in the Langmuir case (Figure 9b,c). For K and eV, the Frumkin isotherm almost coincides with the “abTD” isotherm for between 0.25 and 0.75, but below and above these coverages the Frumkin isotherm goes smoothly toward clean and fully-covered surfaces, respectively.
Only in the case of repulsive interactions does “abTD” approach not predict the phase-transition. Instead, the variation of coverage with can be described as:
that is, coverage increases linearly with when . However, even in this case the “abTD” predicted transition from clean to fully-covered surface is sharper than that predicted by Frumkin adsorption isotherm (Figure 9e).
It should be noted, though, that the Frumkin isotherms plotted in Figure 9d,e are too gradual, because it can be reasonably anticipated that the actual configurational entropy is smaller than the ideal configurational entropy that was used in Equation (23). This implies that the actual isotherms would be between those of “abTD” and Frumkin isotherms, when the adsorption energy is linearly dependent on the coverage.
5. Conclusions
Lateral intermolecular interactions and thermodynamic stability of various adsorption structures of imidazole, triazole, and tetrazole were characterized by means of DFT calculations on the following CuO surfaces: CuO(111), CuO(111)+1Cu–(2 × 2), CuO(111)+1Cu–(3 × 3), CuO(111)-w/o-Cu, CuO(111)-recon-( × )R30, and CuO(110):CuO. Lateral intermolecular interactions were found the most repulsive for imidazole and the least repulsive for tetrazole, for which they are usually even slightly attractive. The impact of van der Waals dispersion interactions on molecular adsorption bonding was also addressed; they enhance the molecule–surface bonding by about 0.4 eV/molecule. The thermodynamic analysis reveals that although dissociated azole molecules bind more strongly to surfaces than intact molecules and although at oxygen vacancy sites the dissociative adsorption is preferred over the non-dissociative, none of the considered structures that involve dissociated molecules appear on the phase diagrams, i.e., whatever the oxygen and azole molecular chemical potentials there is always some other structure that is more stable and does not involve oxygen vacancies and dissociated molecules. Nevertheless, it is known from experiments that oxygen vacancies exist on CuO surface and that it is in fact very difficult to prepare surfaces with no oxygen vacancies in vacuum [34]. The reason for this discord between the calculated phase diagrams and experimental observations is threefold: (i) we neglect the configurational entropy effects, which definitely favor the formation of vacancies, (ii) we consider oxygen vacancies only at relatively large concentration of 33% using the CuO(111)-recon-( × )R30 model; according to calculations the surface with such a large concentration of vacancies is thermodynamically unstable (it seems that a lower concentration of vacancies is more realistic), and (iii) GGA may underestimate the molecular dissociation tendency (as inferred from comparison with GGA+U results) and correspondingly the stabilization of the CuO(111)-recon-( × )R30 surface. Therefore, it can be reasonably anticipated that oxygen vacancies may be stabilized thermodynamically at lower concentration due to both configurational entropy effects and strong molecular adsorption.
The thermodynamic analysis further reveals that molecular adsorption can alter the relative stability of surfaces, i.e., molecular adsorption stabilizes some surfaces more than others. In particular, our results show that the three azole molecules adsorb to otherwise thermodynamically deficient Cu sites under all conditions for which molecular adsorption is stable on CuO(111)-type surfaces. This clearly indicates that molecular adsorption stabilizes the thermodynamic deficiency of coordinatively unsaturated Cu ions. Indeed, azole molecules display a strong tendency to preferentially adsorb at reactive undercoordinated surface sites, such as currently considered Cu and oxygen vacancy sites, and to stabilize them. This in turn tentatively suggests that the ability of these azole molecules to inhibit corrosion may stem, at least in part, from their ability to passivate reactive surface sites. There is, however, an important point to keep in mind when interpreting the current results in the context of corrosion inhibition. Namely, phase diagrams presented in the current paper pertain to noncompetitive adsorption (i.e., adsorption of a single molecular species) at the solid/vacuum interface, but in the context of corrosion the solid/water interface is relevant and adsorption thereon is competitive. Current phase diagrams therefore reveal that azole molecules are able to cover CuO surfaces in high coverage only in principle (note that inhibitor surface-coverage is often assumed to be directly related to its corrosion inhibition efficiency); whether they actually do so under given conditions for a given corrosion medium is an open-question that cannot be answered on the basis of current results.
We further analyzed a specific drawback of the approximate “abTD” approach that was used for the thermodynamic analysis and the construction of phase diagrams. In the “abTD” approach configurational entropy effects are often neglected and this results in a too hasty prediction of phase-transition like behavior between different coverages. While such a phase-transition can be reasonably expected when intermolecular lateral interactions are significant, the “abTD” approach with neglected configurational entropy also predicts a phase-transition like behavior from the clean to the fully covered surface when the adsorption energy is independent from the coverage.
Author Contributions
Anton Kokalj and Dunja Gustinčič conceived and designed the computational study. Dunja Gustinčič performed the calculations. Data were analyzed and the paper was written jointly by both authors. Dunja Gustičič constructed phase diagrams, while Anton Kokalj analyzed the drawback due to neglect of configurational entropy.
Acknowledgments
The authors thank Matic Poberžnik and Matic Lozinšek for valuable discussions and for their careful reading of the manuscript. The authors acknowledge the financial support from the Slovenian Research Agency (Grant No. P2-0393). This work is a part of the M-Era.Net project “Coin Desc: Corrosion inhibition and dealloying descriptors”, co-financed by the Slovenian Ministry of Education, Science, and Sport (Grant No. C3330-17-500074).
Conflicts of Interest
The authors declare no conflict of interest.
Abbreviations
The following abbreviations are used in this manuscript:
| DFT | density functional theory |
| GGA | generalized gradient approximation |
| PBE | Perdew–Burke–Ernzerhof |
| PBE with reparametrized empirical dispersion correction of Grimme | |
| BZ | Brillouin zone |
| CSA | coordinatively saturated |
| CUS | coordinatively unsaturated |
| abTD | ab initio thermodynamics |
Appendix A. Mapping of Molecular Chemical Potential into Temperature and Partial Pressure
In this study free energies of solids (in particular surfaces) were approximated with the DFT total energies. While the term is negligible for solids at ambient pressures, the vibrational contributions to thermal energy and entropy should be taken into account. However, vibrational calculations of the current surface structures (and also considering the large number of them) would be computationally too intensive for our available resources. We therefore neglected vibrational contributions. Such an approximation is acceptable only when vibrational contributions of reactants and products cancel each other to a large extent, i.e.,
where is the vibrational Helmholtz free energy. Although vibrational calculations of standalone molecules are relatively straightforward, they were also neglected for consistency reasons associated with Equation (A1). Only translational and rotational contributions to Gibbs free energy were therefore taken into account (for the oxygen molecule also electronic contribution). They were calculated as described in Supporting Information of ref [40]. In particular, the translational partition function is:
where the ideal gas-approximation was used, ; V is the volume per ideal-gas particle (molecule) and p is the partial pressure; m is the mass of the molecule. The corresponding translational contributions to thermal energy and entropy are:
The rotational partition function of a linear molecule is:
where I is the moment of inertia and is the rotational symmetry number. The rotational contributions to thermal energy and entropy are:
For a non-linear molecule, the rotational partition function and associated contributions to thermal energy and entropy are:
and
where , , and are the three eigenvalues of the moment of inertia tensor.
For the oxygen-molecule (triplet ground-state) the electronic contribution was also taken into account:
All of the above quantities are normalized to a single molecule, hence the chemical potential of a gaseous molecule (relative to the DFT calculated total energy) was calculated as:
where the ideal gas relation was used and . This equation was used to map into p and T axes.
Appendix B. Additional Figures
This appendix contains five figures: Figure A1 compares the calculated surface free energies of Önsten’s models A and B of the ( × )R30 reconstructed surfaces; Figure A2 shows comparison between calculated and estimated surface free energies of CuO(111)+1Cu–(2 × 2) and CuO(111)+1Cu–(3 × 3) surfaces; Figure A3 compares PBE and calculated average adsorption energy dependence on for two different adsorption structures of tetrazole on CuO(111)-w/o-Cu; and Figure A4 and Figure A5 depict the PBE and calculated adsorption surface free energies as a function of the molecular chemical potential.
Figure A1.
Surface energies of Önsten’s models A and B of the ( × )R30 reconstructed CuO(111) surface—the difference between the two models is that model A contains Cu ions—compared to surface energies of other surfaces, which are shown as faded. Notice that the model A is predicted to be the least stable among the considered surface models, which is in agreement with GGA+U calculations of Bendavid and Carter [24].

Figure A2.
Comparison between explicitly calculated (solid lines) and estimated (dashed lines) surface free energies of CuO(111)+1Cu–(2 × 2) and CuO(111)+1Cu–(3 × 3) surfaces. The “estimated” surface free energy, , is calculated as a linear combination of surface free energies of CuO(111)r and CuO(111)-w/o-Cu, i.e., , where is the fraction of Cu ions, which is 0.25 and 0.11 for the CuO(111)+1Cu–(2 × 2) and CuO(111)+1Cu–(3 × 3) surfaces, respectively.

Figure A3.
Top-left: PBE and calculated average adsorption energy as a function of the nearest-neighbor intermolecular distance () for two different adsorption structures of tetrazole on CuO(111)-w/o-Cu. Notice that PBE predicts the N2+N1H⋯O (black) and the N2+N1H⋯O (red) structure to be the most stable; snapshots of the two are shown on the right. Bottom-left: the difference between and PBE adsorption energies for the two structures.

Figure A4.
PBE and calculated adsorption surface free energies as a function of the molecular chemical potential, of Equation (11), for imidazole (left), triazole (middle), and tetrazole (right) on CuO(111) (top), CuO(111)+1Cu–(2 × 2) (middle) and CuO(111)-w/o-Cu (bottom) surfaces. Only the preferred non-dissociative adsorption modes are considered.

Figure A5.
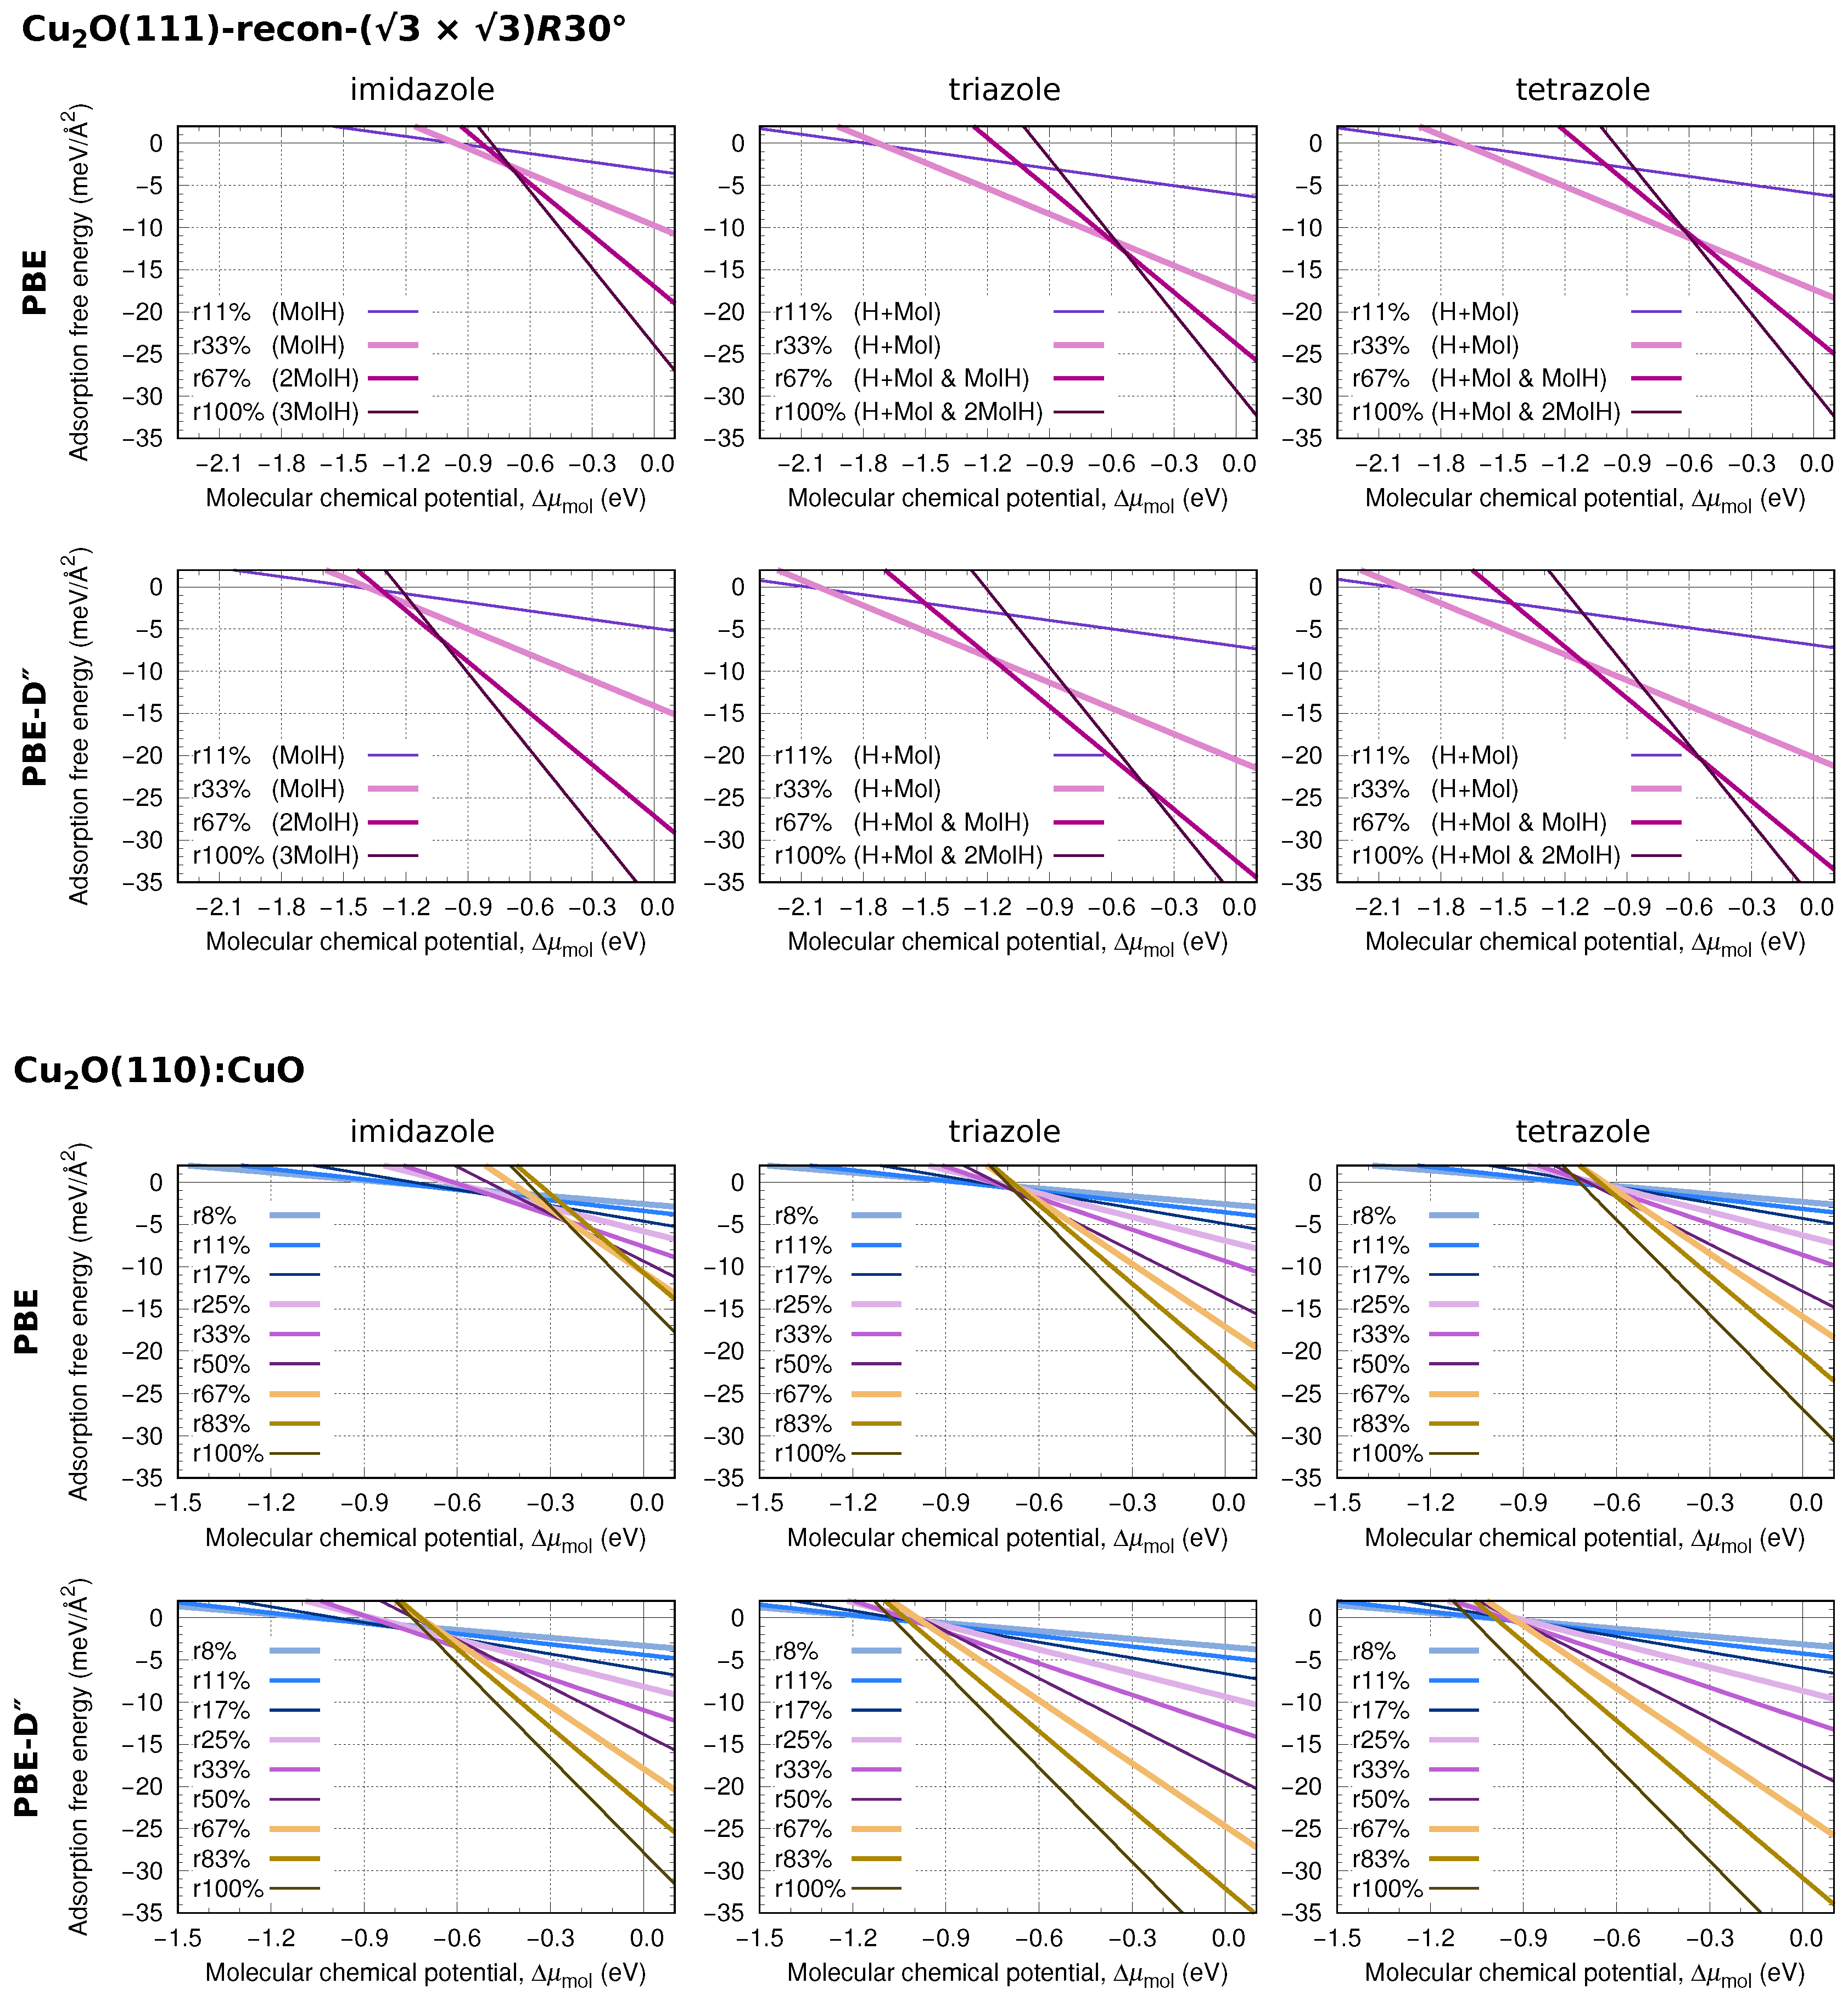
As in Figure A4, but for CuO(111)-recon-( × )R30 (top) and CuO(110):CuO (bottom). Only the preferred adsorption modes at given coverages are considered. In particular, triazole and tetrazole prefer to adsorb dissociatively on CuO(111)-recon-( × )R30 up to a coverage of (marked as “H+Mol”) and above it in mixed-mode (marked as “H+Mol & nMolH”, ). For all other cases the molecules prefer to adsorb non-dissociatively.
Figure A5.
As in Figure A4, but for CuO(111)-recon-( × )R30 (top) and CuO(110):CuO (bottom). Only the preferred adsorption modes at given coverages are considered. In particular, triazole and tetrazole prefer to adsorb dissociatively on CuO(111)-recon-( × )R30 up to a coverage of (marked as “H+Mol”) and above it in mixed-mode (marked as “H+Mol & nMolH”, ). For all other cases the molecules prefer to adsorb non-dissociatively.

References
- Gustinčič, D.; Kokalj, A. DFT Study of Azole Corrosion Inhibitors on Cu2O Model of Oxidized Copper Surfaces: I. Molecule–Surface and Cl–Surface Bonding. Metals 2018, 8, 310. [Google Scholar] [CrossRef]
- Reuter, K.; Scheffler, M. Composition, structure, and stability of RuO2(110) as a function of oxygen pressure. Phys. Rev. B 2001, 65, 035406. [Google Scholar] [CrossRef]
- Perdew, J.P.; Burke, K.; Ernzerhof, M. Generalized gradient approximation made simple. Phys. Rev. Lett. 1996, 77, 3865–3868. [Google Scholar] [CrossRef] [PubMed]
- Isseroff, L.Y.; Carter, E.A. Importance of reference Hamiltonians containing exact exchange for accurate one-shot GW calculations of Cu2O. Phys. Rev. B 2012, 85, 235142. [Google Scholar] [CrossRef]
- Scanlon, D.O.; Morgan, B.J.; Watson, G.W. Modeling the polaronic nature of p-type defects in Cu2O: The failure of GGA and GGA+U. J. Chem. Phys. 2009, 131, 124703. [Google Scholar] [CrossRef] [PubMed]
- Grimme, S. Semiempirical GGA-type density functional constructed with a long-range dispersion correction. J. Comput. Chem. 2006, 27, 1787–1799. [Google Scholar] [CrossRef] [PubMed]
- Barone, V.; Casarin, M.; Forrer, D.; Pavone, M.; Sambi, M.; Vittadini, A. Role and effective treatment of dispersive forces in materials: Polyethylene and graphite crystals as test cases. J. Comput. Chem. 2009, 30, 934–939. [Google Scholar] [CrossRef] [PubMed]
- McNellis, E.R.; Meyer, J.; Reuter, K. Azobenzene at coinage metal surfaces: Role of dispersive van der Waals interactions. Phys. Rev. B 2009, 80, 205414. [Google Scholar] [CrossRef]
- Kokalj, A.; Peljhan, S. Density functional theory study of ATA, BTAH, and BTAOH as copper corrosion inhibitors: Adsorption onto Cu(111) from gas phase. Langmuir 2010, 26, 14582–14593. [Google Scholar] [CrossRef] [PubMed]
- Tonigold, K.; Groß, A. Adsorption of small aromatic molecules on the (111) surfaces of noble metals: A density functional theory study with semiempirical corrections for dispersion effects. J. Chem. Phys. 2010, 132, 224701. [Google Scholar] [CrossRef] [PubMed]
- Klimeš, J.; Michaelides, A. Perspective: Advances and challenges in treating van der Waals dispersion forces in density functional theory. J. Chem. Phys. 2012, 137, 120901. [Google Scholar] [CrossRef] [PubMed]
- Gustinčič, D.; Kokalj, A. A DFT study of adsorption of imidazole, triazole, and tetrazole on oxidized copper surfaces: Cu2O(111) and Cu2O(111)-w/o-CuCUS. Phys. Chem. Chem. Phys. 2015, 17, 28602–28615. [Google Scholar] [CrossRef] [PubMed]
- Vanderbilt, D. Soft self-consistent pseudopotentials in a generalized eigenvalue formalism. Phys. Rev. B 1990, 41, 7892–7895. [Google Scholar] [CrossRef]
- Ultrasoft pseudopotentials for H, C, N, O, and Cu were taken from the Quantum Espresso Pseudopotential. 2017. Available online: http://www.quantum-espresso.org/pseudopotentials (accessed on 21 August 2017). (files: H.pbe-rrkjus.UPF, C.pbe-rrkjus.UPF, N.pbe-rrkjus.UPF, O.pbe-rrkjus.UPF and Cu.pbe-d-rrkjus.UPF).
- Monkhorst, H.J.; Pack, J.D. Special points for Brillouin zone integrations. Phys. Rev. B 1976, 13, 5188–5192. [Google Scholar] [CrossRef]
- Marzari, N.; Vanderbilt, D.; De Vita, A.; Payne, M.C. Thermal contraction and disordering of the Al(110) surface. Phys. Rev. Lett. 1999, 82, 3296–3299. [Google Scholar] [CrossRef]
- Giannozzi, P.; Baroni, S.; Bonini, N.; Calandra, M.; Car, R.; Cavazzoni, C.; Ceresoli, D.; Chiarotti, G.L.; Cococcioni, M.; Dabo, I.; et al. QUANTUM ESPRESSO: A modular and open-source software project for quantum simulations of materials. J. Phys. Condens. Matter 2009, 21, 395502. [Google Scholar] [CrossRef] [PubMed]
- Giannozzi, P.; Andreussi, O.; Brumme, T.; Bunau, O.; Nardelli, M.B.; Calandra, M.; Car, R.; Cavazzoni, C.; Ceresoli, D.; Cococcioni, M.; et al. Advanced capabilities for materials modelling with Quantum ESPRESSO. J. Phys. Condens. Matter 2017, 29, 465901. [Google Scholar] [CrossRef] [PubMed]
- Kokalj, A.; Peljhan, S. Density functional theory study of adsorption of benzotriazole on Cu2O surfaces. J. Phys. Chem. C 2015, 119, 11625–11635. [Google Scholar] [CrossRef]
- Bengtsson, L. Dipole correction for surface supercell calculations. Phys. Rev. B 1999, 59, 12301–12304. [Google Scholar] [CrossRef]
- Soon, A.; Todorova, M.; Delley, B.; Stampfl, C. Thermodynamic stability and structure of copper oxide surfaces: A first-principles investigation. Phys. Rev. B 2007, 75, 125420–125429. [Google Scholar] [CrossRef]
- Li, C.; Wang, F.; Li, S.; Sun, Q.; Jia, Y. Stability and electronic properties of the O-terminated Cu2O(111) surfaces: First-principles investigation. Phys. Lett. A 2010, 374, 2994–2998. [Google Scholar] [CrossRef]
- Önsten, A.; Göthelid, M.; Karlsson, U.O. Atomic structure of Cu2O(111). Surf. Sci. 2009, 603, 257–264. [Google Scholar] [CrossRef]
- Bendavid, L.I.; Carter, E.A. First-principles predictions of the structure, stability, and photocatalytic potential of Cu2O surfaces. J. Phys. Chem. B 2013, 117, 15750–15760. [Google Scholar] [CrossRef] [PubMed]
- Nilius, N.; Fedderwitz, H.; Groß, B.; Noguera, C.; Goniakowski, J. Incorrect DFT-GGA predictions of the stability of non-stoichiometric/polar dielectric surfaces: the case of Cu2O(111). Phys. Chem. Chem. Phys. 2016, 18, 6729–6733. [Google Scholar] [CrossRef] [PubMed]
- Kokalj, A. Ab initio modeling of the bonding of benzotriazole corrosion inhibitor to reduced and oxidized copper surfaces. Faraday Discuss. 2015, 180, 415–438. [Google Scholar] [CrossRef] [PubMed]
- Besharat, Z.; Stenlid, J.H.; Soldemo, M.; Marks, K.; Önsten, A.; Johnson, M.; Öström, H.; Weissenrieder, J.; Brinck, T.; Göthelid, M. Dehydrogenation of methanol on Cu2O(100) and (111). J. Chem. Phys. 2017, 146, 244702. [Google Scholar] [CrossRef] [PubMed]
- Kovačević, N.; Kokalj, A. DFT Study of Interaction of Azoles with Cu(111) and Al(111) Surfaces: Role of Azole Nitrogen Atoms and Dipole–Dipole Interactions. J. Phys. Chem. C 2011, 115, 24189–24197. [Google Scholar] [CrossRef]
- Kokalj, A. Electrostatic model for treating long-range lateral interactions between polar molecules adsorbed on metal surfaces. Phys. Rev. B 2011, 84, 045418. [Google Scholar] [CrossRef]
- Peljhan, S.; Kokalj, A. DFT study of gas-phase adsorption of benzotriazole on Cu(111), Cu(100), Cu(110), and low coordinated defects thereon. Phys. Chem. Chem. Phys. 2011, 13, 20408–20417. [Google Scholar] [CrossRef] [PubMed]
- Peljhan, S.; Koller, J.; Kokalj, A. The Effect of Surface Geometry of Copper on Adsorption of Benzotriazole and Cl. Part I. J. Phys. Chem. C 2014, 118, 933–943. [Google Scholar] [CrossRef]
- Kovačević, N.; Milošev, I.; Kokalj, A. The roles of mercapto, benzene, and methyl groups in the corrosion inhibition of imidazoles on copper: II. Inhibitor–copper bonding. Corros. Sci. 2015, 98, 457–470. [Google Scholar] [CrossRef]
- Soldemo, M.; Stenlid, J.H.; Besharat, Z.; Johansson, N.; Önsten, A.; Knudsen, J.; Schnadt, J.; Göthelid, M.; Brinck, T.; Weissenrieder, J. Interaction of sulfur dioxide and near-ambient pressures of water vapor with cuprous oxide surfaces. J. Phys. Chem. C 2017, 121, 24011–24024. [Google Scholar] [CrossRef]
- Deng, X.; Herranz, T.; Weis, C.; Bluhm, H.; Salmeron, M. Adsorption of Water on Cu2O and Al2O3 Thin Films. J. Phys. Chem. C 2008, 112, 9668–9672. [Google Scholar] [CrossRef]
- Kokalj, A.; Costa, D. Molecular Modeling of Corrosion Inhibitors. In Reference Module in Chemistry, Molecular Sciences and Chemical Engineering; Encyclopedia of Interfacial Chemistry: Surface Science and Electrochemistry; Elsevier: Amsterdam, The Netherlands, 2018; Volume 6.1, pp. 332–345. [Google Scholar] [CrossRef]
- Kuznetsov, Y.; Kazansky, L. Physicochemical aspects of metal protection by azoles as corrosion inhibitors. Russ. Chem. Rev. 2008, 77, 219–232. [Google Scholar] [CrossRef]
- Milošev, I.; Kovačević, N.; Kovač, J.; Kokalj, A. The roles of mercapto, benzene and methyl groups in the corrosion inhibition of imidazoles on copper: I. Experimental characterization. Corros. Sci. 2015, 98, 107–118. [Google Scholar] [CrossRef]
- Kovačević, N.; Milošev, I.; Kokalj, A. How relevant is the adsorption bonding of imidazoles and triazoles for their corrosion inhibition of copper? Corros. Sci. 2017, 124, 25–34. [Google Scholar] [CrossRef]
- Schmickler, W.; Santos, E. Interfacial Electrochemistry, 2nd ed.; Springer: Berlin/Heidelberg, Germany, 2010. [Google Scholar]
- Poberžnik, M.; Costa, D.; Hemeryck, A.; Kokalj, A. Insight into the Bonding of Silanols to Oxidized Aluminum Surfaces. J. Phys. Chem C 2018, in press. [Google Scholar] [CrossRef]
Scheme 1.
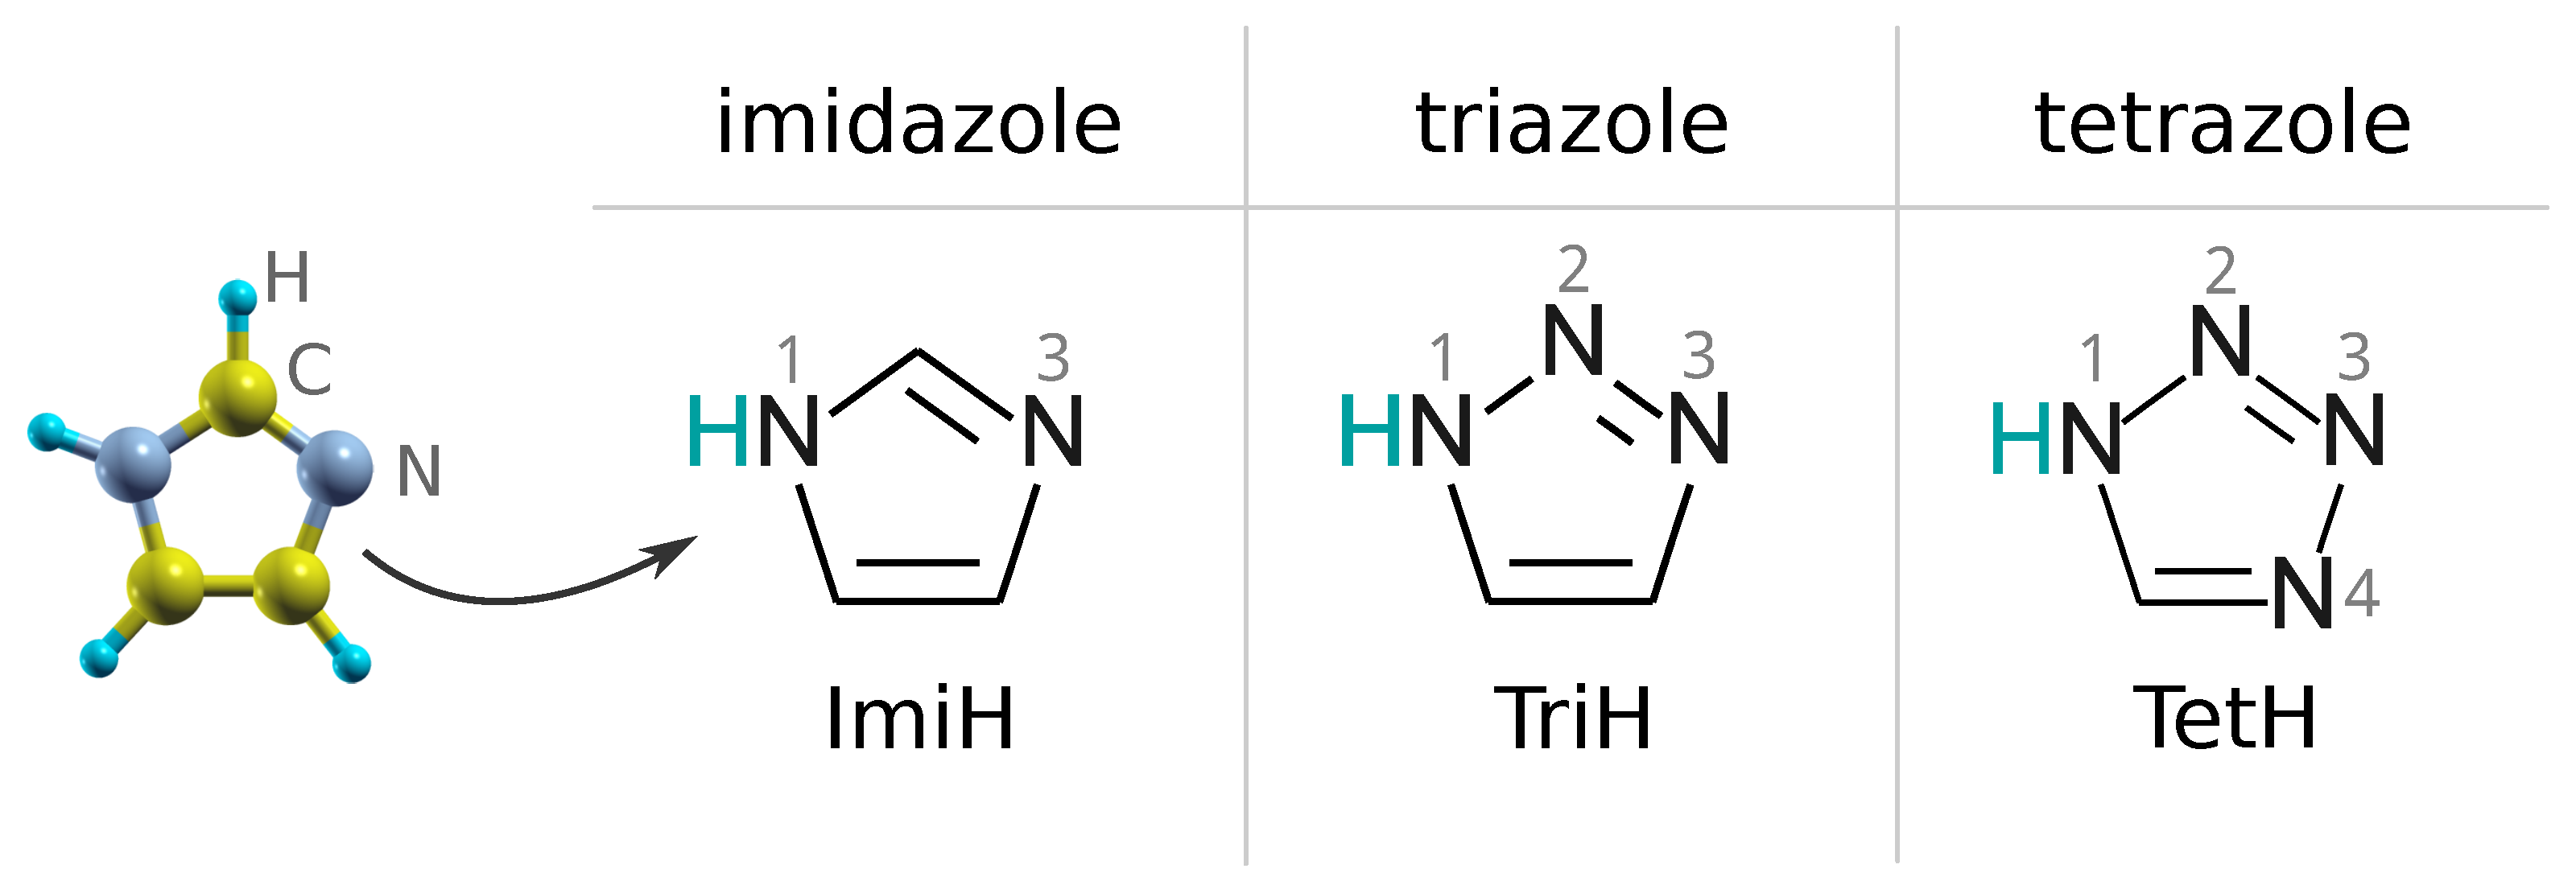
Skeletal formulas of imidazole, triazole, and tetrazole. Numbering of N atoms is also indicated. ImiH, TriH, and TetH are shorthand labels for the intact imidazole, triazole, and tetrazole, respectively. Note that dissociative adsorption involves the cleavage of the N1–H bond, i.e., the cyan colored H is stripped off the molecule. Atom coloring as used in this work is indicated on the ball-and-stick model of imidazole shown on the left.
Scheme 1.
Skeletal formulas of imidazole, triazole, and tetrazole. Numbering of N atoms is also indicated. ImiH, TriH, and TetH are shorthand labels for the intact imidazole, triazole, and tetrazole, respectively. Note that dissociative adsorption involves the cleavage of the N1–H bond, i.e., the cyan colored H is stripped off the molecule. Atom coloring as used in this work is indicated on the ball-and-stick model of imidazole shown on the left.

Figure 1.
Top-views of considered CuO surface structures with various Cu (bigger brown balls) and O (smaller red balls) ions labeled graphically. (a)–(d) four different CuO(111)-type surfaces and (e) CuO(110)-type surface. The unit cell of each surface structure is indicated with a white parallelogram. For a more detailed graphical representation of these models, see Figures 1 and 2 in Part I [1].

Figure 2.
PBE calculated surface free energies for the considered CuO surfaces as a function of the oxygen chemical potential, Equation (13). The O and O labels mark the oxygen-lean and oxygen-rich limits, respectively. The corresponding surface structures are depicted in Figure 1; see also Figures 1 and 2 in Part I [1].

Figure 3.
PBE (top) and (bottom) calculated bond-strengths for (a) MolH∗ and (b) Mol∗ adsorption modes of imidazole, triazole, and tetrazole at considered Cu sites and the respective (c) dissociation energies for MolH∗ + ∗→ Mol∗ + H∗ reaction (N1–H bond cleavage); note that after the dissociation the H binds to a nearby lattice O ion thus forming a surface OH group. The association between sites and surfaces is as follows: Cu corresponds to CuO(111)-w/o-Cu, Cu to CuO(111)+1Cu, Cu to CuO(111)-recon-( × )R30, and Cu to CuO(110):CuO.

Figure 4.
Top row: dependence of PBE (solid symbols and lines) and (open symbols and dashed lines) calculated average adsorption energies on either the nearest-neighbor intermolecular distance () or the effective nearest-neighbor intermolecular distance ( of Equation (18)) for imidazole, triazole, and tetrazole on considered CuO surfaces; note that the ordinate axes are different for each surface. Lines are drawn to guide the eye. Molecules preferentially bind to the following sites: Cu on CuO(111)+1Cu, Cu on CuO(111)-w/o-Cu, Cu on CuO(111)-recon-( × )R30, and Cu on CuO(110):CuO. Only the most stable configurations at each site are considered, which—apart from two exceptions—correspond to non-dissociative adsorption mode. The two exceptions are triazole and tetrazole at Cu sites on CuO(111)-recon-( × )R30, for which dissociative adsorption is the stablest (cf. Figure 3c). However, when all the Cu sites are occupied on CuO(111)-recon-( × )R30, which happens at a relative coverage of 1/3 ML, the molecules start to adsorb non-dissociatively; this implies a mixed-mode adsorption for coverages larger than 1/3 ML. The transition from dissociative to mixed-mode adsorption is seen by the large upward “jump” in adsorption energy as going 1/3 to 2/3 ML coverage; coverages at which the mixed-mode adsorption takes place are indicated by a yellowish band. Bottom row: the difference between and PBE adsorption energies.

Figure 5.
PBE calculated total adsorption energy per unit area, , as a function of coverage (the results display the same trend and are thus not shown). Except for triazole and tetrazole on CuO(111)-recon-( × )R30, the molecules prefer to adsorb non-dissociatively. The yellowish regions on graphs for CuO(111)+1Cu–(2 × 2) and CuO(111)-recon-( × )R30 surfaces indicate the regions of mixed-site and mixed-mode adsorption, i.e., on the former the molecules adsorb onto Cu sites up to the coverage of , at which all the Cu sites are occupied, and above it the molecules adsorb onto remaining surface sites, whereas on CuO(111)-recon-( × )R30 triazole and tetrazole adsorb dissociatively onto Cu sites up to the coverage of and above it non-dissociatively.

Figure 6.
Surface free energies (top row) as a function of oxygen chemical potential, (), for five considered surfaces and their stabilization (two middle rows) due to high coverage adsorption, , of imidazole (left), triazole (middle), and tetrazole (right) as calculated with PBE and functionals; note that ordinate axes are different for each row but within the row they are the same. The bottom row shows top-view snapshots of high coverage triazole structures on the five considered surfaces; surface Cu atoms are shown as bigger brown balls and O atoms as smaller red balls, whereas molecular atoms are colored as in Scheme 1. Notice the mixed-site and mixed-mode adsorption on CuO(111)+1Cu–(2 × 2) and CuO(111)-recon-( × )R30, respectively. In particular, on the former one molecule adsorbs at Cu and three molecules at Cu sites per supercell, whereas on the latter one molecule adsorbs dissociatively and two molecules non-dissociatively (labeled as H+Mol & 2MolH); dissociated molecules are encircled.

Figure 7.
Two-dimensional phase diagrams as a function of azole and oxygen chemical potentials, , for imidazole (left), triazole (middle), and tetrazole (right) on CuO(111)-type surfaces, calculated with PBE (top row) and (bottom row) functionals. Top-view snapshots of structures appearing on the phase diagrams are shown in Figure 8. The dependence on each chemical potential was also recast into a temperature scale at partial pressure atm and into a partial pressure scale at K (shown by two additional axes for each chemical potential).

Figure 8.
As in Figure 7, but in addition to CuO(111)-type surfaces also the CuO(110):CuO surface is considered. Notice that CuO(111)-type structures appear on the left part of phase diagrams, whereas CuO(110):CuO structures appear on the right. Top-view snapshots and naming of structures that appear on the phase diagrams are shown for imidazole.

Figure 9.
Comparison of approximate ab initio thermodynamics (abTD) approach, Equation (11), compared to Langmuir and Frumkin adsorption isotherms. (a) Adsorption free energy per unit area as a function of molecular chemical potential, calculated by Equation (11), for the case when the adsorption energy is independent from the coverage (i.e., Langmuir adsorption model) and the corresponding (b) “abTD” isotherm. (c) Langmuir adsorption isotherms at and 300 K. Comparison between “abTD” and Frumkin isotherms at K for (d) attractive lateral interactions, eV and (e) repulsive lateral interactions, eV.

© 2018 by the authors. Licensee MDPI, Basel, Switzerland. This article is an open access article distributed under the terms and conditions of the Creative Commons Attribution (CC BY) license (http://creativecommons.org/licenses/by/4.0/).
Share and Cite
MDPI and ACS Style
Gustinčič, D.; Kokalj, A. DFT Study of Azole Corrosion Inhibitors on Cu2O Model of Oxidized Copper Surfaces: II. Lateral Interactions and Thermodynamic Stability. Metals 2018, 8, 311. https://doi.org/10.3390/met8050311
AMA Style
Gustinčič D, Kokalj A. DFT Study of Azole Corrosion Inhibitors on Cu2O Model of Oxidized Copper Surfaces: II. Lateral Interactions and Thermodynamic Stability. Metals. 2018; 8(5):311. https://doi.org/10.3390/met8050311
Chicago/Turabian StyleGustinčič, Dunja, and Anton Kokalj. 2018. "DFT Study of Azole Corrosion Inhibitors on Cu2O Model of Oxidized Copper Surfaces: II. Lateral Interactions and Thermodynamic Stability" Metals 8, no. 5: 311. https://doi.org/10.3390/met8050311
Note that from the first issue of 2016, this journal uses article numbers instead of page numbers. See further details here.