Hot Deformation Behavior and Processing Map of Mg-3Sn-2Ca-0.4Al-0.4Zn Alloy


1
Department of Mechanical and Biomedical Engineering, City University of Hong Kong, Tat Chee Avenue, Kowloon, Hong Kong, China
2
Magnesium Innovation Centre, Helmholtz Zentrum Geesthacht, Max-Planck-Strasse 1, 21502 Geesthacht, Germany
3
Current Address: Department of Physics, Bharathiar University, Tamil Nadu 641046, India
*
Author to whom correspondence should be addressed.
Metals 2018, 8(4), 216; https://doi.org/10.3390/met8040216
Submission received: 11 January 2018
/
Revised: 20 March 2018
/
Accepted: 21 March 2018
/
Published: 27 March 2018
(This article belongs to the Special Issue Metallic Materials and Manufacturing)
Abstract
:Among newly developed TX (Mg-Sn-Ca) alloys, TX32 alloy strikes a good balance between ductility, corrosion, and creep properties. This study reports the influence of aluminum and zinc additions (0.4 wt % each) to TX32 alloy on its strength and deformation behavior. Uniaxial compression tests were performed under various strain rates and temperature conditions in the ranges of 0.0003–10 s−1 and 300–500 °C, respectively. A processing map was developed for TXAZ3200 alloy, and it exhibits three domains that enable good hot workability in the ranges (1) 300–340 °C/0.0003–0.001 s−1; (2) 400–480 °C/0.01–1 s−1; and (3) 350–500 °C/0.0003–0.01 s−1. The occurrence of dynamic recrystallization in these domains was confirmed from the microstructural observations. The estimated apparent activation energy in Domains 2 and 3 (219 and 245 kJ/mole) is higher than the value of self-diffusion in magnesium. This is due to the formation of intermetallic phases in the matrix that generates back stress. The strength of TXAZ3200 alloy improved up to 150 °C as compared to TX32 alloy, suggesting solid solution strengthening due to Al and Zn. Also, the hot deformation behavior of TXAZ3200 alloy was compared in the form of processing maps with TX32, TX32-0.4Al, TX32-0.4Zn, and TX32-1Al-1Zn alloys.
1. Introduction
Owing to their light weight and specific stiffness, Mg alloys are being developed for use as structural parts in the automobile and aerospace industries [1]. Their extensive applications are limited, however, mainly because of their low strength and corrosion resistance. In a quest to achieve better creep and corrosion resistance, new alloys based on the TX (Mg-Sn-Ca) system have been developed [2,3,4,5]. In this system, Sn imparted corrosion resistance by forming a solid solution with Mg, and additions up to 5 wt % improved mechanical properties such as ductility and tensile strength [6]. Ternary additions by Ca improved the creep strength at service temperatures due to the presence of the stable CaMgSn intermetallic phase in the matrix [2,3]. It was found that the ratio of Ca to Sn (or Sn to Ca) dictates the formation of different phases in the microstructure [2,4]. In this series, Mg-3Sn-2Ca (TX32) alloy was found to exhibit a fair balance between the creep resistance and the corrosion resistance [5,7]. An attempt was made to increase the strength of TX32 alloy by adding 0.4 wt % Al [8]. In a view to increase the strength further, 0.4 wt % Zn was also added to Mg-3Sn-2Ca-0.4Al (TX32-0.4Al) alloy.
Zinc exhibits high solid solubility in magnesium, which is about 6 wt % at 340 °C and results in solid solution strengthening [9,10,11,12] that increases the value of the critical resolved shear stress (CRSS) needed for the occurrence of basal slip. However, Zn addition lowers the CRSS required for prismatic slip and thereby promotes its activity, which in turn leads to plastic deformation. However, with the increase of alloying elements percentage, i.e., their concentration, many other problems such as casting defects, precipitates formation and their non-uniform distribution and morphology, micro-porosity, and chemical segregation may arise. To overcome these problems, the thermomechanical processing of the cast alloy at higher temperatures is required. So, it is essential to develop a technology to optimize the hot working of Mg-3Sn-2Ca-0.4Al-0.4Zn (TXAZ3200) alloy to ensure reliability via the formation of defect-free microstructures. The aim of this investigation is to evaluate the strength of TXAZ3200 alloy under compression as well as to generate a processing map to identify the best deformation conditions that can yield optimum hot workability. The strength of TXAZ3200 alloy was estimated to be in the range of 25 °C to 250 °C, which is in the general service temperature range of Mg alloys for automotive applications. The hot deformation characteristics were studied by developing its processing map and applying kinetic analysis.
The dynamic materials model formed the basis in developing processing maps for a number of materials, using the concepts and procedures that have been well established [13,14]. In this approach, two different maps, namely, a power dissipation efficiency (η) map and an instability (ξ) map, are first determined over a range of temperature and strain rate at a chosen deformation strain, and then superimposed to generate a processing map. The portion of applied power used to cause microstructure changes in the workpiece determines its dissipation efficiency, and can be evaluated using the equation:
where m is the strain rate sensitivity of the material. The dissipation efficiency map is generally presented as an efficiency contour map, with various “domains” identified around peak efficiencies. The valleys separating the domains represent the shift from one domain to another, while each domain represents a dominant metallurgical mechanism. These mechanisms can be identified on the basis of domain characteristics.
η = 2m/(m + 1)
A workpiece may also experience non-uniform deformation under some specific processing conditions that would lead to the occurrence of flow instability regimes. Such conditions develop adiabatic shear bands (high intense) or flow localization (low intense) in the deforming material. The theory of mechanics of large plastic flow [15] can be applied to determine the conditions that would lead to the occurrence of undesirable regimes, using an instability parameter :
Flow instability happens under the deformation conditions where the value of ξ( is negative. Based on the processing map, the temperature and strain rate conditions that promote mechanisms such as dynamic recrystallization (DRX) can be identified. By deforming the material under only such conditions, the workability of any material may be optimized. The map also helps to avoid the conditions of flow instability.
2. Experimental Section
Cast Mg-3Sn-2Ca-0.4Al-0.4Zn (TXAZ3200) alloy was obtained by employing the conventional permanent mold casting technique in which pure elemental metals were used. The molten alloy was maintained at a temperature of 720 °C under a protective cover of Sulfur hexafluoride (SF6) and Argon gas mixture. The melt was poured into permanent molds that were preheated. To perform the compression testing, specimens in a cylindrical shape with dimensions of 10 mm in diameter and 15 mm in height were extracted from the as-cast billet. A hole with a diameter of 1 mm was drilled to a depth of about 5 mm (i.e., to the center of the specimen) at the mid-height point of the specimen. By inserting a thermocouple (chromel-alumel Pro-K type, RS Components Ltd., Corby, UK) into the hole, the instantaneous rise of temperature within the specimen during deformation was recorded. The details on the procedure for performing compression testing were described earlier [16]. To evaluate high temperature compressive strength, the specimens were compressed at a nominal strain rate of 0.0001 s−1 in the temperature range between 25 °C to 250 °C until the specimens were fractured/fragmented. To generate processing maps of TXAZ3200 alloy, uniaxial compression tests were performed on the cylindrical specimens in the range of strain rates between 0.0003 s−1 and 10 s−1 and in the temperature range of 300–500 °C (5 × 6 experimental matrix). An exponential decay function in the servo-hydraulic machine (M1000/RK; Darted Ltd., Bournemouth, UK) was used to control the actuator speed to achieve the required constant true strain rates during the entire compression test period. A graphite powder and grease mixture was used in all of the compression experiments for lubrication purposes. The tests were performed up to a true strain of about 1, or until specimens had undergone fracture, followed by quenching the deformed specimens immediately in water. Standard mathematical expressions governing uniaxial compression were employed to convert the recorded data of load-stroke into values of true stress and true strain. Due to the adiabatic rise of temperature within the specimen undergoing the compressive deformation, the values of flow stress were corrected to obtain the proportional value under the actual test temperature. This correction was achieved by fitting the smooth curves of flow stress data at all the relevant strain rates as a function of temperature for uniform intervals of strain. The processing maps were generated by using those corrected flow stress values as a function of temperature at various strain rates and for the chosen strain values. The steps involved, and the general procedure were described earlier [13,14].
Siemens D-5000 diffractometer facility at City University of Hong Kong was used to perform the X-ray diffraction (XRD, Siemens D-5000 Diffractometer, Siemens Analytical X-Ray Instruments, Inc. Madison, WI, USA) and to identify the phases present in TXAZ3200 alloy. The initial alloy sample was polished to make its surface flat and then characterized by XRD under Cu Kα radiation (λ = 1.5406 Å). The sample was then examined with a scanning step size of 0.05° in the 2θ range between 20° and 80°. A scanning electron microscope (SEM—JEOL JSM-5600, SEM—JEOL Ltd., Akishima, Tokyo, Japan) was used to record the microstructure of the initial cast alloy as well as to perform energy-dispersive spectroscopy analysis (EDS—OXFORD/Aztec) to determine the chemical composition and to produce individual elemental distribution maps to locate the presence of elements within the matrix and as second-phase particles. These results were supplemented to confirm the main constituent phases of the alloy that were obtained in the XRD analysis. Differential scanning calorimetry (DSC, TA Instruments, New Castle, DE, USA) was performed to detect the phase transformations, if any, in the 0.4 wt % Zn-containing TXAZ3200 alloy.
The post-compressed specimens were cut along the compression axis at the center of the specimen. After mounting, the cut surfaces were polished to produce mirror-like scratch-free surfaces for optical metallography. To obtain microstructures, etching was performed with an etchant that contained 3 g picric acid, 20 mL acetic acid, 50 mL ethanol, and 20 mL distilled water. The etched specimens were examined using optical metallurgical microscope (OMM—Olympus/PMG3, Olympus Corporation, Tokyo, Japan) for their microstructural features.
3. Results and Discussion
3.1. Initial Microstructure
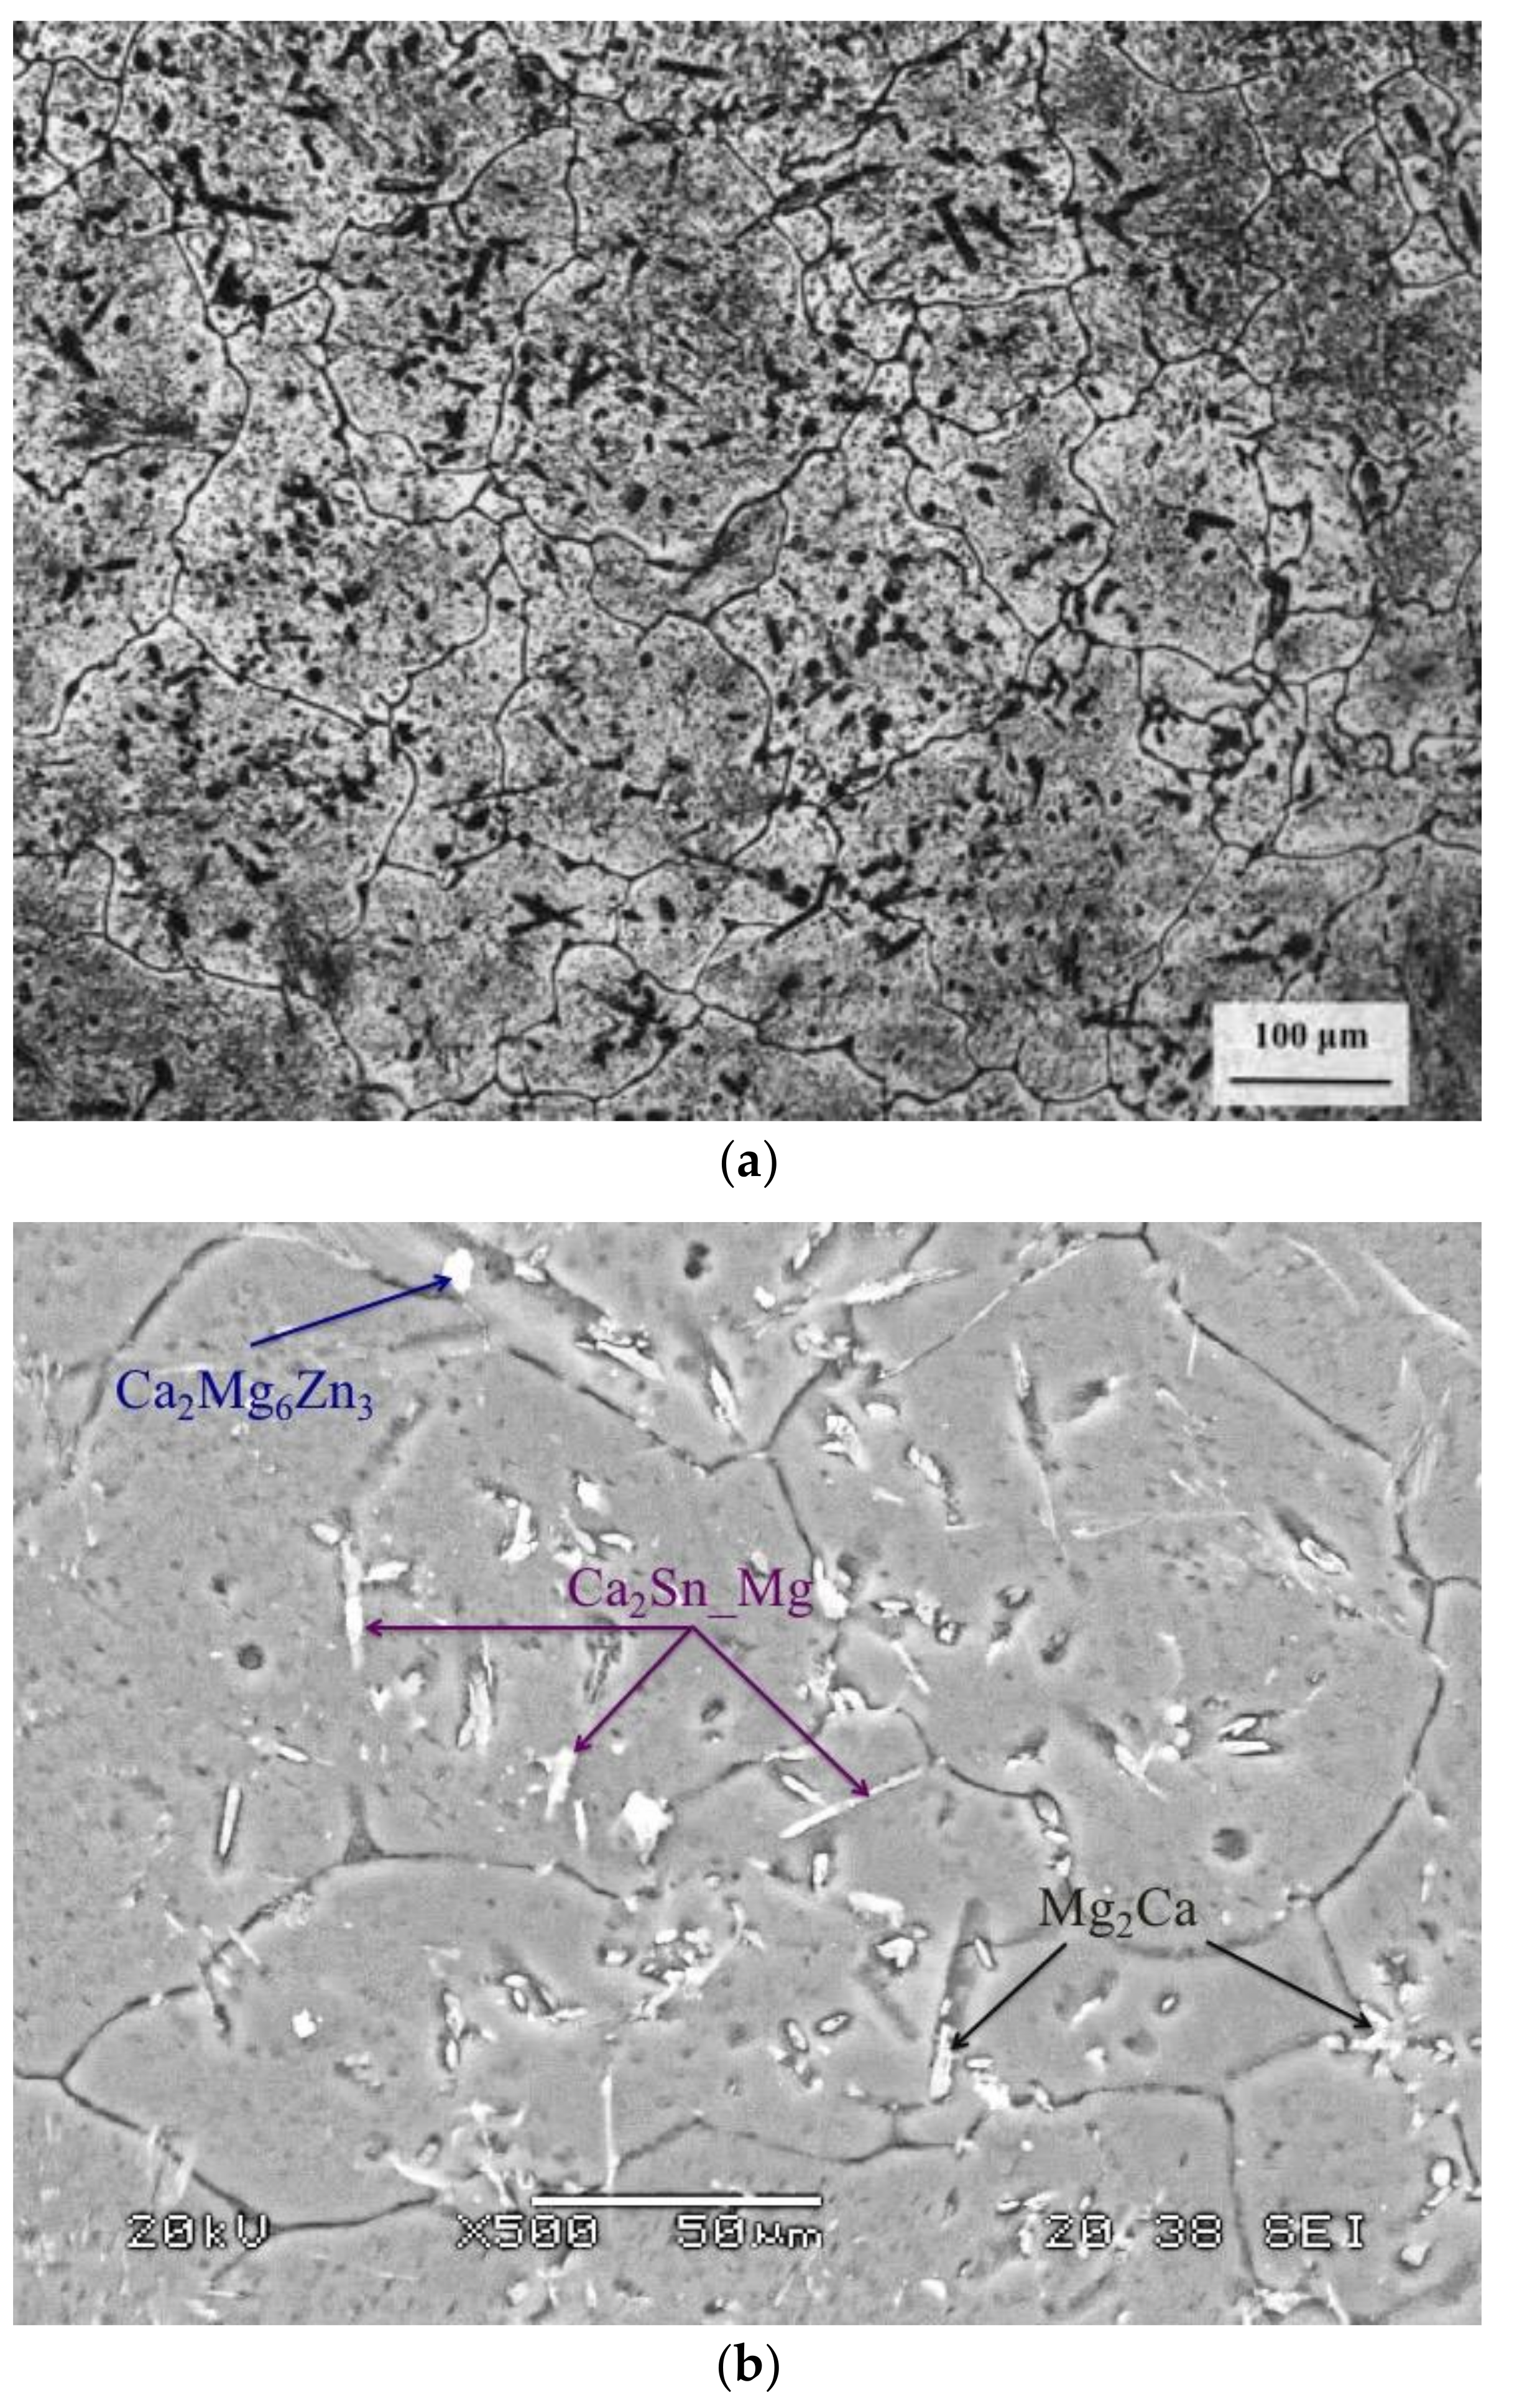
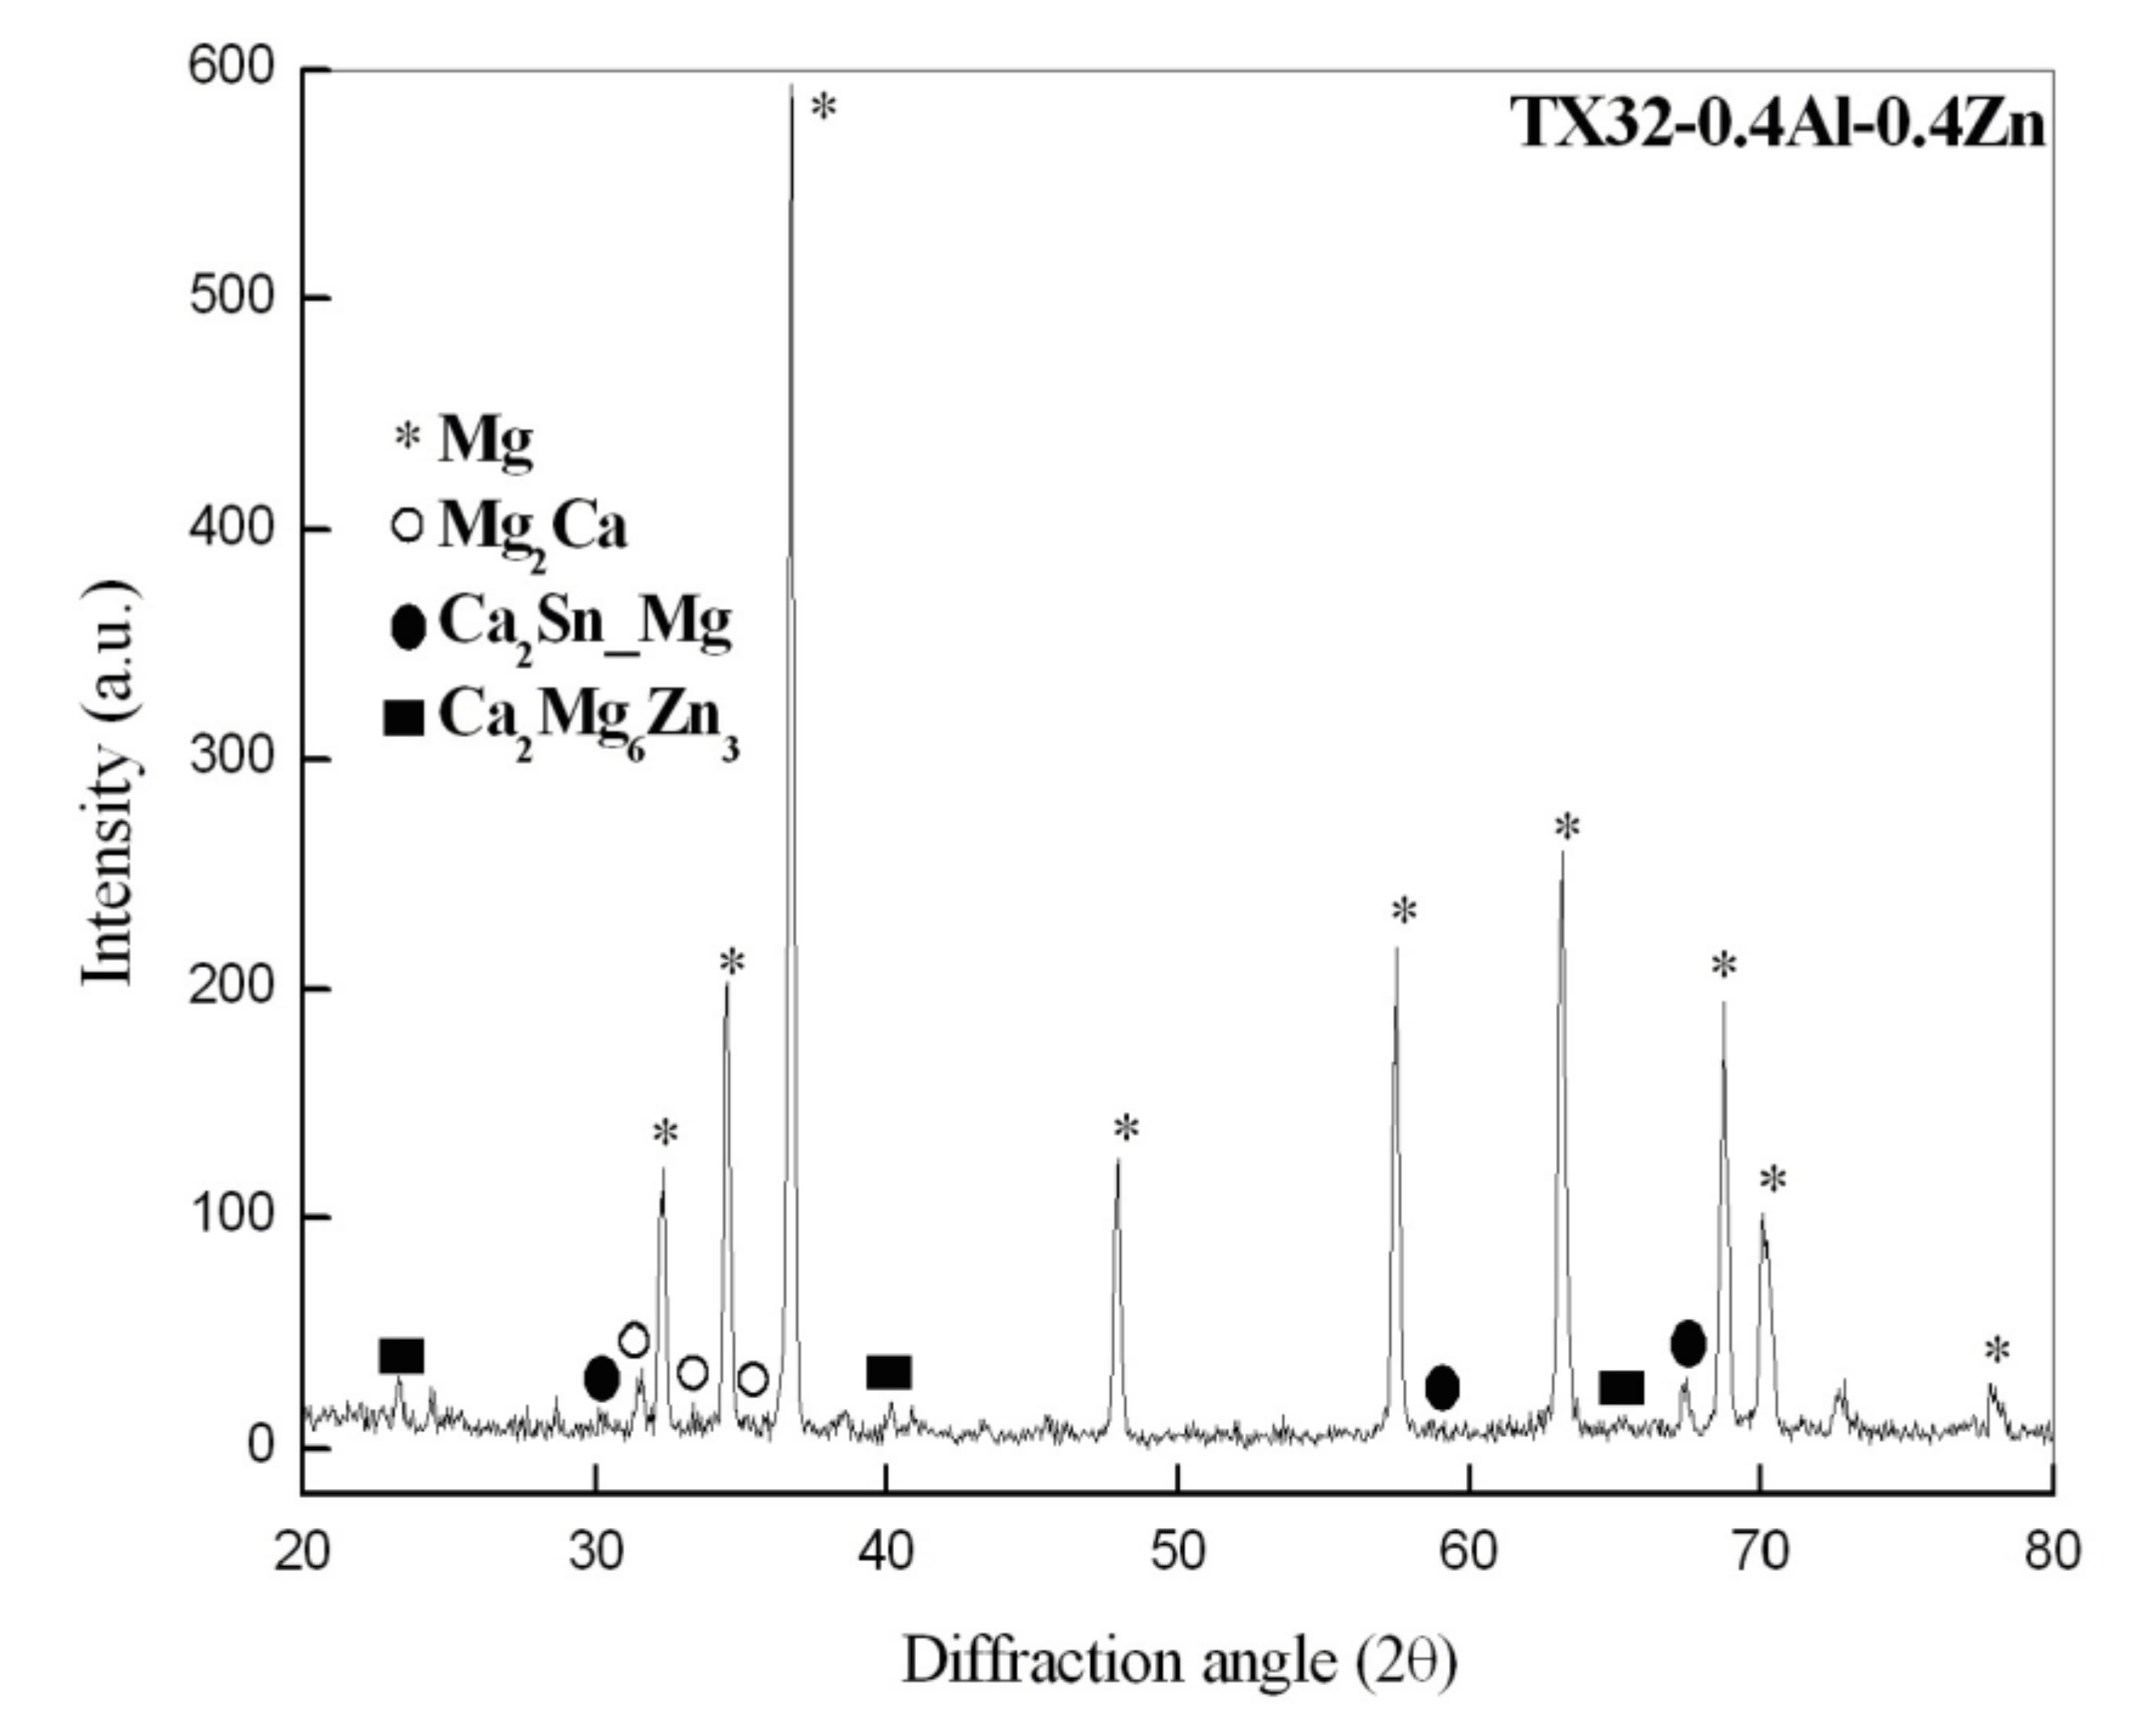
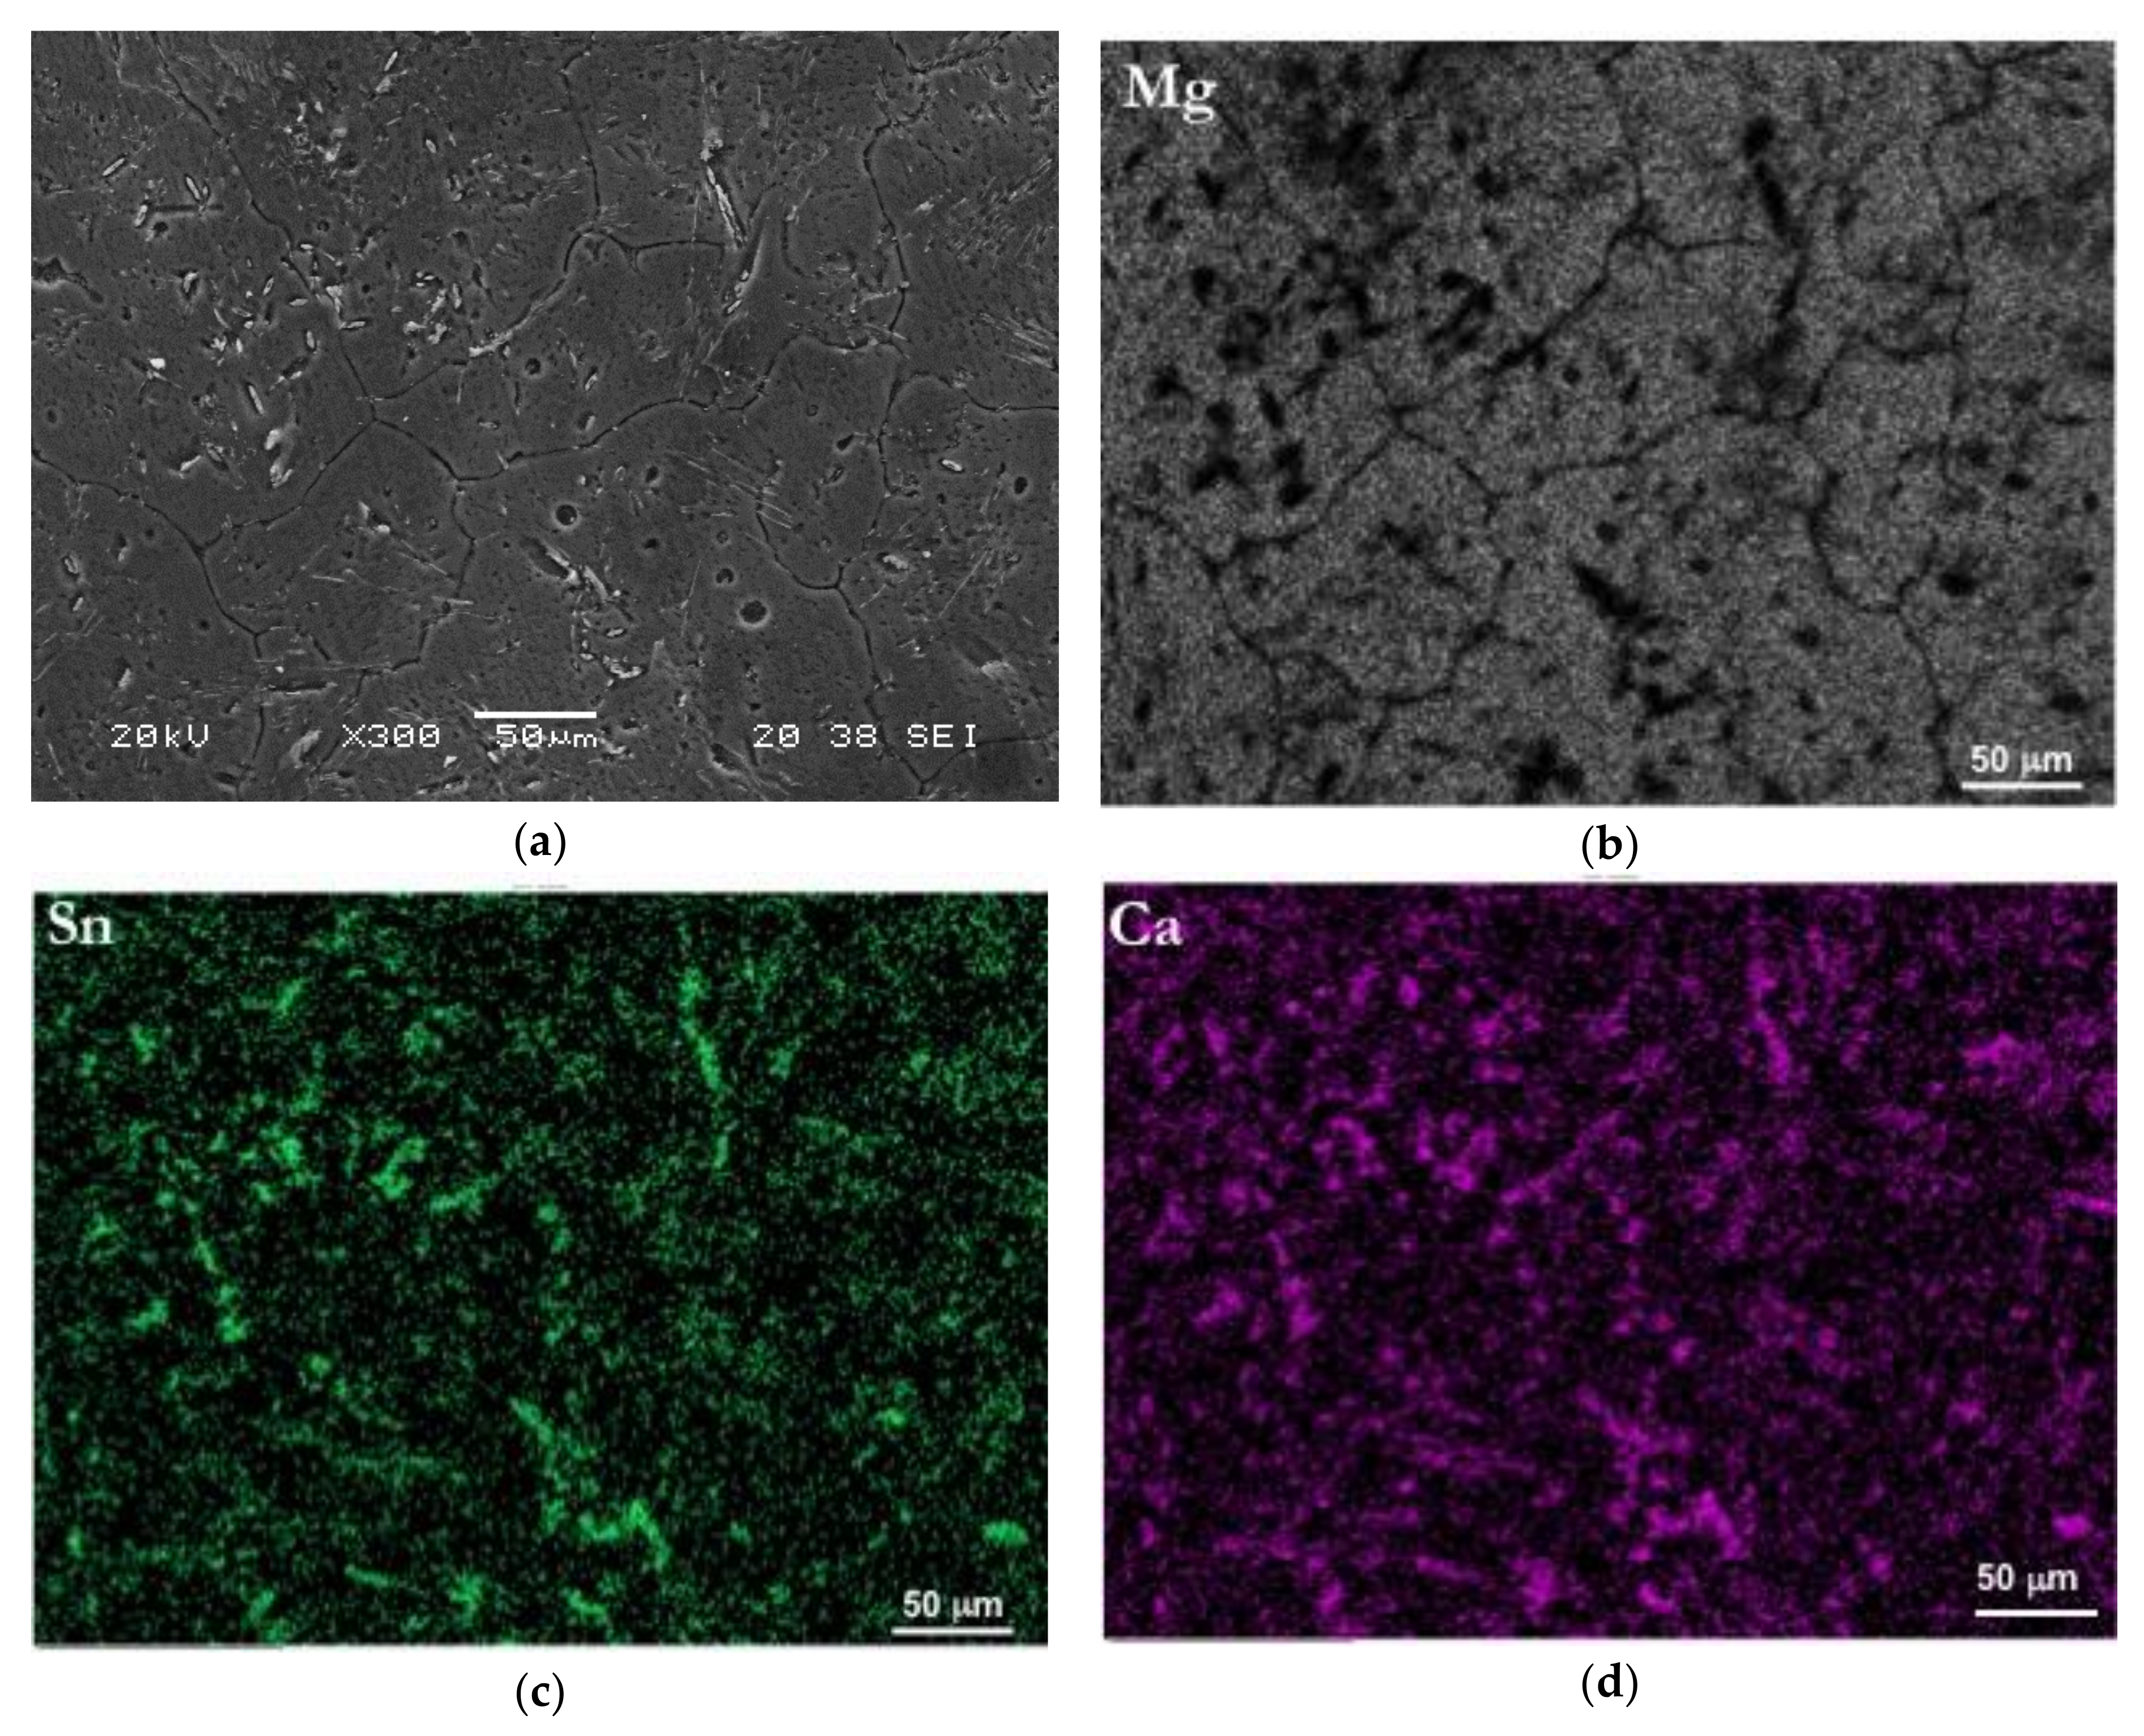
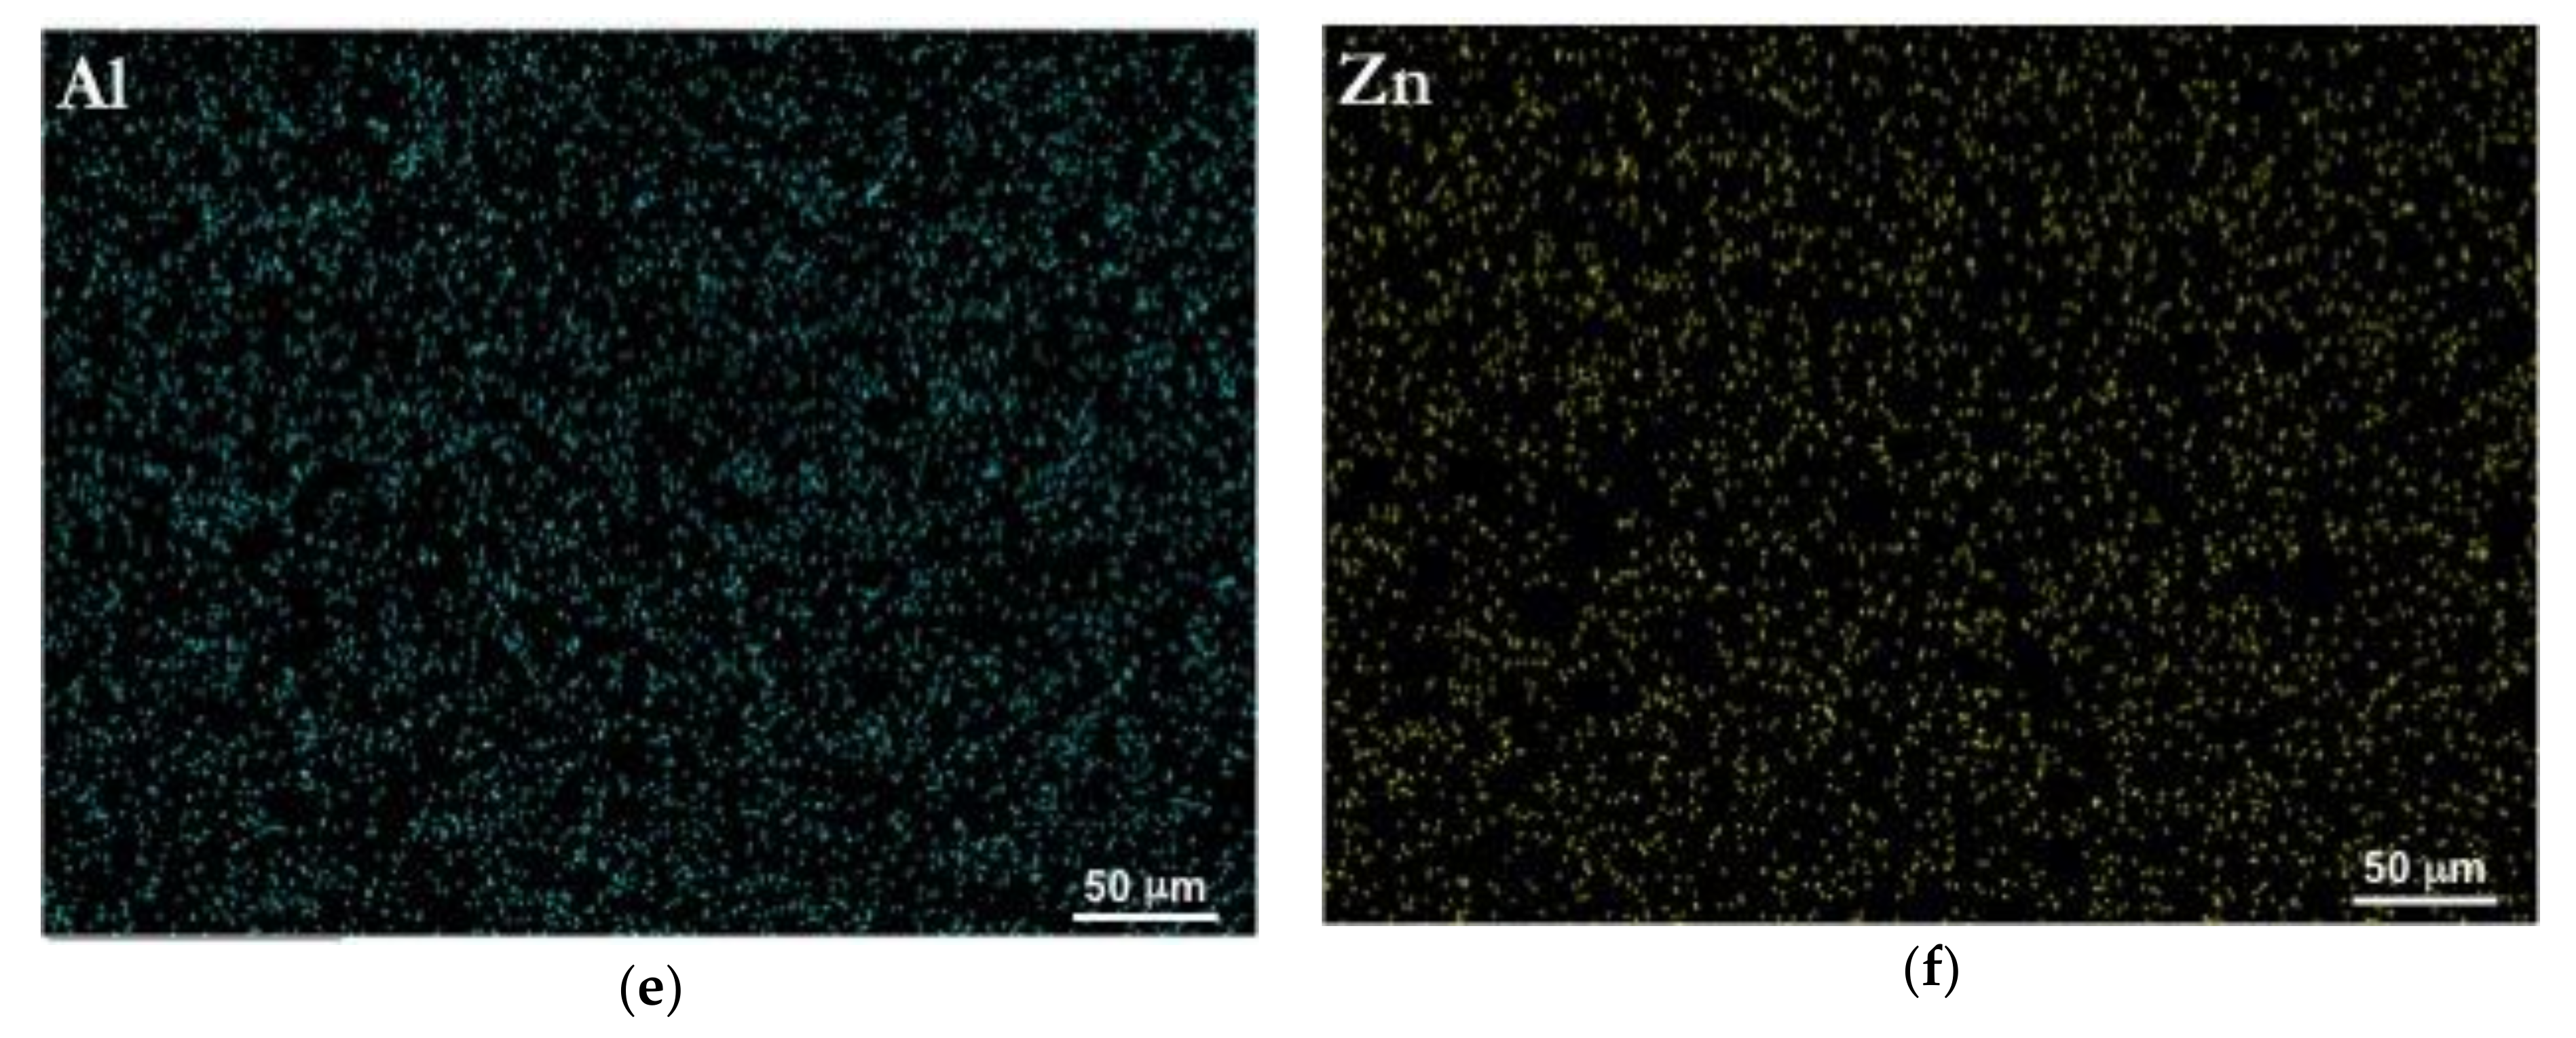
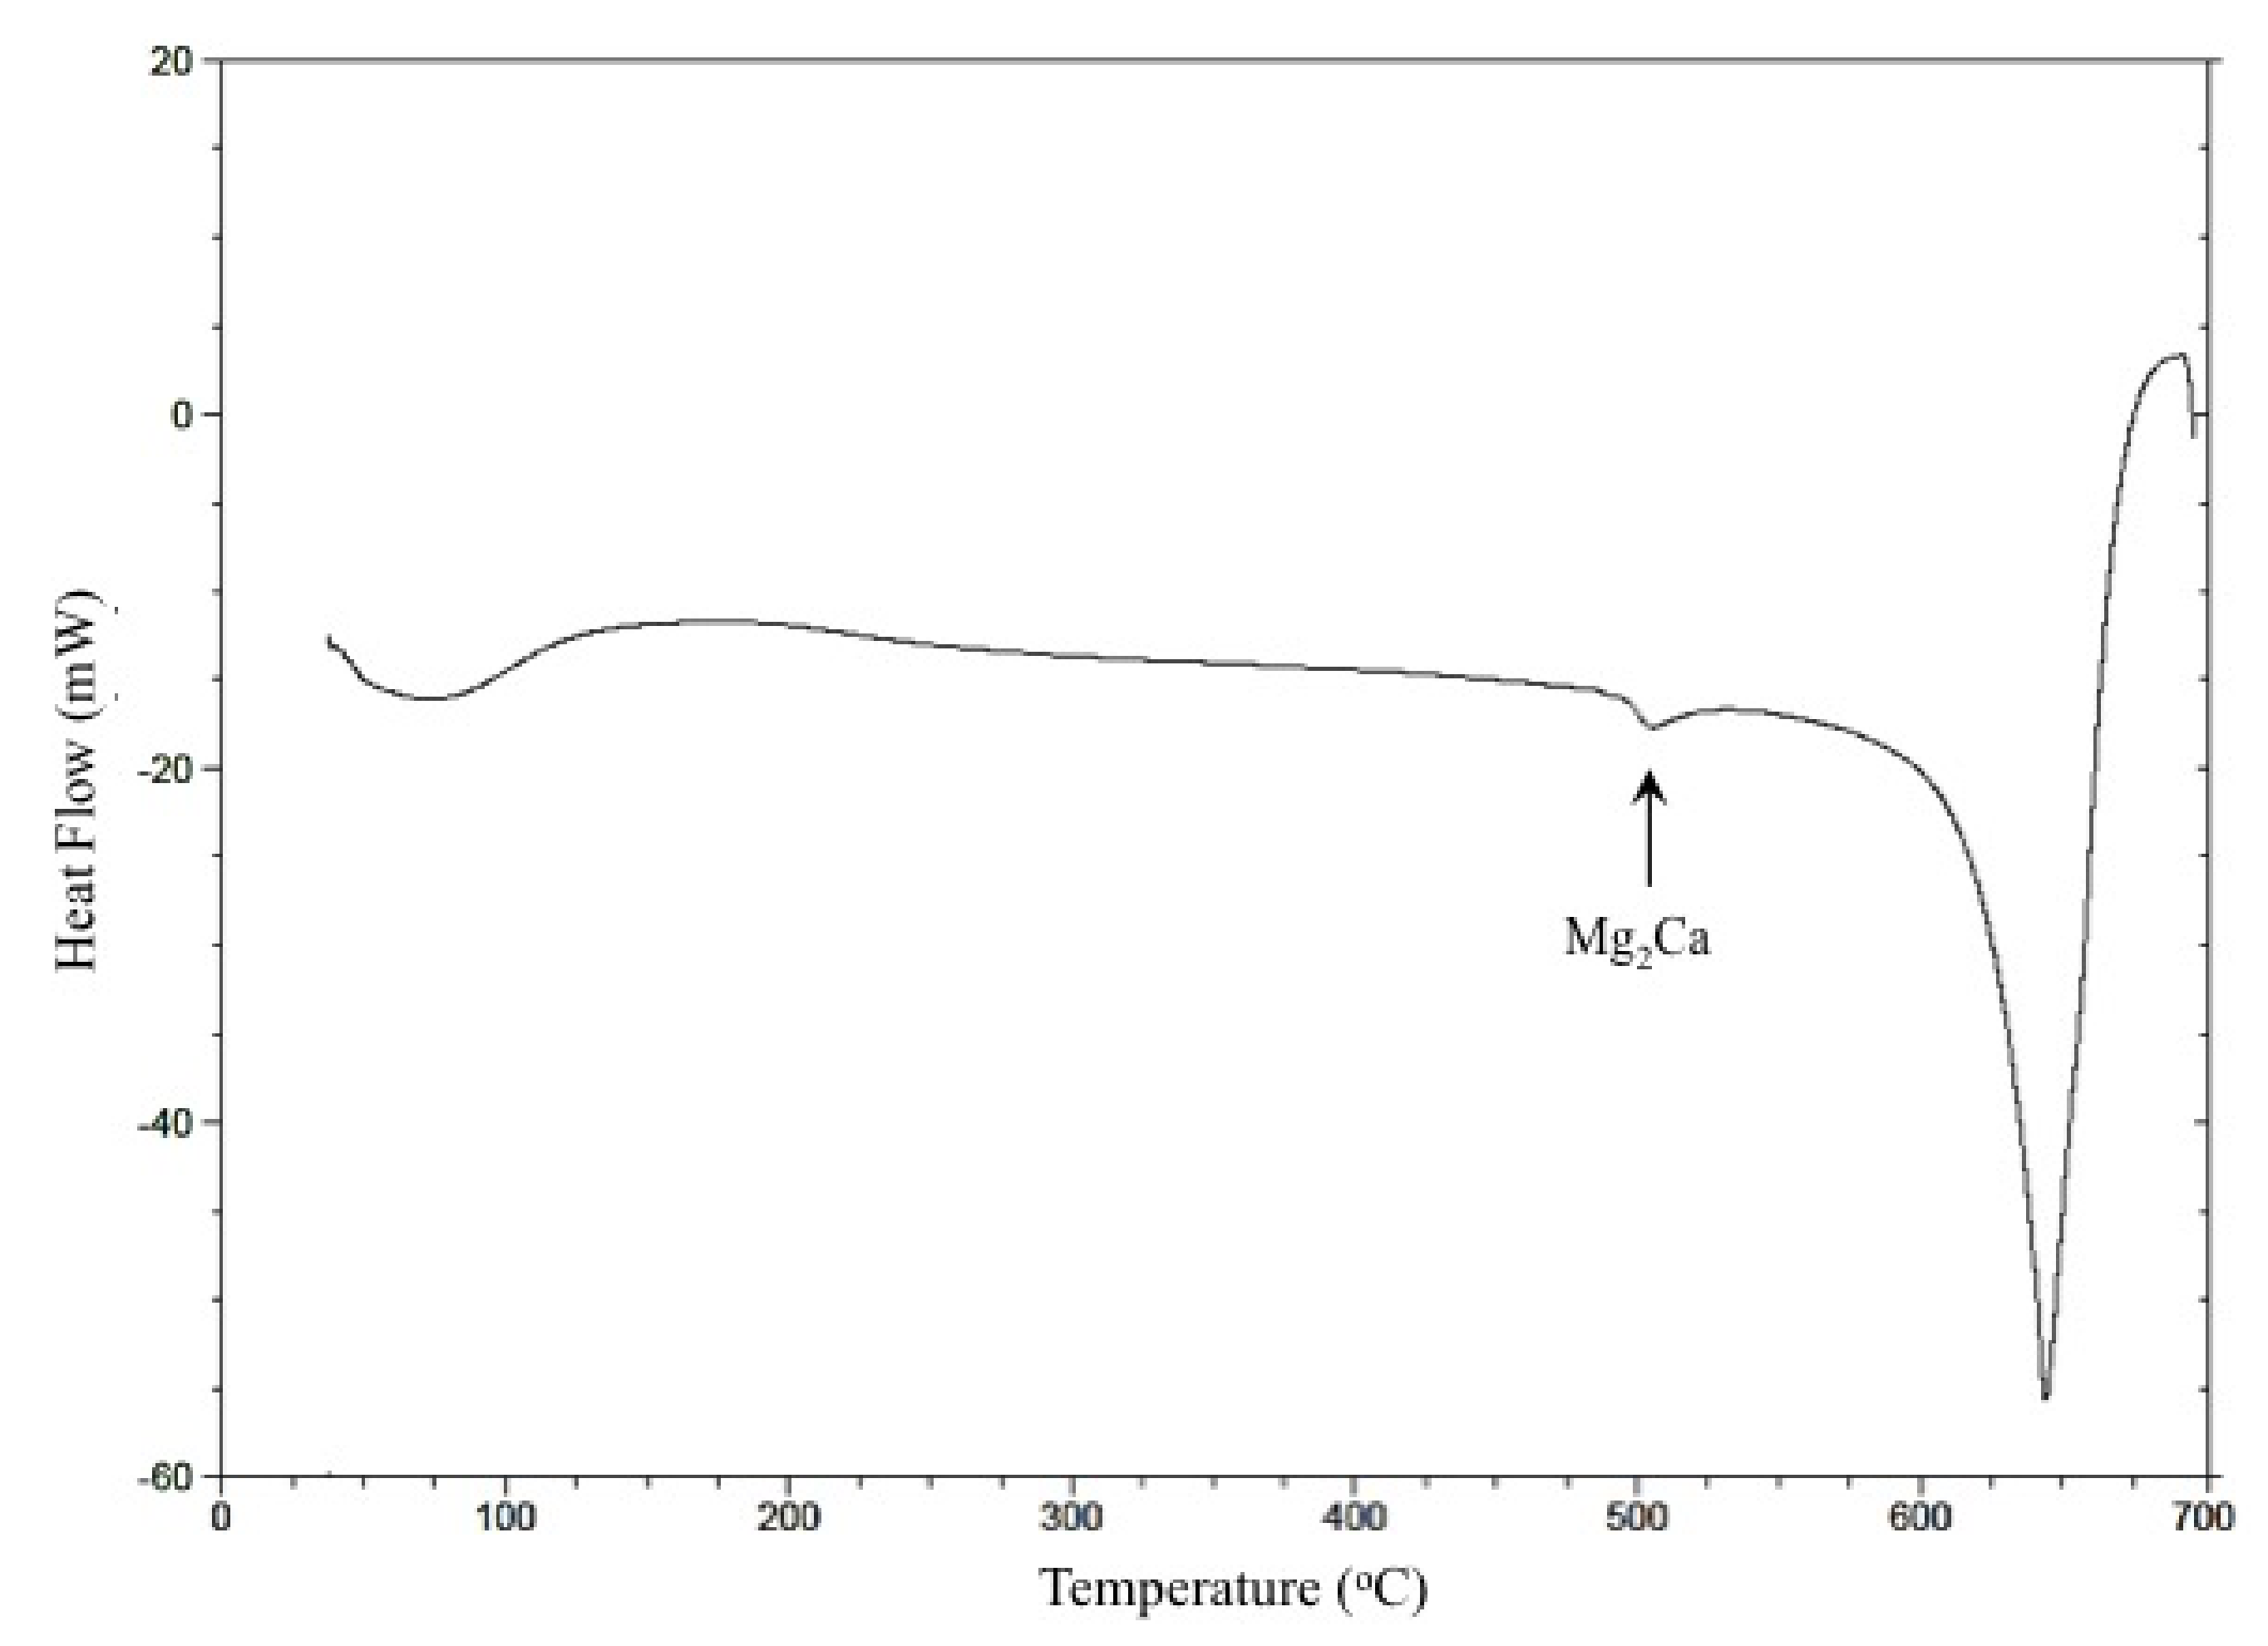
The chemical composition of the as-cast TX32-0.4Al-0.4Zn (TXAZ3200) alloy billet is shown in Table 1. The initial microstructure of the as-cast TXAZ3200 alloy is presented in Figure 1a,b, which are the optical and SEM (scanning electron microscope) micrographs, respectively. The average grain diameter of the cast alloy is 100 µm. This is considerably finer than the grain size that was typically observed in other TX-based as-cast Mg alloys (200–500 µm) [17,18,19,20]. Figure 2 shows the XRD phase analysis plot, which reveals the phases present in the microstructure. The cast microstructure reveals three types of phases; the first is Mg2Ca, which would be present mainly on the grain boundaries [19], and the second consists of needle-like Ca2Sn_Mg particles. The XRD spectrum indicates the presence of the Ca2Mg6Zn3 phase (spherical particles), the volume fraction of which is very low, as can be seen in Figure 1b. Figure 3 shows a typical SEM-EDS analysis (SEM image and elemental distribution maps for Mg, Sn, Ca, Al, and Zn, respectively) for TXAZ3200 alloy, based on which intermetallic particles in the microstructure are marked in the SEM image in Figure 1b. With the presence of Sn at most of the locations where Ca is present, it is difficult to differentiate the Ca-containing phase. These results are consistent with the results obtained for TX32-based alloys with small additions of Al or Zn [19,21]. EDS maps show that Al and Zn are mostly dissolved in the matrix. Figure 4 presents the DSC graph of TXAZ3200 alloy, which indicates that the intermetallic particles are thermally stable up to the melting point of the alloy. A kink is formed at 516 °C that coincides with the formation of eutectic or the softening of the Mg2Ca phase.
3.2. Ultimate Compressive Strength
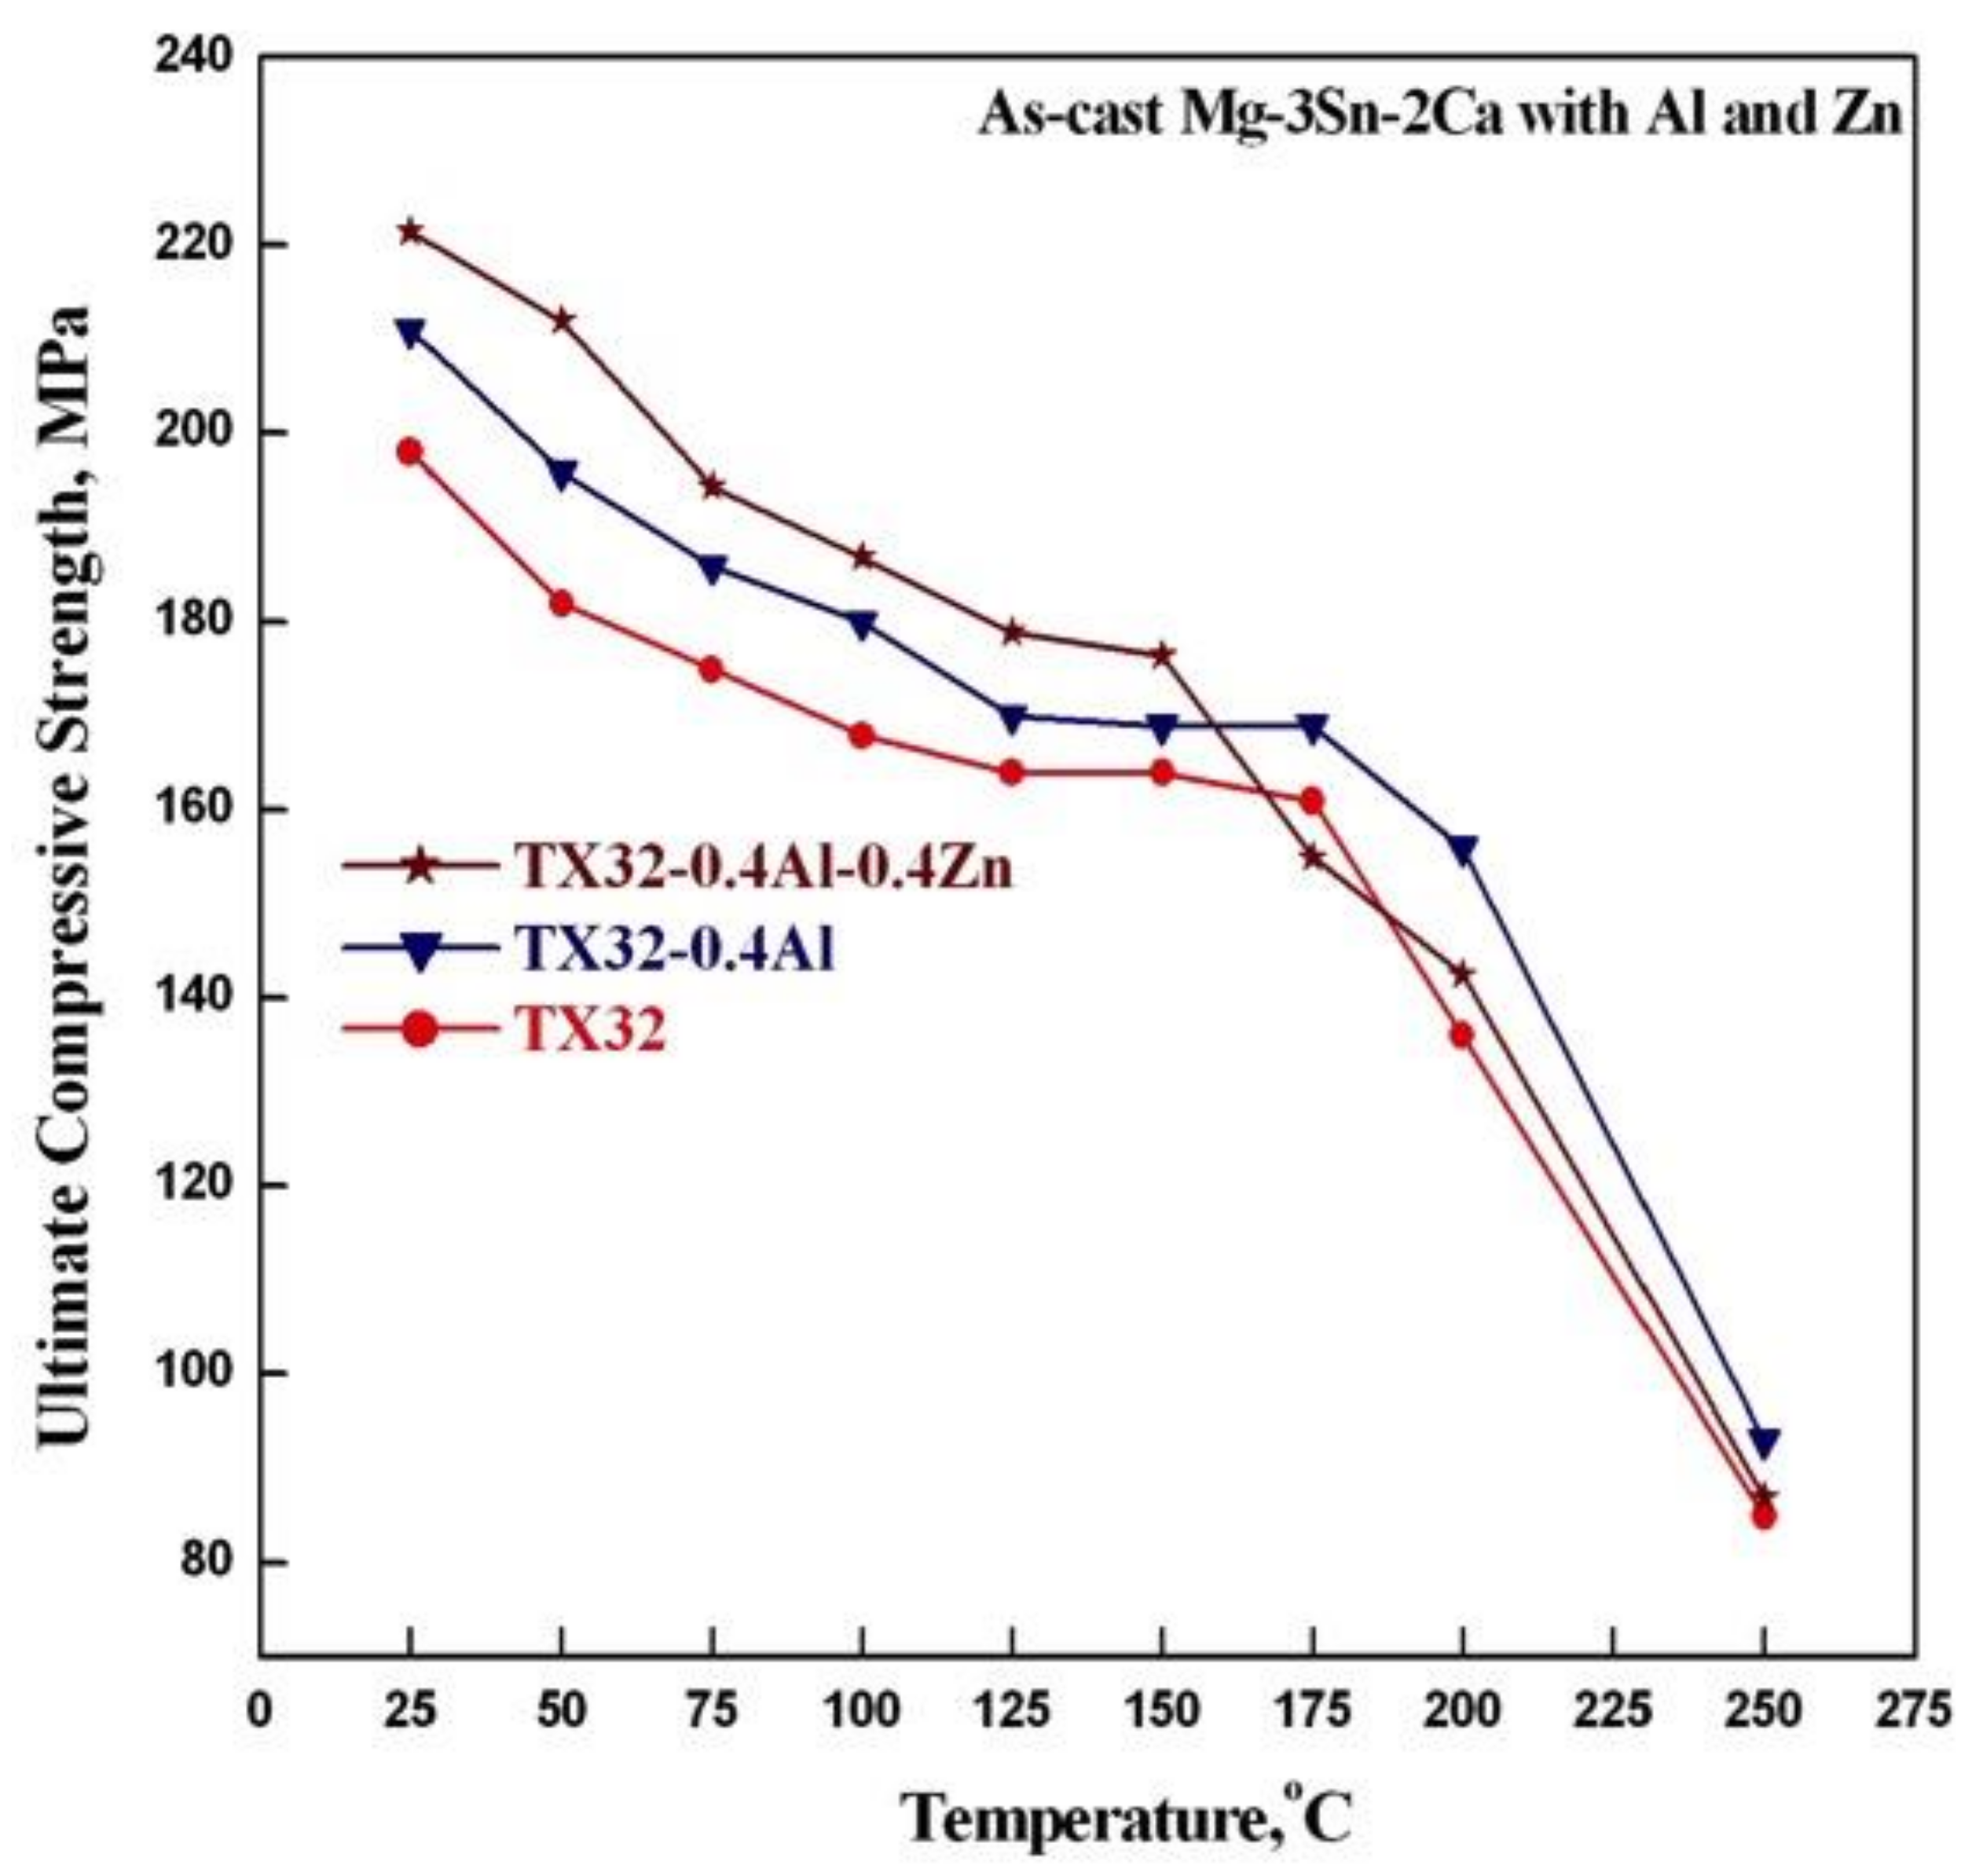
Figure 5 shows the effect of temperature between 25 °C to 250 °C on the ultimate compressive strength (UCS) of the cast TXAZ3200 alloy. The UCS values of base alloys such as TX32 and TX32-0.4Al (TXA320) are also shown for comparison. The grain size of TX32 and TXA320 alloys in the initial as-cast condition was about 700 µm [17] and 500 µm [18], respectively. In these three alloys, the compressive strength continuously decreased with the increase of temperature, probably due to the decrease of contribution from twinning. TX32 and TXA320 alloys exhibited a plateau between 125 and 175 °C, which is attributed to the grain boundary phase Mg2Ca and associated dislocation pinning that hinders the sliding contribution to the plastic flow. The strength exhibited by TXAZ3200 is higher than that of the base alloys up to 150 °C, indicating that Zn has a strengthening effect and leads to a refined grain size. Zn addition also increases the activity of basal and prismatic slip [9,10,11]; thus, the strength has a sharper decrease above 175 °C than that observed in the base TXA320 alloy.
3.3. Stress-Strain Behavior
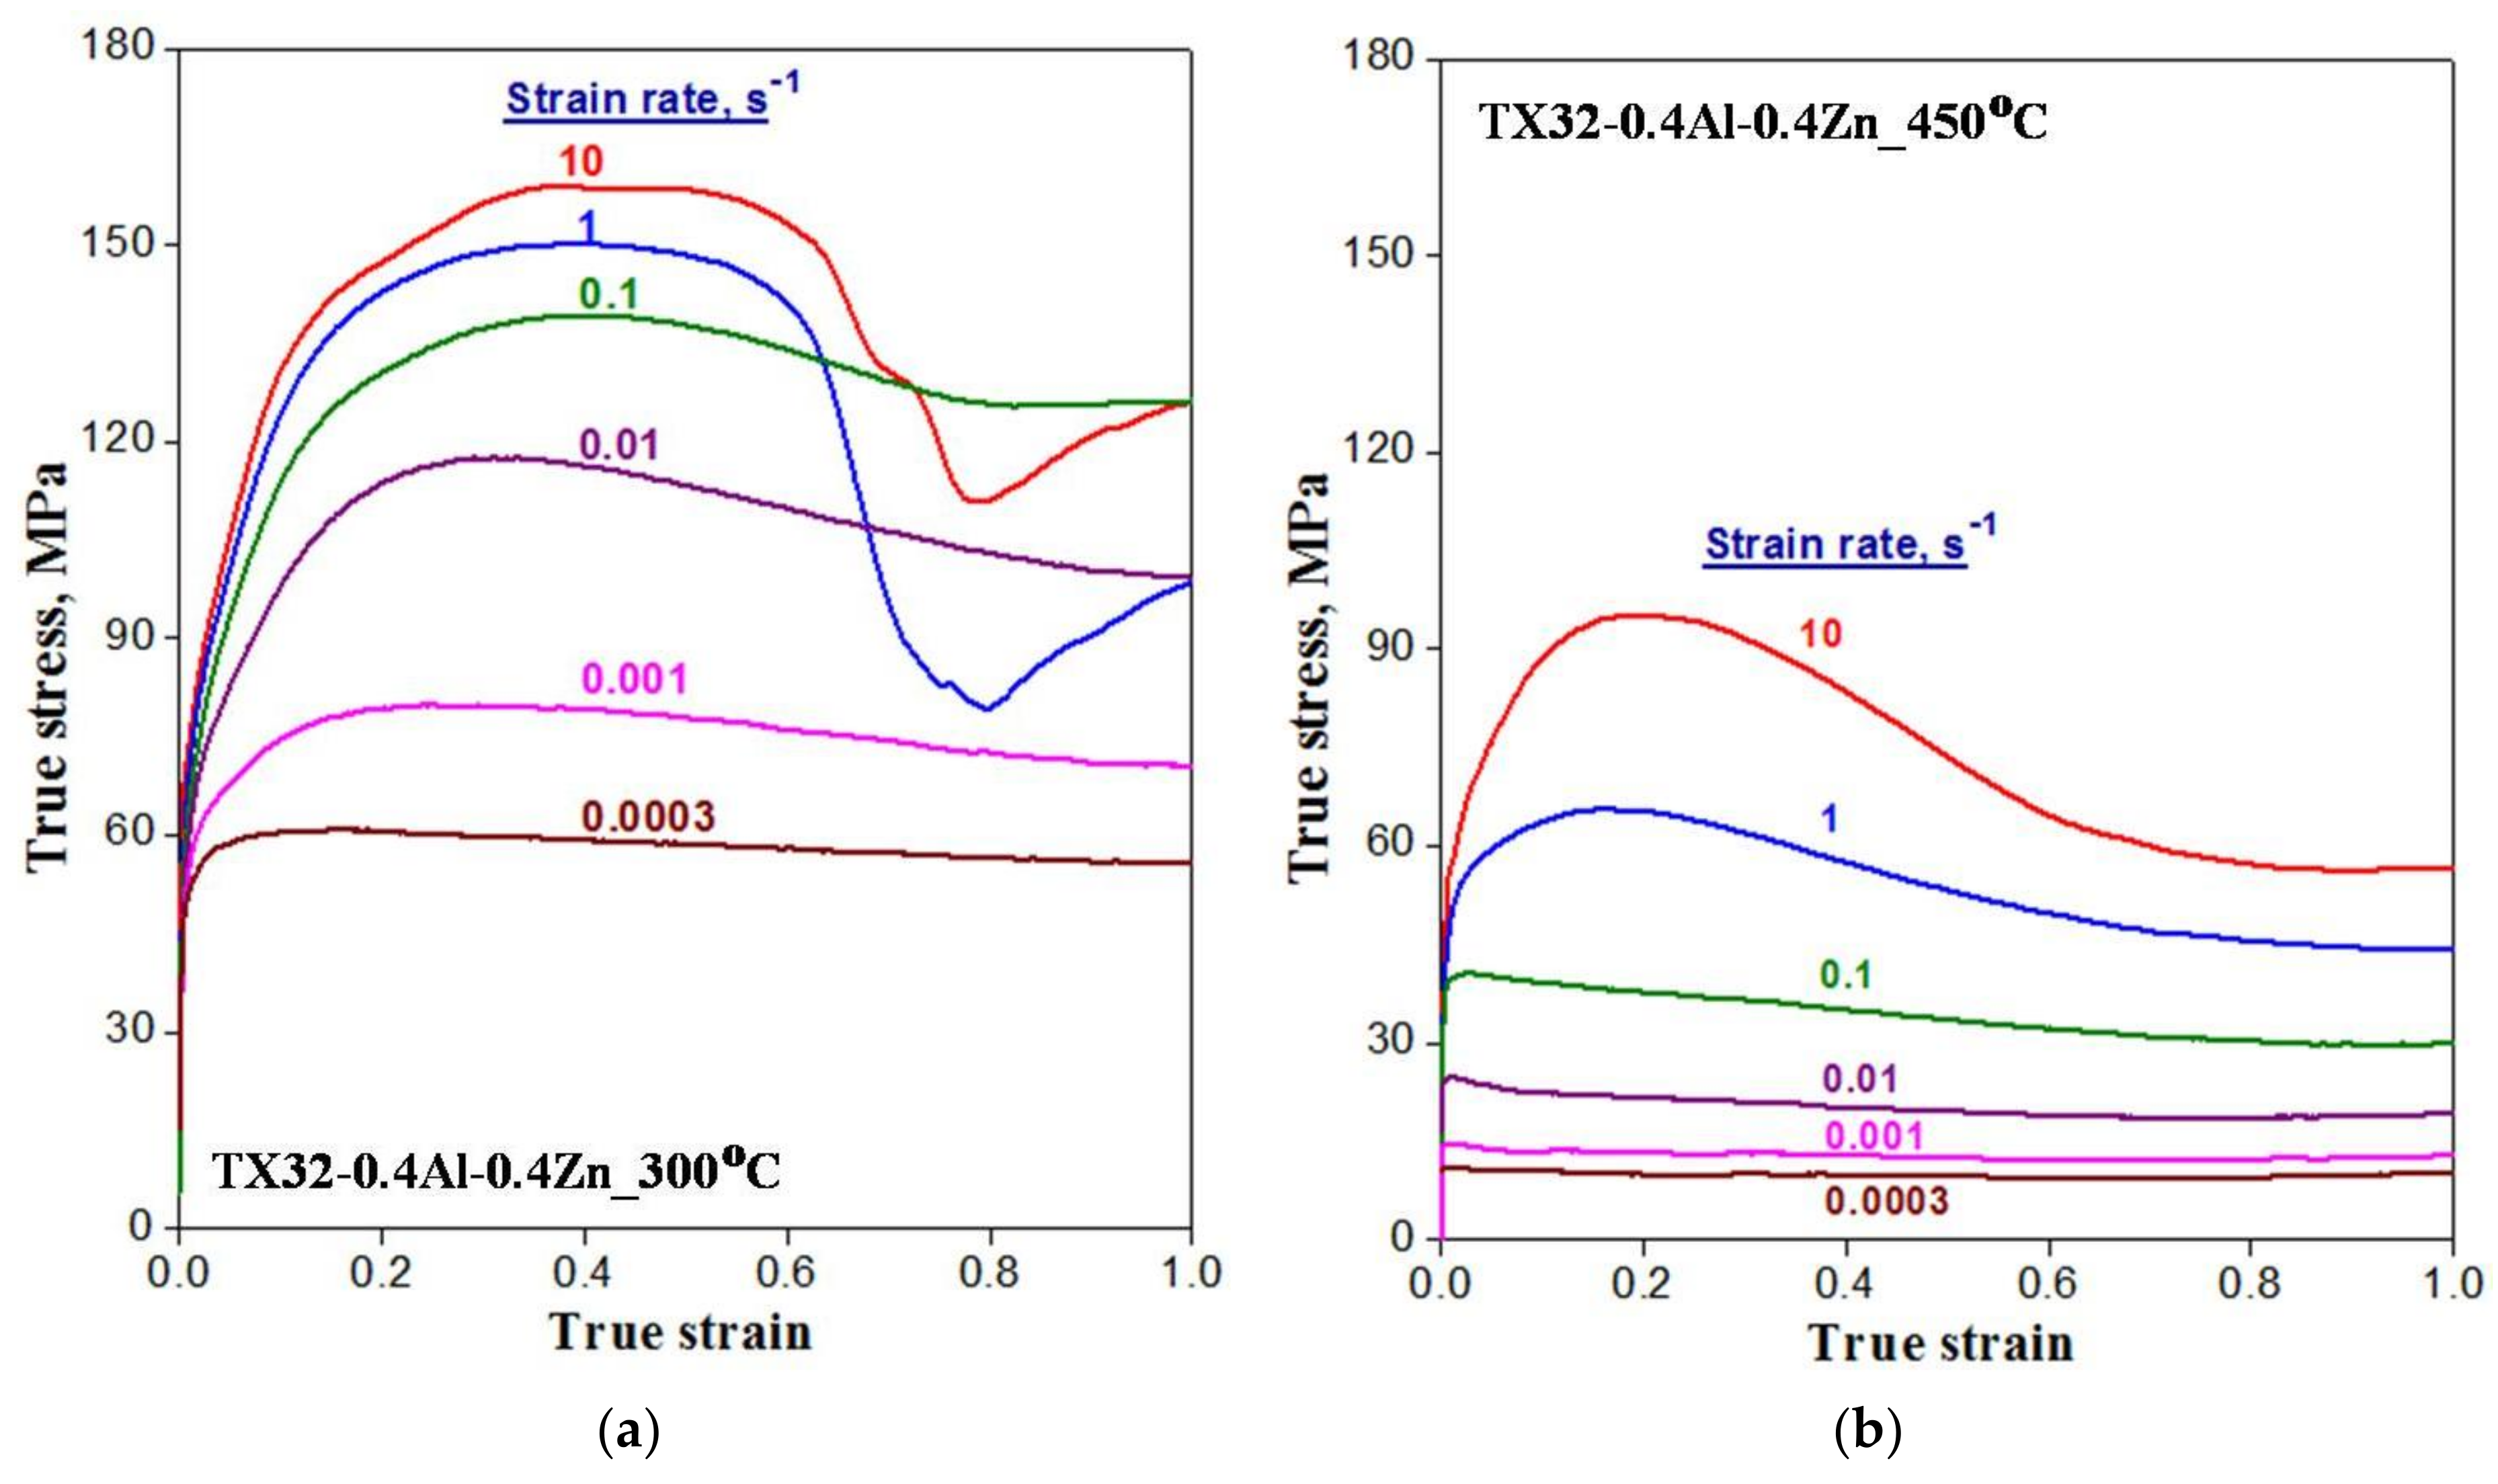
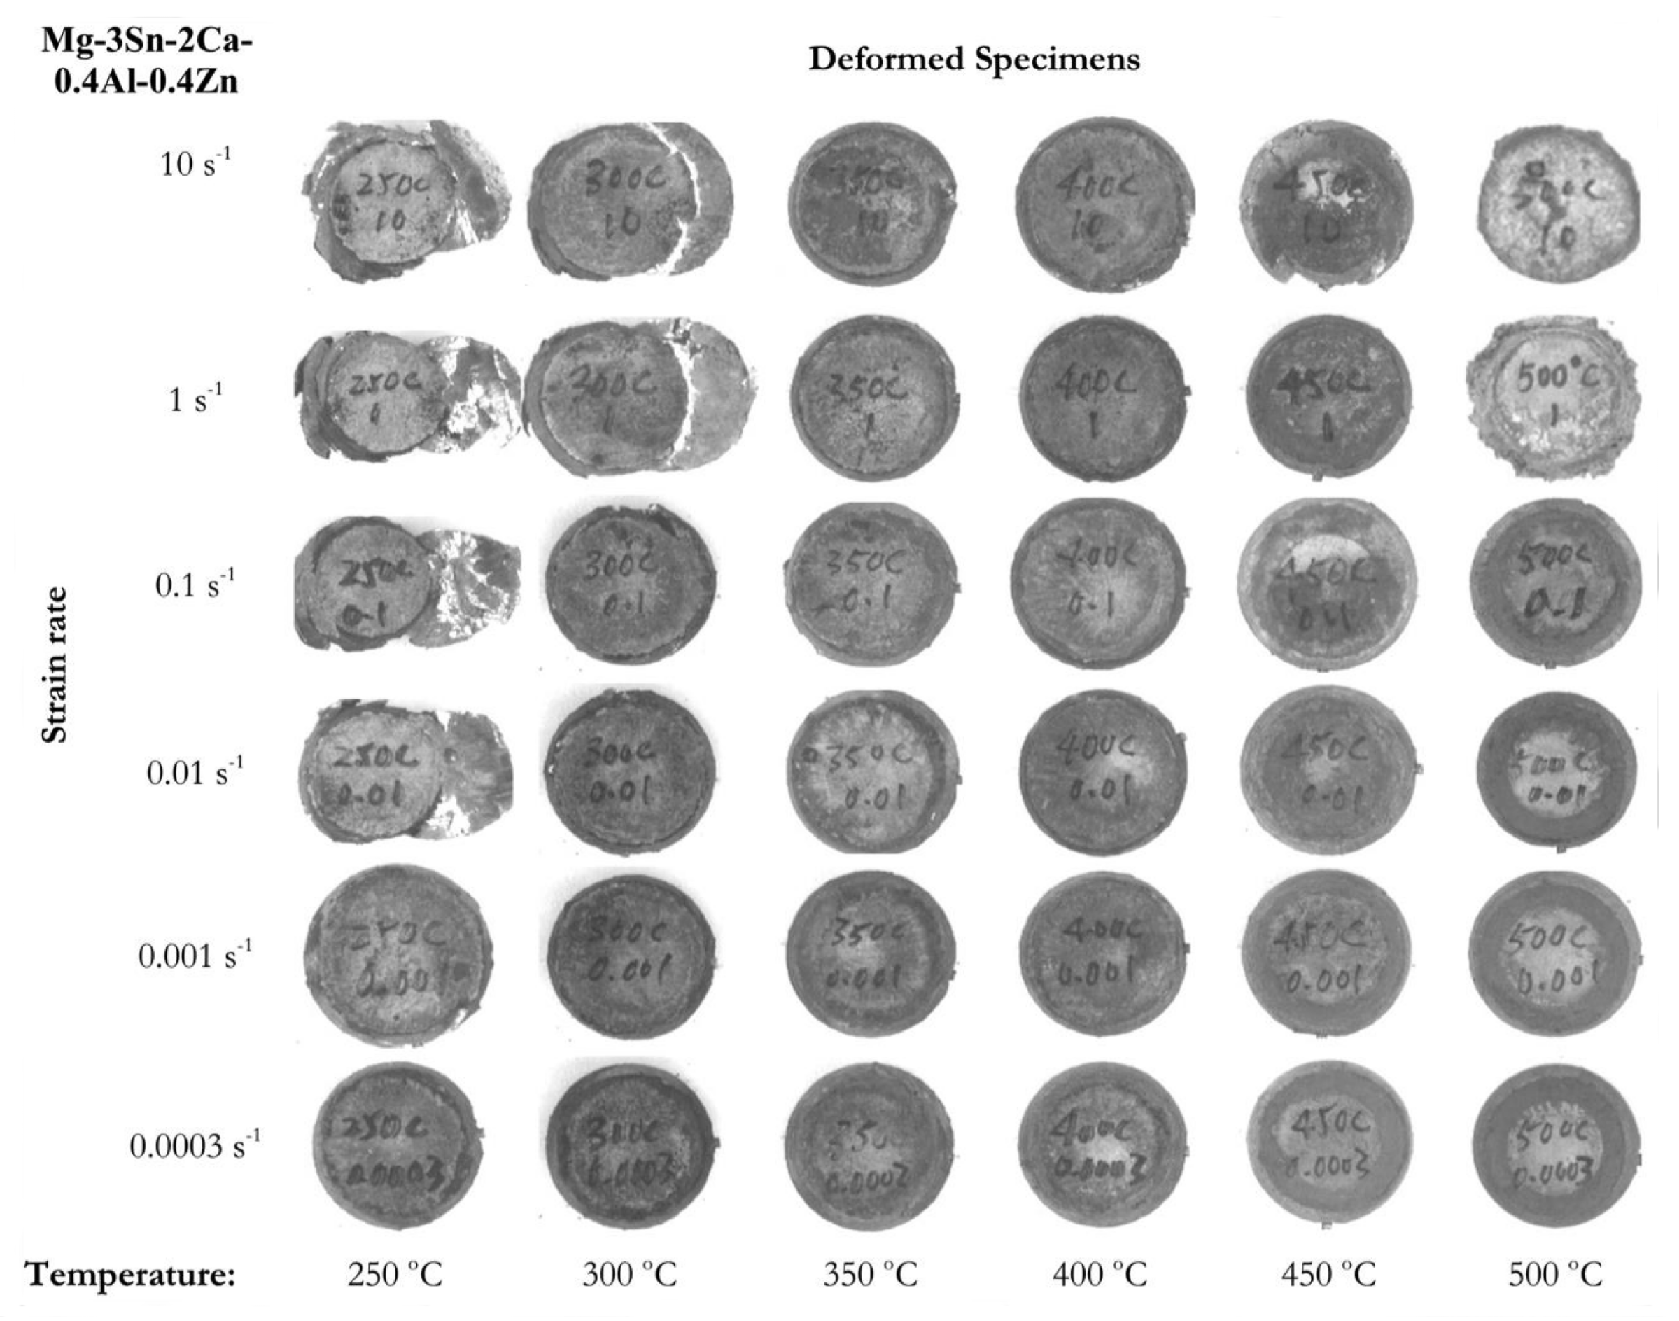
True stress–true strain plots at different strain rates corresponding to the compression test conditions of 300 and 450 °C are shown in Figure 6a,b, respectively. With reference to Figure 6a, the curves reveal flow-softening type behavior at values higher than 0.01 s−1, whereas nearly steady-state type flow behavior was observed at lower strain rates. At higher temperatures (e.g., 450 °C), as shown in Figure 6b, the flow softening during compression is highest at 10 s−1, and with the decrease in strain rate this trend decreased. At strain rates lower than 0.01 s−1, the stress-strain curves exhibited near steady-state flow. The shapes of the deformed specimens after compression are shown in Figure 7. The specimens deformed at lower temperatures (300 °C), and at strain rates above 0.01 s−1 they exhibited shear fractures. The corresponding flow curves revealed intense flow softening, which indicate the possibility of the occurrence of flow instability. At higher temperatures (500 °C) as well as higher strain rates, the specimens underwent fractures. The rest of the specimens exhibited homogeneous deformation and their cross-sections were nearly circular.
3.4. Processing Map and Microstructural Evolution
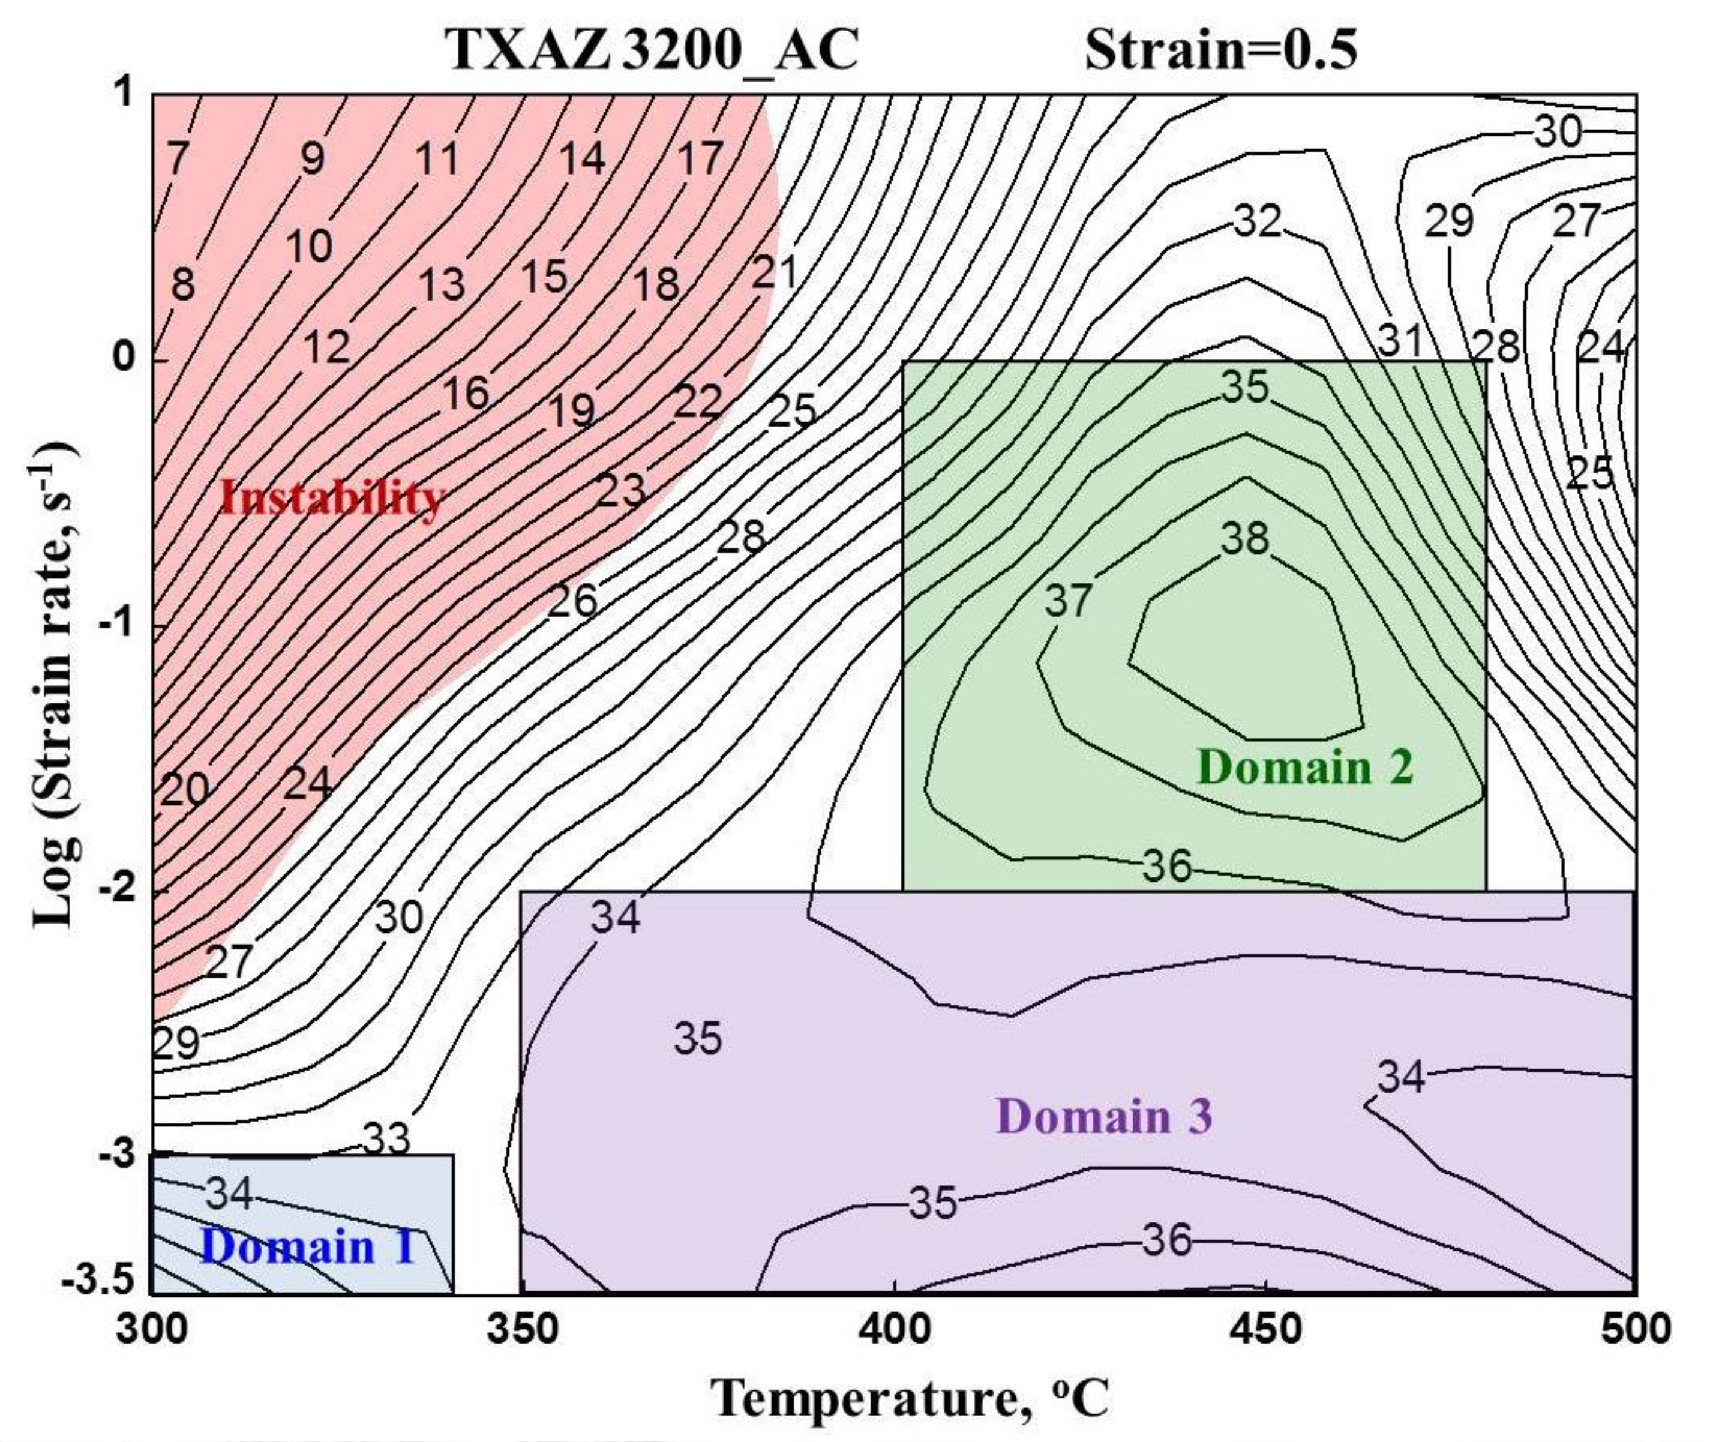
The processing map generated for TXAZ3200 alloy corresponding to a true strain of 0.5 is shown in Figure 8. The numbers marked on the contours indicate the values of efficiency of power dissipation in percentage. The reddish colored area in Figure 5 corresponds to the regime of flow instability. The processing map exhibits three domains of workability in the deformation conditions ranges of:
- (1)
- 300–340 °C and 0.0003–0.001 s−1; corresponding peak efficiency is 37% at 300 °C/0.0003 s−1 (Domain 1);
- (2)
- 400–480 °C and 0.01–1 s−1; corresponding peak efficiency is 38% at 450 °C/0.1 s−1 (Domain 2); and
- (3)
- 350–500 °C and 0.0003–0.01 s−1; corresponding peak efficiency is 37% at 450 °C/0.0003 s−1 (Domain 3).
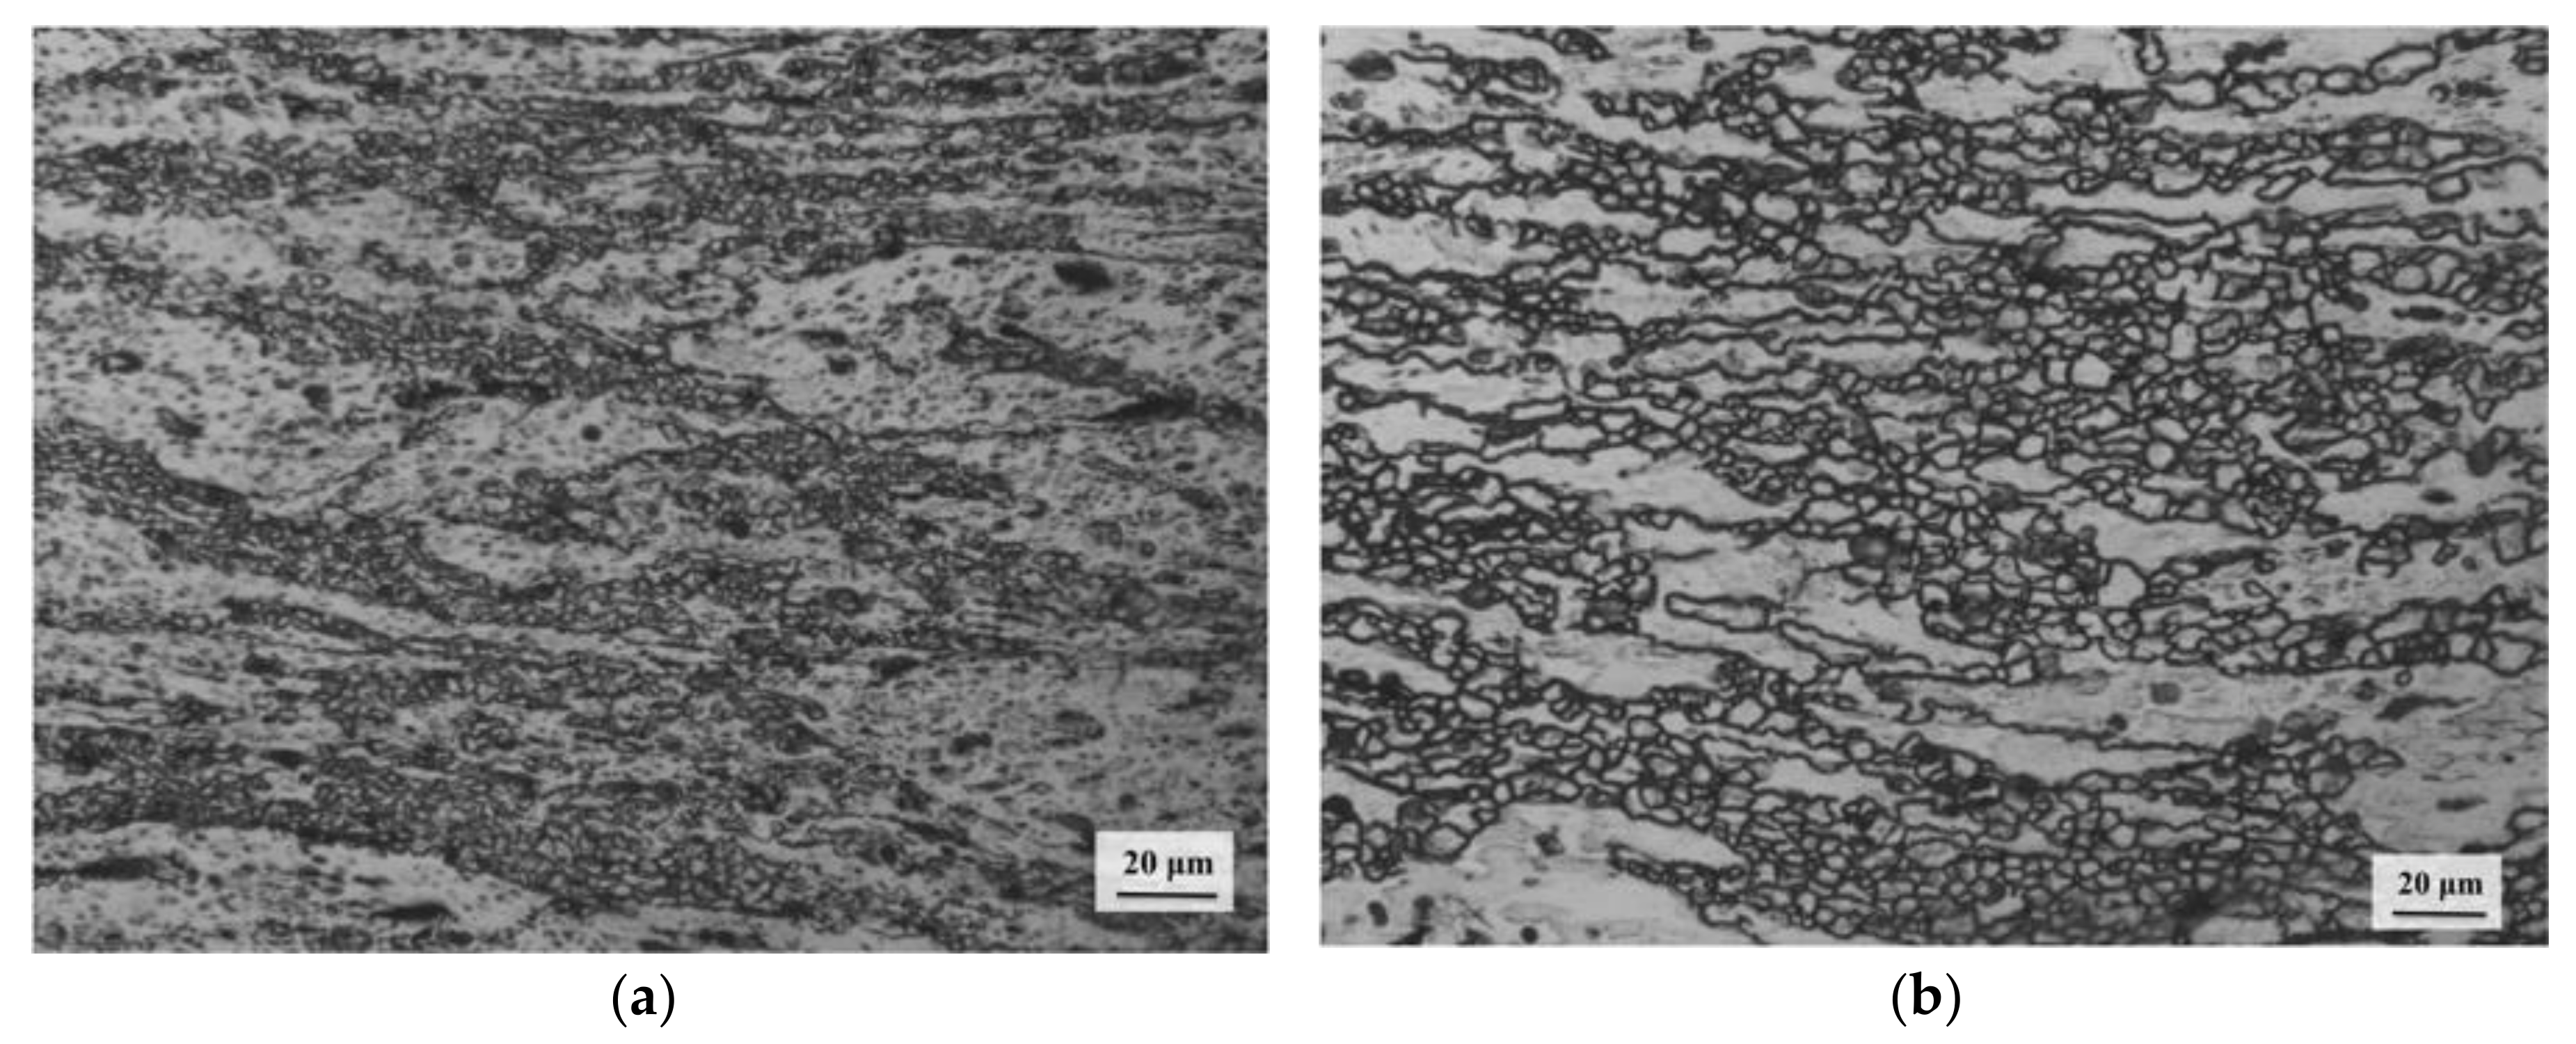
The optical microstructures observed on the deformed specimens compressed at 300 °C/0.0003 s−1 and 350 °C/0.0003 s−1 (conditions corresponding to Domain 1 and nearby) are presented in Figure 9a,b, respectively. These reveal the initiation of fine recrystallized necklace type grain structure in the matrix, suggesting that the dynamic recrystallization (DRX) mechanism occurs in this window (Domain 1).
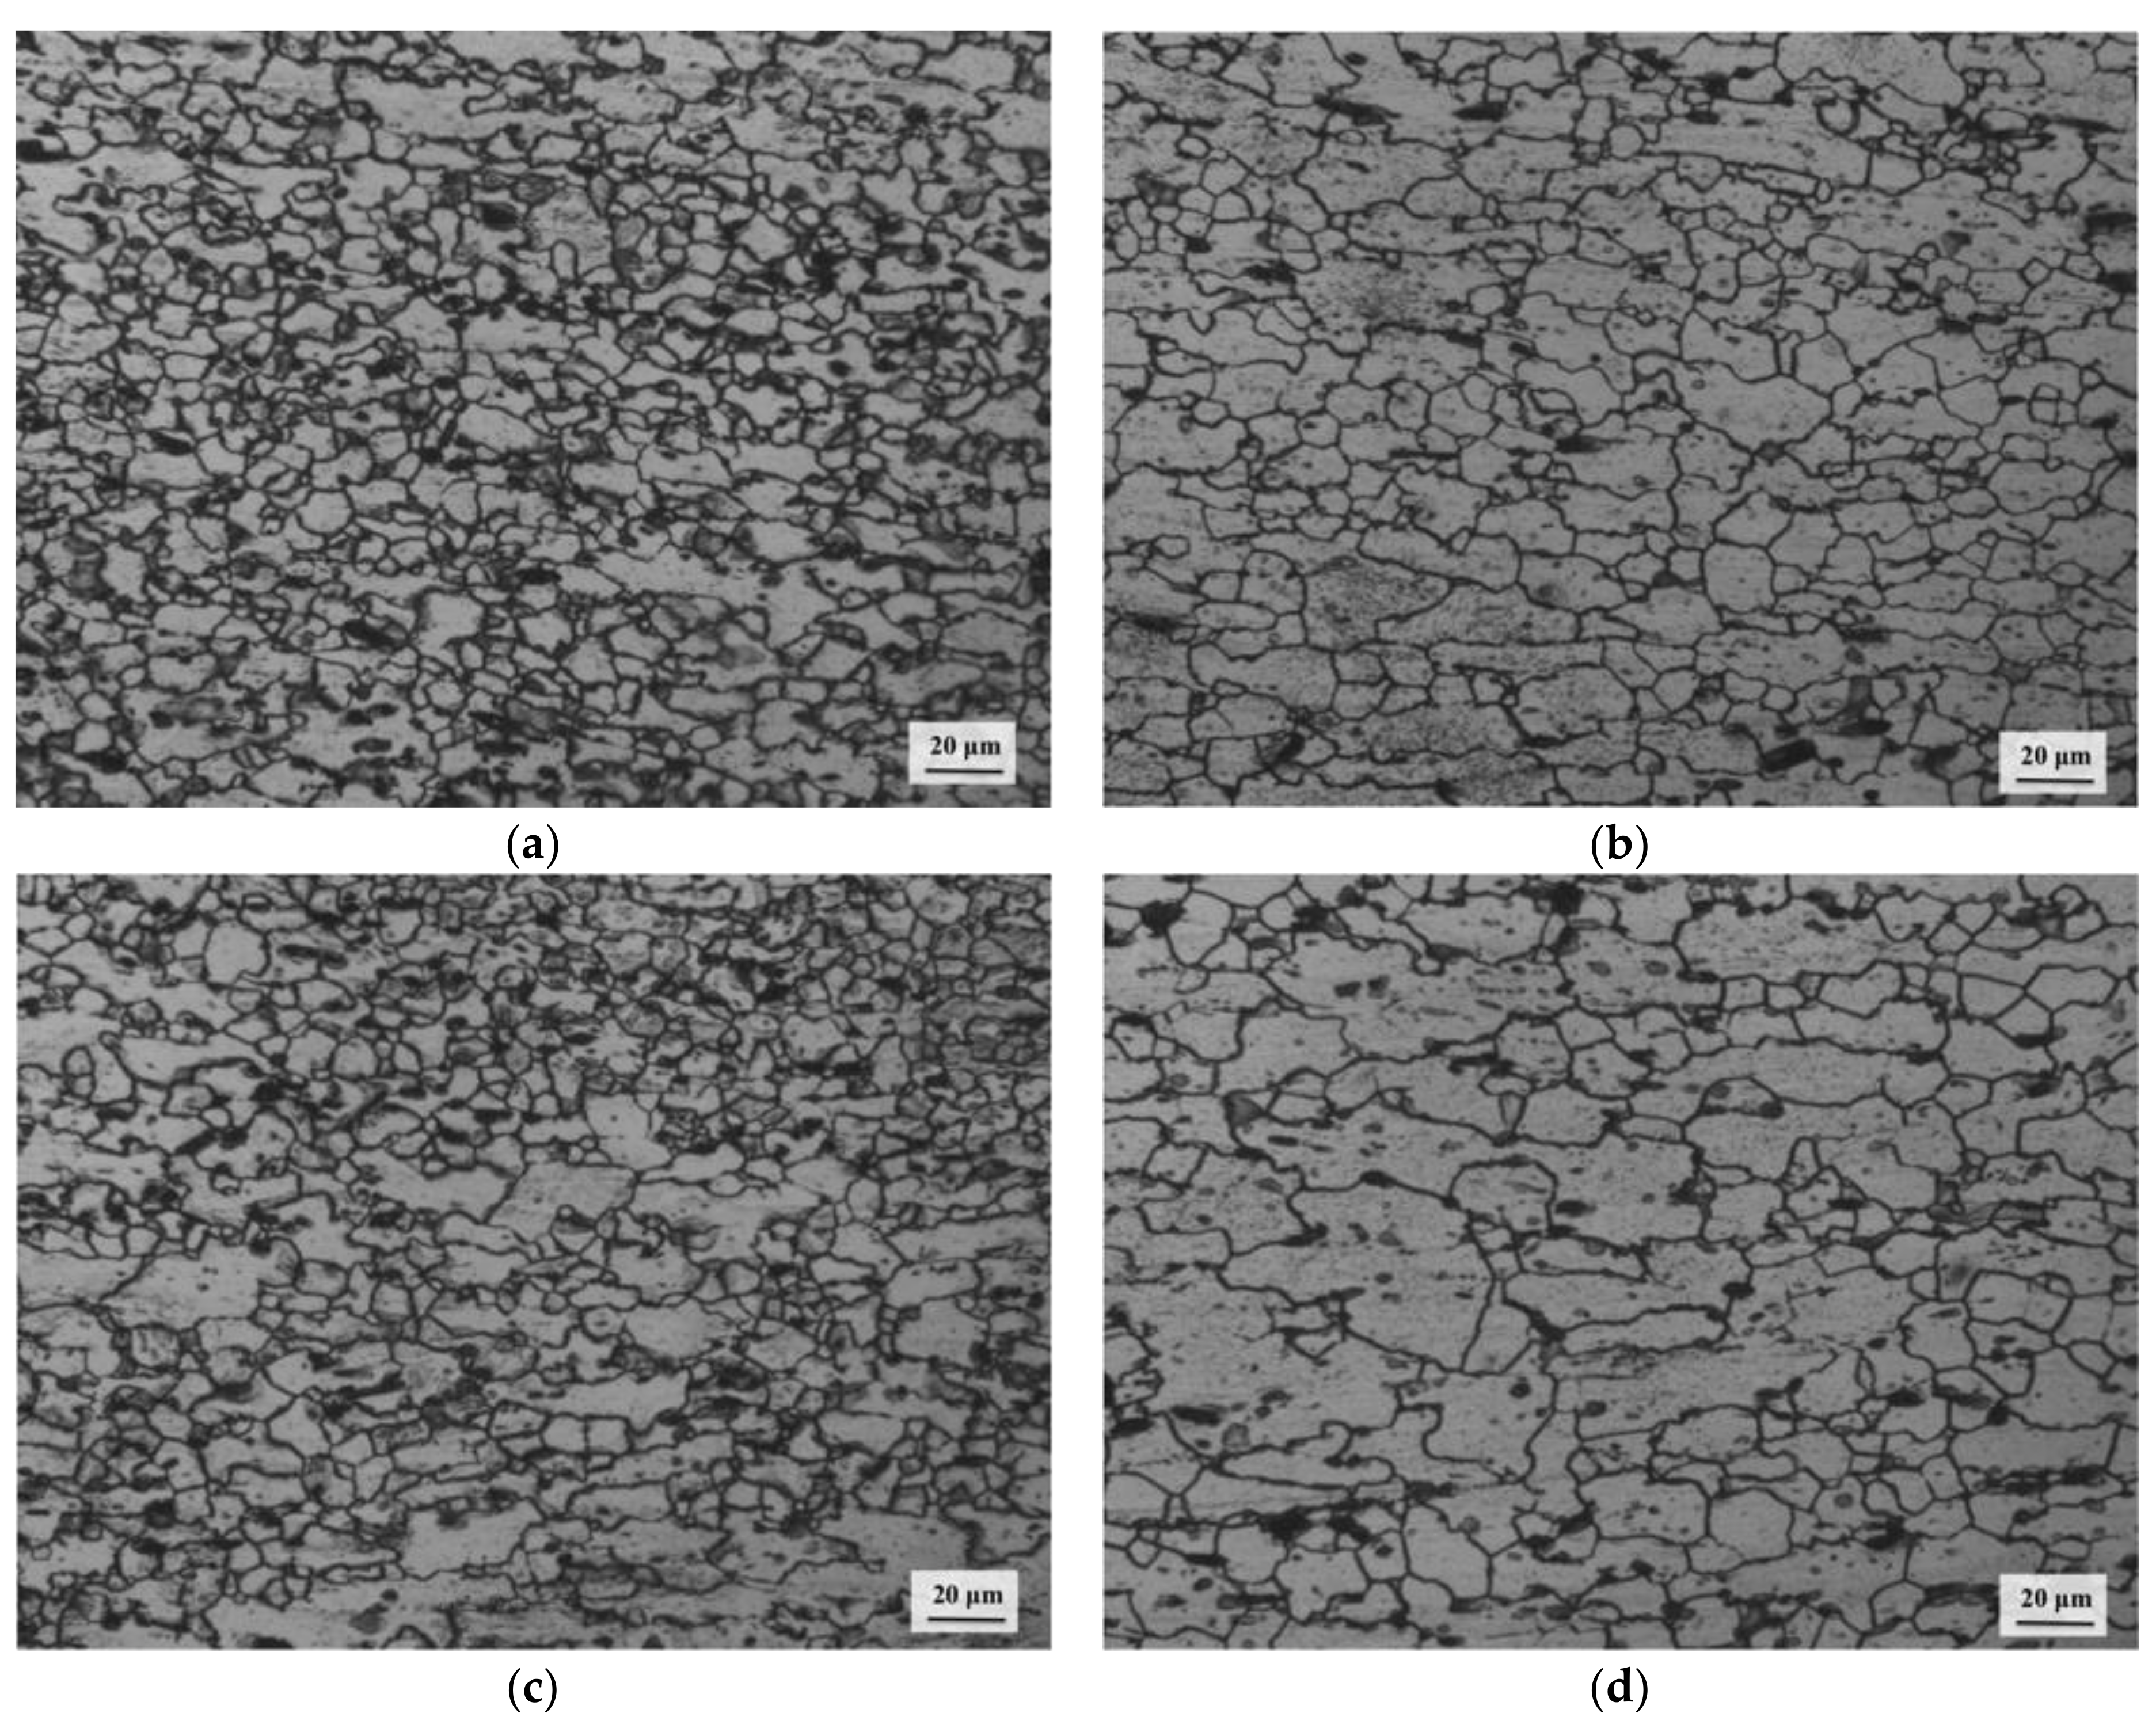
The microstructures recorded under the deformation conditions corresponding to Domain 2 are shown in Figure 10a–d, which indicate the occurrence of DRX in this domain as well, and consequently indicate that the initial microstructure in the cast condition is changed into a wrought equiaxed grain structure.
The optical microstructures of the specimens compressed in Domain 3 conditions are presented in Figure 11a–d, revealing the formation of a fine-grained recrystallized microstructure. These features confirm that Domain 3 is also a DRX domain. A wrought Mg alloy exhibiting two DRX domains at the same temperatures (one domain at lower strain rates and another DRX domain at higher strain rates) is not an unusual. The average grain diameters of specimens deformed under Domains 1, 2, and 3 are considerably lower than those in the initial cast condition. Thus, the occurrence of DRX caused considerable grain refinement in all three domains when compared with the grain size of TXAZ3200 alloy (100 µm) in the cast condition.
3.5. Kinetic Analysis
The flow stress (σ) dependence on temperature (T) and strain rate can be represented by the standard kinetic rate equation (Arrhenius type) [22], as follows:
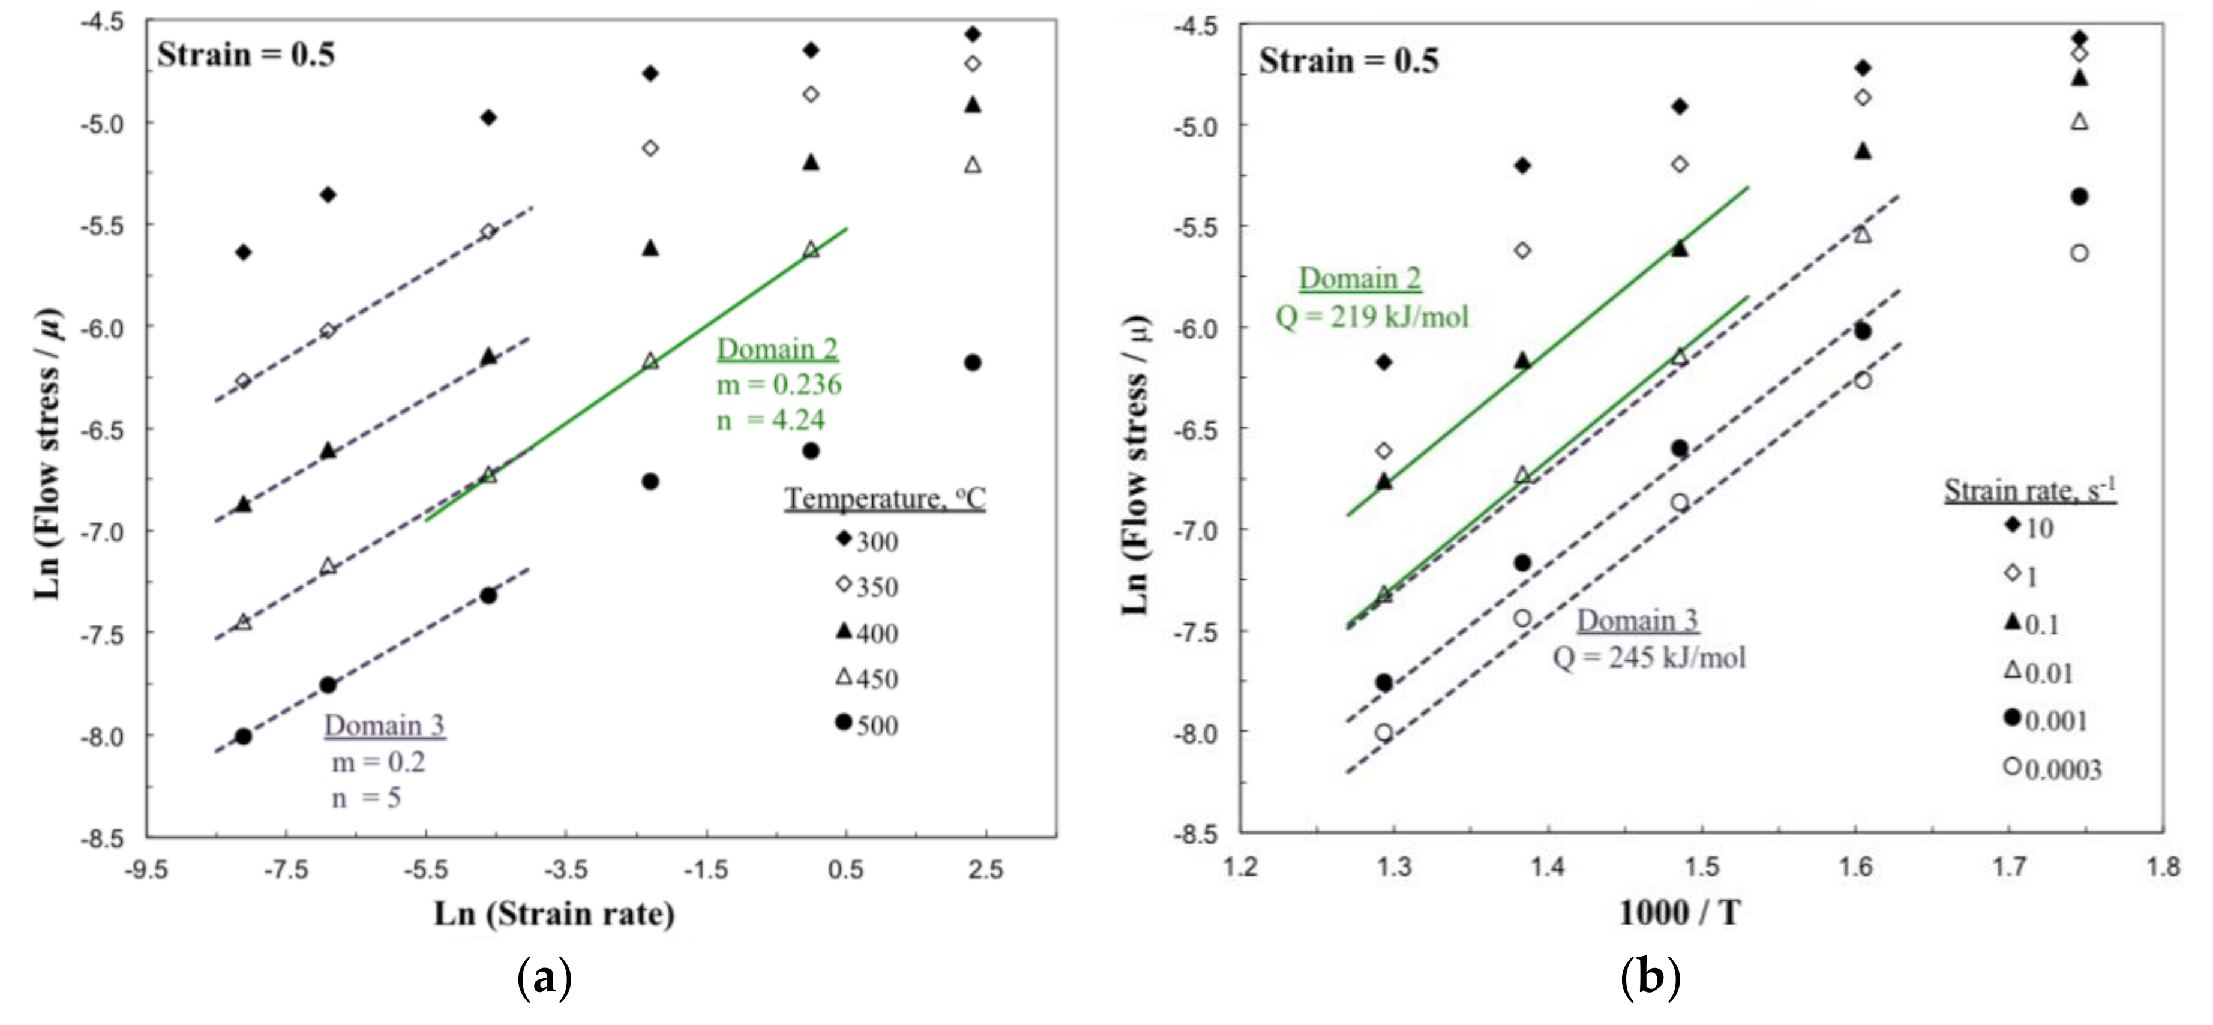
where n, Q, and R are the stress exponent, apparent activation energy, and gas constant, respectively, and A is a constant. The rate equation is obeyed within the deterministic region (domains). So, the apparent activation energy value can be evaluated for each domain. For this purpose, a plot of flow stress versus strain rate (both are on the natural logarithmic scale) at different temperatures was drawn and is shown in Figure 12a. The Arrhenius plot shown in Figure 12b presents the change of the natural logarithm of flow stress normalized with respect to the shear modulus of Mg that has a value of 16.5 GPa, against the inverse of absolute temperature.
The calculated values of apparent activation energy (Q) are 219 kJ/mole, and 245 kJ/mole for Domains 2 and 3, respectively. The Q values obtained for all three DRX domains are higher than the value of Q for the lattice self-diffusion in magnesium, which is 135 kJ/mole [23]. This may be due to the production of a considerable amount of back stress to the glide of dislocations, which is attributed to the presence of Ca2Mg6Zn3 and Mg2Ca intermetallic particles that are present in the matrix and on the grain boundaries, respectively.
3.6. Deformation Mechanisms
Basal slip on {0001}<110>, prismatic slip on the {100} slip plane in the <110> direction, first-order pyramidal slip on the {101} and {102} planes in the <110> direction, and second-order pyramidal type slip on the {112} plane along the <11> direction are the important slip planes and directions in Mg alloys. The activity of any slip system depends on its threshold levels of CRSS. It is well understood that the basal slip plays a dominant role in the room temperature deformation of magnesium due to its low CRSS, whereas the prismatic slip is active at above 225 °C and the pyramidal slip contribution is significant beyond 350 °C. Climb is the recovery process that is associated with basal slip and prismatic slip [24], whereas cross-slip is associated with second-order pyramidal slip system [25]. The activity of pyramidal slip and the occurrence of cross-slip results in high workability in magnesium materials.
In Domain 1, which occurs at lower temperatures (see Figure 8), basal type slip {0001}<110> is highly favored because of the lower CRSS at 300–340 °C (i.e., conditions of Domain 1), even though the prismatic slip {100}<110> is also favored to some extent to fulfill the requirement of five independent slip systems for homogeneous deformation in polycrystalline materials. The recovery process that is associated with the basal slip system is the climb of the edge dislocations, which is controlled by the lattice self-diffusion. The conditions at which Domain 1 occur are almost similar to the Domain 1 conditions of TX32 [17] and TX32-0.4Al [18] alloys. While a precise estimation of activation energy is not feasible due to few experimental datasets being available in this domain range, the activation energy value can be expected to be higher for TXAZ3200 due to the hard intermetallic particles in the matrix of TXAZ3200 alloy, which generate back stress.
In previous studies, the effect of Zn in Mg was reported and the addition of Zn tended to lower the CRSS required for the extensive activation of prismatic slip [11,12], thereby promoting its activity. The temperatures at which Domains 2 and 3 occur are higher for the prismatic slip alone to dominate. With the increase in temperature, the contribution of the second-order pyramidal slip system also increases as its CRSS decreases. As a result, this type of slip dominates the deformation in Domains 2 and 3, over a larger temperature range in the case of the latter. Moreover, a split in the strain rate axis differentiates the two domains. In view of the higher strain rates at which Domain 2 occurs, extensive second-order pyramidal slip occurs and the associated recovery mechanism would be cross-slip as the pyramidal dislocations are screw in character. In Domain 2, DRX occurs more quickly and can be controlled by the cross-slip. Also, the alloy can be hot worked at much faster strain rates than the rates of Domain 1. Although DRX occurs in Domain 3, the softening or the rate-controlling mechanism is possibly different from that of Domain 2. Due to the extensive occurrence of prismatic slip in these conditions (i.e., lower strain rates) and due to the edge nature of prismatic dislocations, the recovery mechanism would be dislocation climb, which can be controlled by the self-diffusion. As diffusion is a time-dependent process, it is slower and can feasibly occur at lower strain rates.
3.7. Flow Instability
Using the flow stress data and upon applying Equation (2) to evaluate the instability criterion, the processing map of TXAZ3200 alloy (Figure 5) revealed a regime of flow instability that occurred at lower temperatures and higher strain rates. Optical microstructures of the specimens compressed at (1) 300 °C/0.1 s−1 and (2) 300 °C/1 s−1 are shown in Figure 13a,b, respectively. At a lower strain rate, the manifestation of flow instability is observed as a flow localization process, in which flow bands are formed as shown in the Figure 13a. The manifestation of instability at a higher strain rate is viewed as the formation of an adiabatic shear band that occurred at almost 45° with respect to the loading axis (Figure 13b). This regime must be avoided for the thermomechanical processing of TXAZ3200 alloy.
3.8. Comparison with the Processing Maps of TX32-Based Alloys
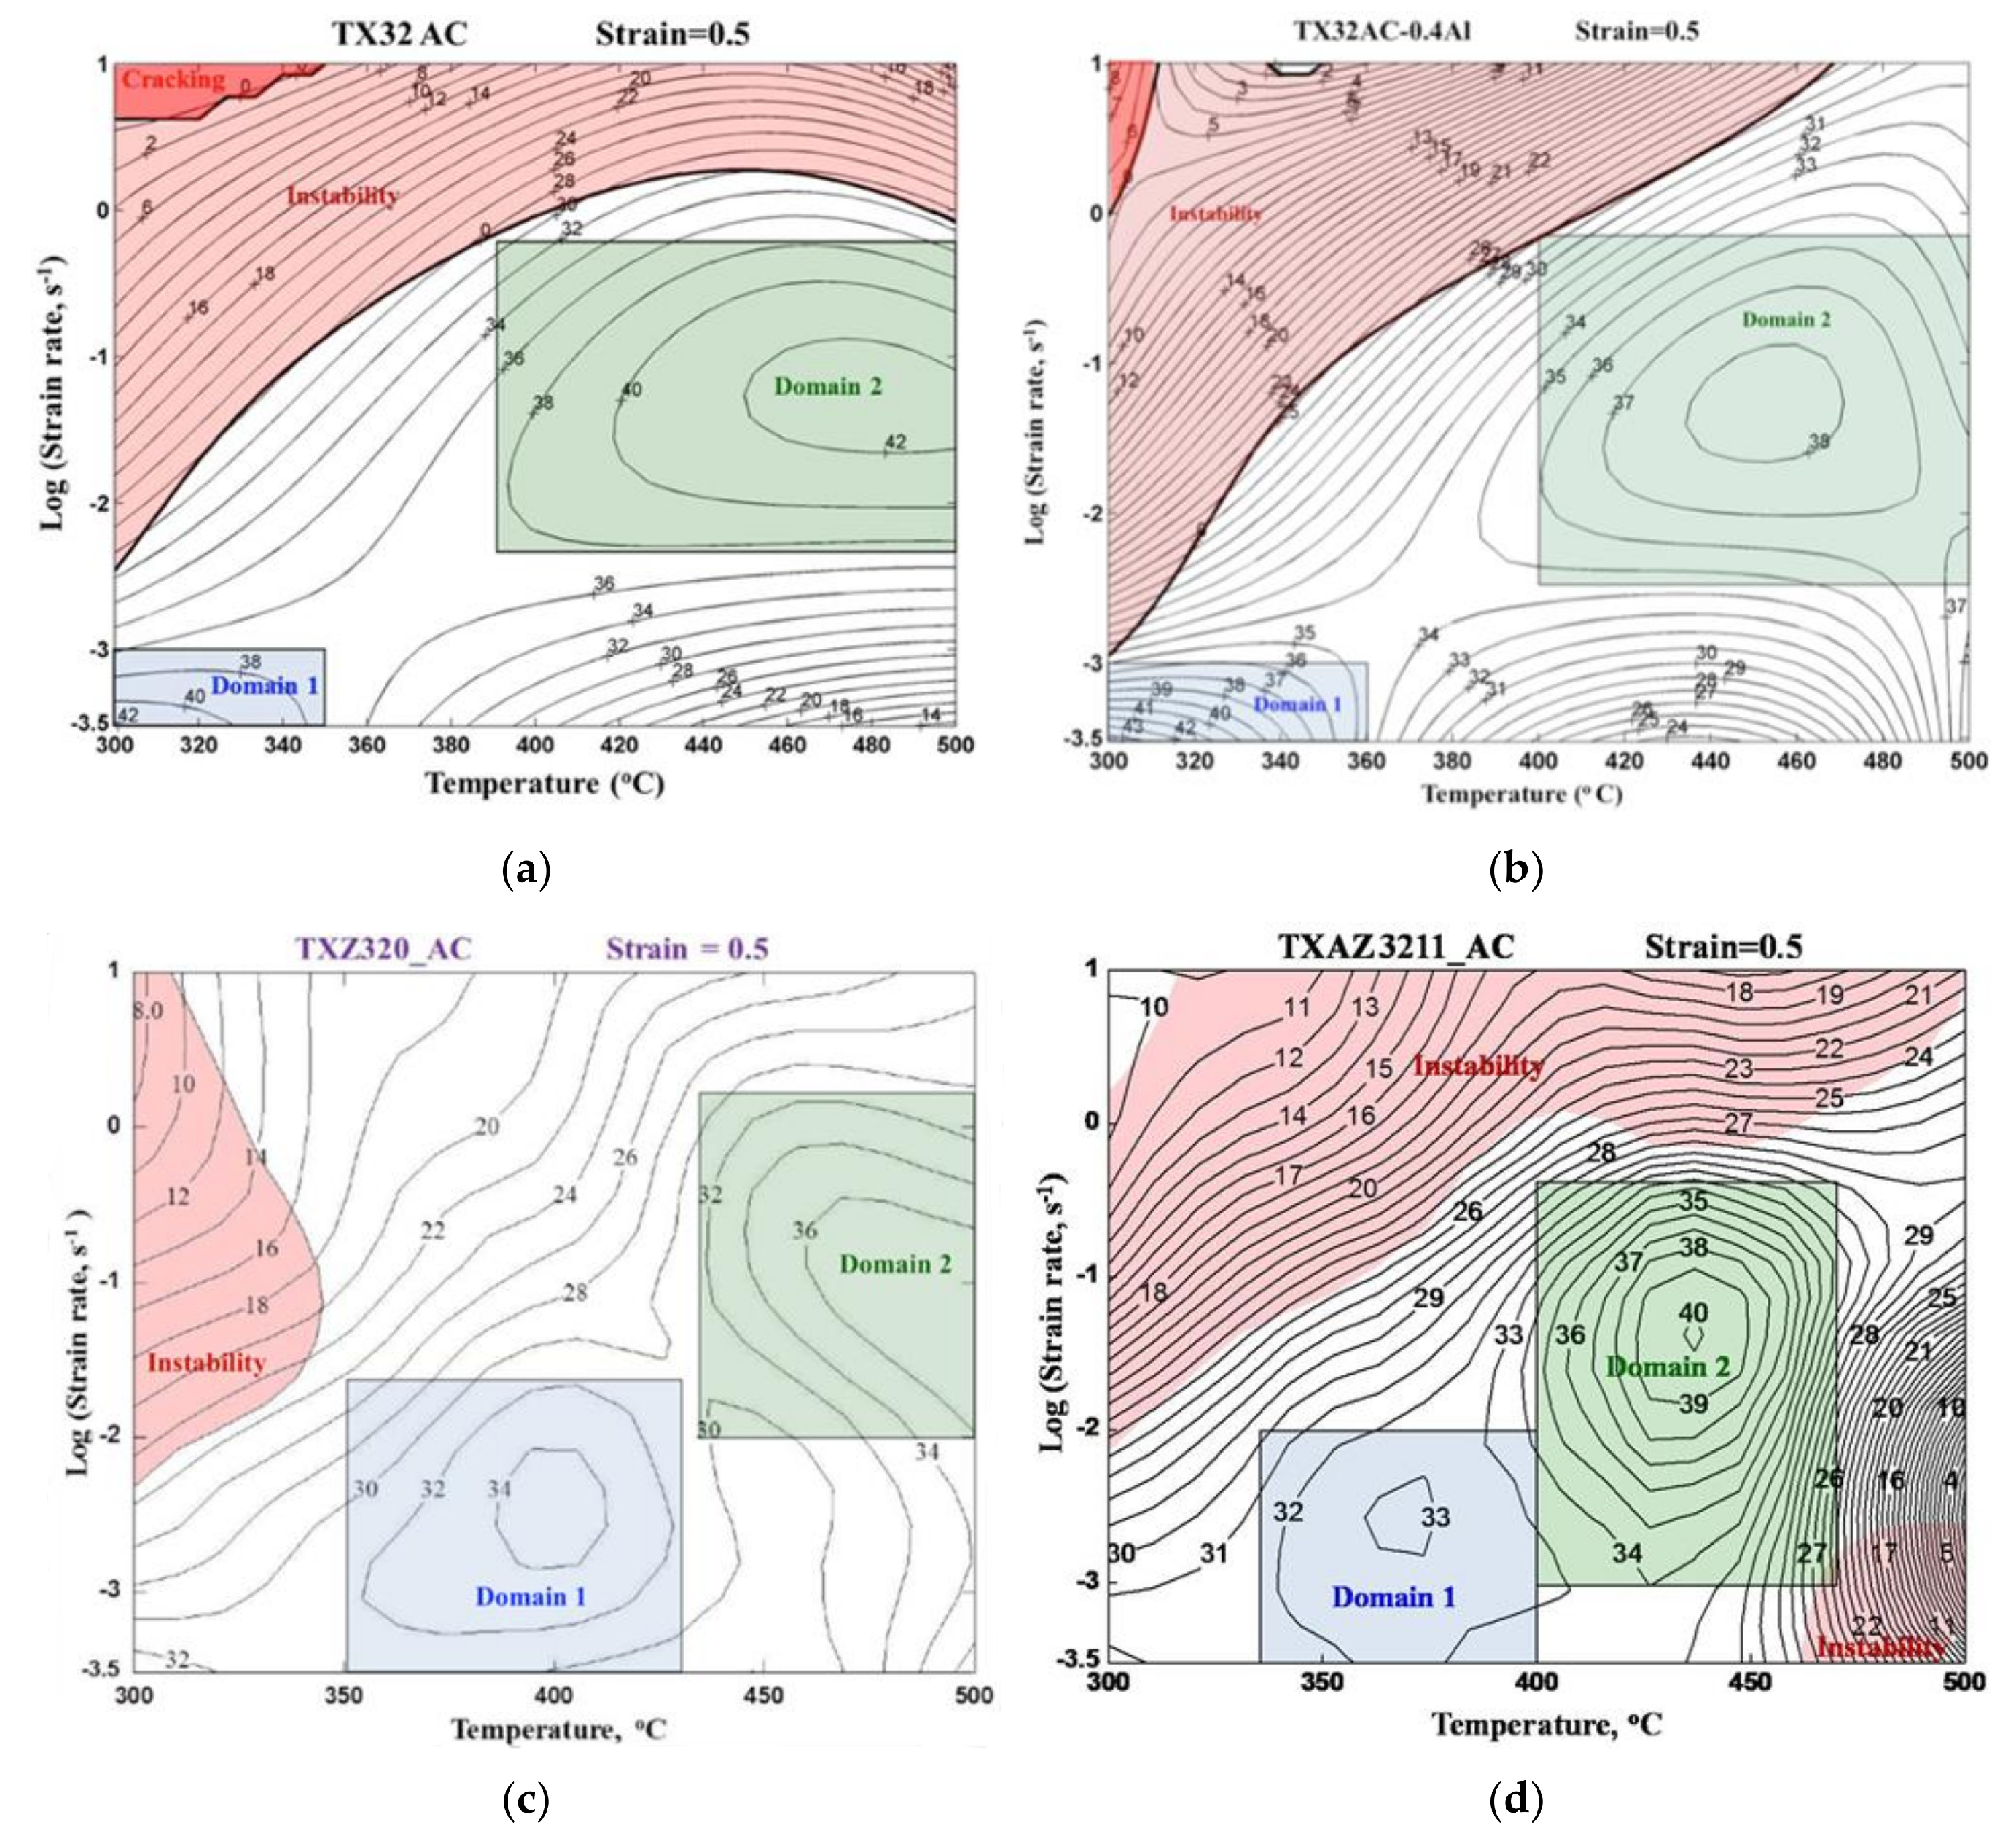
It is quite interesting to analyze the difference in the hot working behavior of TXAZ3200 (0.4% Al, 0.4% Zn) alloy with those based on the TX32 alloy system involving minor differences in Al and Zn content, such as TX32, TX32 with 0.4% Al (TXA320), TX32 with 0.4% Zn (TXZ320), and TX32 with 1% Al and 1% Zn (TXAZ3211) alloys. TX32 alloy that has no Al or Zn contains CaMgSn in the matrix and Mg2Ca that precipitates at the grain boundaries. The processing map for TX32 alloy [17], obtained in similar temperature and strain rate ranges to those covered in this study, is shown in Figure 14a. The map exhibits two DRX domains, as previously reported [17]: (1) 300–350 °C and 0.0003–0.001 s−1 showing a peak efficiency of about 42% at 300 °C/0.0003 s−1 (Domain 1); and (2) 390–500 °C and 0.005–0.6 s−1 showing a peak efficiency of about 42% at 450–500 °C/0.03 s−1 (Domain 2). Under the conditions of Domain 1 of the processing map of TX32, basal and prismatic slip occurred along with the recovery by dislocation climb. In Domain 2 conditions, second-order pyramidal slip occurred with cross-slip as the rate-controlling mechanism [17].
When 0.4% Al is added, the processing map (shown in Figure 14b) is almost similar to that of the base TX32 alloy. The map [18] exhibits two DRX domains that occur at similar temperature and strain rate conditions to those of TX32 alloy, and the corresponding deformation mechanisms are also the same in TXA320 alloy.
An attempt was made in the present work to study the deformation behavior of TX32 alloy with the addition of only 0.4% Zn. The phases formed are Ca2Mg6Zn3, Mg2Ca, and Ca2Sn in TXZ320 alloy [21]. The processing map developed for TXZ320 is shown in Figure 14c. In comparison with the base TX32 alloy, the processing map for TXZ320 alloy exhibits a significant difference in that the flow instability regime is limited only to 300–350 °C. This may be attributed to the new phases formed and the suppression of Mg2Ca at the grain boundaries. The processing map exhibits two DRX domains, similar to TX32 and TXA320 alloys. However, in TXZ320 alloy, Domain 1 shifts towards higher temperatures by 50 °C and the temperature of peak efficiency condition is higher by 100 °C, while it is extended to 0.02 s−1 on the strain rate axis. Domain 2 also moves to higher temperatures by 35 °C, with some shift to higher strain rates.
Comparing the processing map of TXAZ3200 alloy (Figure 8) with the map of its base TXA320 alloy (Figure 14b) that has no zinc, differences caused by the addition of Zn are observed as follows: (i) Domain 1 covers a slightly smaller range of temperature and the peak efficiency is lower (37% as compared to 43%); (ii) Domain 2 starts and ends towards lower values (about 20 °C) on the temperature axis, although the strain rates are very close; (iii) the new Domain 3 forms at higher temperatures and lower strain rates; and (iv) the instability regime is reduced significantly (up to 460 °C in the base alloy down to a maximum of 370 °C).
In TXA320 alloy, the deformation mechanisms in Domains 1 and 2 are the same as those described above for TXAZ3200 alloy. Even though the efficiency is same as that in Domain 2, Zn addition reduces the efficiency of deformation in Domain 1 and limits the temperature range. This may be due to the presence of intermetallic particles in the matrix that generate large back stress to transform into dislocation motion, which in turn reduces the rate of recovery. Both of these factors decrease the efficiency of DRX. A third domain, occurring only in the map of TXAZ3200 alloy, is interpreted to represent DRX controlled by slip on prismatic planes, along with the recovery by climb-controlled lattice self-diffusion. The presence of this domain in the Zn-containing alloy may be attributed to the enhanced prismatic slip activity [11] and the decrease of Mg2Ca particles at the grain boundaries, which considerably increase the grain boundary diffusion rate. Thus, recovery occurs to complete DRX in Domain 3.
In a view to increase the strength of TX32 alloy further, high Al and Zn additions (1 wt % each) were made and the hot workability behavior of the alloy was studied. The processing map for the TXAZ3211 alloy obtained in similar temperature and strain rate ranges is shown in Figure 14d. The map exhibits two DRX domains: (1) 335–400 °C and 0.0003–0.01 s−1 with a peak efficiency of about 33% occurring at 375 °C/0.005 s−1 (Domain 1); and (2) 400–470 °C and 0.001–0.3 s−1 with a peak efficiency of about 40% occurring at 440 °C/0.1 s−1 (Domain 2). The important difference between the map for TXAZ3211 alloy (Figure 14d) and that for TXAZ3200 (Figure 8) is that the flow instability regime extends over the entire temperature range (i.e., up to 500 °C). In addition, another instability regime is formed at higher temperatures and lower strain rates. This can be attributed to the high amount of Zn-containing intermetallic particles in the 1 wt % Zn alloy, which are not thermally stable up to 500 °C and cause the incipient melting of the alloy, unlike in TX32 and TXA320 alloys that have stable phases. The presence of Domain 1 in TXAZ3211 moves towards higher temperatures (by about 60 °C) and the peak efficiency is decreased. The basic slip and recovery mechanisms that caused DRX in the two domains of TXAZ3211 alloy are similar to those in Domains 1 and 2 of TXAZ3200 alloy, although the kinetics of the mechanisms might be influenced by the formation of a large volume fraction of intermetallic particles with 1% additions of both Al and Zn. Another interesting feature is that the Domain 3 that occurs in TXAZ3200 alloy at lower strain rates does not occur under those same conditions in TXAZ3211. This is likely due to the onset of instability at higher temperatures and low strain rates, as mentioned above, that enable the merger of Domains 2 and 3 into a single large domain with the active participation of prismatic as well as pyramidal slip systems which facilitate the extensive occurrence of DRX.
4. Conclusions
The compression deformation behavior of TX32-0.4Al-0.4Zn (TXAZ3200) alloy was studied and a processing map was generated. With the support of kinetic analysis and microstructural features, the following conclusions are drawn from this study:
- (1)
- The ultimate compressive strength of TXAZ3200 alloy is higher than the base TX32-0.4Al alloy in the temperature range of 25–150 °C.
- (2)
- The processing map of the alloy, in the range of 300–500 °C and 0.0003–10 s−1, exhibited three domains in the ranges: (1) 300–340 °C and 0.0003–0.001 s−1; (2) 400–480 °C and 0.01–1 s−1; and (3) 350–500 °C and 0.0003–0.01 s−1.
- (3)
- Dynamic recrystallization (DRX) occurs in all three domains and is dominated by basal slip in the first domain, pyramidal slip in the second, and prismatic slip in the third. The recovery mechanisms are climb in Domains 1 and 3 and cross-slip in Domain 2.
- (4)
- The estimated apparent activation energy (Q) values from the kinetic analysis for the as-cast TXAZ3200 alloy are 219 and 245 kJ/mole in Domains 2 and 3, respectively. These values are higher than the value of Q required for self-diffusion in Mg, which suggests the generation of significant back stress associated with the presence of intermetallic particles in the matrix and as well as on grain boundaries.
- (5)
- To maximize the workability of TXAZ3200 alloy, bulk processing may be done in Domain 2 and a completion step may be done in Domain 3 to obtain a fine grain size in the final product.
- (6)
- Compared with the processing map for TX32-0.4Al alloy, Domain 1 is slightly less wide, Domain 2 moves slightly on the temperature axis by 20 °C, and a new third domain exhibited by the Zn-containing alloy appears at higher temperatures and lower strain rates. The regime of flow instability is reduced in TXAZ3200 alloy.
- (7)
- In the processing map of TXAZ3211 alloy that has a high amount of Al and Zn (1 wt % each), Domain 1 moves to a higher temperature by 60 °C and the third domain is not present, as compared to the map of TXAZ3200 alloy. The flow instability regime extends along the entire temperature range at high strain rates, and another regime forms at high temperatures and lower strain rates.
Acknowledgments
This work described in this paper was supported by a grant from the Research Grants Council of the Hong Kong Special Administrative Region, China (Project No. CityU 114809).
Author Contributions
Chalasani Dharmendra performed the analysis of the data and contributed to writing the paper; Kamineni Pitcheswara Rao contributed to the aspects related to the processing maps, kinetic analysis, and writing the paper; Suresh Kalidass performed the experimental work, generating the results and microstructural work; Norbert Hort developed and provided the alloys in their initial cast form as well as contributed to microstructural work.
Conflicts of Interest
The authors declare no conflict of interest.
References
- Kainer, K.U.; Dieringa, H.; Dietzel, W.; Hort, N.; Blawert, C. The use of magnesium alloys: Past, present and future. In Magnesium Technology in the Global Age, Proceedings of the International Symposium on Magnesium Technology in the Global Age, Montreal, QC, Canada, 1–4 October 2006; Pekguleryuz, M.O., Mackenzie, L.W.F., Eds.; Canadian Institute of Mining, Metallurgy and Petroleum: Montreal, QC, Canada, 2006; pp. 3–19. [Google Scholar]
- Hort, N.; Huang, Y.; Abu Leil, T.; Maier, P.; Kainer, K.U. Microstructural investigations of the Mg-Sn-xCa system. Adv. Eng. Mater. 2006, 8, 359–364. [Google Scholar] [CrossRef]
- Abu Leil, T.; Huang, Y.; Dieringa, H.; Hort, N.; Kainer, K.U.; Bursik, J.; Jiraskova, Y.; Rao, K.P. Effect of heat treatment on the microstructure and creep behavior of Mg-Sn-Ca alloys. Mater. Sci. Forum. 2007, 546–549, 69–72. [Google Scholar] [CrossRef]
- Hort, N.; Huang, Y.D.; Abu Leil, T.; Rao, K.P.; Kainer, K.U. Properties and processing of magnesium-tin-calcium alloys. Kovove Mater. 2011, 49, 163–177. [Google Scholar] [CrossRef]
- Abu Leil, T.; Hort, N.; Dieringa, H.; Blawert, C.; Huang, Y.; Kainer, K.U.; Rao, K.P. Development and characterization of a series of Mg-Sn-Ca alloys. In Magnesium Technology in the Global Age, Proceedings of the International Symposium on Magnesium Technology in the Global Age, Montreal, QC, Canada, 1–4 October 2006; Pekguleryuz, M.O., Mackenzie, L.W.F., Eds.; Canadian Institute of Mining, Metallurgy and Petroleum: Montreal, QC, Canada, 2006; pp. 739–749. [Google Scholar]
- Liu, H.; Chen, Y.; Tang, Y.; Wei, S.; Niu, G. The microstructure, tensile properties, and creep behavior of as-cast Mg-(1–10)%Sn alloys. J. Alloys Compd. 2007, 440, 122–126. [Google Scholar] [CrossRef]
- Rao, K.P.; Prasad, Y.V.R.K.; Hort, N.; Huang, Y.; Kainer, K.U. High Temperature Deformation Behaviour of a New Magnesium Alloy. Key Eng. Mater. 2007, 340–341, 89–94. [Google Scholar] [CrossRef]
- Rao, K.P.; Suresh, K.; Hort, N.; Kainer, K.U. Effect of minor additions of Al and Si on the mechanical properties of cast Mg-3Sn-2Ca alloys in low temperature range. Mater. Sci. Forum. 2010, 654–656, 635–638. [Google Scholar] [CrossRef]
- Akhtar, A.; Teghtsoonian, E. Substitutional solution hardening of magnesium single crystals. Philos. Mag. 1972, 25, 897–916. [Google Scholar] [CrossRef]
- Akhtar, A.; Teghtsoonian, E. Solid solution strengthening of magnesium single crystals-I, Alloying behaviour in basal slip. Acta Metall. 1969, 17, 1339–1349. [Google Scholar] [CrossRef]
- Akhtar, A.; Teghtsoonian, E. Solid solution strengthening of magnesium single crystals-II, The effect of solute on the ease of prismatic slip. Acta Metall. 1969, 17, 1351–1356. [Google Scholar] [CrossRef]
- Blake, A.H.; Cáceres, C.H. Solid solution effects on the tensile behavior of concentrated Mg-Zn alloys. In Essential Readings in Magnesium Technology; Mathaudhu, S.N., Luo, A.A., Neelameggham, N.R., Nyberg, E.A., Sillekens, W.H., Eds.; John Wiley & Sons, Inc.: Hoboken, NJ, USA, 2014; pp. 263–267. [Google Scholar]
- Prasad, Y.V.R.K.; Rao, K.P.; Sasidhara, S. Hot Working Guide: A Compendium of Processing Maps, 2nd ed.; ASM International, Materials Park: Novelty, OH, USA, 2015; ISBN 978-1-62708-091-0. [Google Scholar]
- Prasad, Y.V.R.K.; Seshacharyulu, T. Modelling of hot deformation for microstructural control. Inter. Mater. Rev. 1998, 43, 243–258. [Google Scholar] [CrossRef]
- Ziegler, H. Progress in Solid Mechanics; Sneddon, I.N., Hill, R., Eds.; John Wiley: New York, NY, USA, 1965; Volume 4, pp. 91–193. [Google Scholar]
- Prasad, Y.V.R.K.; Rao, K.P. Processing maps and rate controlling mechanisms of hot deformation of electrolytic tough pitch copper in the temperature range 300–950 °C. Mater. Sci. Eng. A 2005, 391, 141–150. [Google Scholar] [CrossRef]
- Dharmendra, C.; Rao, K.P.; Prasad, Y.V.R.K.; Hort, N.; Kainer, K.U. Hot workability analysis with processing maps and texture characteristics of as-cast TX32 magnesium alloy. J. Mater. Sci. 2013, 48, 5236–5246. [Google Scholar] [CrossRef]
- Dharmendra, C.; Rao, K.P.; Prasad, Y.V.R.K.; Hort, N.; Kainer, K.U. Hot working mechanisms and texture development in Mg-3Sn-2Ca-0.4Al alloy. Mater. Chem. Phys. 2012, 136, 1081–1091. [Google Scholar] [CrossRef]
- Dharmendra, C.; Rao, K.P.; Zhao, F.; Prasad, Y.V.R.K.; Hort, N.; Kainer, K.U. Effect of aluminum on microstructural evolution during hot deformation of TX32 magnesium alloy. J. Mater. Sci. 2014, 49, 5885–5898. [Google Scholar] [CrossRef]
- Dharmendra, C.; Rao, K.P.; Zhao, F.; Prasad, Y.V.R.K.; Hort, N.; Kainer, K.U. Effect of silicon content on hot working, processing maps, and microstructural evolution of cast TX32-0.4Al magnesium alloy. Mater. Sci. Eng. A 2014, 606, 11–23. [Google Scholar] [CrossRef]
- Suresh, K.; Rao, K.P.; Prasad, Y.V.R.K.; Hort, N.; Kainer, K.U. Microstructure and mechanical properties of as-cast Mg-Sn-Ca alloys and effect of alloying elements. Trans. Nonferrous Met. Soc. China 2013, 23, 3604–3610. [Google Scholar] [CrossRef]
- Jonas, J.J.; Sellars, C.M.; Tegart, W.J.M.G. Strength and structure under hot working conditions. Metall. Rev. 1969, 14, 1–24. [Google Scholar] [CrossRef]
- Frost, H.J.; Ashby, M.F. Deformation-Mechanism Maps; Pergamon Press: Oxford, UK, 1982; p. 44. [Google Scholar]
- Obara, T.; Yoshinga, H.; Morozumi, S. {112} <1123> slip system in magnesium. Acta Metall. 1973, 21, 845–853. [Google Scholar] [CrossRef]
- Morris, J.R.; Schraff, J.; Ho, K.M.; Turner, D.E.; Ye, Y.Y.; Yoo, M.H. Prediction of a {1122} hcp stacking fault using a modified generalized stacking-fault calculation. Philos. Mag. A 1997, 76, 1065–1077. [Google Scholar] [CrossRef]
Figure 1.
(a) Optical microstructure and (b) SEM micrograph of as-cast TX32-0.4Al-0.4Zn (TXAZ3200) alloy.
Figure 1.
(a) Optical microstructure and (b) SEM micrograph of as-cast TX32-0.4Al-0.4Zn (TXAZ3200) alloy.

Figure 2.
X-ray diffraction (XRD) spectrum of as-cast TX32-0.4Al-0.4Zn (TXAZ3200) alloy.

Figure 3.
(a) SEM micrograph of TXAZ3200 alloy and its corresponding energy-dispersive spectroscopy (EDS) maps for elements (b) Mg, (c) Sn, (d) Ca, (e) Al, and (f) Zn.
Figure 3.
(a) SEM micrograph of TXAZ3200 alloy and its corresponding energy-dispersive spectroscopy (EDS) maps for elements (b) Mg, (c) Sn, (d) Ca, (e) Al, and (f) Zn.


Figure 4.
Differential scanning calorimetry (DSC) curve of TX32-0.4Al-0.4Zn (TXAZ3200) alloy in the as-cast condition.
Figure 4.
Differential scanning calorimetry (DSC) curve of TX32-0.4Al-0.4Zn (TXAZ3200) alloy in the as-cast condition.

Figure 5.
Ultimate compressive strength (UCS) of TXAZ3200 alloy compared with base TX32 and TX32-0.4Al (TXA320) alloys.
Figure 5.
Ultimate compressive strength (UCS) of TXAZ3200 alloy compared with base TX32 and TX32-0.4Al (TXA320) alloys.

Figure 6.
True stress–true strain plots obtained in compression for six strain rates at (a) 300 °C and (b) 450 °C.
Figure 6.
True stress–true strain plots obtained in compression for six strain rates at (a) 300 °C and (b) 450 °C.

Figure 7.
Specimen shapes after the hot compression of TXAZ3200 alloy at different temperatures and strain rates.
Figure 7.
Specimen shapes after the hot compression of TXAZ3200 alloy at different temperatures and strain rates.

Figure 8.
Processing map for TXAZ3200 (0.4Al and 0.4Zn) alloy developed at a true strain of 0.5. The numbers shown with the contours represent dissipation efficiency in percent. The shaded reddish area represents the flow instability regime.
Figure 8.
Processing map for TXAZ3200 (0.4Al and 0.4Zn) alloy developed at a true strain of 0.5. The numbers shown with the contours represent dissipation efficiency in percent. The shaded reddish area represents the flow instability regime.

Figure 9.
Microstructures of specimens compressed at temperatures and strain rates corresponding to Domain 1 and its close proximity. The compression axis is vertical. (a) 300 °C and 0.0003 s−1; (b) 350 °C and 0.0003 s−1.
Figure 9.
Microstructures of specimens compressed at temperatures and strain rates corresponding to Domain 1 and its close proximity. The compression axis is vertical. (a) 300 °C and 0.0003 s−1; (b) 350 °C and 0.0003 s−1.

Figure 10.
Optical microstructures of specimens deformed at conditions corresponding to Domain 2, revealing dynamic recrystallization (DRX) features. The compression axis is vertical. (a) 400 °C and 0.1 s−1; (b) 450 °C and 0.1 s−1; (c) 400 °C and 0.01 s−1; (d) 450 °C and 0.01 s−1.
Figure 10.
Optical microstructures of specimens deformed at conditions corresponding to Domain 2, revealing dynamic recrystallization (DRX) features. The compression axis is vertical. (a) 400 °C and 0.1 s−1; (b) 450 °C and 0.1 s−1; (c) 400 °C and 0.01 s−1; (d) 450 °C and 0.01 s−1.
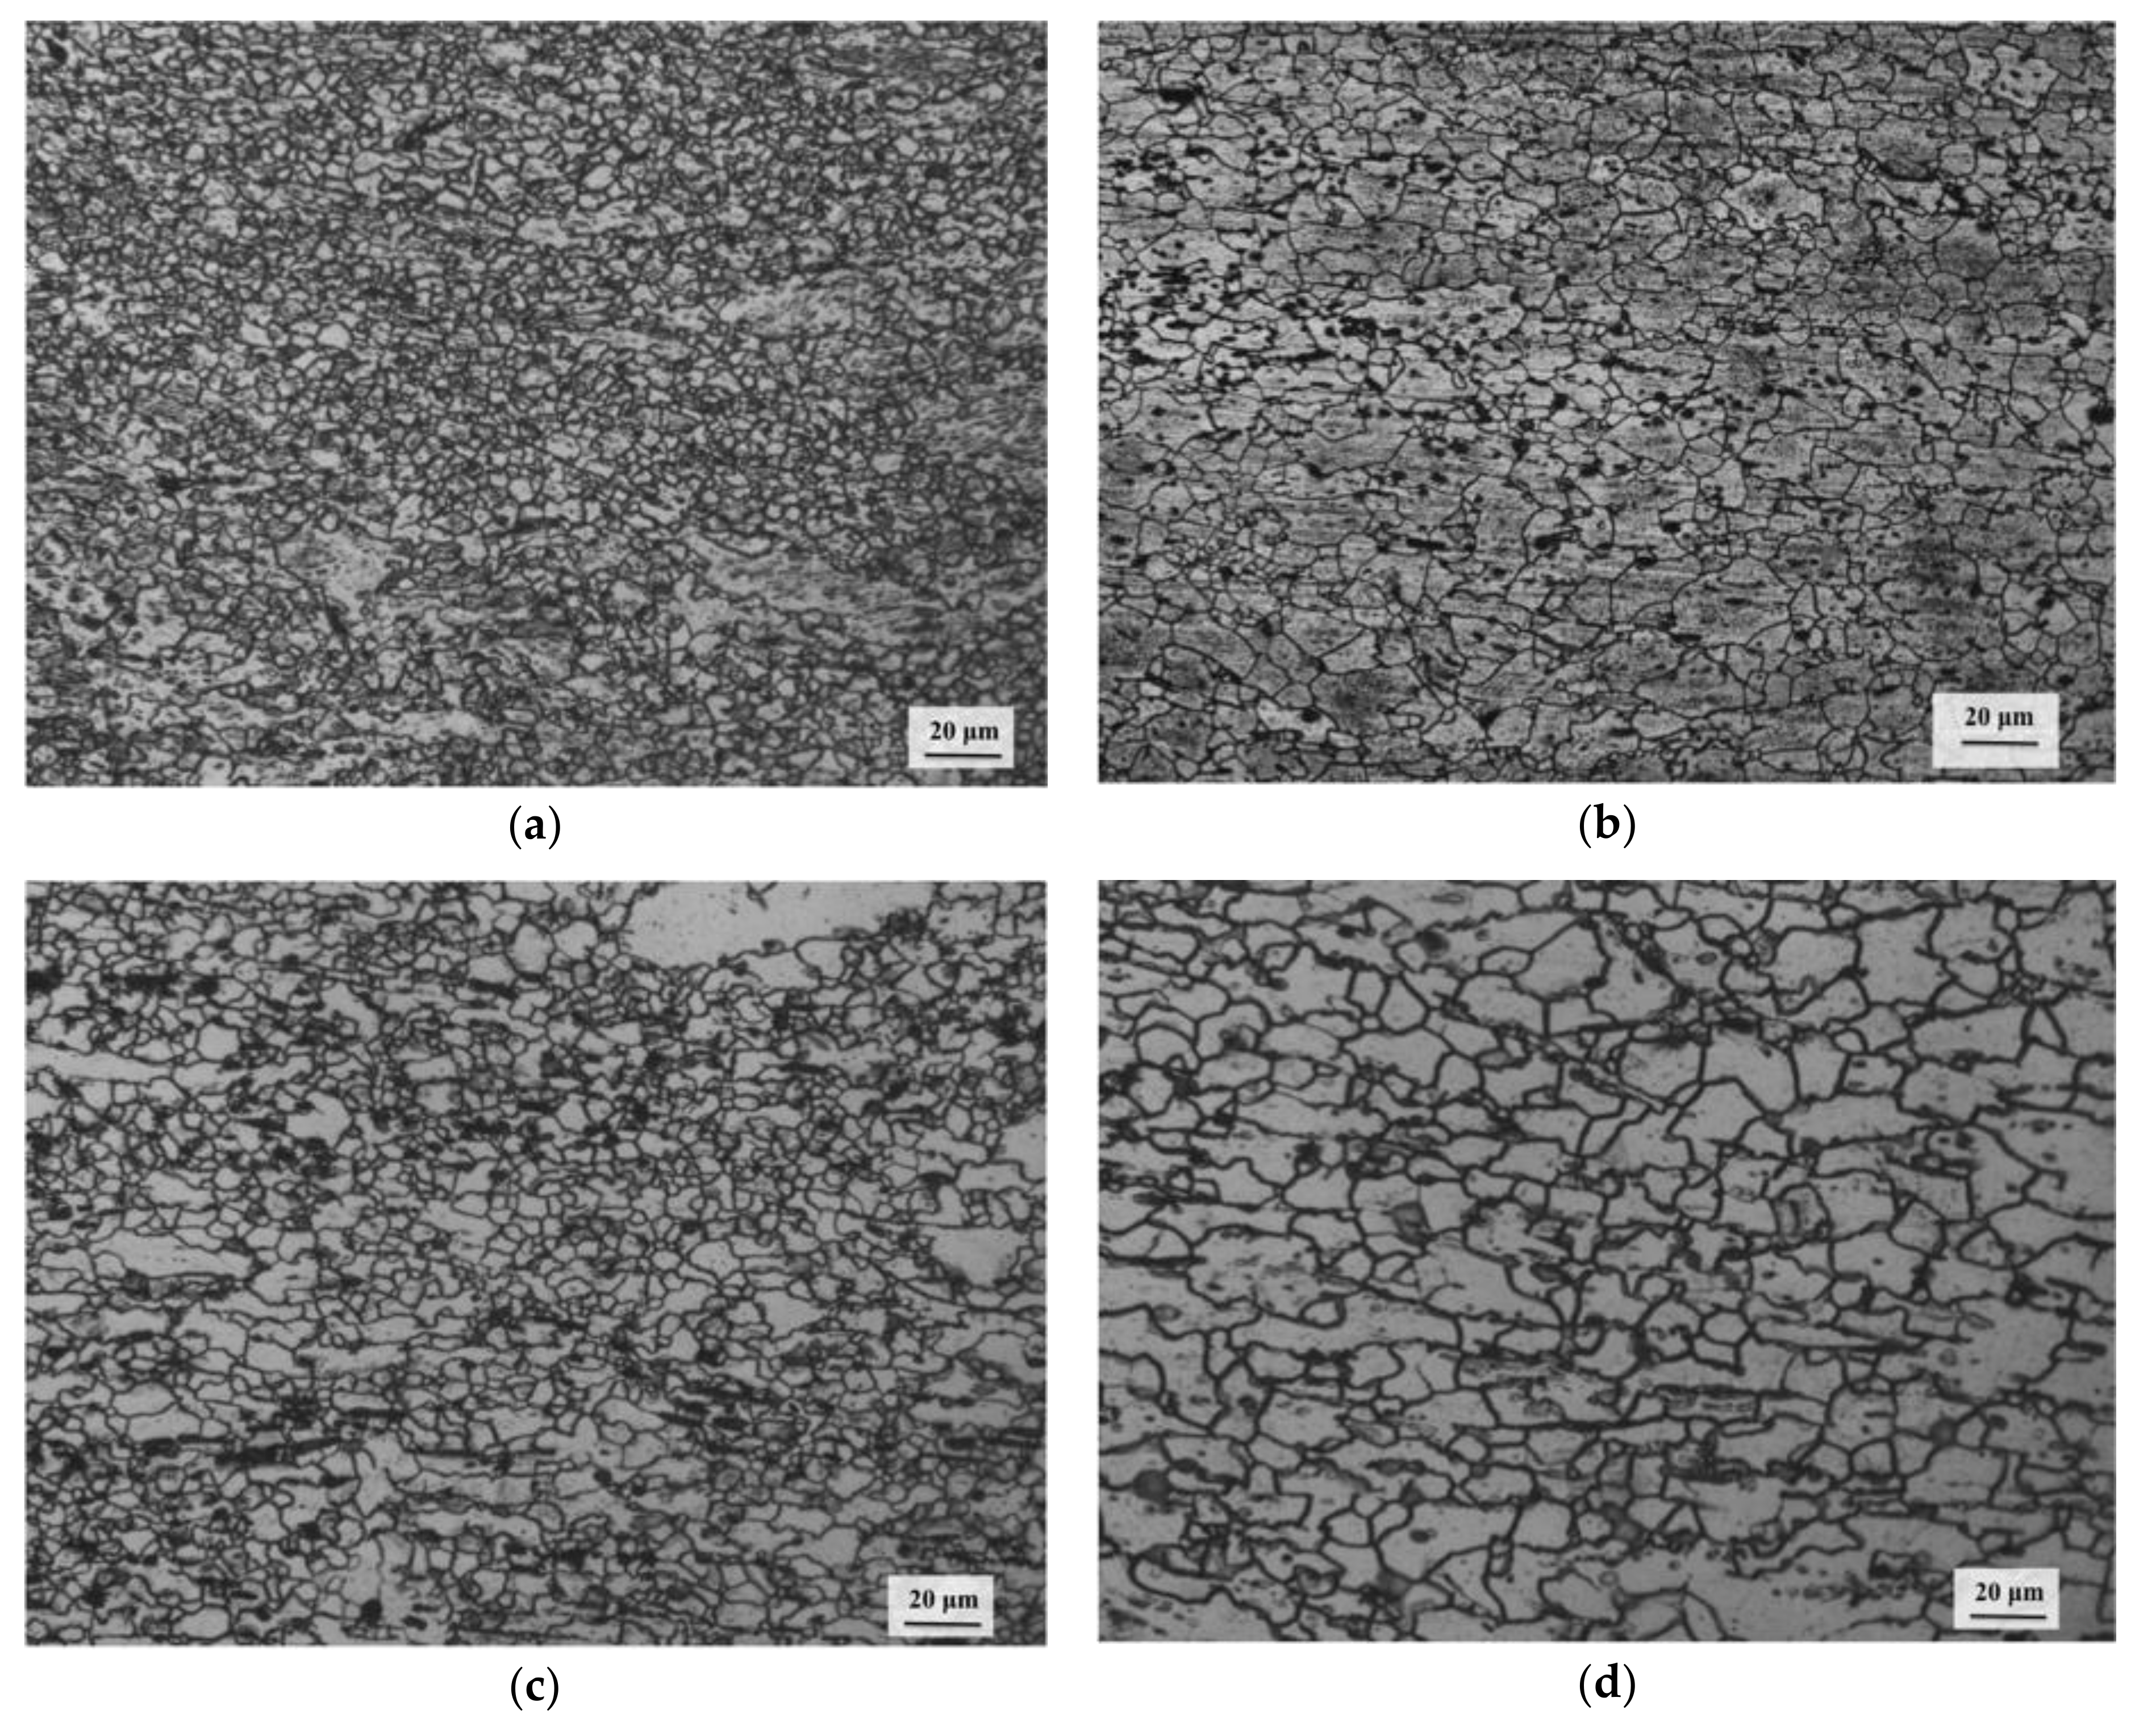
Figure 11.
Optical microstructures of specimens deformed at conditions corresponding to Domain 3, revealing DRX features. The compression axis is vertical. (a) 400 °C and 0.001 s−1; (b) 450 °C and 0.001 s−1; (c) 400 °C and 0.0003 s−1; (d) 450 °C and 0.0003 s−1.
Figure 11.
Optical microstructures of specimens deformed at conditions corresponding to Domain 3, revealing DRX features. The compression axis is vertical. (a) 400 °C and 0.001 s−1; (b) 450 °C and 0.001 s−1; (c) 400 °C and 0.0003 s−1; (d) 450 °C and 0.0003 s−1.

Figure 12.
(a) Flow stress versus strain rate on the natural logarithm scale at various temperatures, and (b) normalized flow stress versus the inverse of absolute temperature at different strain rates for TXAZ3200 alloy.
Figure 12.
(a) Flow stress versus strain rate on the natural logarithm scale at various temperatures, and (b) normalized flow stress versus the inverse of absolute temperature at different strain rates for TXAZ3200 alloy.

Figure 13.
Microstructures of specimens compressed under the conditions of flow instability regime. The compression axis is vertical. (a) 300 °C and 0.1 s−1; (b) 300 °C and 1 s−1.
Figure 13.
Microstructures of specimens compressed under the conditions of flow instability regime. The compression axis is vertical. (a) 300 °C and 0.1 s−1; (b) 300 °C and 1 s−1.
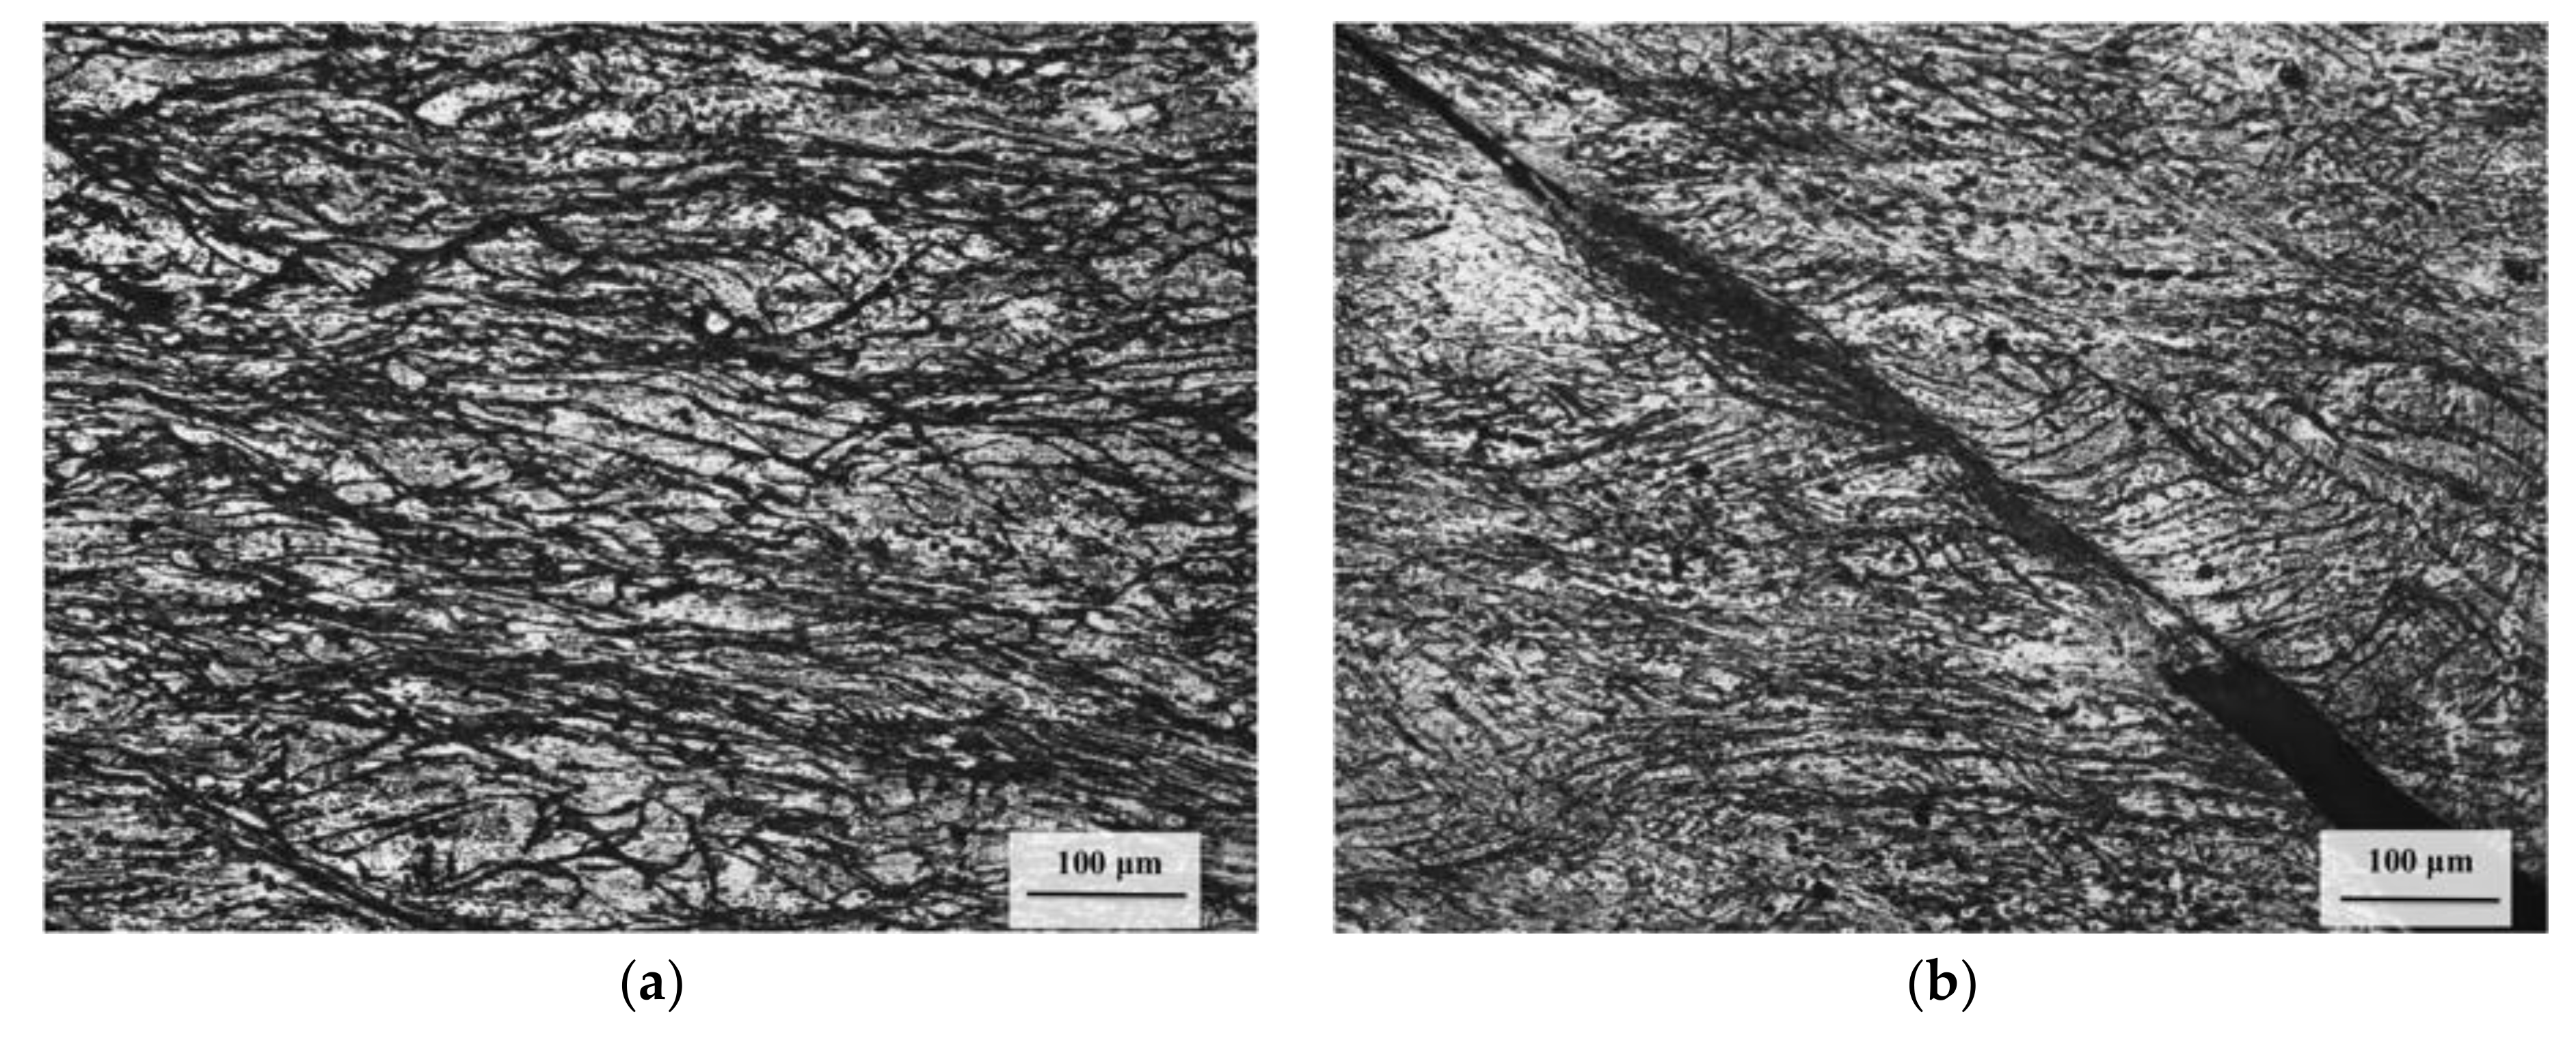
Figure 14.
Processing maps for (a) TX32 [17]; (b) TX32-0.4Al [18]; (c) TX32-0.4Zn; and (d) TX32-1Al-1Zn alloys at a true strain of 0.5. The numbers on the contours represent power dissipation efficiency in percent. The flow instability regimes are marked.


Table 1.
The chemical composition (in percent) measured on the cast billet of TXAZ3200 alloy.
| Sn | Ca | Al | Zn | Mg |
|---|---|---|---|---|
| 2.844 | 1.857 | 0.384 | 0.38 | Balance (94.53) |
© 2018 by the authors. Licensee MDPI, Basel, Switzerland. This article is an open access article distributed under the terms and conditions of the Creative Commons Attribution (CC BY) license (http://creativecommons.org/licenses/by/4.0/).
Share and Cite
MDPI and ACS Style
Dharmendra, C.; Rao, K.P.; Suresh, K.; Hort, N. Hot Deformation Behavior and Processing Map of Mg-3Sn-2Ca-0.4Al-0.4Zn Alloy. Metals 2018, 8, 216. https://doi.org/10.3390/met8040216
AMA Style
Dharmendra C, Rao KP, Suresh K, Hort N. Hot Deformation Behavior and Processing Map of Mg-3Sn-2Ca-0.4Al-0.4Zn Alloy. Metals. 2018; 8(4):216. https://doi.org/10.3390/met8040216
Chicago/Turabian StyleDharmendra, Chalasani, Kamineni Pitcheswara Rao, Kalidass Suresh, and Norbert Hort. 2018. "Hot Deformation Behavior and Processing Map of Mg-3Sn-2Ca-0.4Al-0.4Zn Alloy" Metals 8, no. 4: 216. https://doi.org/10.3390/met8040216
Note that from the first issue of 2016, this journal uses article numbers instead of page numbers. See further details here.