Effect of Segregation and Surface Condition on Corrosion of Rheo-HPDC Al–Si Alloys
by
 , , and
Maryam Eslami
1 ,
,
Mostafa Payandeh
2,
Flavio Deflorian
1,
Anders E. W. Jarfors
2 and
Caterina Zanella
2,*
1
Department of Industrial Engineering, University of Trento, 38123 Trento, Italy
2
Department of Materials and Manufacturing, School of Engineering, Jönköping University, 55111 Jönköping, Sweden
*
Author to whom correspondence should be addressed.
Metals 2018, 8(4), 209; https://doi.org/10.3390/met8040209
Submission received: 22 February 2018
/
Revised: 21 March 2018
/
Accepted: 23 March 2018
/
Published: 24 March 2018
(This article belongs to the Special Issue Semi-Solid Processing of Alloys and Composites)
Abstract
:Corrosion properties of two Al–Si alloys processed by Rheo-high pressure die cast (HPDC) method were examined using polarization and electrochemical impedance spectroscopy (EIS) techniques on as-cast and ground surfaces. The effects of the silicon content, transverse and longitudinal macrosegregation on the corrosion resistance of the alloys were determined. Microstructural studies revealed that samples from different positions contain different fractions of solid and liquid parts of the initial slurry. Electrochemical behavior of as-cast, ground surface, and bulk material was shown to be different due to the presence of a segregated skin layer and surface quality.
1. Introduction
High pressure die casting (HPDC) is one of the most used manufacturing process for light alloy components [1,2], due to its high productivity, capability to cast complex geometry, dimensional accuracy, reduced need for finishing operations, and producing component with fine grain microstructure and good mechanical properties [3,4,5].
Coupling semisolid metal (SSM) casting to HPDC (SSM-HPDC) is a promising technology to produce high quality components with sound microstructure. Higher viscosity of semisolid material in this process reduces air entrapment and consequent porosity in the component. Such a technology introduces a new opportunity to enhance the castability of a component, which is impossible to achieve by traditional manufacturing methods [2,3,6,7].
There are two kinds of semisolid processes: “rheocasting” and “thixocasting”. In 1976, Flemings et al. [8] introduced rheocasting as an alternative manufacturing process to die casting and even forging, and suggested it can be used to prepare high quality parts. Rheocasting, the method which is used in the current research, involves shearing force during a first solidification to produce a slurry. The slurry is then transferred into a mold and solidifies with non-dendritic microstructure [9]. Rheocasting can be coupled with high pressure die casting and Rheo-HPDC parts have a globular microstructure and usually show low porosity. This leads to heat treatability and high performance [2,6]. Proper materials for Rheo-HPDC process are limited to those which have good castability with HPDC process and also have low sensitivity of the solid fraction to variations of temperature [10]. Hypoeutectic Al–Si alloys in the range of 5–8% silicon content are suitable choices for this process [11].
While Rheo-HPDC widens the composition range of castable alloys and allows for casting of thin sections, it is a process which increases the inhomogeneity of the microstructure at the macroscale in the final component, in comparison to the conversional HPDC process [5]. This phenomenon arises from the fact that the primary α-Al phase solidifies at higher temperature during slurry preparation, and is characterized with low solubility of alloying elements, therefore, these elements will be higher in the remnant liquid phase [11]. In addition, macrosegregation is formed during the filling process: solid and liquid fractions tend to separate in the gating system (longitudinal macrosegregation) and from the surface to the core of the component (transverse macrosegregation), increasing the microstructure inhomogeneity of the final component. This leads to variations of properties in different locations of the component either in microscopic or macroscopic scale [12,13,14]. The liquid will preferentially fill the furthest parts of the mold, or the thinner sections, while the solid fraction will concentrate in the core. This is due to the higher viscosity of the slurry compared to the liquid molten metal during casting [15]. As a consequence, higher yield strength and ultimate tensile strength are developed near the vent, where more liquid fraction and refined grains solidify compared to the region near the gate [11].
Park et al. [16] showed that the tensile elongation of thixoformed 357-T5 semi solid aluminum alloy is strongly affected by the α1-Al volume fraction which changes in different locations of the component.
Masuku et al. [17,18,19] investigated the corrosion behavior of the surface layer of SSM-HPDC 7075-T6 and 2024-T6 alloys in sodium chloride solution. They observed a surface liquid segregated layer (mainly formed by the eutectic) in all the alloys, with higher amounts of alloying elements (such as copper). They did not report any difference between the pitting potential, however, they mentioned that pitting morphology is affected by the amount and distribution of the intermetallic particles and therefore differences are expected between the SSM-HPDC and wrought alloys [18]. How longitudinal macrosegregation affects the corrosion resistance of semisolid aluminum alloys and the behavior of the as-cast surface is still not studied.
Limitation of scientific and technical knowledge makes it essential to evaluate properties and behavior of aluminum alloys produced by means of Rheo-HPDC process under different operational circumstances. Corrosion resistance is a critical property for Al alloys, especially in outdoor applications, and therefore, is an interesting subject either for researchers or industries.
Many authors have investigated corrosion resistance of Al–Mg–Si (6xxx series) [20,21,22,23,24,25,26,27,28] and Al–Si alloys [29,30,31,32,33,34,35]. Regarding Al–Mg–Si alloys, pitting and intergranular corrosions (IGC) have been reported as localized corrosion features [23,27]. IGC susceptibility is especially influenced by the amount of copper, iron, and Mg/Si ratio in the alloy composition [23,24,27,36,37]. The localized corrosion occurs in the presence of phases such as β-phase (Mg2Si), silicon (in alloys with excess Si) and copper-containing phases such as Q-phase (Al4Cu2Mg8Si7) (in alloys with Cu) [38]. Iron-rich intermetallics in Al–Mg–Si alloys are nobler compared to the matrix [21]. Nobler intermetallic particles (IMs) in grain boundaries form a microgalvanic couple with the adjacent precipitate free zones (PFZ), and result in IGC [37]. In chloride containing solutions, Mg2Si undergoes Mg dealloying, before turning to an active cathodic site [21,22].
Al–Si alloys generally suffer from the localized corrosion (pitting) in the Al–Si eutectic, due to impurities, such as Fe [39]. Generally, corrosion behavior of these alloys depends on the amount and morphology of iron-rich IMs, such as β-AlFeSi and π-AlFeSiMg [34]. Both Fe and Si are cathodic with respect to the aluminum. Therefore, together they can form a microgalvanic couple, resulting in localized corrosion [34]. Silicon also increases the corrosion potential [23,27].
Previous corrosion studies of semisolid-cast Al-Si alloys such as those performed by Yu et al. [40], Park et al. [31], Tahamtan et al. [30,35] and Arrabal et al. [34], have mostly emphasized on the pitting corrosion in the eutectic regions of A356 and A357 alloys.
It is shown that semisolid-cast process, such as thixoforming, can effectively modify the Si morphology in 357 alloy, resulting in a higher corrosion resistance [40]. The acicular eutectic silicon phase in permanent mold cast 357 alloy has more contact area with the aluminum matrix in comparison to that of the globular eutectic silicon in the thixoformed alloy, and this can encourage the galvanic corrosion [40].
Rheocast process can increase the concentration of silicon in α-Al particles in A356 aluminum alloy. This leads to smaller potential differences between this phase and the eutectic silicon phase and β-AlFeSi IM particles, which result in higher resistance to pitting corrosion [34]. Although both of the eutectic silicon phase and iron-rich IMs contribute in the localized corrosion, some authors consider the contribution of IM particles to be more important [34,41].
The present study focused on the Al low Si alloys produced by Rheo-HPDC process and on the effect of the microstructure inhomogeneity on the corrosion resistance. In addition, the influence of silicon content and surface condition on the microstructure characteristics and the corrosion behavior is examined.
2. Materials and Methods
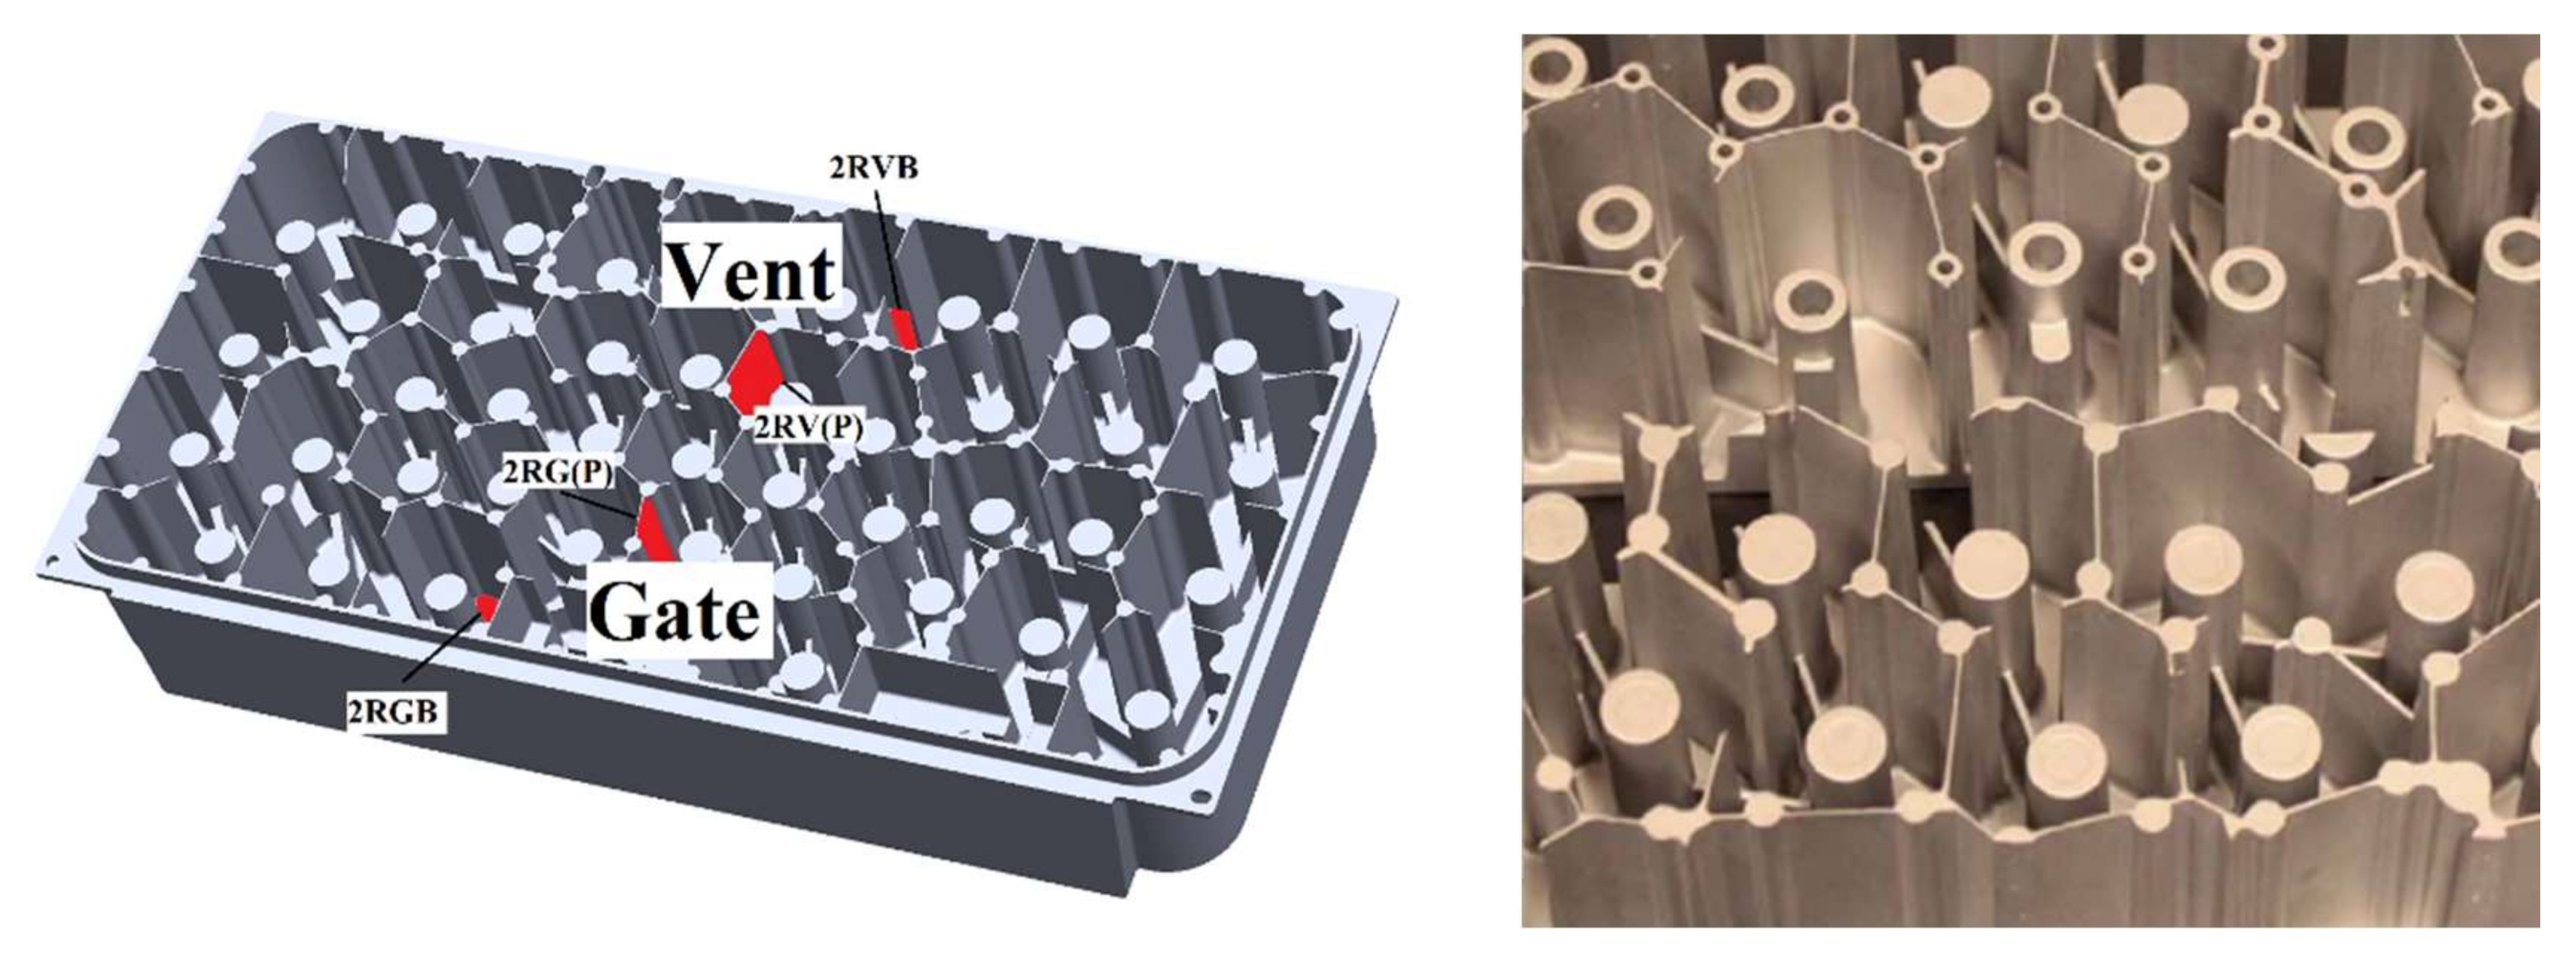
A telecom cavity filter (Figure 1) was rheocast by a 400 ton HPDC machine equipped with an automated RheoMetalTM slurry generator. The RheoMetalTM (Stockholm, Sweden) process uses an Enthalpy Exchange Material (EEM) as slurry generator [42].
The alloys were prepared, and their composition were adjusted by adding pure silicon to a primary alloy in a resistance furnace. The chemical compositions of the alloys were measured by optical emission spectroscopy (OES) (SPECTRO Analytical Instruments GmbH, Kleve, Germany) and are presented in Table 1.
In the casting process, the temperature of the fixed half of the die was maintained at 230–250 °C, while the temperature of the moving half was set to 280–320 °C. Shots of about 5 kg were held at 675 °C in the ladle where 5% of EEM was added under stirring at 900 rpm. The final slurry temperature was 610 °C and had 40% of solid fraction. The die was filled in two stages with piston speed at 0.23 and 5.2 m/s, respectively, and the shot time was 31 ms. The solid fraction in the slurry was estimated by image analyses of a quenched sample of slurry after light etch using a 5% NaOH.
Specimens for corrosion tests were taken from the thin walls (thickness ≈ 1.5 mm), in as-cast or ground condition, or from the thick bottom plate (thickness ≈ 4 mm), underneath the component only in ground condition.
To investigate longitudinal segregation, both thin wall and thick bottom plate samples were taken from different locations: near the feeding gate (G) or near the die vent (V). The detailed samples designation is presented in Table 2.
Polarization tests and electrochemical impedance spectroscopy (EIS) were performed with a 3-electrode cell and a potentiostat (Parstat 2273, Ametek, Berwyn, PA, USA). The aluminum alloy with an exposure area of 1 cm2 was connected as working electrode, platinum as a counter and silver/silver chloride (Ag/AgCl·3M·KCl) as reference electrodes. Due to the working environment of telecom components, diluted Harrison solution (0.5 g/L NaCl and 3.5 g/L (NH4)2SO4) was used to simulate the electrochemical behavior of the alloys exposed to an acid rain [43,44].
Regarding the polarization test, the sweep rate was 0.166 mV/s, and the delay time before each the test was 600 s, to let the open circuit potential (OCP) reaches its stable value. For each sample, mainly anodic branch was collected (as cathodic branch did not exhibit any significant information), starting from OCP. Anodic polarization was stopped after the maximum current density of 9 × 10⁻⁴ A/cm2 was reached. In order to highlight the effect of chloride ions, all the polarization experiments were also repeated using a solution of 3.5 g/L (NH4)2SO4.
EIS measurements were collected for 24 h of immersion at the room temperature in the diluted Harrison solution from 100 kHz to 10 MHz with 36 points and 10 mV of amplitude of the sinusoidal potential.
EIS measurements were conducted on as-cast and ground surfaces of thin wall samples, and also on ground surface of the thick bottom plate samples, to investigate the effect of transverse macrosegregation and as-cast condition.
To distinguish the results of these different experiments, the letter P is added to the name of the samples of thin walls, which were ground before the electrochemical test. These samples were wet ground by silicon carbide abrasive papers from P600 to P4000 to the extent that the skin layer was completely removed. In the case of bulk samples (of the thick bottom plate), the surfaces were ground until the middle of each sample was reached. In this way, the electrochemical behavior of the bulk of each alloy can be investigated. Repeatability of the results was tested by conducting each experiment on at least three specimens. ZsimpWinTM software (3.5, Echem software, Ann Arbor, MI, USA, 2013) was used to fit the EIS spectra. After the corrosion tests, corroded surfaces were examined using SEM/EDS (JSM-IT300) (Jeol, Akishima, Japan).
For metallographic analyses, samples were wet ground, followed by polishing using diamond paste (3 µm and 1 µm). NaOH solution (10 wt %) was used to clean the surface and to reveal the constituents of the microstructure. The microstructure of the surfaces and the bulk of components were studied using a light optical microscope (LOM) (Zeiss, Oberkochen, Germany) and scanning electron microscopy (SEM) (Jeol, Akishima, Japan). Energy/wave-dispersive X-ray spectroscopy (EDS/WDS) (EDAX, Mahwah, NJ, USA) was used to measure the composition of the different phases.
3. Results and Discussion
3.1. Microstructural Features
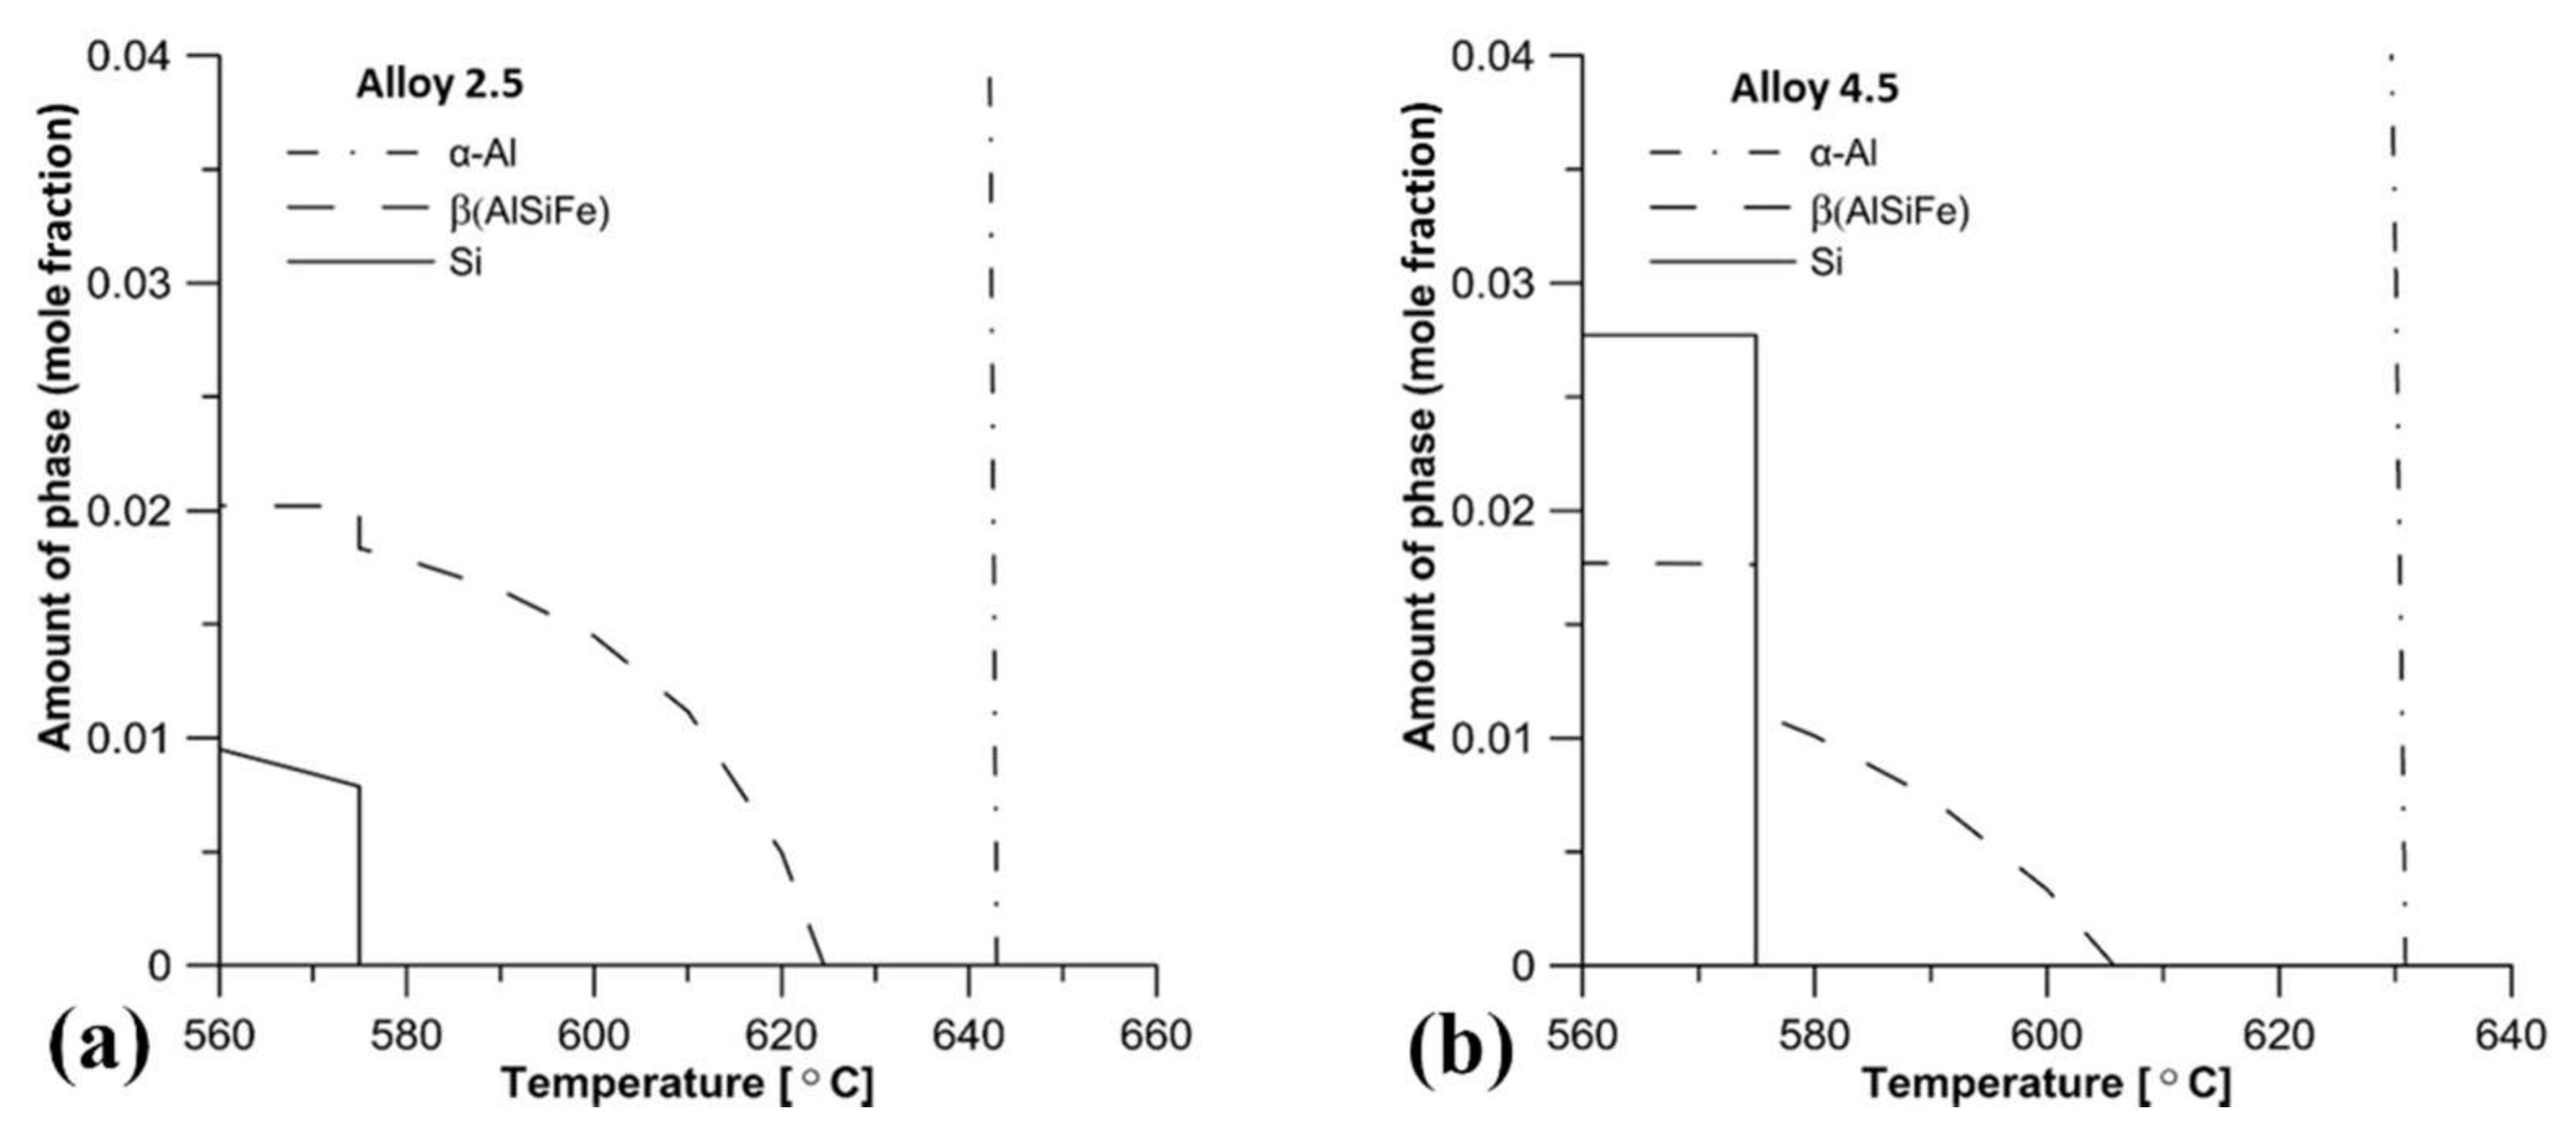
Generally, the microstructure of rheocast low silicon content aluminum alloys exhibit the presence of α-Al phase together with Al–Si eutectic mixture and some intermetallic particles [45]. Based on the presence of Fe in the two alloys (Table 1), and since its solubility in Al is very low [46], the presence of Fe-rich intermetallic particles is expected. The sequence of phase formation (aluminum phase and eutectic reaction) was calculated using ThermoCalcTM (2015b, Solna, Sweden, 2015) software [47,48]. The results are shown in Figure 2. As it is predicted by the thermodynamic model, the needle shape β-AlFeSi intermetallic particle was the most favored intermetallic phase for precipitation, and it is formed before the eutectic silicon.
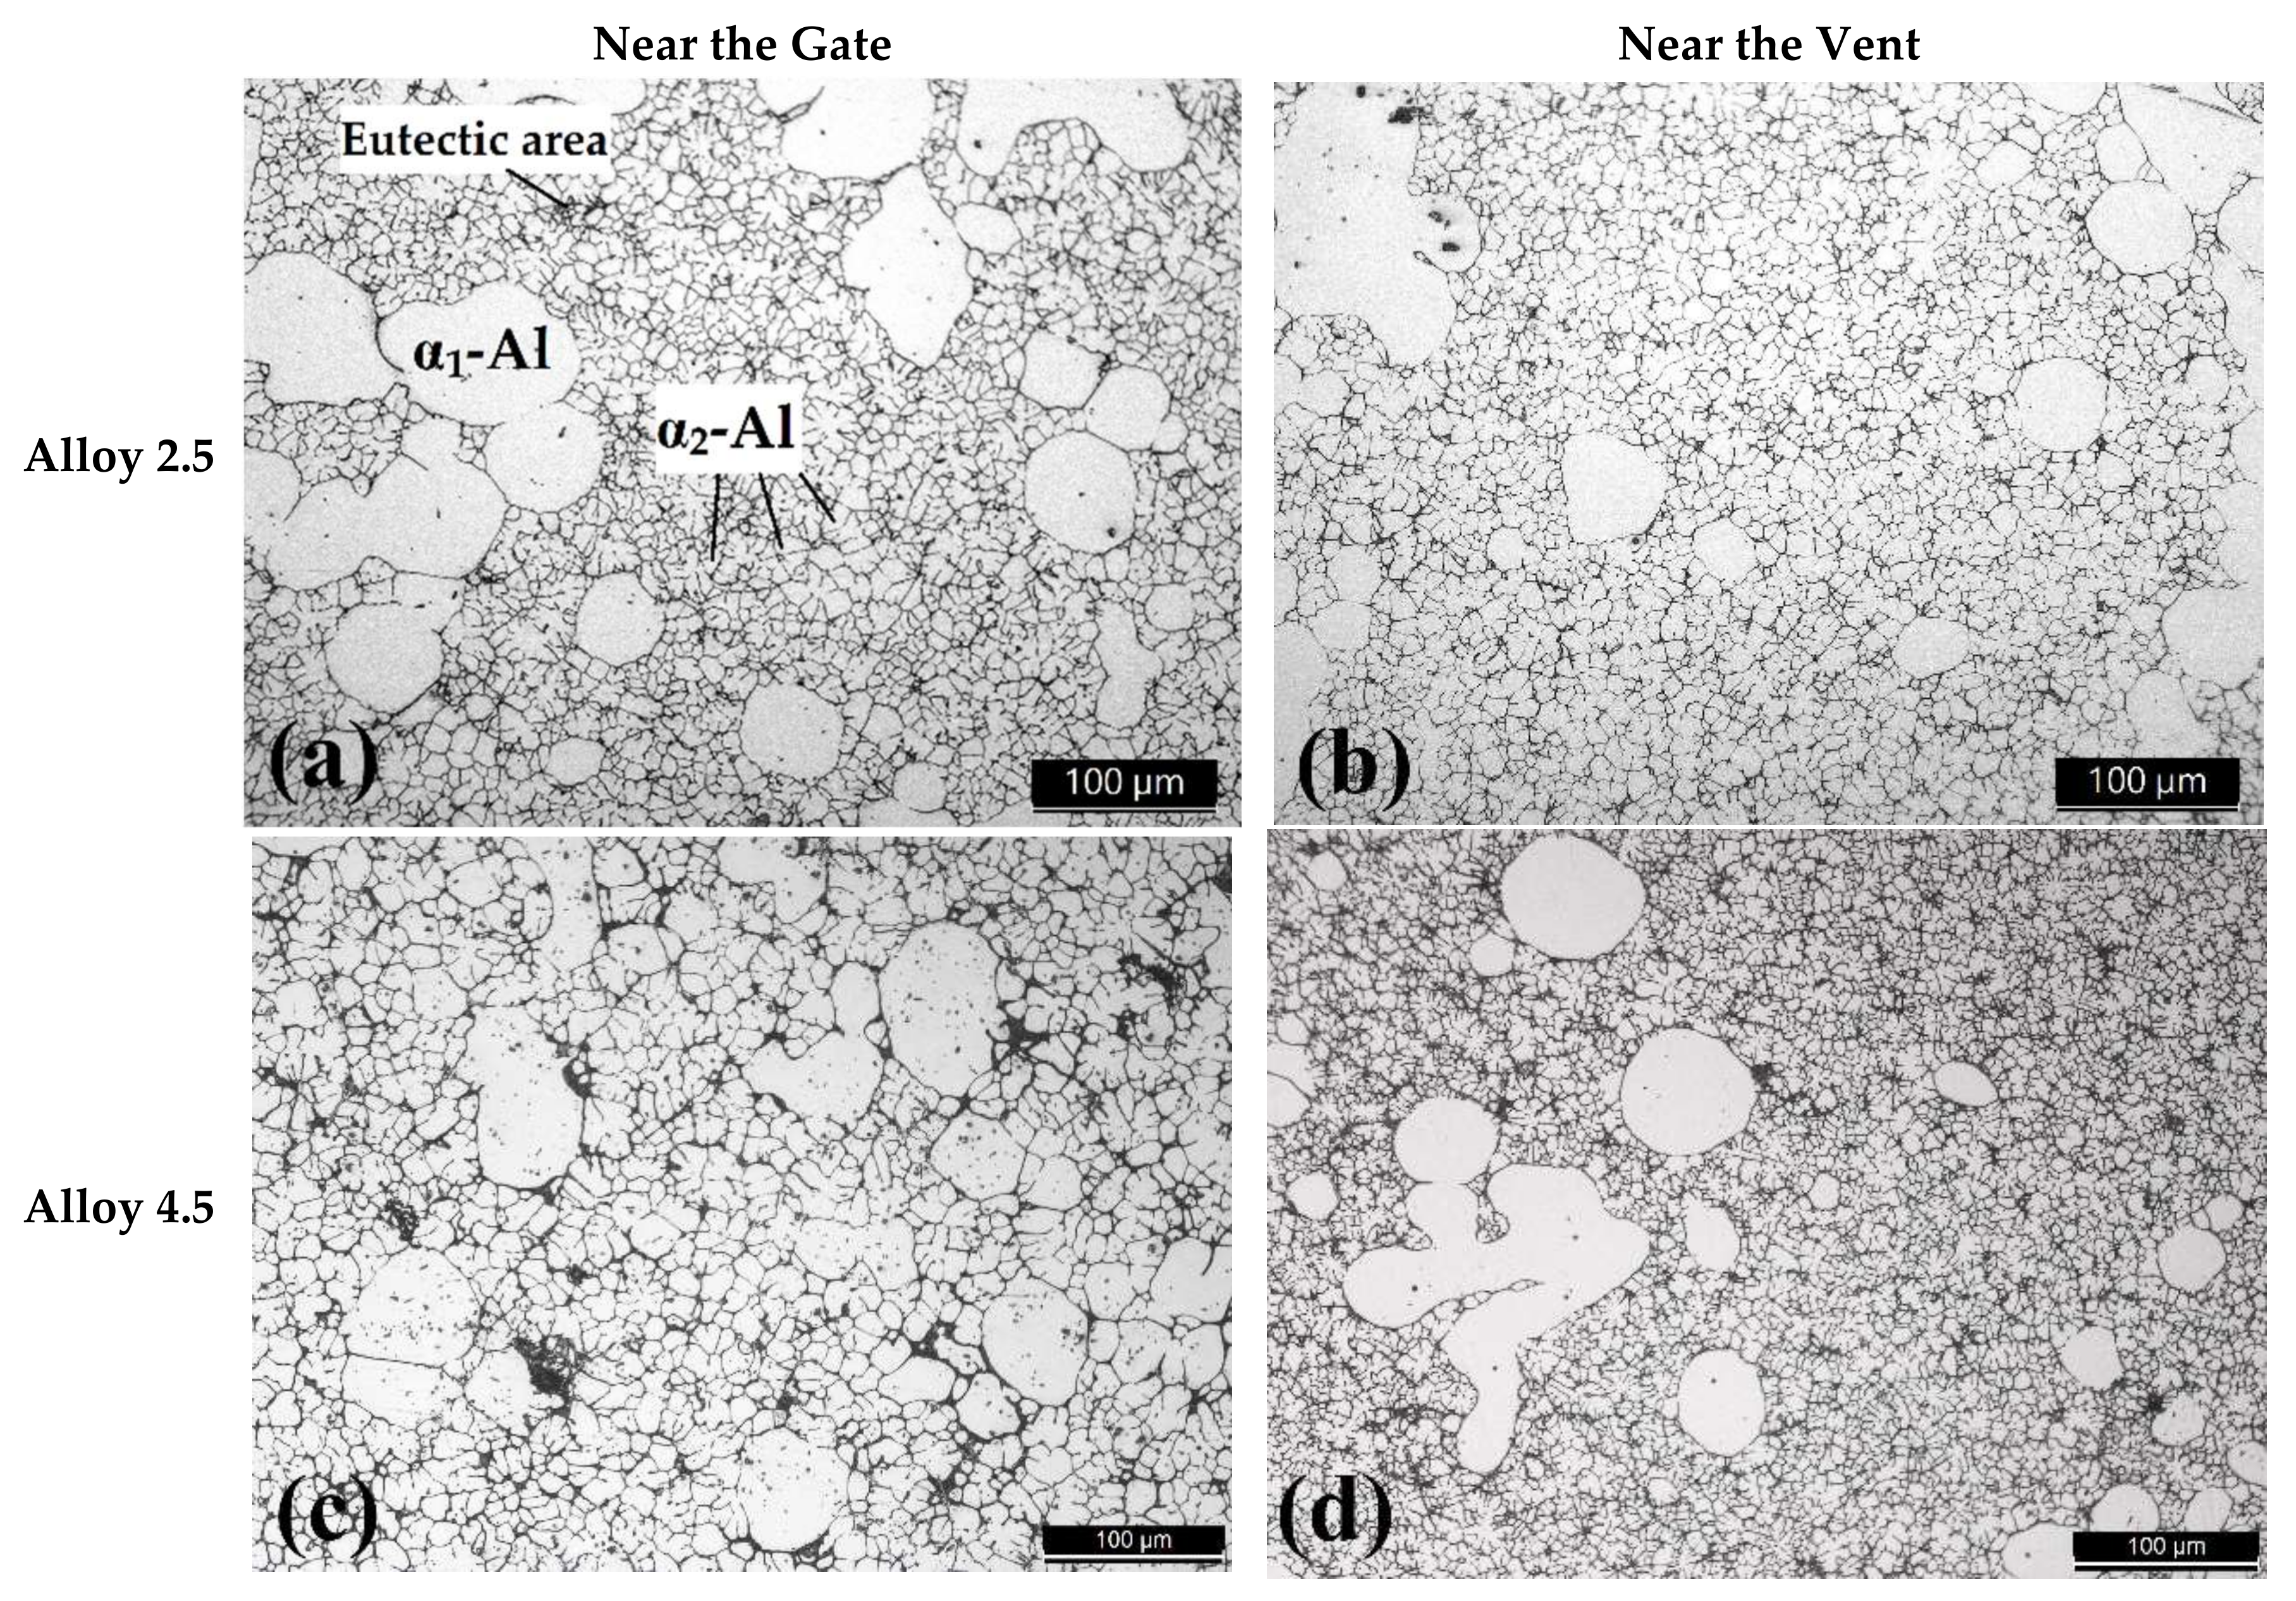
The microstructural features of the polished surfaces of thin walls from different positions in the cavity, with different percentage of silicon, are illustrated in LOM images in Figure 3. From microstructure images in Figure 3, two different range sizes of α-Al phase can be observed: a coarse globular α-Al phase (α1-Al) and a finer α-Al phase (α2-Al).
The formation of α1-Al and α2-Al is related to the multi-stage solidification in the semisolid metal process. α1-Al grains are nucleated in the ladle, under shear forces, due to stirring at a higher temperature due to contact with the EEM and form the slurry, while α2-Al grains are mostly formed in the solidification stage inside the die, at a higher cooling rate [49].
Regarding the effect of the position, the microstructure near the gate (Figure 3a,c) consists of a higher amount of α1-Al particles compared to the region near to the vent (Figure 3b,d). However, this difference is not significant in alloy 2.5.
This microstructure heterogeneity is attributed to the distribution among the die of the liquid and solid fraction of the slurry during the injection stage: the liquid part squeezes out and leaves the solid fraction behind near to the gate. Easton et al. [50] show this behavior in a SSM-HPDC component and defined this type of separation of the slurry as sponge effect.
α2-Al particles in thin wall samples (of both alloys) are finer near the vent in comparison to the region near the gate, due to the higher undercooling in this region of the cavity. This effect is more evident for alloy 4.5. It seems that by increasing the amount of silicon, aluminum phase is refined by undercooling, which can be due to more nucleation of the eutectic silicon [51].
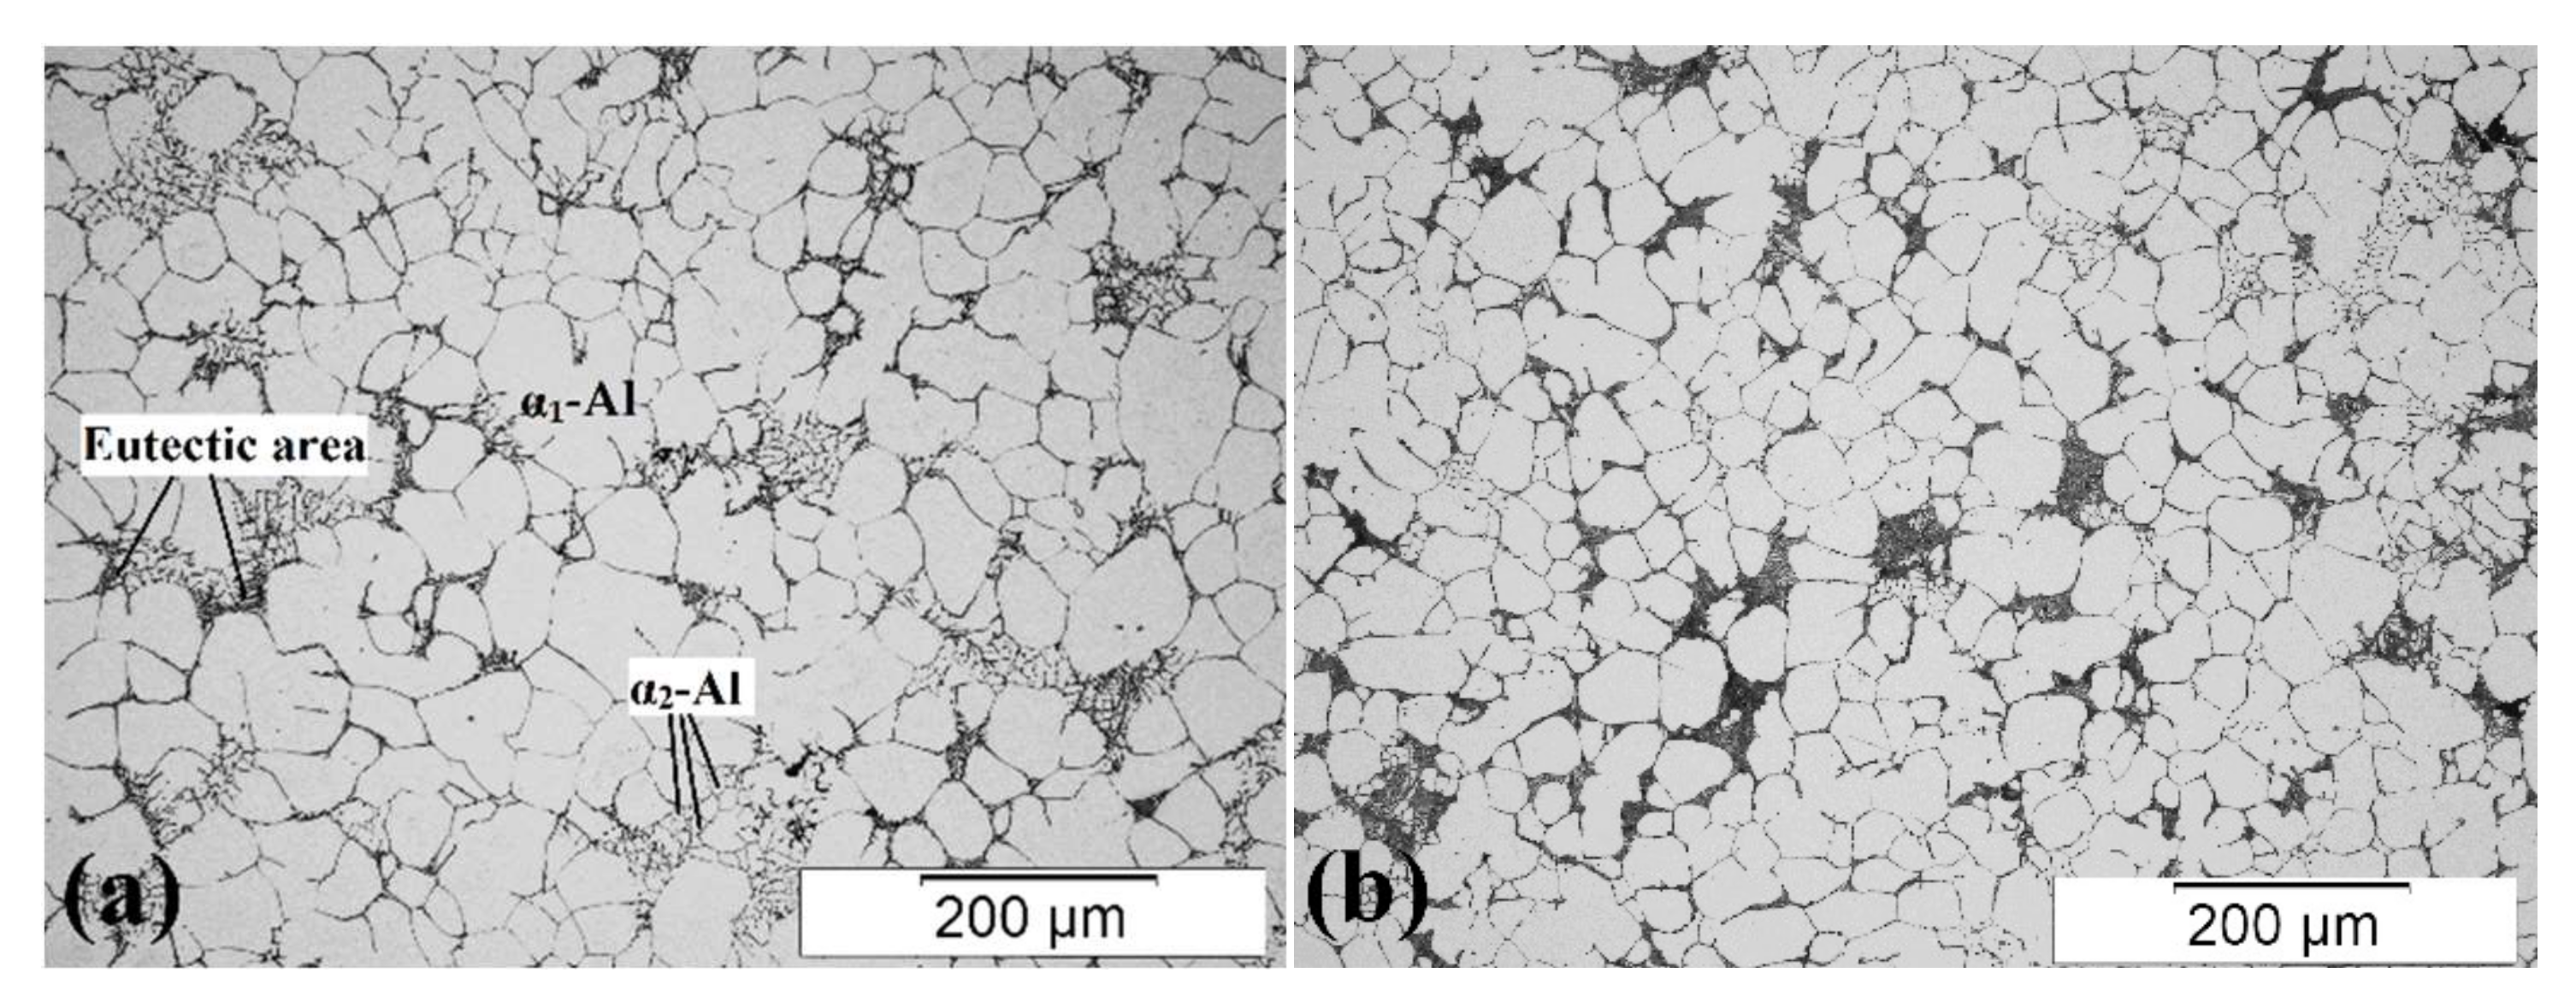
LOM images of sample 2.5 RGB and 4.5 RGB from the thick plate are presented in Figure 4. In comparison to the microstructure of thin walls, the bulk microstructure contains more α1-Al particles in both of the alloys, which is expected. In fact, due to the high viscosity of semisolid slurry, thin walls are mostly filled by liquid, while the relatively thicker parts are filled by the solid fraction of the slurry [15].
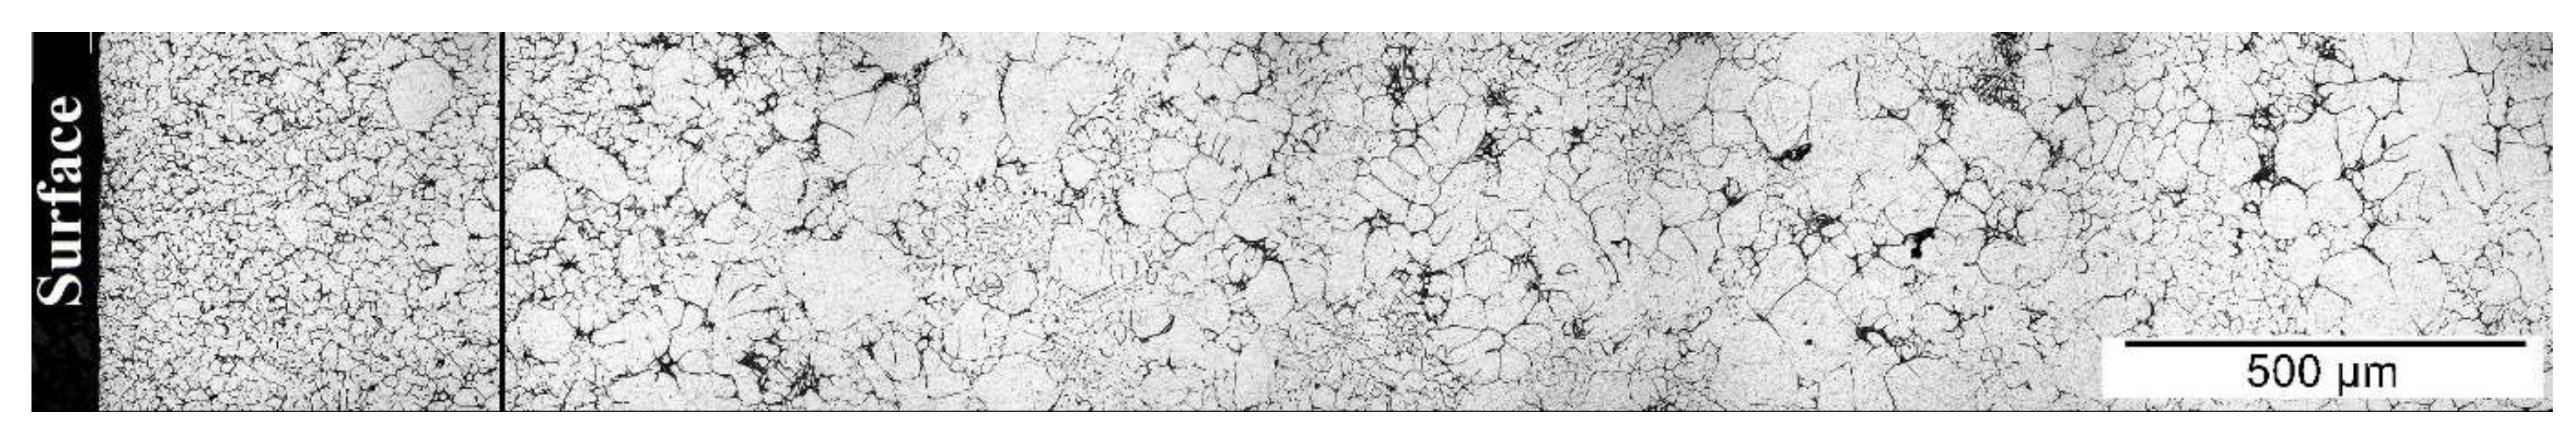
LOM image of cross-section of the thick plate of Alloy 2.5 in the region near the gate is reported in Figure 5. On the surface, there is a segregation of the liquid fraction to the surface and α1-Al solid fraction, which tend to aggregate in the center of samples. This phenomenon is considered as transverse macrosegregation. Three different phenomena lead to transverse macrosegregation: skin effect [12], sponge effect [13,50] and shearing band during melt flow that lead to porosity or eutectic-rich segregation band [52]. Study of transverse macrosegregation in different positions of the same Rheo-HPDC component performed by Payandeh et al. [53] showed that the thickness of the surface segregation layer increases by increasing the liquid faction. Govender et al. [54] also reported the existence of a surface layer consisting of mainly liquid or eutectic phase in SSM-HPDC A356 Alloy.
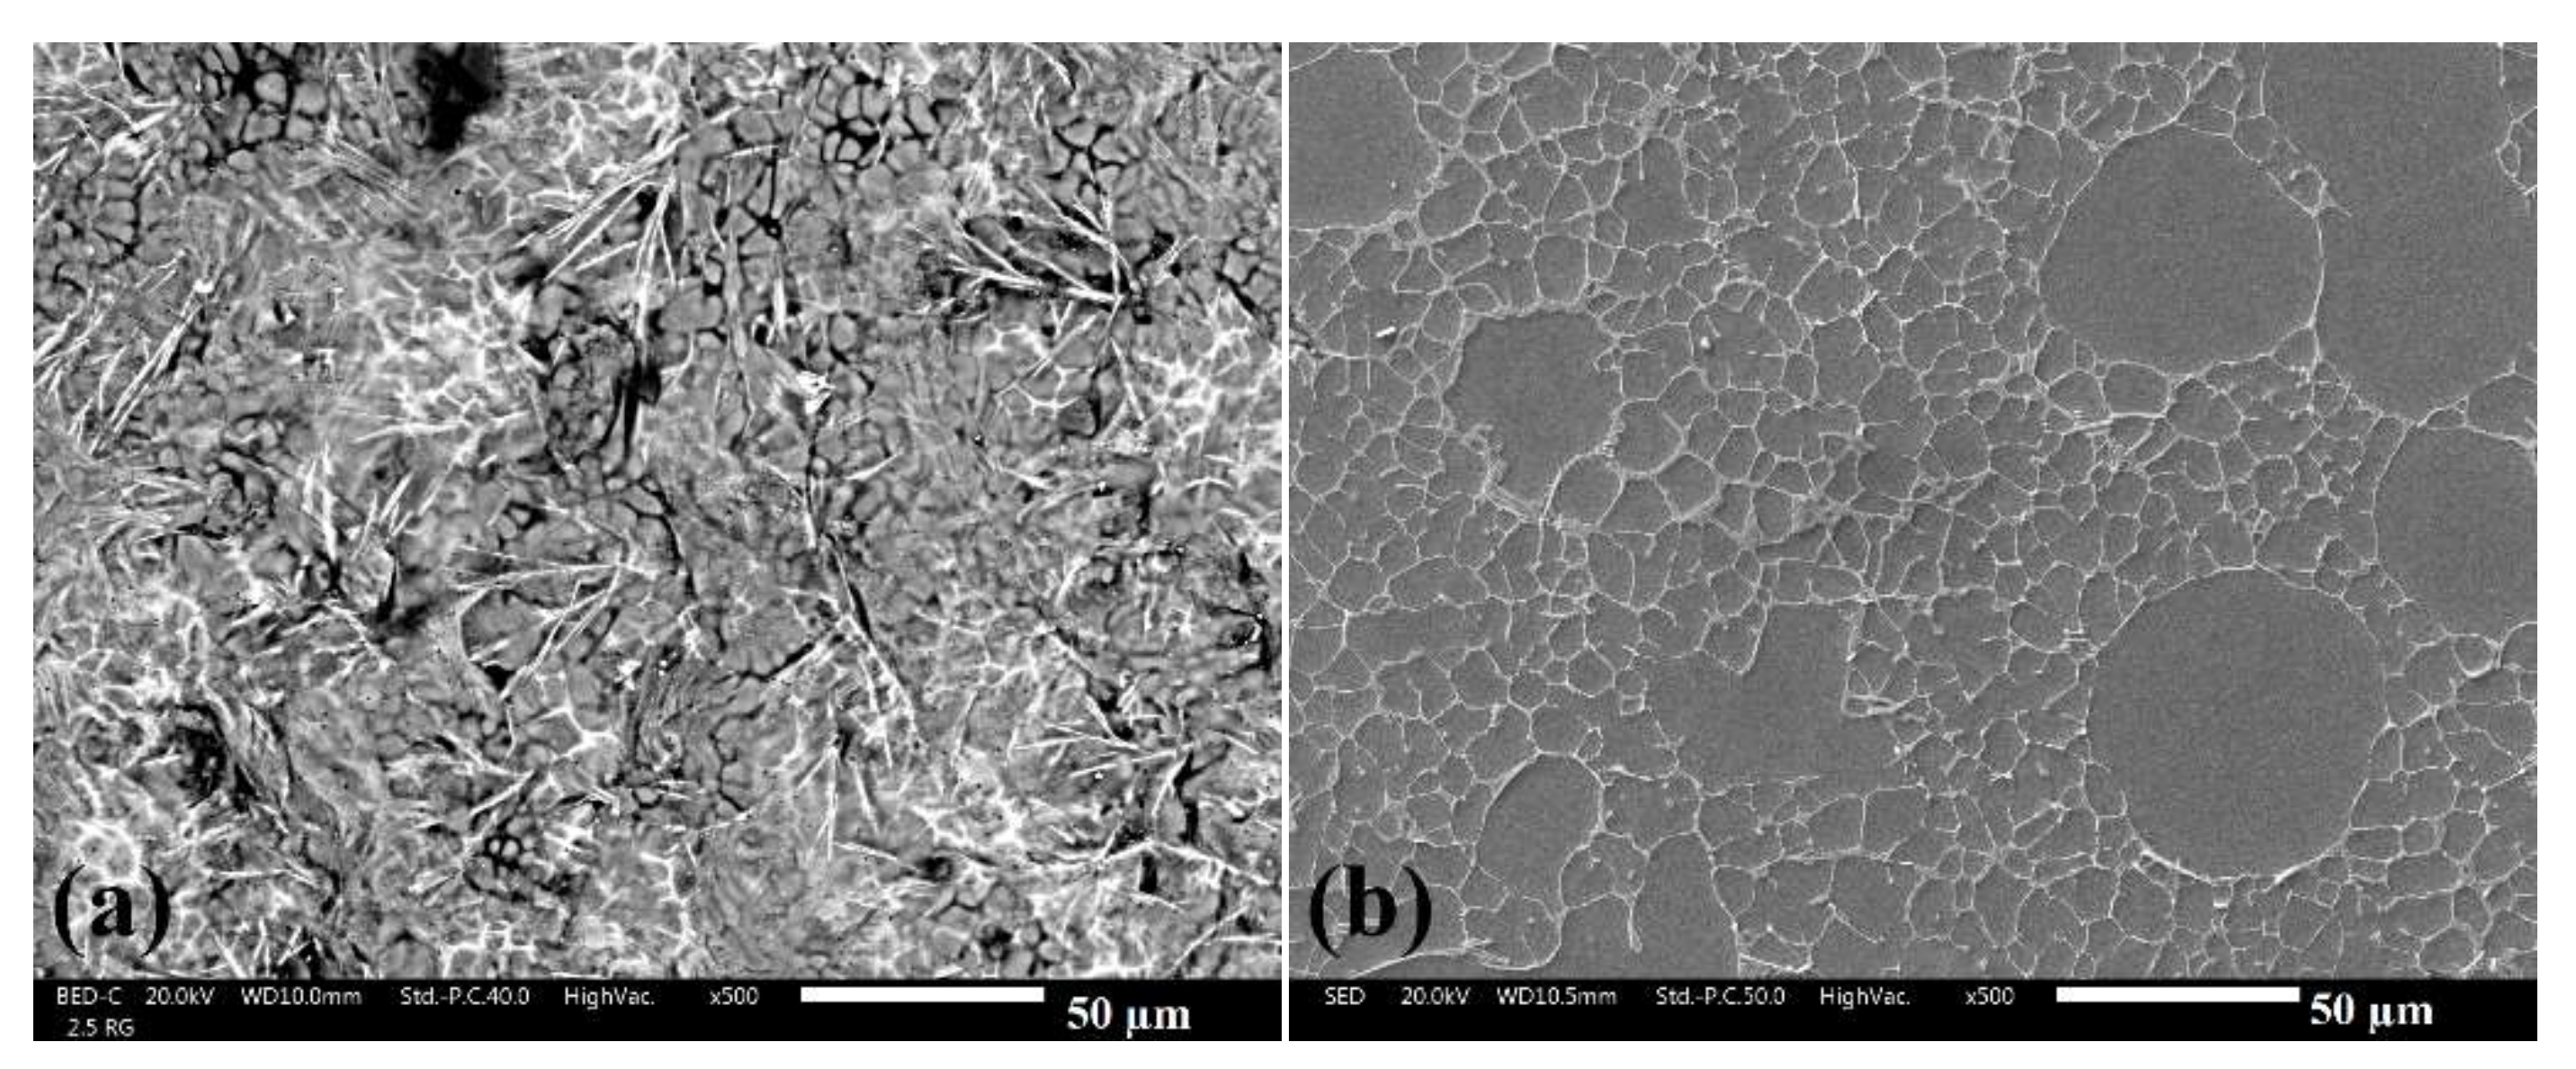
Figure 6 compares the as-cast and polished surfaces of sample 2.5RG/P of the thin wall section. It is noticeable how the as-cast surface is enriched with eutectic phase and intermetallic particles. Moreover, localized defects, such as porosities and/or voids among the grains and inclusions, are visible.
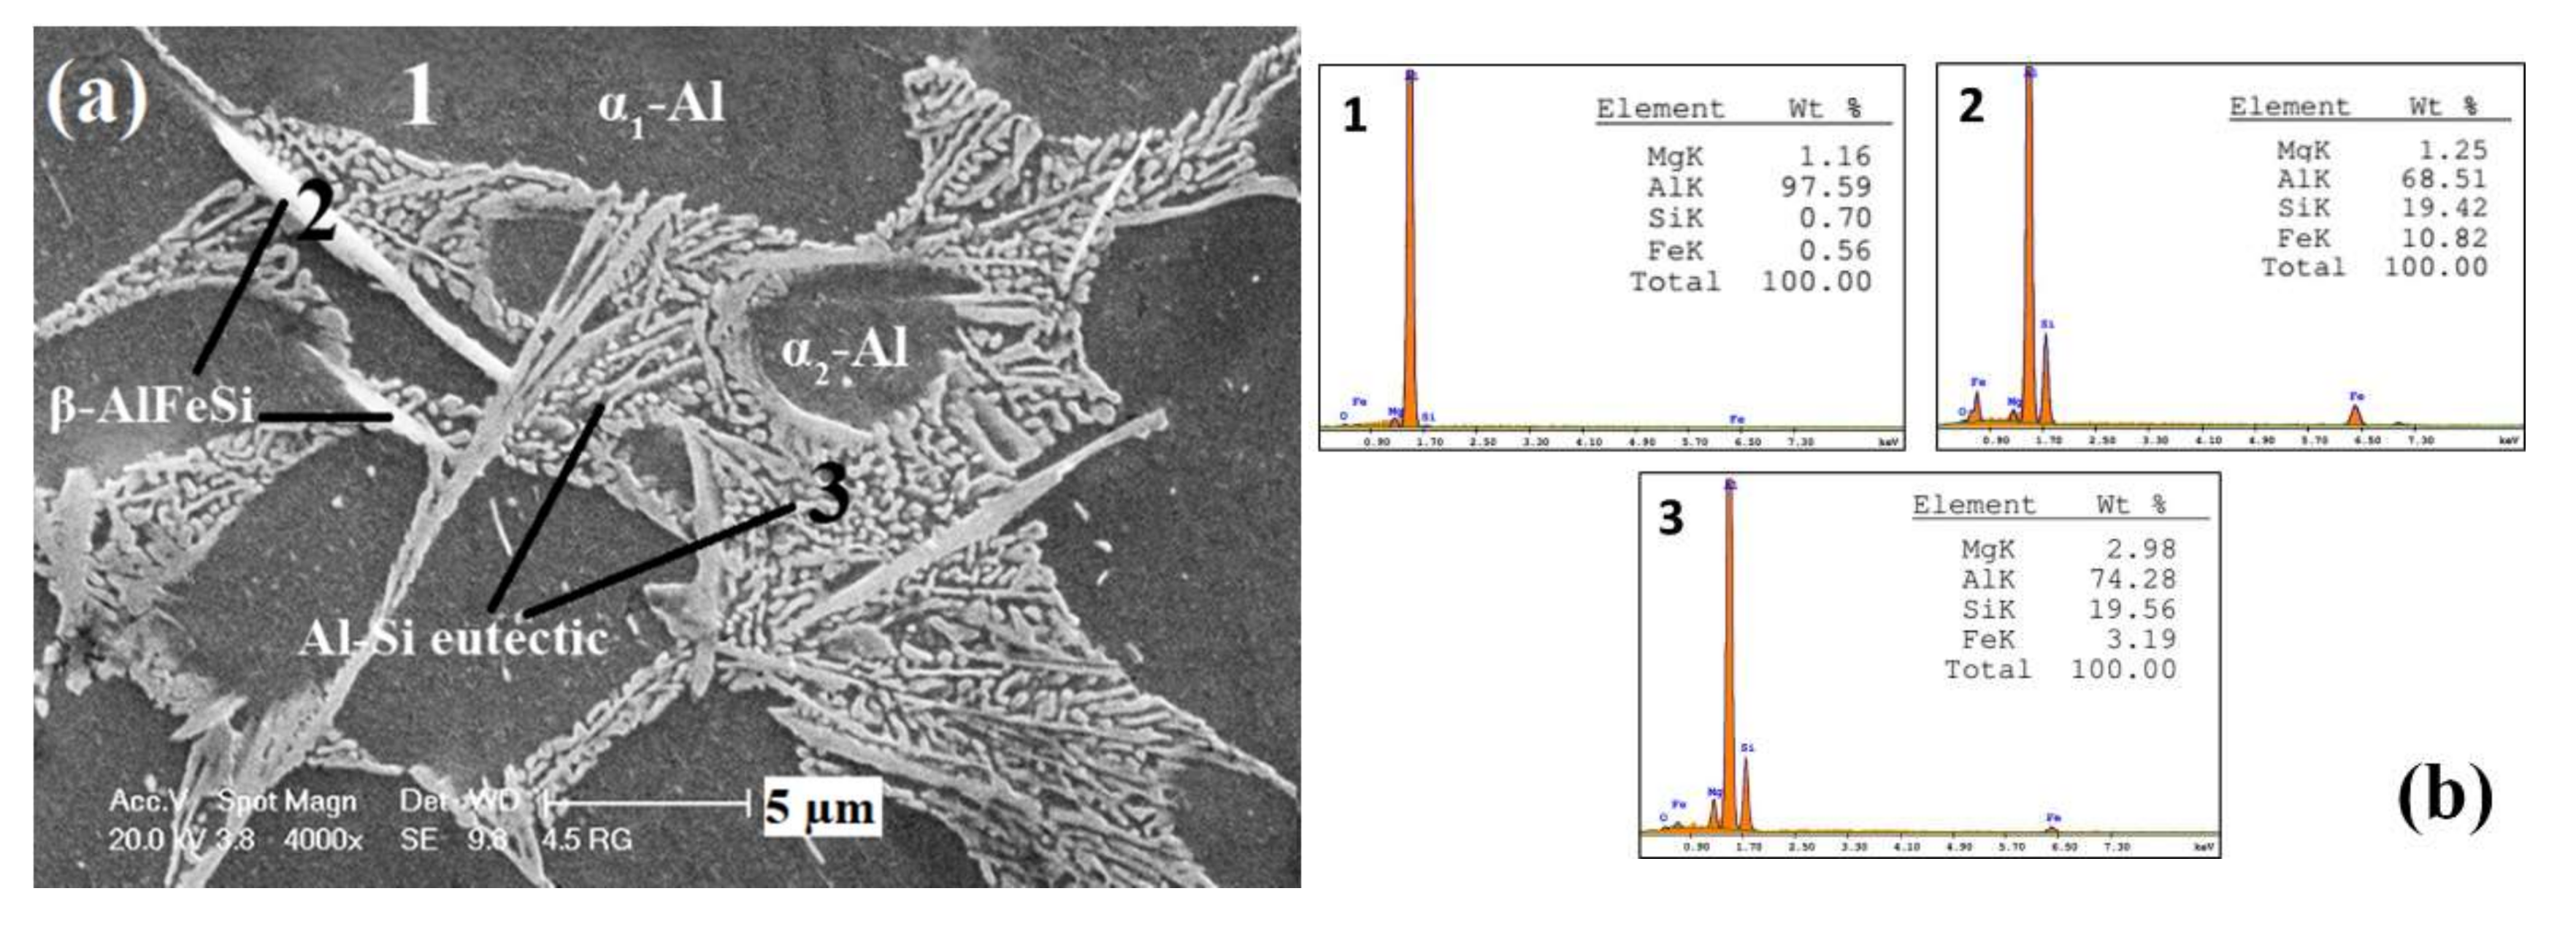
SEM image of sample 4.5 RGP at higher magnification in Figure 7a depicts the microstructure of the eutectic and the intermetallic particles. The Si particles have a flake shape and form a continuous network [55].
According to the EDS results in Figure 7b, in this figure, intermetallic particles are rich in iron, and as is expected in hypoeutectic alloys, the intermetallic particles are β-AlFeSi. These intermetallic particles usually have a needle shape [34], and a platelet morphology in 3D tomographic volume [56].
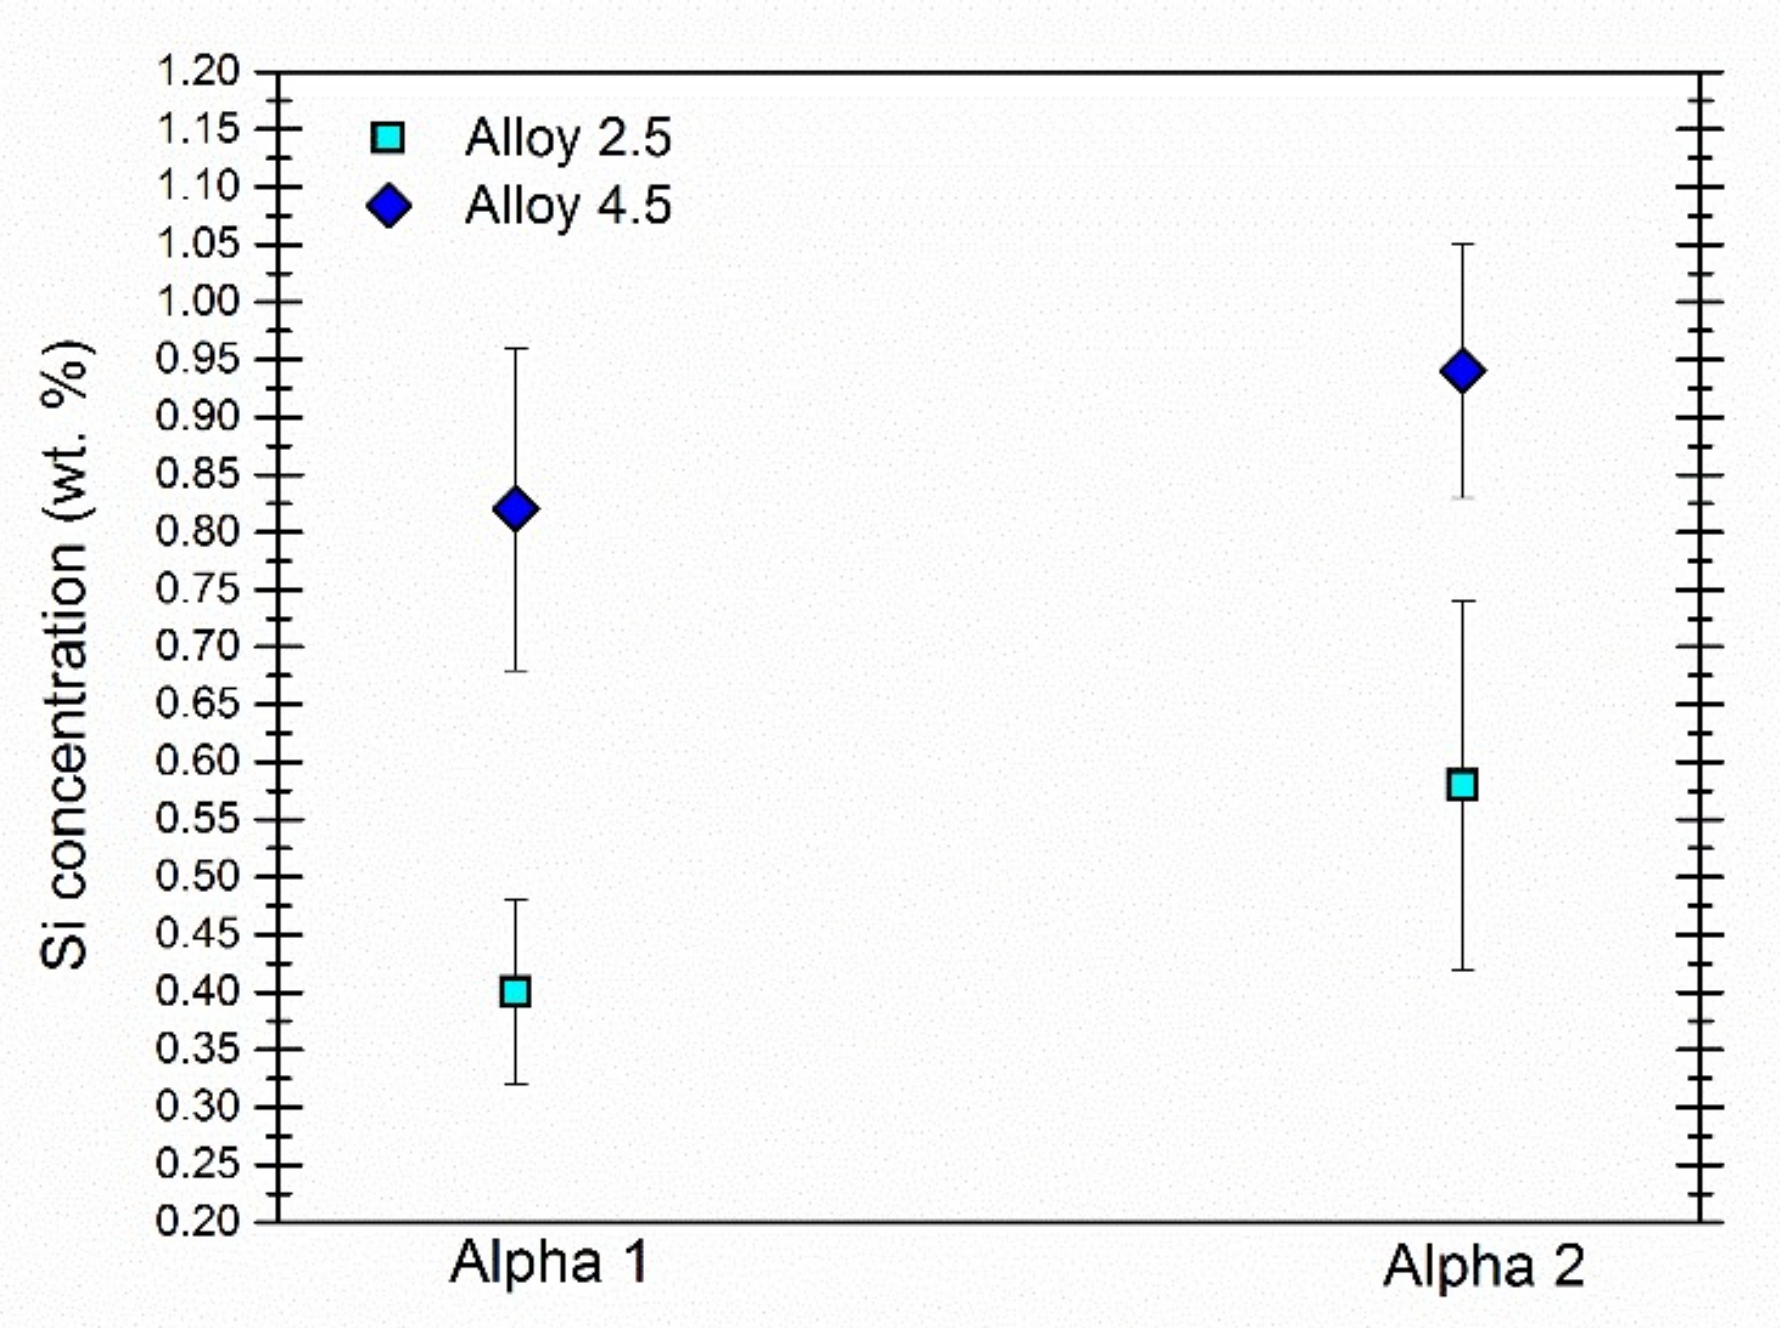
Figure 8 represents the concentration of silicon at the center of α1-Al and α2-Al grains in alloys 2.5 and 4.5. α2-Al particles, nucleated from the liquid portion of the slurry [57], have higher amounts of silicon, which leads to smaller potential differences between them and the silicon eutectic phase and/or iron-rich intermetallic particles, and results in less severe corrosion [34].
3.2. Corrosion Studies
3.2.1. Potentiodynamic Polarization Curves
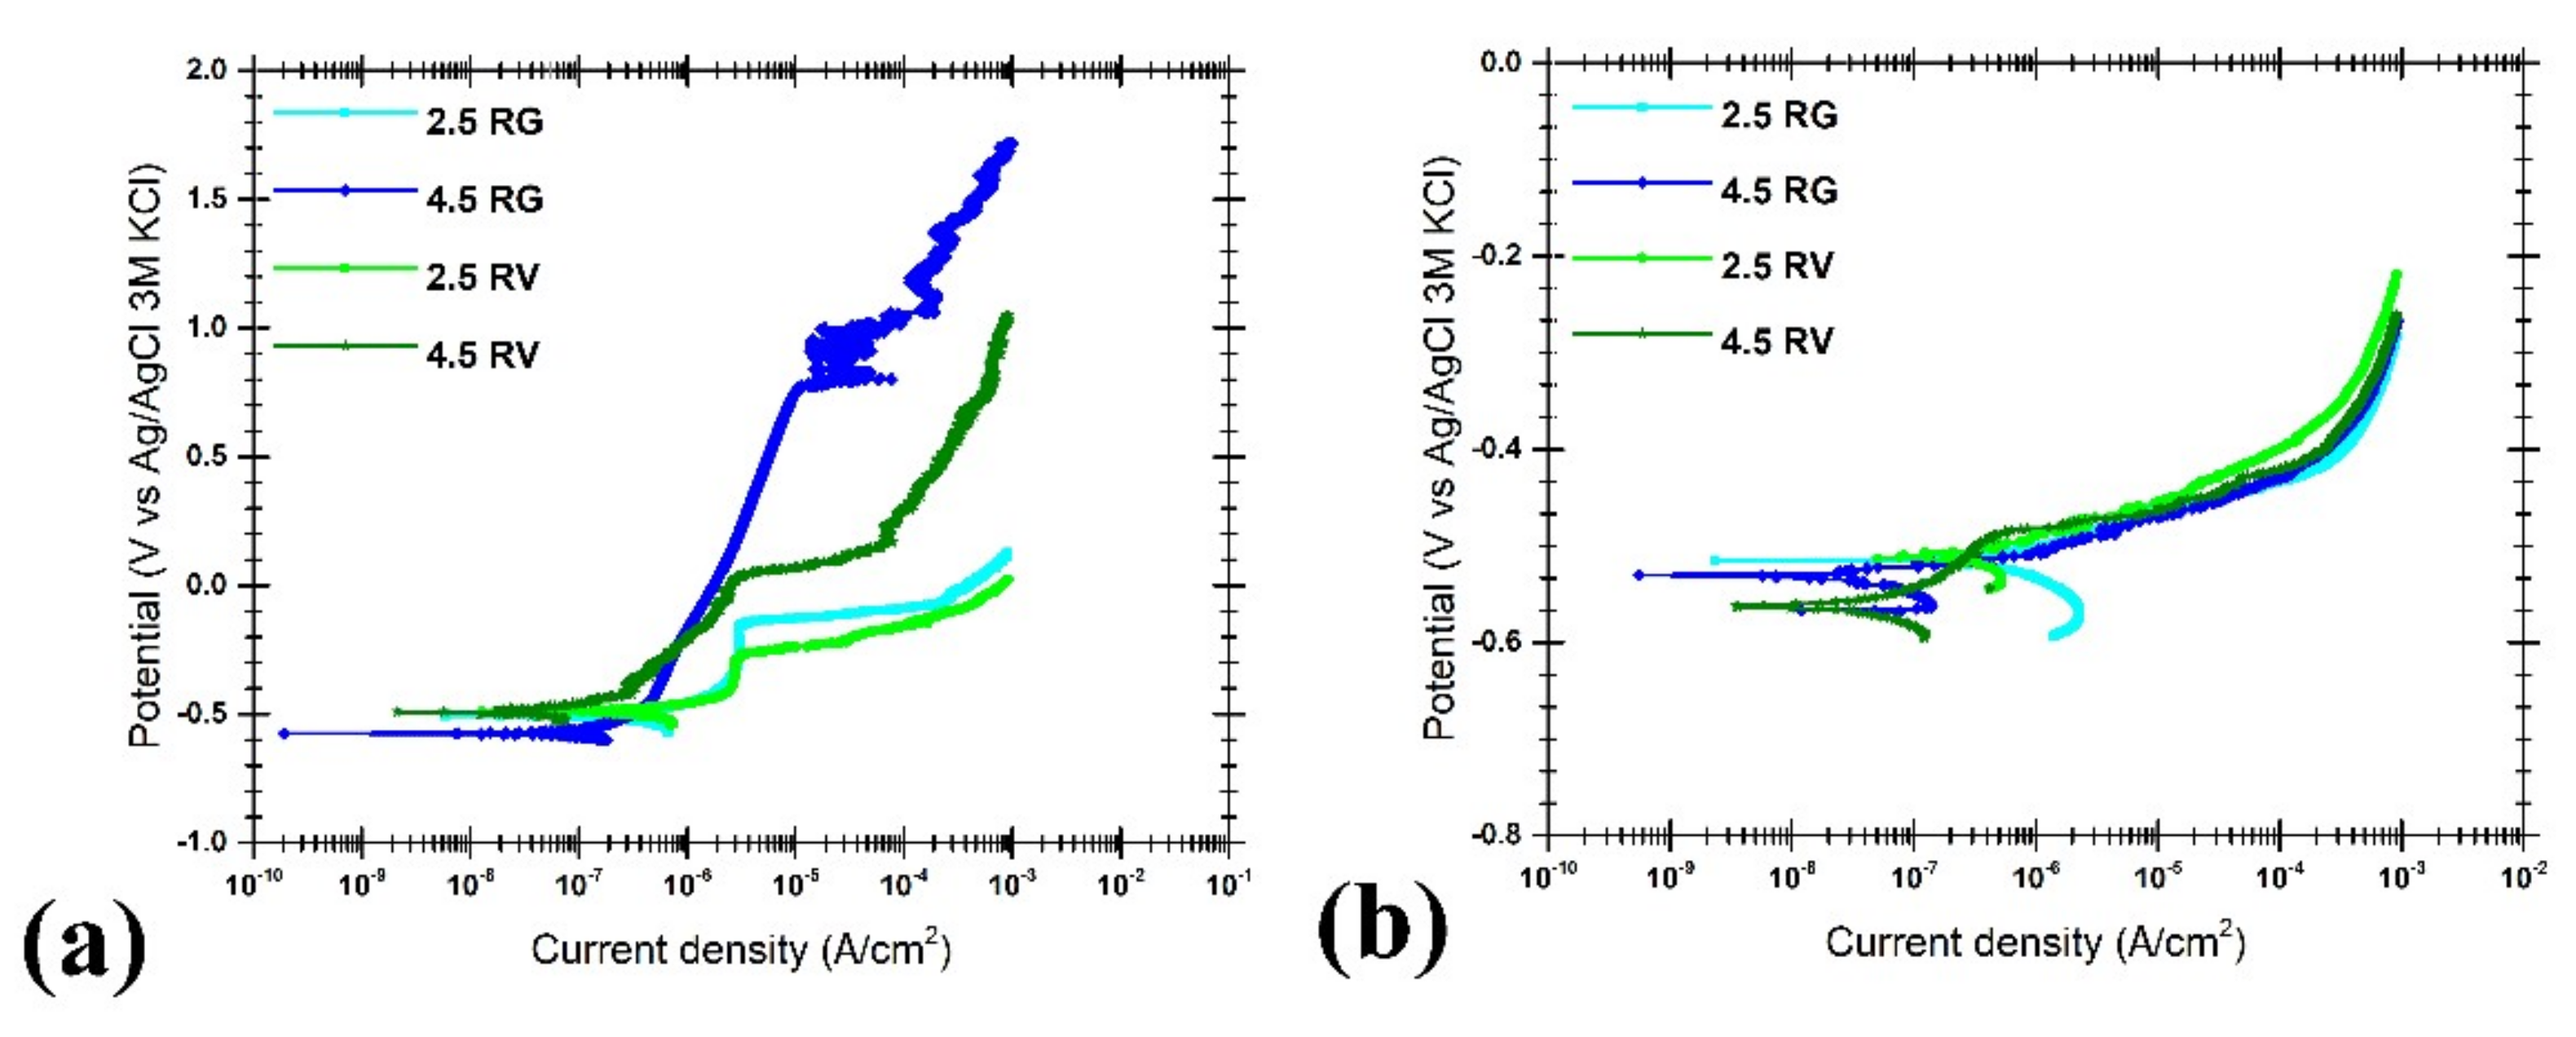
Potentiodynamic polarization curves of as-cast surface of the thin wall samples (2.5 RG, 2.5 RV, 4.5 RG, and 4.5 RV) in the diluted Harrison solution and in the solution of 3.5 g/L (NH4)2SO4 are reported in Figure 9.
In both of the solutions, values of corrosion potential are similar for different samples regardless of the position and the silicon content. Regarding the effect of the position, samples from near the gate (2.5 RG and 4.5 RG) possess higher pitting potentials, in the solution of 3.5 g/L (NH4)2SO4, compared to the samples taken from near the vent (2.5 RV and 4.5 RV). In the diluted Harrison solution, all of the samples (except for 4.5 RV) show pitting from the OCP, which is due to the chloride ions and the higher amount of iron-rich intermetallic particles, as well as the defective condition of the as-cast surfaces.
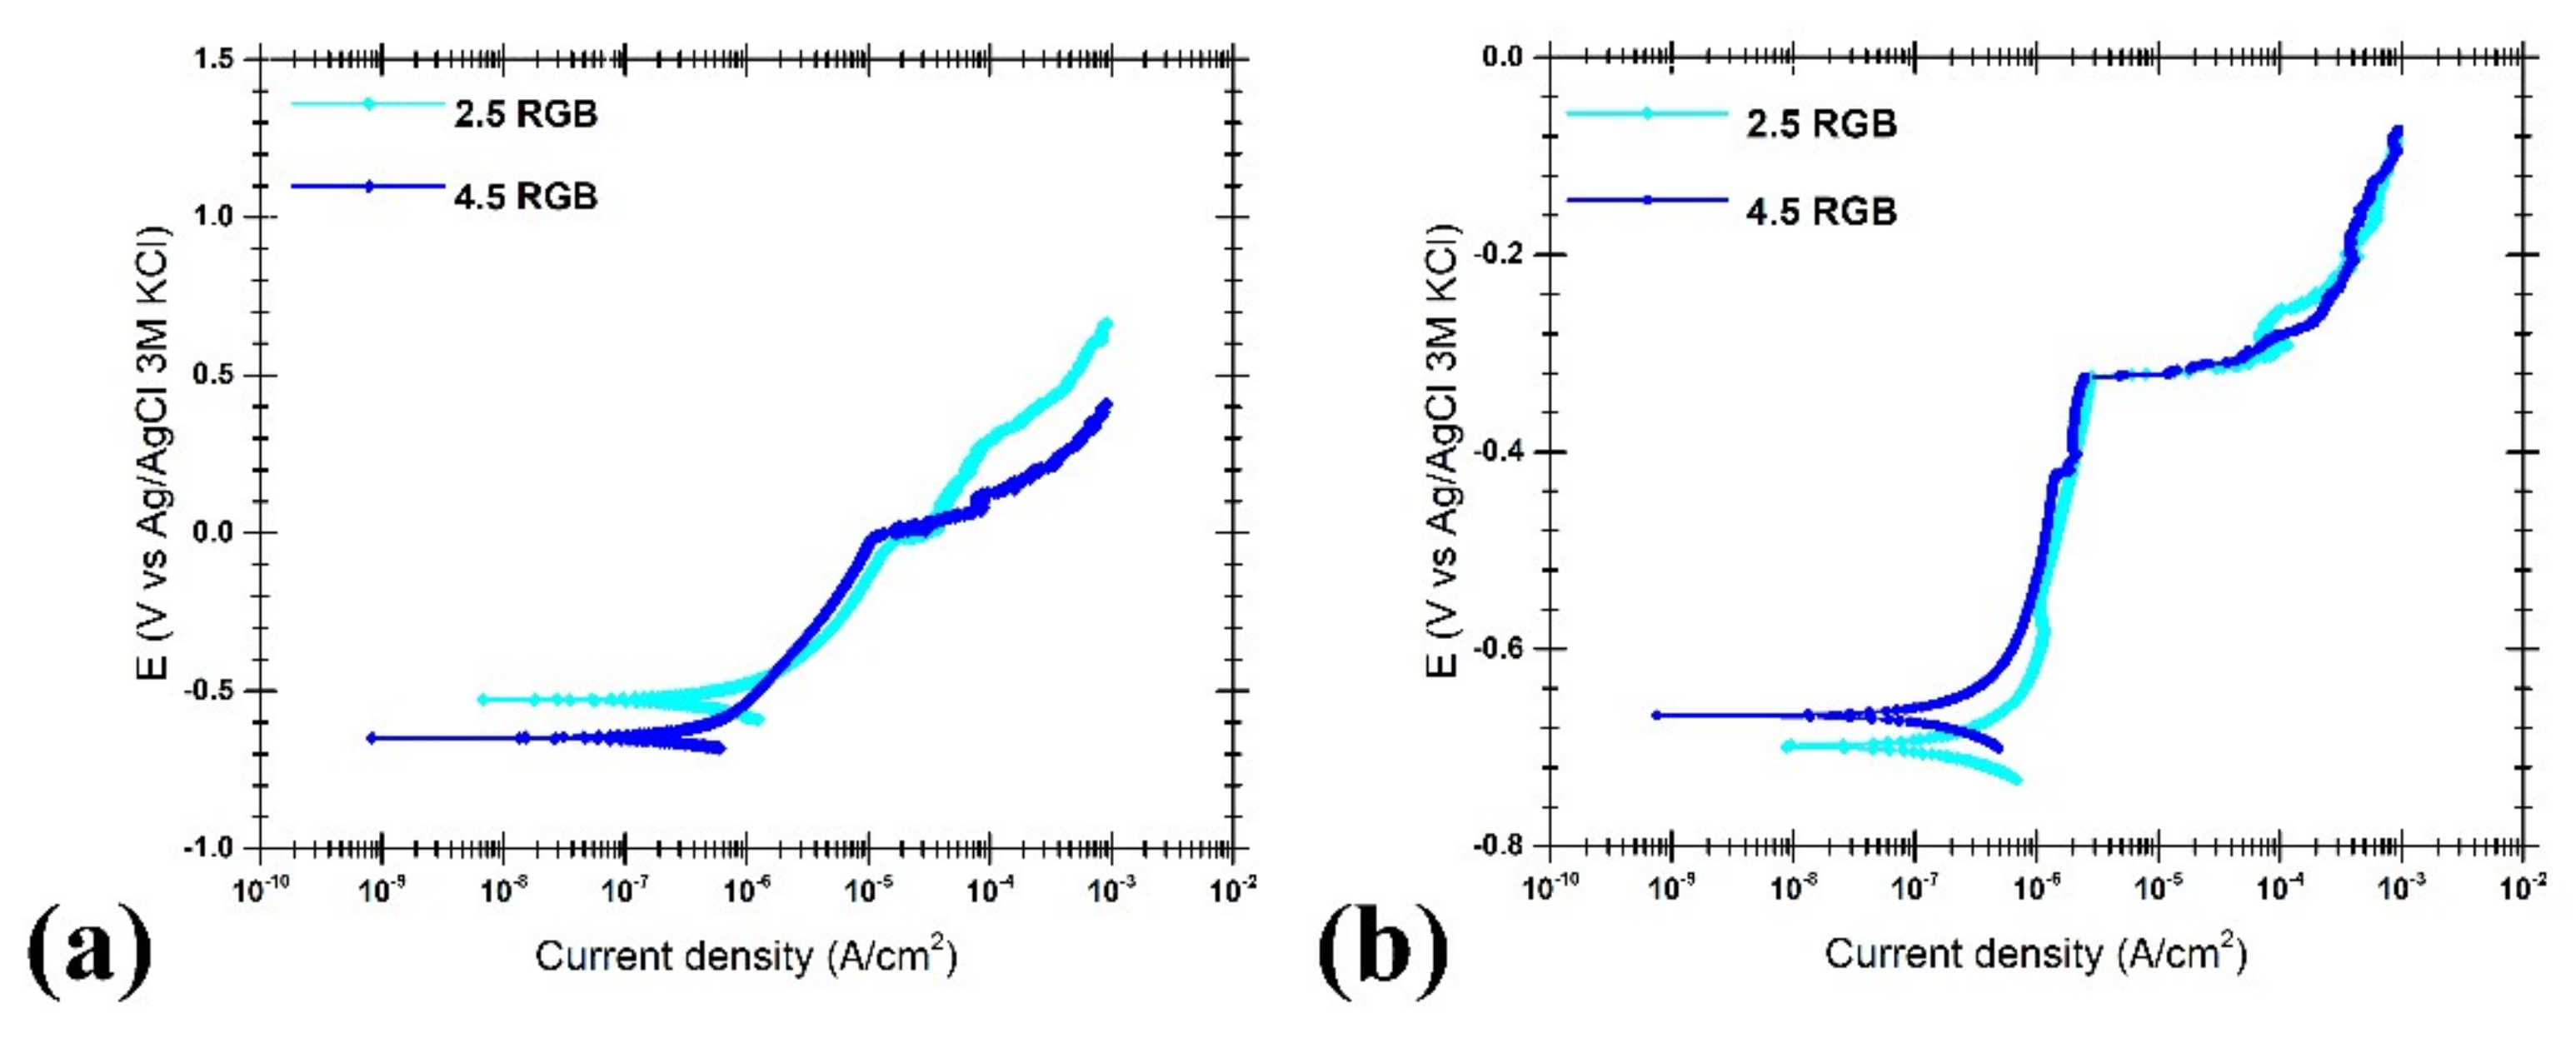
Considering the bulk microstructure, the results of potentiodynamic polarization test in the diluted Harrison solution and in the solution of 3.5 g/L (NH4)2SO4, of samples of 2.5 RGB and 4.5 RGB, are presented in Figure 10. In both of the solutions, the corrosion potentials of the two samples shows no significant difference.
The stability of the passive oxide layer is higher for the bulk samples compared to the as-cast surface, especially in the chloride containing solution. This is due to the surface condition, since the bulk samples have higher α1-Al fraction, less eutectic fraction, and are ground while the thin wall samples are tested in as-cast condition.
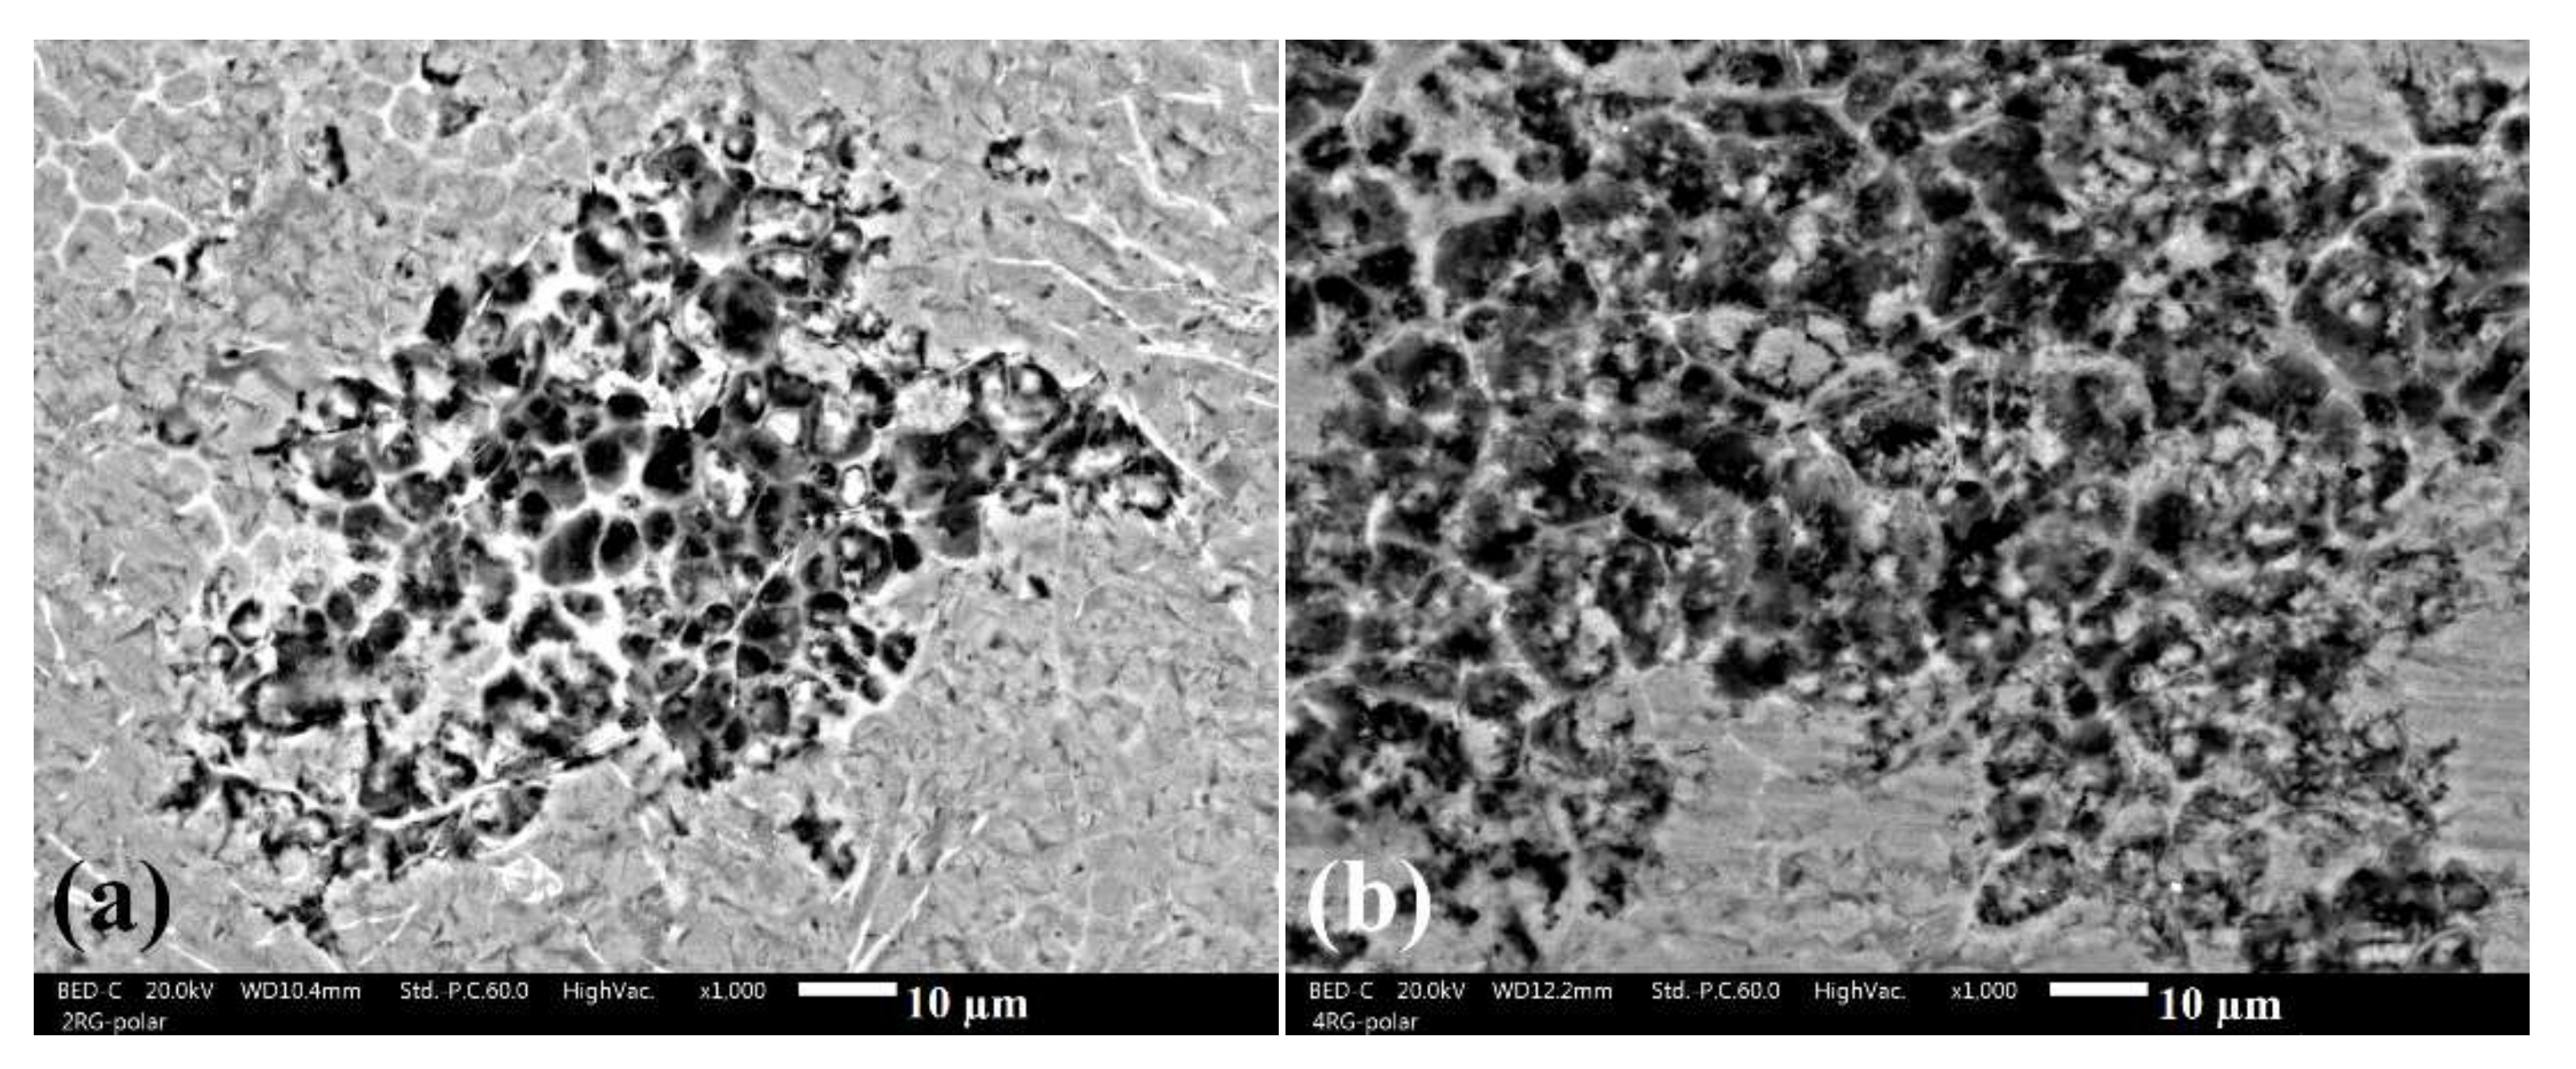
SEM images of the corroded surfaces of samples 2.5 RG and 4.5 RG after the polarization test in the diluted Harrison solution are presented in Figure 11. For both samples, corrosion is localized, and a galvanic couple between the eutectic silicon phase and/or iron-rich intermetallic particles and aluminum matrix can be observed.
3.2.2. Electrochemical Impedance Spectroscopy
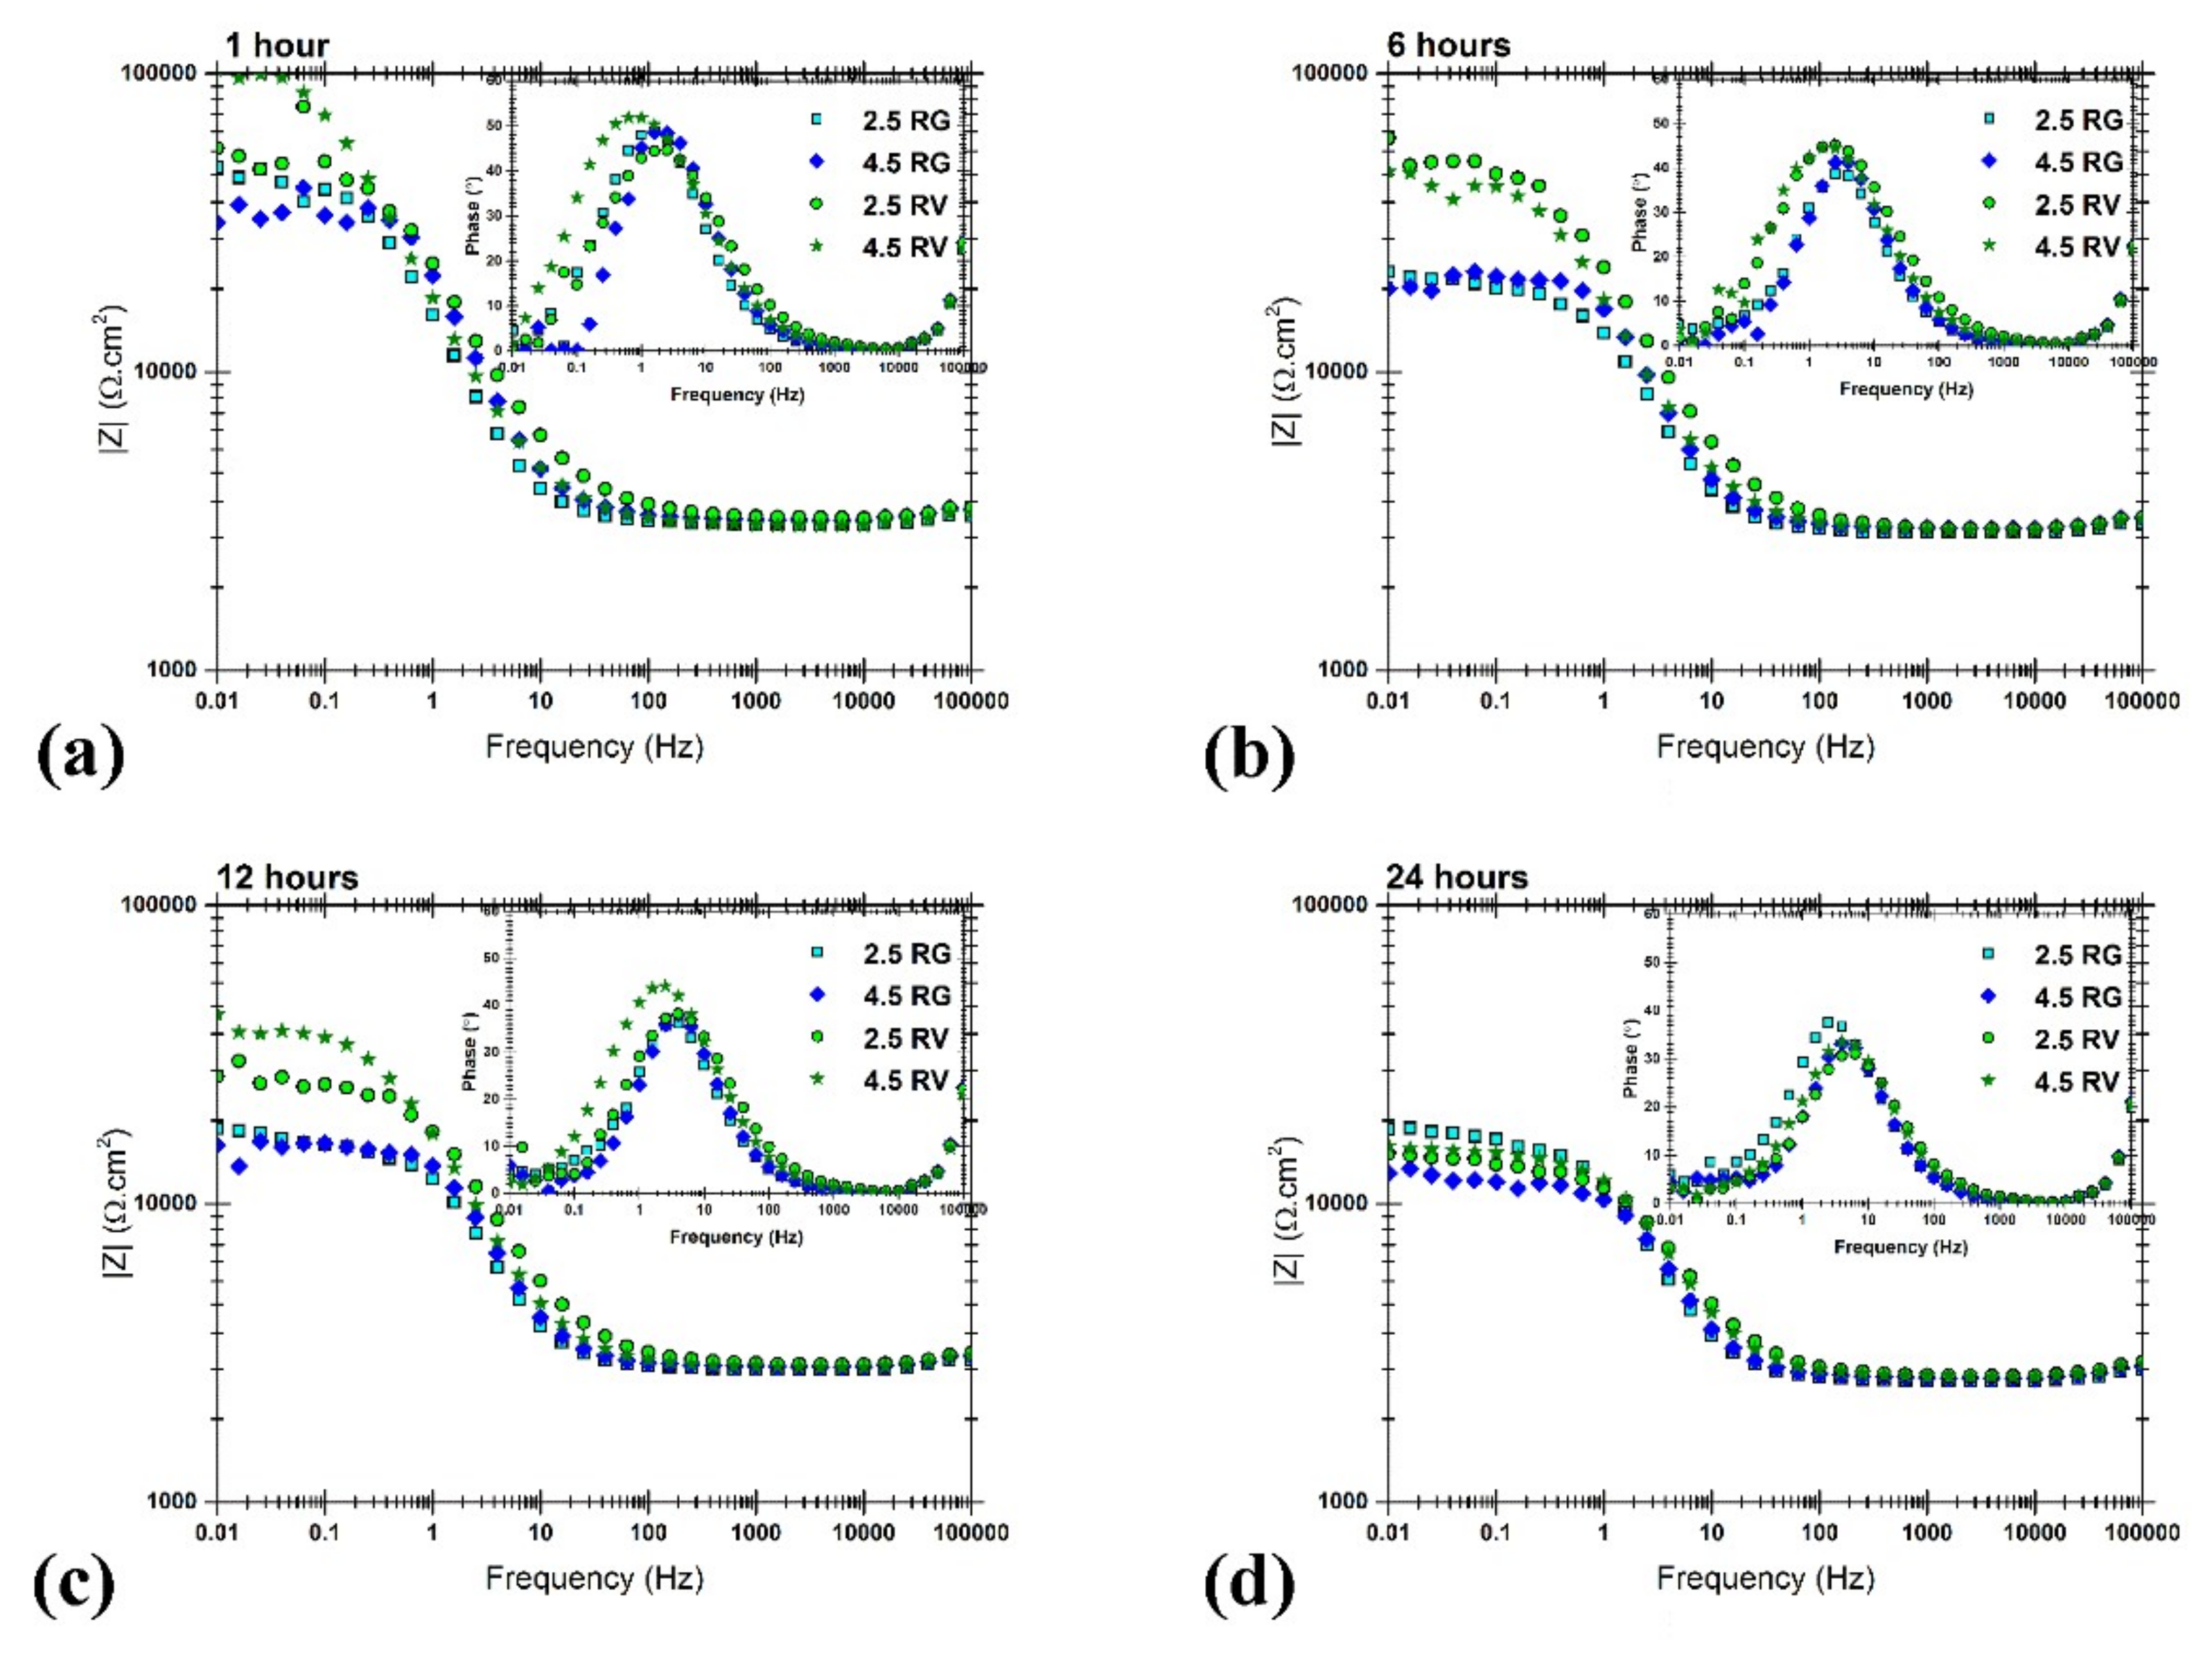
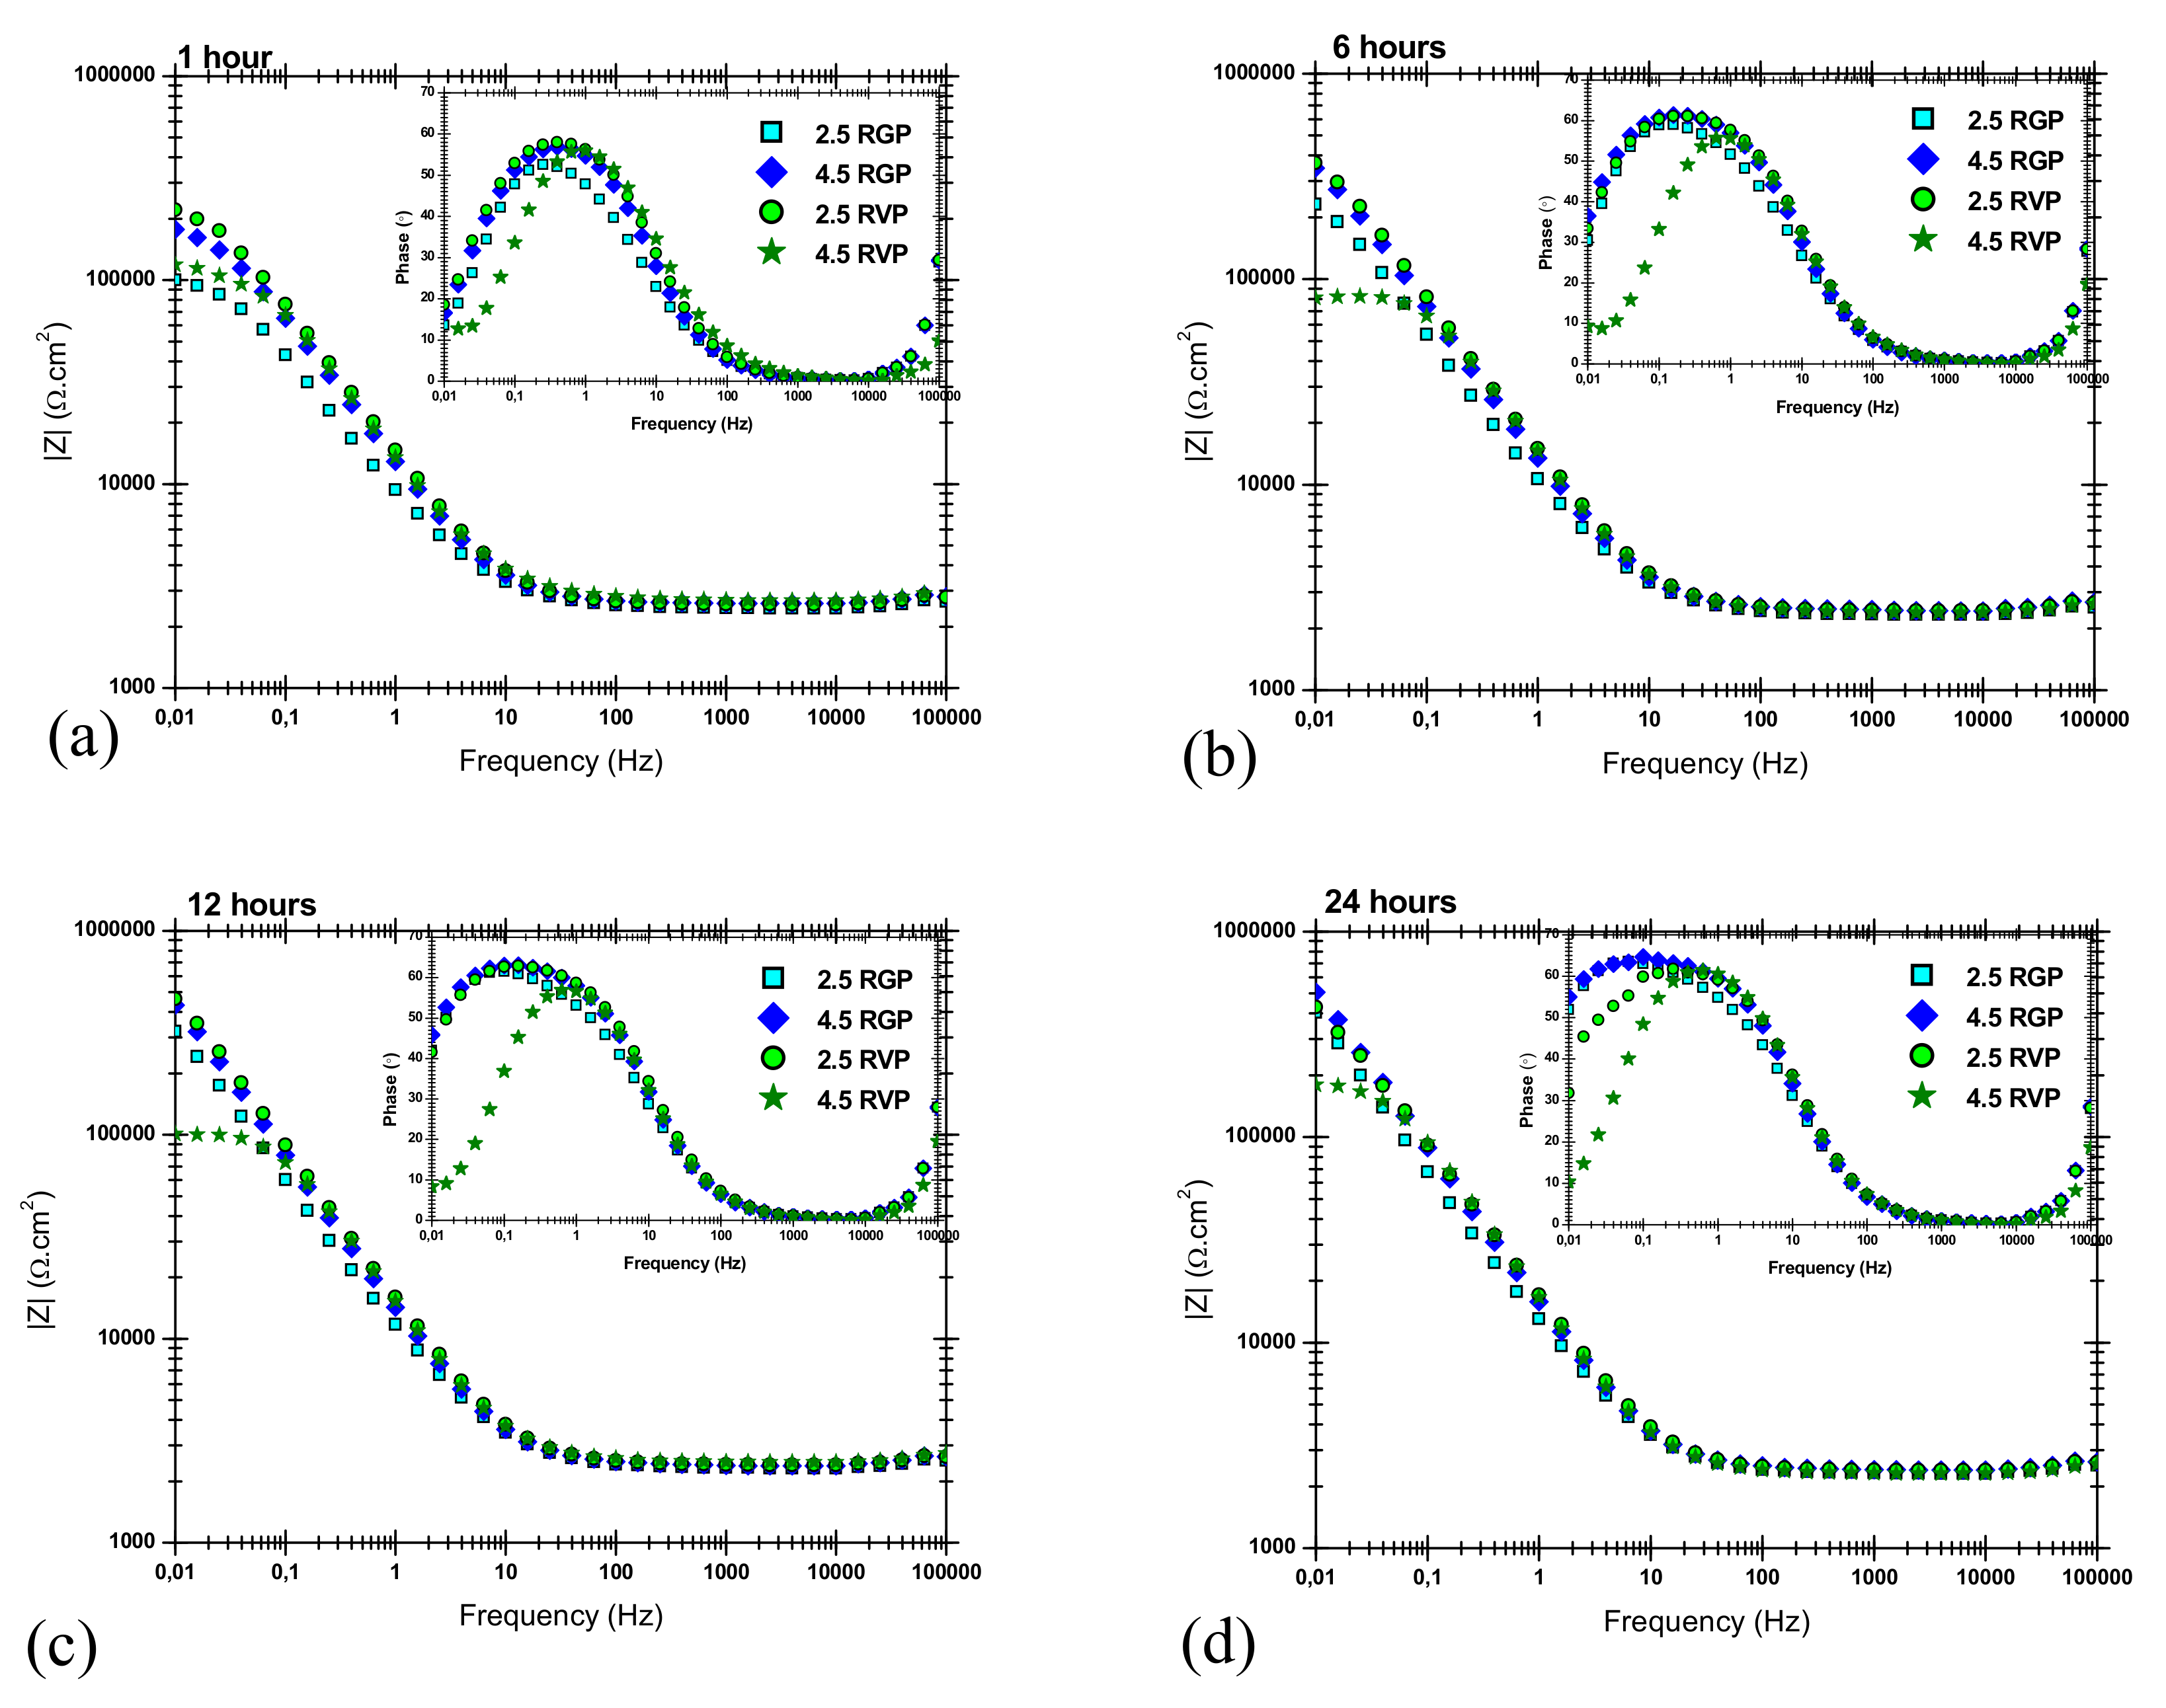
EIS spectra were obtained during 24 h of immersion in the diluted Harrison solution. The Bode plots of EIS spectra of thin wall samples in as-cast condition are reported in Figure 12. The figure also compares the effect of different positions in the cavity and the silicon content in the alloy.
For all of the samples, the impedance values at low frequencies decrease with the immersion time, which indicates the progressive corrosion process on the surface. In addition, the phase angle peak depresses through the immersion time, suggesting that the pitting corrosion activity is increasing [58].
Regarding the effect of position, samples taken from near the vent almost always, during the 24 h of immersion, show slightly higher impedance values at low frequencies, compared to the samples taken near the gate, except for 24 h, when all the samples show the same values. As it was discussed before, according to LOM images (Figure 3), the samples, which are taken from near the vent, possess a higher fraction of α2-Al particles, and they also have a finer microstructure compared to the samples which are taken from near the gate.
Concerning the effect of silicon, no noticeable difference is detectable. However, all the previous research has indicated the positive effect of silicon on the pitting resistance of aluminum alloys [29,59,60]. Nevertheless, it is worth mentioning that these studies are focused on silicon content higher than 6%, which is higher than the percentage of silicon in both of our alloys.
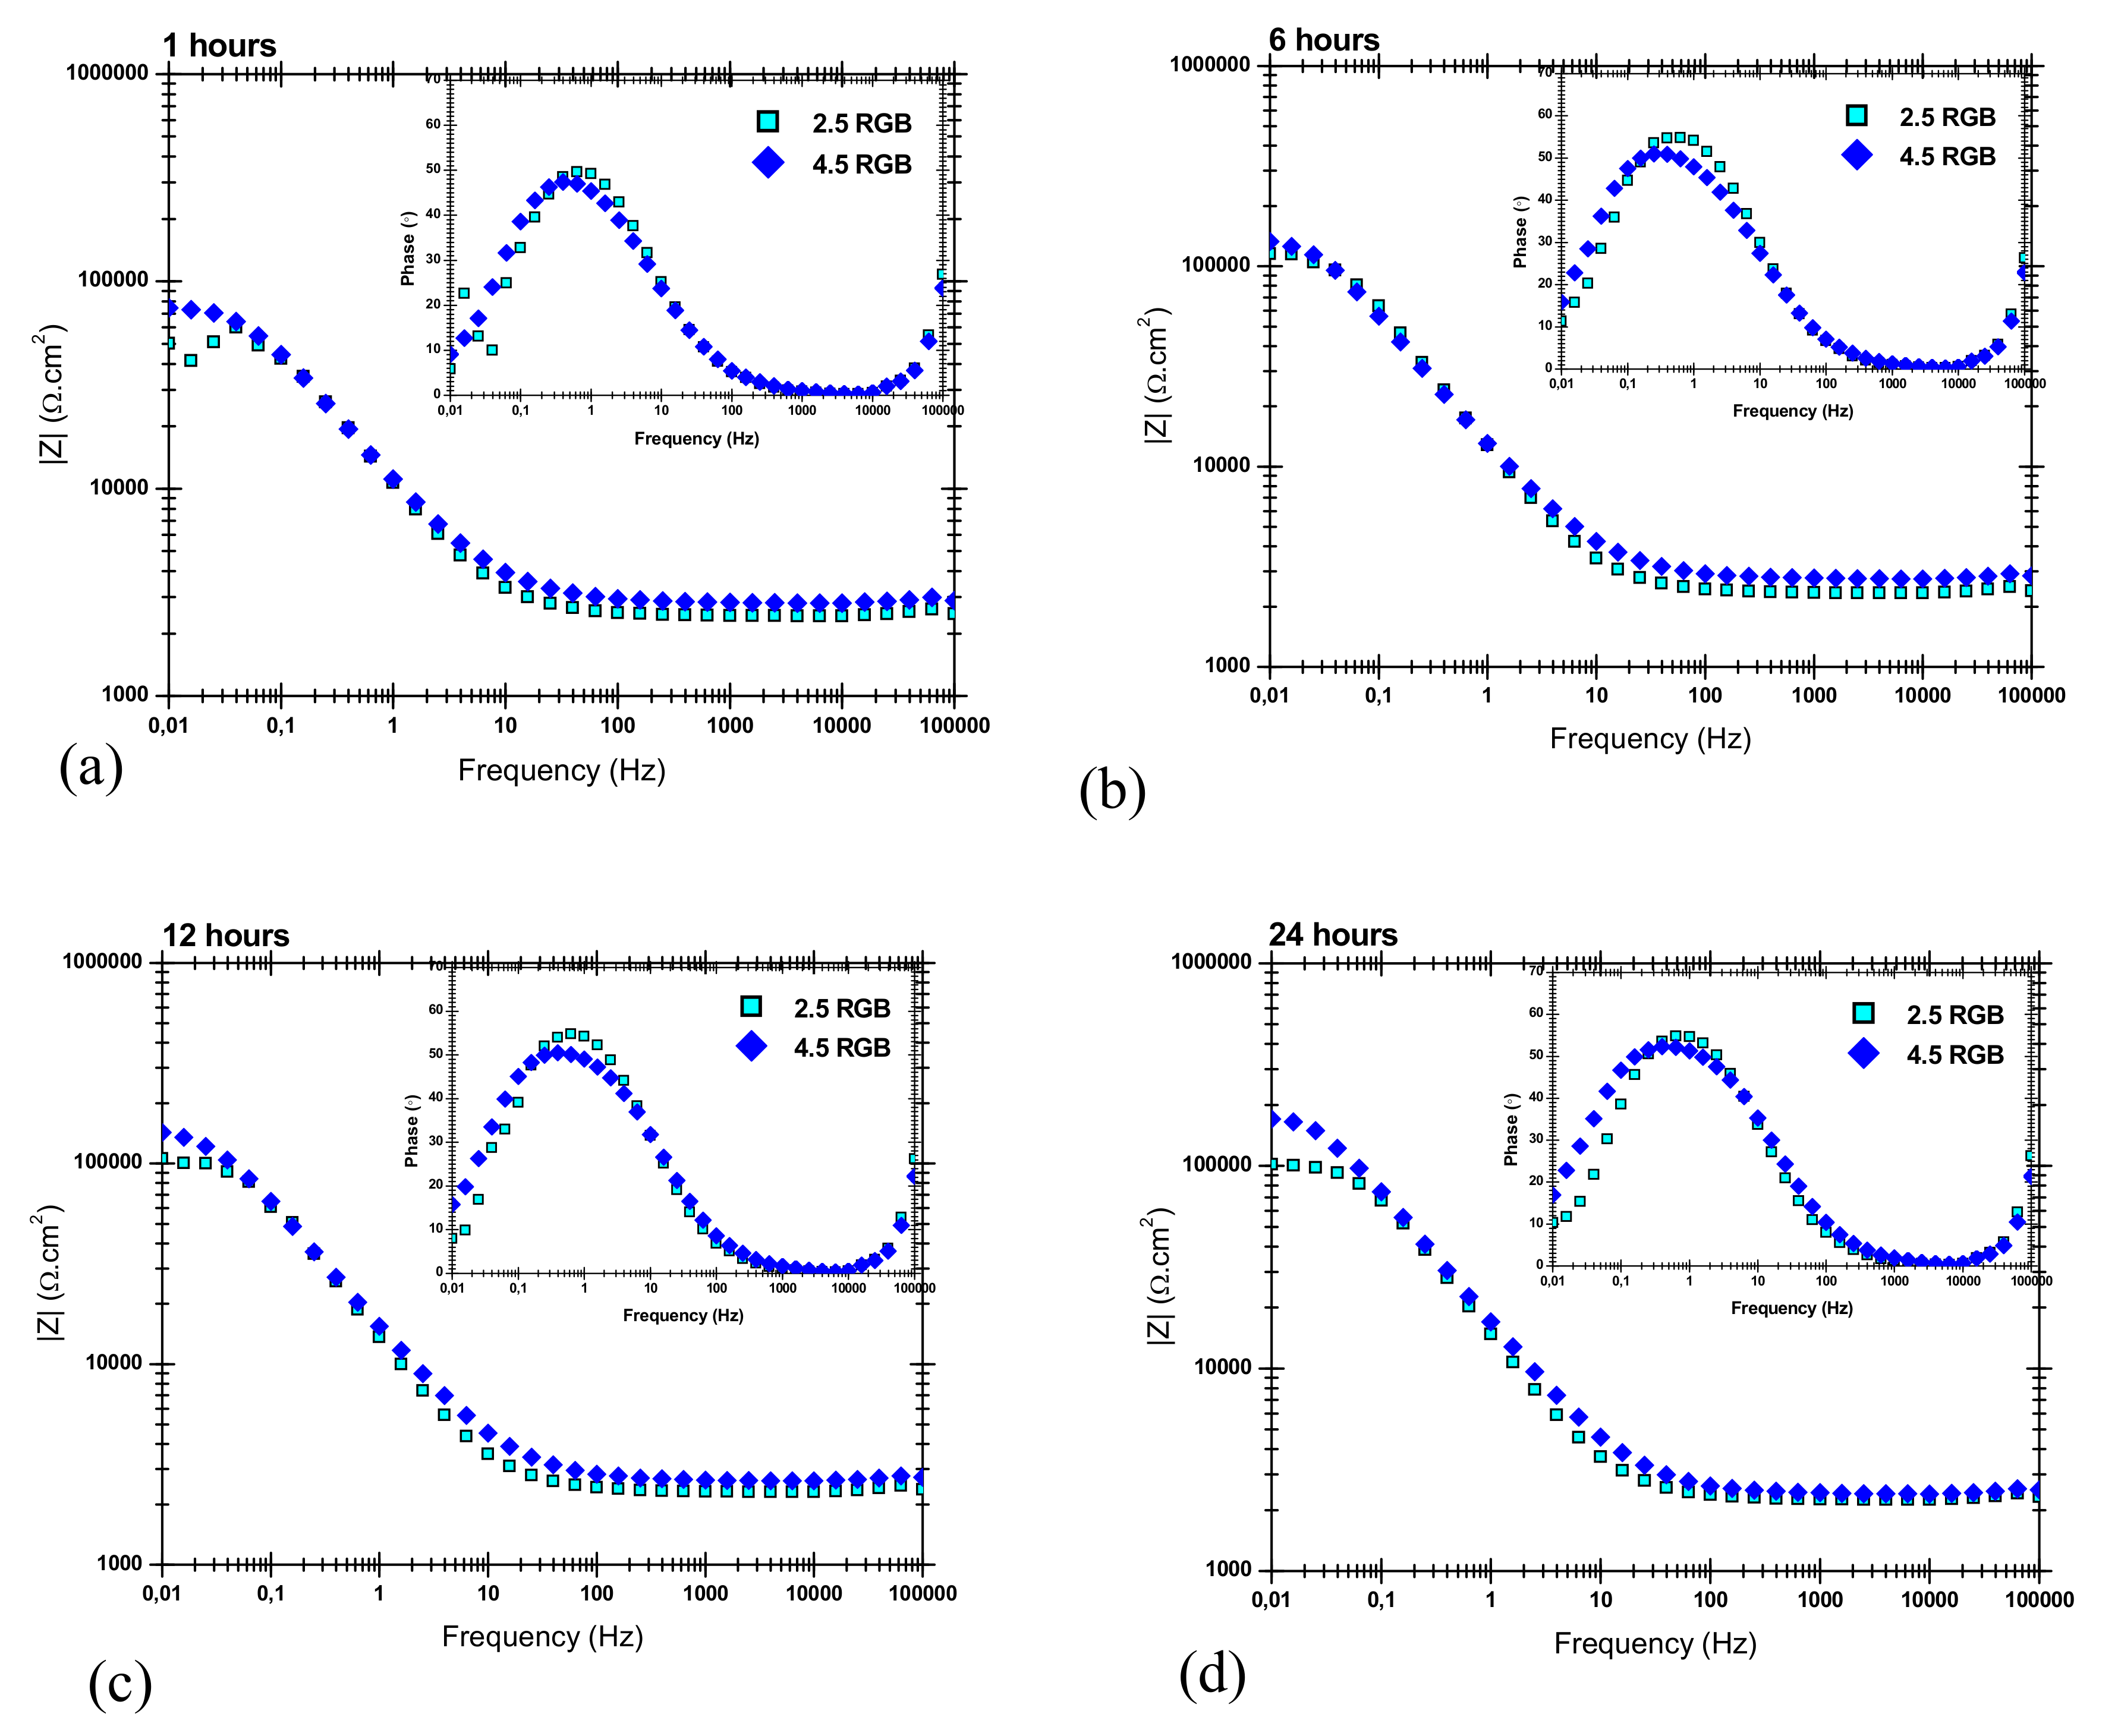
To remove the effect of as-cast surface quality, the thin wall samples were ground using SiC abrasive papers to the extent that the skin layer was totally removed. The samples were then monitored by EIS during 24 h of immersion in the same solution. Bode presentation of EIS spectra of these samples are presented in Figure 13. According to these spectra, the ground thin wall samples show one order of magnitude higher impedance values at low frequencies compared to the same samples in as-cast condition. In addition, the impendence values increased during 24 h of immersion for all of these samples. This can be related to the presence of a protective oxide, which is more stable to pitting. This protective oxide later is provided by better finishing quality on the ground surfaces. By grinding, the skin layer is removed, and a surface containing more α1-Al particles and fewer intermetallic particles (Figure 6) is exposed to the corrosive solution.
The difference between the corrosion performances of samples from different positions is negligible in this condition. Impedance tends slightly to increase after 6 h, and no pits are developed after 24 h. This proves that the poor behavior of as-cast surface is due to the poor surface quality and the higher amounts of intermetallic particles.
EIS spectra of the samples taken from the thicker plate, which are ground to the middle to expose the bulk microstructure, are reported in Figure 14. These results indicate the growth of a protective oxide layer on the surface.
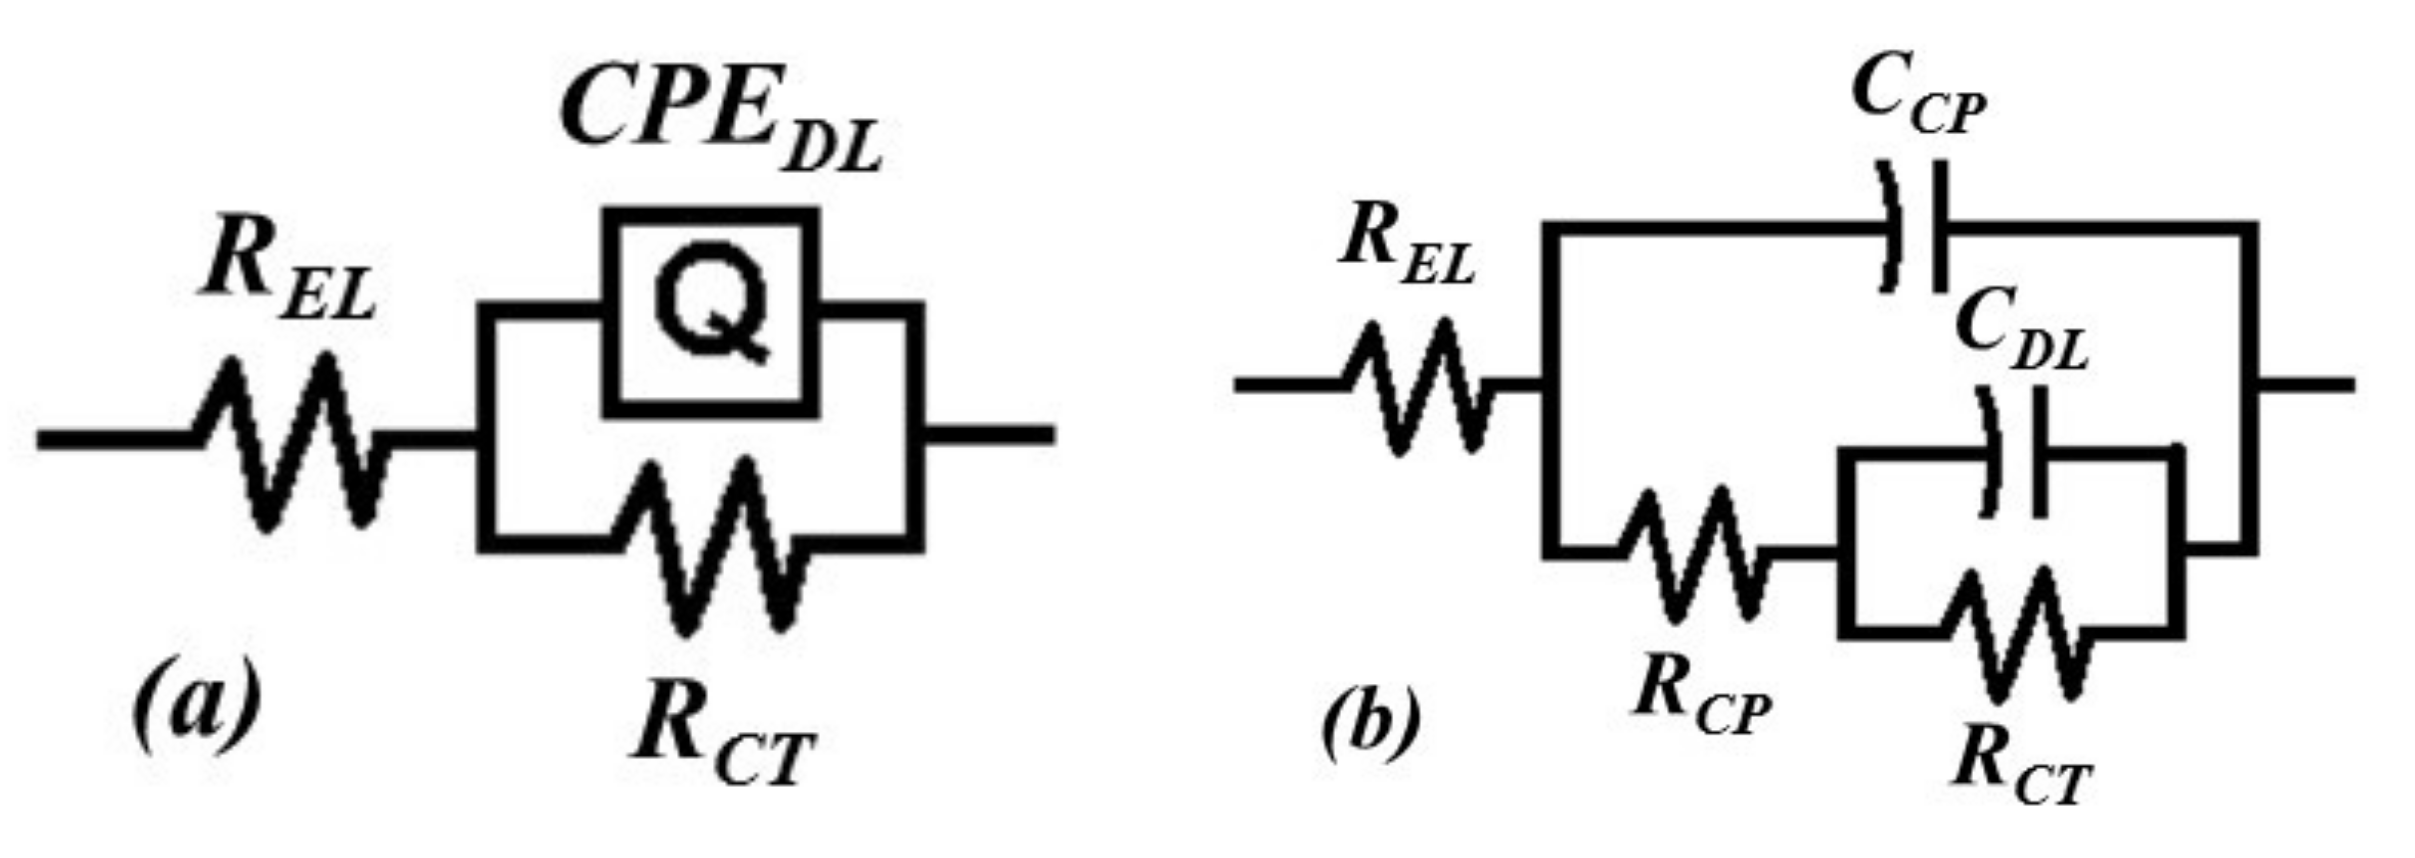
The equivalent circuits used to describe the electrochemical responses of the samples 2.5 RG(P/B), 4.5 RG(P/B), 2.5 RVP, and 4.5 RVP are shown in Figure 15.
The electrochemical behavior of aluminum surface is affected by the presence of the passive oxide layer and the interface between the intermetallic particles and the aluminum. Although all these constituents are present, their time constants strongly overlap, or one dominates. Therefore, only one peak in the phase diagram can be observed for all of them.
The oxide layer is represented by a parallel circuit containing a resistor and a capacitor representing, respectively, the oxide ionic conduction and its dielectric properties [61].
The circuit in Figure 15a with one time constant has been used for the first 6 h of immersion, for almost all the samples, while the circuit in Figure 15b has been used for the later hours of immersion, when a second time constant was visible in the EIS spectrum. In the circuits depicted in Figure 15a,b, REL represents the resistance of the electrolyte. QDL (or CDL) and RCT stand for capacitive behavior of the electrical double layer at the interface between the surface and the solution, and for the resistance against the charge transfer (or polarization resistance), respectively. The second time constant at longer immersion time shows the oxidation of aluminum, and can represent the oxide layer (for ground surface of thin wall and thick plate samples). It can also stand for the corrosion products formed due to the localized corrosion attack in the case of thin wall samples in as-cast condition. RCP and CCP stand for the resistance and capacitive behavior of the oxide layer (or the corrosion products).
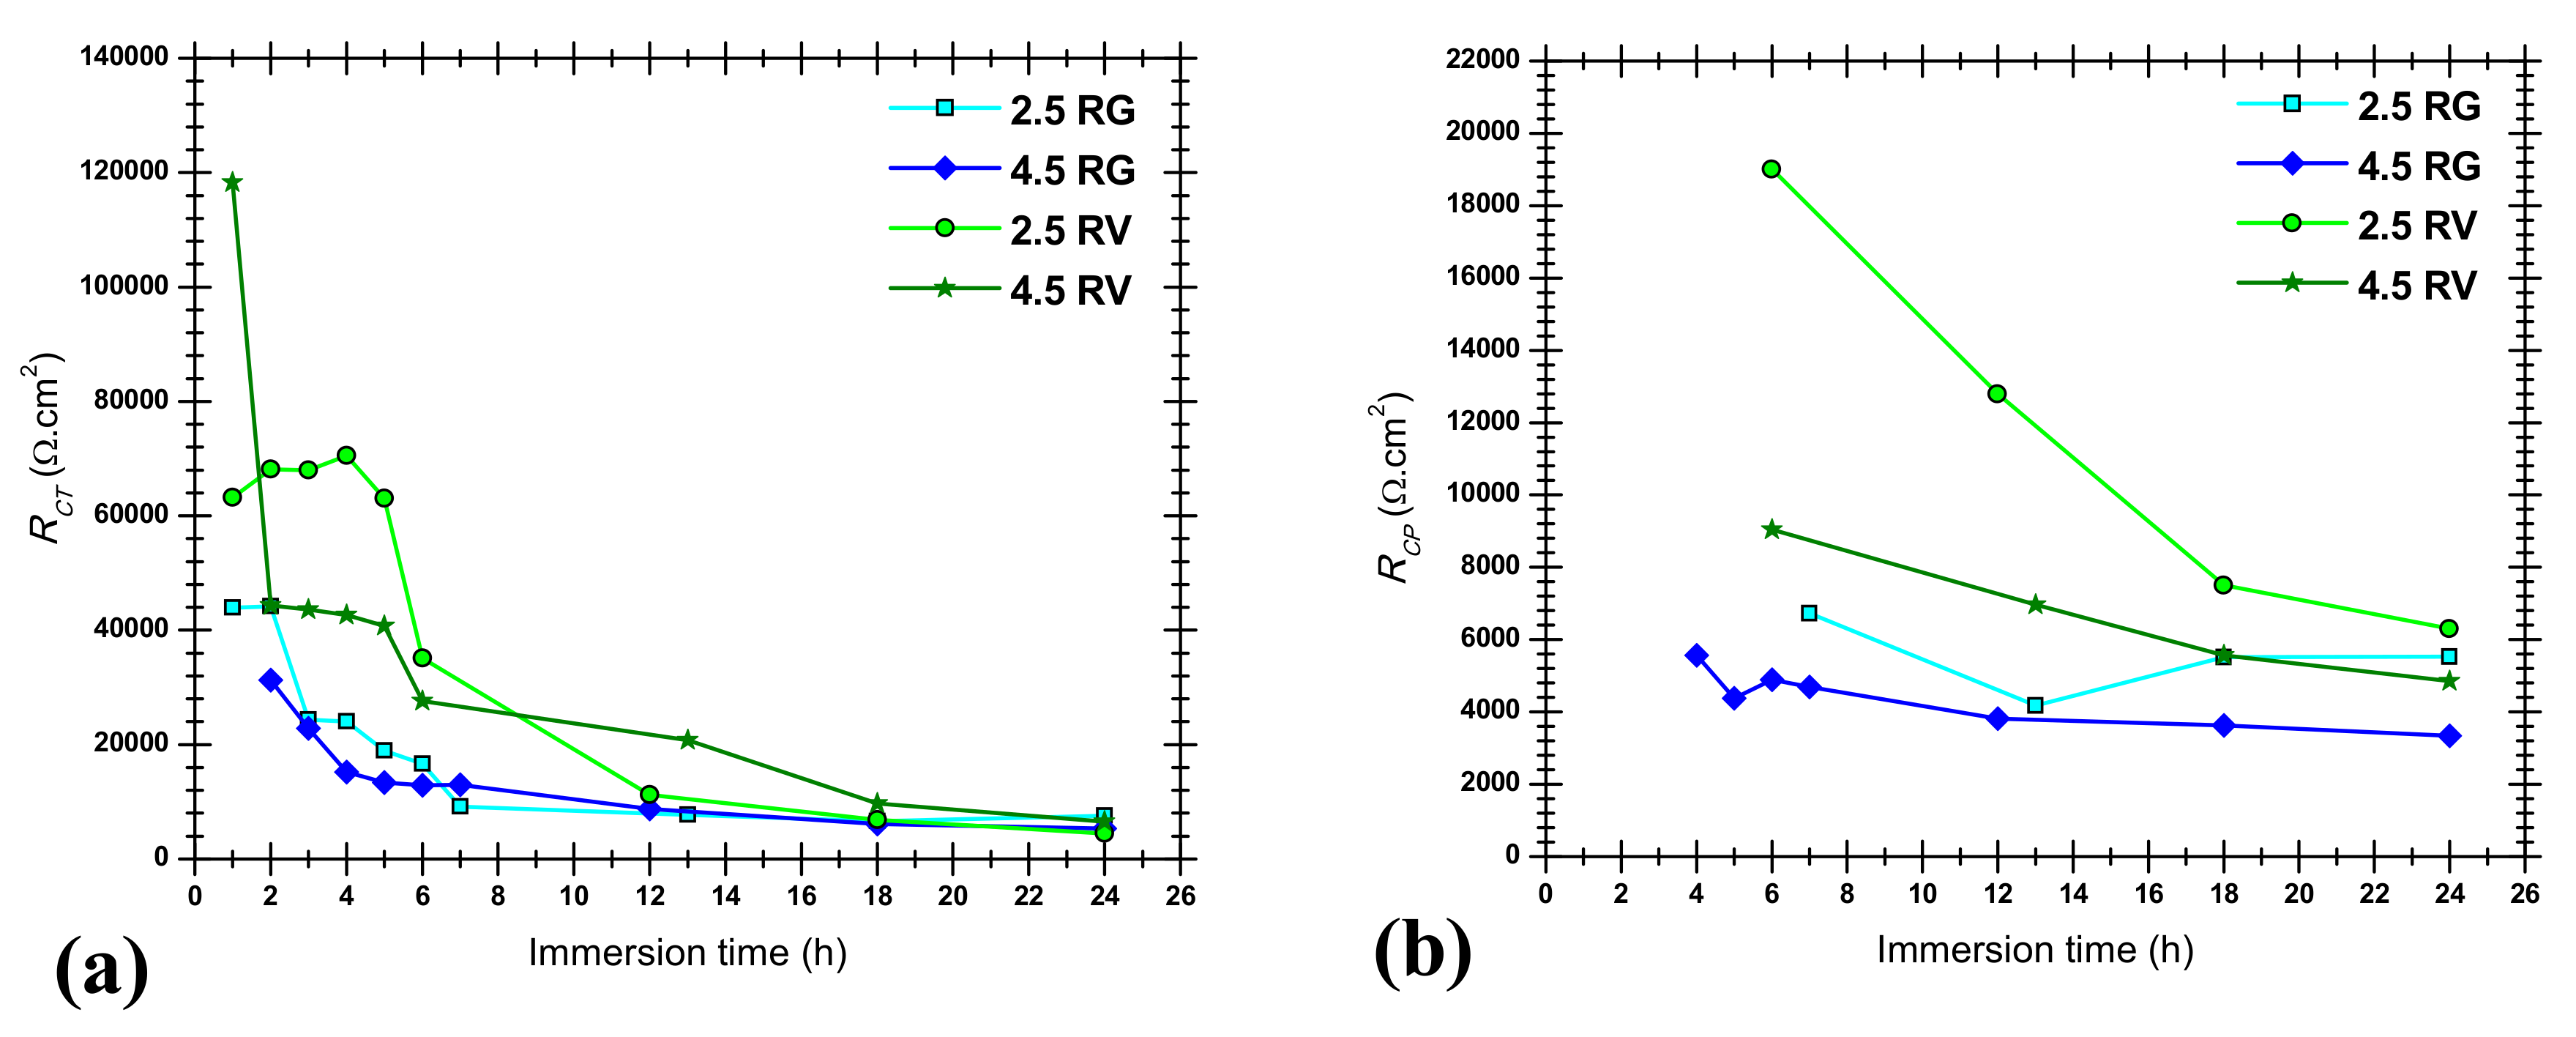
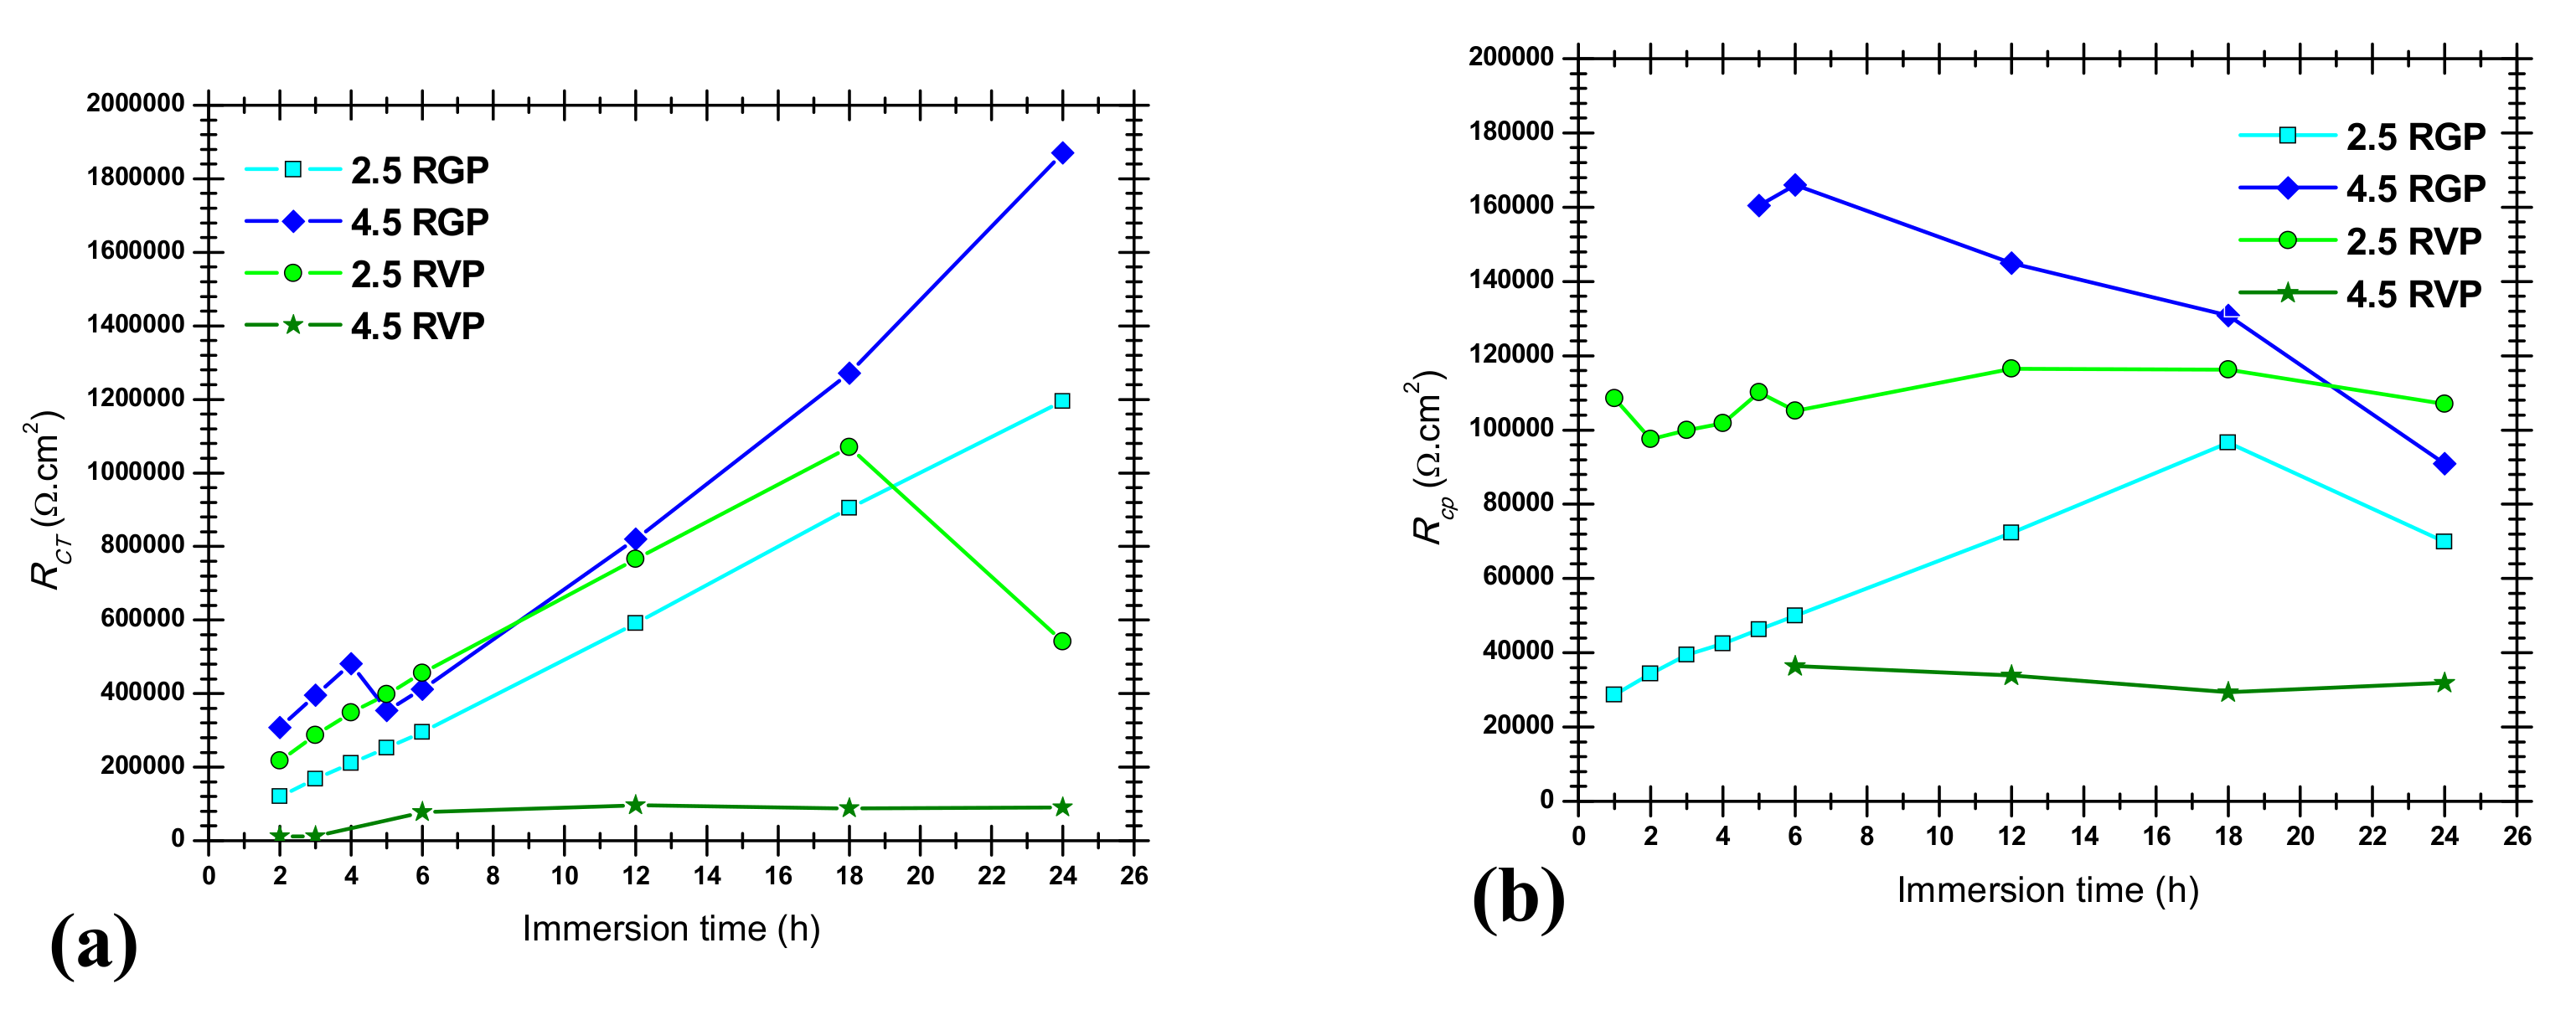
The fitting results of the two resistances (RCT and RCP) for thin wall samples, ground and in as-cast condition, and ground thick plate samples, are presented in Figure 16, Figure 17 and Figure 18, respectively.
Values of RCT of thin wall samples in as-cast condition (Figure 16a) decrease with the immersion time for all the samples, which indicates an increase of the activity and a higher corrosion rate in the localized attack [62]. It should be noted that this decrease is immediate for the samples taken from near the gate, while for the samples taken from near the vent, it starts after 5–6 h of immersion. These values are higher for the samples near the vent, compared to the samples near the gate. Regarding the effect of silicon content, samples with lower amounts of silicon show slightly higher RCT values at the very first hours of immersion. The values of RCP (Figure 16b), that for these samples represent the resistance of corrosion products in the pits, are very low, and slightly decrease for all the samples due to the corrosion attack.
Regarding the ground thin wall samples, RCT values are generally one order of magnitude higher compared to the thin wall samples in as-cast condition. The values increase during immersion time for all the samples (Figure 17a). The values of RCT for different samples, with regard to the position, and with different amounts of silicon, are close to each other. In the case of ground samples, values of RCP represent the presence of the passive oxide layer. They remain almost constant for all of the samples, and show a similar trend.
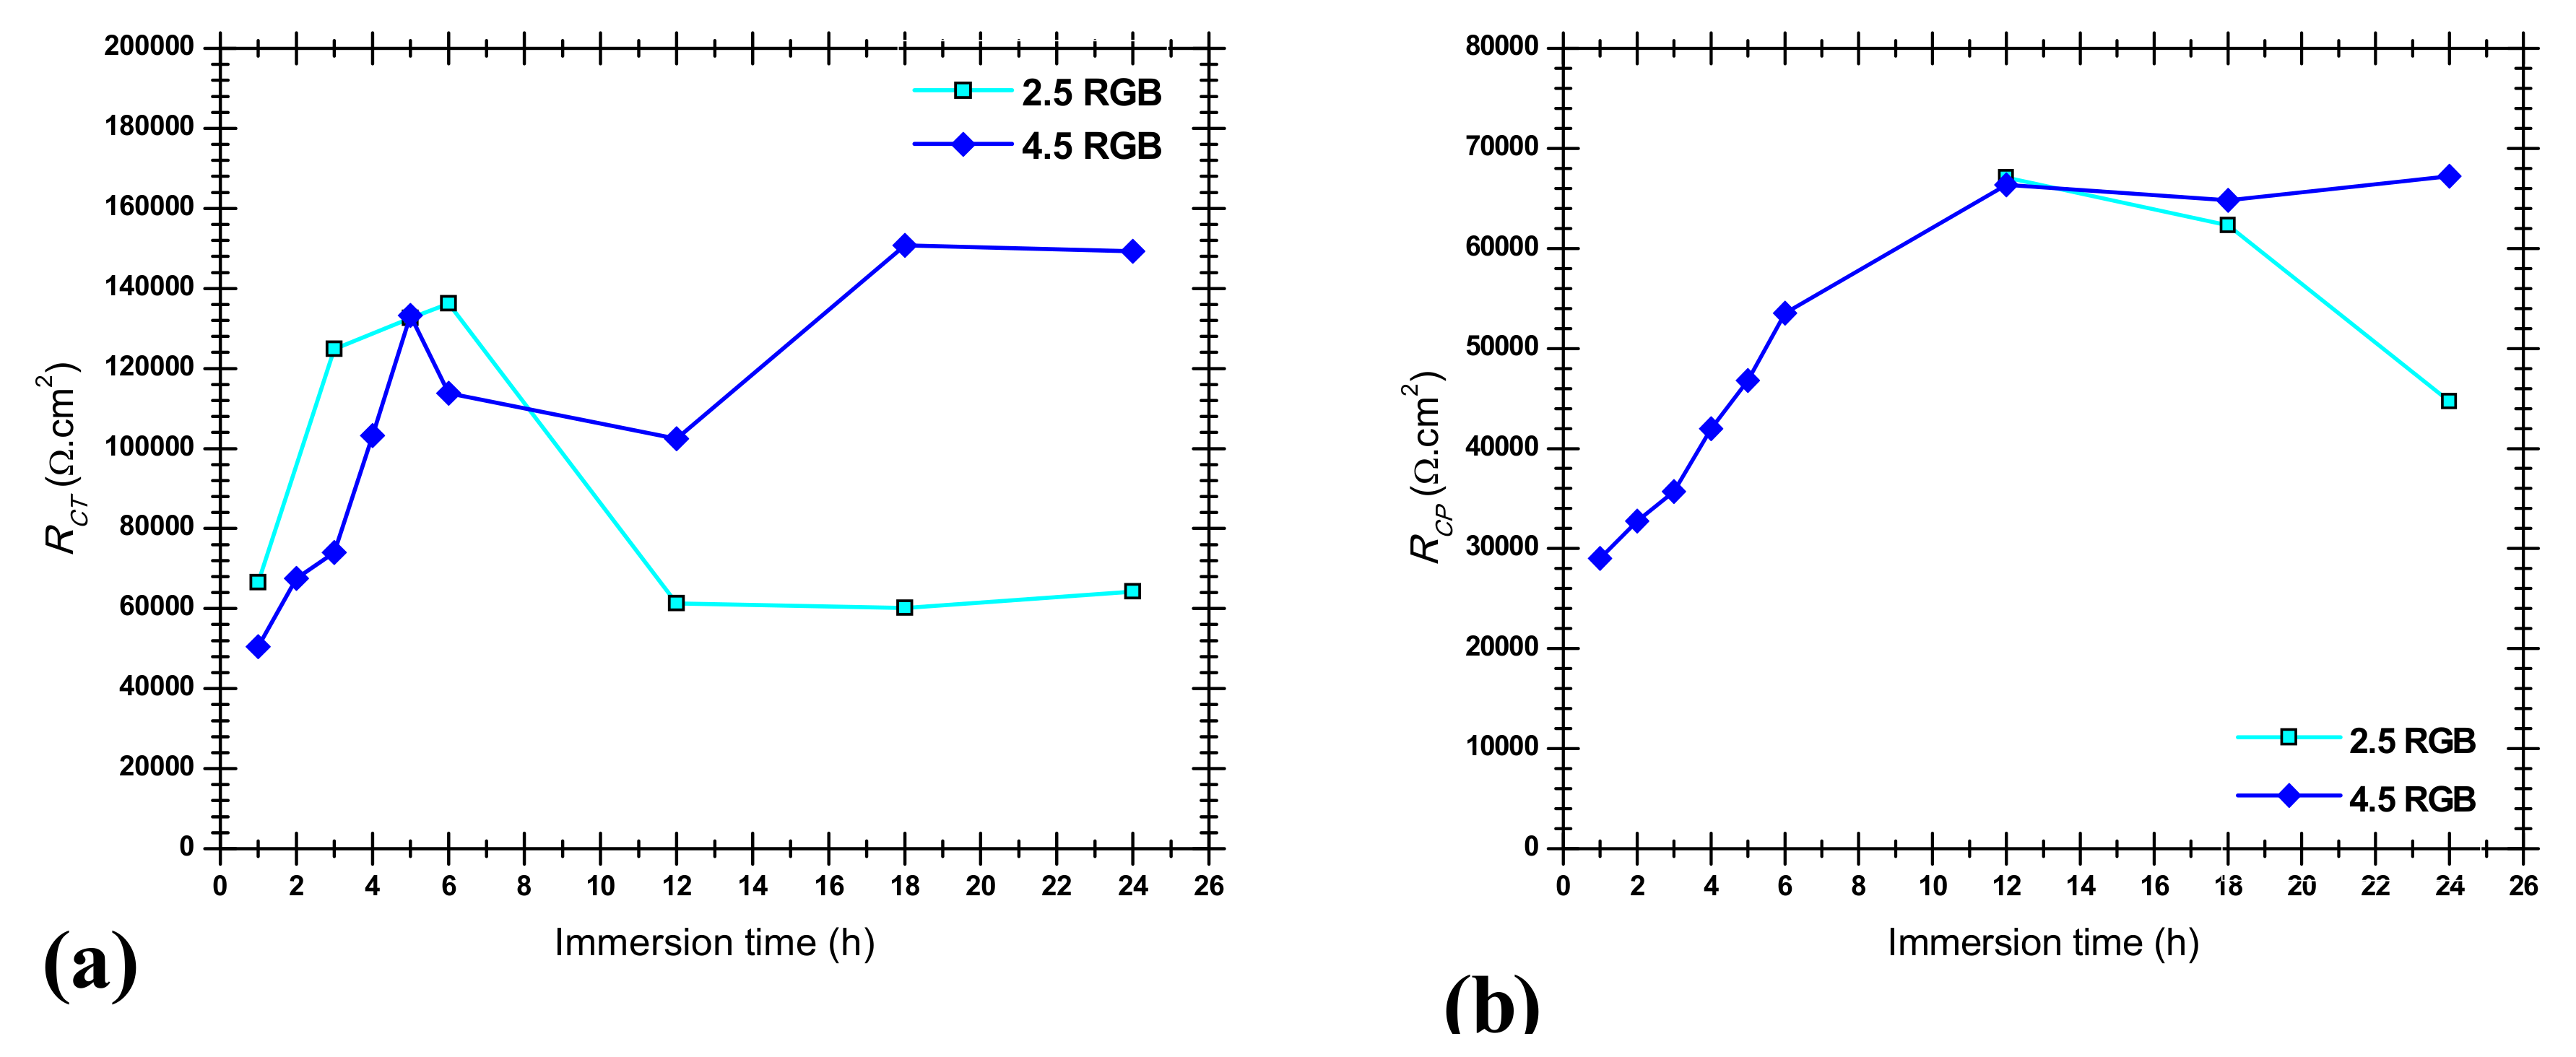
In the case of ground thick plate (bulk) samples, reported in Figure 18, the behavior of 2.5 RGB and 4.5 RGB samples are very similar. After some initial fluctuation, values of RCT remain almost constant for the two samples from 12 to 24 h of immersion, but never reach the high resistance showed by the ground thin wall samples. RCP values increase from the first hour of immersion for sample 4.5 RGB.
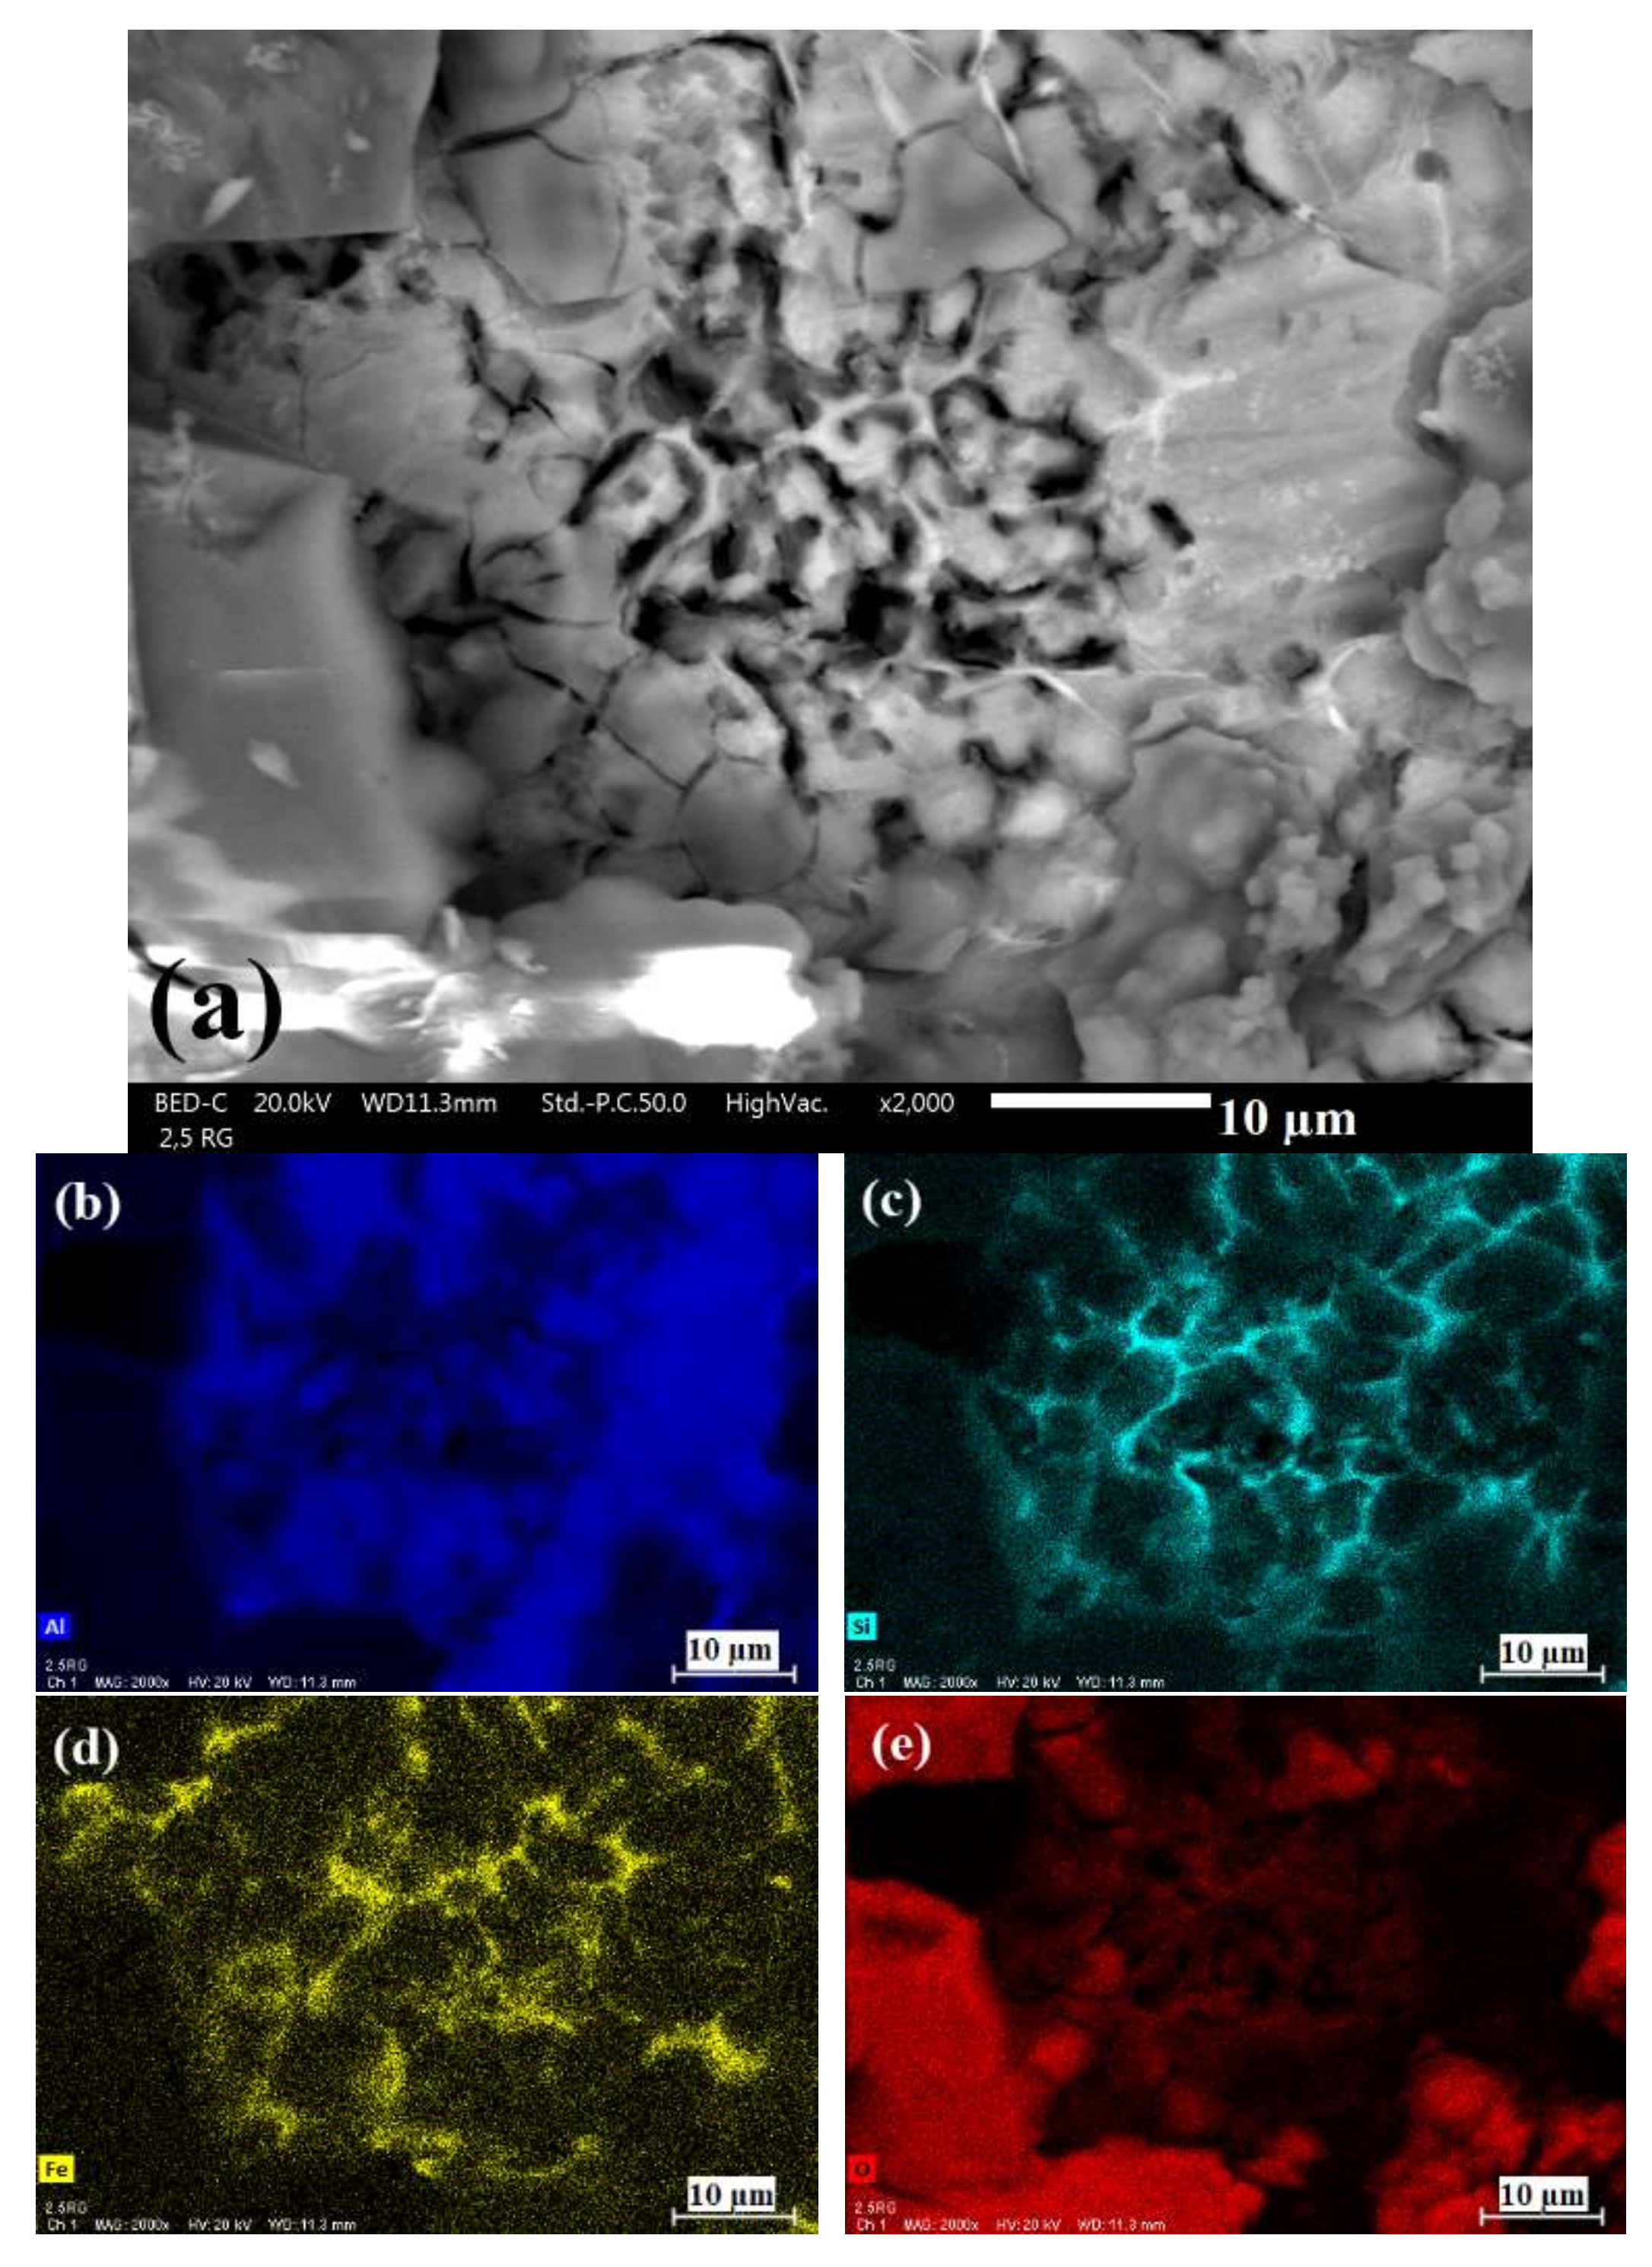
SEM micrographs and map analysis of some selected corroded surfaces are shown in Figure 19. As clearly visible in Figure 19, corrosion is mainly localized in all the samples, and takes place especially in the eutectic region, at the interface between the silicon and aluminum and at the interface of aluminum grains and iron-rich intermetallic particles. These results are in accordance with results of other researchers about corrosion of Al–Si alloys in similar solutions [34,35].
4. Conclusions
In this paper, the corrosion behavior of the alloy in different parts of the component geometry were compared, and the microstructure macrosegregation due to Rheo-HPDC process was evaluated in terms of corrosion properties for two aluminum alloys containing 2.5 wt % and 4.5 wt % silicon. These alloys are prone to localized corrosion in the eutectic region at the interface between iron-rich intermetallic particles and the aluminum. Therefore, segregation of these phases influences the electrochemical behavior of the component. It was shown that the samples taken from different positions and different parts with various thicknesses differ in the amount of α1-Al and α2-Al particles. Samples also show a transverse macrosegregation. α1-Al particles which are the solid fraction of the slurry, tend to segregate at the center of the samples, while the surface is richer in α2-Al. Longitudinal segregation induces higher fraction of α1-Al particles in the area nearer to the higher fraction of α2-Al and the eutectic phase near the vent.
Both kinds of these segregations were shown to have influence on the corrosion behavior. A big change in the corrosion resistance was shown by grinding the samples. This is due to the as-cast surface morphology and composition, and to higher concentrations of intermetallic particles on the surface. In as-cast surface conditions, samples with higher amounts of α2-Al and finer microstructure (near the vent) show slightly higher corrosion resistance.
Differently to most of the previous papers, the as-cast surface was tested. It was shown how the surface segregation and the increase of intermetallic particles on the very surface influence the pitting resistance of the component. Both ground thin wall and thick plate samples possess better corrosion resistance compared to the thin wall samples in as-cast condition. This improvement is due to the better surface condition. Nevertheless, relatively thinner samples show a higher corrosion resistance compared to the thicker samples. Surfaces of the rheocast component present a purely liquid microstructure due to the segregation, which makes them more resistant to corrosion when ground and therefore without surface defects.
Acknowledgments
This research work was partially supported by the KK-foundation (CompCast, Project No. 20100280) which is gratefully acknowledged. The authors would like to thank COMPtech AB, Sweden for the production of the component and technical support.
Author Contributions
Maryam Eslami and Caterina Zanella conceived and designed the experiments; Maryam Eslami performed the experiments; Maryam Eslami, Mostafa Payandeh, Flavio Deflorian, Anders E. W. Jarfors and Caterina Zanella analyzed the data; Flavio Deflorian contributed reagents/materials/analysis tools; Maryam Eslami, Mostafa Payandeh and Caterina Zanella wrote the paper.
Conflicts of Interest
The authors declare no conflict of interest.
References
- Bonollo, F.; Gramegna, N.; Timelli, G. High-pressure die-casting: Contradictions and challenges. JOM 2015, 67, 901–908. [Google Scholar] [CrossRef]
- Qi, M.; Kang, Y.; Zhou, B.; Liao, W.; Zhu, G.; Li, Y.; Li, W. A forced convection stirring process for Rheo-HPDC aluminum and magnesium alloys. J. Mater. Process. Technol. 2016, 234, 353–367. [Google Scholar] [CrossRef]
- Ji, S.; Zhen, Z.; Fan, Z. Effects of rheo-die casting process on the microstructure and mechanical properties of AM50 magnesium alloy. J. Mater. Sci. Technol. 2005, 21, 1019–1024. [Google Scholar] [CrossRef]
- Ji, S.; Wang, Y.; Watson, D.; Fan, Z. Microstructural evolution and solidification behavior of Al-Mg-Si alloy in high-pressure die casting. Metall. Mater. Trans. A 2013, 44, 3185–3197. [Google Scholar] [CrossRef]
- Jin, C.K.; Jang, C.H.; Kang, C.G. Die design method for thin plates by indirect rheo-casting process and effect of die cavity friction and punch speed on microstructures and mechanical properties. J. Mater. Process. Technol. 2015, 224, 156–168. [Google Scholar] [CrossRef]
- Fan, Z.; Ji, S.; Liu, G. Development of the rheo-diecasting process for Mg-alloys. Mater. Sci. Forum 2005, 488–489, 405–412. [Google Scholar] [CrossRef]
- Moller, H.; Stumpf, W.E.; Pistorius, P.C. Influence of elevated Fe, Ni and Cr levels on tensile properties of SSM-HPDC Al-Si-Mg alloy F357. Trans. Nonferr. Metals Soc. China 2010, 20, s842–s846. [Google Scholar] [CrossRef]
- Flemings, M.C.; Riek, R.G.; Young, K.P. Rheocasting. Mater. Sci. Eng. 1976, 25, 103–117. [Google Scholar] [CrossRef]
- Fan, Z. Semisolid metal processing. Int. Mater. Rev. 2002, 47, 49–85. [Google Scholar] [CrossRef]
- Atkinson, H.V. Alloys for semi-solid processing. Solid State Phenom. 2013, 192–193, 16–27. [Google Scholar] [CrossRef]
- Payandeh, M. Rheocasting of Aluminium Alloys: Slurry Formation, Microstructure, and Properties. Ph.D. Thesis, Jönköping University, Jönköping, Sweden, April 2015. [Google Scholar]
- Chen, Z.W. Skin solidification during high pressure die casting of Al–11Si–2Cu–1Fe alloy. Mater. Sci. Eng. A 2003, 348, 145–153. [Google Scholar] [CrossRef]
- Laukli, H.I.; Gourlay, C.M.; Dahle, A.K. Migration of crystals during the filling of semi-solid castings. Metall. Mater. Trans. A 2005, 36, 805–818. [Google Scholar] [CrossRef]
- Kaufmann, H.; Fragner, W.; Galovsky, U.; Uggowitzer, P.J. Fluctuations of Alloy Composition and Their Influence on Sponge Effect and Fluidity of A356-NRC. In Proceedings of the 2nd International Light Metals Technology ConferenceProceedings of the 2nd International Light Metals Technology Conference, St. Wolfgang, Austria, 8–10 June 2005; Kaufmann, H., Ed.; LKR-Verlag: St. Wolfgang, Austria, 2005. [Google Scholar]
- Zabler, S.; Ershov, A.; Rack, A.; Garcia-Moreno, F.; Baumbach, T.; Banhart, J. Particle and liquid motion in semi-solid aluminium alloys: A quantitative in situ microradioscopy study. Acta Mater. 2013, 61, 1244–1253. [Google Scholar] [CrossRef]
- Park, C.; Kim, S.; Kwon, Y.; Lee, Y.; Lee, J. Effect of microstructure on tensile behavior of thixoformed 357-T5 semisolid Al alloy. Metall. Mater. Trans. A 2004, 35, 1407–1410. [Google Scholar] [CrossRef]
- Möller, H.; Masuku, E.P. The influence of liquid surface segregation on the pitting corrosion behavior of semi-solid metal high pressure die cast alloy F357. TOCORRJ 2009, 2, 216–220. [Google Scholar] [CrossRef]
- Masuku, E.P.; Moller, H.; Curle, U.A.; Pistorius, P.C.; Li, W. Influence of surface liquid segregation on corrosion behavior of semi-solid metal high pressure die cast aluminium alloys. Trans. Nonferr. Metals Soc. China 2010, 20, s837–s841. [Google Scholar] [CrossRef]
- Möller, H.; Curle, U.A.; Masuku, E.P. Characterization of surface liquid segregation in SSM-HPDC aluminium alloys 7075, 2024, 6082 and A201. Trans. Nonferr. Metals Soc. China 2010, 20, s847–s851. [Google Scholar] [CrossRef]
- Guillaumin, V.; Mankowski, G. Localized corrosion of 6056 T6 aluminium alloy in chloride media. Corros. Sci. 2000, 42, 105–125. [Google Scholar] [CrossRef]
- Eckermann, F.; Suter, T.; Uggowitzer, P.J.; Afseth, A.; Schmutz, P. The influence of MgSi particle reactivity and dissolution processes on corrosion in Al–Mg–Si alloys. Electrochim. Acta 2008, 54, 844–855. [Google Scholar] [CrossRef]
- Zeng, F.-L.; Wei, Z.-L.; Li, J.-F.; Li, C.-X.; Tan, X.; Zhang, Z.; Zheng, Z.-Q. Corrosion mechanism associated with Mg2Si and Si particles in Al–Mg–Si alloys. Trans. Nonferr. Metals Soc. China 2011, 21, 2559–2567. [Google Scholar] [CrossRef]
- Liang, W.J.; Rometsch, P.A.; Cao, L.F.; Birbilis, N. General aspects related to the corrosion of 6xxx series aluminium alloys: Exploring the influence of Mg/Si ratio and Cu. Corros. Sci. 2013, 76, 119–128. [Google Scholar] [CrossRef]
- Li, H.; Zhao, P.; Wang, Z.; Mao, Q.; Fang, B.; Song, R.; Zheng, Z. The intergranular corrosion susceptibility of a heavily overaged Al-Mg-Si-Cu alloy. Corros. Sci. 2016, 107, 113–122. [Google Scholar] [CrossRef]
- Brito, C.; Vida, T.; Freitas, E.; Cheung, N.; Spinelli, J.E.; Garcia, A. Cellular/dendritic arrays and intermetallic phases affecting corrosion and mechanical resistances of an Al–Mg–Si alloy. J. Alloys Compd. 2016, 673, 220–230. [Google Scholar] [CrossRef]
- Li, C.; Sun, J.; Li, Z.; Gao, Z.; Liu, Y.; Yu, L.; Li, H. Microstructure and corrosion behavior of Al–10%Mg2Si cast alloy after heat treatment. Mater. Charact. 2016, 122, 142–147. [Google Scholar] [CrossRef]
- Kairy, S.K.; Rometsch, P.A.; Diao, K.; Nie, J.F.; Davies, C.H.J.; Birbilis, N. Exploring the electrochemistry of 6xxx series aluminium alloys as a function of Si to Mg ratio, Cu content, ageing conditions and microstructure. Electrochim. Acta 2016, 190, 92–103. [Google Scholar] [CrossRef]
- Svenningsen, G.; Lein, J.E.; Bjørgum, A.; Nordlien, J.H.; Yu, Y.; Nisancioglu, K. Effect of low copper content and heat treatment on intergranular corrosion of model AlMgSi alloys. Corros. Sci. 2006, 48, 226–242. [Google Scholar] [CrossRef]
- Rehim, S.S.A.; Hassan, H.H.; Amin, M.A. Chronoamperometric studies of pitting corrosion of Al and (Al–Si) alloys by halide ions in neutral sulphate solutions. Corros. Sci. 2004, 46, 1921–1938. [Google Scholar] [CrossRef]
- Tahamtan, S.; Boostani, A.F. Evaluation of pitting corrosion of thixoformed A356 alloy using a simulation model. Trans. Nonferr. Metals Soc. China 2010, 20, 1602–1606. [Google Scholar] [CrossRef]
- Park, C.; Kim, S.; Kwon, Y.; Lee, Y.; Lee, J. Mechanical and corrosion properties of rheocast and low-pressure cast A356-T6 alloy. Mater. Sci. Eng. A 2005, 391, 86–94. [Google Scholar] [CrossRef]
- Bastidas, J.M.; Forn, A.; Baile, M.T.; Polo, J.L.; Torres, C.L. Pitting corrosion of A357 aluminium alloy obtained by semisolid processing. Mater. Corros. 2001, 52, 691–696. [Google Scholar] [CrossRef]
- Pech-Canul, M.A.; Pech-Canul, M.I.; Bartolo-Pérez, P.; Echeverría, M. The role of silicon alloying addition on the pitting corrosion resistance of an Al-12 wt %Si alloy. Electrochim. Acta 2014, 140, 258–265. [Google Scholar] [CrossRef]
- Arrabal, R.; Mingo, B.; Pardo, A.; Mohedano, M.; Matykina, E.; Rodríguez, I. Pitting corrosion of rheocast A356 aluminium alloy in 3.5 wt % NaCl solution. Corros. Sci. 2013, 73, 342–355. [Google Scholar] [CrossRef]
- Tahamtan, S.; Boostani, A.F. Quantitative analysis of pitting corrosion behavior of thixoformed A356 alloy in chloride medium using electrochemical techniques. Mater. Des. 2009, 30, 2483–2489. [Google Scholar] [CrossRef]
- Larsen, M.H.; Walmsley, J.C.; Lunder, O.; Mathiesen, R.H.; Nisancioglu, K. Intergranular corrosion of copper-containing AA6xxx AlMgSi aluminum alloys. J. Electrochem. Soc. 2008, 155, C550–C556. [Google Scholar] [CrossRef]
- Zhan, H.; Mol, J.M.C.; Hannour, F.; Zhuang, L.; Terryn, H.; de Wit, J.H.W. The influence of copper content on intergranular corrosion of model AlMgSi(Cu) alloys. Mater. Corros. 2008, 59, 670–675. [Google Scholar] [CrossRef]
- Svenningsen, G.; Larsen, M.H.; Walmsley, J.C.; Nordlien, J.H.; Nisancioglu, K. Effect of artificial aging on intergranular corrosion of extruded almgsi alloy with small Cu content. Corros. Sci. 2006, 48, 1528–1543. [Google Scholar] [CrossRef]
- Qian, M.; Li, D.; Liu, S.B.; Gong, S.L. Corrosion performance of laser-remelted Al–Si coating on magnesium alloy AZ91D. Corros. Sci. 2010, 52, 3554–3560. [Google Scholar] [CrossRef]
- Yu, Y.; Kim, S.; Lee, Y.; lee, J. Phenomenological observations on mechanical and corrosion properties of thixoformed 357 alloys: A comparison with permanent mold cast 357 alloys. Metall. Mater. Trans. A 2002, 33, 1399–1412. [Google Scholar] [CrossRef]
- Eslami, M.; Fedel, M.; Speranza, G.; Deflorian, F.; Zanella, C. Deposition and characterization of cerium-based conversion coating on HPDC low Si content aluminum alloy. J. Electrochem. Soc. 2017, 164, C581–C590. [Google Scholar] [CrossRef]
- Wessén, M.; Cao, H. The RSF Technology: A Possible Breakthrough for Semi-Solid Casting Processes. In Proceedings of the International Conference of High Tech Die Casting, Vicenza, Italy, 21–22 September 2006. [Google Scholar]
- Cano, E.; Lafuente, D.; Bastidas, D.M. Use of EIS for the evaluation of the protective properties of coatings for metallic cultural heritage: A review. J. Solid State Electrochem. 2010, 14, 381–391. [Google Scholar] [CrossRef] [Green Version]
- Letardi, P. 7—Electrochemical measurements in the conservation of metallic heritage artefacts: An overview. In Corrosion and Conservation of Cultural Heritage Metallic Artefacts; Watkinson, D., Angelini, E., Adriaens, A., Eds.; Woodhead Publishing: Cambridge, UK, 2013; pp. 126–148. [Google Scholar]
- Kirkwood, D.H.; Suery, M.; Kapranos, P.; Atkinson, H.V.; Young, K.P. Semi-Solid Processing of Alloys; Springer: New York, NY, USA, 2010. [Google Scholar]
- Belov, N.A.; Aksenov, A.A. Iron in Aluminum Alloys: Impurity and Alloying Element; Taylor & Francis Inc.: New York, NY, USA, 2002. [Google Scholar]
- Sundman, B.; Jansson, B.; Andersson, J.-O. The thermo-calc databank system. Calphad 1985, 9, 153–190. [Google Scholar] [CrossRef]
- Andersson, J.-O.; Helander, T.; Höglund, L.; Shi, P.; Sundman, B. Thermo-Calc & DICTRA, computational tools for materials science. Calphad 2002, 26, 273–312. [Google Scholar]
- Payandeh, M.; Jarfors, A.E.W.; Wessén, M. Solidification sequence and evolution of microstructure during rheocasting of four Al-Si-Mg-Fe alloys with low Si content. Metall. Mater. Trans. A 2016, 47, 1215–1228. [Google Scholar] [CrossRef]
- Easton, M.; Kaufmann, H.; Fragner, W. The effect of chemical grain refinement and low superheat pouring on the structure of NRC castings of aluminium alloy Al–7Si–0.4 Mg. Mater. Sci. Eng. A 2006, 420, 135–143. [Google Scholar] [CrossRef]
- Zhu, B.; Seifeddine, S.; Persson, P.O.Å.; Jarfors, A.E.W.; Leisner, P.; Zanella, C. A study of formation and growth of the anodised surface layer on cast Al-Si alloys based on different analytical techniques. Mater. Des. 2016, 101, 254–262. [Google Scholar] [CrossRef]
- Gourlay, C.; Dahle, A.; Nagira, T.; Nakatsuka, N.; Nogita, K.; Uesugi, K. Granular deformation mechanisms in semi-solid alloys. Acta Mater. 2011, 59, 4933–4943. [Google Scholar] [CrossRef]
- Payandeh, M.; Jarfors, A.E.W.; Wessén, M. Influence of microstructural inhomogeneity on fracture behaviour in SSM-HPDC Al-Si-Cu-Fe component with low Si content. Solid State Phenom. 2015, 217–218, 67–74. [Google Scholar] [CrossRef]
- Govender, G.; Möller, H. Evaluation of surface chemical segregation of semi-solid cast aluminium alloy A356. Solid State Phenom. 2008, 141–143, 433–438. [Google Scholar] [CrossRef]
- Dinnis, C.M.; Dahle, A.K.; Taylor, J.A. Three-dimensional analysis of eutectic grains in hypoeutectic Al–Si alloys. Mater. Sci. Eng. A 2005, 392, 440–448. [Google Scholar] [CrossRef]
- Mingo, B.; Arrabal, R.; Pardo, A.; Matykina, E.; Skeldon, P. 3D study of intermetallics and their effect on the corrosion morphology of rheocast aluminium alloy. Mater. Charact. 2016, 112, 122–128. [Google Scholar] [CrossRef]
- Ji, S.; Das, A.; Fan, Z. Solidification behavior of the remnant liquid in the sheared semisolid slurry of Sn–15 wt % Pb alloy. Scripta Mater. 2002, 46, 205–210. [Google Scholar] [CrossRef]
- Wang, X.-H.; Wang, J.-H.; Fu, C.-W. Characterization of pitting corrosion of 7A60 aluminum alloy by EN and EIS techniques. Trans. Nonferr. Metals Soc. China 2014, 24, 3907–3916. [Google Scholar] [CrossRef]
- Amin, M.A. Uniform and pitting corrosion events induced by SCN− anions on Al alloys surfaces and the effect of UV light. Electrochim. Acta 2011, 56, 2518–2531. [Google Scholar] [CrossRef]
- Amin, M.A.; Hassan, H.H.; Hazzazi, O.A.; Qhatani, M.M. Role of alloyed silicon and some inorganic inhibitors in the inhibition of meta-stable and stable pitting of Al in perchlorate solutions. J. Appl. Electrochem. 2008, 38, 1589–1598. [Google Scholar] [CrossRef]
- Despić, A.; Parkhutik, V.P. Electrochemistry of aluminum in aqueous solutions and physics of its anodic oxide. In Modern Aspects of Electrochemistry No. 20; Bockris, J.O.M., White, R.E., Conway, B.E., Eds.; Springer: Boston, MA, USA, 1989; pp. 401–503. [Google Scholar]
- Moreto, J.A.; Marino, C.E.B.; Filho, W.W.B.; Rocha, L.A.; Fernandes, J.C.S. SVET, SKP and EIS study of the corrosion behaviour of high strength Al and Al–Li alloys used in aircraft fabrication. Corros. Sci. 2014, 84, 30–41. [Google Scholar] [CrossRef]
Figure 1.
The experimental cavity filter used for Rheo-high pressure die cast (HPDC) process.

Figure 2.
Sequence of formation of different phases in the (a) Alloy 2.5 and (b) Alloy 4.5.

Figure 3.
Light optical microscope (LOM) images of sample (a) 2.5 RGP; (b) 2.5 RVP; (c) 4.5 RGP and (d) 4.5 RVP.
Figure 3.
Light optical microscope (LOM) images of sample (a) 2.5 RGP; (b) 2.5 RVP; (c) 4.5 RGP and (d) 4.5 RVP.

Figure 4.
LOM image of sample (a) 2.5 RGB and (b) 4.5 RGB.

Figure 5.
LOM images of cross-sectional view of sample 2.5 RGB.

Figure 6.
Scanning electron microscopy (SEM) image of sample (a) 2.5 RG (as-cast condition) and (b) 2.5 RGP (polished surface).
Figure 6.
Scanning electron microscopy (SEM) image of sample (a) 2.5 RG (as-cast condition) and (b) 2.5 RGP (polished surface).

Figure 7.
SEM image (a) and spot EDS analysis (b) of polished surface microstructure of the sample 4.5 RGP.
Figure 7.
SEM image (a) and spot EDS analysis (b) of polished surface microstructure of the sample 4.5 RGP.

Figure 8.
Concentration of Si in α1 and α2-Al phases in alloy 2.5 and 4.5.

Figure 9.
Potentiodynamic polarization curves in (a) the solution of 3.5 g/L (NH4)2SO4 and (b) the diluted Harrison solution.
Figure 9.
Potentiodynamic polarization curves in (a) the solution of 3.5 g/L (NH4)2SO4 and (b) the diluted Harrison solution.

Figure 10.
Potentiodynamic polarization curves in (a) the solution of 3.5 g/L (NH4)2SO4 and (b) the diluted Harrison solution.
Figure 10.
Potentiodynamic polarization curves in (a) the solution of 3.5 g/L (NH4)2SO4 and (b) the diluted Harrison solution.

Figure 11.
Corroded surfaces of sample (a) 2.5 RG and (b) 4.5 RG after polarization test in the diluted Harrison solution.
Figure 11.
Corroded surfaces of sample (a) 2.5 RG and (b) 4.5 RG after polarization test in the diluted Harrison solution.

Figure 12.
Bode plots of EIS spectra of samples 2.5 RG, 4.5 RG, 2.5 RV, and 4.5 RV after (a) 1 h; (b) 6 h; (c) 12 h; and (d) 24 h of immersion in the diluted Harrison solution.
Figure 12.
Bode plots of EIS spectra of samples 2.5 RG, 4.5 RG, 2.5 RV, and 4.5 RV after (a) 1 h; (b) 6 h; (c) 12 h; and (d) 24 h of immersion in the diluted Harrison solution.

Figure 13.
Bode plots of EIS spectra of samples 2.5 RGP, 4.5 RGP, 2.5 RVP, and 4.5 RVP after (a) 1 h; (b) 6 h; (c) 12 h and (d) 24 h of immersion in the diluted Harrison solution.
Figure 13.
Bode plots of EIS spectra of samples 2.5 RGP, 4.5 RGP, 2.5 RVP, and 4.5 RVP after (a) 1 h; (b) 6 h; (c) 12 h and (d) 24 h of immersion in the diluted Harrison solution.

Figure 14.
Bode plots of EIS spectra of samples 2.5 RGB, 4.5 RGB after (a) 1 h; (b) 6 h; (c) 12 h; and (d) 24 h of immersion in the diluted Harrison solution.
Figure 14.
Bode plots of EIS spectra of samples 2.5 RGB, 4.5 RGB after (a) 1 h; (b) 6 h; (c) 12 h; and (d) 24 h of immersion in the diluted Harrison solution.

Figure 15.
Equivalent circuits for the studied alloy after (a) a short time and (b) a longer time of immersion in the diluted Harrison solution.
Figure 15.
Equivalent circuits for the studied alloy after (a) a short time and (b) a longer time of immersion in the diluted Harrison solution.

Figure 16.
Fitted EIS parameters of as-cast thin wall samples: (a) RCT and (b) RCP.

Figure 17.
Fitted EIS parameters of ground thin wall samples: (a) RCT and (b) RCP.

Figure 18.
Fitted EIS parameters of ground thick plate (bulk) samples: (a) RCT and (b) RCP.

Figure 19.
(a) SEM micrograph and elemental map analysis of corroded surface of sample 2.5 RG; (b) Al; (c) Si; (d) Fe; and (e) O.
Figure 19.
(a) SEM micrograph and elemental map analysis of corroded surface of sample 2.5 RG; (b) Al; (c) Si; (d) Fe; and (e) O.


Table 1.
Measured composition (wt %) of alloys.
| Name | Si | Fe | Cu | Mn | Mg | Zn | Al |
|---|---|---|---|---|---|---|---|
| Alloy 2.5 | 2.41 | 0.462 | 0.131 | 0.019 | 0.58 | 0.038 | 96.338 |
| Alloy 4.5 | 4.50 | 0.481 | 0.137 | 0.019 | 0.58 | 0.035 | 94.223 |
Table 2.
Designation of samples.
| Name | Section | Near the Gate | Near the Vent |
|---|---|---|---|
| Alloy 2.5 | Thin wall surfaces | 2.5 RGP | 2.5 RVP |
| Plate bulk | 2.5 RGB | 2.5 RVB | |
| Alloy 4.5 | Thin wall surface | 4.5 RGP | 4.5 RVP |
| Plate bulk | 4.5 RGB | 4.5 RVB |
R = Rheo-HPDC, G = Samples from near the gate, V = Samples from near the vent, P = Thin wall samples in ground surface condition, B = Samples from the thick bottom plate ground to the half of thickness (Bulk samples).
© 2018 by the authors. Licensee MDPI, Basel, Switzerland. This article is an open access article distributed under the terms and conditions of the Creative Commons Attribution (CC BY) license (http://creativecommons.org/licenses/by/4.0/).
Share and Cite
MDPI and ACS Style
Eslami, M.; Payandeh, M.; Deflorian, F.; Jarfors, A.E.W.; Zanella, C. Effect of Segregation and Surface Condition on Corrosion of Rheo-HPDC Al–Si Alloys. Metals 2018, 8, 209. https://doi.org/10.3390/met8040209
AMA Style
Eslami M, Payandeh M, Deflorian F, Jarfors AEW, Zanella C. Effect of Segregation and Surface Condition on Corrosion of Rheo-HPDC Al–Si Alloys. Metals. 2018; 8(4):209. https://doi.org/10.3390/met8040209
Chicago/Turabian StyleEslami, Maryam, Mostafa Payandeh, Flavio Deflorian, Anders E. W. Jarfors, and Caterina Zanella. 2018. "Effect of Segregation and Surface Condition on Corrosion of Rheo-HPDC Al–Si Alloys" Metals 8, no. 4: 209. https://doi.org/10.3390/met8040209
Note that from the first issue of 2016, this journal uses article numbers instead of page numbers. See further details here.