Study on the Size Effects of H-Shaped Fusion Zone of Fiber Laser Welded AZ31 Joint

State key laboratory of mechanical behavior for materials, Xi’an Jiaotong University, Xi’an 710049, China
*
Author to whom correspondence should be addressed.
Metals 2018, 8(4), 198; https://doi.org/10.3390/met8040198
Submission received: 25 January 2018
/
Revised: 4 March 2018
/
Accepted: 15 March 2018
/
Published: 21 March 2018
(This article belongs to the Special Issue Laser Welding)
Abstract
:There are two kinds of typical cross-section profiles for the fusion zone (FZ) of a laser welded thin section joint, i.e., a V-shaped cross-section and an H-shaped cross-section. Previous researches indicated that tensile strength of the V-shaped joint was lower than that of the H-shaped one due to the greater heterogeneity of strain distribution on the V-shaped joint during tensile process. In this work, impacts of the aspect ratio of FZ on the mechanical properties of laser welded thin section joints with an H-shaped cross-section profile were investigated. Welding conditions corresponding to two typical H-shaped joints (i.e., Wnarrower with a narrower FZ, and Wwider with a wider FZ) were decided through a laser welding orthogonal experimental plan. Then, the microstructure and properties of both joints were examined and compared. The results show that the tensile strength of joint Wnarrower and joint Wwider was about 72% and 80.9% that of the base metal, respectively. Both joints fractured in the FZ during tensile processes. The low-cycle fatigue life of the base metal, the joint Wnarrower and the joint Wwider were 3377.5 cycles, 2825 cycles and 3155.3 cycles, respectively. By using high-speed imaging, it was found that the fatigue crack of joint Wnarrower initiated and propagated inside the fusion zone, while the fatigue crack of the joint Wwider initiated at the edge of the base metal and propagated for a distance within the base metal before entering into the fusion zone. This work promoted our understanding about the influence of the weld bead shape on the properties of laser welded thin section joints.
1. Introduction
Impacts of cross-section profiles of fusion zone (FZ) on the service performance of laser-welded joints have been studied by many researchers. Benyounis et al. [1] developed linear and quadratic polynomial equations which described the correlation between weld bead geometry and welding parameters including laser power, welding speed and defocusing amount. Hann et al. [2] presented a simple physical model to predict melt depth and width by using the concept of mean surface enthalpy which was derived from both material parameters and laser parameters. Li [3] investigated the effect of parameters on weld bead geometry in high-power laser welding of thick plate. The results showed that the width and depth of the weld seam decreased with the increasing of the welding speed. As a result, the geometry of the weld cross-section changed from a big-head shape to a needle-like shape. Kim et al. [4] proposed a simple scaling law that could predict the penetration depth by considering heat flow characteristics and multiple reflections. Volpp et al. [5] presented an analytical model to calculate the keyhole geometry using a ray-tracing method. Ayoola et al. [6] found that the weld bead geometry can be regulated by changing the spatial and temporal distribution of laser energy, such as power density, interaction time, and energy density. Tchoffo Ngoula [7] studied the influence of weld toe geometry on the fatigue life of cruciform welded joints. The result showed that the flank angle has a significant influence on the calculated fatigue life: the fatigue life decreases with increasing flank angle. Matsuoka [8] found that the weld geometry could affect the thermal deformation of thin stainless steel sheet in laser micro-welding and the smallest deformation could be achieved by forming a proper weld geometry. Furthermore, Okamoto [9] ensured that the smallest deformation was achieved around the maximum aspect ratio of the weld bead regardless of specimen thickness and spot diameter. Liu et al. [10] investigated the correlations between the microstructure and typical weld shapes of SUS201 including [peanut-shaped welds (PWs), nail-shaped welds (NWs), and wedge-shaped welds (WWs). The result showed that the three weld morphologies presented different microstructures and distributions of alloying elements.
Fiber laser welding has many advantages, such as high energy density, low heat input, small welding deformation, and flexibility [11,12,13,14,15,16]. Compared with Nd:YAG lasers, a fiber laser beam has a higher power density and larger Rayleigh length. Therefore, fiber lasers are more suitable for welding thin-walled metals [12,14,16,17,18,19,20]. Casalino et al. [18] studied the laser offset welding of AZ31B magnesium alloy to 316 stainless steel. The result showed that a thin intermetallic compounds was formed in the FZ and the ultimate tensile strength exceeded the value of 100 MPa. Campanelli et al. [20] used fiber laser welding to produce Ti6Al4V butt joints with a thickness of 2 mm and found that the increase of the welding speed led to restricted HAZ and FZ and a conic-shaped bead. In this work, fiber laser welding was used to conduct the experiment. In recent years, laser-arc hybrid welding also attracted researchers’ interest [12,17,21]. Zhang et al. [12] compared the microstructure and properties of MIG welding joint and laser-MIG hybrid welding joints. In laser full-penetration welding of thin workpieces, there are two kinds of typical cross-section profiles of the fusion zone (FZ): V-shaped and H-shaped [22]. Previous studies revealed that the weld joint with a V-shaped FZ showed a lower tensile strength than that of a joint with an H-shaped FZ due to that the heterogeneity of strain distribution on the former was greater than that on the latter [23]. However, investigation on effects of aspect ratio of FZ on the mechanical properties of laser welded thin section joints with H-shaped cross-section was rather limited.
Magnesium alloys have been widely used in aviation, aerospace, transportation, electronics, and other industrial sectors, since magnesium alloys have high specific strength, high elastic modulus, and good vibration resistance, and also possess good electrical conductivity, thermal conductivity, electromagnetic shielding performance, and good recyclability. In this paper, the influences of the aspect ratio of FZ on the mechanical properties of laser-welded 1-mm thick AZ31 magnesium alloy joints with H-shaped FZ were investigated. The results of this study have certain guiding significance on optimizing the service performance of laser welded thin-wall AZ31 structures.
2. Materials and Methods
2.1. Materials and Welding Test
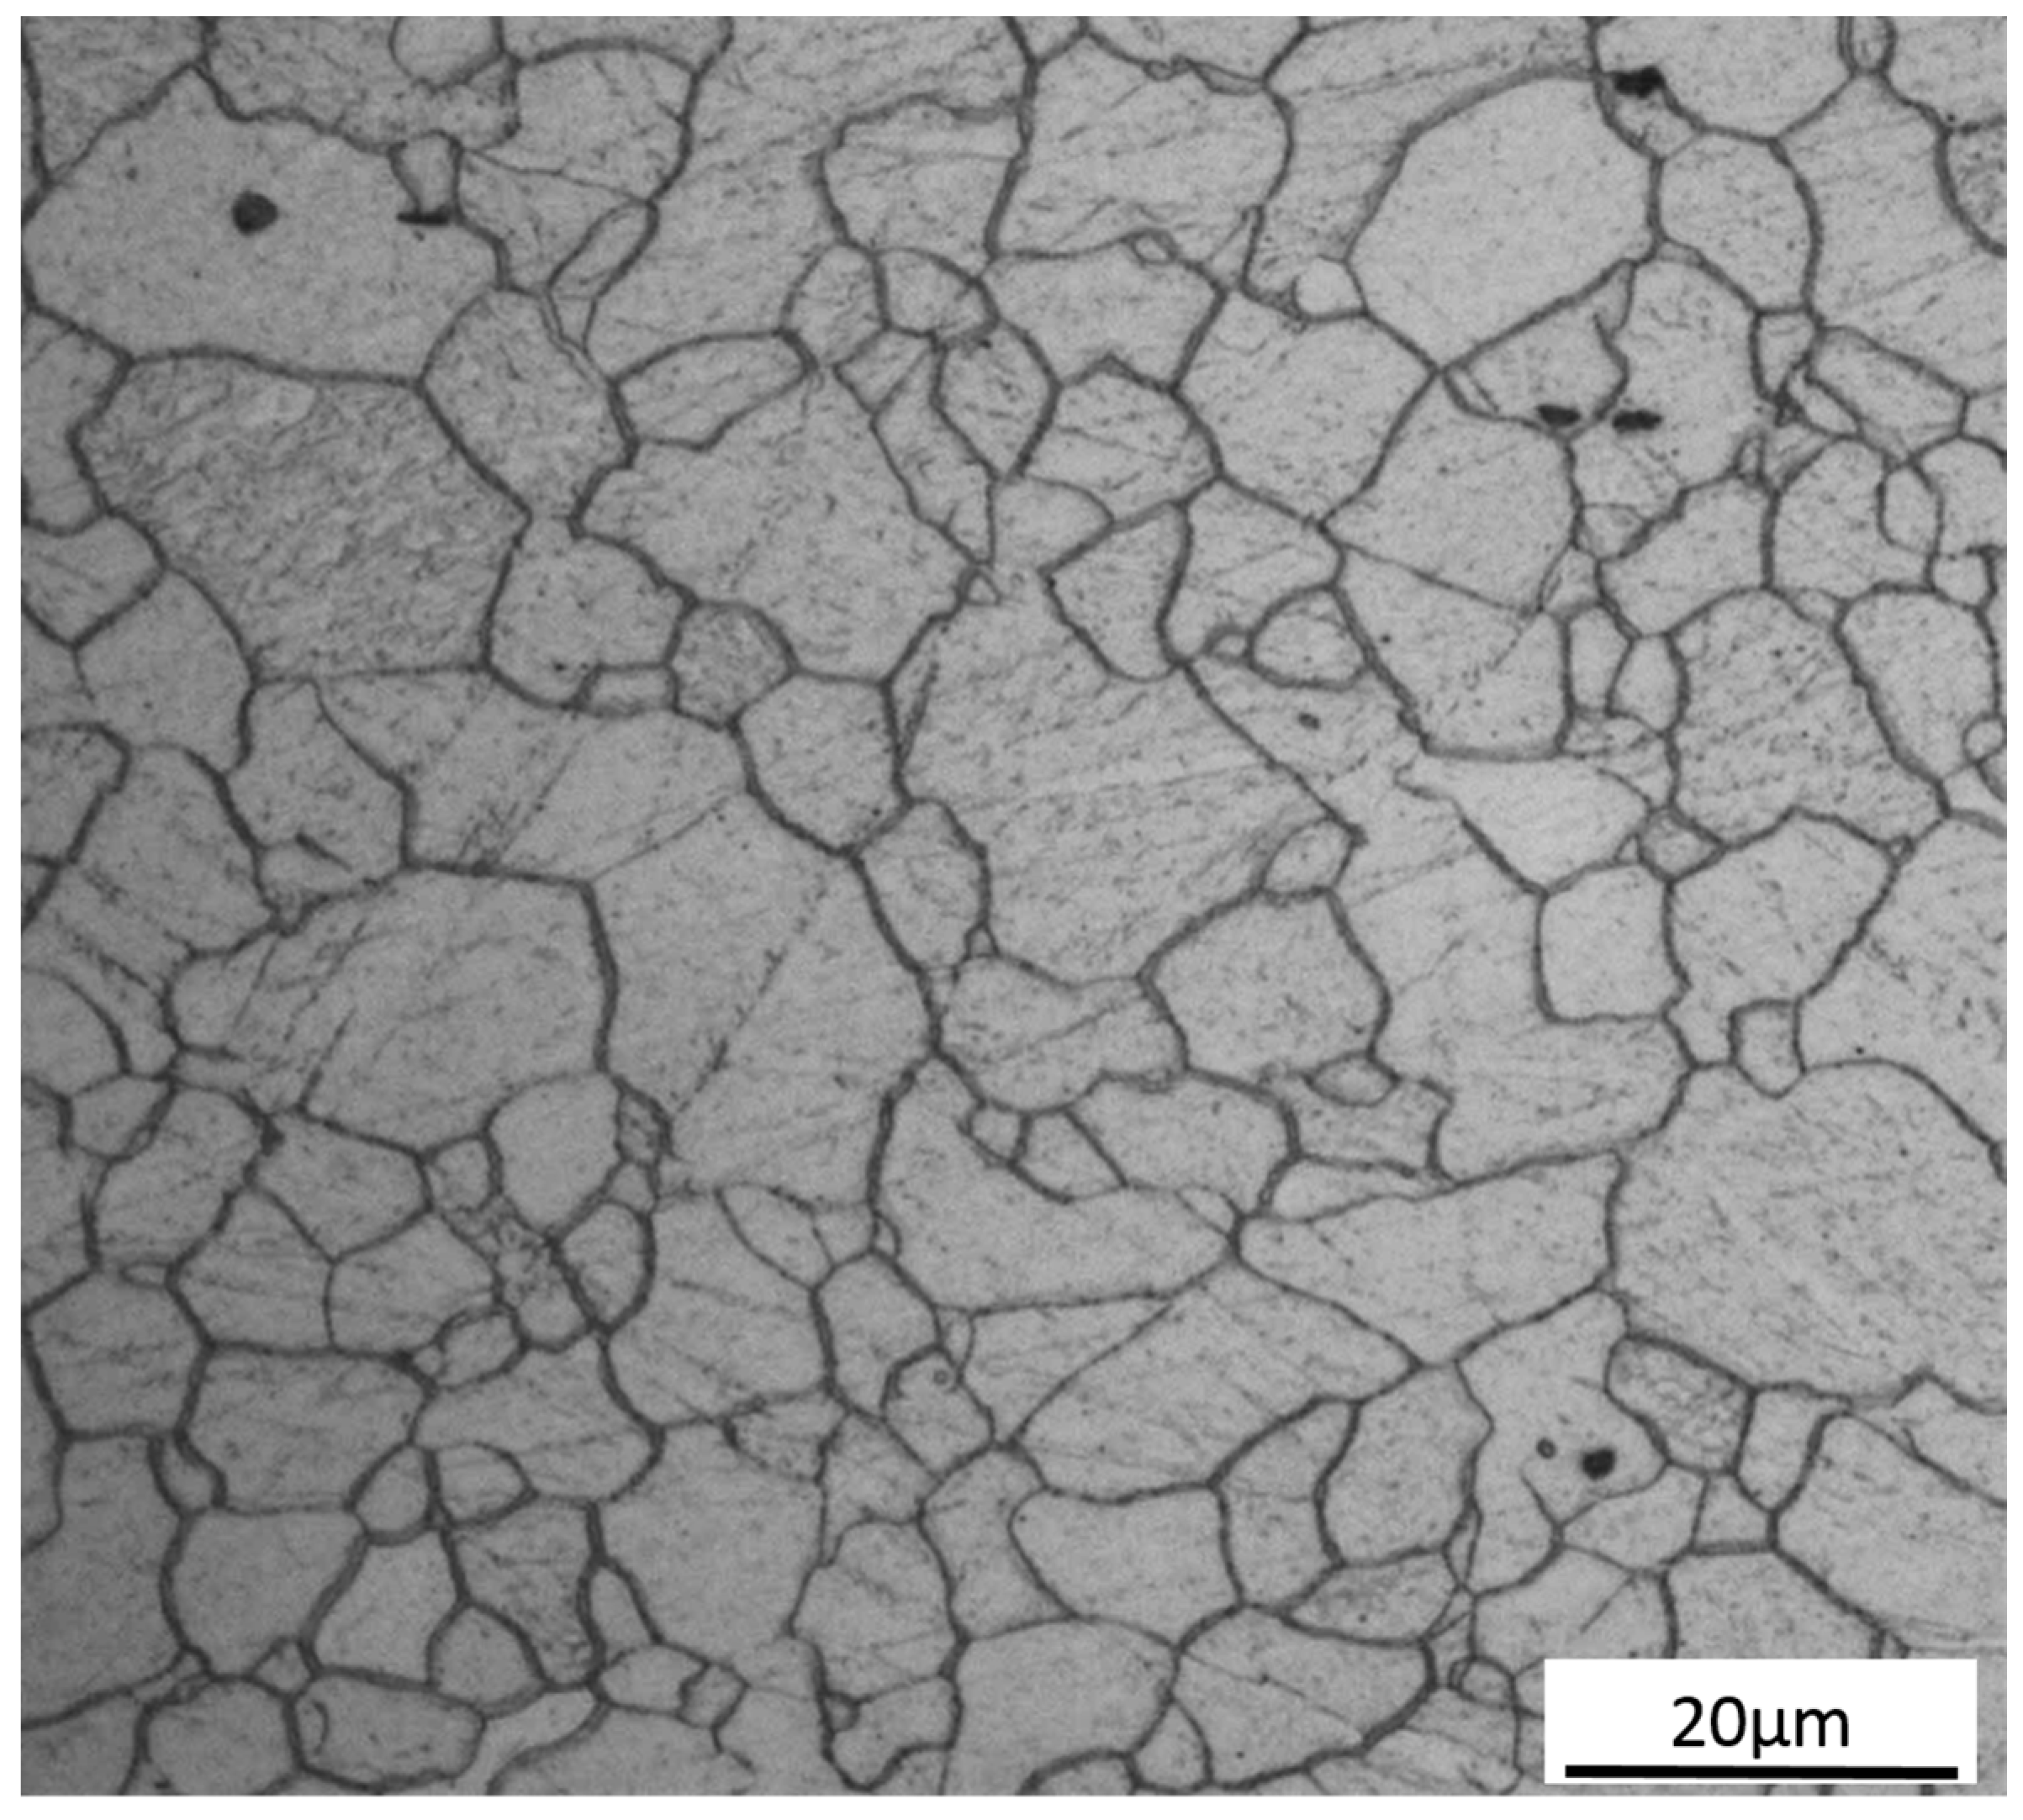
This research used 1-mm AZ31 magnesium alloy sheet and the base metal (BM) is composed of equiaxed grains, as shown in Figure 1. Its chemical composition has been shown in Table 1. Before the welding, the plates had been burnished by sandpaper and cleaned with acetone to remove the oxide film and oil on the surface. The welding equipment was an IPG YLS-4000 laser device produced by IPG Photonics Corporation (Oxford, MA, USA) and high-purity argon was used as the shielding gas in the LBW process. The welding direction was perpendicular to the rolling direction of the base metal. The rolling direction of the plate was determined according to the surface morphology of the plate. A set of orthogonal experiments were conducted from which two weld joints with quite different weld widths were chosen to compare the microstructure and properties. The parameters are shown in Table 2.
2.2. Microstructure Examination and Microhardness Test
The metallographic samples were polished and then etched with a kind of corrosive (4.2 g picric acid, 10 mL acetic acid, 10 mL diluted water and 70 mL ethanol) to reveal the microstructure. The microstructure of the weld joints was observed under a Nikon MA200 metallographic microscope (Nikon, Tokyo, Japan). The microhardness of the weld joints was measured using a Vickers hardness tester with the load of 0.49 N and a dwell time of 15 s.
2.3. Mechanical Property Test
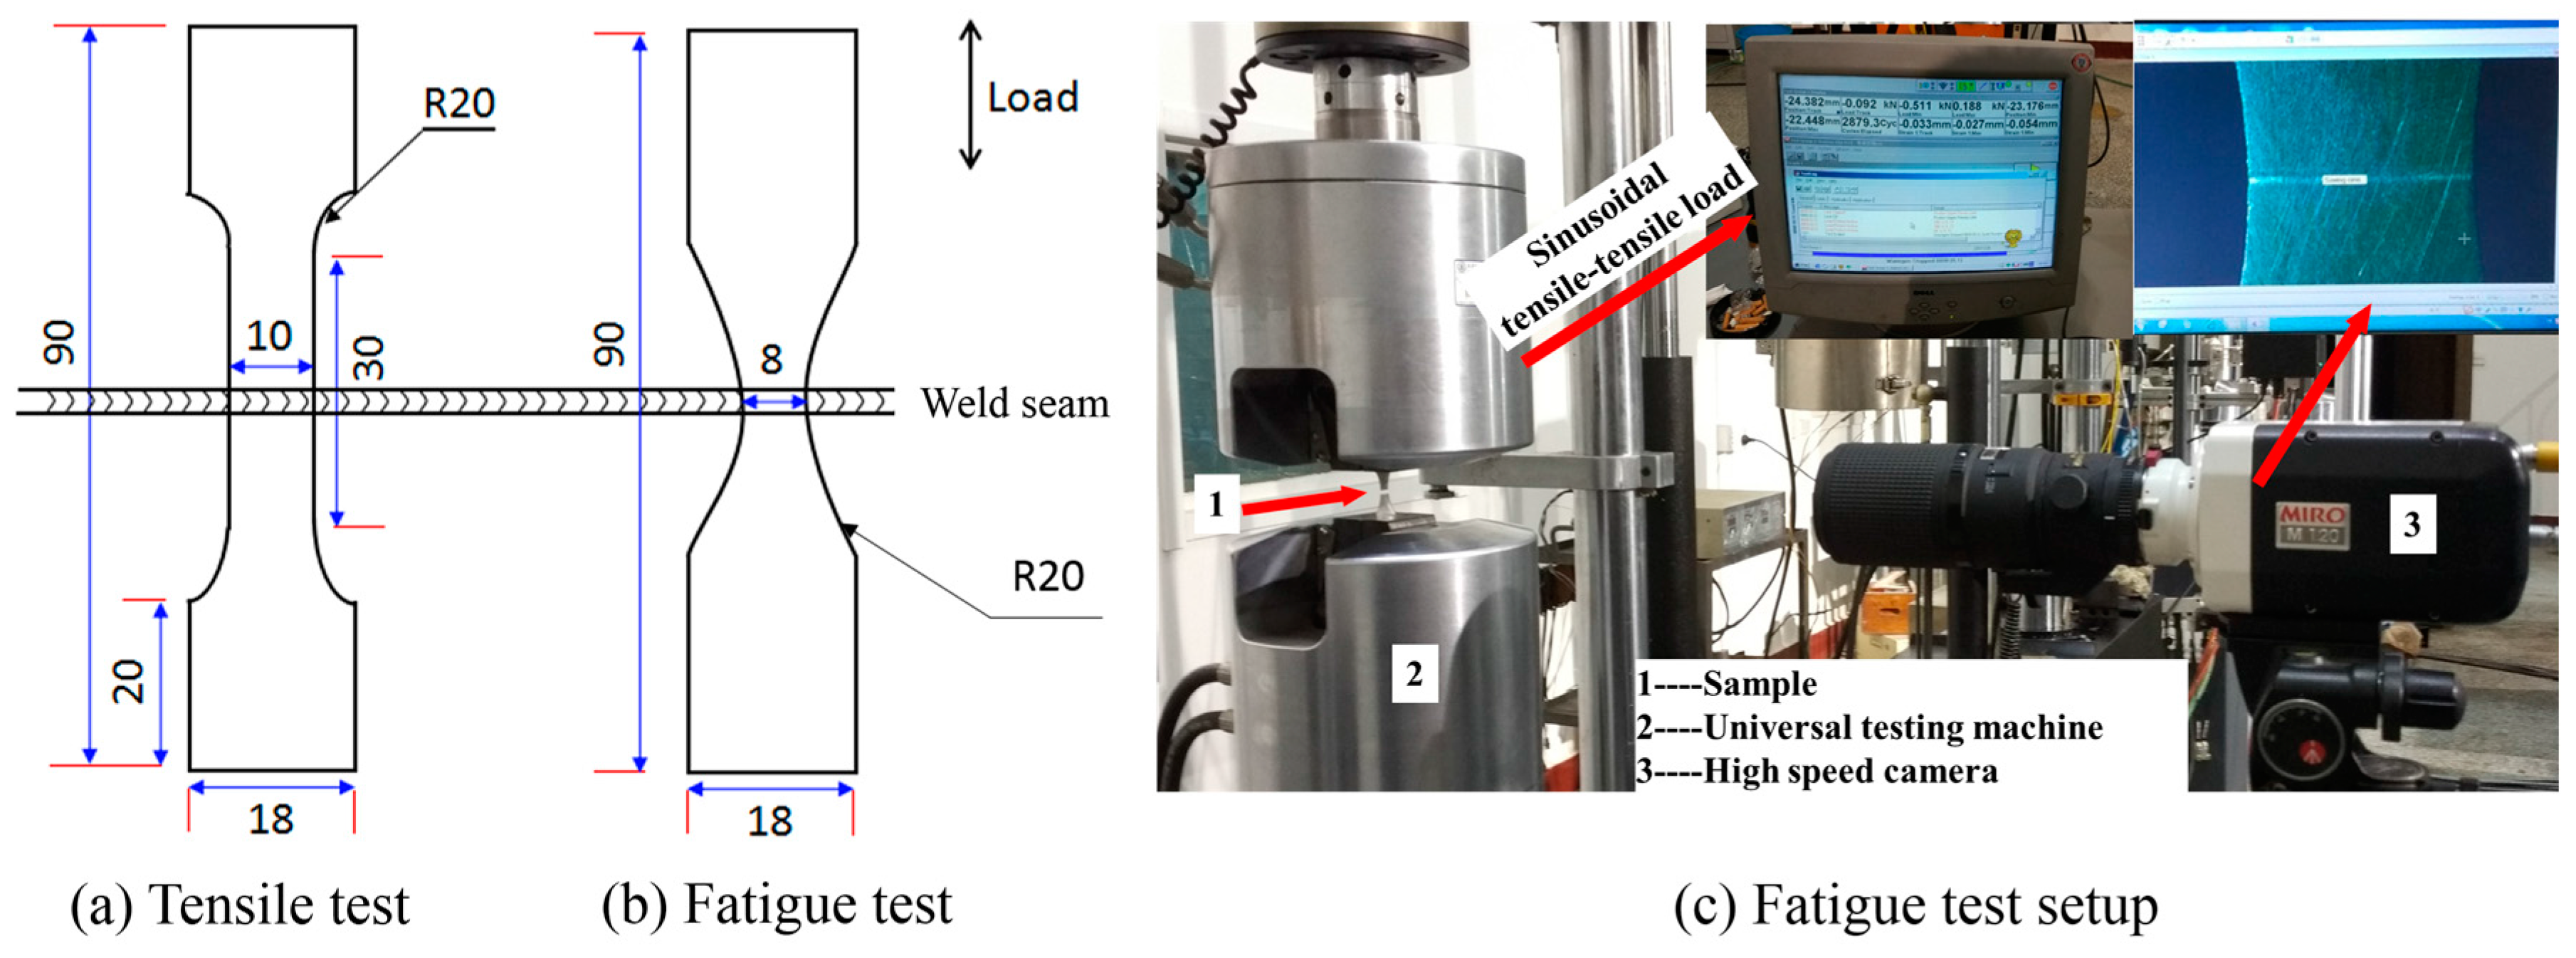
The dimensions of tensile test specimen and fatigue test specimen are shown in Figure 2. The tensile test was carried out using a CSS-88100 universal testing machine (SINOMACH, Beijing, China) with a stretching rate 1 mm/min. The sinusoidal tensile-tensile load was employed in the fatigue test with the aid of an INSTRON fatigue testing machine. The maximum transient load was 1.44 KN and the minimum transient load was 0.144 KN. The stress ratio was R = σmin/σmax = 0.1 and the frequency was 15 HZ. The evolution of the fatigue crack were recorded by using a high speed camera and the shooting rate was 24 fps, as shown in Figure 2. The tensile fracture morphology and fatigue fracture morphology were observed with SEM (JEOL, Tokyo, Japan). Before the fatigue test, the specimens were polished smooth with a metallographic procedure.
3. Results and Discussion
3.1. Effect of Parameters on Weld Shape
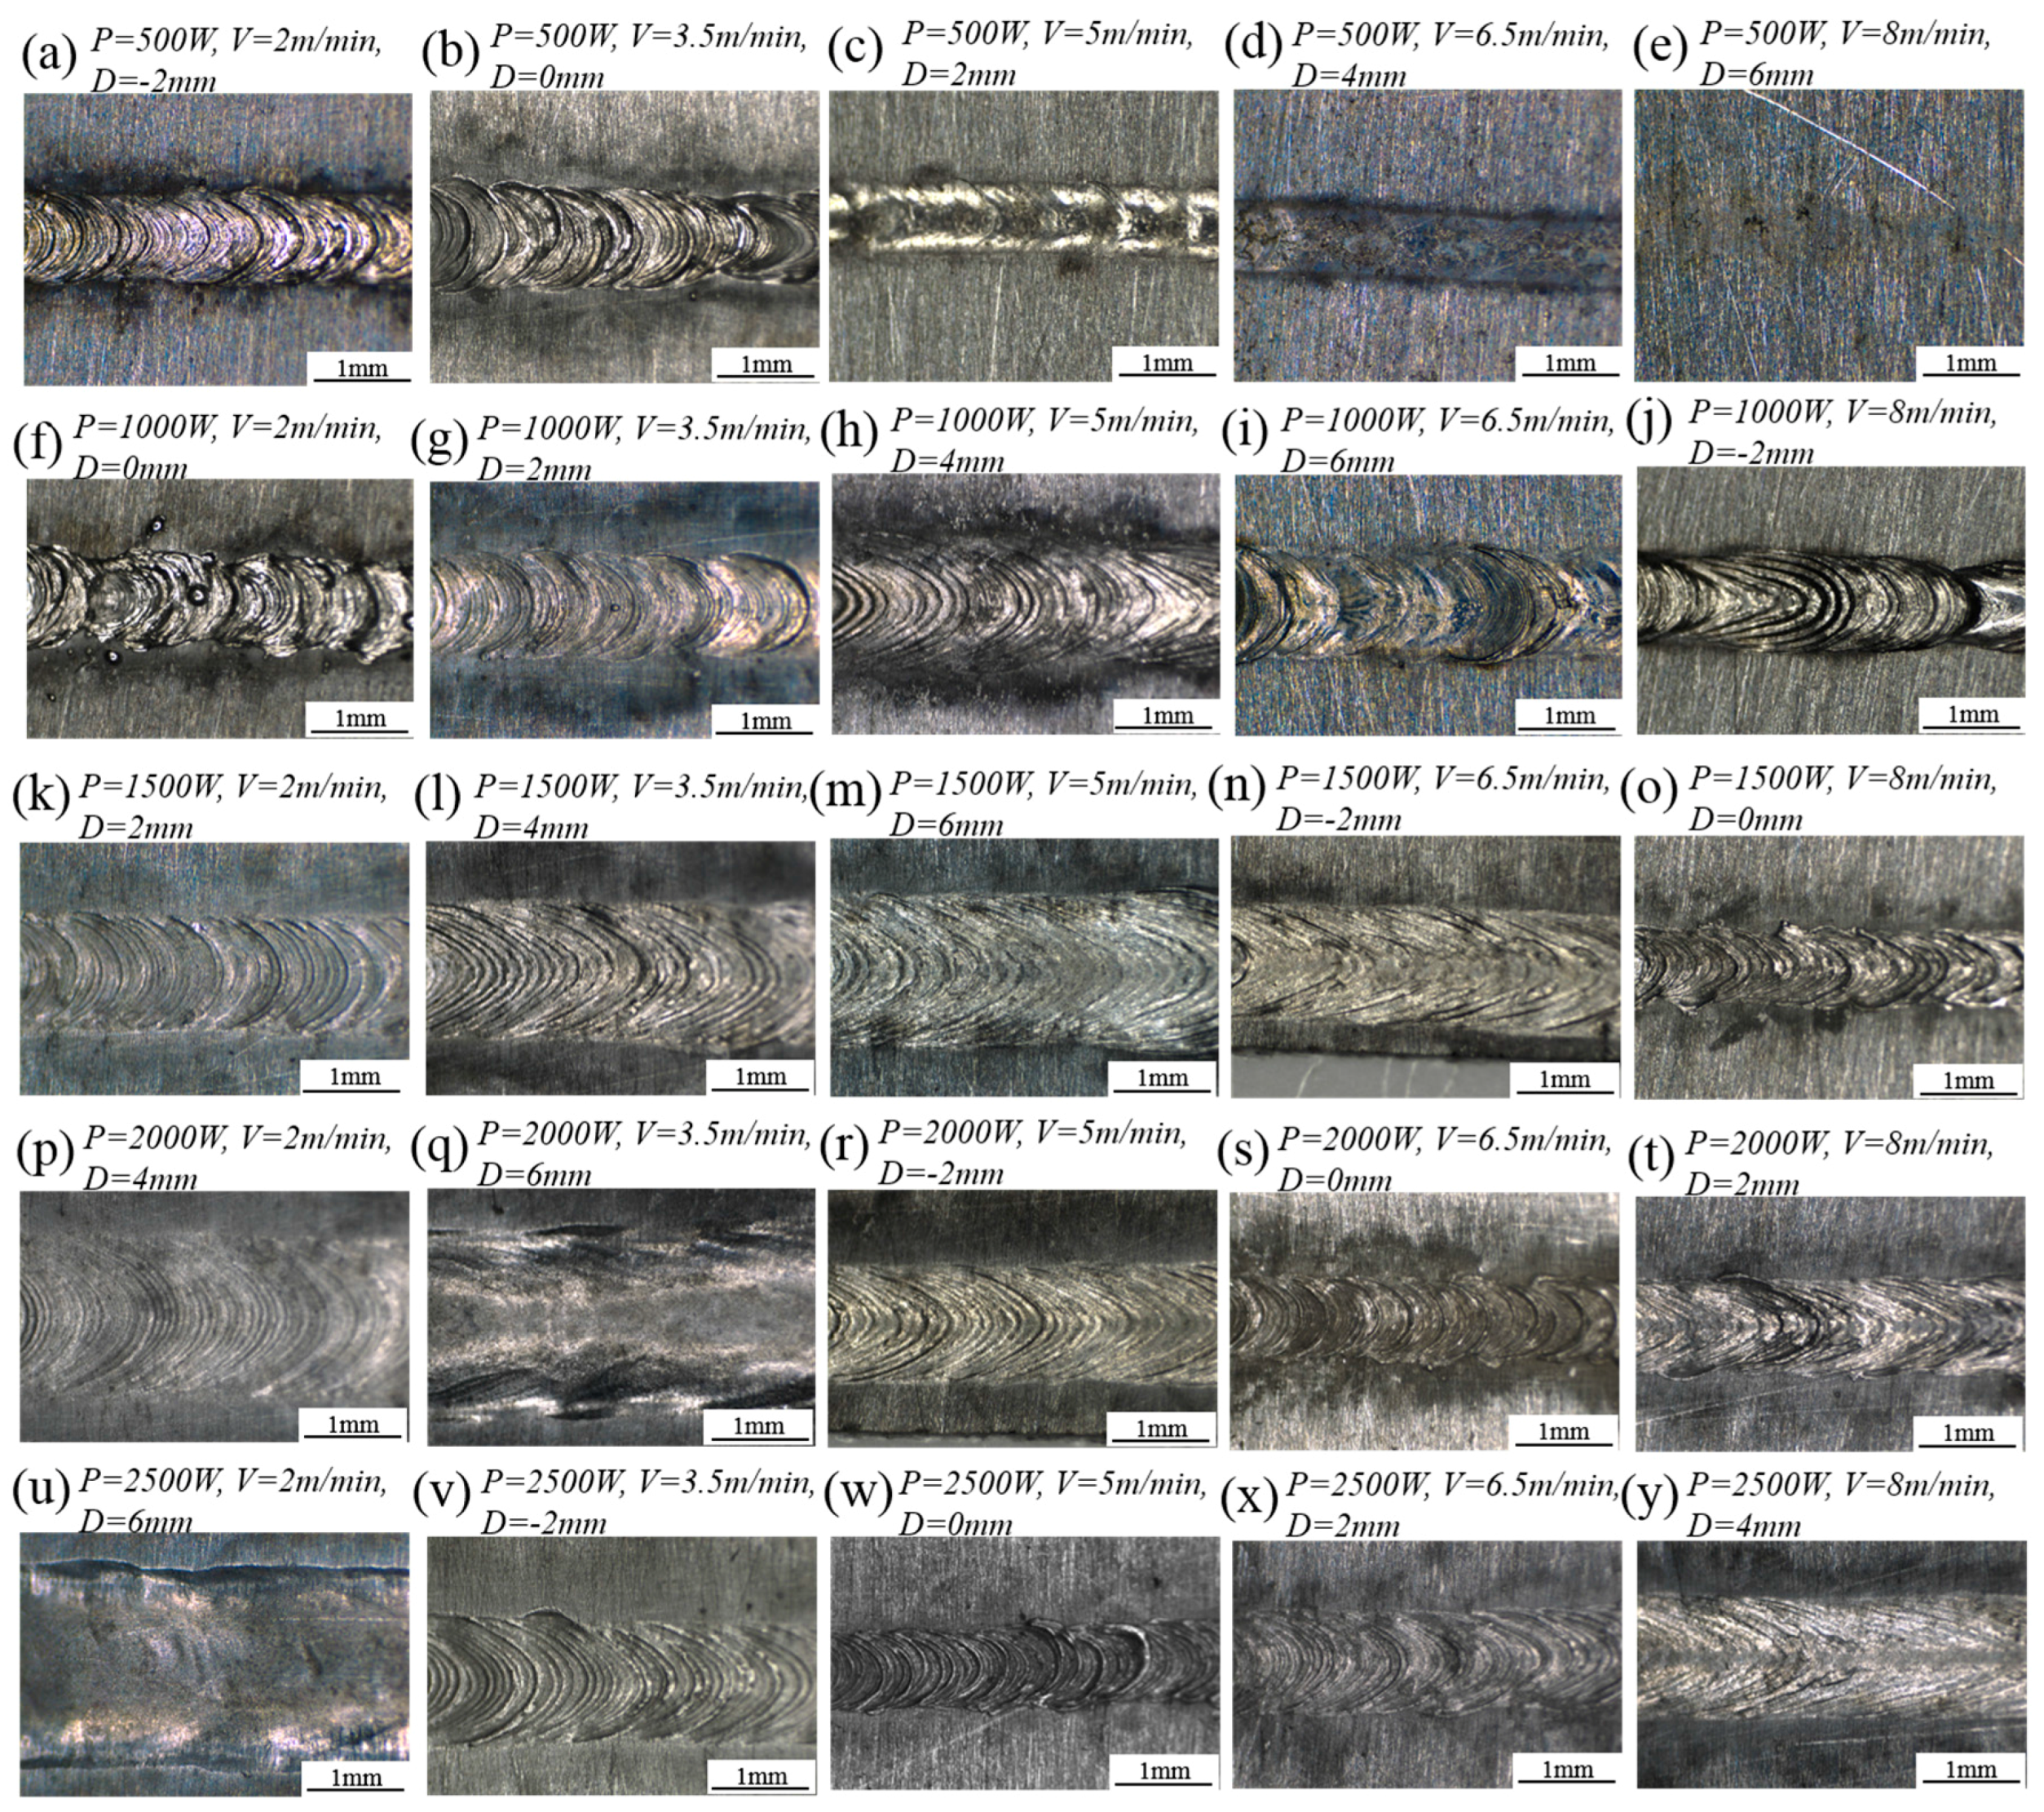
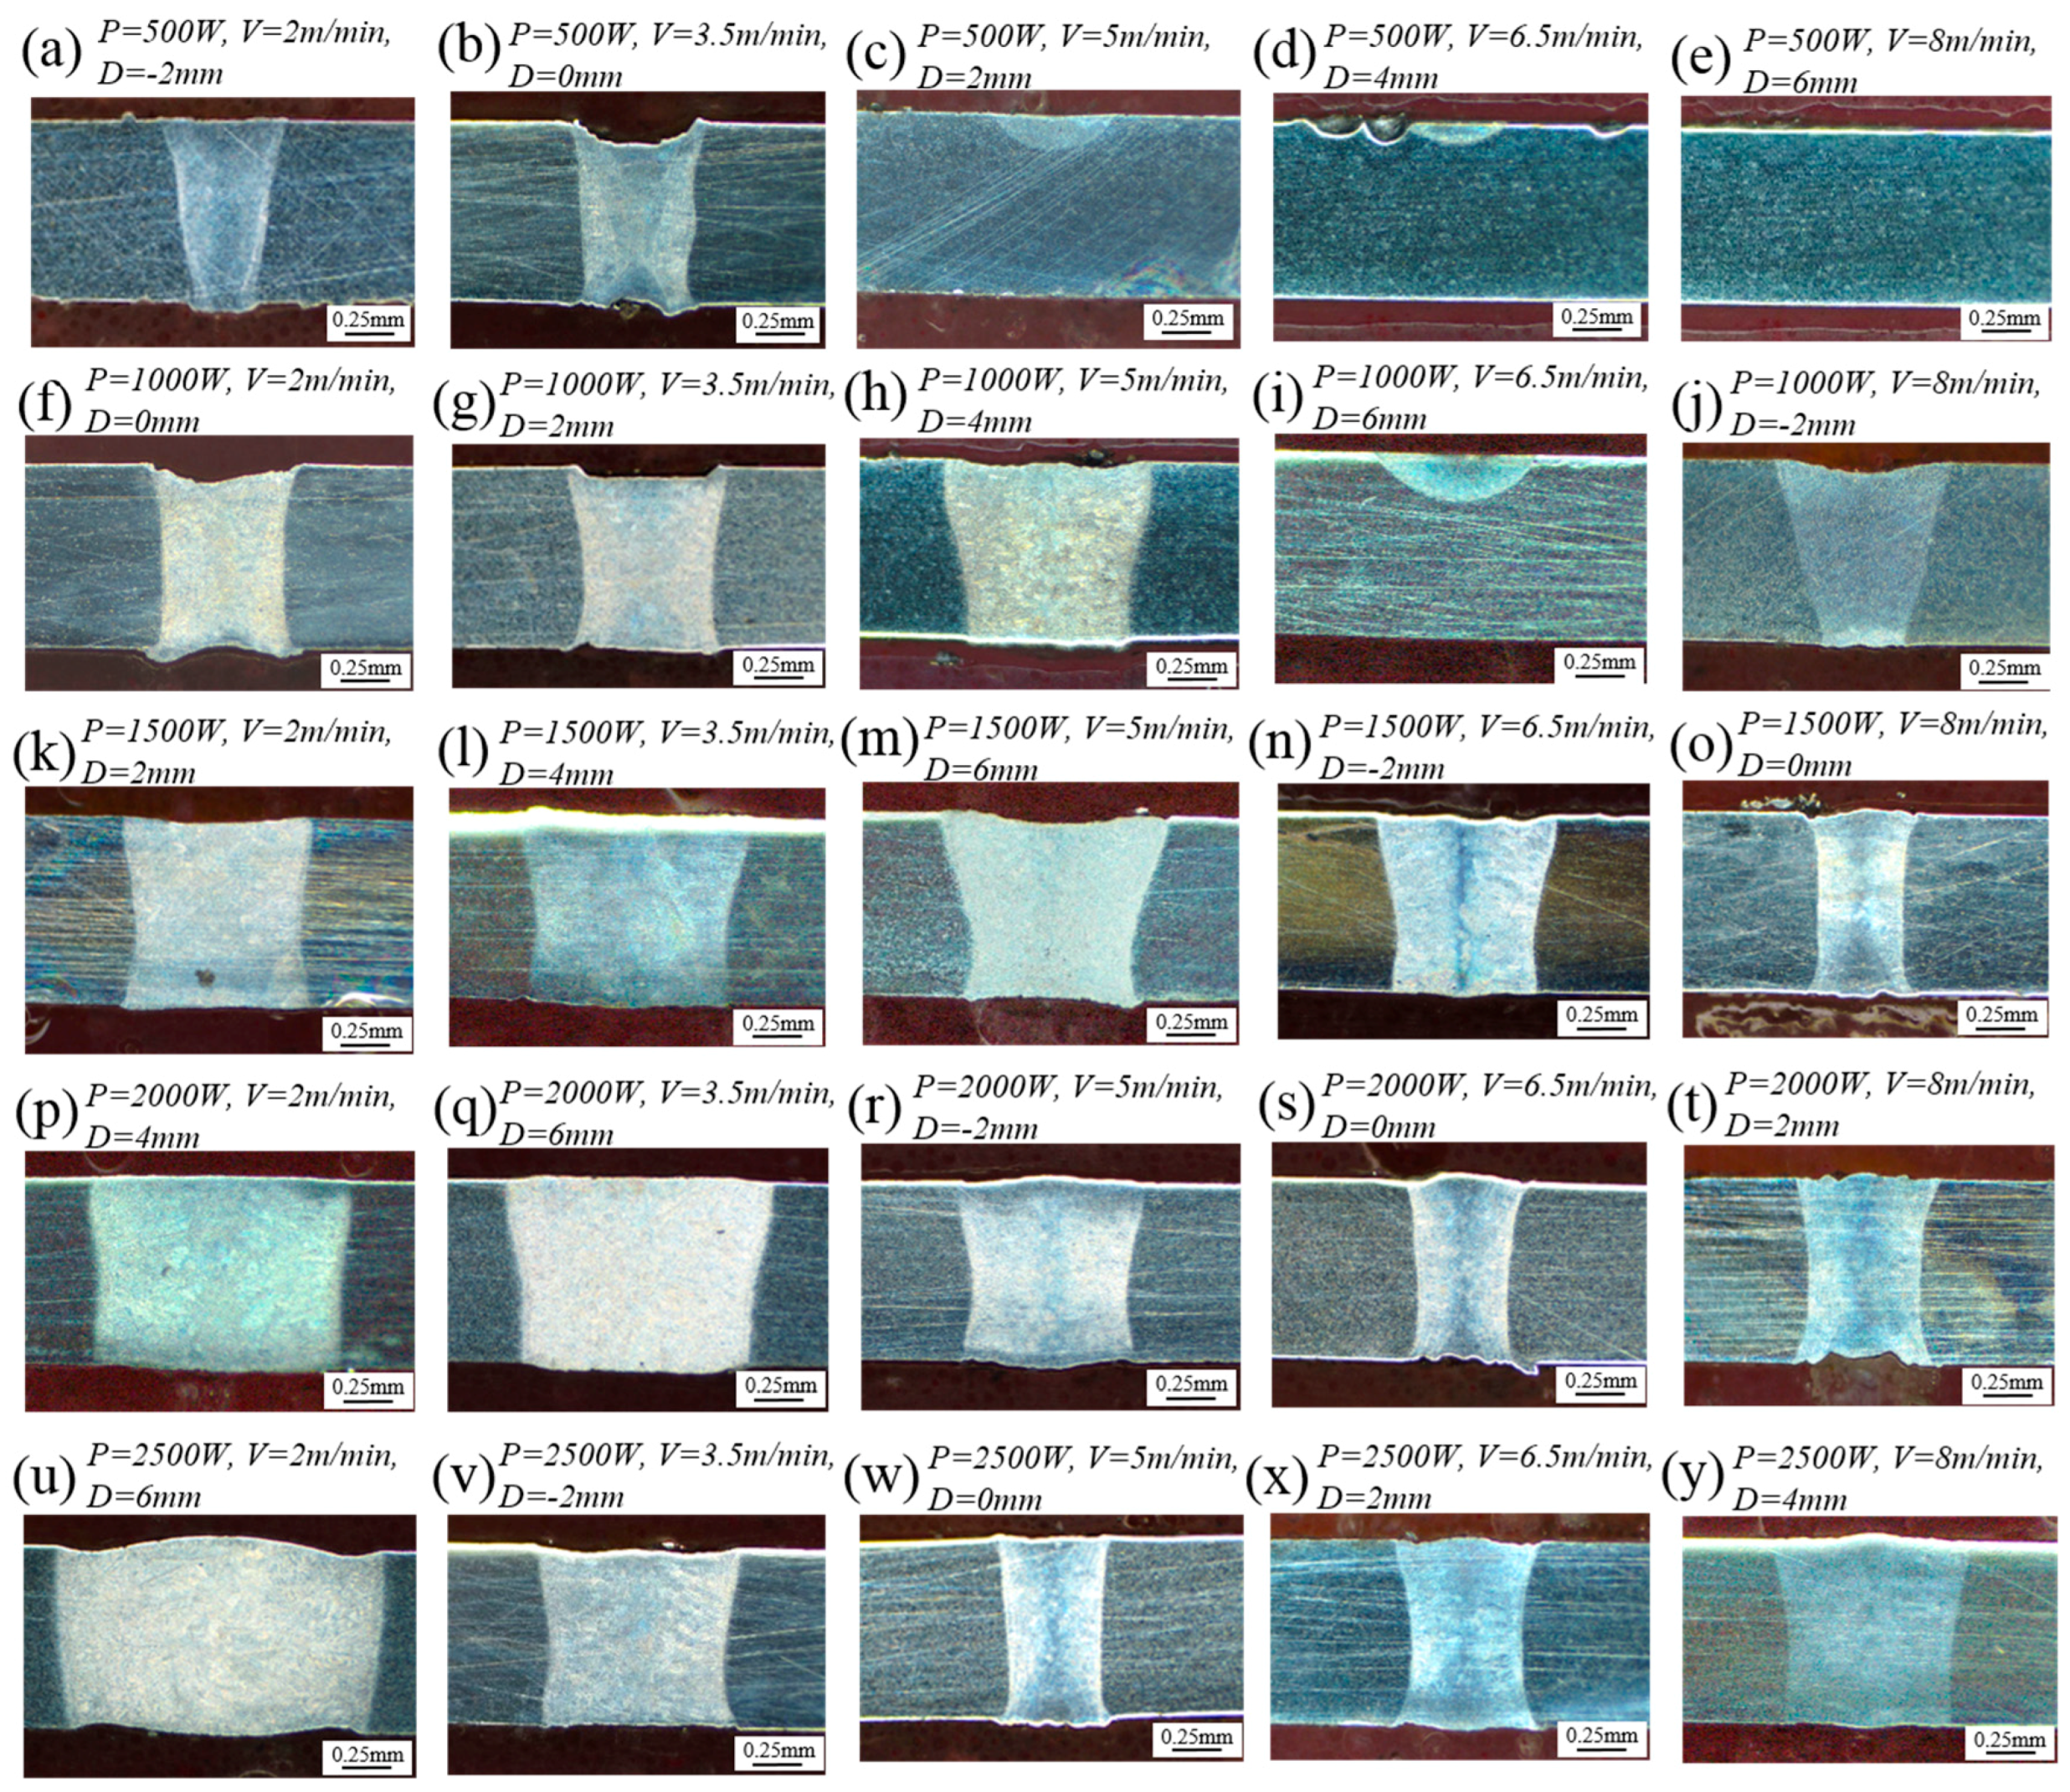
Figure 3 shows the upper surface morphology of the welded joints achieved through the orthogonal experiments. Figure 4 shows the cross-sections of the welded joints. In order to investigate the influence of different aspect ratio on the property of welded joints of magnesium alloy, two welded joints with different aspect ratios and good shape quality were chosen. The welded joint 15 (Figure 3o) and welded joint 18 (Figure 3r) had a relatively good forming quality. Additionally, they presented different aspect ratios as showed in the Figure 4o,r. Thus, these two joints were chosen as the research objects. Joint 15, with a narrower fusion zone, was recorded as Wnarrower and joint 18 was recorded as Wwider.
3.2. Microstructure
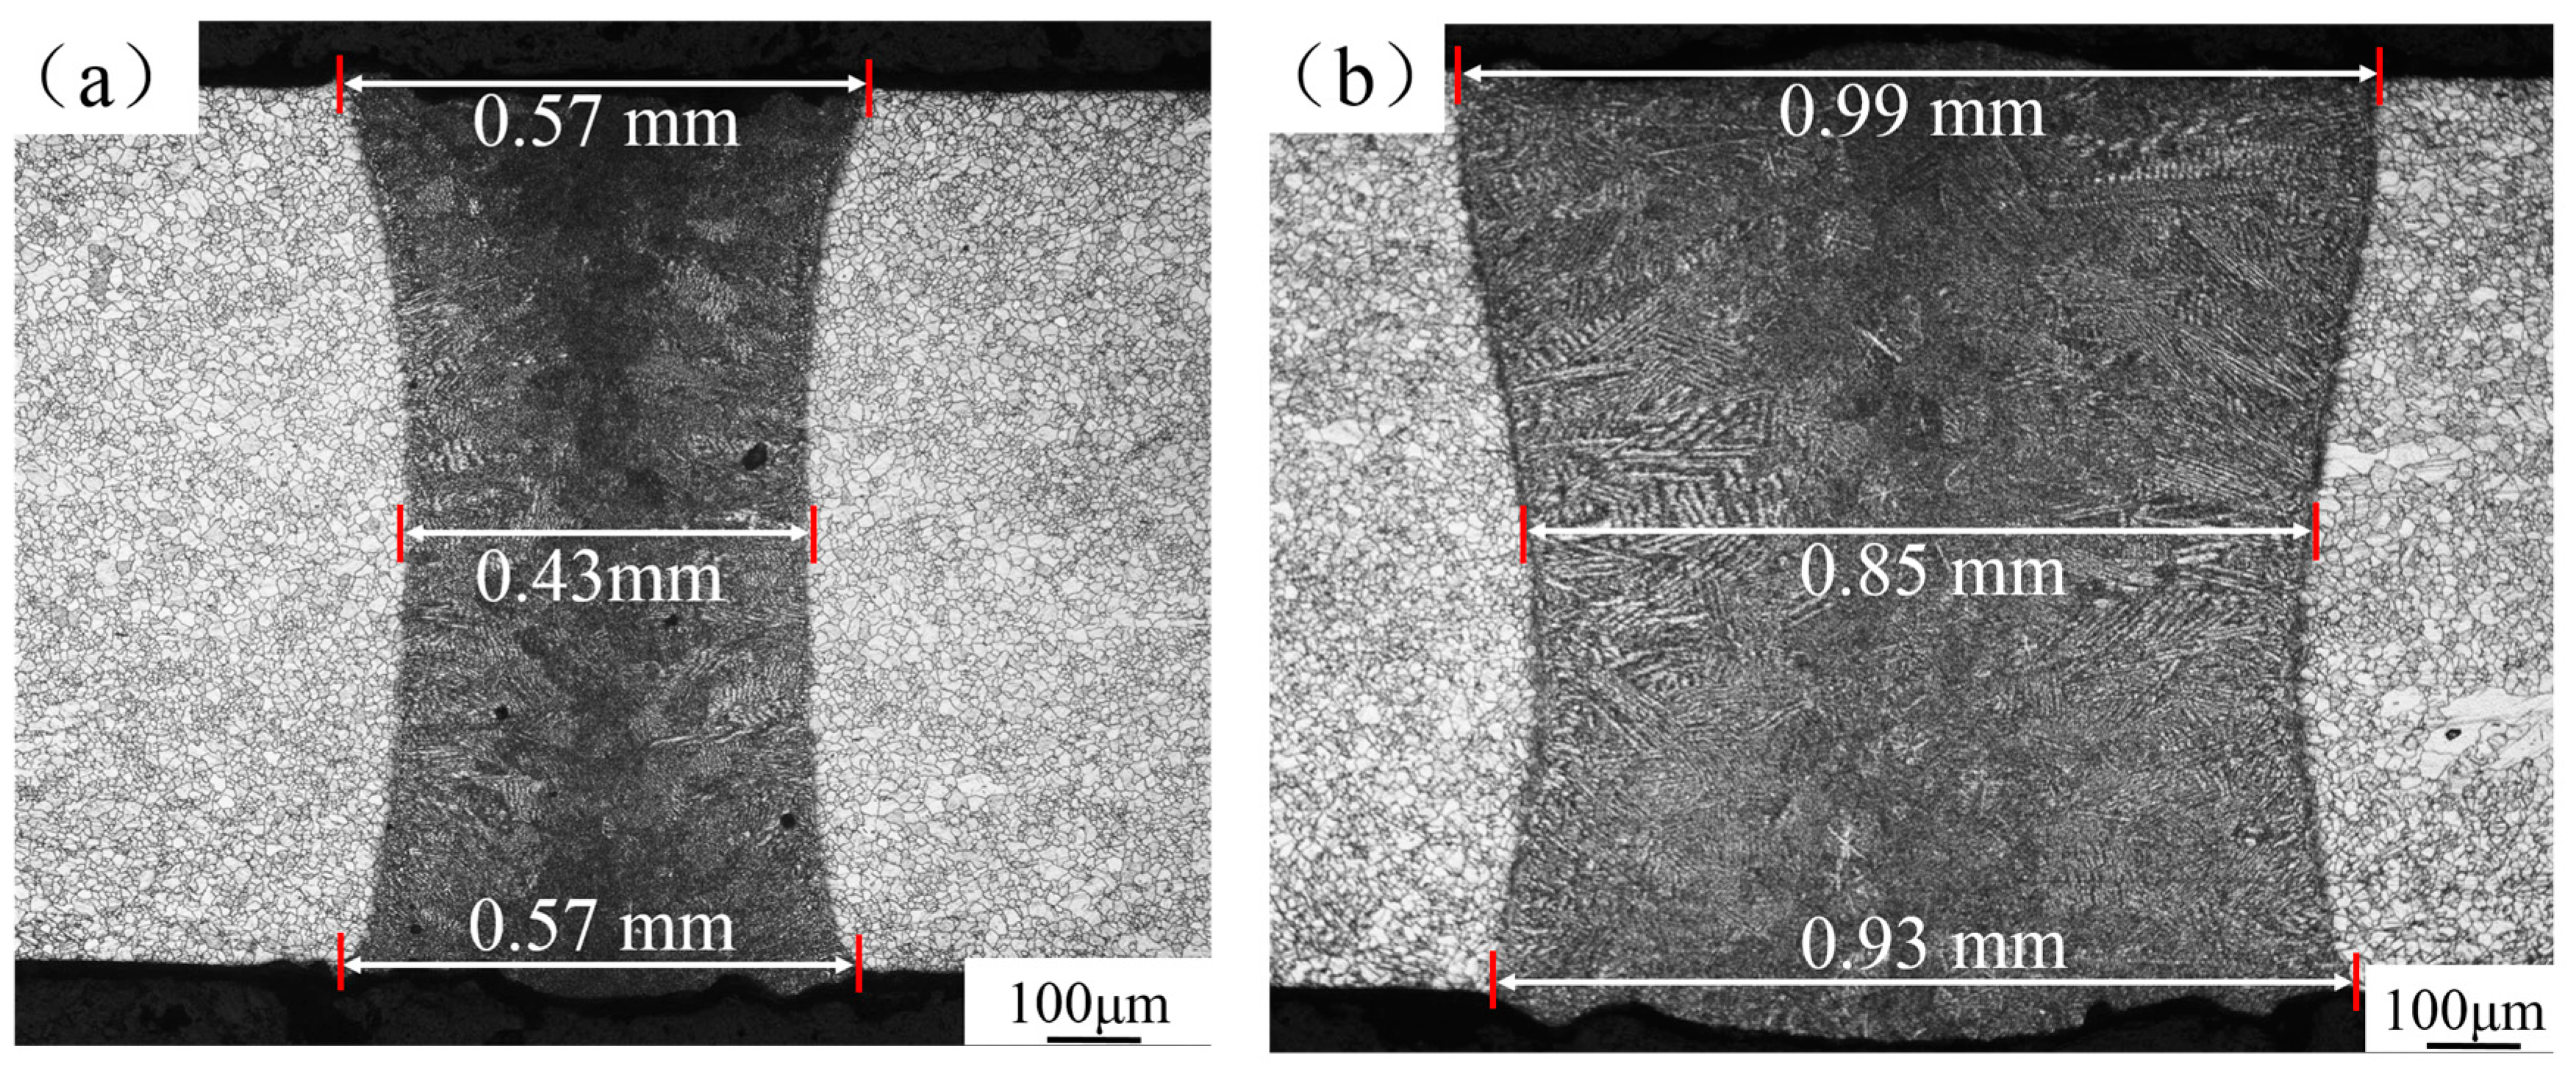
Figure 5 shows the cross-section of welded joints Wnarrower and Wwider. The average weld width of joint Wnarrower is about 0.52 mm. However, the average weld width of Wwider is about 0.92 mm, 1.77 times of that of joint Wnarrower. The aspect ratios of the two joints are 1.92 and 1.09, respectively. The difference was mainly caused by the different defocusing amount during welding process.
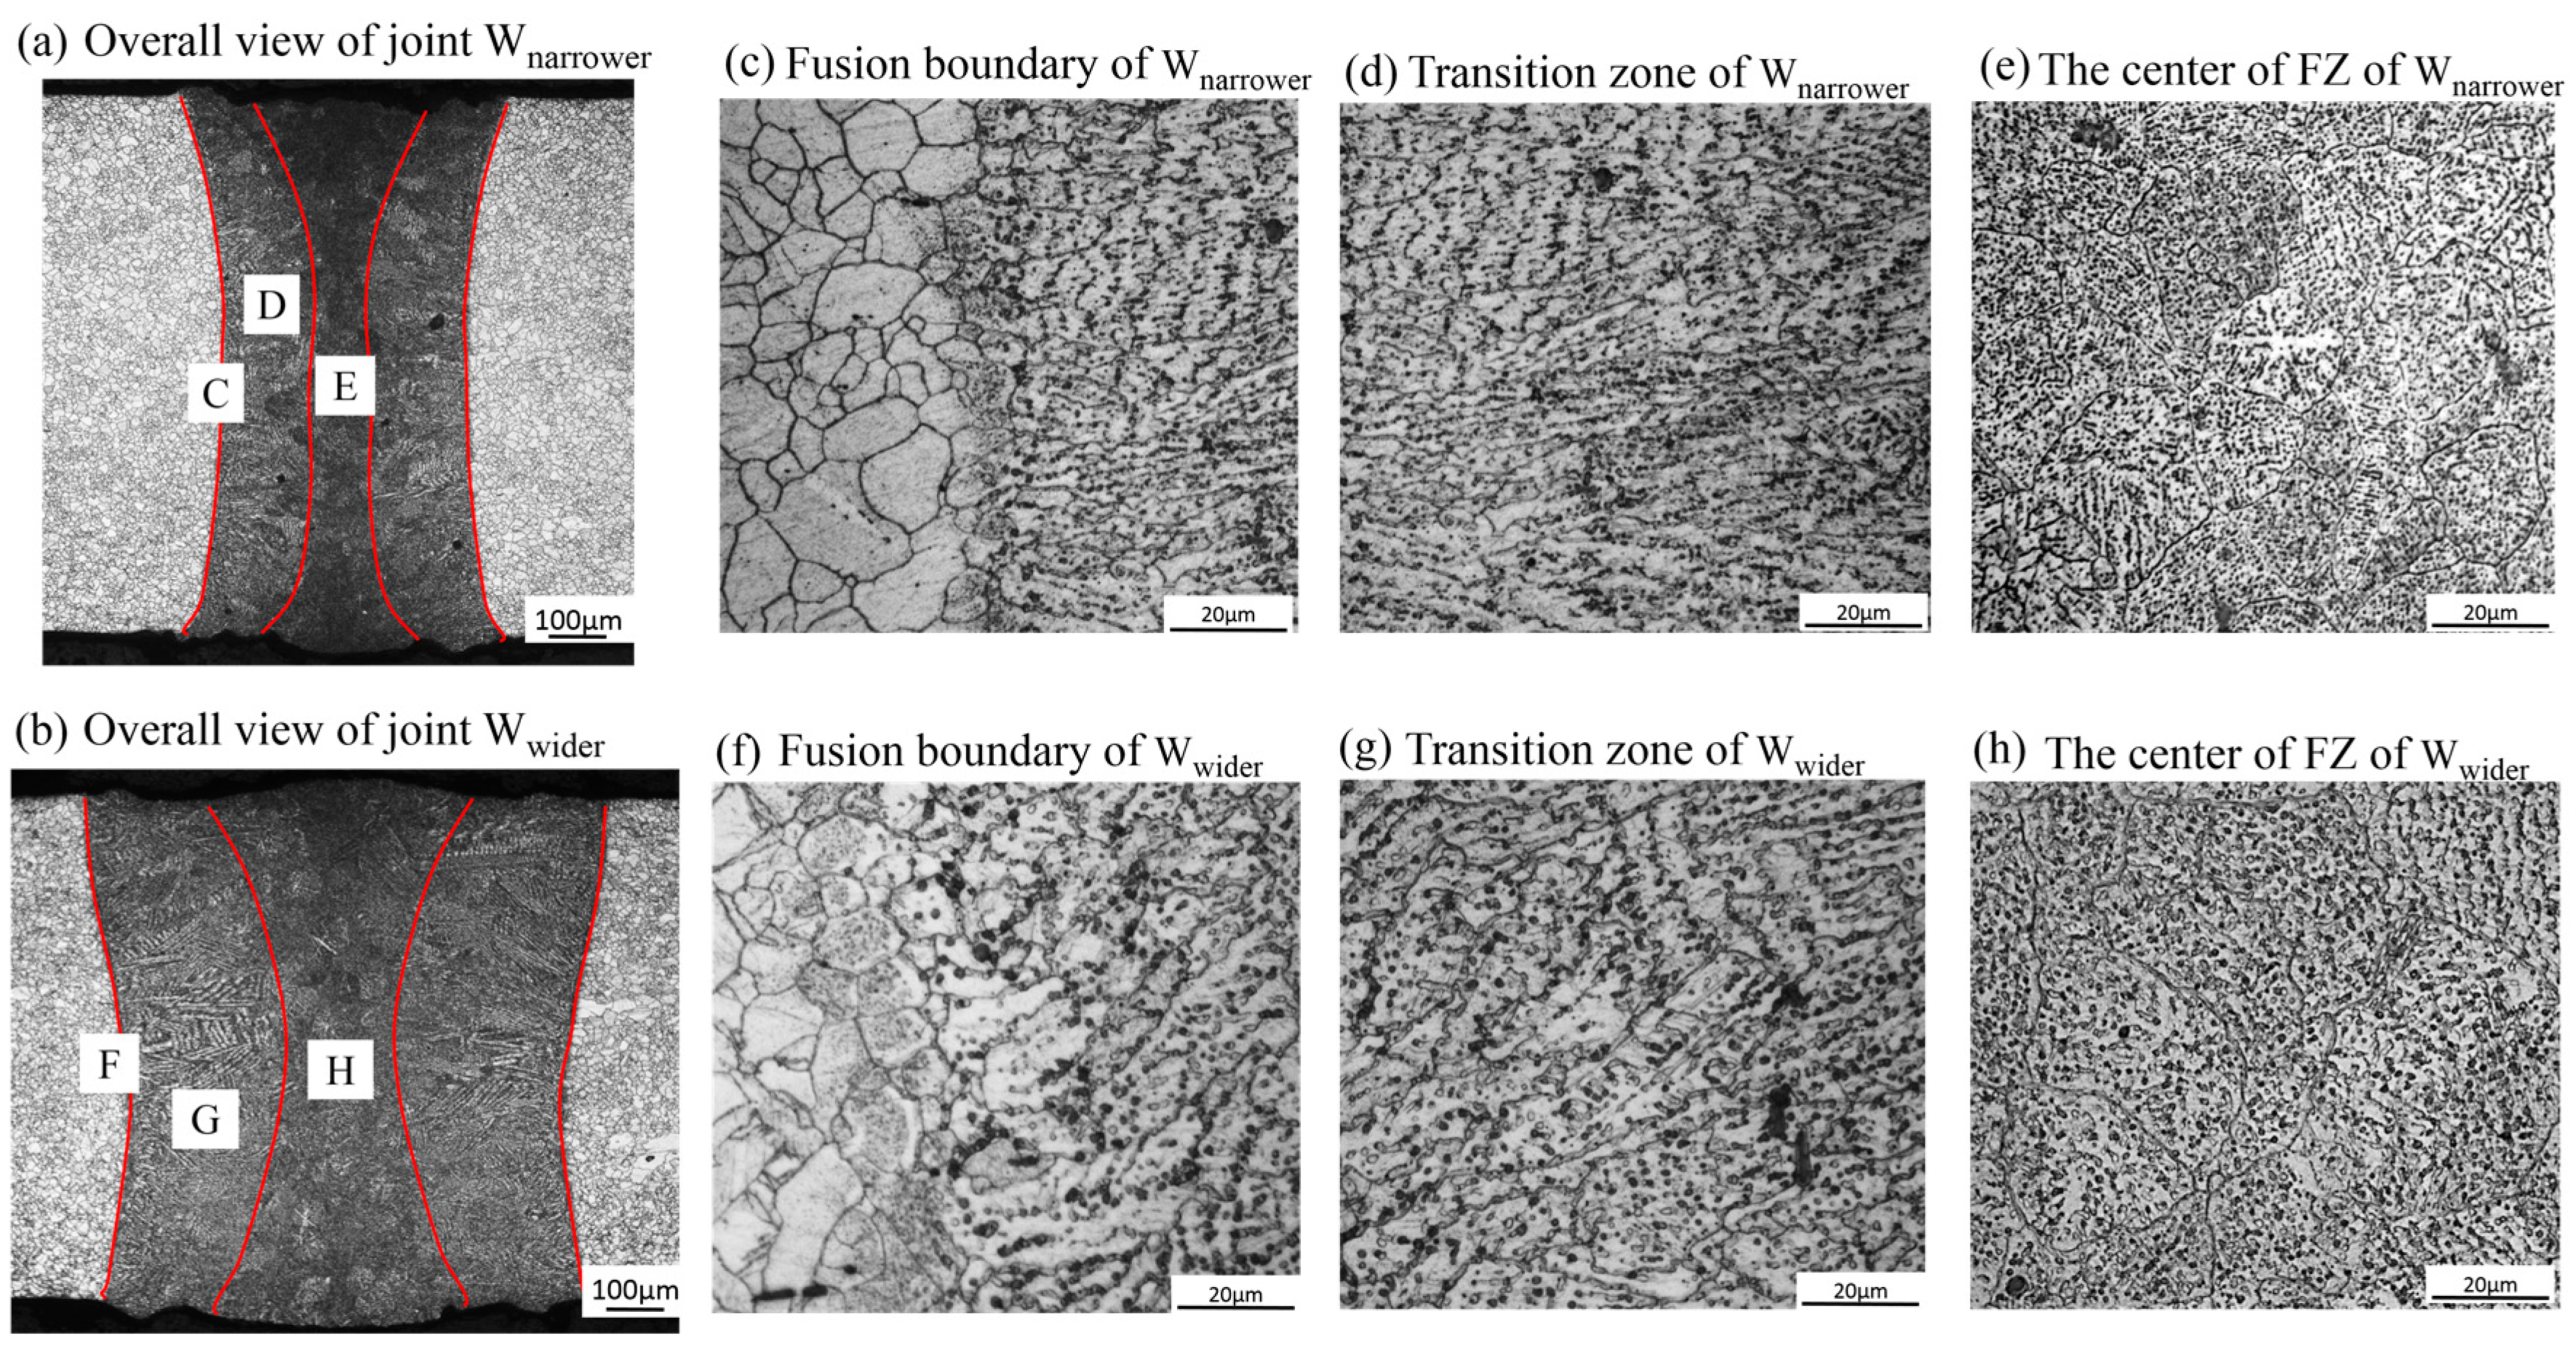
Figure 6c,f present the fusion boundary of joint Wnarrower and Wwider, respectively. On the base metal side are the equiaxed grains and they did not show any obvious growth compared with the microstructure of the BM (Figure 1). Some equiaxed grains next to the fusion boundary precipitated some fine intermetallic phases. On the fusion zone side is the transition zone. This zone is composed of columnar grains as shown in Figure 6d,g. This is mainly because of the large temperature gradient around the fusion boundary which resulted from the high energy density of laser and good thermal conductivity of magnesium alloys. The center of the fusion zone is composed of equiaxed grains as shown in Figure 6e,h. The temperature gradient of the center of fusion zone was relatively smooth causing the formation of equiaxed crystals. During the welding process, many particles precipitated inside the fusion zone which are composed of Mg, Al, and Zn [24]. It is mainly because that in the solidification process, the alloying elements dissolved in the base metal diffused and gathered together which caused the formation of precipitations. Due to a larger defocusing amount, both the columnar grain zone and equiaxed grain zone of the joint Wwider are wider than that of joint Wnarrower. The size of grains of the two welded joints are similar. Compared with the base metal, the equiaxed grains in the fusion zone are obviously larger.
3.3. Microhardness
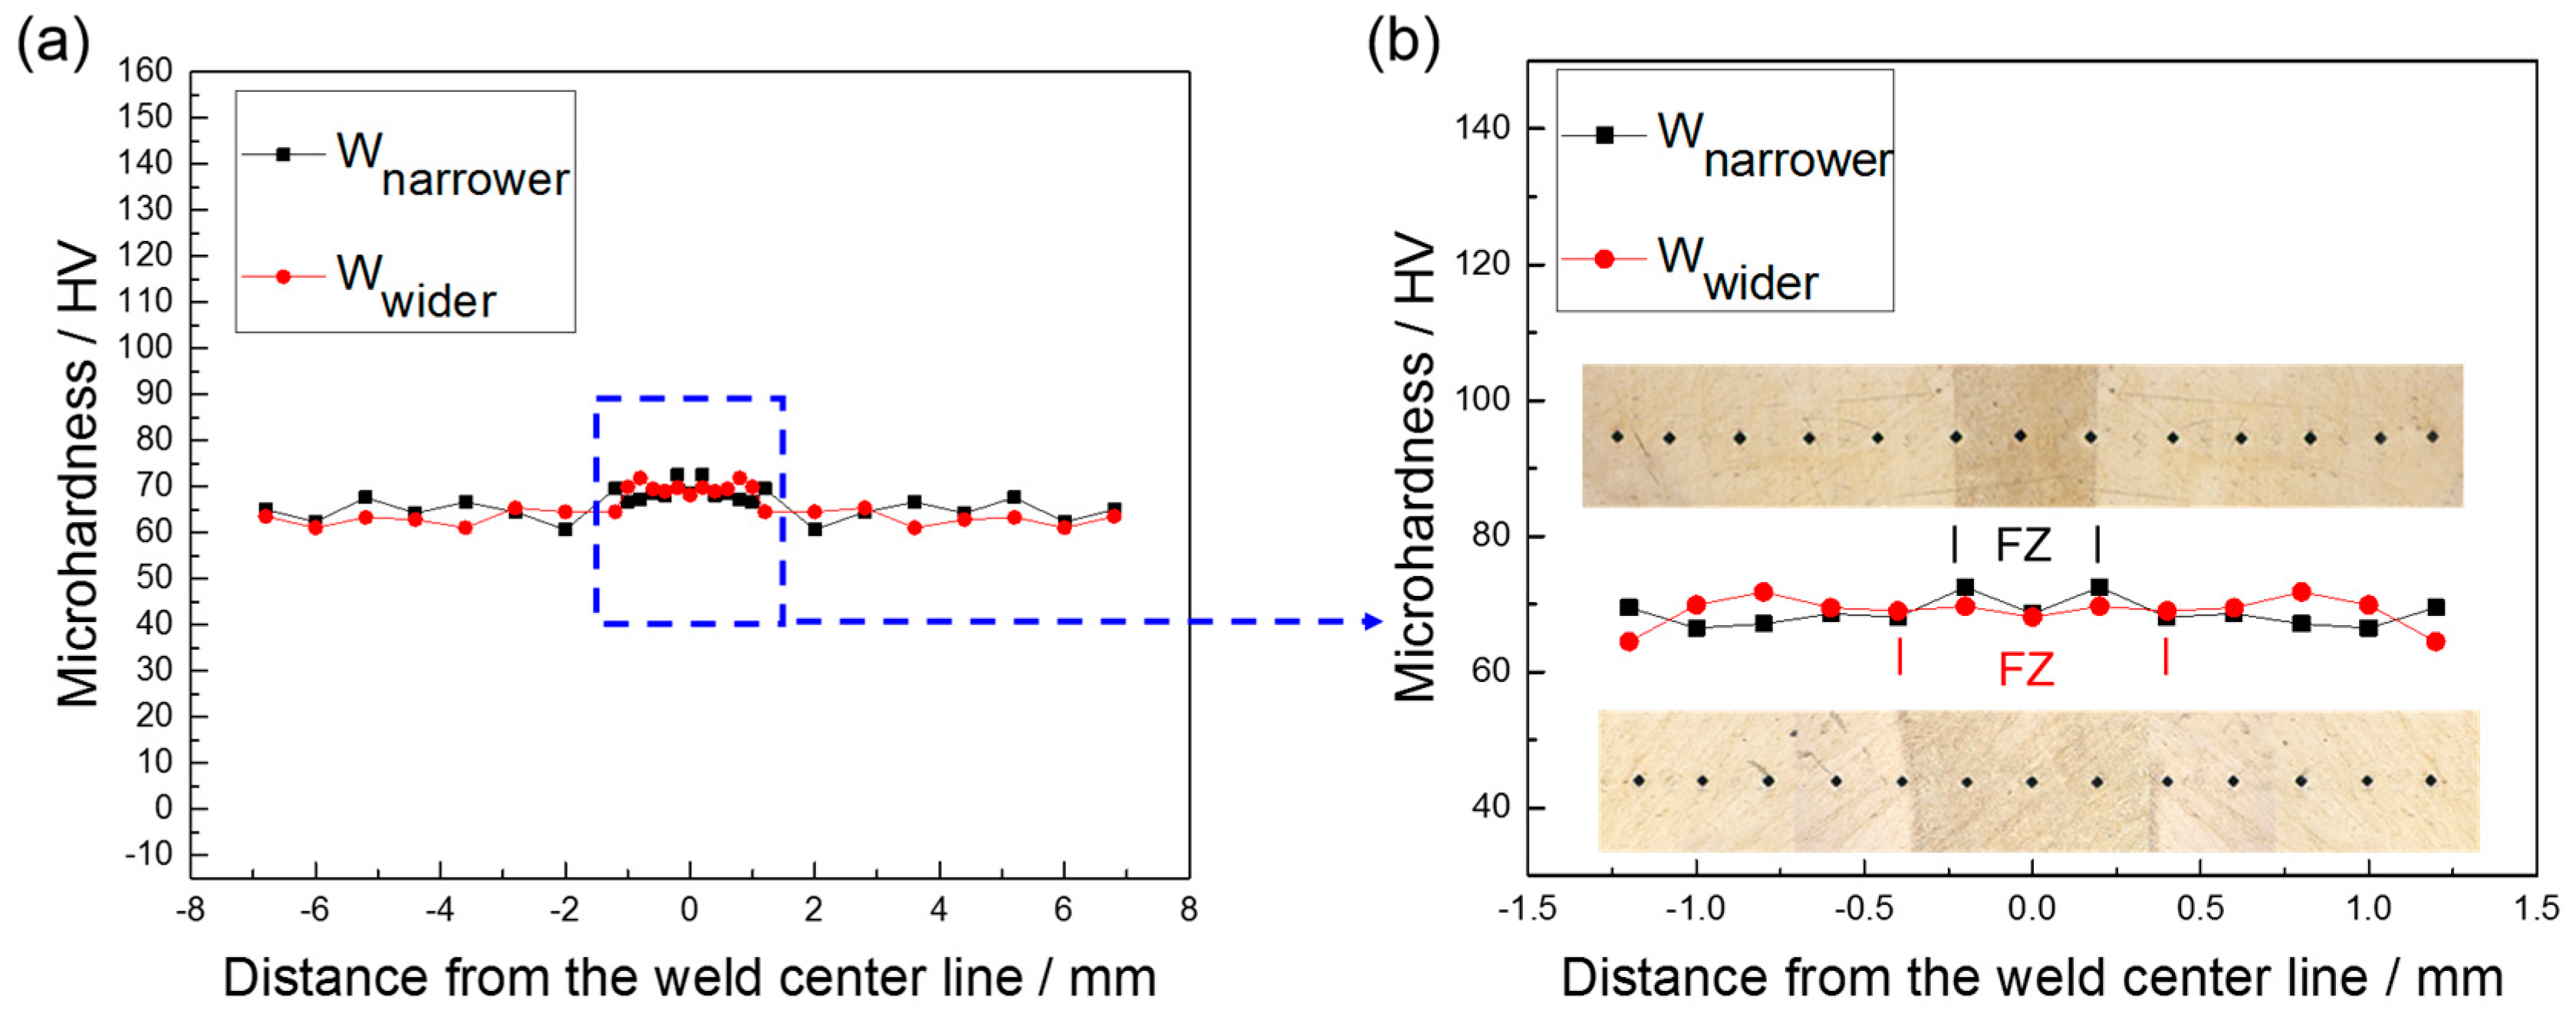
Figure 7 shows the microhardness distribution profile along the center line in the direction of the plate thickness. It can be seen from Figure 7a that the microhardness around the FZ is similar to the microhardness far away from the FZ. The hardness of this material can be affected by both the grain size and the precipitated phases. Although the grain size of the fusion zones is larger than the base metal, many precipitated particles occurred in the FZ. According to the Orowan hardening mechanism [25], the hardness can benefits from the small particles of intermetallic compounds. In addition, there is no obvious difference between the microhardness distribution of the two welded joints, which can be attributed to the similar microstructure of the FZs.
3.4. Tensile Test
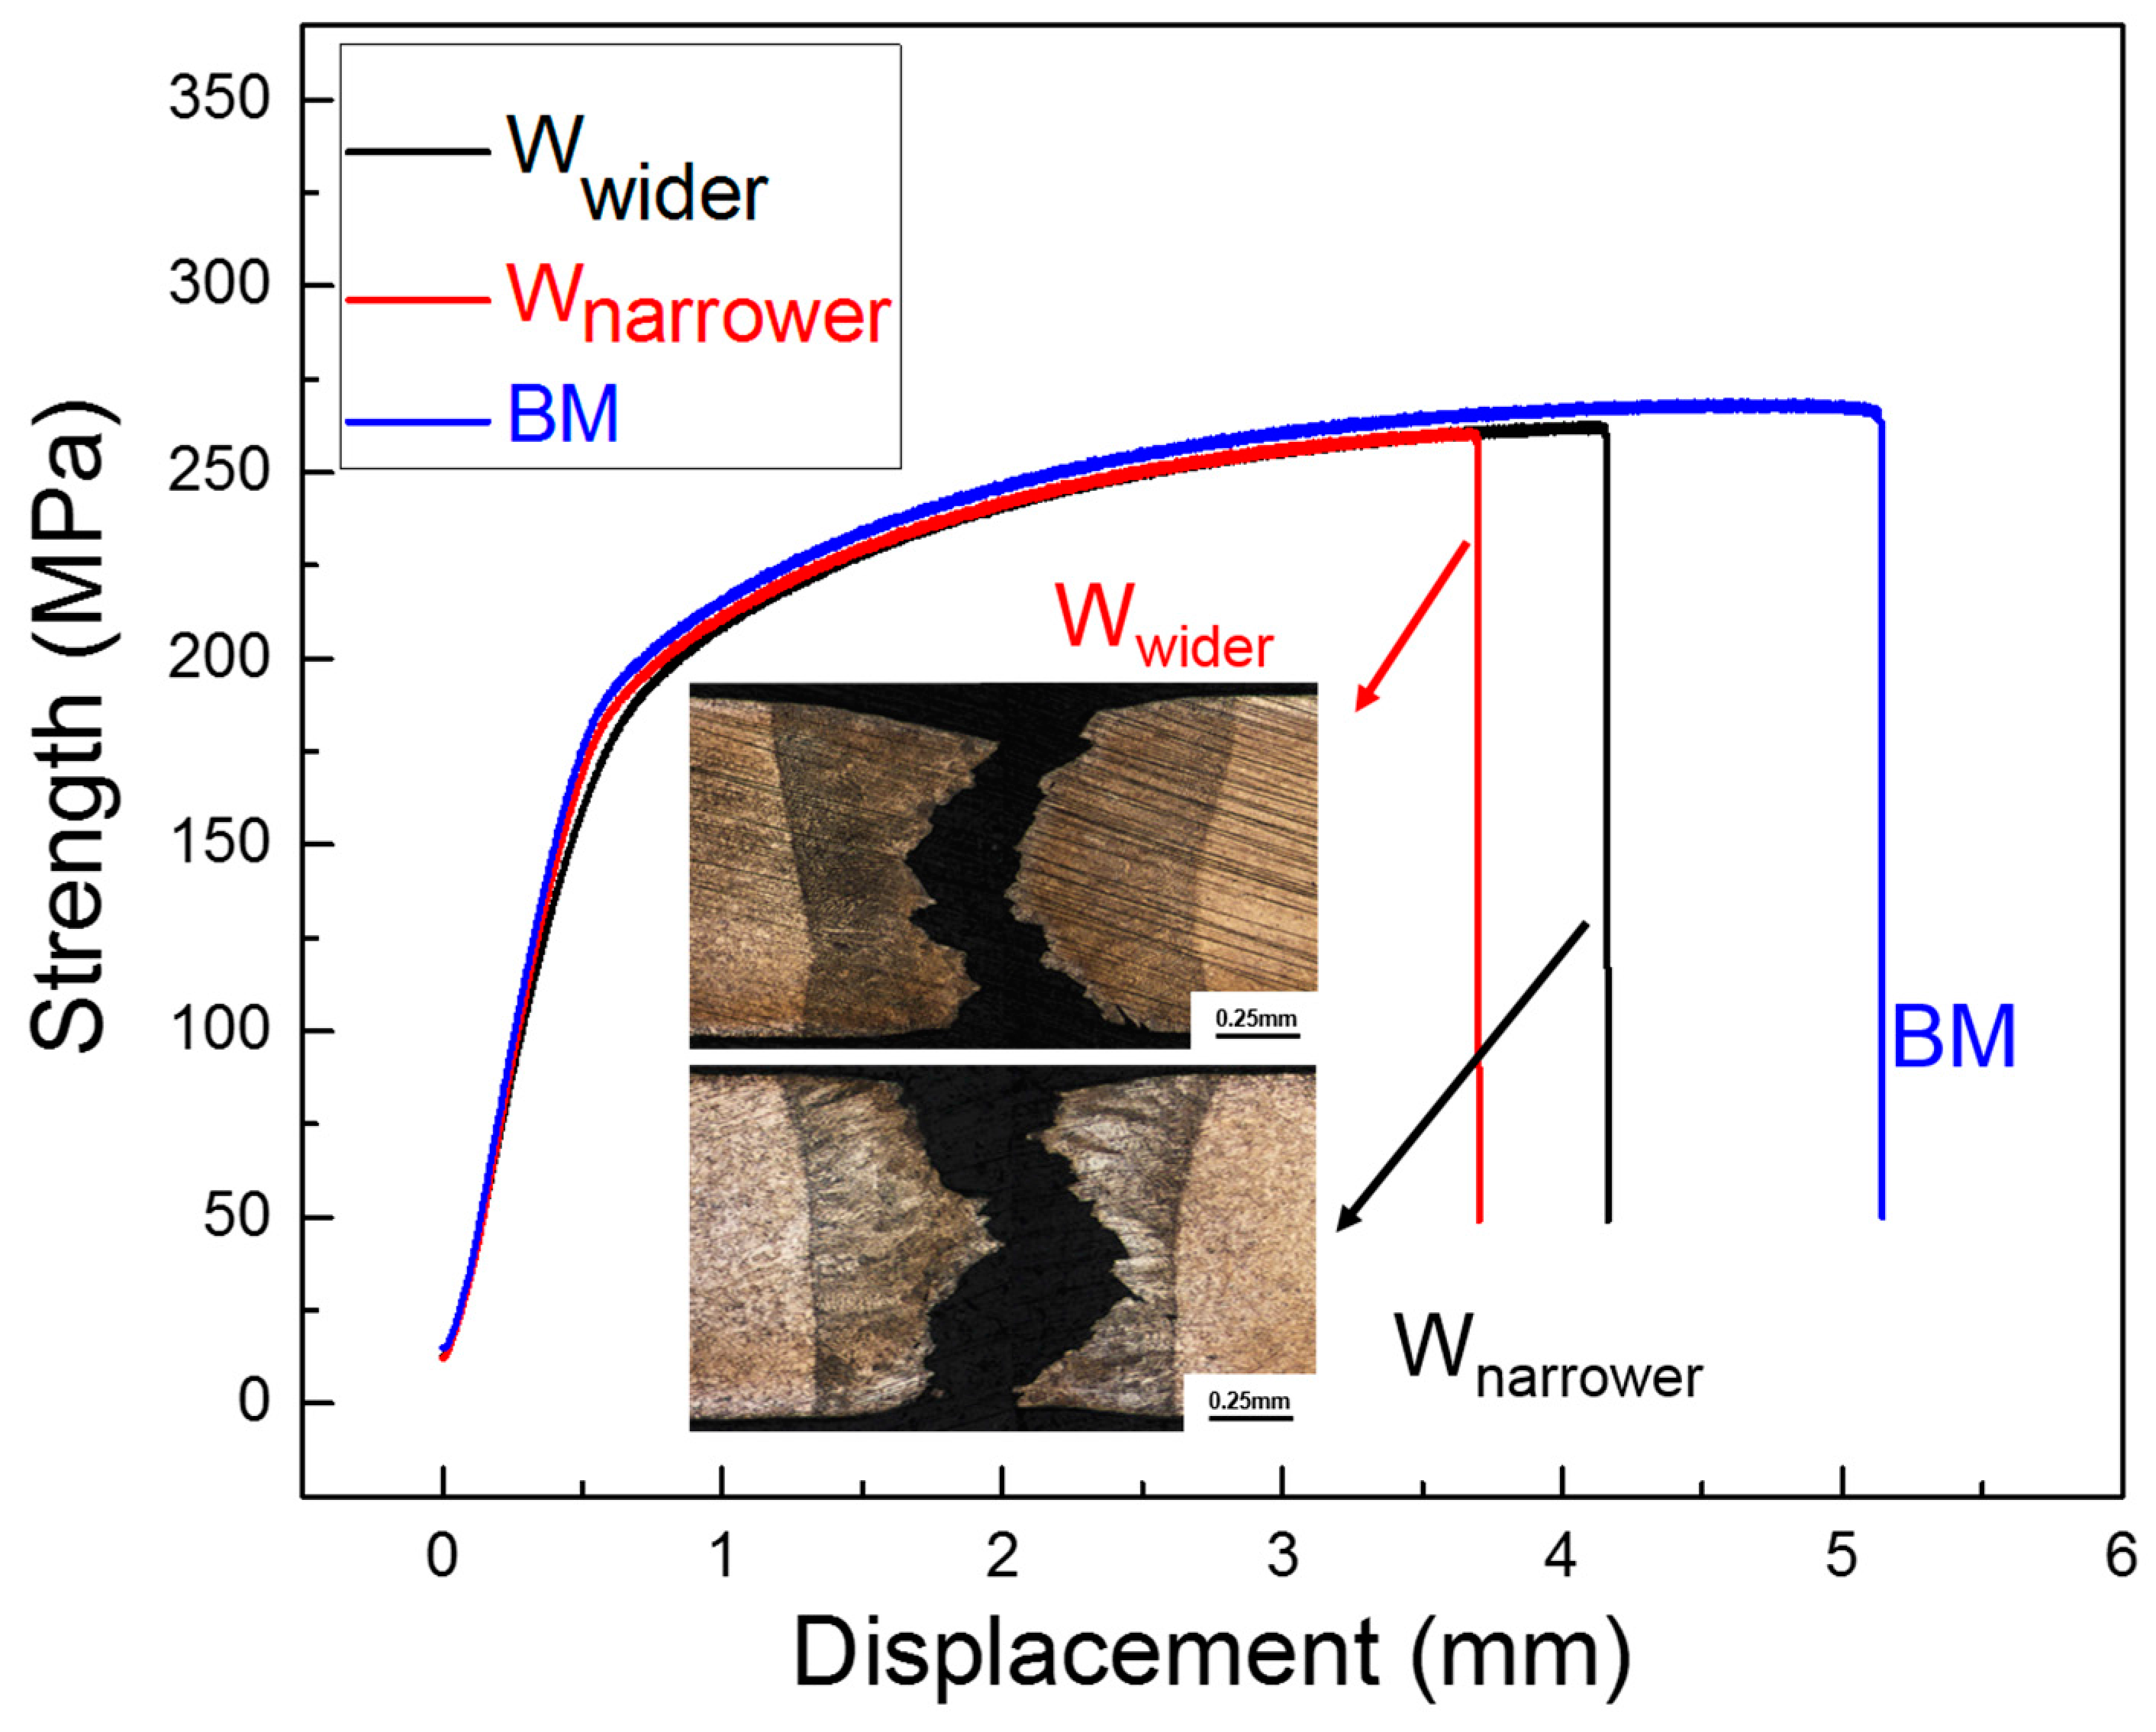
Figure 8 shows the tensile test results of the base metal and the two joints. The tensile strengths of Wnarrower and Wwider are very close to that of base metal, which is about 97.1% and 97.8% that of the base metal, respectively. The high tensile strength of the welded joint can attribute to the precipitated phases. It can be seen from Figure 6 that most precipitated phases occurred in the grain and distributed uniformly. These phases can compensate the decrease of mechanical properties caused by the coarse grain size in the FZ by hinting dislocation movement. The elongation rate of the welded joint Wwider is about 80.9% that of the base metal, slightly larger than that of the welded joint Wnarrower, which is up to 72% that of base metal. This might because that the joint Wwider has a larger weld width and can endure a greater deformation [26]. Both joints fractured in the FZ during tensile processes.
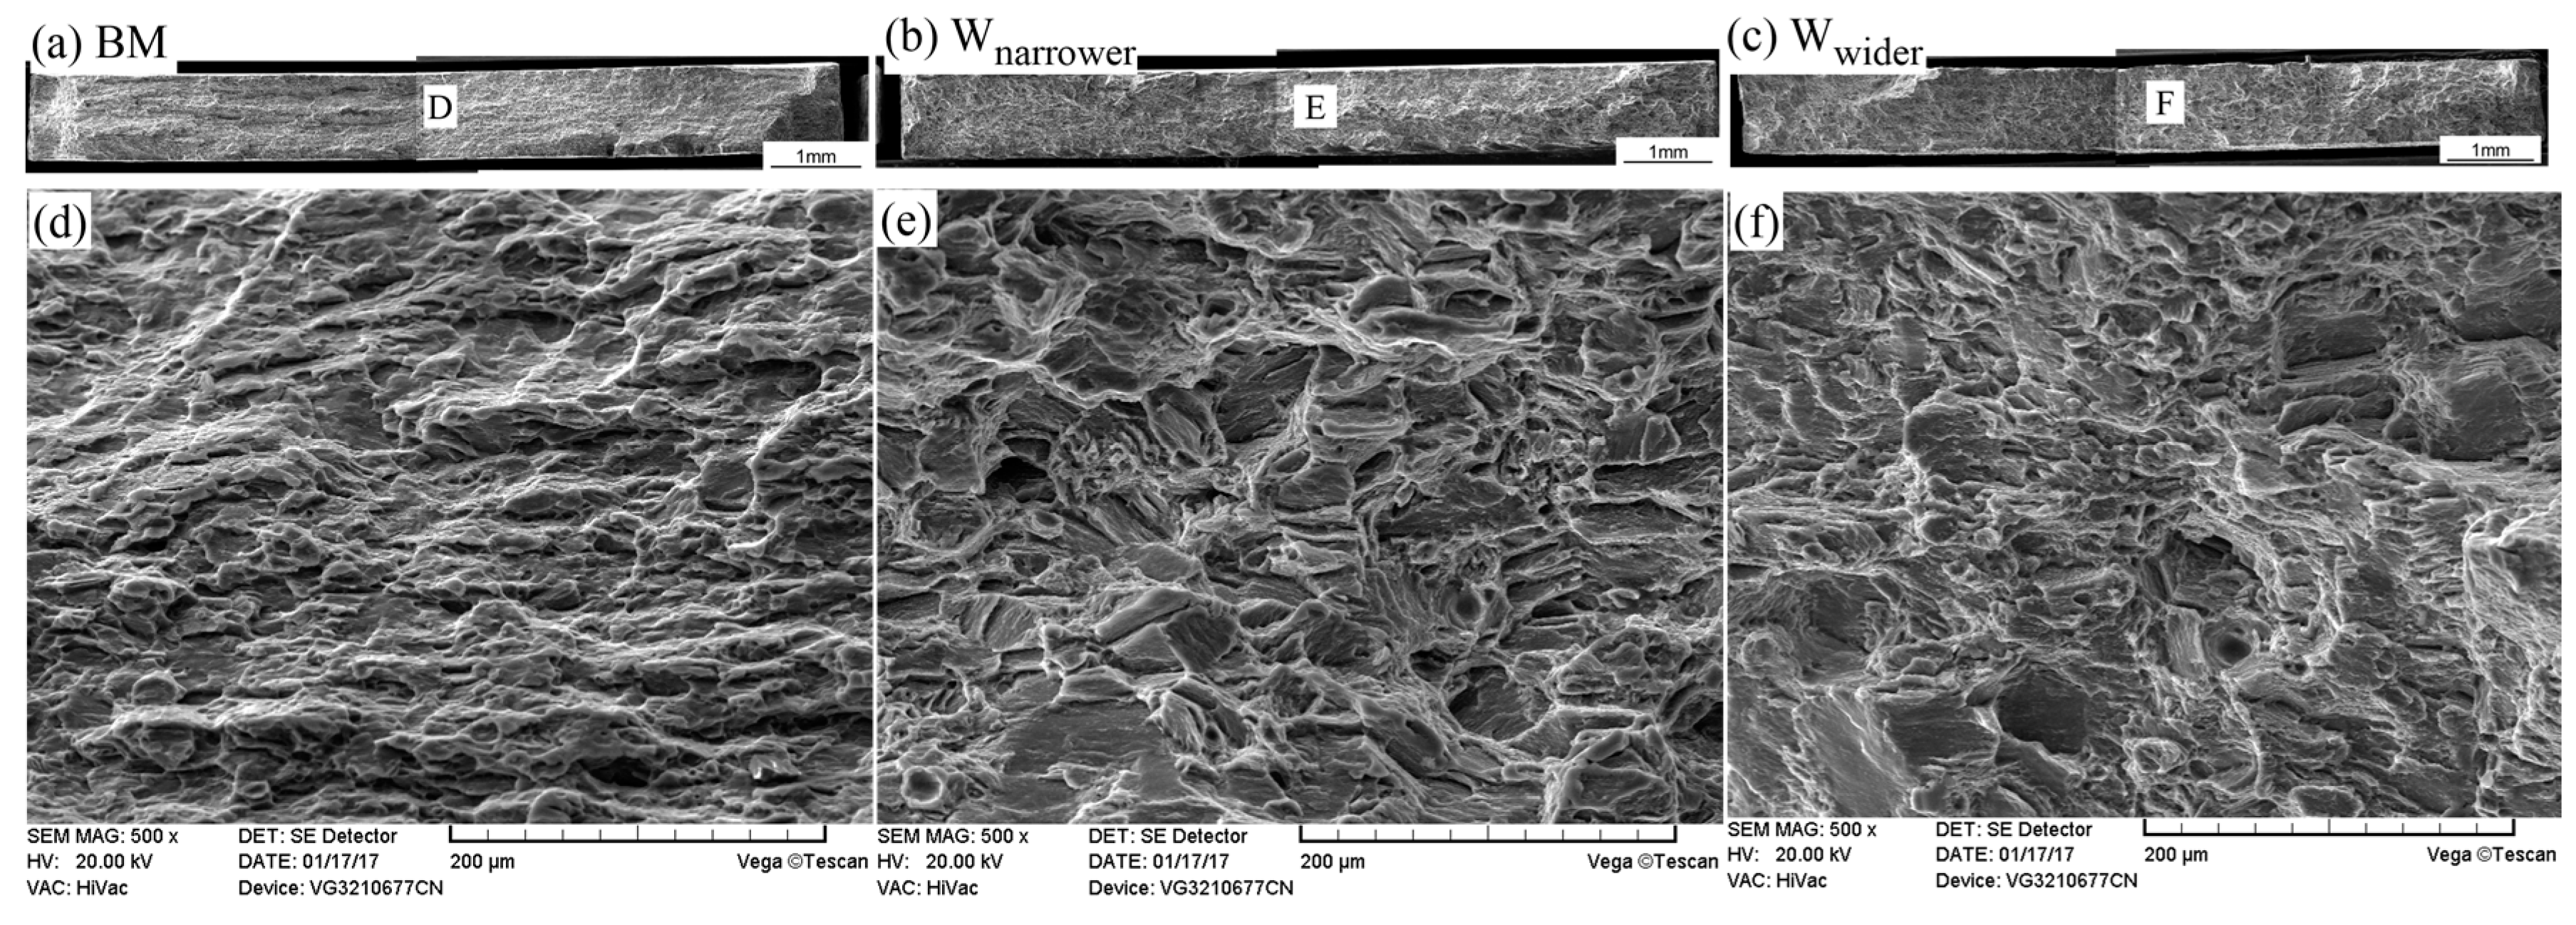
Figure 9 shows the tensile fractures of base metal and two joints. The fracture of the base metal is composed of many small and dense dimples. However, the fracture of joint Wnarrower shows a cleavage fracture pattern. The fracture of joint Wwider shows characteristics of both of these two fracture patterns.
3.5. Fatigue Test
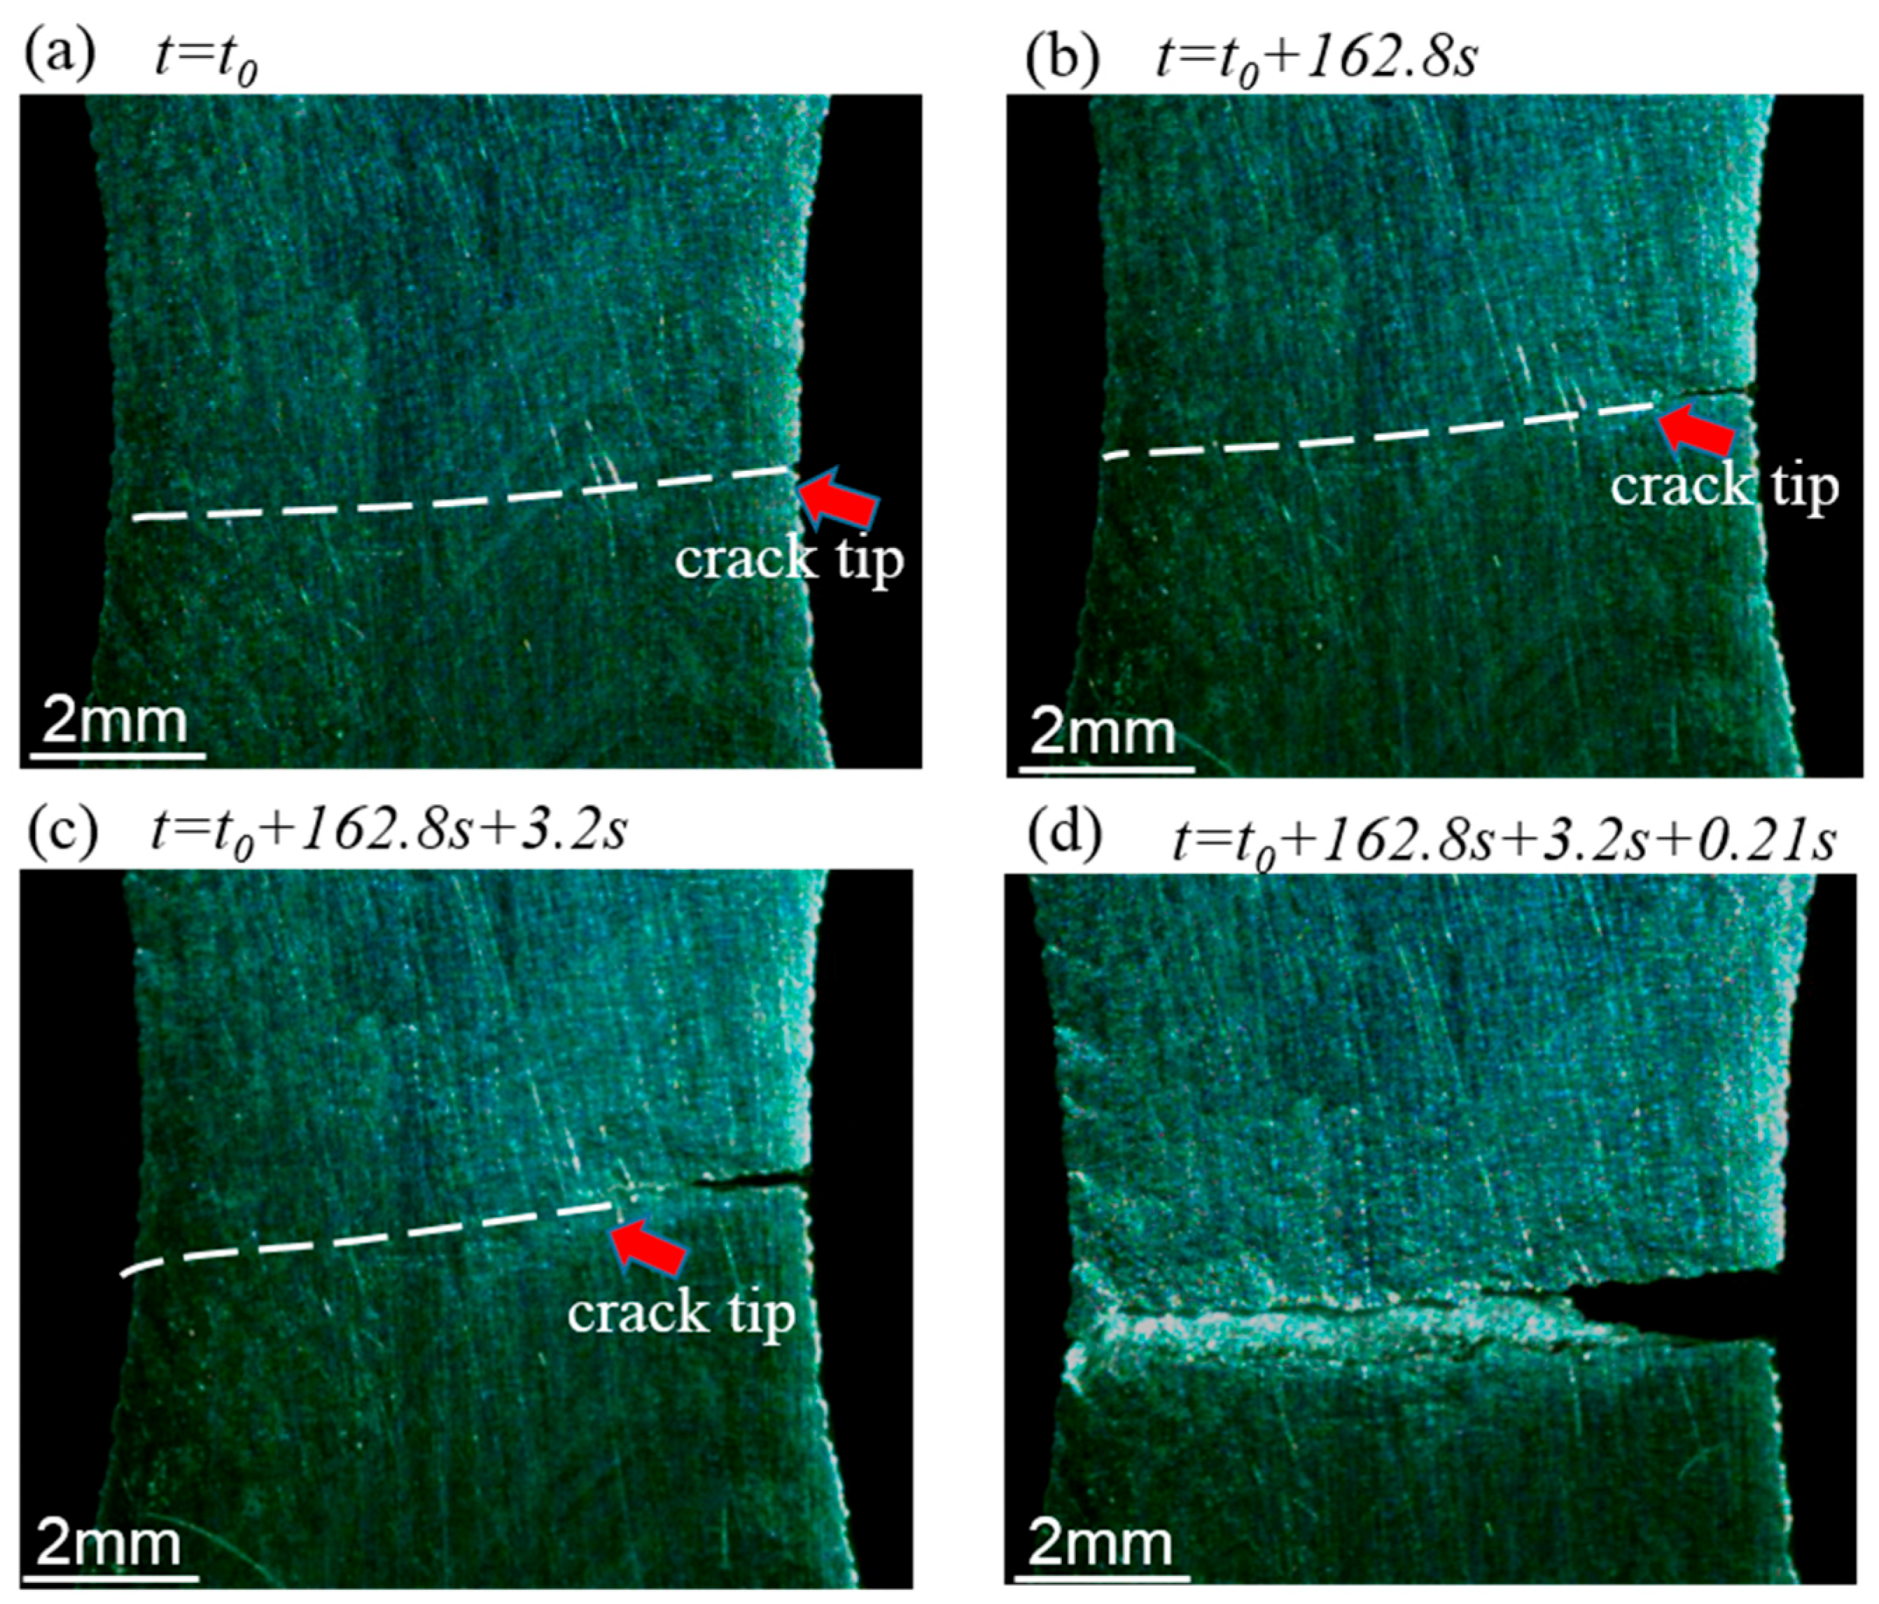
Figure 10 shows the crack evolution in the low-cycle fatigue test of base metal. The white dashed line shows the fatigue crack path. The crack of the base metal specimen initiated at the notch of the edge (Figure 10a) because of a great stress concentration. Subsequently, the crack propagated perpendicular to the loading direction. After a period of about 162.8 s, the crack propagated 13% the neck width of the specimen (Figure 10b) and from this time, the propagation rate became significantly larger. After 3.2 s, the crack propagated to 33% the whole crack path (Figure 10c). In the last 0.21 s, the crack propagated rapidly and the specimen broke completely (Figure 10d). The fatigue life of the base metal specimen was 3377.5 cycles.
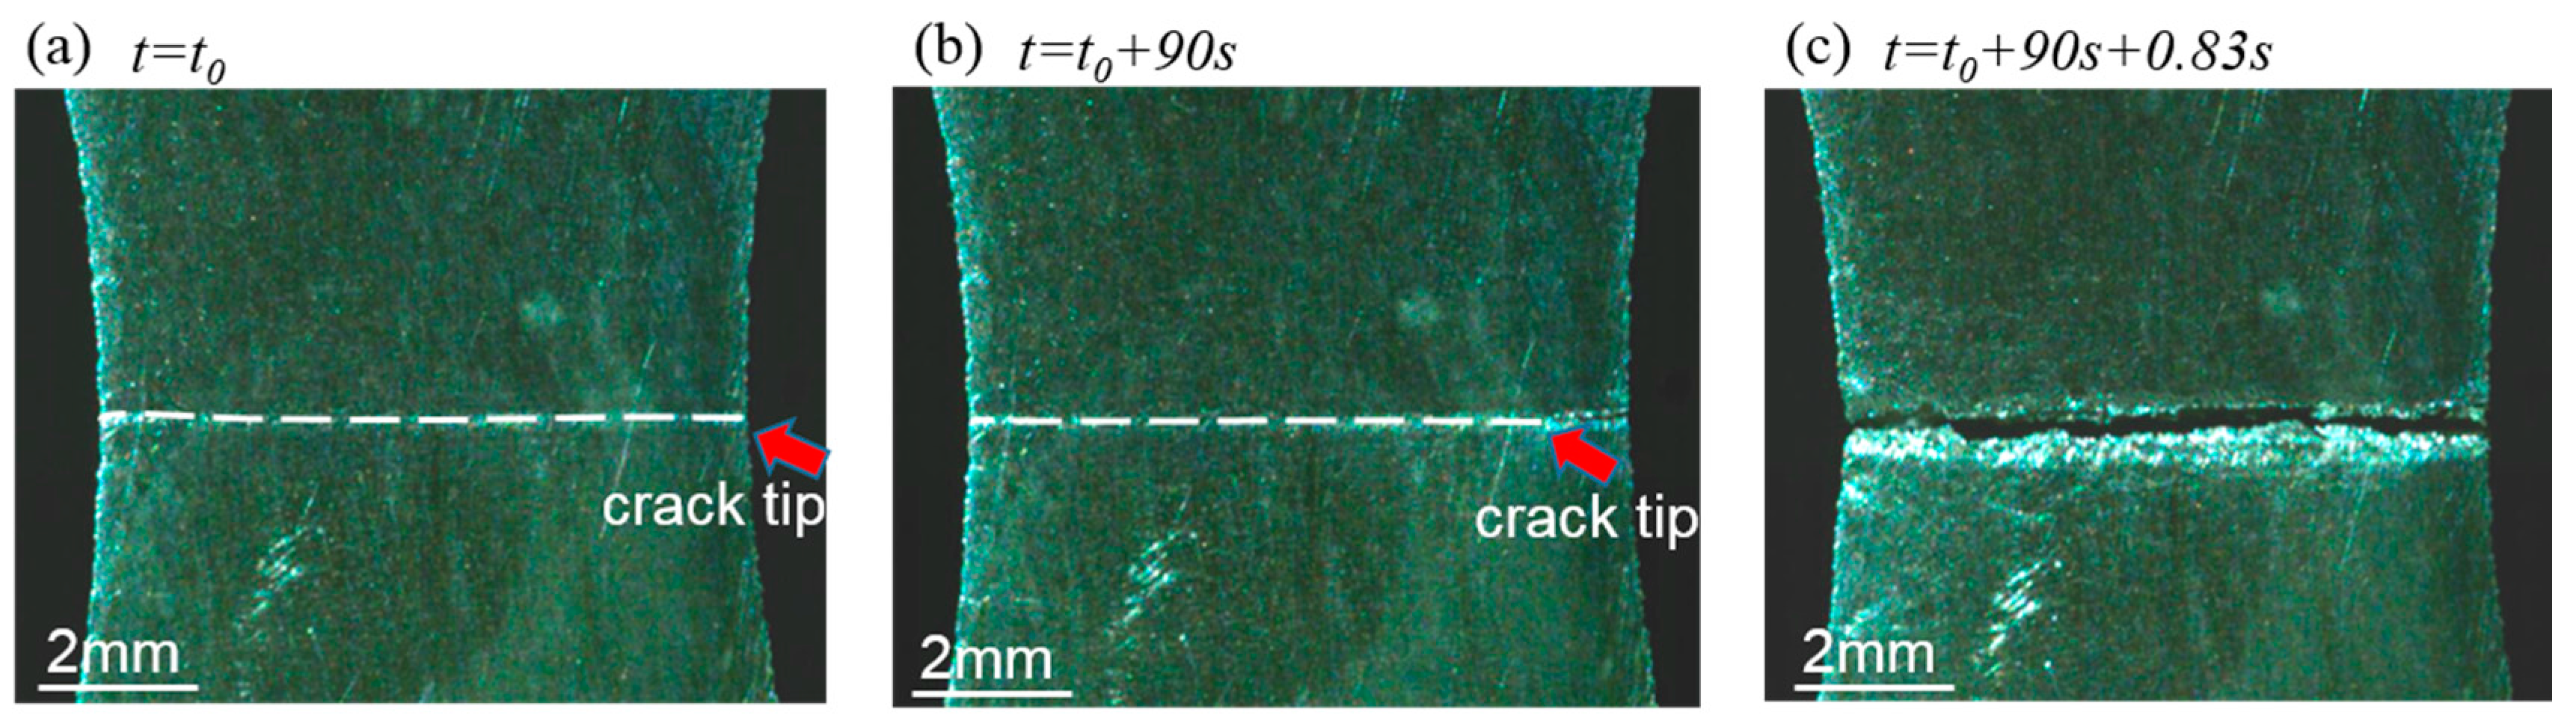
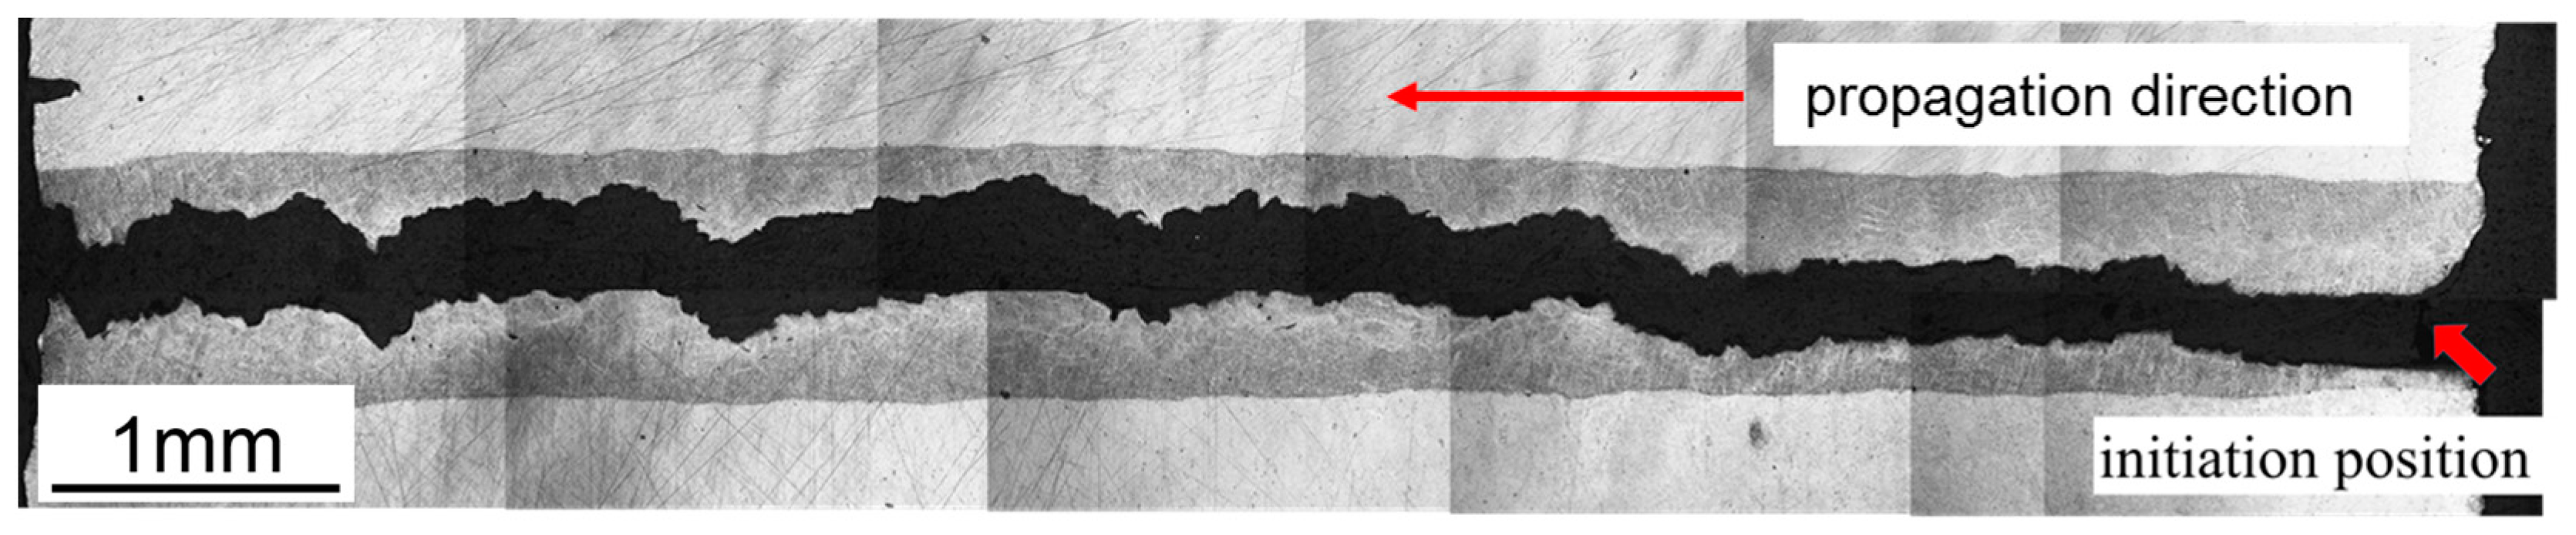
Figure 11 shows the crack evolution in the low-cycle fatigue test of the welded joint Wnarrower. The fatigue crack initiated at the edge of the specimen (Figure 11a). It took 90 s to propagate through 14% of the whole path (Figure 11b) and during subsequent 0.83 s, the crack propagated rapidly and the specimen broke suddenly (Figure 11c). Compared with the base metal specimen, the fatigue crack propagation rate of joint Wnarrower was relatively larger and steadily increasing without mutation. It took less time for the fatigue crack propagation stage of joint Wnarrower. Figure 12 shows the fracture path of the welded joint Wnarrower after the low-cycle fatigue test. It can be seen from the picture that the fatigue crack initiated and propagated inside the fusion zone. The fatigue life of joint Wnarrower was 2825 cycles, which reached 83.6% that of the base metal.
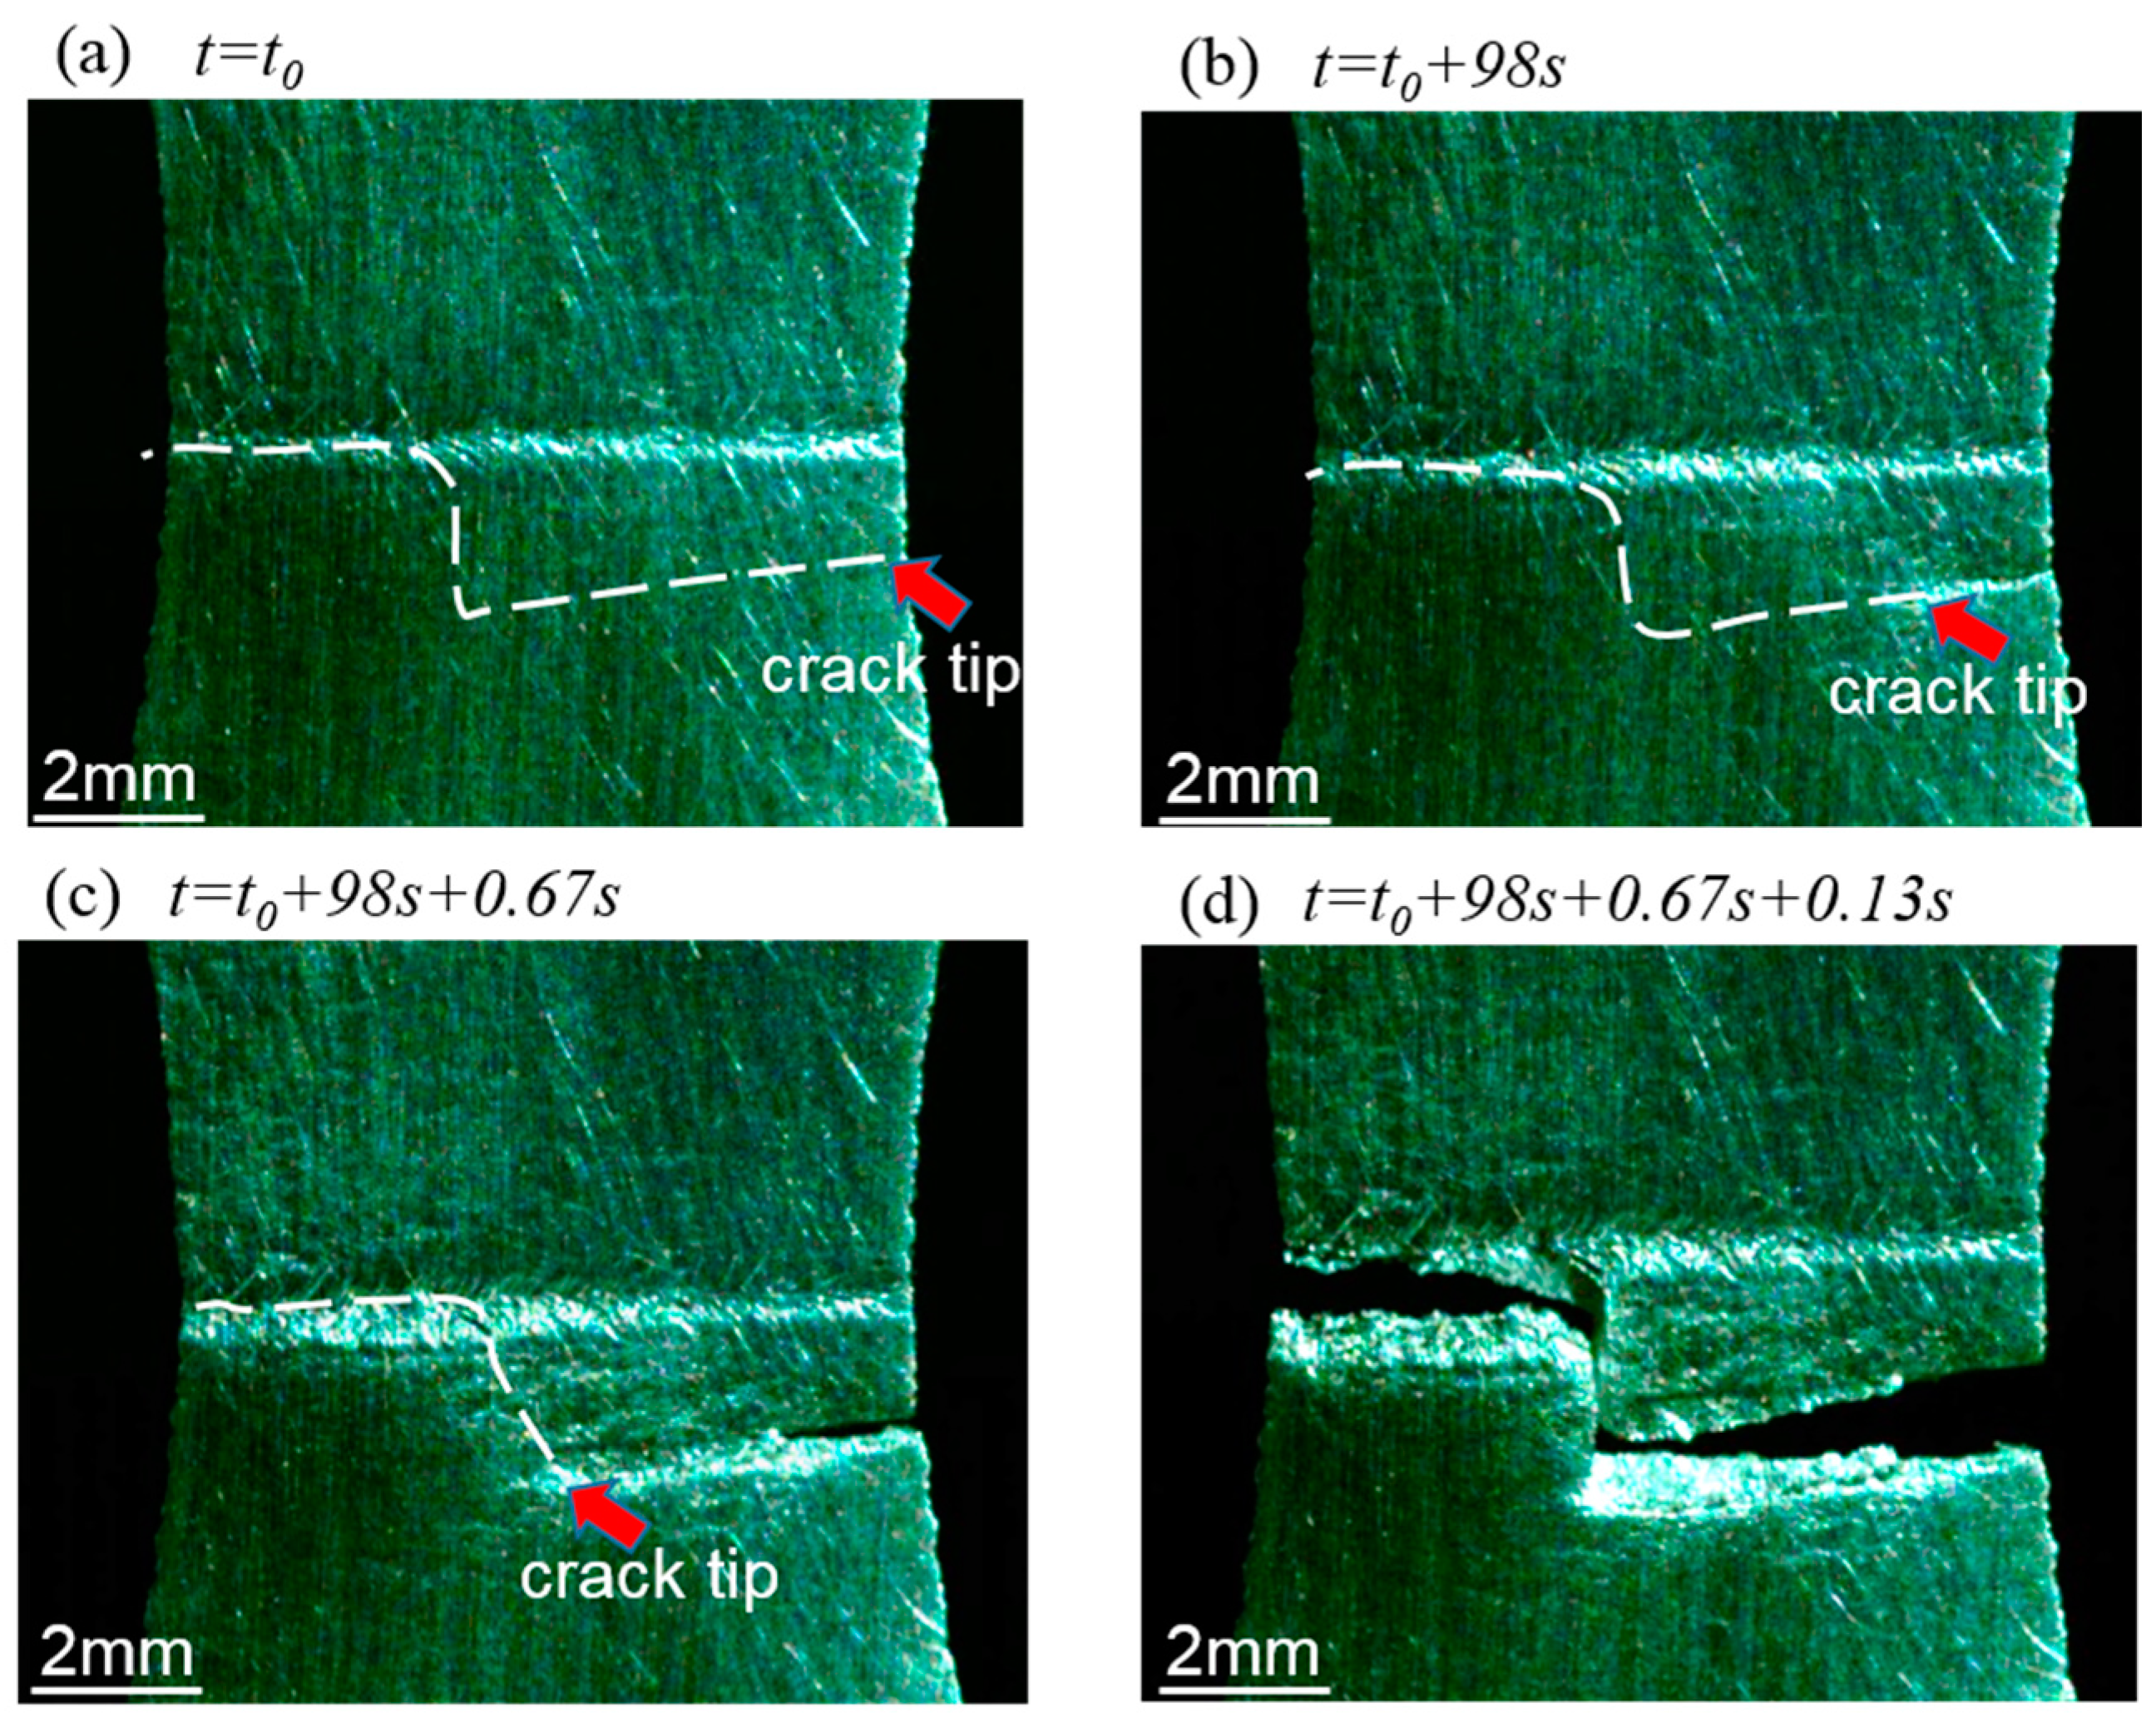
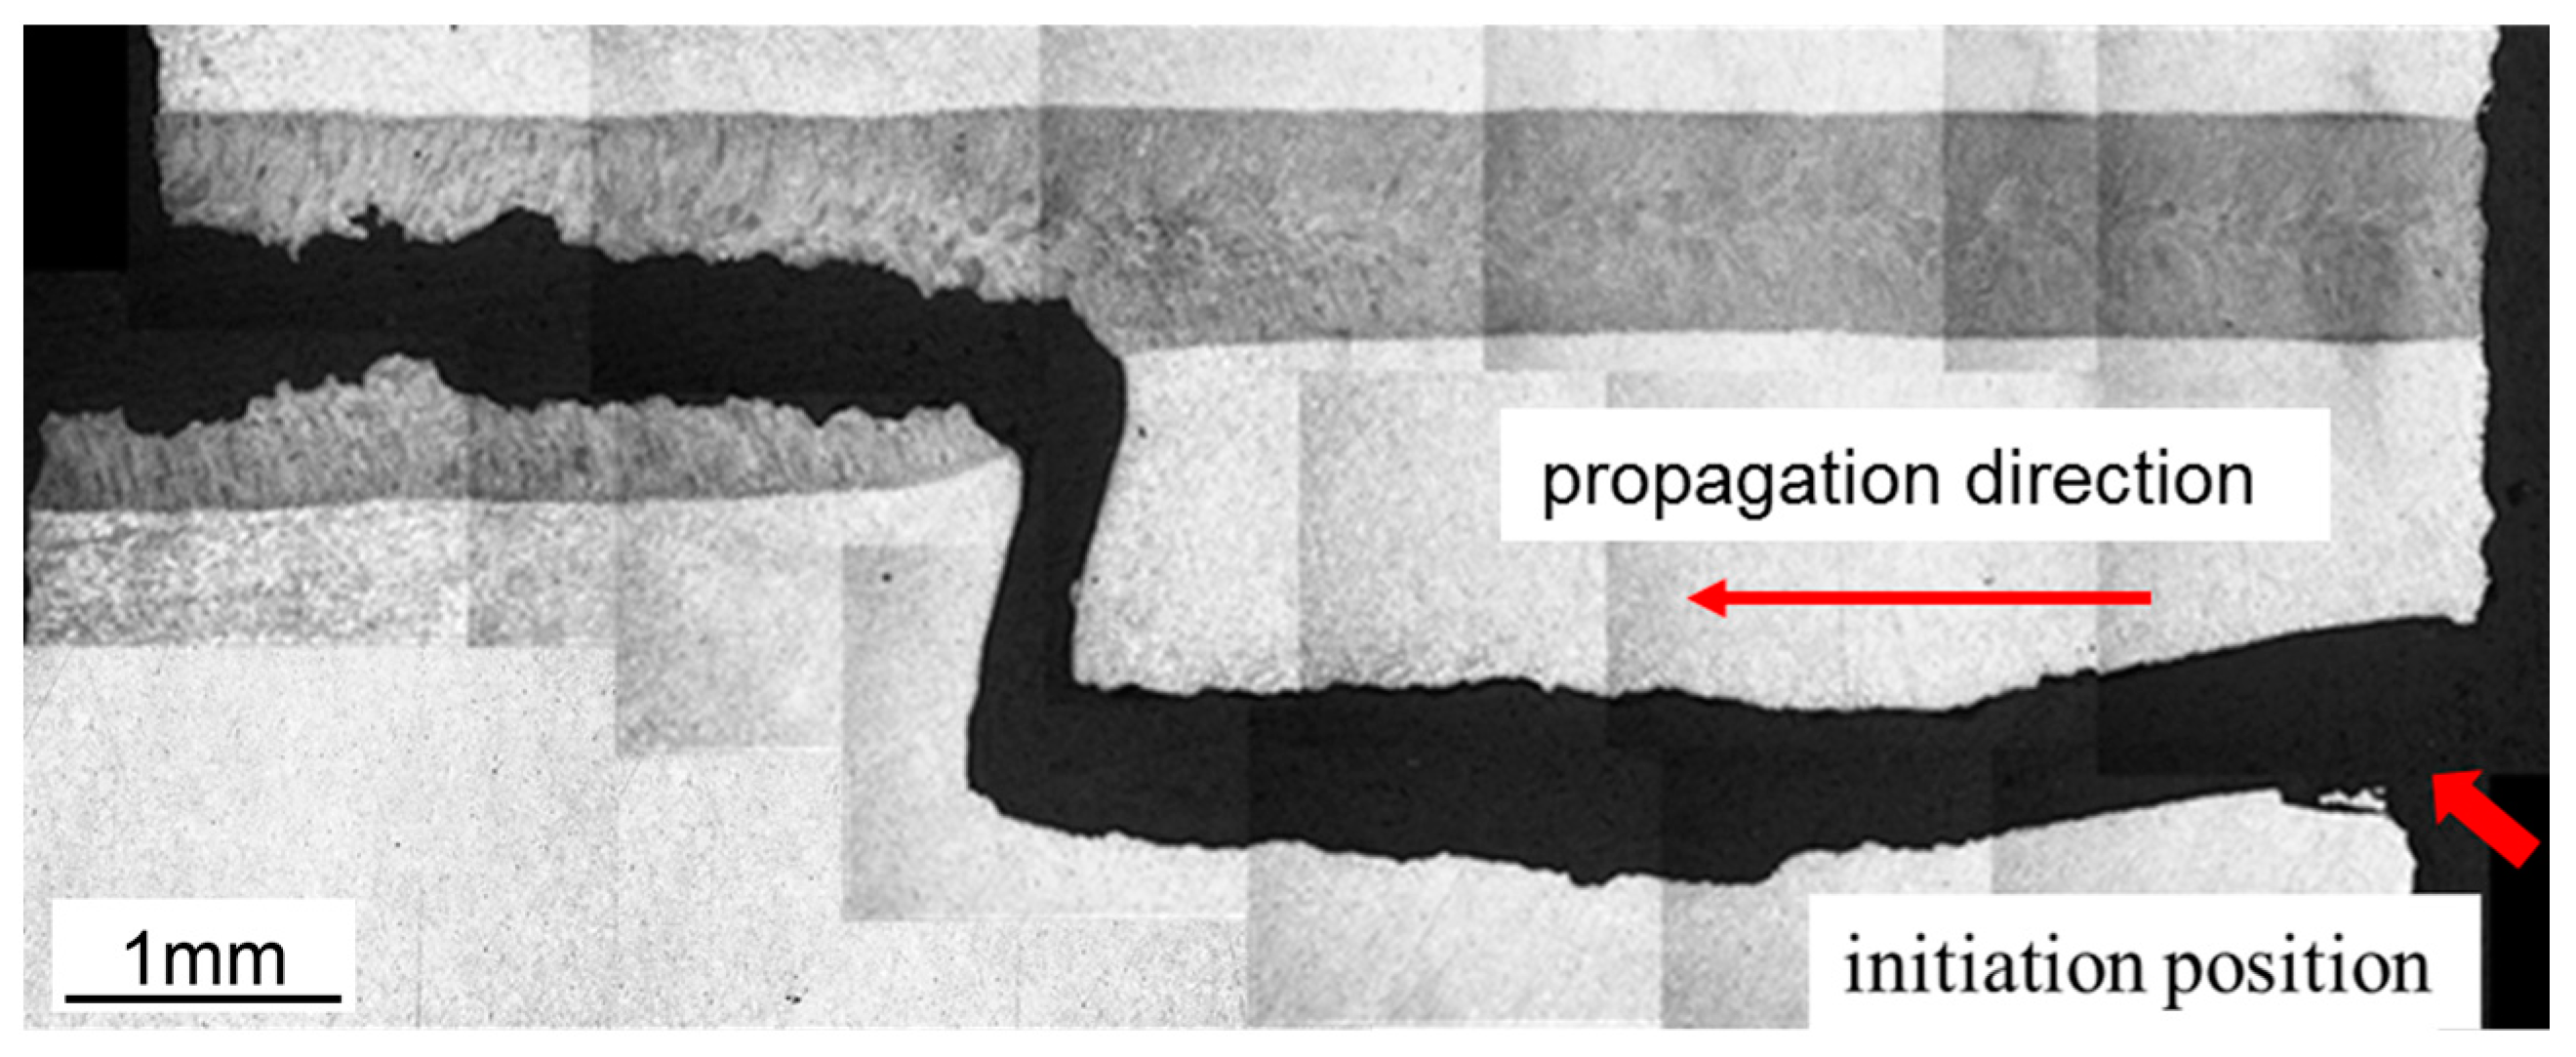
Figure 13 shows the crack evolution in the low-cycle fatigue test of joint Wwider. Different from the fatigue failure behavior of joint Wnarrower, the crack of joint Wwider initiated at the edge of the base metal about 1 mm away from the fusion boundary (Figure 13a). This can be attributed to the better tensile ductility showed from the tensile test. The crack propagated slowly perpendicular to the loading direction for 98 s (Figure 13b), and then the propagation rate became larger. During the subsequent 0.67 s, the crack changed direction and propagated toward the fusion zone (Figure 13c). Then, it propagated perpendicular to the loading direction inside the FZ as the white dotted line shows in Figure 13c and finally caused the fracture of this specimen (Figure 13d). The fatigue life of joint Wwider was 3155.3 cycles, which was 93.4% that of the base metal, obviously superior to joint Wnarrower. Figure 14 shows the fatigue crack path of joint Wwider. It can be seen that the fatigue crack propagated through the BM first and then through the fusion zone.
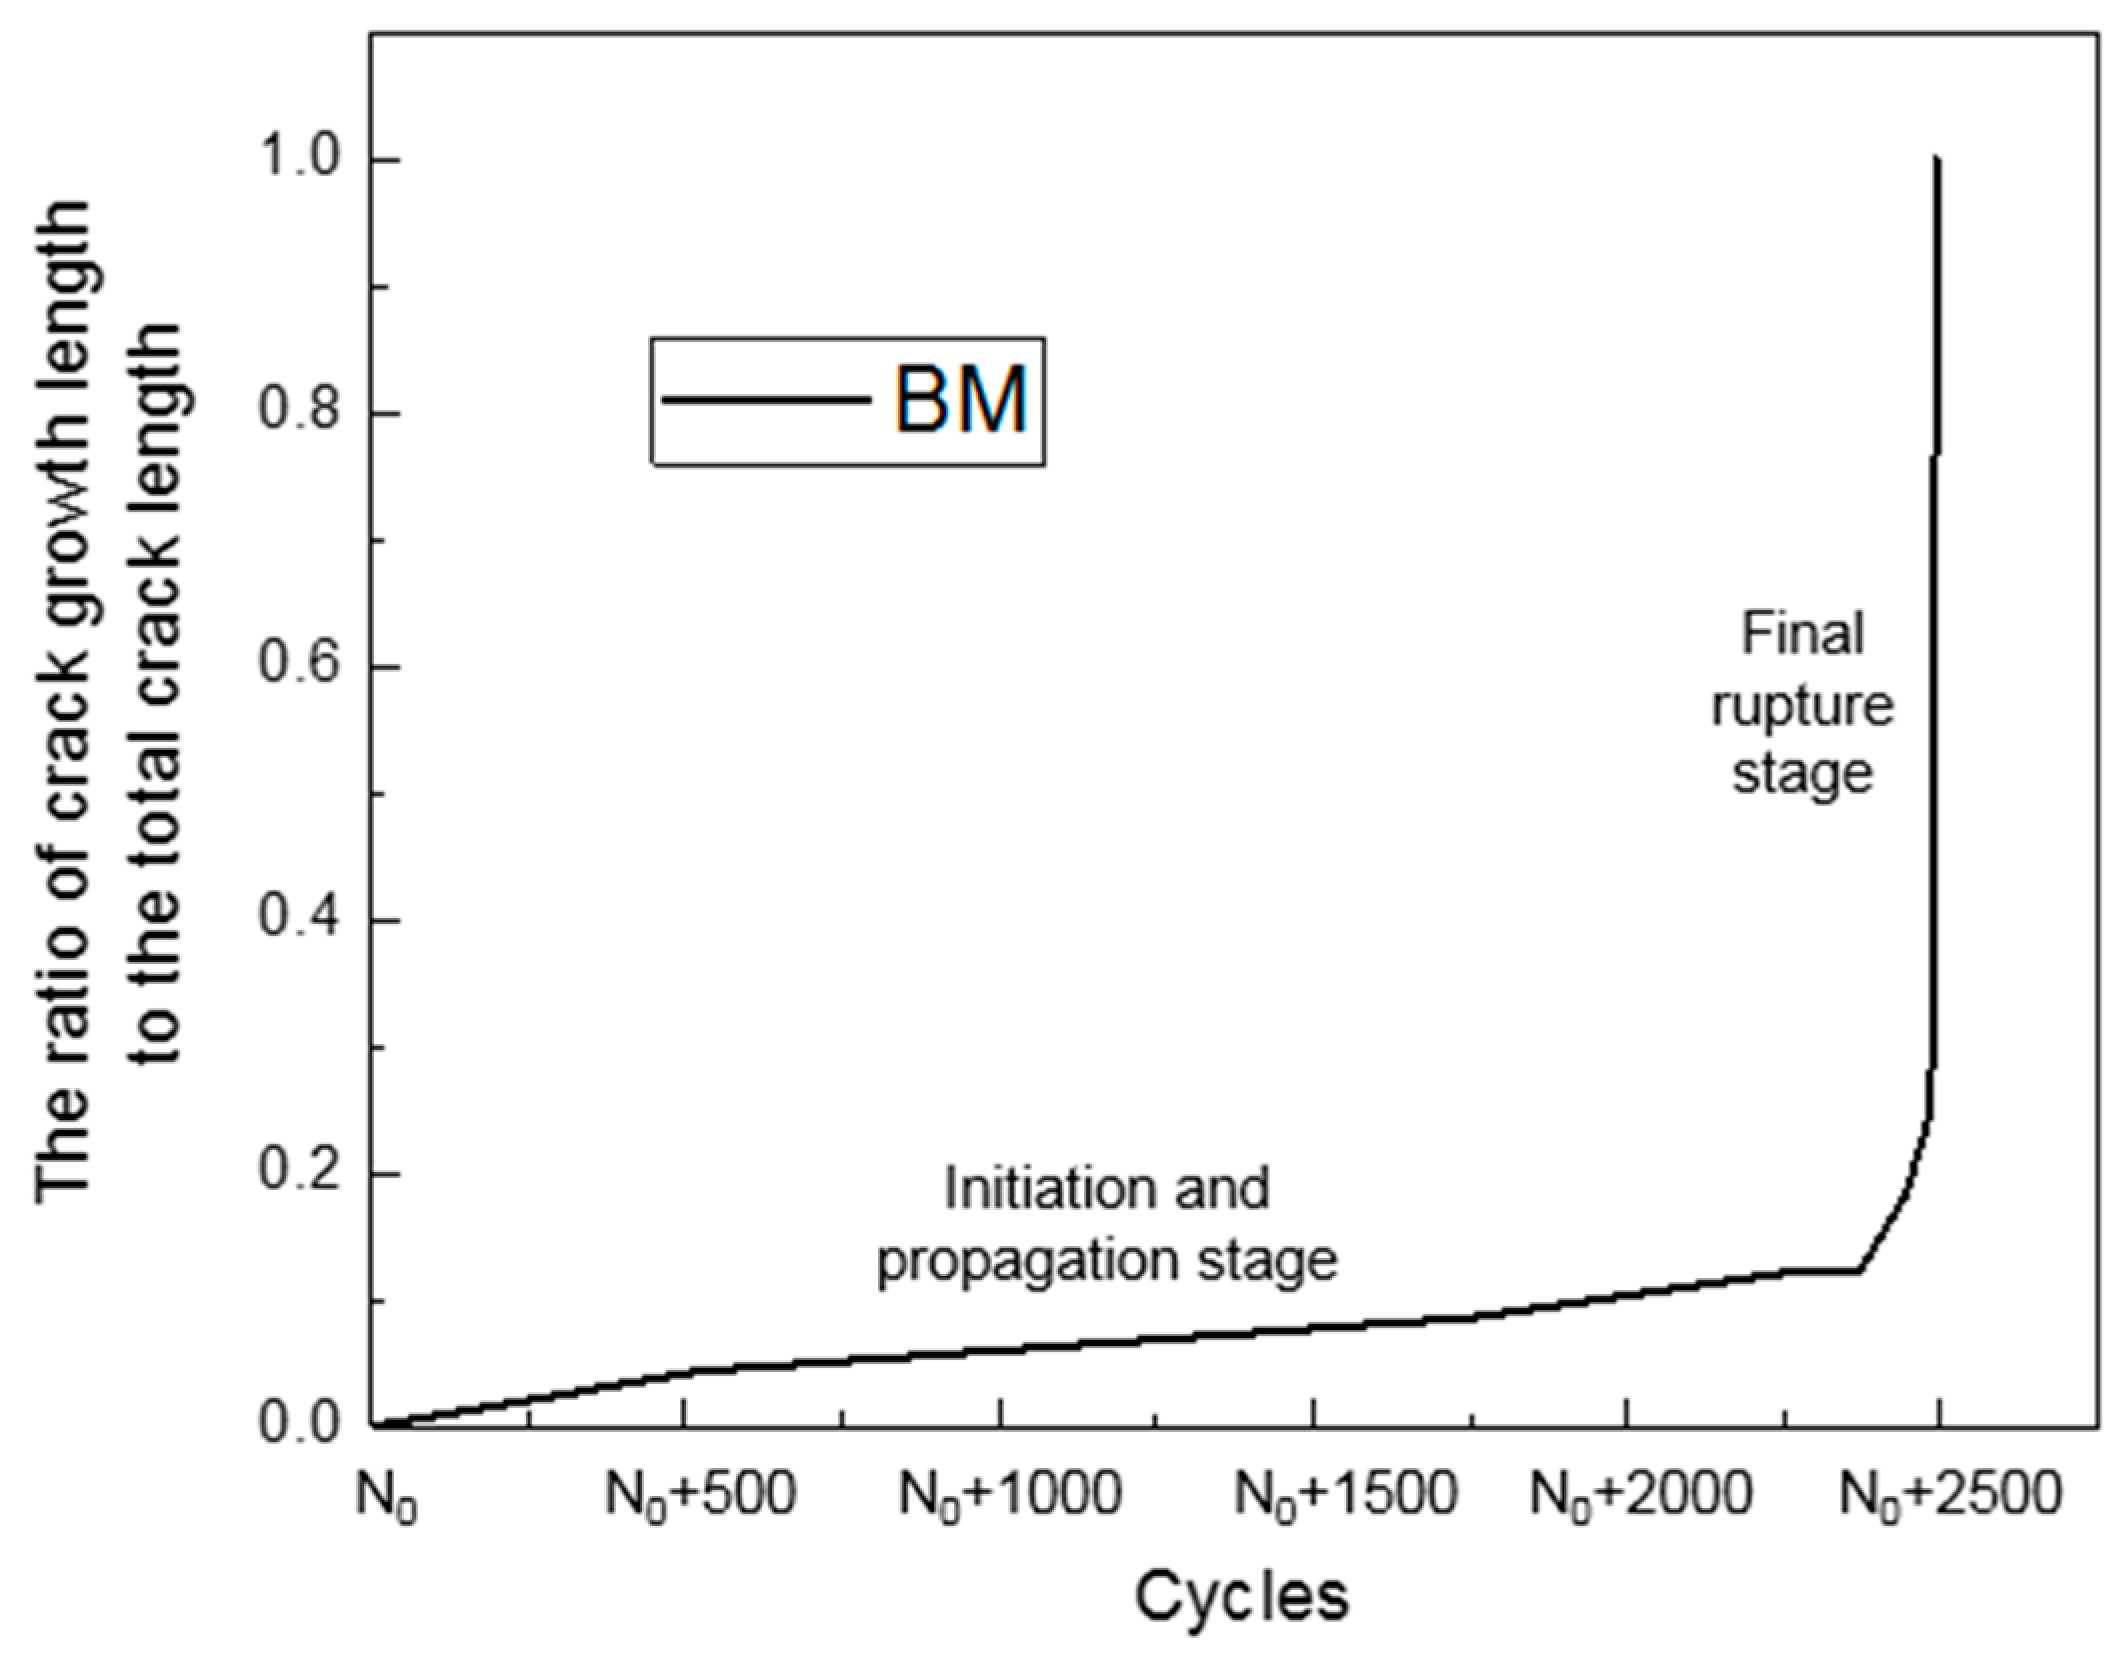
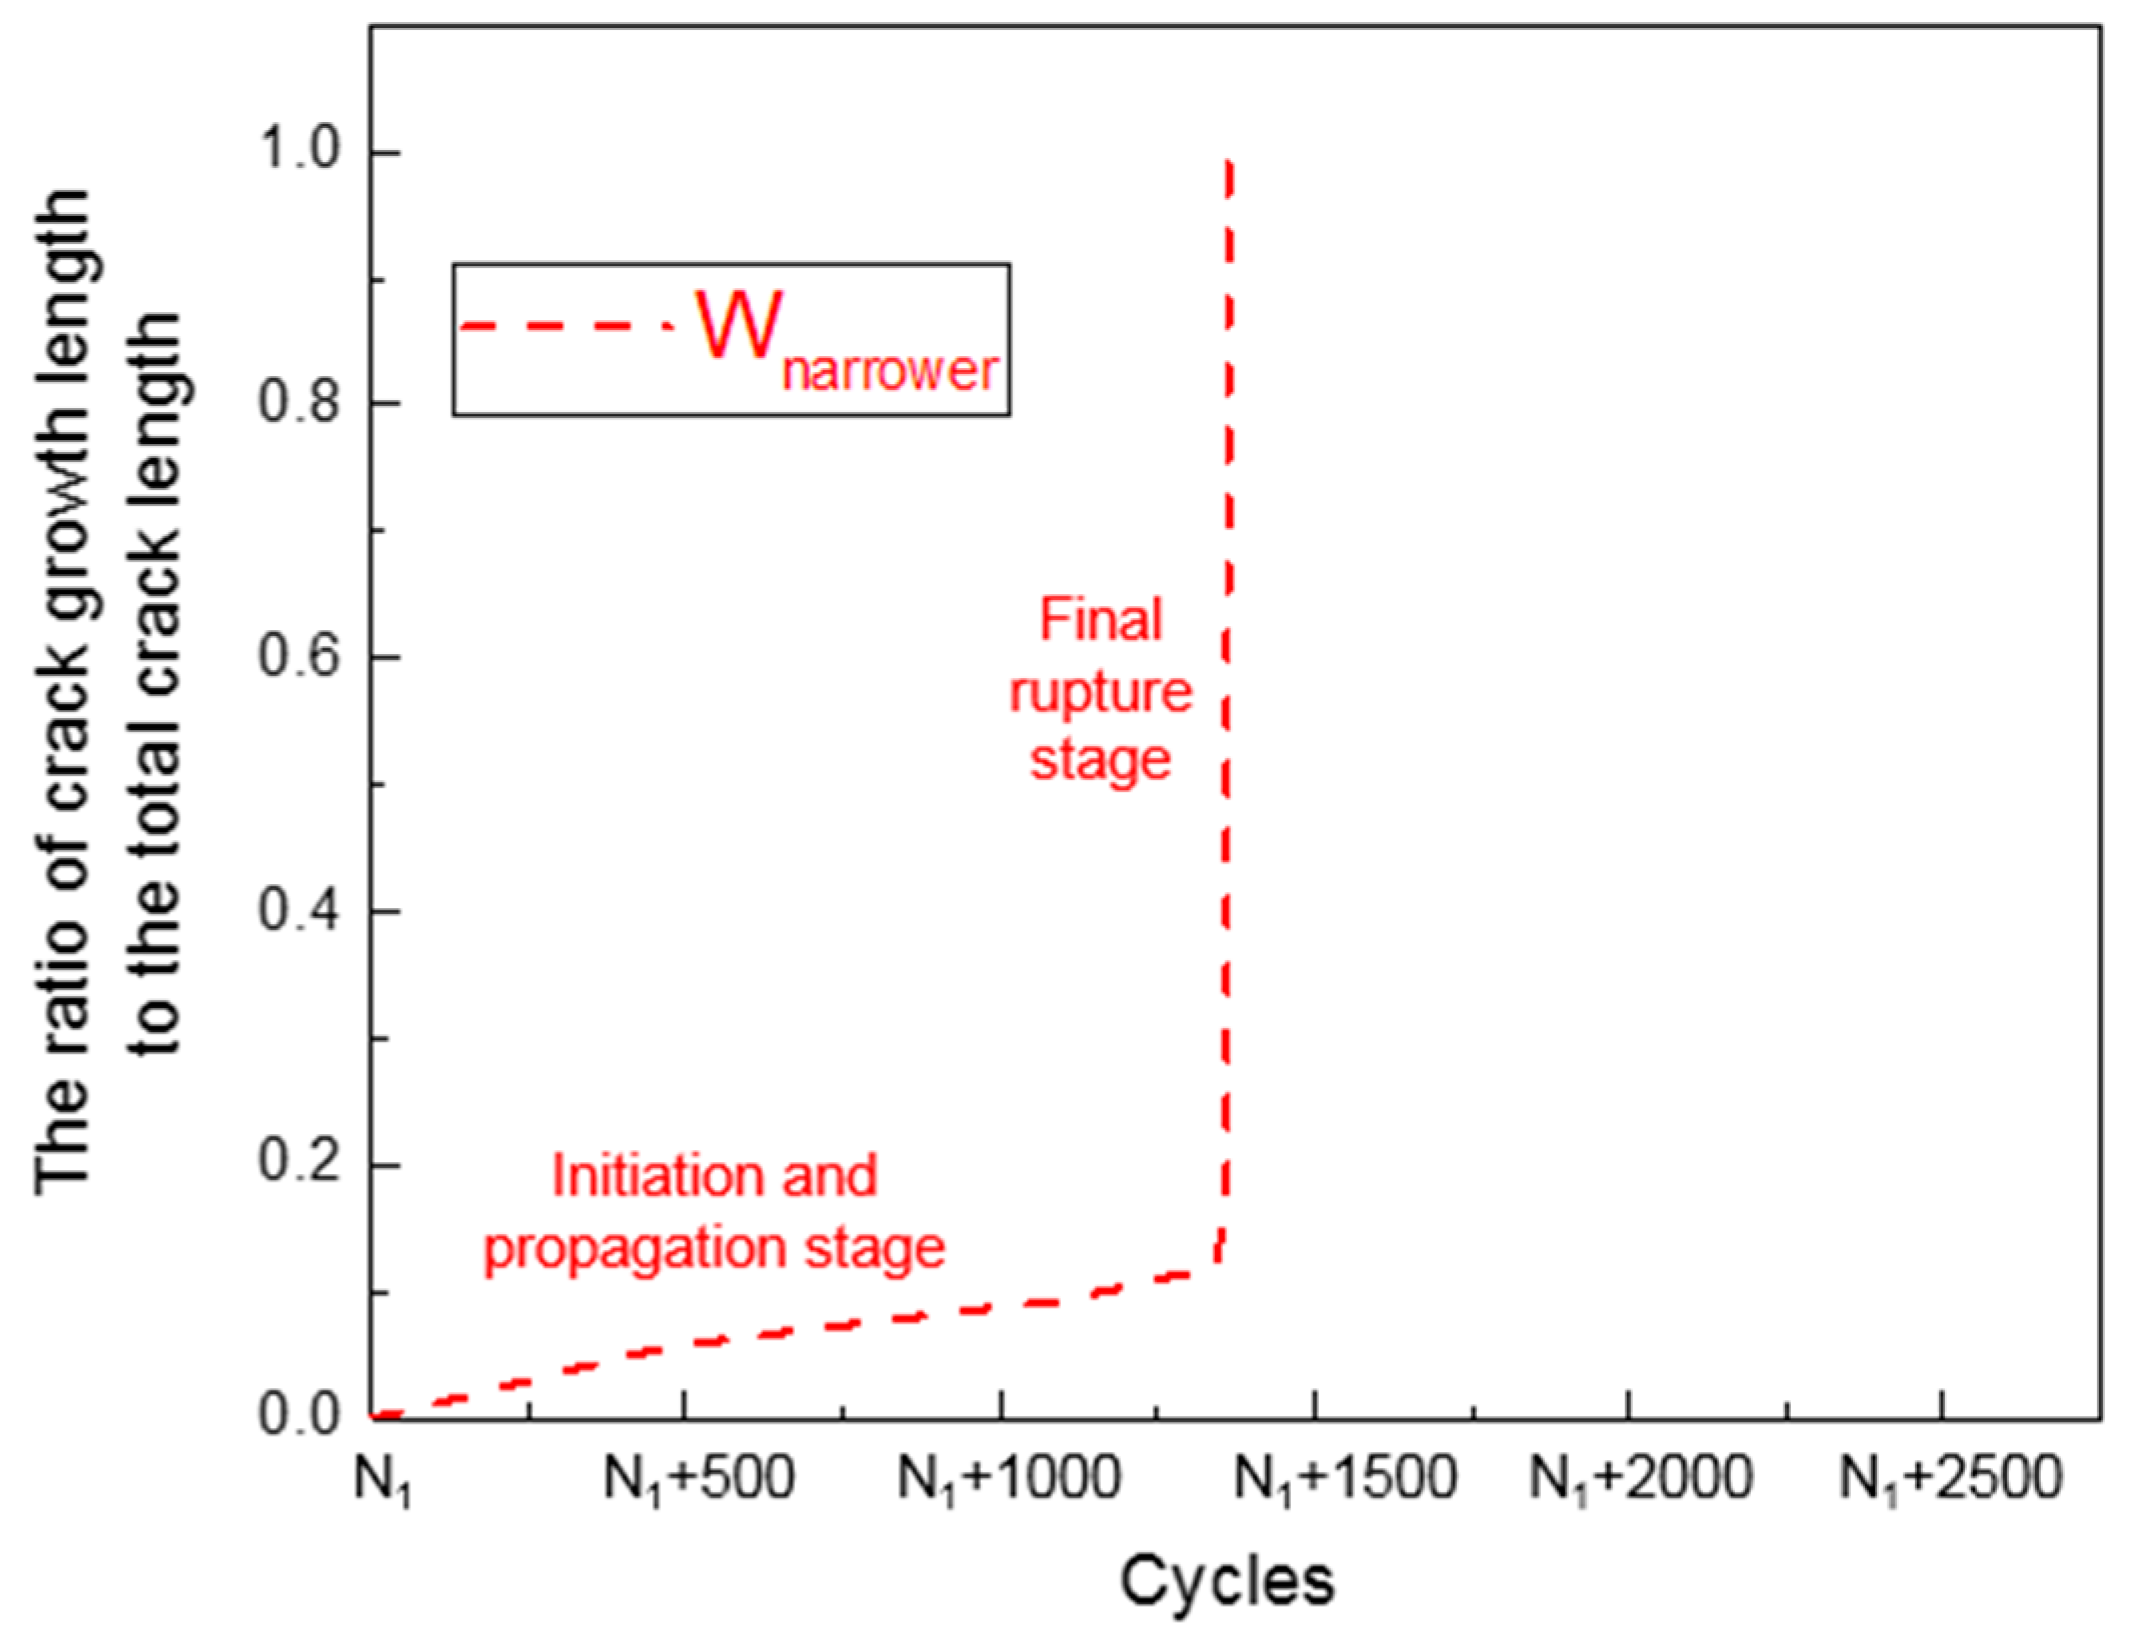
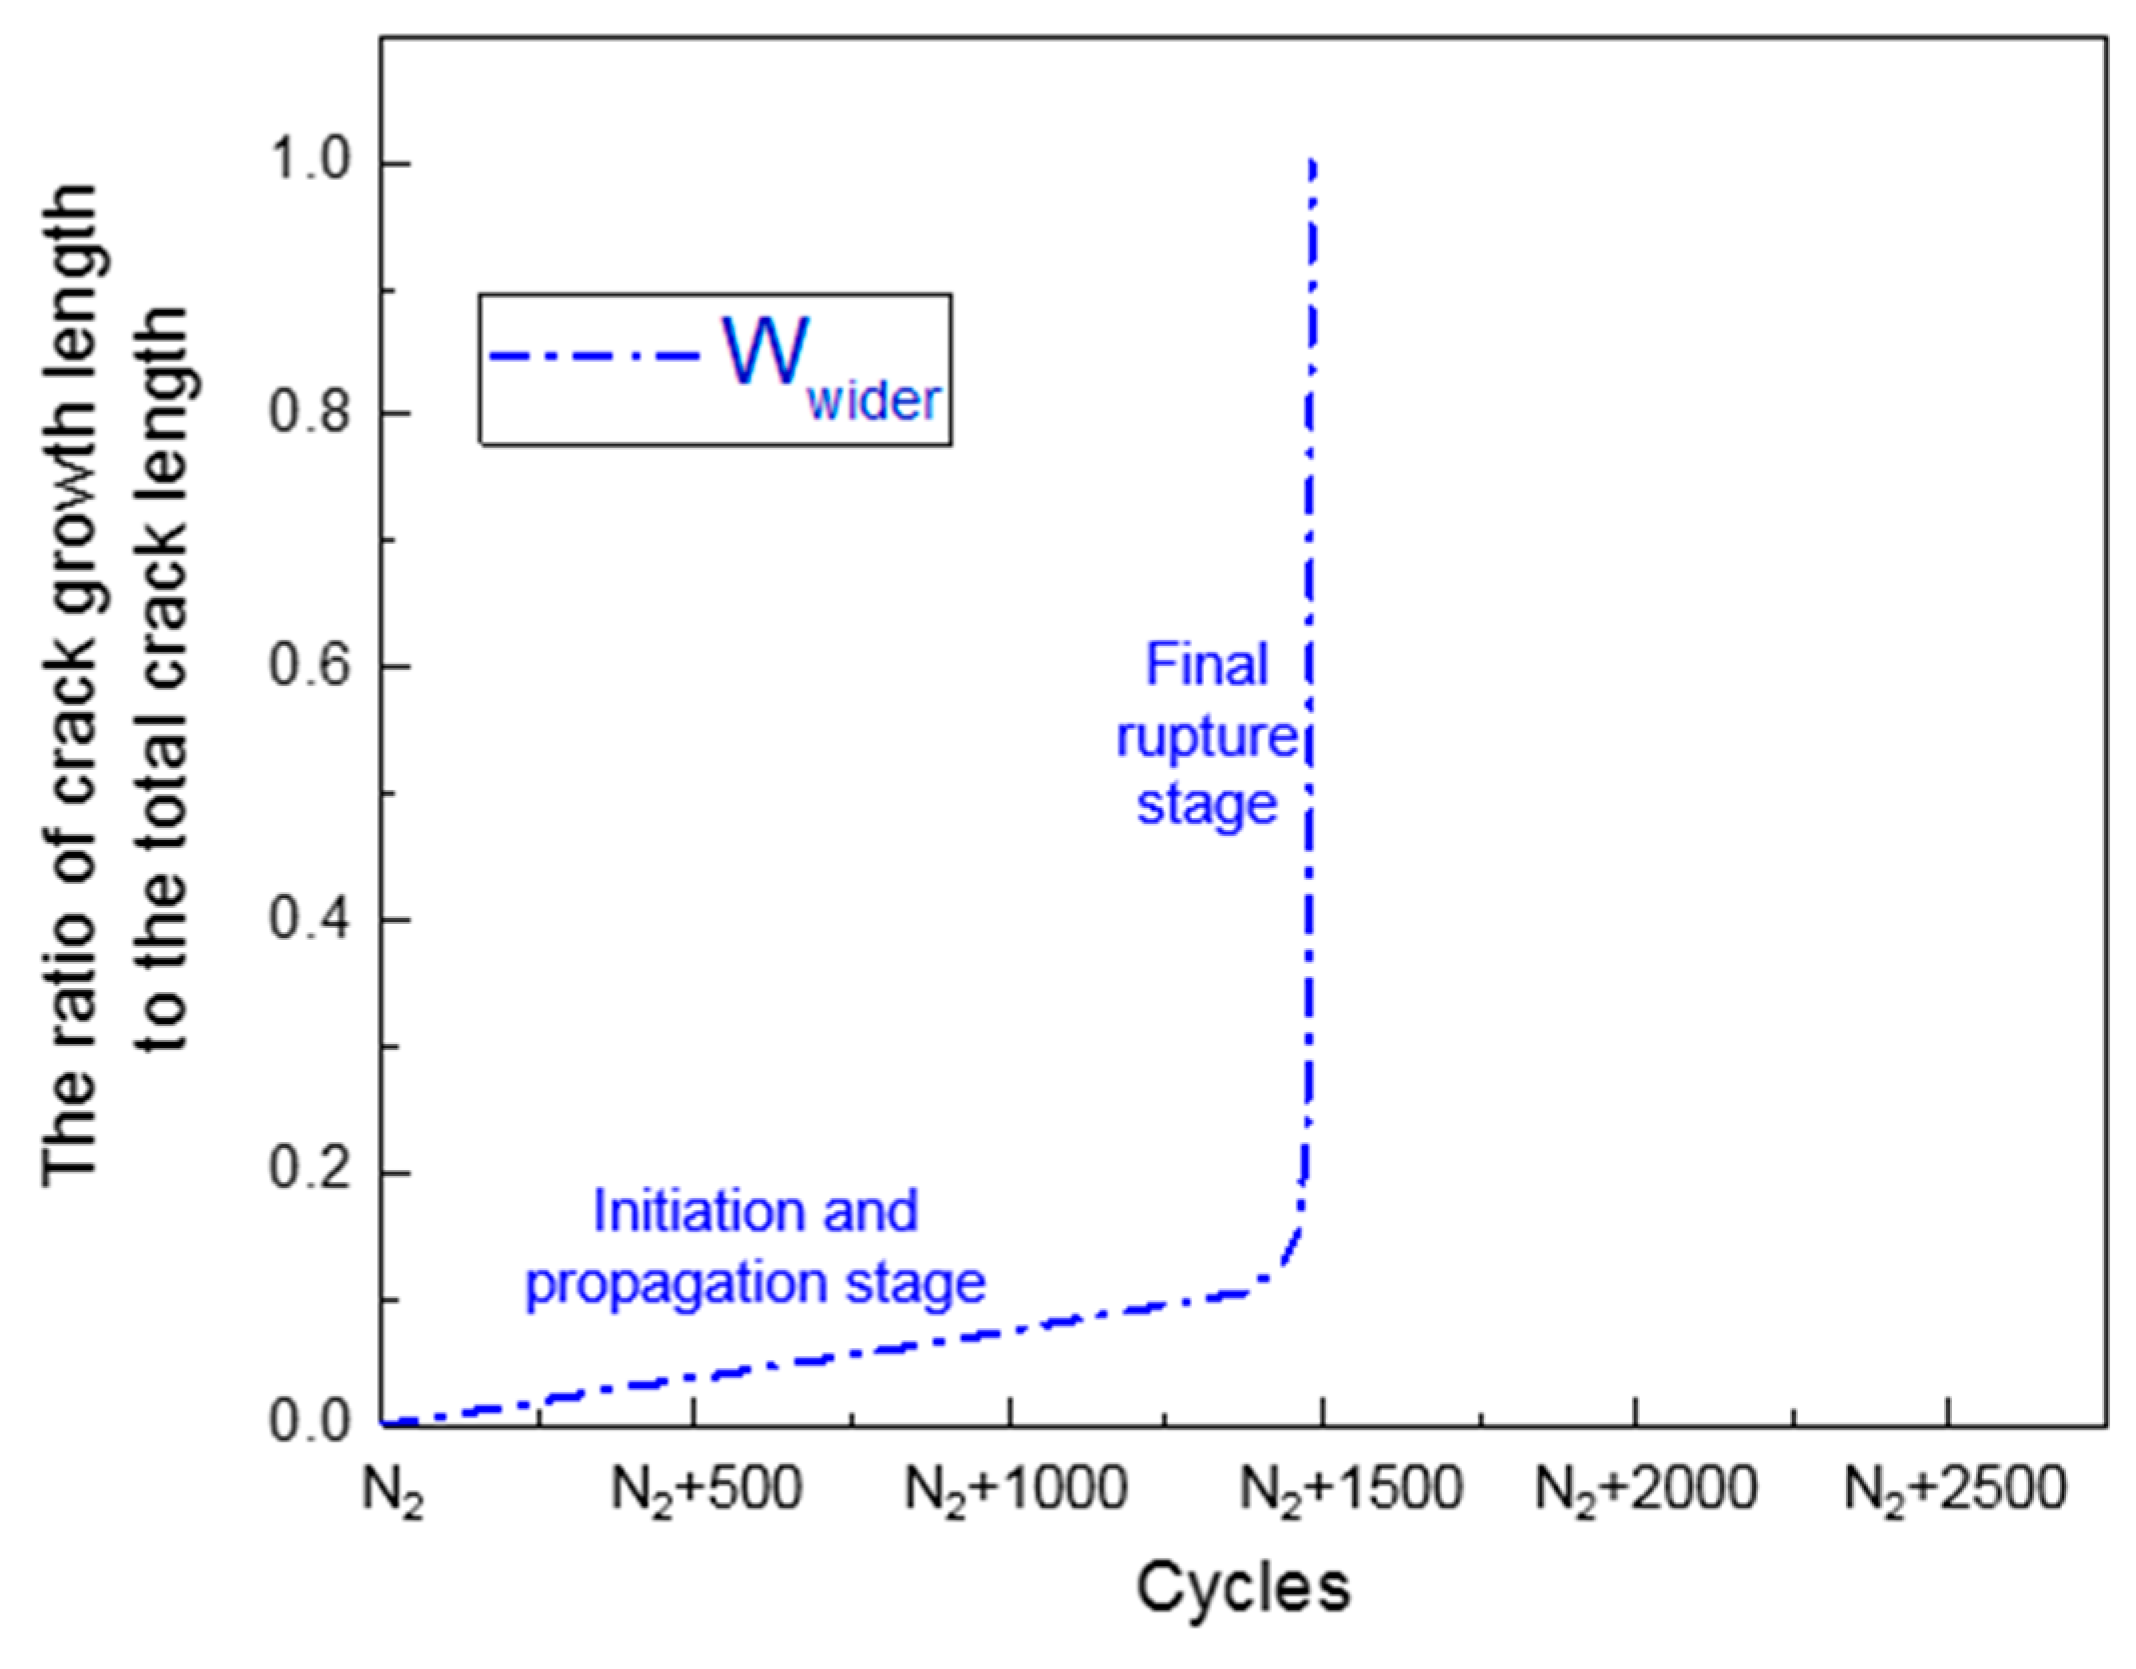
Figure 15, Figure 16 and Figure 17 show the evolution of fatigue cracks of BM, joint Wnarrower, and joint Wwider. It can be seen that the initiation and propagation stage of joint Wnarrower and Wwider was relatively shorter than that of the BM and the fatigue crack of the joint Wnarrower propagated fastest among three specimens. The final rupture stage was very short compared with the initiation and propagation stage.
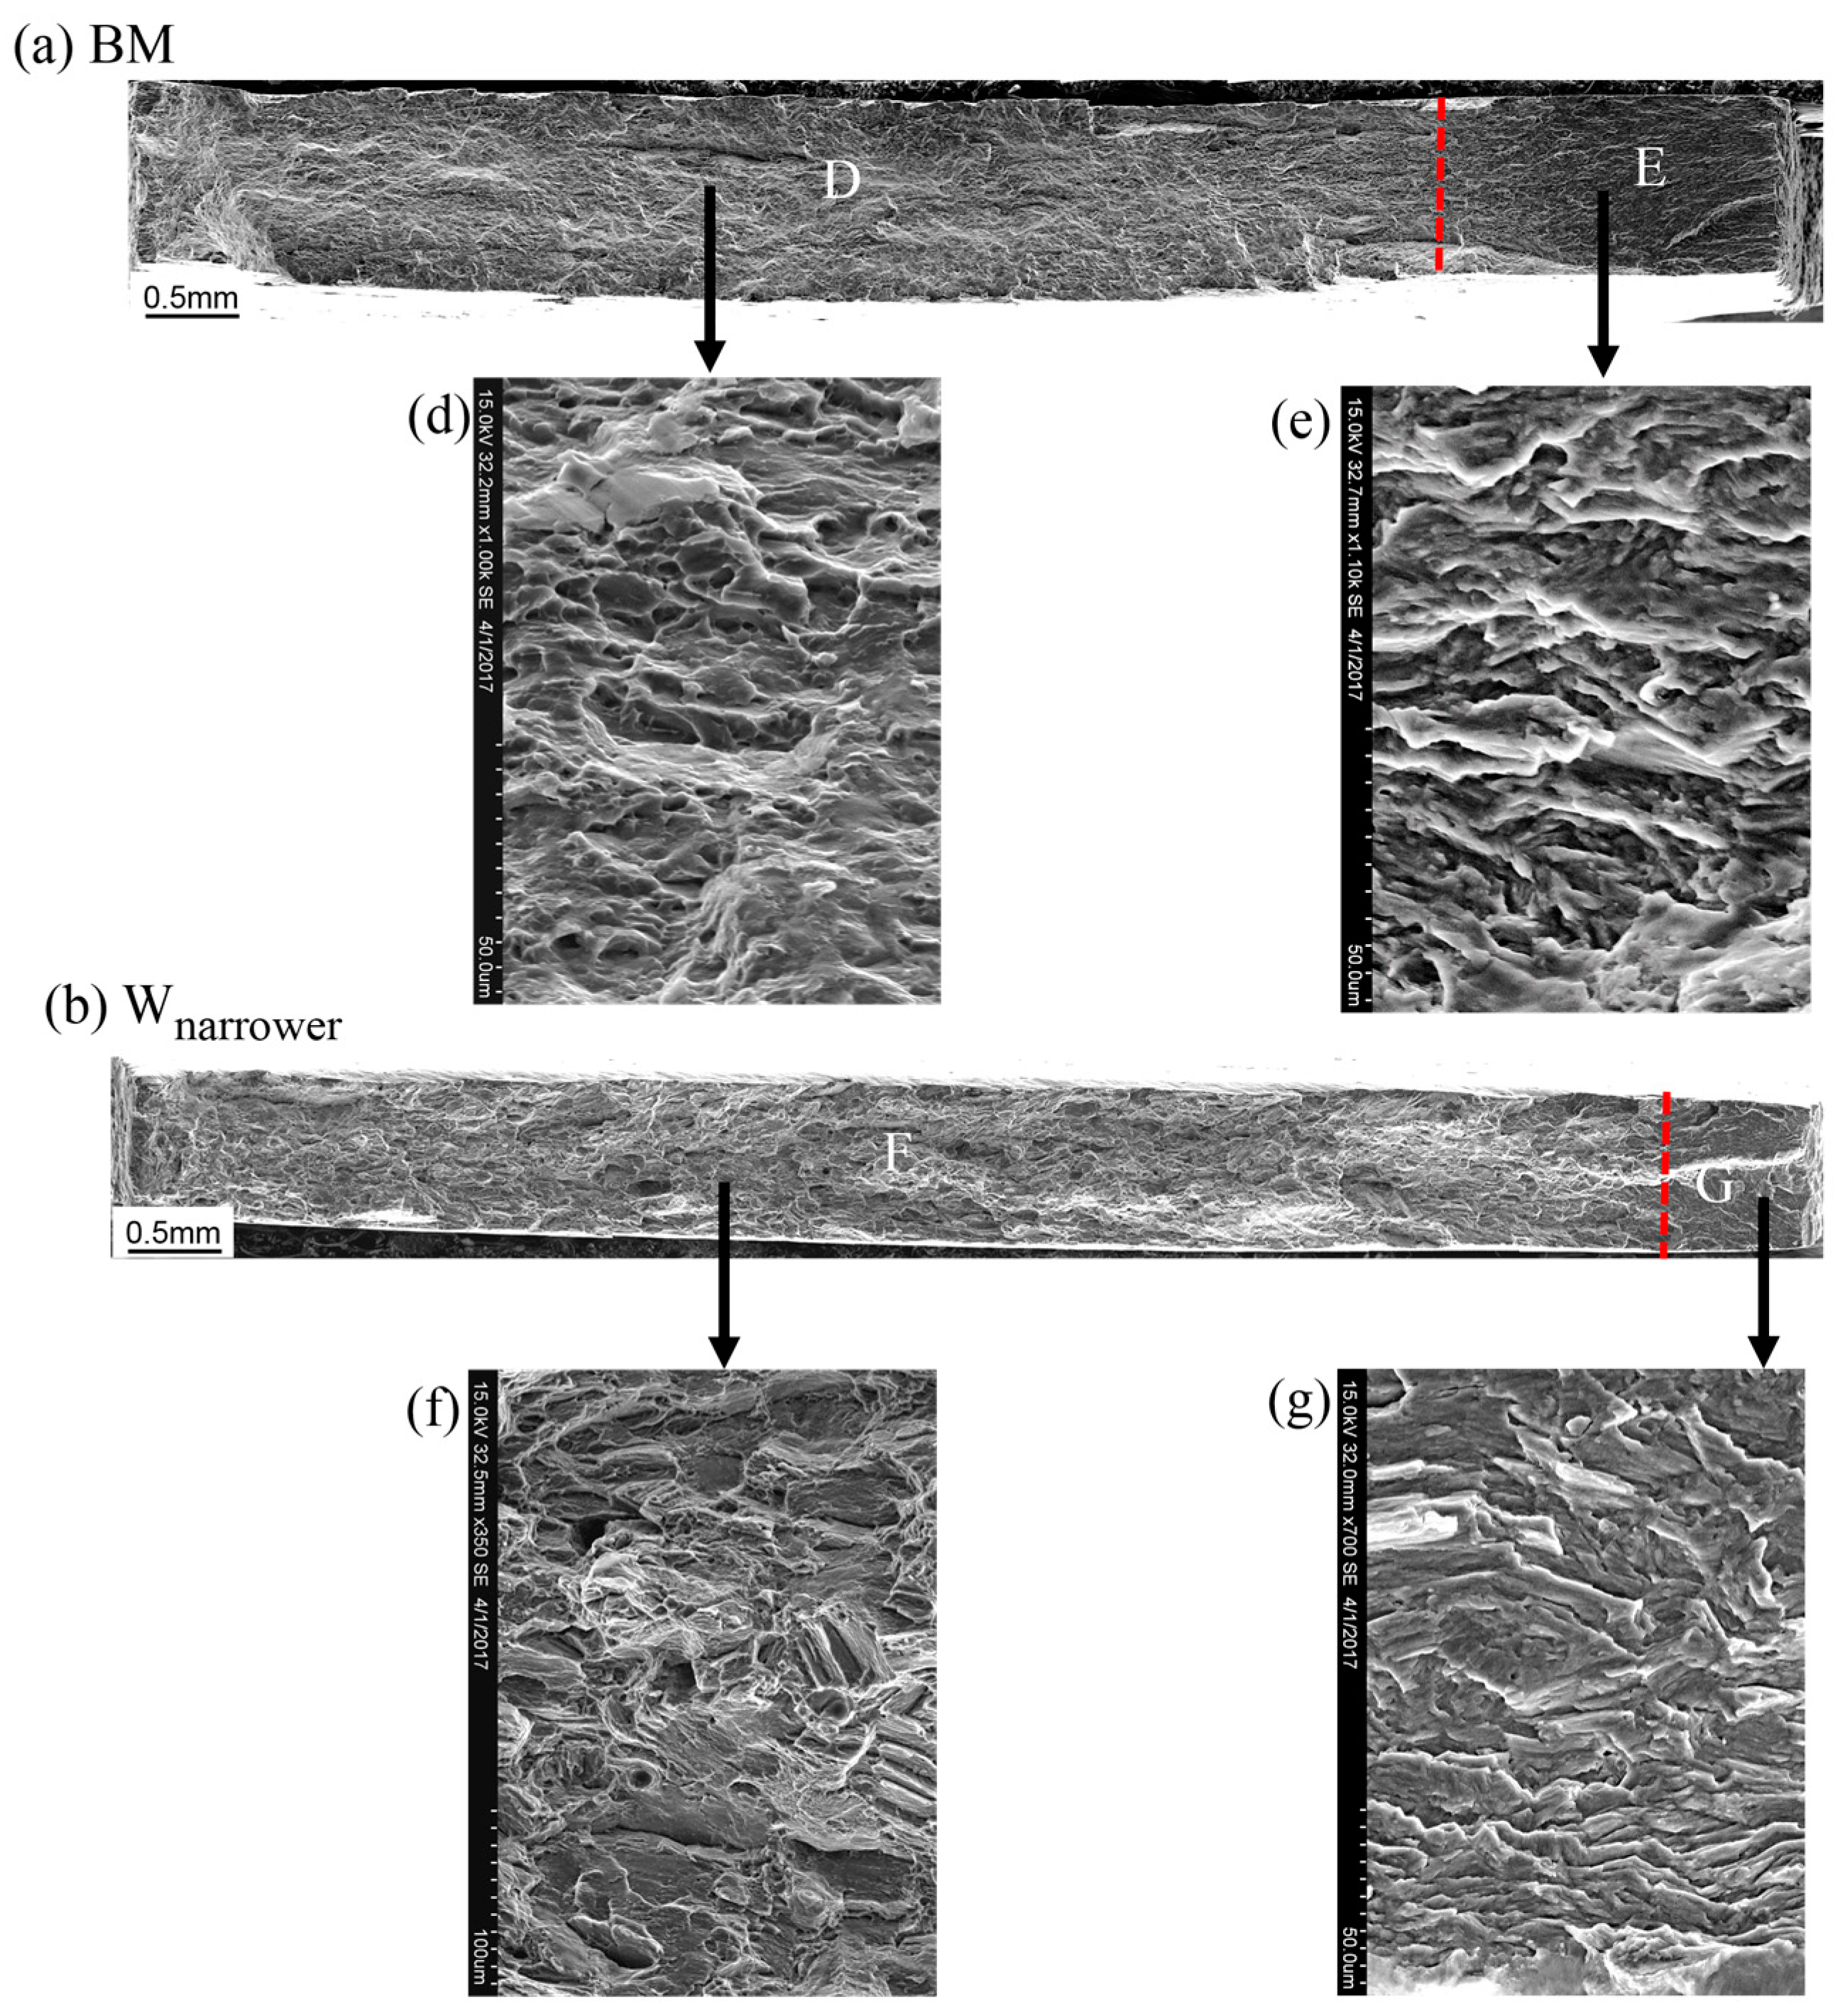
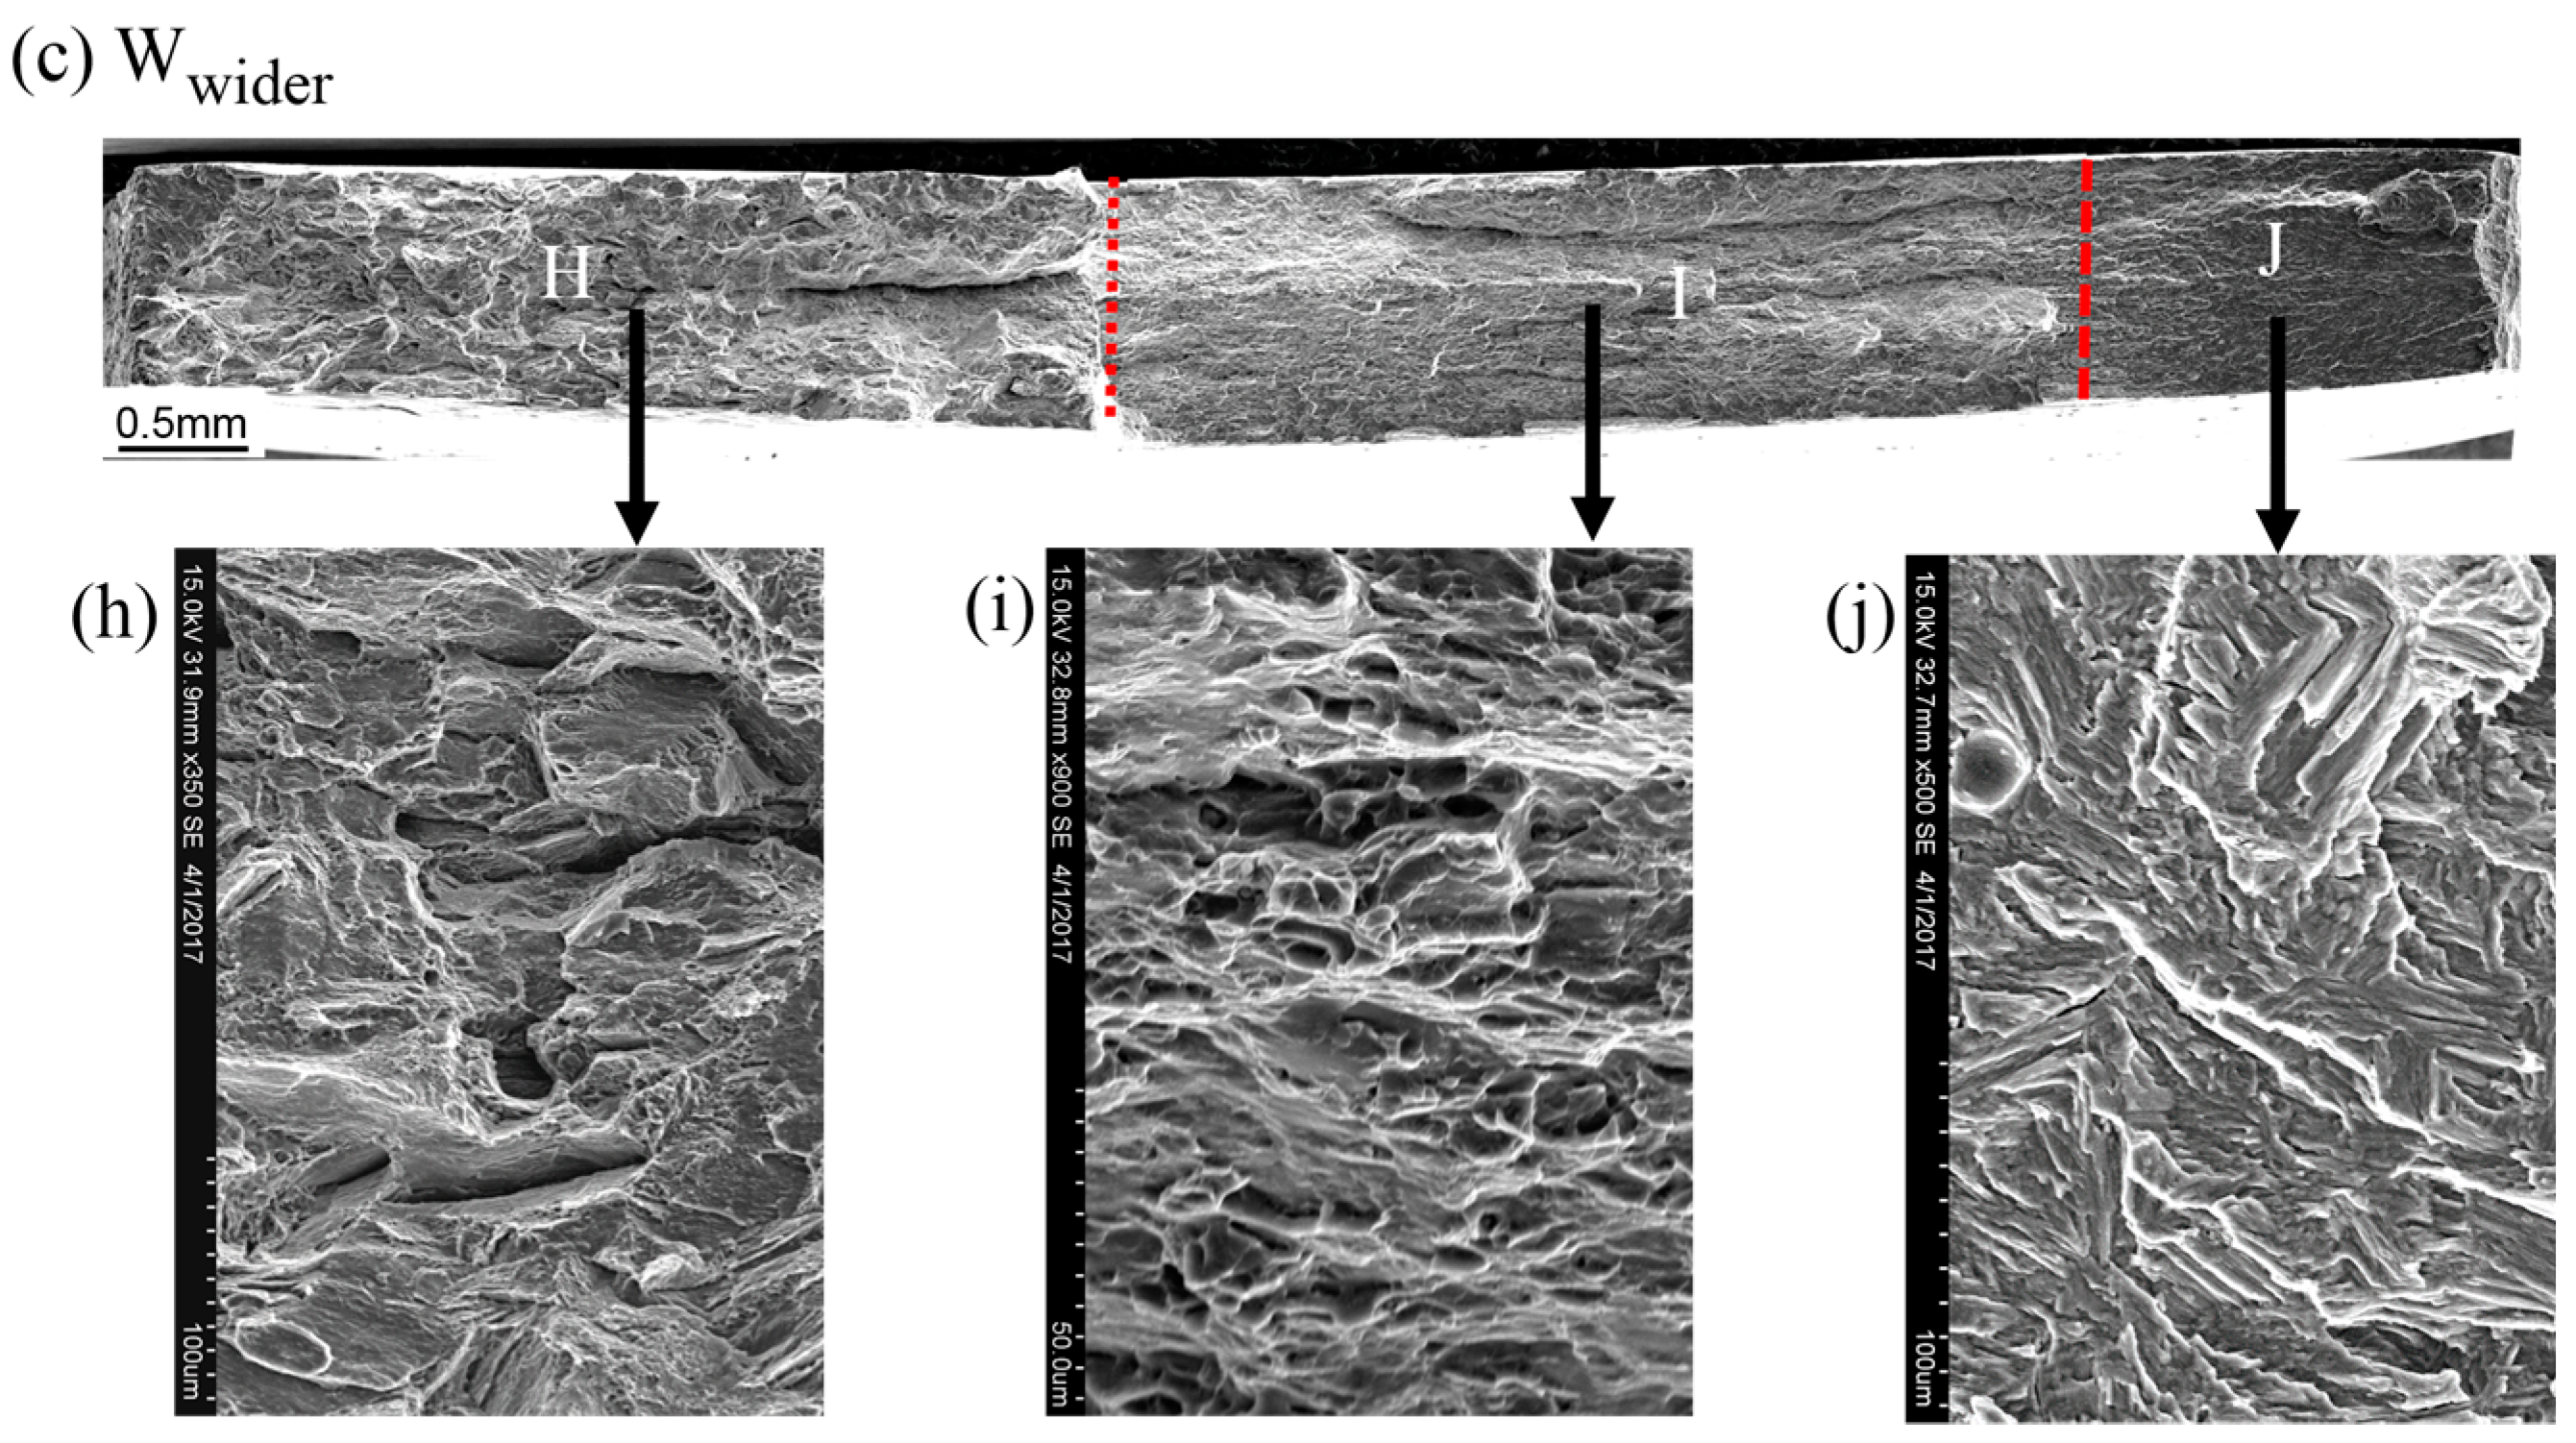
Figure 18 presents the SEM images of the fatigue fracture. The fatigue crack initiation and stable propagation zones of the three samples is shown in the Figure 18a–c and marked with E, G, and J, respectively. The other regions are unstable crack propagation and final rupture zones. Figure 18e, Figure 18g,j are the SEM images with higher magnification for zones E, G, and J. It shows that the stable propagation zones of the three samples are characterized by a lamellar structure and the fracture surface is relatively flat. Additionally, it is revealed in the overall morphologies that the crack initiation and stable propagation zones of BM are larger than that of joint Wnarrower, which indicate that the stable crack propagation stage of FZ is short than that of the BM. Figure 18d,f are the SEM images with higher magnification for zones D and F. It is revealed that the unstable crack propagation zone and final rupture zone of BM are characterized by small and shallow dimples. However, that of FZ is characterized by a tearing ridge which is similar to the fracture morphology observed in the tensile test. This indicates that the FZ has a lower capability of preventing the propagation of the fatigue crack than the BM. Figure 18h,i are the SEM images with higher magnification for zone H and zone I. The zone I is on the base metal part of crack path of joint Wwider and shows identical morphology with the BM. Zone H is on the fusion zone part of the crack path of joint Wwider and presents similar morphology with joint Wnarrower.
4. Conclusions
In this study, tensile tests and fatigue tests were repeated only two times. We have to recognize that this is an obvious limitation of the experimental work. We will pay attention to it in future studies. The major conclusions are as follows:
- The fusion zone of the welded joint is composed of two different zones. The transition zone is composed of columnar grains and are distributed on both sides of the fusion zone. The center of the fusion zone is composed of equiaxed grains. Many precipitated phases were found on the fusion zone. The equiaxed grains next to the fusion boundary on the base metal side did not show obvious growth. The fusion zones of the two welded joints show similar microhardness.
- The tensile strengths of both two joints exceed 90% that of base metal. The elongation rate of the joint Wwider is about 80.9% that of the base metal slightly larger than that of the joint Wnarrower which is up to 72% that of the base metal. The fracture of the base metal is composed of many small and dense dimples. However, the fracture of joint Wnarrower shows a cleavage fracture pattern. The fracture of joint Wwider shows characteristics of both of these two fracture patterns.
- The low-cycle fatigue life of the base metal, the joint Wnarrower and the joint Wwider are 3377.5 cycles, 2825 cycles and 3155.3 cycles, respectively. The initiation and propagation of the fatigue crack of joint Wnarrower is inside the fusion zone. However, the fatigue crack of the joint Wwider initiated at the edge of the base metal and propagated for a distance on the base metal before propagating inside the fusion zone.
In summary, the microstructure and microhardness distribution of the joints Wwider and Wnarrower were similar to each other. The ductility and fatigue life of the joint Wwider was slightly larger than that of the joint Wnarrower. The result of this research can provide reference for optimizing the service performance of laser welded AZ31 thin-walled structures used in the fields of aerospace, automobile, light railway traffic, etc. Certainly, to achieve high-quality products of thin-walled AZ31 structures, there are still many topics should be investigated in the future, such as the size effects of the H-shaped fusion zone of AZ31 joint on its corrosion resistance, flame resistance, high-cycle fatigue properties, and so on.
Acknowledgments
The authors wish to thank Xue-Wu Wang from School of Information Science and Engineering of East China University of Science and Technology for his valuable comments and advices. This work was supported by National Natural Science Foundation of China (grant no. 61773165 and grant no. 51275391).
Author Contributions
Lin-jie Zhang and Jie Ning conceived and designed the experiments; Yi Pei and Jian-Xun Zhang analysed the experimental data; Guang-Feng Lu did the experiments and wrote the paper.
Conflicts of Interest
The authors declare no conflict of interest.
References
- Benyounis, K.Y.; Olabi, A.G.; Hashmi, M.S.J. Effect of laser welding parameters on the heat input and weld-bead profile. J. Mater. Process. Technol. 2005, 164, 978–985. [Google Scholar] [CrossRef] [Green Version]
- Hann, D.B.; Iammi, J.; Folkes, J. A simple methodology for predicting laser-weld properties from material and laser parameters. J. Phys. D Appl. Phys. 2011, 44, 445401. [Google Scholar] [CrossRef]
- Li, S.; Chen, G.; Zhou, C. Effects of welding parameters on weld geometry during high-power laser welding of thick plate. Int. J. Adv. Manuf. Technol. 2015, 79, 177–182. [Google Scholar] [CrossRef]
- Kim, J.; Ki, H. Scaling law for penetration depth in laser welding. J. Mater. Process. Technol. 2014, 214, 2908–2914. [Google Scholar] [CrossRef]
- Volpp, J.; Vollertsen, F. Analytical Modeling of the Keyhole Including Multiple Reflections for Analysis of the Influence of Different Laser Intensity Distributions on Keyhole Geometry. Phys. Procedia 2013, 41, 453–461. [Google Scholar] [CrossRef]
- Ayoola, W.A.; Suder, W.J.; Williams, S.W. Parameters controlling weld bead profile in conduction laser welding. J. Mater. Process. Technol. 2017, 249, 522–530. [Google Scholar] [CrossRef]
- Ngoula, D.T.; Beier, H.T.; Vormwald, M. Fatigue crack growth in cruciform welded joints: Influence of residual stresses and of the weld toe geometry. Int. J. Fatigue 2016, 101, 253–262. [Google Scholar] [CrossRef]
- Matsuoka, S.; Okamoto, Y.; Okada, A. Influence of Weld Bead Geometry on Thermal Deformation in Laser Micro-Welding. Procedia CIRP 2013, 6, 492–497. [Google Scholar] [CrossRef]
- Okamoto, Y.; Matsuoka, S.; Otowa, T.; Okada, A. Influence of Bead Geometry on Weld Distortion in Laser Micro-welding of Thin Stainless Steel Sheet with High-speed Scanning. Int. J. Electr. Mach. 2017, 20, 9–15. [Google Scholar] [CrossRef]
- Liu, S.; Mi, G.; Yan, F.; Wang, C.; Jiang, P. Correlation of high power laser welding parameters with real weld geometry and microstructure. Opt. Laser Technol. 2017, 94, 59–67. [Google Scholar] [CrossRef]
- Zhang, M.; Chen, G.; Zhou, Y.; Li, S. Direct observation of keyhole characteristics in deep penetration laser welding with a 10 kW fiber laser. Opt. Express 2013, 21, 19997–20004. [Google Scholar] [CrossRef] [PubMed]
- Zhang, L.J.; Bai, Q.L.; Ning, J.; Wang, A.; Yang, J.N.; Yin, X.Q.; Zhang, J.X. A comparative study on the microstructure and properties of copper joint between MIG welding and laser-MIG hybrid welding. Mater. Des. 2016, 110, 35–50. [Google Scholar] [CrossRef]
- Pang, S.; Chen, X.; Shao, X.; Gong, S.; Xiao, J. Dynamics of vapor plume in transient keyhole during laser welding of stainless steel: Local evaporation, plume swing and gas entrapment into porosity. Opt. Lasers Eng. 2016, 82, 28–40. [Google Scholar] [CrossRef]
- Zhou, L.; Li, Z.Y.; Song, X.G.; Tan, C.W.; He, Z.Z.; Huang, Y.X.; Feng, J.C. Influence of laser offset on laser welding-brazing of Al/brass dissimilar alloys. J. Alloy. Compd. 2017, 717, 78–92. [Google Scholar] [CrossRef]
- Pang, S.; Chen, X.; Li, W.; Shao, X.; Gong, S. Efficient multiple time scale method for modeling compressible vapor plume dynamics inside transient keyhole during fiber laser welding. Opt. Laser Technol. 2016, 77, 203–214. [Google Scholar] [CrossRef]
- Guo, W.; Crowther, D.; Francis, J.A.; Thompson, A.; Liu, Z.; Li, L. Microstructure and mechanical properties of laser welded S960 high strength steel. Mater. Des. 2015, 85, 534–548. [Google Scholar] [CrossRef]
- Leo, P.; Renna, G.; Casalino, G.; Olabi, A.G. Effect of power distribution on the weld quality during hybrid laser welding of an Al–Mg alloy. Opt. Laser Technol. 2015, 73, 118–126. [Google Scholar] [CrossRef]
- Casalino, G.; Guglielmi, P.; Lorusso, V.D.; Mortello, M.; Peyre, P.; Sorgente, D. Laser offset welding of AZ31B magnesium alloy to 316 stainless steel. J. Mater. Process. Technol. 2017, 242, 49–59. [Google Scholar] [CrossRef]
- Casalino, G.; Mortello, M.; Campanelli, S.L. Ytterbium fiber laser welding of Ti6Al4V alloy. J. Manuf. Process. 2015, 20, 250–256. [Google Scholar] [CrossRef]
- Campanelli, S.L.; Casalino, G.; Mortello, M.; Angelastro, A.; Ludovico, A.D. Microstructural Characteristics and Mechanical Properties of Ti6Al4V Alloy Fiber Laser Welds. Procedia CIRP 2015, 33, 428–433. [Google Scholar] [CrossRef]
- Casalino, G.; Campanelli, S.L.; Ludovico, A.D. Laser-arc hybrid welding of wrought to selective laser molten stainless steel. Int. J. Adv. Manuf. Technol. 2013, 68, 209–216. [Google Scholar] [CrossRef]
- Krasnoperov, M.Y.; Pieters, R.R.G.M.; Richardson, I.M. Weld pool geometry during keyhole laser welding of thin steel sheets. Sci. Technol. Weld. Join. 2014, 9, 501–506. [Google Scholar] [CrossRef]
- Gao, X.L.; Zhang, L.J.; Liu, J.; Zhang, J.X. Effects of weld cross-section profiles and microstructure on properties of pulsed Nd:YAG laser welding of Ti6Al4V sheet. Int. J. Adv. Manuf. Technol. 2014, 72, 895–903. [Google Scholar] [CrossRef]
- Quan, Y.J.; Chen, Z.H.; Gong, X.S.; Yu, Z.H. Effects of heat input on microstructure and tensile properties of laser welded magnesium alloy AZ31. Mater. Charact. 2008, 59, 1491–1497. [Google Scholar] [CrossRef]
- Wang, X.; Wang, K. Microstructure and properties of friction stir butt-welded AZ31 magnesium alloy. Mater. Sci. Eng. A 2006, 431, 114–117. [Google Scholar]
- Ning, J.; Zhang, L.J.; Bai, Q.L.; Yin, X.Q.; Niu, J.; Zhang, J.X. Comparison of the microstructure and mechanical performance of 2A97 Al-Li alloy joints between autogenous and non-autogenous laser welding. Mater. Des. 2017, 120, 144–156. [Google Scholar] [CrossRef]
Figure 1.
Microstructure of BM (base metal).
Figure 2.
Details of the mechanical properties tests: (a) dimension of the tensile test specimens, (b) dimension of the fatigue test specimens, and (c) fatigue test setup.
Figure 2.
Details of the mechanical properties tests: (a) dimension of the tensile test specimens, (b) dimension of the fatigue test specimens, and (c) fatigue test setup.
Figure 3.
The upper surface morphologies and corresponding welding parameters of the welded joints achieved through the orthogonal experiments: (a–y) the upper surface morphologies and welding parameters of welded joints 1–25 in Table 2, respectively.
Figure 3.
The upper surface morphologies and corresponding welding parameters of the welded joints achieved through the orthogonal experiments: (a–y) the upper surface morphologies and welding parameters of welded joints 1–25 in Table 2, respectively.
Figure 4.
The cross-section morphologies and corresponding welding parameters of the welded joints achieved through the orthogonal experiments: (a–y) the cross-section morphologies and welding parameters of welded joints 1–25 in Table 2, respectively.
Figure 4.
The cross-section morphologies and corresponding welding parameters of the welded joints achieved through the orthogonal experiments: (a–y) the cross-section morphologies and welding parameters of welded joints 1–25 in Table 2, respectively.
Figure 5.
The width of the fusion zone of welded joints: (a) Wnarrower (P = 1500 W, V = 8 m/min, f = 0 mm) and (b) Wwider (P = 2000 W, V = 5 m/min, f = 2 mm).
Figure 5.
The width of the fusion zone of welded joints: (a) Wnarrower (P = 1500 W, V = 8 m/min, f = 0 mm) and (b) Wwider (P = 2000 W, V = 5 m/min, f = 2 mm).
Figure 6.
The microstructure of welded joints: (a, b) overall view of joint Wnarrower and Wwider; and (c–h) high-resolution images of positions C–H in panel (a, b).
Figure 6.
The microstructure of welded joints: (a, b) overall view of joint Wnarrower and Wwider; and (c–h) high-resolution images of positions C–H in panel (a, b).
Figure 7.
The microhardness (HV) distribution profile along the center line in the direction of the plate thickness: (a) overview of the microhardness distribution profile, and (b) the microhardness distribution around the FZ.
Figure 7.
The microhardness (HV) distribution profile along the center line in the direction of the plate thickness: (a) overview of the microhardness distribution profile, and (b) the microhardness distribution around the FZ.
Figure 8.
Tensile test results of joint Wnarrower, joint Wwider, and BM.
Figure 9.
SEM (scanning electron microscope) images of the tensile fractures: (a–c) the overall view of BM, joint Wnarrower, and joint Wwider respectively; (d–f) the high resolution images of region D–F in panel (a–c).
Figure 9.
SEM (scanning electron microscope) images of the tensile fractures: (a–c) the overall view of BM, joint Wnarrower, and joint Wwider respectively; (d–f) the high resolution images of region D–F in panel (a–c).
Figure 10.
Crack evolution in the low-cycle fatigue test of base metal: (a–d) the status of the crack propagation at different times.
Figure 10.
Crack evolution in the low-cycle fatigue test of base metal: (a–d) the status of the crack propagation at different times.
Figure 11.
Crack evolution in the low-cycle fatigue test of the welded joint Wnarrower: (a–c) the status of the crack propagation at different times.
Figure 11.
Crack evolution in the low-cycle fatigue test of the welded joint Wnarrower: (a–c) the status of the crack propagation at different times.
Figure 12.
The fracture path on the welded joint Wnarrower after low-cycle fatigue testing.
Figure 13.
Crack evolution in the low-cycle fatigue test of the welded joint Wwider: (a–d) the status of the crack propagation at different times.
Figure 13.
Crack evolution in the low-cycle fatigue test of the welded joint Wwider: (a–d) the status of the crack propagation at different times.
Figure 14.
The fracture path on the weld joint Wwider after low-cycle fatigue testing.
Figure 15.
The evolution of fatigue cracks of BM in terms of cycles (N0 represents where the crack of BM initiated).
Figure 15.
The evolution of fatigue cracks of BM in terms of cycles (N0 represents where the crack of BM initiated).
Figure 16.
The evolution of fatigue cracks of joint Wnarrower in terms of cycles (N1 represents where the crack of joint Wnarrower initiated).
Figure 16.
The evolution of fatigue cracks of joint Wnarrower in terms of cycles (N1 represents where the crack of joint Wnarrower initiated).
Figure 17.
The evolution of fatigue cracks of joint Wwider in terms of cycles (N2 represents where the crack of joint Wwider initiated).
Figure 17.
The evolution of fatigue cracks of joint Wwider in terms of cycles (N2 represents where the crack of joint Wwider initiated).
Figure 18.
The SEM images of fatigue fracture: (a–c) overall view of BM, joint Wnarrower and Wwider; and (d–j) typical morphologies of region D–J in panel (a–c).
Figure 18.
The SEM images of fatigue fracture: (a–c) overall view of BM, joint Wnarrower and Wwider; and (d–j) typical morphologies of region D–J in panel (a–c).

Table 1.
Chemical composition of AZ31 magnesium alloy (wt %).
| Al | Zn | Mn | Si | Fe | Cu | Ca | Be | Mg |
|---|---|---|---|---|---|---|---|---|
| 3.19% | 0.81% | 0.34% | 0.02% | 0.005% | 0.05% | 0.04% | 0.1% | Balance |
Table 2.
L25 (53) orthogonal test table.
| Welded Joint Number | Welding Power/W | Welding Speed/m/min | Defocusing Amount/mm |
|---|---|---|---|
| 1 | 500 | 2 | −2 |
| 2 | 500 | 3.5 | 0 |
| 3 | 500 | 5 | 2 |
| 4 | 500 | 6.5 | 4 |
| 5 | 500 | 8 | 6 |
| 6 | 1000 | 2 | 0 |
| 7 | 1000 | 3.5 | 2 |
| 8 | 1000 | 5 | 4 |
| 9 | 1000 | 6.5 | 6 |
| 10 | 1000 | 8 | −2 |
| 11 | 1500 | 2 | 2 |
| 12 | 1500 | 3.5 | 4 |
| 13 | 1500 | 5 | 6 |
| 14 | 1500 | 6.5 | −2 |
| 15 | 1500 | 8 | 0 |
| 16 | 2000 | 2 | 4 |
| 17 | 2000 | 3.5 | 6 |
| 18 | 2000 | 5 | −2 |
| 19 | 2000 | 6.5 | 0 |
| 20 | 2000 | 8 | 2 |
| 21 | 2500 | 2 | 6 |
| 22 | 2500 | 3.5 | −2 |
| 23 | 2500 | 5 | 0 |
| 24 | 2500 | 6.5 | 2 |
| 25 | 2500 | 8 | 4 |
© 2018 by the authors. Licensee MDPI, Basel, Switzerland. This article is an open access article distributed under the terms and conditions of the Creative Commons Attribution (CC BY) license (http://creativecommons.org/licenses/by/4.0/).
Share and Cite
MDPI and ACS Style
Lu, G.-F.; Zhang, L.-J.; Pei, Y.; Ning, J.; Zhang, J.-X. Study on the Size Effects of H-Shaped Fusion Zone of Fiber Laser Welded AZ31 Joint. Metals 2018, 8, 198. https://doi.org/10.3390/met8040198
AMA Style
Lu G-F, Zhang L-J, Pei Y, Ning J, Zhang J-X. Study on the Size Effects of H-Shaped Fusion Zone of Fiber Laser Welded AZ31 Joint. Metals. 2018; 8(4):198. https://doi.org/10.3390/met8040198
Chicago/Turabian StyleLu, Guang-Feng, Lin-Jie Zhang, Yi Pei, Jie Ning, and Jian-Xun Zhang. 2018. "Study on the Size Effects of H-Shaped Fusion Zone of Fiber Laser Welded AZ31 Joint" Metals 8, no. 4: 198. https://doi.org/10.3390/met8040198
Note that from the first issue of 2016, this journal uses article numbers instead of page numbers. See further details here.