Effects of Porosity on Mechanical Properties and Corrosion Resistances of PM-Fabricated Porous Ti-10Mo Alloy
by

Wei Xu
1, 
Xin Lu
1,*,
Bing Zhang
2,
Chengcheng Liu
1,
Shaomin Lv
1,2,
Shidi Yang
3 and
Xuanhui Qu
1
1
Institute for Advanced Materials and Technology, University of Science and Technology Beijing, Beijing 100083, China
2
Science and Technology on Advanced High Temperature Structural Materials Laboratory, AECC Beijing Institute of Areonautical Materials, Beijing 100095, China
3
Sanying Precision Instruments Co., Ltd., Tianjin 300399, China
*
Author to whom correspondence should be addressed.
Metals 2018, 8(3), 188; https://doi.org/10.3390/met8030188
Submission received: 30 January 2018
/
Revised: 3 March 2018
/
Accepted: 14 March 2018
/
Published: 15 March 2018
(This article belongs to the Special Issue Powder Synthesis and Processing)
Abstract
:Porous binary Ti-10Mo alloys were prepared using non-spherical titanium, molybdenum powders by the powder metallurgy (PM) space holder technique. Based on the three-dimensional analysis of porosity characteristics, a detailed assessment of the effects of porosity on mechanical properties and corrosion resistances in phosphate-buffered saline (PBS) was carried out. For comparison, PM-fabricated CP-Ti with 50.5% porosity sintered at 1200 °C for 2 h and dense Ti-10Mo alloy sintered at 1450 °C for 2 h (relative density is 97.2% and porosity is 2.8%) were studied simultaneously. The results show that with the space-holder volume contents rising from 63 to 79%, the open porosity and average pore size (d50) increase remarkably, while the pore size distribution (d10–d90) tends to be stable at about 100 μm. The average pore sizes (d50) of porous Ti-10Mo alloy can be controlled in the range of 70–380 μm. The PM-fabricated porous Ti-10Mo alloy can achieve a wide range of mechanical properties, with yield compression strength of 248.2–76.9 MPa, and elastic modulus of 6.4–1.7 GPa. In addition, the yield compression strength and the elastic modulus meet the linear regression and exponential formula, respectively. With the porosity of Ti-10Mo alloy increasing from 2.8 to 66.9%, the corrosion rate rises exponentially from 1.6 g/m2·day to 17.1 g/m2·day. In comparison to CP Ti with nearly the same porosity, Ti-10Mo alloy shows significantly higher corrosion resistance. As a result, the relationships between porosity and mechanical properties, corrosion resistances of Ti-10Mo alloys were established, which can be used as a design reference in material selection for orthopedic applications.
1. Introduction
Titanium and its alloys have been widely used in biomedical applications and have a great potential in making orthopedic implants due to their high specific strength, low elastic modulus, excellent biocompatibility and corrosion resistance in the human body environment [1]. However, current major biomedical titanium alloys in used, including the most conventional extra-low interstitial (ELI) Ti-6Al-4V (hereafter all in wt. %), Ti-5Al-2.5Fe and Ti-6Al-7Nb, are all at risk of releasing toxic Al and V ions in vivo. Besides, elastic modulus (~110 GPa) of these alloys is still much higher than that of cortical bone, which may bring severe ‘stress shielding’ [2]. Ample effort has been made to develop Al- and V-free lower-modulus β-Ti alloys. Notable examples include the United States Food and Drug Administration (FDA)-approved proprietary alloys Ti-13Nb-13Zr and Ti-12Mo-6Zr-2Fe and the non-proprietary alloy Ti-15Mo. In particular, binary Ti-Mo alloys containing 4–20% Mo have attracted significant attention due to their simplicity and reasonable cost [3,4,5,6,7], as well as the capability of offering a very low amount of artifacts in magnetic resonance imaging (MRI) compared to other β-titanium alloys.
As a commonly used β-phase stabilizing element in titanium, Mo is non-toxic and non-allergic below ion concentration of 8.5 μg/L [8]. It also can effectively reduce the elastic modulus of titanium alloy through forming metastable or stable β-phase while increase the strength and wear resistance [9]. In addition, some studies have demonstrated that Mo can contribute to regulating the acid-base balance in human bodies [10,11]. Near-β titanium alloy Ti-15Mo, as mentioned above, is a successful example which has been used clinically since 1998 (the developmental history of Ti-15Mo can be found in Ref. [12]). Previous studies have proved that solid solution hardening in Ti-Mo alloys appears to be maximal at 10–12% Mo, and Ti-(10–12.5)Mo alloys (335–350 HV) are clearly harder than ELI Ti-6Al-4V (294 HV) and Ti-13Nb-13Zr (285 HV) under the same conditions [3]. From an application-and-design point of view, less Mo content is always preferred. Mo element is costly and heavy (density = 10.28 g cm−3). Hence, minimizing the use of Mo minimizes the cost and latent risk. Furthermore, minimizing the use of Mo also lowers the melting point of Ti-Mo alloys, which makes the alloys liable to be processed. Accordingly, the composition of Ti-10Mo was selected as a competitive option.
To improve fixation of solid implants to the surrounding tissues, materials with a porous structure have been introduced. By ingrowing of the tissue into a porous structure in a metallic implant, bonding between the implant and the bone can be obtained. In addition, the substantial open-cellular structure, in the metallic implant, allows extensive transport of [13,14,15] or even for potential use on drug delivery [16]. Several previous studies indicate that porous Ti-(7.5–15)Mo alloys can be processed by selective laser sintering [17,18,19,20]. It has been testified that their intriguing characteristics, mainly including the promising mechanical properties and good biocompatibility, make the alloys an attractive candidate as a new implant material. Although contributing greatly to the improvement of biomechanical compatibility, porosity may inevitably reduce the resistance to corrosion, which may elicit both local and systemic biological responses. Hence, assessing the in vitro corrosion performance in physiological solutions and further establishing a relationship among pore characteristic, mechanical and corrosion properties are crucial, but still rare in the open literature.
In this paper, porous Ti-10Mo alloys were processed with a low-cost technique, powder metallurgy (PM), from non-spherical hydride-dehydride (HDH) Ti powders and hydrogen-reduced Mo powders. The purpose of this research is to assess systematically the pore characteristics, mechanical properties and electrochemical behavior of PM-fabricated Ti-10Mo alloys. It aims to establish a necessary understanding of the low-cost fabricated porous Ti-10Mo alloy for orthopedic applications.
2. Experiments and Methods
2.1. Materials and Sample Preparation by PM
Hydride-dehydride (HDH) Ti powder (≤45 μm) and hydrogen-reduced Mo powder (≤25 μm) (Beijing Xing Rong Yuan Technology Co. Ltd., Beijing, China) were used to make Ti-10Mo alloy. The metal powder compositions are listed in Table 1. Then Ti-10Mo powder and NH4HCO3 (80–250 μm) were mixed in a blender for 3 h, where volume contents of NH4HCO3 were set at five points between 63% and 79% (vol. %), respectively. After blending, the mixture was cold-pressed into cylindrical compacts under 260 MPa. Final sintering was carried out in the argon protection environment and implemented in two steps. Specimens were initially heated to 1000 °C for 2 h at 5 °C/min and then heated at 2 °C/min to 1300 °C for 2 h, followed by furnace cooling to room temperature to obtain samples.
2.2. Materials Characterization
Pore morphology was observed with an optical microscope (LEXT OLS4000, Olympus, Tokyo, Japan). To analyze the internal pore structure of samples, X-ray tomography scan technique (nanoVoxel-2000, Sanying Precision Instruments Co., Ltd., Tianjin, China) was used. The samples were columns of a gauge size of φ 5 mm × 3 mm prepared by electric discharge machining. Tested conditions of the X-ray tube acceleration voltage, the tube current and the exposure time were set at 145 kV, 70 μA and 20 s, respectively. To increase the contrast between pore and matrix and avoid image artifacts caused by X-ray beam harden effect, CaF2 filter with a thickness of 1 mm was used. Samples were rotated through 360° with angular increments of 0.33°, and a projection image was taken at each position. After scanning, the compute tomography (CT, Sanying Precision Instruments Co., Ltd., Tianjin, China) datasets were used to produce a series of original reconstructed slice images by means of back projection algorithm. Then slice images were imputed into Avizo software (9.0, Thermo Fisher Scientific Inc., Waltham, MA, USA, 2017) to be reconstructed, and the total porosity and connected porosity of samples were calculated by Avizo software. The pore diameter distribution of samples was determined from original 350 2D slices images by Image-Pro-Plus6 (IPP6) software (6.0, Media Cybernetics, Inc., Rockville, MD, USA, 2015).
X-ray diffraction (XRD) for phase analysis was conducted with a Dmax-RB X-ray diffractometer (Cu Kα, λ = 0.15406 nm, Rigaku, Tokyo, Japan). The internal microstructure was examined by using a ZEISS SUPRA 55 scanning electron microscope (SEM, Zeiss, Oberkochen, Germany). Compression specimens with a gauge size of φ 3 mm × 5 mm were fabricated by electric discharge machining and the specimen surface was polished with SiC papers. Compression test was performed on an Instron machine (Instron, Boston, MA, USA) at the strain rate of 2 × 10⁻³ s−1 at room temperature. The compressive yield strength and elastic modulus were calculated from the engineering stress-strain curves.
2.3. Corrosion Testing
Corrosion resistance of Ti-10Mo alloy with different porosity was studied in phosphate-buffered saline (PBS) (HyClone, Logan, UT, USA) at (37 ± 0.5) °C using a multichannel electrochemical workstation (Versa STAT MC with VersaStudio software, 1.28, Princeton Instruments, Trenton, NJ, USA, 2012) through the potentiodynamic polarization scan technique. Chemical composition of PBS is listed as follows: NaCl 8 g/L, KCl 0.2 g/L, KH2PO4·0.2 g/L, Na2HPO4 1.15 g/L, pH = 7.2. For comparison, PM-fabricated CP-Ti with 50.5% porosity and dense Ti-10Mo alloy with 2.8% porosity were studied simultaneously. The microstructure of CP Ti with 50% porosity consists of a single α phase and is in accord with current reports [21,22,23,24] on fabricating porous and dense CP Ti by different PM technique. All samples were made to be 10 mm square with a thickness of 2 mm. A Cu-wire was welded to each sample for electrical connection. Each sample was then embedded in epoxy resin, leaving an untouched working surface of 1 cm2. Prior to each experiment, the working surface of each sample was ground with water-proof emery papers up to 2000 grit in running water. Then samples were cleaned ultrasonically with ethanol and distilled water three times for 5 min, respectively, and dried under a cold air stream finally for use.
A conventional three-electrode system was adopted, where the Ti alloy samples were a working electrode, while a saturated calomel electrode (SCE) was used as a reference electrode and a platinum foil was employed as a counter electrode. Prior to tests, the working electrode was held in solution for 120 min to enable it to approach a stable potential. The open-circuit potential (OCP) vs. time curve was recorded. Then, potentiodynamic polarization (PD) curves were measured with the scan rate of 0.5 mV/s (scan range: −0.25 V to 2.0 V vs. OCP). The corrosion parameters were worked out from potentiodynamic polarization curves, including Ecorr (corrosion potential), Icorr (corrosion current density) and βc (cathodic Tafel slope). Considering the great difference of the sample density, mass loss rate was used to evaluate their corrosion rate. The value can be calculated from the Faraday’s equation according to ASTM 102-89 as follows:
where CR is corrosion rate (g/m2·day), Icorr is the corrosion current density (μA/cm2), K is 8.954 × 10⁻³ (g cm2/μA·m2·day), EW is the equivalent weight and considered dimensionless. In order to verify the reproducibility of electrochemical results, all experiments were repeated three times. A volume of 500 mL of test solution was used in each electrochemical test.
3. Results and Discussion
3.1. Pore Characteristics
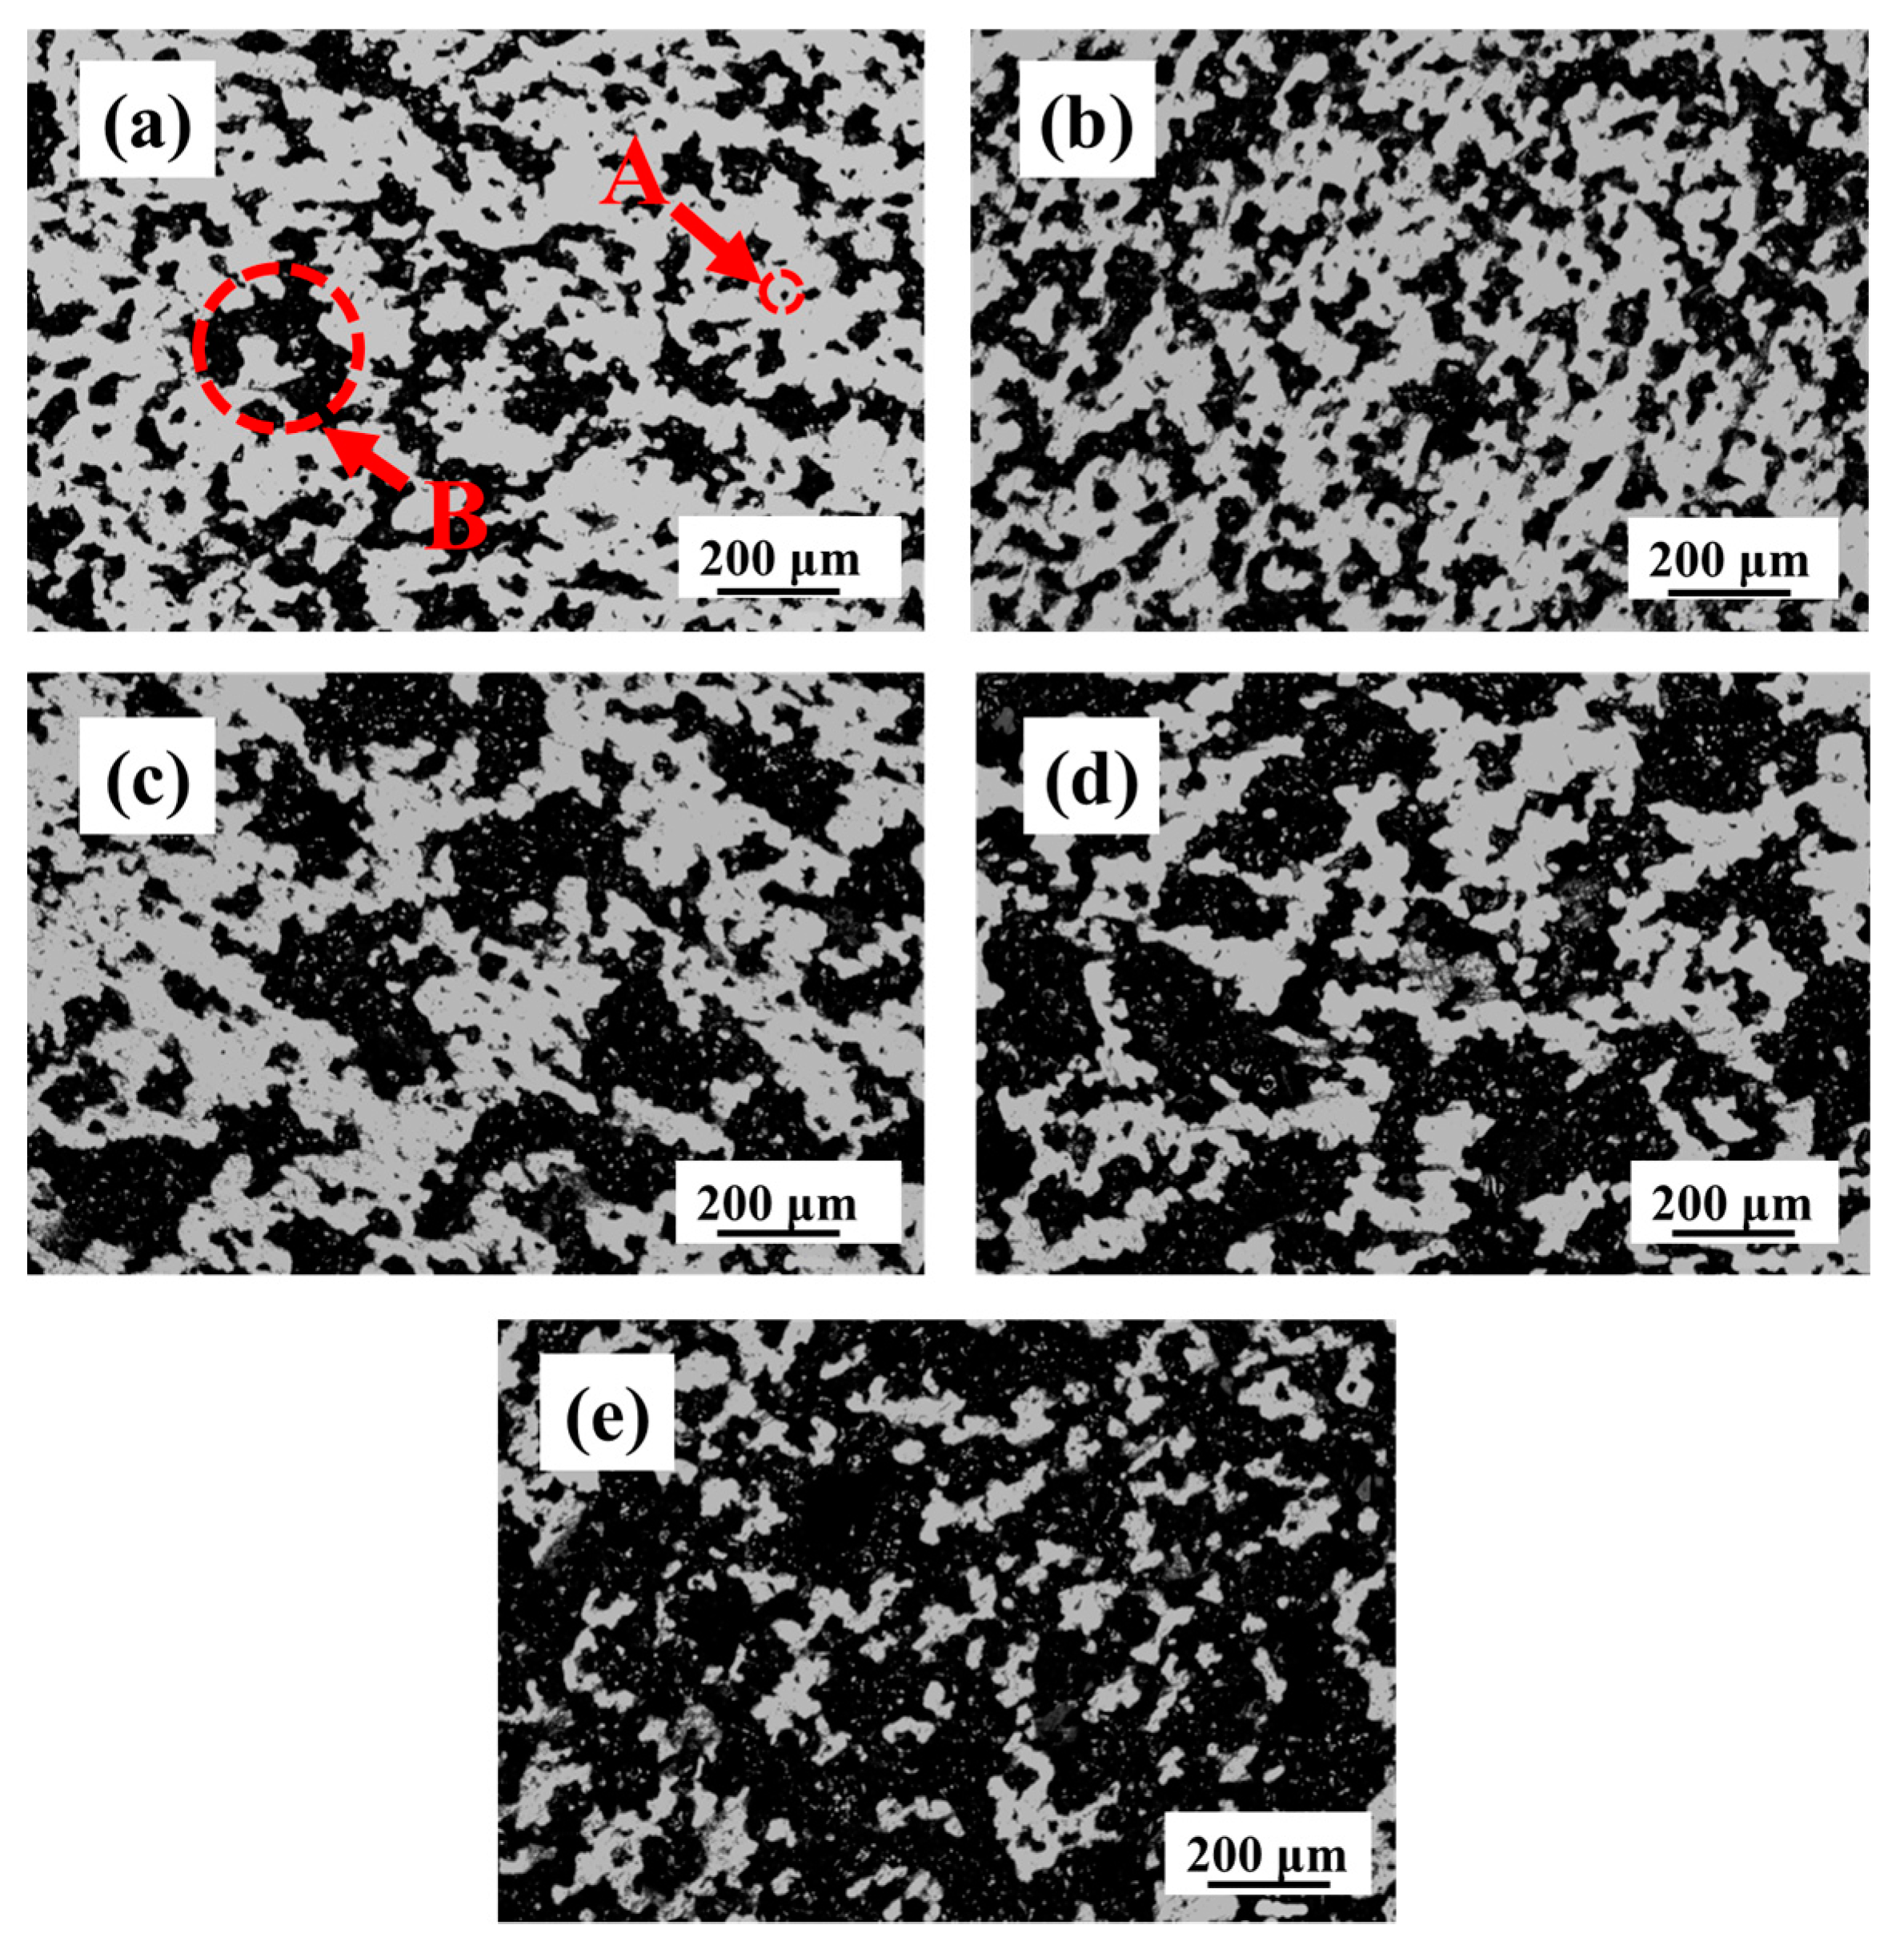
Figure 1 depicts the representative optical micrographs of each sample profile. It can be seen that with the contents of NH4HCO3 increasing, the pore size of the alloy increases gradually. Pores of sintered Ti-10Mo alloy are irregular and distributed uniformly, and mainly consist of two types of pores (as shown by arrow A and B). One (arrow A) is micro-pores with the size of several micrometers, which have presumably resulted from volume shrinkage occurring during the sintering process. Another one (arrow B) is a kind of interpenetrating macro-pores with the size range of several hundred micrometers, owing to decomposition of NH4HCO3. With the rise of space-holder content, the macro-pores increase in volume proportion while the micro-pores show small change. It is believed that the presence of micro-pores and macro-pores is beneficial to porous scaffolds to achieve osteoinduction [25].
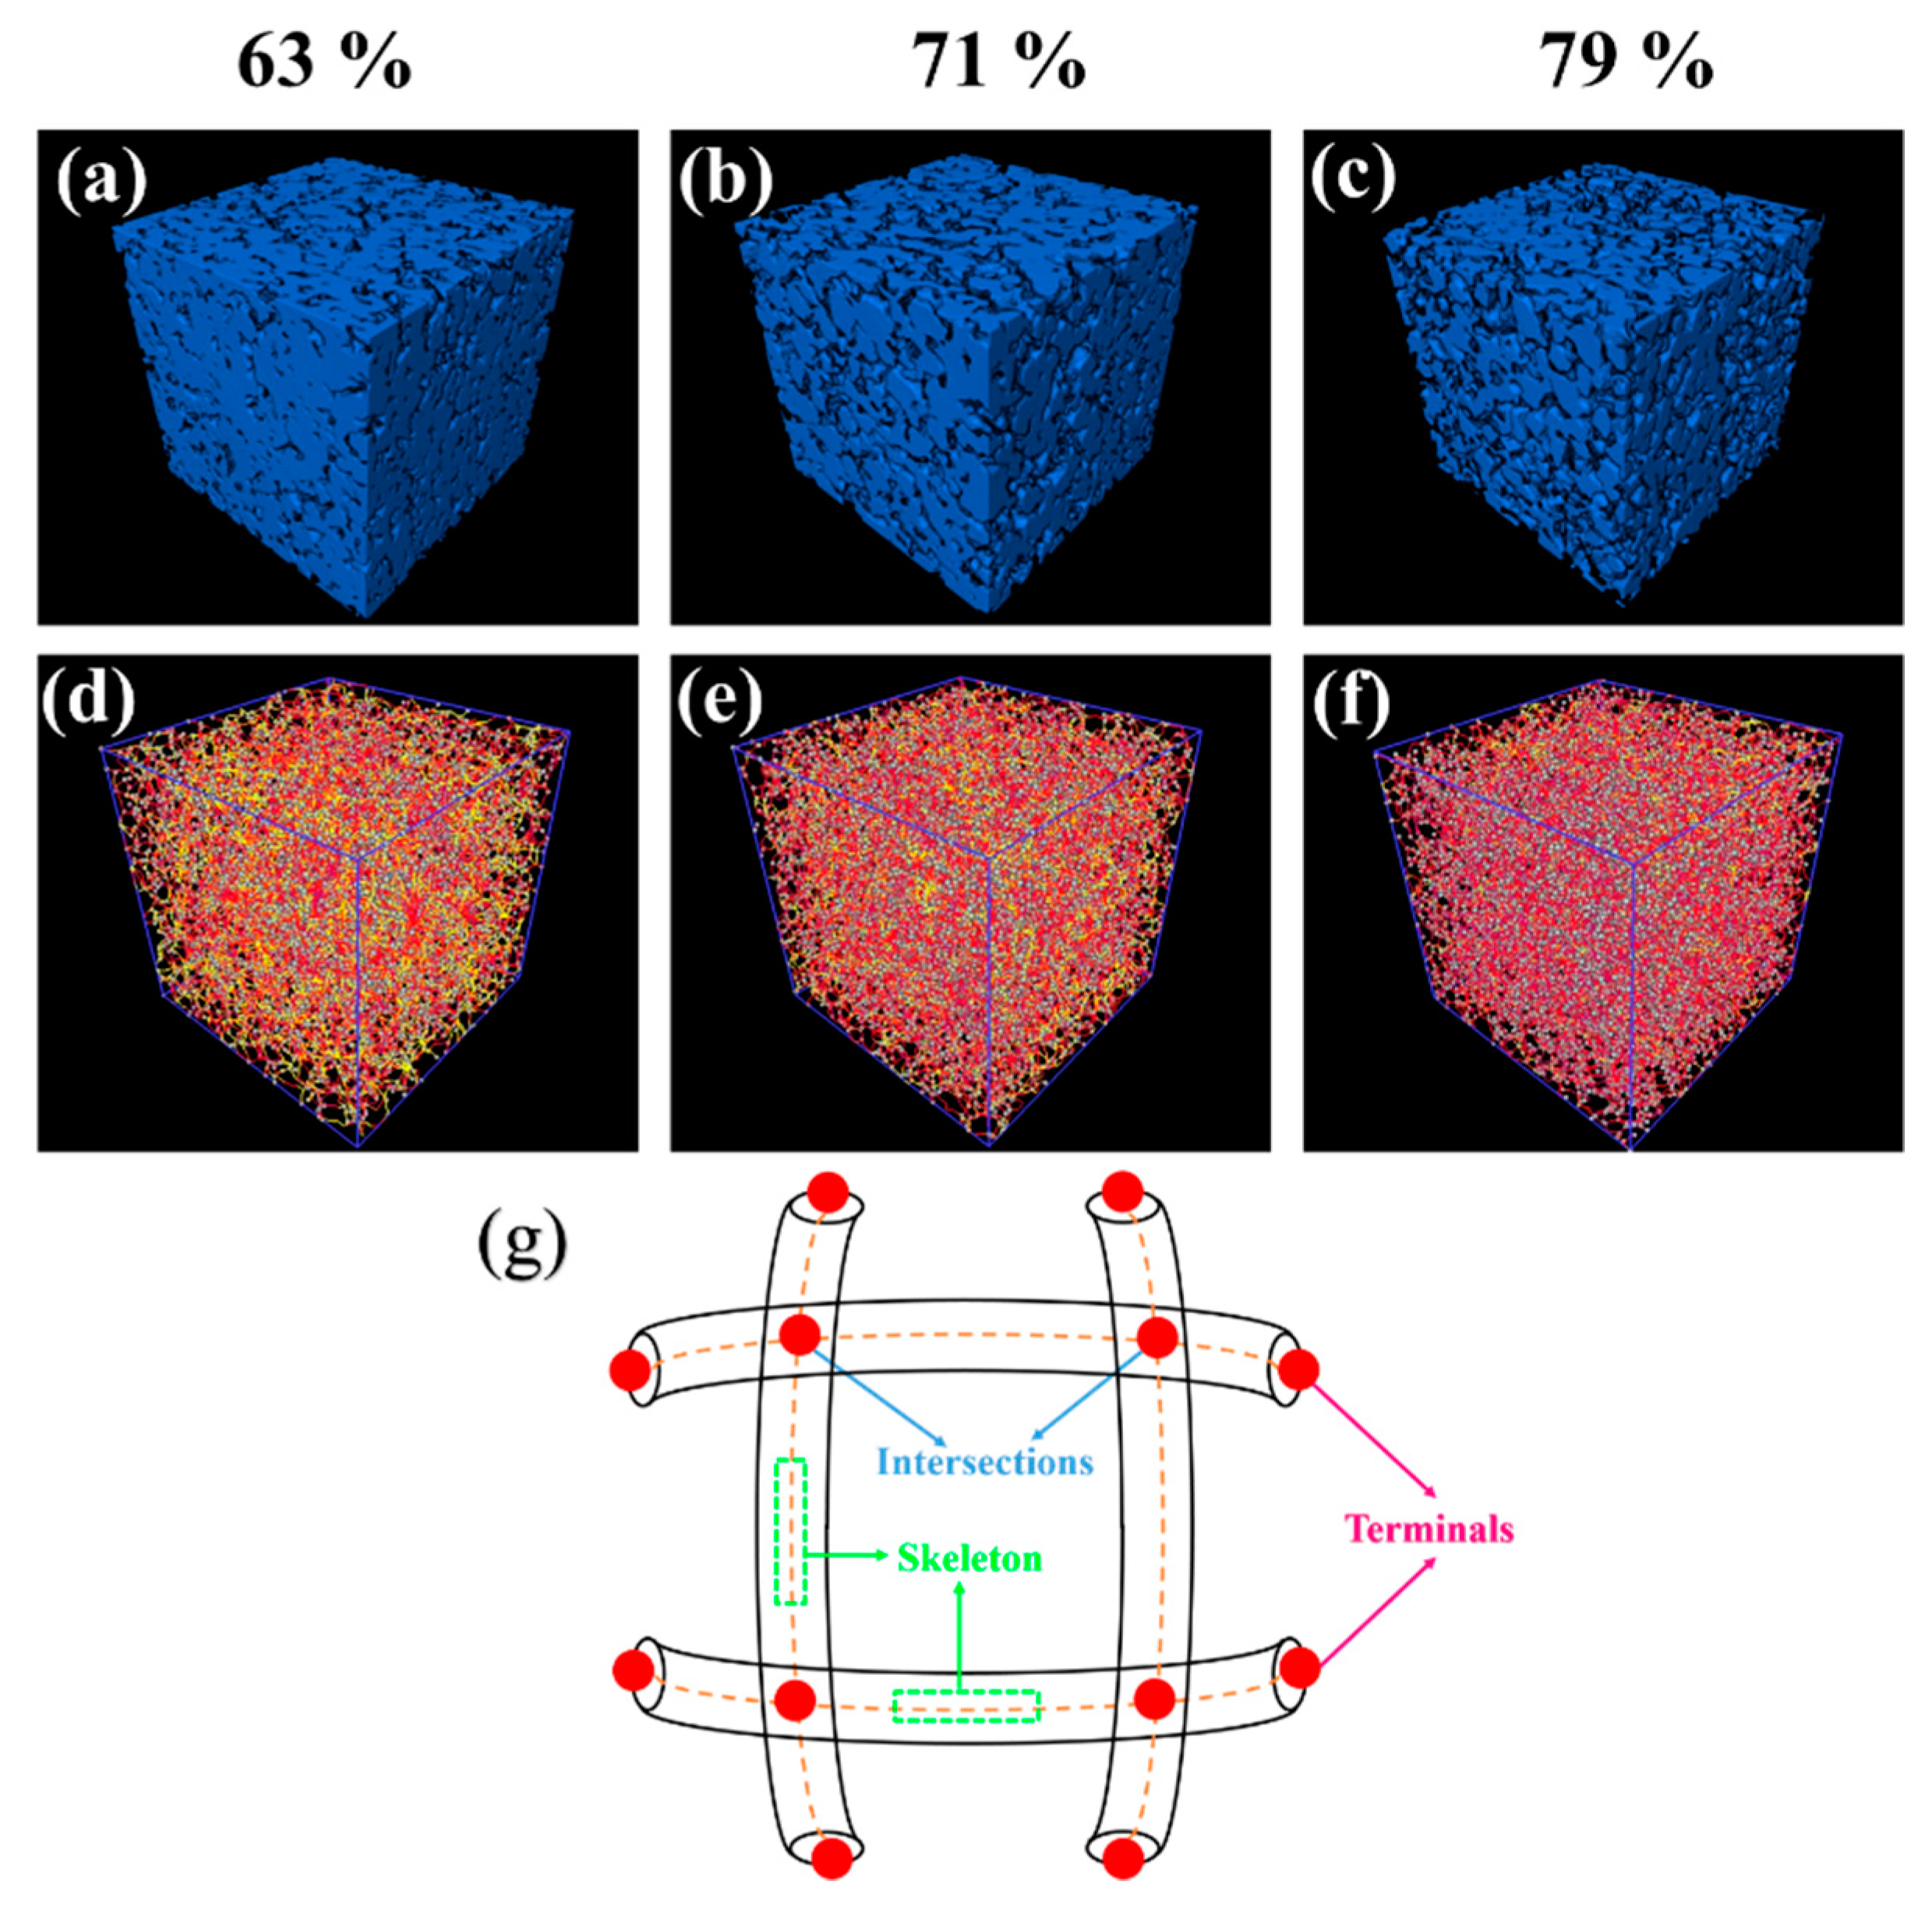
3D reconstructed images of Ti-10Mo alloy samples are shown in Figure 2. All samples show similar appearances, so here just focus on the images of adding 63%, 71% and 79% content of NH4HCO3. As shown in Figure 2a–c, all samples have a uniform distribution of pores, and with the increase of NH4HCO3 content, pore size increases significantly. Figure 2d–f shows skeletonization images of samples. Skeletonization is an important image processing method, which can illustrate the interconnected pores. In the skeletonization process, the line represents the skeleton (pore), and the ball is intersections and terminals of the lines called nodes (as Figure 2g shown). From Figure 2d–f, it is clear that lines are interacted with each other, which means pores have formed a three-dimensional connection structures. It has been demonstrated that high inter-connectivity structures can promote the growth of cells while also providing pathways for bodily fluid and nutrient transportation, which is beneficial for osseointergeation of the implant, bone regeneration and growth [26,27].
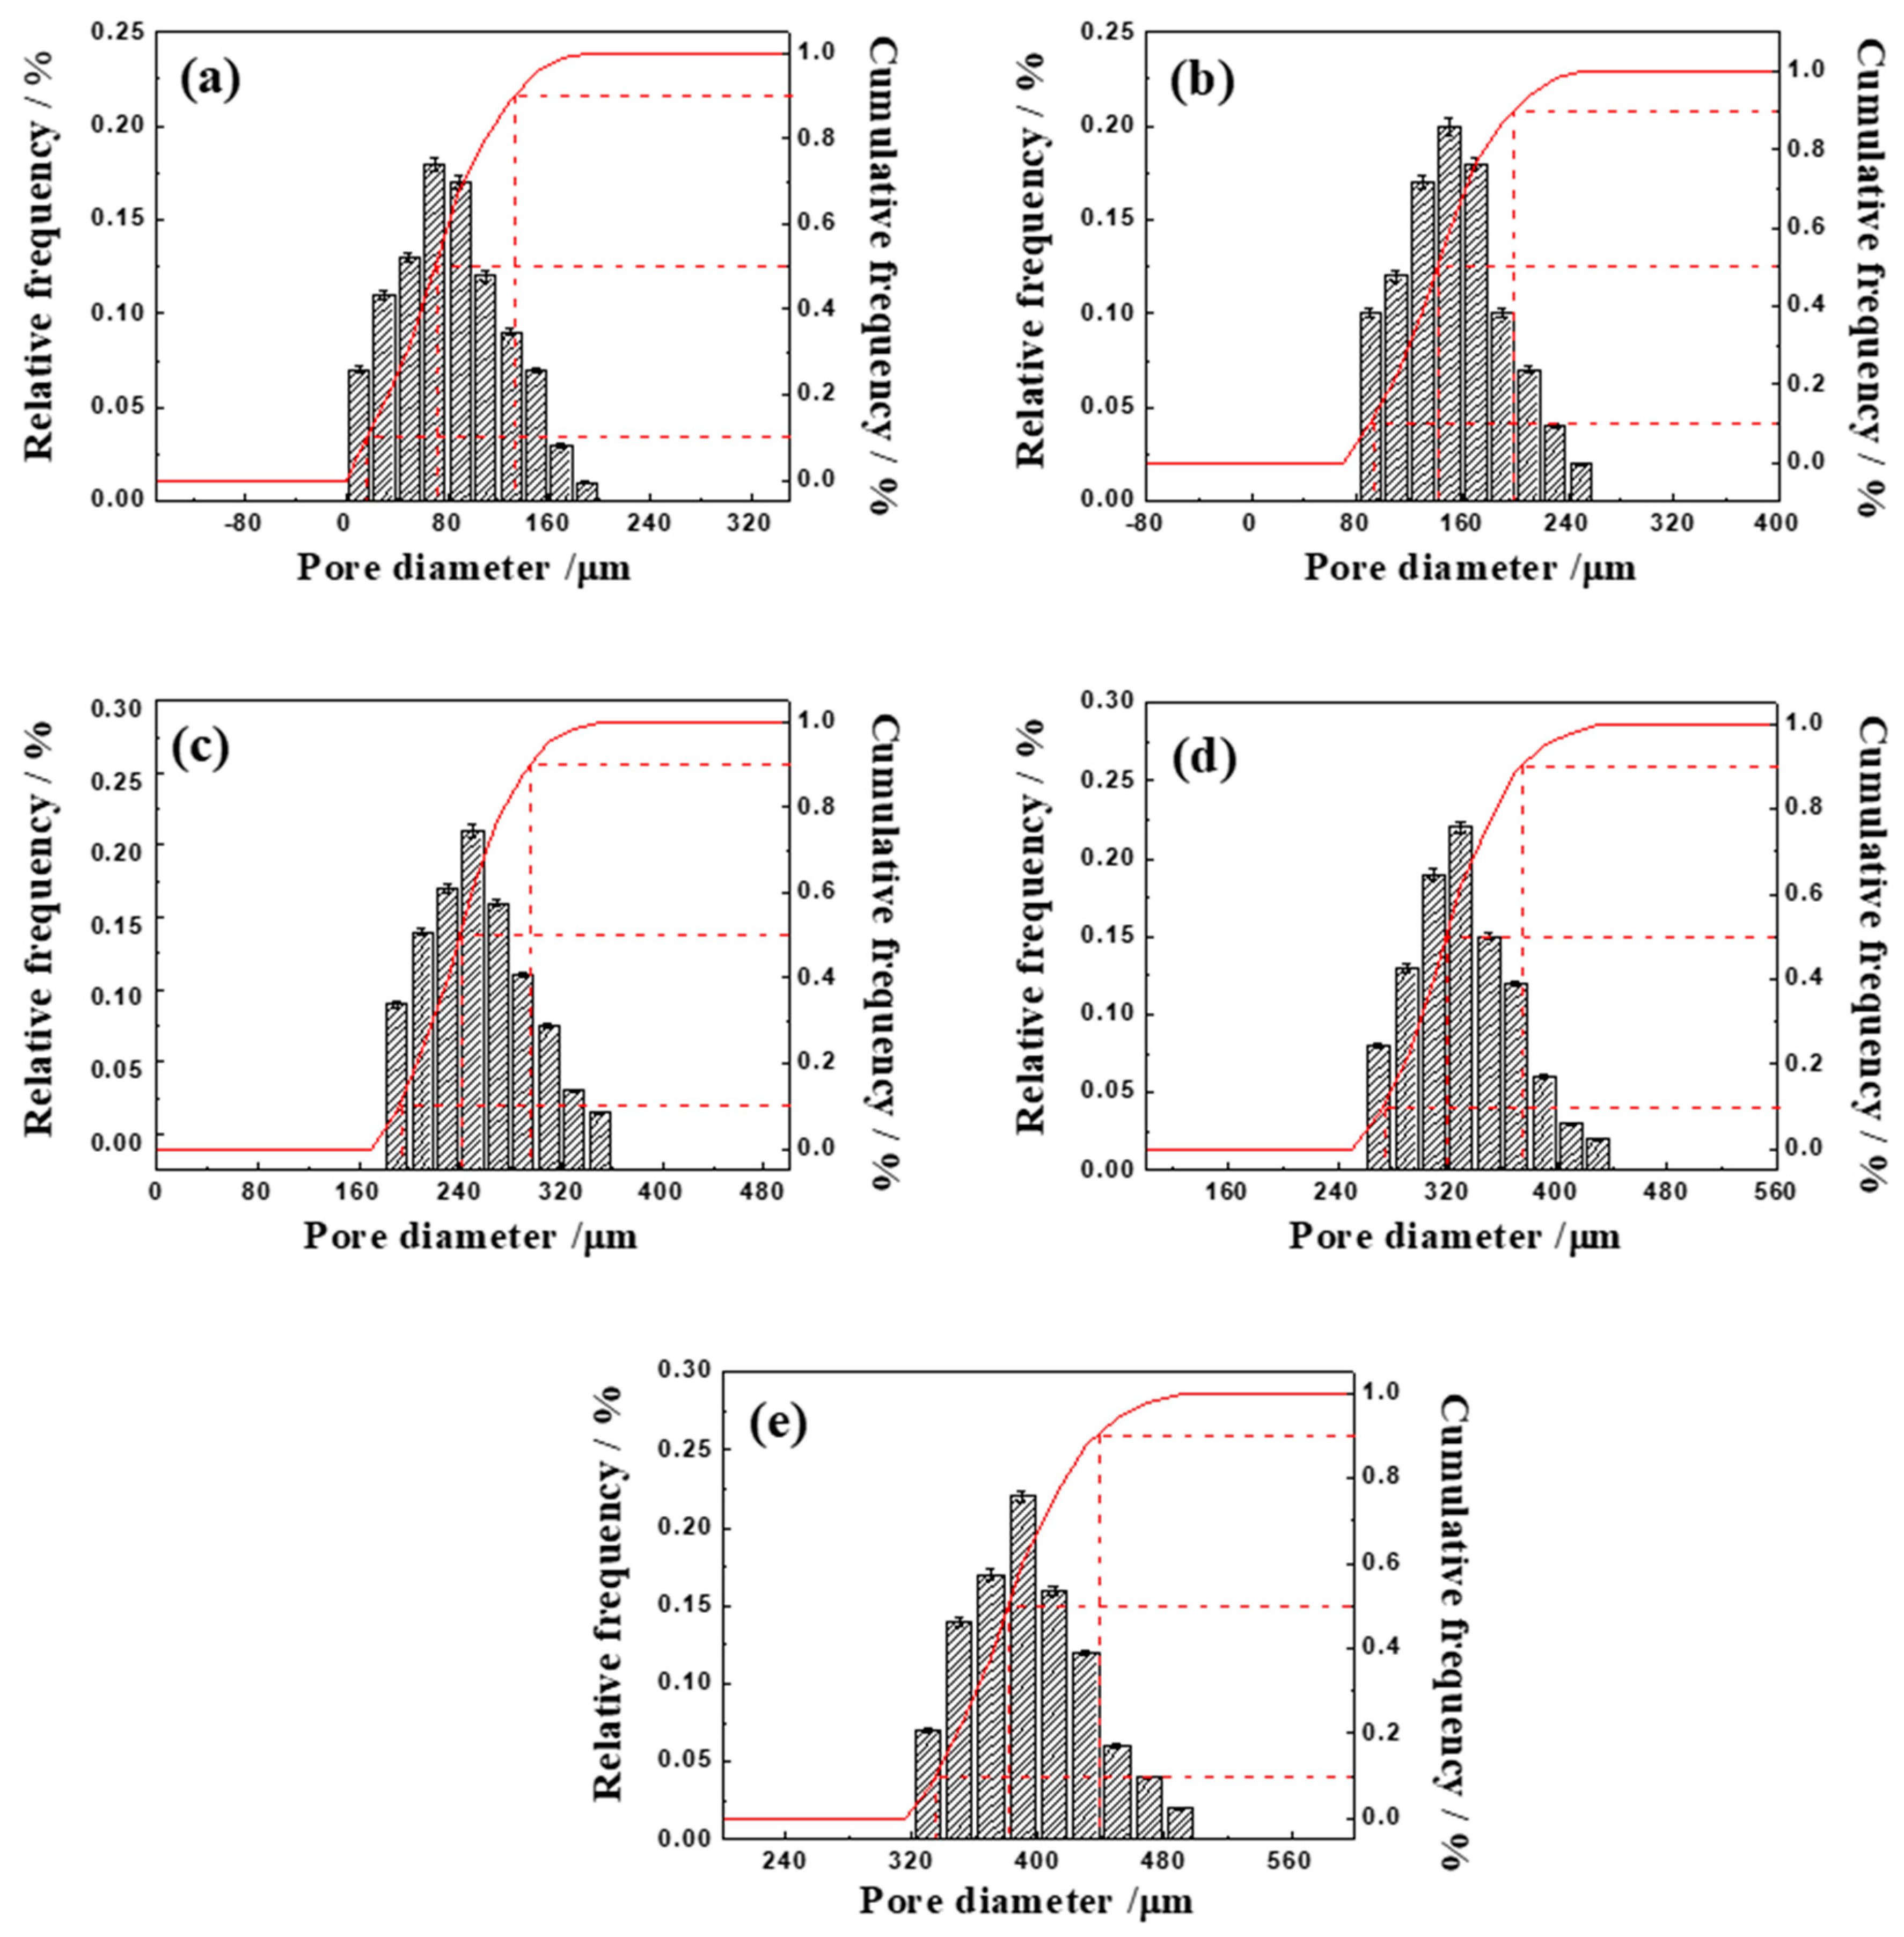
Pore size distributions were characterized quantitatively by measuring the pore sizes from the original 2D slice images, and the results are shown in Figure 3. It can be seen that the amount of space-holders has a great impact on the pore size distribution. With the increase of NH4HCO3 from 63 to 79%, pore size of Ti-10Mo alloy increases significantly and is in the range of 0–200 μm, 80–260 μm, 180–360 μm, 260–440 μm, 320–500 μm, respectively. The parameters, total porosity Pt, connected porosity Pc, and pore size d10, d50 and d90, were chosen to describe the porosity characteristics. Among them, d10, d50, d90 of alloys increases remarkably with increasing of NH4HCO3 contents. The d10, d50 and d90 represent pore diameters at cumulative pore size (by frequency) of 10%, 50% 90%, respectively, and d50 is usually used to represent the average pore size. The parameters of porous Ti-10Mo by PM with different additions of NH4HCO3 deduced from X-ray tomography scan techniques are summarized in Table 2. With increasing of NH4HCO3 from 63 to 79%, the porosity, and average pore size (d50) rise remarkably, while the pore size distribution (d10–d90) tends to be stabilized at about 100 μm. The average pore size (d50) of porous Ti-10Mo alloy can be controlled in the range of 70–380 μm.
3.2. Microstructure Observation
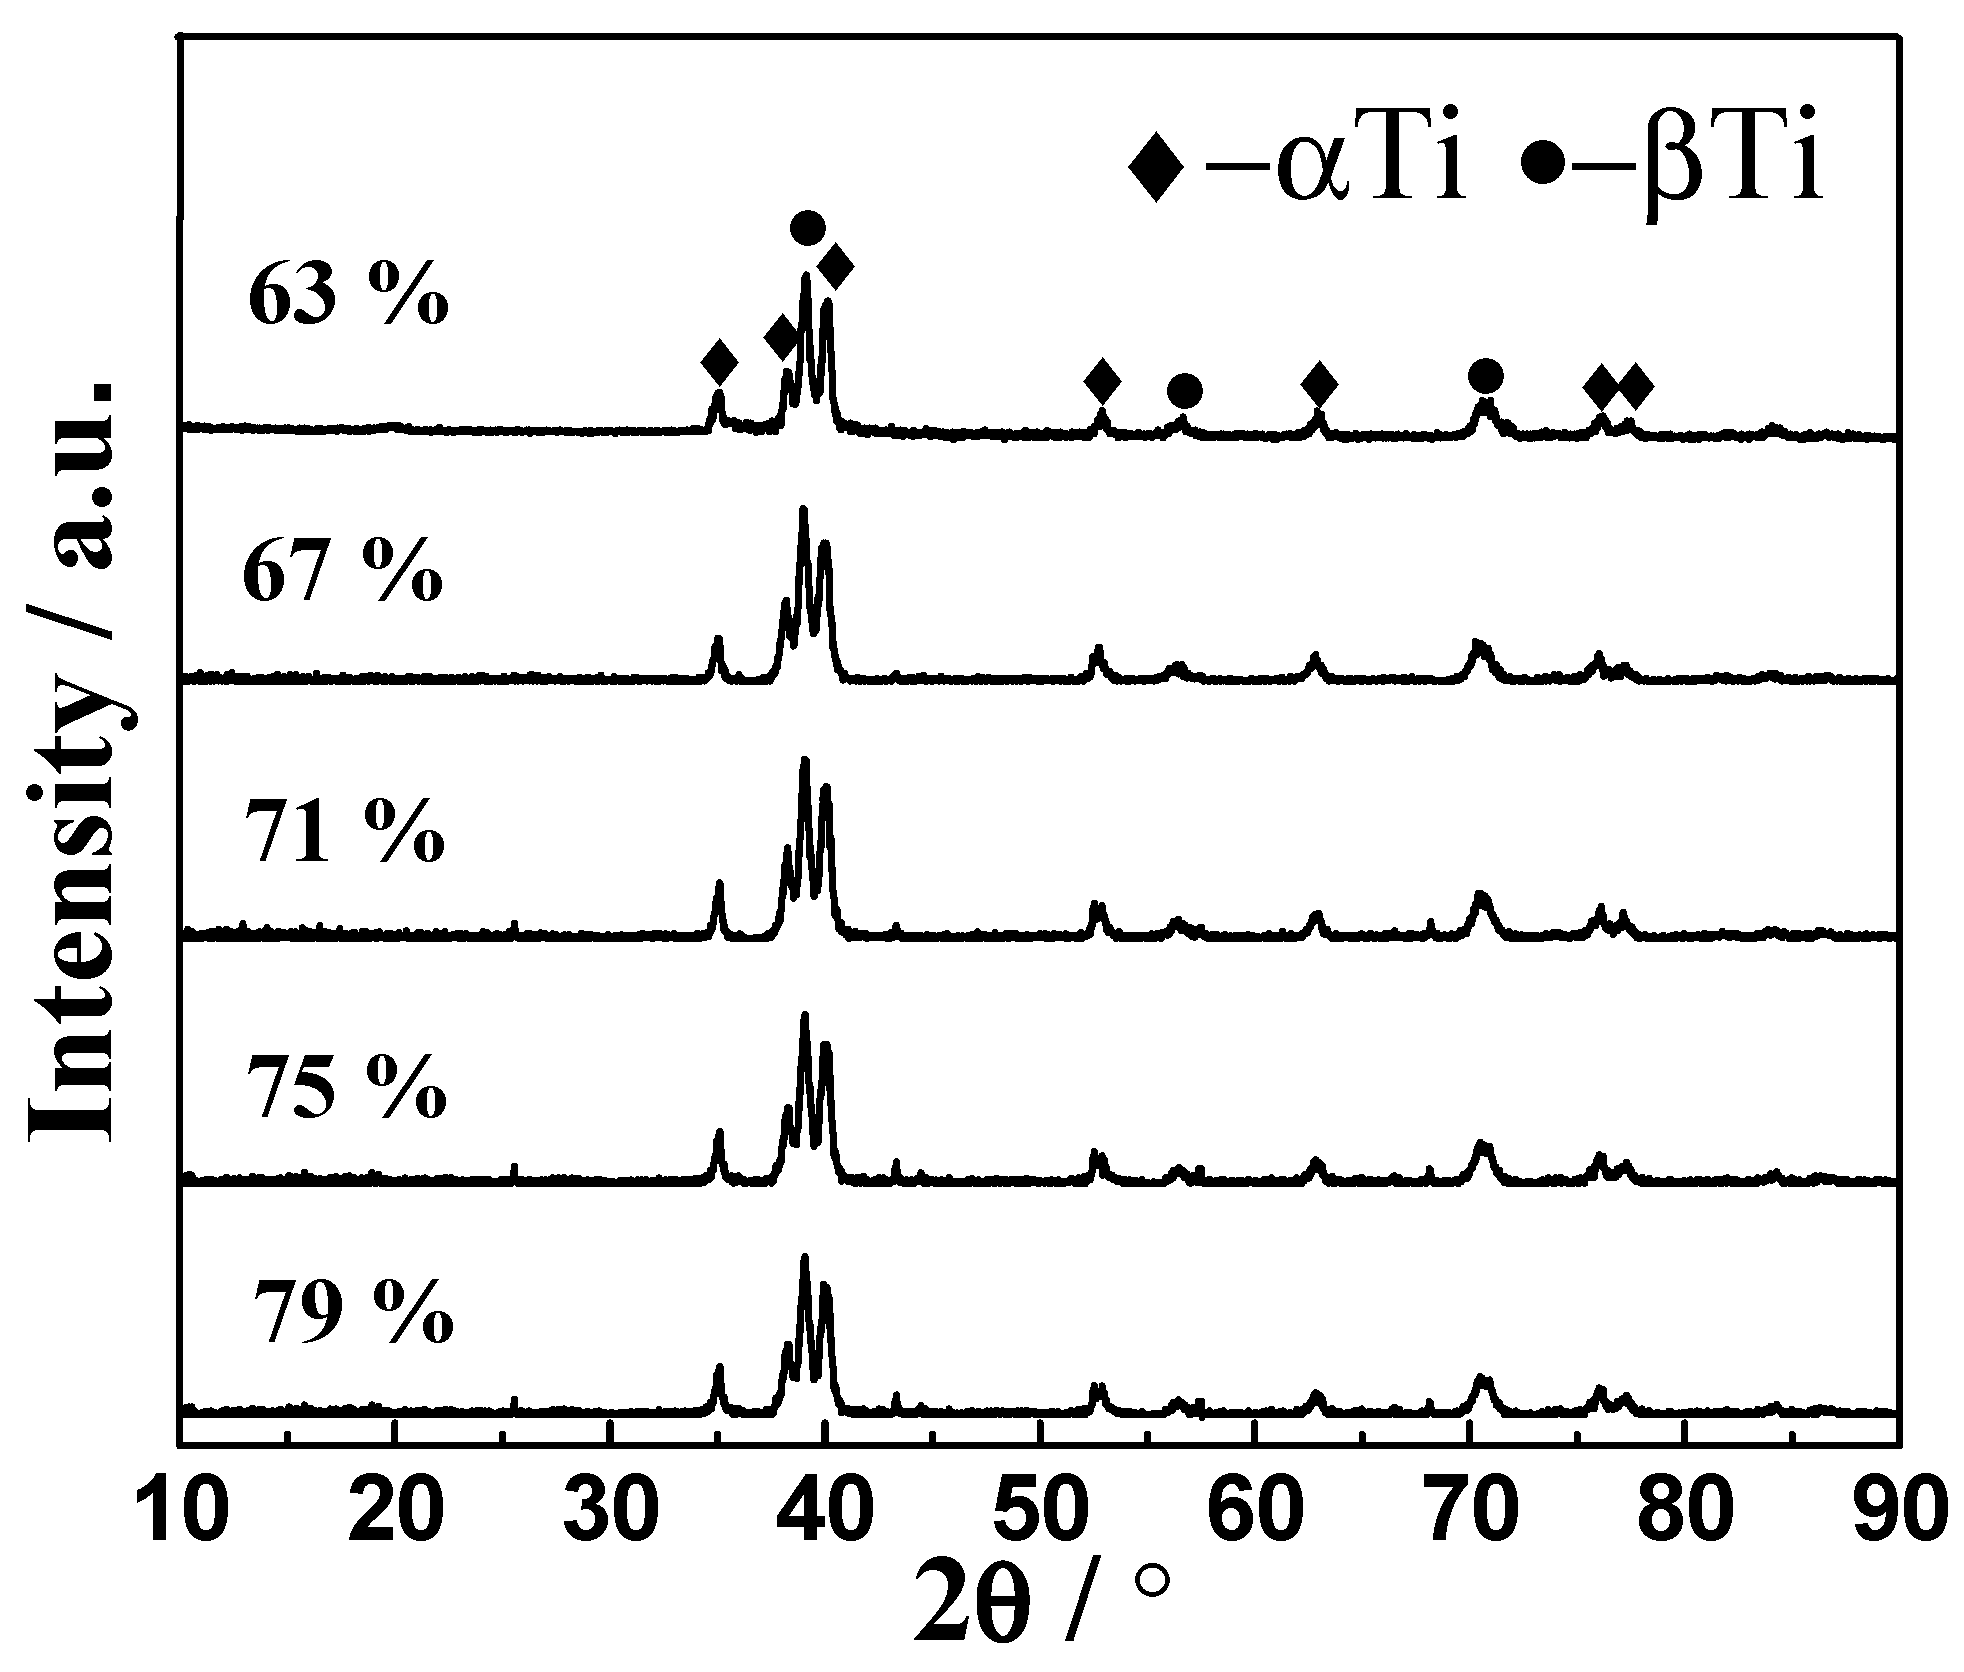
Figure 4 shows the XRD patterns of Ti-10Mo alloys with adding different contents of NH4HCO3 sintered at 1300 °C. As the figures show, there is no significant difference of XRD patterns with NH4HCO3 contents increasing. The clear diffraction peaks suggest that the alloy mainly consists of β phases with a small amount of α phase. In addition, there are no obvious diffraction peaks of elemental Mo remaining in the as-sintered Ti-10Mo alloy.
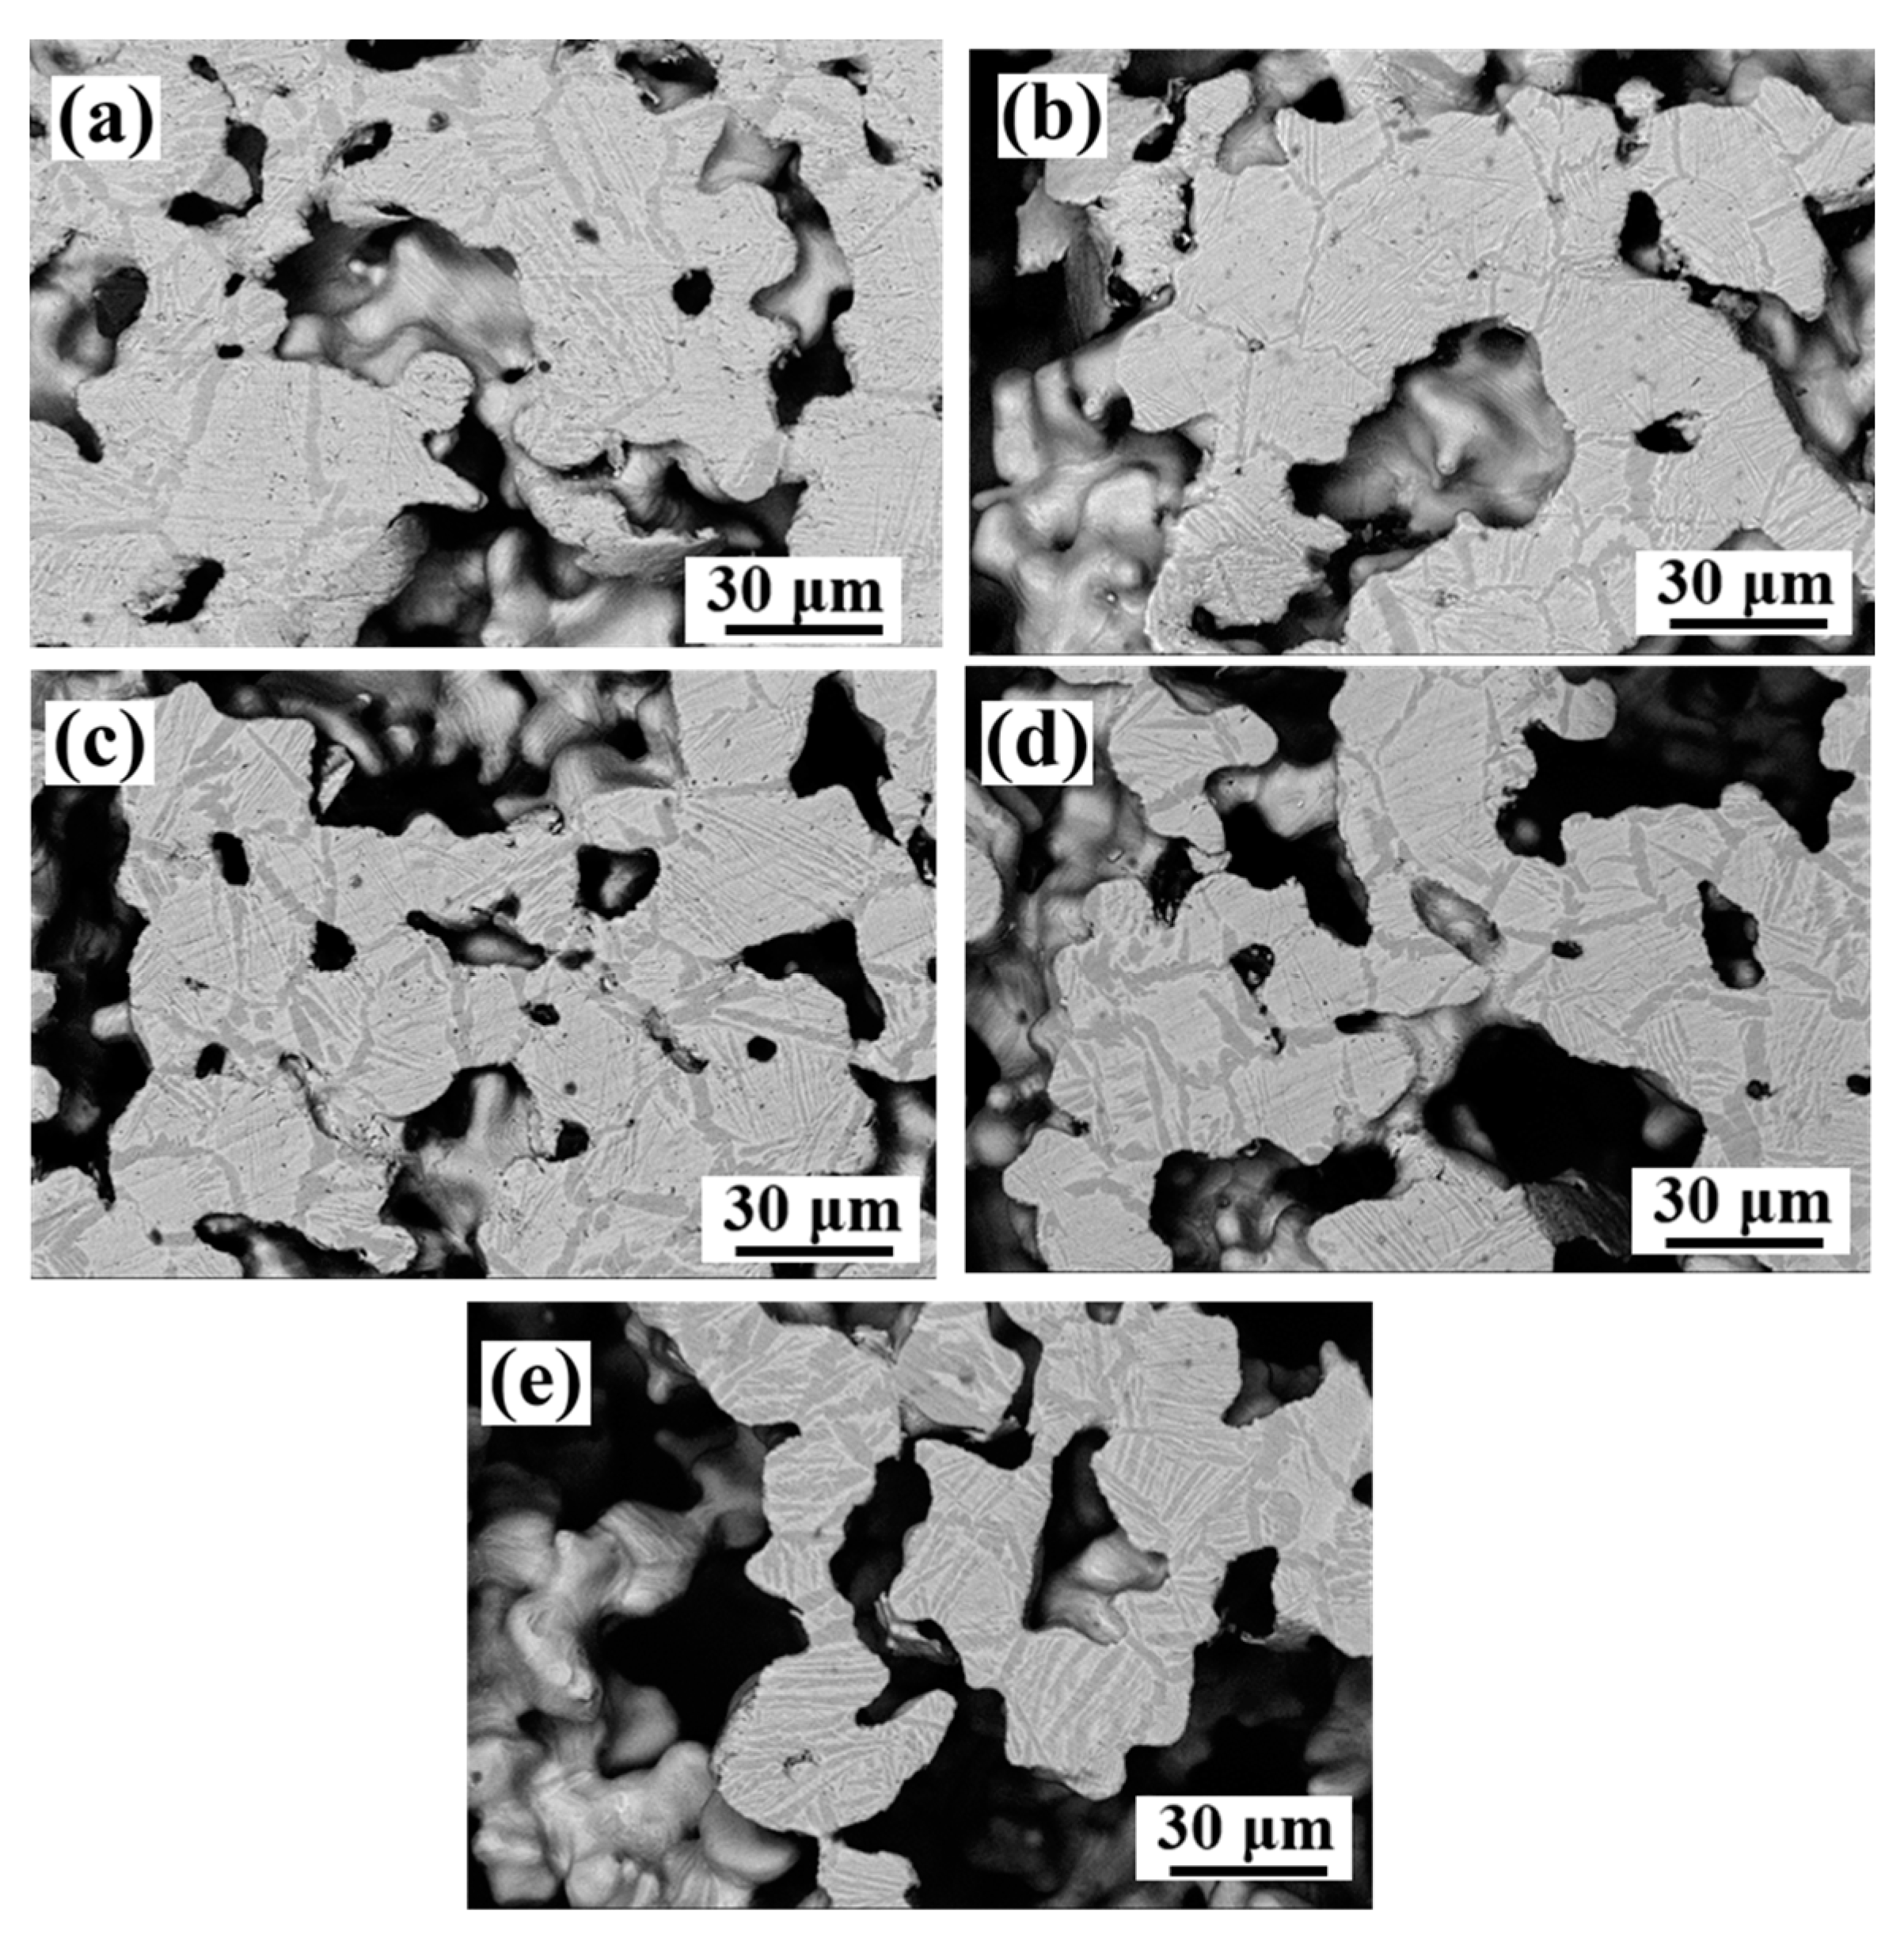
The microstructure of Ti-10Mo alloys with adding different contents of NH4HCO3 sintered at 1300 °C is displayed in Figure 5a–e. As the figures show, the Ti-10Mo alloys with different porosity show similar microstructure, which is consistent with the XRD analysis. The samples all form uniform typical Widmanstatten structure, indicating that Mo element is completely diffused into Ti matrix after sintering at 1300 °C. During the furnace cooling, the grains of β phase are subjected to the precipitation of the lamellar α phase along the grain boundary and intracrystalline, leading to the formation of Widmanstatten structure (α + β).
3.3. Mechanical Properties
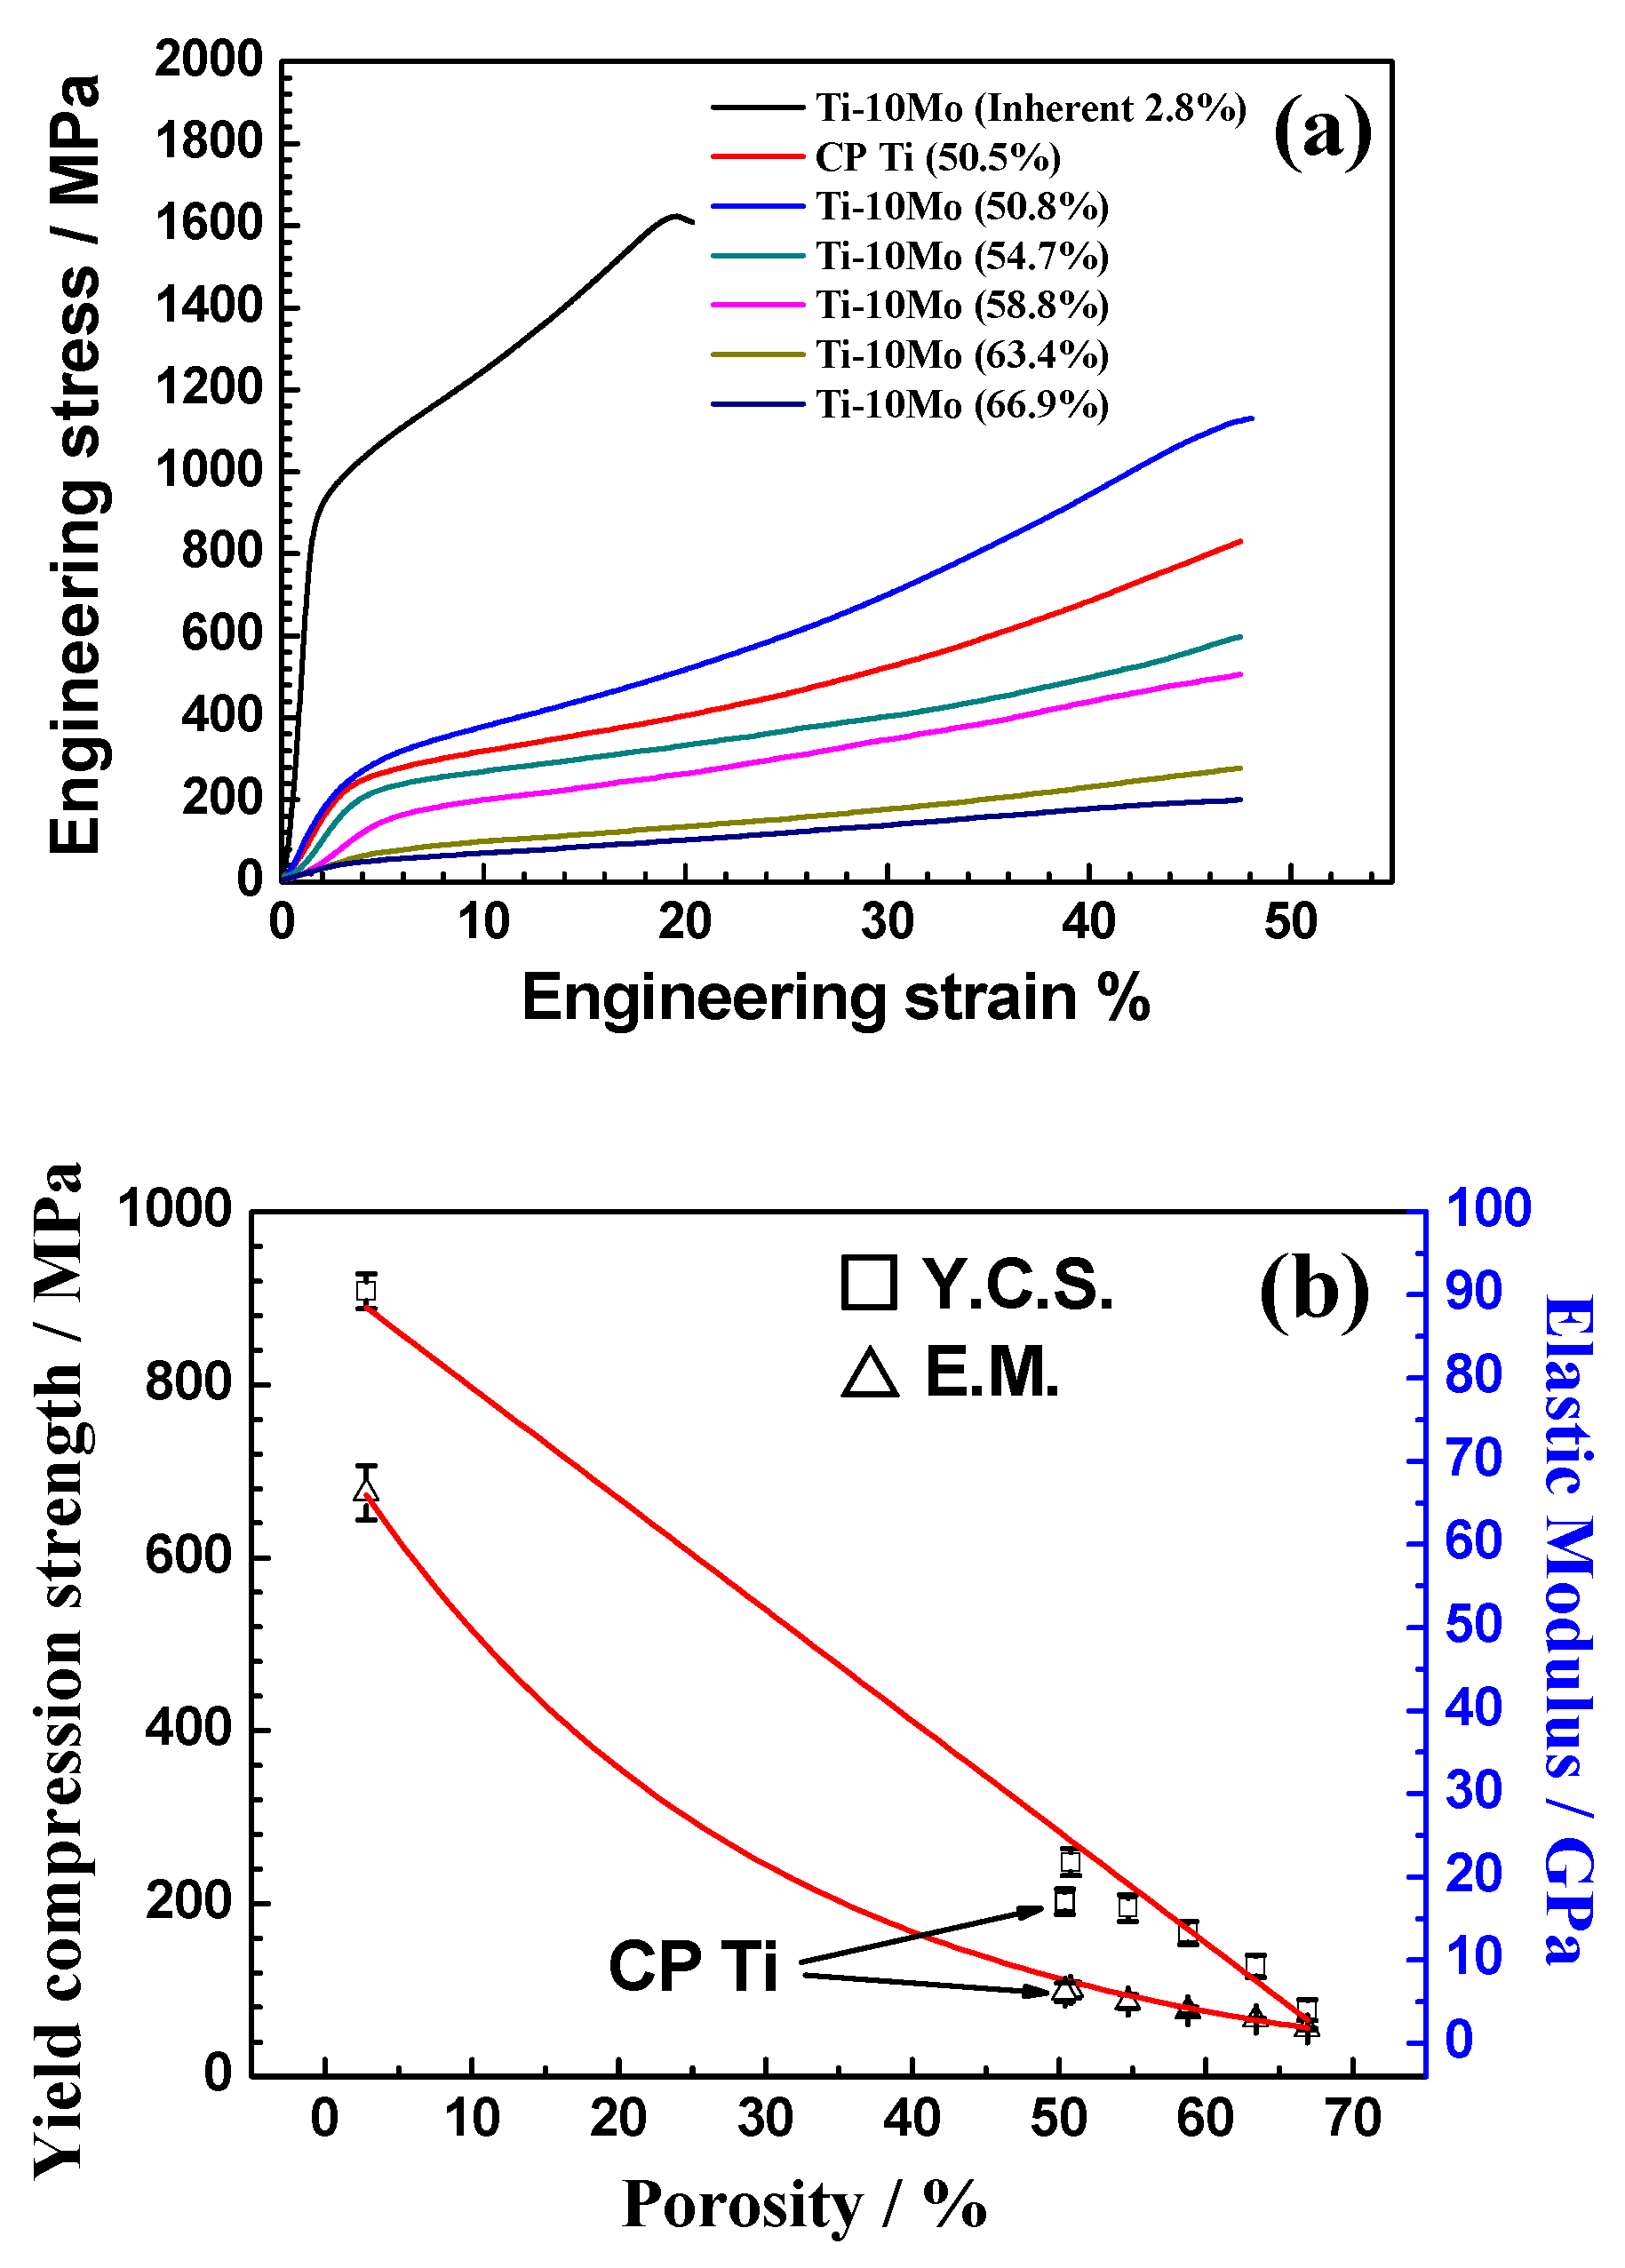
The engineering stress-strain curves and mechanical properties of sintered porous Ti-10Mo alloy are shown in Figure 6. As Figure 6a shows, the porous alloys exhibit the similar stress-strain behavior. No fracture was observed during their compression process while it occurs at the strain of 19.4% for dense Ti-10Mo alloy samples, demonstrating that the porous samples have good elastic-plastic deformation capability. As Figure 6b shows, a wide range of mechanical properties can be obtained by changing content of NH4HCO3. The elastic modulus and yield strength of the porous Ti-10Mo alloy generally decrease with porosity increasing, and they are in the range of 248.2–76.9 MPa and 6.4–1.7 GPa, respectively. Compared with CP Ti, Ti-10Mo alloy with similar porosity (about 50%) shows higher yield compression strength. The yield compressive strength basically meets the linear regression while the elastic modulus satisfies the exponential relationships with porosity. The equations are given as follows:
where E is the elastic modulus, σ is yield compressive strength, and P is porosity. Both R2 of the fittings are extremely close to 1, which suggests the linear and exponential analysis is valid.
σ = −1284.72 P + 924.78, R2 = 0.99071
E = 78.75 e (−P/0.2777) − 5.29, R2 = 0.98154
3.4. Electrochemical Behaviors
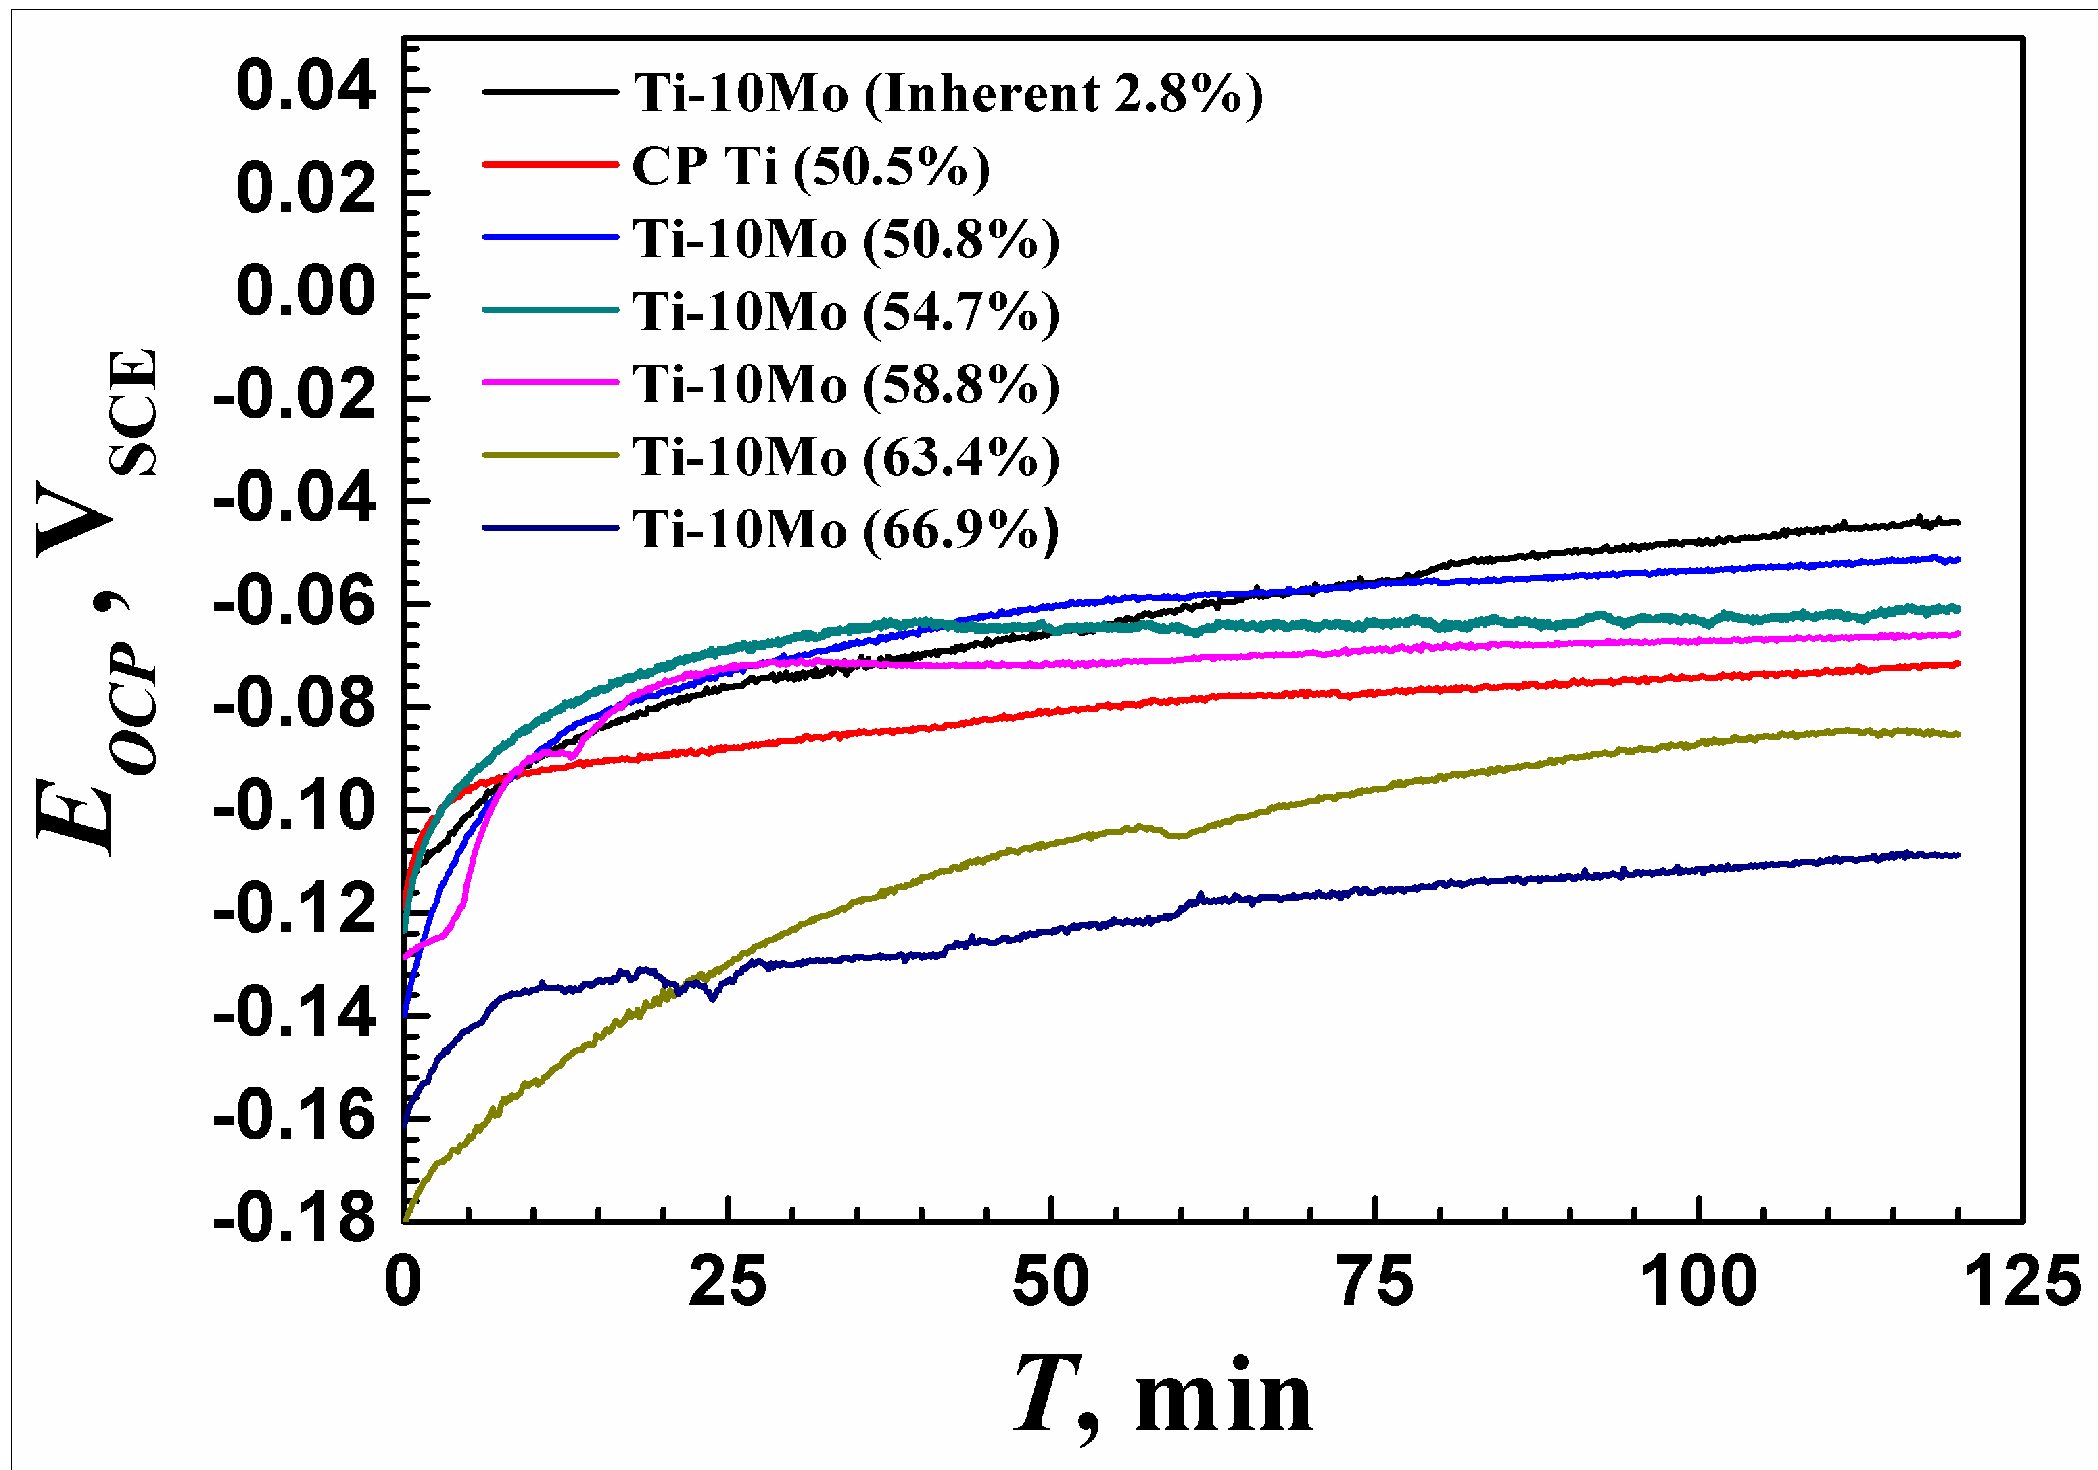
Figure 7 plots the EOCP (open-circuit potential) vs. immersion time for different Ti alloy samples in PBS at 37 ± 0.5 °C. All curves have a similar tendency in PBS solution. Following immersion of different Ti alloy samples in PBS, EOCP have an abrupt increase towards positive direction suggesting a protective oxide film begins to grow on the alloy surface [28,29]. Then, EOCP increases slowly and reaches a quasi-stationary value. With porosity increasing, the stable potential of Ti-10Mo alloy decreases gradually. It can also be noted that, compared with CP Ti, Ti-10Mo alloy with similar porosity (about 50%) shows nobler potential.
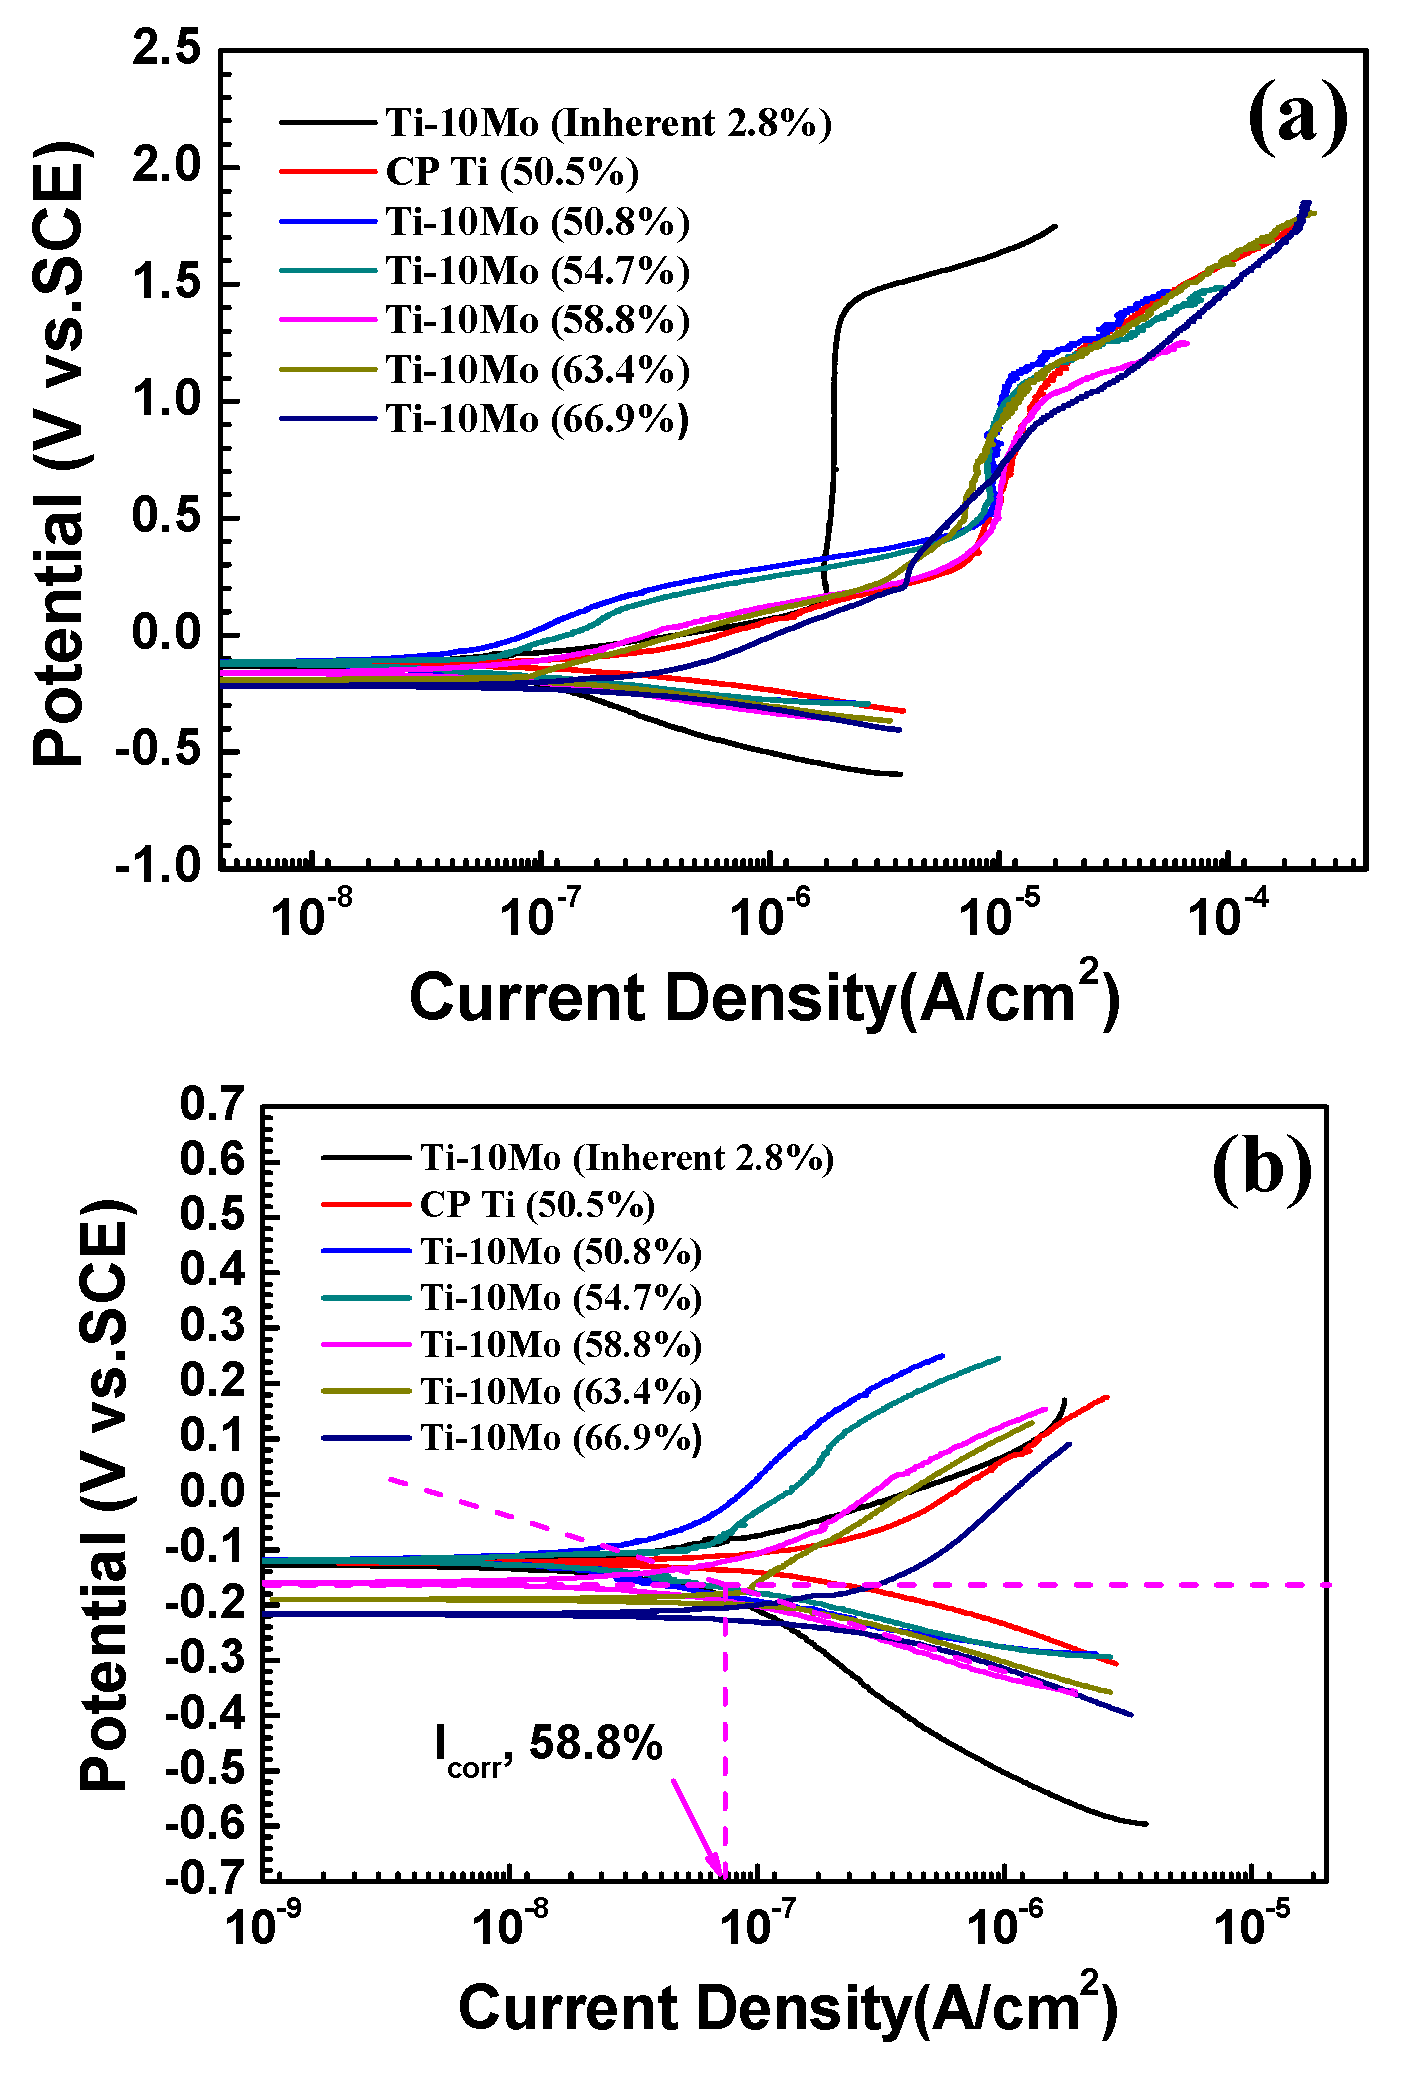
The potentiodynamic polarization curves for each alloy are shown in Figure 8. As can be seen, there is no distinct difference among the different Ti samples cathodic polarization curves, which indicates the same cathodic reaction occurred on their surface but at different rates. On the anodic branches, the curves can be divided into several potential domains. Taking the example of Ti-10Mo alloy with 50.8% porosity, the potential domain between −0.12 VSCE (corrosion potential, Ecorr) and 0.52 VSCE (passive potential, Ep) is featured by a transition stage. In this stage, the current density increases with the rise of potential. The increases in current density can be related to the replacement of the spontaneous oxide film by a less protective oxide layers, or to the oxidation of TiO or Ti2O3 to TiO4 [30]. The second domain corresponds to the passivation plateau, which ranges from 0.521 VSCE (passive potential Ep) to 1.12 VSCE (breakdown potential Eb). In this stage, the Ti-10Mo alloy enters the stable passivation region without exhibiting any active-passive transition, and the current density remains essentially unchanged. Above the breakdown potential (Eb), due to higher overpotential the oxide films began to break down. As for other Ti based alloy samples, no significant difference is observed in their anodic polarization behavior, although corrosion potential and breakdown potential vary.
To further visualize the corrosion properties of different Ti alloy samples, the corrosion parameters, including Ecorr (corrosion potential), Icorr (corrosion current density), and βc (cathodic Tafel slope), are obtained using standard techniques from the potentiodynamic polarization plots and listed in Table 3. The anodic and cathodic polarisation curves represent passivation of the samples and oxygen absorption, respectively. The existence of a dissolution reaction in conjunction with the onset of passivation reaction does not result in a well-defined experimental anodic Tafel region in the anodic polarisation curves of the Ti samples [31]. So the corrosion current density (Icorr) is determined by Tafel extrapolation of the cathodic polarisation curve, as shown in Figure 8b.
As shown in Table 3, the corrosion potential of Ti-10Mo alloy samples decreases gradually with the porosity increasing from 50 to 67%, while their corrosion current density increases. These indicate the increase of electrochemical activity with the porosity increasing. In comparison with CP Ti with 50.5% porosity Ti-10Mo alloy with similar porosity has lower Icorr and higher Ecorr, which means that porous Ti-10Mo alloy possesses higher corrosion resistance in PBS.
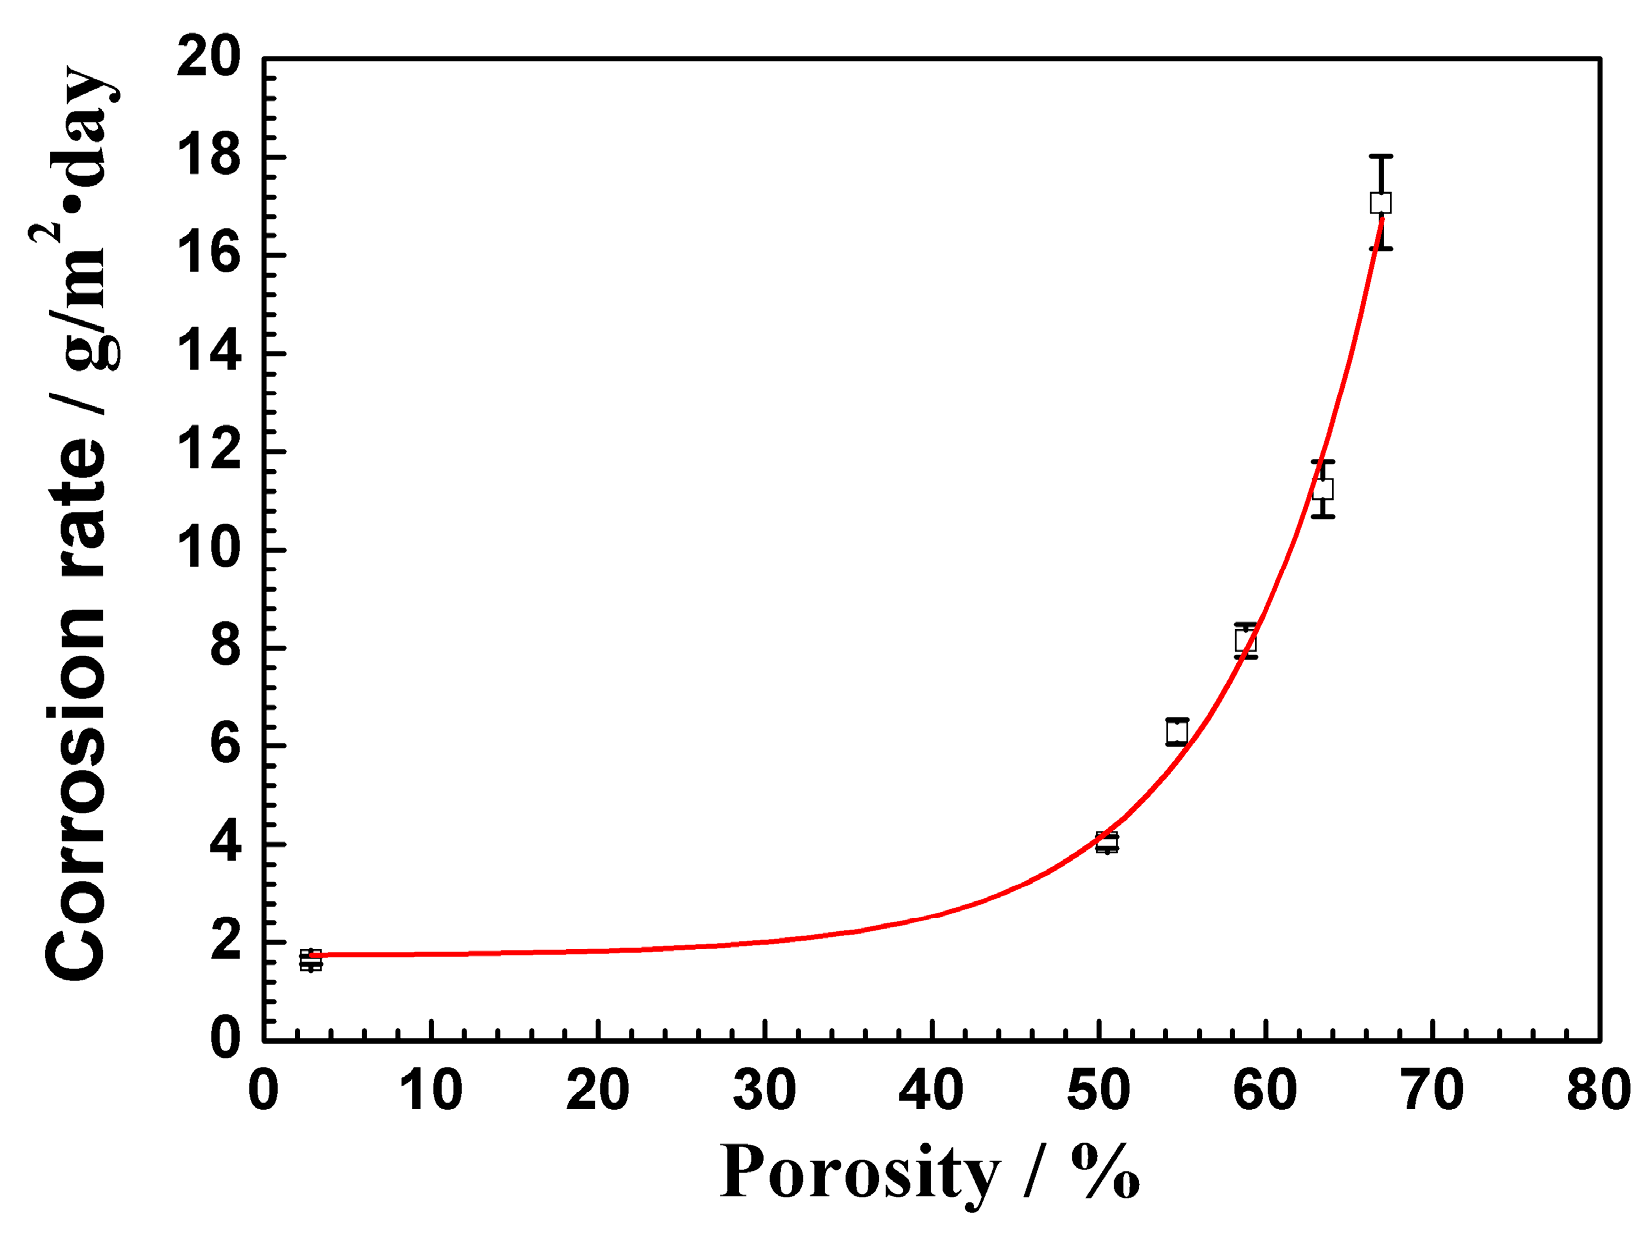
The corrosion rate calculated by Equation (1) is used to assess the corrosion rate of test samples. The results are shown in Figure 9. The dense Ti-10Mo apparently shows the lowest corrosion rate, which is consistent with the results of corrosion potential and corrosion current density. With the porosity increasing, the corrosion rate increases gradually. Corrosion rate is found to accord with the exponential formula. The equation is given as follows:
where CR is corrosion rate, and P is porosity. R2 of the fitting is close to 1, which indicates a good quality of the fitting in this experiment.
CR = 0.01063e(P/0.09227) + 1.719211, R2 = 0.98788
3.5. Relationship among Porosity, Mechanical Properties and Corrosion Resistance
The porosity characteristic, mechanical properties and corrosion rate of porous Ti-10Mo by PM are summarized and compared with dense Ti-10Mo and porous CP Ti, as shown in Table 4. The porous structure can be controlled in average pore size range of 70–380 µm and porosity of 50–67% with high inter-connectivity, and that is believed to satisfy the demand of implantation. According to the previous report, connected pores with a pore size range of 100–500 μm and an open porosity range of 20–50 vol. % are beneficial for the ingrowths of the new-bone tissues and the transport of the bodilyfluids [32].
Porosity has a significant impact on the mechanical and corrosion properties of metal materials [33]. By adjusting the porosity, a wide range of mechanical properties of Ti-10Mo alloys can be achieved, and the yield strength and elastic modulus can be controlled in the range of 248.2–76.9 MPa and 6.4–1.7 GPa, respectively. In comparison to CP Ti with similar porosity, yield strength of porous Ti-10Mo alloys are much higher while the elastic modulus is very close. It has been accepted that the mechanical properties of implant materials need to match those of the living bone tissue at the site of implantation in order to reduce the ‘stress shielding’ effects [34]. Ti-10Mo alloys obtained show mechanical properties close to human bone (compressive strength 114–195 MPa and elastic modulus of 0.01–28.8 GPa [34]), suggesting their good mechanical compatibility. However, the rise of porosity inevitably deteriorates the corrosion resistance, and accordingly the corrosion rate of the porous Ti-10Mo alloy increases exponentially. Taking the example of Ti-10Mo alloy with 63.4% porosity, the corrosion rate of samples is about seven times higher than that of dense Ti-10Mo alloy, nevertheless, that is fairly close to that of CP Ti with much lower porosity of 50.5%, indicating a higher corrosion resistance than CP Ti. These properties together with its low-cost manufacturability make Ti-10Mo an attractive new orthopedic implant alloy. In addition, the study also aims to form an association among porosity characteristics, mechanical properties, and corrosion resistance of Ti-10Mo alloys by PM, which can be used as a design reference for material selection for orthopedic applications.
4. Conclusions
- (1)
- Porous Ti-10Mo alloys can be fabricated by PM of adding NH4HCO3 with low-cost non-spherical elemental powders. With different contents added, the porosity can be controlled in the range of 50–67% with the average pores size of 70–381 μm.
- (2)
- The PM-fabricated porous Ti-10Mo alloy is characterized by typical Widmanstaten structure. With porosity increasing, their elastic modulus decreases exponentially in the range of 6.4–1.7 GPa, while yield compression strength decreases linearly in 248.2–76.9 MPa, respectively.
- (3)
- With rising of porosity, the corrosion potential of porous Ti-10Mo alloy in PBS shift to negative direction, while corrosion current density increases significantly. The corrosion rate of the Ti-10Mo increases exponentially with porosity increasing, and is much lower than that of CP Ti with similar porosity.
- (4)
- The association among porosity characteristics, mechanical properties, and corrosion resistance of Ti-10Mo by PM is formed, which can be used as a design reference for material selection for orthopedic applications.
Acknowledgments
This research work is supported by Beijing Natural Science Foundation (2163053).
Author Contributions
Wei Xu and Xin Lu conceived and designed the experiments; Wei Xu and Shidi Yang performed the experiments; Wei Xu analyzed the data and wrote the paper; Bing Zhang, Chengcheng Liu, Shaomin Lv, and Xuanhui Qu revised the manuscript; All authors discussed and approved the final manuscript.
Conflicts of Interest
The authors declare no conflict of interest.
References
- Zhao, X.; Niinomi, M.; Nakai, M. Beta type Ti-Mo alloys with changeable Young’s modulus for spinal fixation applications. Acta Biomater. 2012, 8, 1990–1997. [Google Scholar] [CrossRef] [PubMed]
- Wang, X.J.; Xu, S.Q.; Zhou, S.W.; Xu, W.; Leary, M.; Choong, P.; Qian, M.; Brandt, M.; Xie, Y.M. Topological design and additive manufacturing of porous metals for bone scaffolds and orthopaedic implants: A review. Biomaterials 2016, 83, 127–141. [Google Scholar] [CrossRef] [PubMed]
- Ho, W.F.; Ju, C.P.; Lin, J.C. Structure and properties of cast binary Ti-Mo alloys. Biomaterials 1999, 20, 2115–2122. [Google Scholar] [CrossRef]
- Gonzalez, J.E.; Mirza-Rosca, J.C. Study of the corrosion behavior of titanium and some of its alloys for biomedical and dental implant applications. J. Electroanal. Chem. 1999, 471, 109–115. [Google Scholar] [CrossRef]
- Kumar, S.; Narayanan, T.S. Corrosion behaviour of Ti-15Mo alloy for dental implant applications. J. Dent. 2008, 36, 500–507. [Google Scholar] [CrossRef] [PubMed]
- Oliveira, N.T.; Guastaldi, A.C. Electrochemical stability and corrosion resistance of Ti-Mo alloys for biomedical applications. Acta Biomater. 2009, 5, 399–405. [Google Scholar] [CrossRef] [PubMed]
- Jablokov, V.R.; Nutt, M.J.; Richelsoph, M.E.; Freese, H.L. The application of Ti-15Mo beta titanium alloy in high strength structural orthopaedic applications. J. ASTM Int. 2005, 2, 1–8. [Google Scholar] [CrossRef]
- Li, Y.; Wong, C.; Xiong, J.; Hodgson, P.; Wen, C. Cytotoxicity of titanium and titanium alloying elements. J. Dent. Res. 2010, 89, 493–497. [Google Scholar] [CrossRef] [PubMed]
- Niinomi, M.; Akahori, T.; Yamaguchi, T.; Kasuga, T.; Fukui, H.; Suzuki, A. Aging characteristics and mechanical property of Ti-29Nb-13Ta-4.6Zr coated with calcium phosphate invert glass-ceramic for biomedical application. J. Jpn. Inst. Met. 2003, 67, 604–613. [Google Scholar] [CrossRef]
- Cremasco, A.; Messias, A.D.; Esposito, A.R.; Rezende Duek, E.A.; Caram, R. Effects of alloying elements on the cytotoxic response of titanium alloys. Mater. Sci. Eng. C 2011, 31, 833–839. [Google Scholar] [CrossRef]
- Lee, E.B.; Han, M.K.; Kim, B.J.; Song, H.J.; Park, Y.J. Effect of molybdenum on the microstructure, mechanical properties and corrosion behavior of Ti alloys. Int. J. Mater. Res. 2014, 105, 847–853. [Google Scholar] [CrossRef]
- Yan, M.; Qian, M.; Kong, C.; Dargusch, M. Impacts of trace carbon on the microstructure of as-sintered biomedical Ti-15Mo alloy and reassessment of the maximum carbon limit. Acta Biomater. 2014, 10, 1014–1023. [Google Scholar] [CrossRef] [PubMed]
- Van den Dolder, J.; Farber, E.; Spauwen, P.H.M.; Jansen, J.A. Bone tissue reconstruction using titanium fiber mesh combined with rat bone marrow stromal cells. Biomaterials 2003, 24, 1745–1750. [Google Scholar] [CrossRef]
- Marin, E.; Fusi, S.; Pressacco, M.; Paussa, L.; Fedrizzi, L. Characterization of cellular solids in Ti6Al4V for or thopaedic implant applications: Trabecular titanium. J. Mech. Behav. Biomed. 2010, 3, 373–381. [Google Scholar] [CrossRef] [PubMed]
- Zardiackas, L.D.; Dillon, L.D.; Mitchell, D.W.; Nunnery, L.A.; Poggie, R. Structure, metallurgy, and mechanical properties of a porous tantalum foam. J. Biomed. Mater. Res. A 2011, 58, 180–187. [Google Scholar] [CrossRef]
- Larrañeta, E.; Lutton, R.E.M.; Woolfson, A.D.; Donnelly, R.F. Microneedle arrays as transdermal and intradermal drug delivery systems: Materials science, manufacture and commercial development. Mater. Sci. Eng. R 2016, 104, 1–32. [Google Scholar] [CrossRef] [Green Version]
- Gao, Z.; Li, Q.; He, F.; Huang, Y.; Wan, Y. Mechanical modulation and bioactive surface modification of porous Ti-10Mo alloy for bone implants. Mater Des. 2012, 42, 13–20. [Google Scholar] [CrossRef]
- Xie, F.X.; He, X.B.; Lu, X.; Cao, S.L.; Qu, X.H. Preparation and properties of porous Ti-10Mo alloy by selective laser sintering. Mater. Sci. Eng. C 2013, 33, 1085–1090. [Google Scholar] [CrossRef] [PubMed]
- Xie, F.X.; He, X.M.; Lv, Y.M.; Wu, M.P.; He, X.B.; Qu, X.H. Selective laser sintered porous Ti-(4–10)Mo alloys for biomedical applications: Structural characteristics, mechanical properties and corrosion behaviour. Corros. Sci. 2015, 95, 117–124. [Google Scholar] [CrossRef]
- Xie, F.X.; He, X.B.; Cao, S.L.; Lu, X.; Qu, X.H. Structural characterization and electrochemical behavior of a laser-sintered porous Ti-10Mo alloy. Corros. Sci. 2013, 67, 217–224. [Google Scholar] [CrossRef]
- Chou, X.M. Research on Titanium Alloy and Porous Titanium in Powder Metallurgy; Central South University: Changsha, China, 2007; pp. 27–28. [Google Scholar]
- Sidambe, A.T.; Figueroa, I.A.; Hamilton, H.G.C.; Todd, I. Metal injection moulding of CP-Ti components for biomedical applications. J. Mater. Process. Technol. 2012, 212, 1591–1597. [Google Scholar] [CrossRef]
- Xu, G.F.; Zhou, L.Q.; Li, X.; Duan, Y.L.; Tao, X.F. Existing forms and effects of trace impurities on mechanical properties of CP Ti. Mater. Sci. Eng. Powder Metall. 2016, 21, 672–677. [Google Scholar]
- Nyberg, E.; Miller, M.; Simmons, K.; Weil, K.S. Microstructure and mechanical properties of titanium components fabricated by a new powder injection molding technique. Mater. Sci. Eng. C 2005, 25, 336–342. [Google Scholar] [CrossRef]
- Wen, C.E.; Yamada, Y.; Shimojima, K.; Chino, Y.; Hosokawa, H.; Mabuchi, M. Novel titanium foam for bone tissue engineering. J. Mater. Res. 2002, 17, 2633–2639. [Google Scholar] [CrossRef]
- Kawai, N.; Niwa, S.; Sato, M.; Sato, Y.; Suwa, Y.; Ichihara, I. Bone formation by cells from femurs cultured among three-dimensionally arranged hydroxyapatite granules. J. Biomed. Mater. Res. A 1997, 37, 1–8. [Google Scholar] [CrossRef]
- Krishna, B.V.; Bose, S.; Bandyopadhyay, A. Low stiffness porous Ti structures for load-bearing implants. Acta Biomater. 2007, 3, 997–1006. [Google Scholar] [CrossRef] [PubMed]
- Heakal, E.T.; Ghoneim, A.A.; Mogoda, A.S.; Awad, K. Electrochemical behaviour of Ti-6Al-4V alloy and Ti in azide and halide solutions. Corros. Sci. 2011, 53, 2728–2737. [Google Scholar] [CrossRef]
- Levy, M.; Sklover, G.N. Anodic Polarization of titanium and titanium alloys in hydrochloric acid. J. Electrochem. Soc. 1969, 116, 323–328. [Google Scholar] [CrossRef]
- Assis, S.L.D.; Wolynec, S.; Costa, I. Corrosion characterization of titanium alloys by electrochemical techniques. Electrochim. Acta 2006, 51, 1815–1819. [Google Scholar] [CrossRef]
- McCafferty, E. Validation of corrosion rates measured by the Tafel extrapolation method. Corros. Sci. 2005, 47, 3202–3215. [Google Scholar] [CrossRef]
- Thieme, M.; Wieters, K.P.; Bergner, F.; Scharnweber, D.; Worch, H.; Ndop, J.; Kim, T.J.; Grill, W. Titanium Powder Sintering for Preparation of a Porous FGM Destined as a Skeletal Replacement Implant. Mater. Sci. Forum 1999, 308, 374–382. [Google Scholar] [CrossRef]
- Wen, C.E.; Mabuchi, M.; Yamada, Y.; Shimojima, K.; Chino, Y.; Asahina, T. Processing of biocompatible porous Ti and Mg. Scr. Mater. 2001, 45, 1147–1153. [Google Scholar] [CrossRef]
- Geetha, M.; Singh, A.K.; Asokamani, R.; Gogia, A.K. Ti based biomaterials, the ultimate choice for orthopaedic implants—A review. Prog. Mater. Sci. 2009, 54, 397–425. [Google Scholar] [CrossRef]
Figure 1.
Micrographs from Ti-10Mo alloys with different contents NH4HCO3 added: (a) 63%; (b) 67%; (c) 71%; (d) 75%; (e) 79%.
Figure 1.
Micrographs from Ti-10Mo alloys with different contents NH4HCO3 added: (a) 63%; (b) 67%; (c) 71%; (d) 75%; (e) 79%.
Figure 2.
3D reconstructed images of Ti-10Mo alloys with different content of NH4HCO3 added: (a–c) matrix and pores; (d–f) skeletonization image (pore) of samples and (g) schematic images of skeletonization.
Figure 2.
3D reconstructed images of Ti-10Mo alloys with different content of NH4HCO3 added: (a–c) matrix and pores; (d–f) skeletonization image (pore) of samples and (g) schematic images of skeletonization.

Figure 3.
Distribution of pore size of samples with different content of NH4HCO3 added: (a) 63%; (b) 67%; (c) 71%; (d) 75%; (e) 79%.
Figure 3.
Distribution of pore size of samples with different content of NH4HCO3 added: (a) 63%; (b) 67%; (c) 71%; (d) 75%; (e) 79%.
Figure 4.
X-ray diffraction patterns of Ti-10Mo alloy with different content NH4HCO3 added.
Figure 5.
Scanning electron back scattering morphologies of porous Ti-10Mo alloys with different content NH4HCO3 added: (a) 63%; (b) 67%; (c) 71%; (d) 75%; (e) 79%.
Figure 5.
Scanning electron back scattering morphologies of porous Ti-10Mo alloys with different content NH4HCO3 added: (a) 63%; (b) 67%; (c) 71%; (d) 75%; (e) 79%.
Figure 6.
(a) Engineering Stress-strain curves of different Ti alloy samples (b) Influence of porosity on compression yield strength and elastic modulus mechanical properties of porous Ti-10Mo.
Figure 6.
(a) Engineering Stress-strain curves of different Ti alloy samples (b) Influence of porosity on compression yield strength and elastic modulus mechanical properties of porous Ti-10Mo.

Figure 7.
Open-circuit potential as a function of time for different Ti alloy samples in naturally aerated phosphate-buffered saline solution at (37 ± 0.5) °C.
Figure 7.
Open-circuit potential as a function of time for different Ti alloy samples in naturally aerated phosphate-buffered saline solution at (37 ± 0.5) °C.
Figure 8.
(a) Potentiodynamic polarization curves of different Ti samples during exposure to naturally aerated phosphate-buffered saline solution at (37 ± 0.5) °C; (b) Tafel extrapolation on the cathodic polarization plots for determination of corrosion current density (Icorr) and cathodic Tafel slope (βc).
Figure 9.
Influence of porosity on corrosion rate of Ti-10Mo alloy.


Table 1.
Chemical composition of titanium and molybdenum powders (wt. %).
| Powder | Chemical Composition (wt. %) | |||||||||
|---|---|---|---|---|---|---|---|---|---|---|
| H | C | N | O | Si | Cl | Fe | Ni | Ti | Mo | |
| Ti | 0.02 | 0.02 | 0.04 | 0.25 | 0.02 | 0.05 | 0.06 | 0 | Bal. | 0 |
| Mo | 0.07 | 0.05 | 0.05 | 0.20 | 0.02 | 0.01 | 0.06 | 0.01 | 0 | Bal. |
Table 2.
Pore characteristics of Ti-10Mo alloy with different content NH4HCO3 added.
| Alloys | Space-Holder Content (vol. %) | Total Porosity (Pt, %) | Connected Porosity (Pc, %) | d50 (μm) | d10/d90 (μm) |
|---|---|---|---|---|---|
| Ti-10Mo | 63 | 50.8 ± 1.1 | 46.1 ± 1.0 | 70.1 ± 1.6 | 14.2 ± 0.3/132.5 ± 2.3 |
| 67 | 54.7 ± 1.2 | 50.5 ± 1.2 | 140.9 ± 2.9 | 87.1 ± 1.9/199.2 ± 4.3 | |
| 71 | 58.8 ± 1.4 | 54.3 ± 1.4 | 241.3 ± 5.7 | 190.1 ± 3.7/296.5 ± 6.6 | |
| 75 | 63.4 ± 1.5 | 59.1 ± 1.4 | 321.6 ± 7.8 | 271.3 ± 5.4/374.5 ± 10.2 | |
| 79 | 66.9 ± 1.6 | 62.8 ± 1.7 | 381.4 ± 10.1 | 335.4 ± 7.8/438.7 ± 11.2 |
Table 3.
Corrosion parameters of Ti-10Mo with different porosity in naturally aerated phosphate-buffered saline solution at 37 °C obtained by Tafel analysis.
Table 3.
Corrosion parameters of Ti-10Mo with different porosity in naturally aerated phosphate-buffered saline solution at 37 °C obtained by Tafel analysis.
| Alloys | Porosity (%) | Ecorr (mV vs. SCE) | Icorr × 10−8 (A/cm2) | βc (mV Decade−1) |
|---|---|---|---|---|
| Ti-10Mo | Inherent 2.8 ± 0.2 | −131.1 ± 7.4 | 1.4 ± 0.5 | −205.1 ± 4.2 |
| 50.8 ± 1.1 | −119.1 ± 9.5 | 3.5 ± 0.2 | −121.4 ± 3.6 | |
| 54.7 ± 1.2 | −121.5 ± 8.7 | 5.4 ± 0.4 | −105.6 ± 1.4 | |
| 58.8 ± 1.4 | −155.1 ± 3.3 | 7.1 ± 0.5 | −102.4 ± 2.6 | |
| 63.4 ± 1.5 | −188.1 ± 3.8 | 9.8 ± 0.4 | −128.3 ± 2.9 | |
| 66.9 ± 1.6 | −210.1 ± 9.8 | 14.1 ± 0.4 | −148.6 ± 2.1 | |
| CP Ti | 50.5 ± 1.2 | −125.1 ± 5.1 | 8.9 ± 0.7 | −131.3 ± 1.2 |
Table 4.
Pore characteristics, mechanical and corrosion properties of different Ti base alloy samples.
Table 4.
Pore characteristics, mechanical and corrosion properties of different Ti base alloy samples.
| Alloys | Pore Characteristics | Mechanical Properties | Corrosion Properties | ||
|---|---|---|---|---|---|
| Porosity (%) | Average Pore Size (d50, μm) | Compression Yield Strength (MPa) | Elastic Modulus (GPa) | Corrosion Rate (g/m2·day) | |
| Ti-10Mo | Inherent 2.8 ± 0.2 | - | 908.1 ± 20.6 | 66.2 ± 3.2 | 1.6 ± 0.1 |
| 50.8 ± 1.1 | 70.1 ± 1.6 | 248.2 ± 15.9 | 6.4 ± 0.9 | 4.1 ± 0.2 | |
| 54.7 ± 1.2 | 140.9 ± 2.9 | 194.7 ± 15.1 | 5.1 ± 0.8 | 6.3 ± 0.3 | |
| 58.8 ± 1.4 | 241.3 ± 5.7 | 166.2 ± 13.5 | 3.9 ± 0.4 | 8.1 ± 0.3 | |
| 63.4 ± 1.5 | 321.6 ± 7.8 | 127.5 ± 12.7 | 2.9 ± 0.2 | 11.2 ± 0.5 | |
| 66.9 ± 1.6 | 381.4 ± 10.1 | 76.9 ± 11.9 | 1.7 ± 0.1 | 17.1 ± 0.9 | |
| CP Ti | 50.5 ± 1.0 | 68.8 ± 2.1 | 201.9 ± 14.8 | 6.1 ± 1.1 | 10.1 ± 1.8 |
© 2018 by the authors. Licensee MDPI, Basel, Switzerland. This article is an open access article distributed under the terms and conditions of the Creative Commons Attribution (CC BY) license (http://creativecommons.org/licenses/by/4.0/).
Share and Cite
MDPI and ACS Style
Xu, W.; Lu, X.; Zhang, B.; Liu, C.; Lv, S.; Yang, S.; Qu, X. Effects of Porosity on Mechanical Properties and Corrosion Resistances of PM-Fabricated Porous Ti-10Mo Alloy. Metals 2018, 8, 188. https://doi.org/10.3390/met8030188
AMA Style
Xu W, Lu X, Zhang B, Liu C, Lv S, Yang S, Qu X. Effects of Porosity on Mechanical Properties and Corrosion Resistances of PM-Fabricated Porous Ti-10Mo Alloy. Metals. 2018; 8(3):188. https://doi.org/10.3390/met8030188
Chicago/Turabian StyleXu, Wei, Xin Lu, Bing Zhang, Chengcheng Liu, Shaomin Lv, Shidi Yang, and Xuanhui Qu. 2018. "Effects of Porosity on Mechanical Properties and Corrosion Resistances of PM-Fabricated Porous Ti-10Mo Alloy" Metals 8, no. 3: 188. https://doi.org/10.3390/met8030188
Note that from the first issue of 2016, this journal uses article numbers instead of page numbers. See further details here.