A Study on the Microstructural Evolution of a Low Alloy Steel by Different Shot Peening Treatments


1
Department of Material Science and Engineering, University of Oviedo, Campus de Gijón, Edificio Departamental Este, 33203 Gijón, Spain
2
Department of Mechanical Engineering, Politecnico di Milano, via La Masa, 1, 20156 Milan, Italy
*
Author to whom correspondence should be addressed.
Metals 2018, 8(3), 187; https://doi.org/10.3390/met8030187
Submission received: 26 February 2018
/
Revised: 12 March 2018
/
Accepted: 13 March 2018
/
Published: 15 March 2018
(This article belongs to the Special Issue Kinetic Surface Treatments)
Abstract
:Recent studies have shown that severe shot peening can be categorized as a severe plastic deformation surface treatment that is able to strongly modify the microstructure of the surface layer of materials, by both increasing the dislocation density and introducing a large number of defects that define new grain boundaries and form ultrafine structure. In this work, conventional shot peening and severe shot peening treatments were applied to 39NiCrMo3 steel samples. The samples were characterized in terms of microstructure, surface roughness, microhardness, residual stresses, and surface work-hardening as a function of surface coverage. Particular attention was focused on the analysis of the microstructure to assess the evolution of grain size from the surface to the inner material to capture the gradient microstructure. Severe shot peening proved to cause a more remarkable improvement of the general mechanical characteristics compared to conventional shot peening; more significant improvement was associated with the microstructural alteration induced by the treatment. Our datas provide a detailed verification of the relationship between shot peening treatment parameters and the microstructure evolution from the treated surface to the core material.
Highlights
- Conventional and severe shot peening was performed on a low-alloy varying the surface coverage and keeping Almen intensity constant.
- The surface state was examined and analyzed in terms of microstructure, roughness, hardness, residual stresses, and surface work hardening.
- The surface state is strongly influenced by the coverage, even if saturation is noted, when coverage exceeds 5000%
- It is possible to develop severe shot peening treatments targeted to particular applications.
1. Introduction
Mechanical properties of metallic alloys play an important role in the behavior of components. The microstructure of materials (i.e., grain’s geometry, distribution, and dimension) has a big influence in defining physical and mechanical characteristics of the material. Because of that, during the last few decades, new technics and a lot of heat and mechanical treatments are being developed in order to enhance material properties [1,2,3,4,5]. Regarding grain dimension, structures can be classified as coarse grains, ultrafine grains, or nanocrystals, each inducing different material properties. Ultrafine grains are known for having at least one dimension between 1 µm and 100 nm, whereas nanocrystals present at least one dimension down to 100 nm [6]. The superior characteristics of nanostructured materials are largely related to the high amount of grain boundaries present in their structures (reported to be ranging between 30–50% of the total crystal volume [7,8,9]), which provide the material with a high amount of energy that is responsible for its altered behavior [10].
Keeping in mind that, in most cases, mechanical failures initiate from the surface of the workpiece (e.g., fatigue, wear, etc.) and considering the complications of obtaining bulk nanocrystalline components, especially with large dimensions, severe plastic deformation (SPD) methods that are able to induce surface grain refinement have gained special attention due to their high potential to enhance some mechanical properties of components. Major surface grain refinement is known to lead to high hardness and a low friction coefficient in metals and alloys [11] that enhance wear resistance and tribological behavior, in turn [12,13,14]. Recently several studies have demonstrated that surface nanocrystallized structures show improved fatigue behavior [15,16] despite the relatively high surface roughness [17,18]. There are also some studies reporting that a smaller grain size could accelerate the corrosion process by forming more electrochemical cells between grains [19] and providing more active sites for preferential etching. In another study it is reported that the effect of the grain boundary density on corrosion resistance could be positive or negative, depending on the material composition, corrosion mechanism, and the surrounding environment [20]. Many other features such as diffusivity, electrical resistivity, specific heat, thermal expansion coefficient, and soft magnetic properties are also reported to be influenced directly by grain dimension [21,22,23].
Grain refinement induced by SPD techniques is due to the generation of defects and interfaces (grain boundaries), increasing of polycrystalline free energy, and inducing of grain refinement, through application of high strains at high strain rates. Processes such as ball milling [24,25,26,27], sliding wear [28,29], sand blasting and annealing [30,31], ultrasonic shot peening (USSP) [32,33,34], and severe shot peening (SSP) [17,35,36] are efficient examples of SPD techniques that induce grain refinement on the surface layer of metallic material. However, the application of most of the aforementioned techniques is limited to small scale samples and simple geometries.
Because of this, we have specifically focused our study on SSP as an interesting mechanical surface treatment due to its exclusive simplicity and flexibility in terms of size and geometrical restrictions that can offer high potential for industrial applications. Severe shot peening is derived from classical shot peening. This latter is a cold working process in which small spherical media impact the surface of a metallic part, creating small indentations on the impacted surface. Below the plastically deformed surface layer, the material tries to restore its original shape after the impact, thereby producing a hemisphere of cold-worked region which is highly stressed in compression. These effects induce compressive residual stresses that are useful to stop or prevent crack propagation [37,38]. Severe shot peening differs from classical shot peening mainly because of the higher Almen intensity and the longer time used to complete the process, which means more energy available for the deformation of the material. The Almen intensity is defined as the arc height of an Almen test strip measured at saturation point by using an Almen gauge. Regarding the coverage, it is defined as the percentage of the surface area impacted by shots, commonly referred to as “indentations” or “dimples”. Full (100%) coverage means that the whole surface has been impacted at least one time, while coverage beyond 100% is defined as multiples of the time to achieve 100% [39]. For example, a surface coverage of 1000% requires 10 times the exposure time for obtaining full (100%) coverage.
In more detail, recent studies have successfully revealed that SSP treatment, performed in classical shot peening machines, can generate ultrafine and nanosize grained structures in the surface layer of treated parts [36,40,41,42,43] by increasing the impact energy of the processes. This fact could be really interesting since the machines are widely used and are really versatile, making the application of this treatment possible to most of the industrial components.
As already mentioned, although several studies have demonstrated that SSP treatments are able to improve some mechanical and physical properties, there are few studies on the influence of SSP treatment on microstructural changes [41]. Thus, the aim of this work is to study the effect of very high surface coverage at a fixed Almen intensity to get grain refinement. The microstructural evolution of quenched and tempered low-alloy steel 39NiCrMo3 is analyzed after SSP treatments with different surface coverage (100%, 5000%, and 10,000% coverage) while keeping the Almen intensity constant. These treatments have been performed on a laboratory shot peening machine, and the coverage percentages have been chosen to clearly differentiate conventional from severe shot peening.
Samples were analyzed with a field emission gun scanning electron (FEG-SEM) microscope using the electron backscatter diffraction (EBSD) technique. Grain size determination, thickness evaluations of the layer affected by shot peening, and topography modification, as well as distribution of residual stresses and work hardening, were studied after the applied treatments. The results are critically discussed to evidence the role of surface coverage in microstructural evolution induced by severe shot peening and to draw possible developments of the severe shot peening process.
2. Experimental Procedure
2.1. Material and Samples
Prismatic samples of 16 × 10 × 6.5 mm3 were made of quenched and tempered low alloy steel 39NiCrMo3, the nominal chemical composition of which is shown in the Table 1. This steel is commonly used in mechanical parts of machines and in the automotive industry.
2.2. Shot Peening Treatment
Shot peening treatments were performed by means of a GUYSON Euroblast 4 PF laboratory machine. Three different series of samples were treated using cut wire steel shots of 0.7 mm diameter and an Almen intensity of 19 A but varying the surface coverage level. One series was treated with 100% coverage, considered as the conventionally shot peened series (CSP series) and two other series were severely treated with 5000% and 10,000% coverage, referred to as the SSP5 and SSP10 series, respectively. It is important to clarify that these treatments have been performed using a laboratory shot peening machine. We use these high coverage levels with the aim to transmit a large amount of energy to the treated material; however, in the industrial scale, the same quantity of energy can be induced at lower coverage levels, using a higher Almen intensity.
The Almen intensity was determined according to SAE J443 standard [39]. The time required to perform the treatments with 100% surface coverage (CSP treatment) was determined using the Avrami equation [44], assuming that a statistically random shot particle arrives at the component’s surface at a constant rate and creating circular indents of similar size [45]. The treatment time to get 5000% and 10,000% coverage is 50 and 100 times the time to get 100% coverage, respectively.
2.3. Surface Roughness
Surface roughness measurements were performed on all samples using a Diavite DH-6 roughness tester. Measurements were performed in eight random positions and directions over a length of 4.8 mm using a cut-off length of 0.8 mm.
2.4. Microstructure
The microstructure after different treatments was characterized by a Nikon EPIPHOY 200 optical microscope. One sample of each series was cross sectioned, impregnated in mounting resin, ground sequentially with a range of SiC papers up to 1000 scratch size, subsequently polished using soft cloths with diamond paste abrasives (grain sizes of 6 µm and 1 µm), and chemically etched with a 2% Nital etching solution.
In order to estimate the grains dimension and the depth of grain-refined zone, samples were also analyzed by means of a FEG-SEM (Ultra Plus, Carl Zeiss) equipped with an EBSD system (HKL Channel 5) of Oxford Instruments. For EBSD analysis, the samples were subjected to a similar preparation going through different grinding stages and, subsequently, polished with polycrystalline diamond water-based suspensions of 9 and 3 μm using a neoprene cloth with a colloidal silica suspension of 0.25 μm. This last polishing step was prolonged for several minutes with the aim of eliminating the superficial deformations originating during the previous metallographic preparations. Inverse pole figure (IPF) maps were obtained using a potential of 20 keV, with 10.5 mm working distance and 70° of inclination between the sample and the beam.
In order to evaluate grain size evolution as a function of surface coverage, an area of 400 μm (depth) × 30 μm (along the surface) was scanned using a step size of 200 nm. This step is higher than the one recommended by the ISO Standard 13067 (10% of the average grain size) for individual grain analysis. However, since the purpose of this analysis is to observe the overall grain size evolution as a function of surface coverage over quite a large area, this step size was chosen by prioritizing the size of the overall scan area and considering the extremely high scanning duration for smaller step sizes. Nevertheless, to obtain more precise information of grain size in the top surface layer, surface analysis was also performed over an 8 (depth) × 6 (along the surface) µm2 area using smaller step size of 25 nm in both vertical and horizontal directions.
2.5. Microhardness
The applied treatments are aimed at increasing the dislocation density and at decreasing the grain size [46]. Both effects have a direct relationship with the hardening process. In order to observe this effect, the microhardness trend from the surface to the inner core of the samples was studied in a transversal section using a HV Buehler 2100 microhardness tester with a 200 gf load and 10 s dwell time, up to a depth of 700 μm. Three measurements were performed at each depth.
2.6. Residual Stresses and Full Width at Half Maximum
The residual stress field induced by the applied treatments was measured by means of an X-ray diffraction technique. The distance between different crystalline planes measured with a diffractometer provides information about the residual stress field caused by shot peening treatments based on sample deformation and its Young modulus. X-ray diffraction (XRD) residual stress measurements were performed with an AST X-Stress G3R portable X-ray diffractometer using CrKα radiation (Kα alpha = 2.2910 Å) source. The sin2(Ψ) method was used to analyze the data collected at a diffraction angle (2θ) of 156.4° corresponding to {211}-reflex scanned with a total of five tilts in the range of −45° to 45° along three rotations of 0°, 45°, and −45°. The collimator used was 2 mm diameter and the exposure time was 20 s.
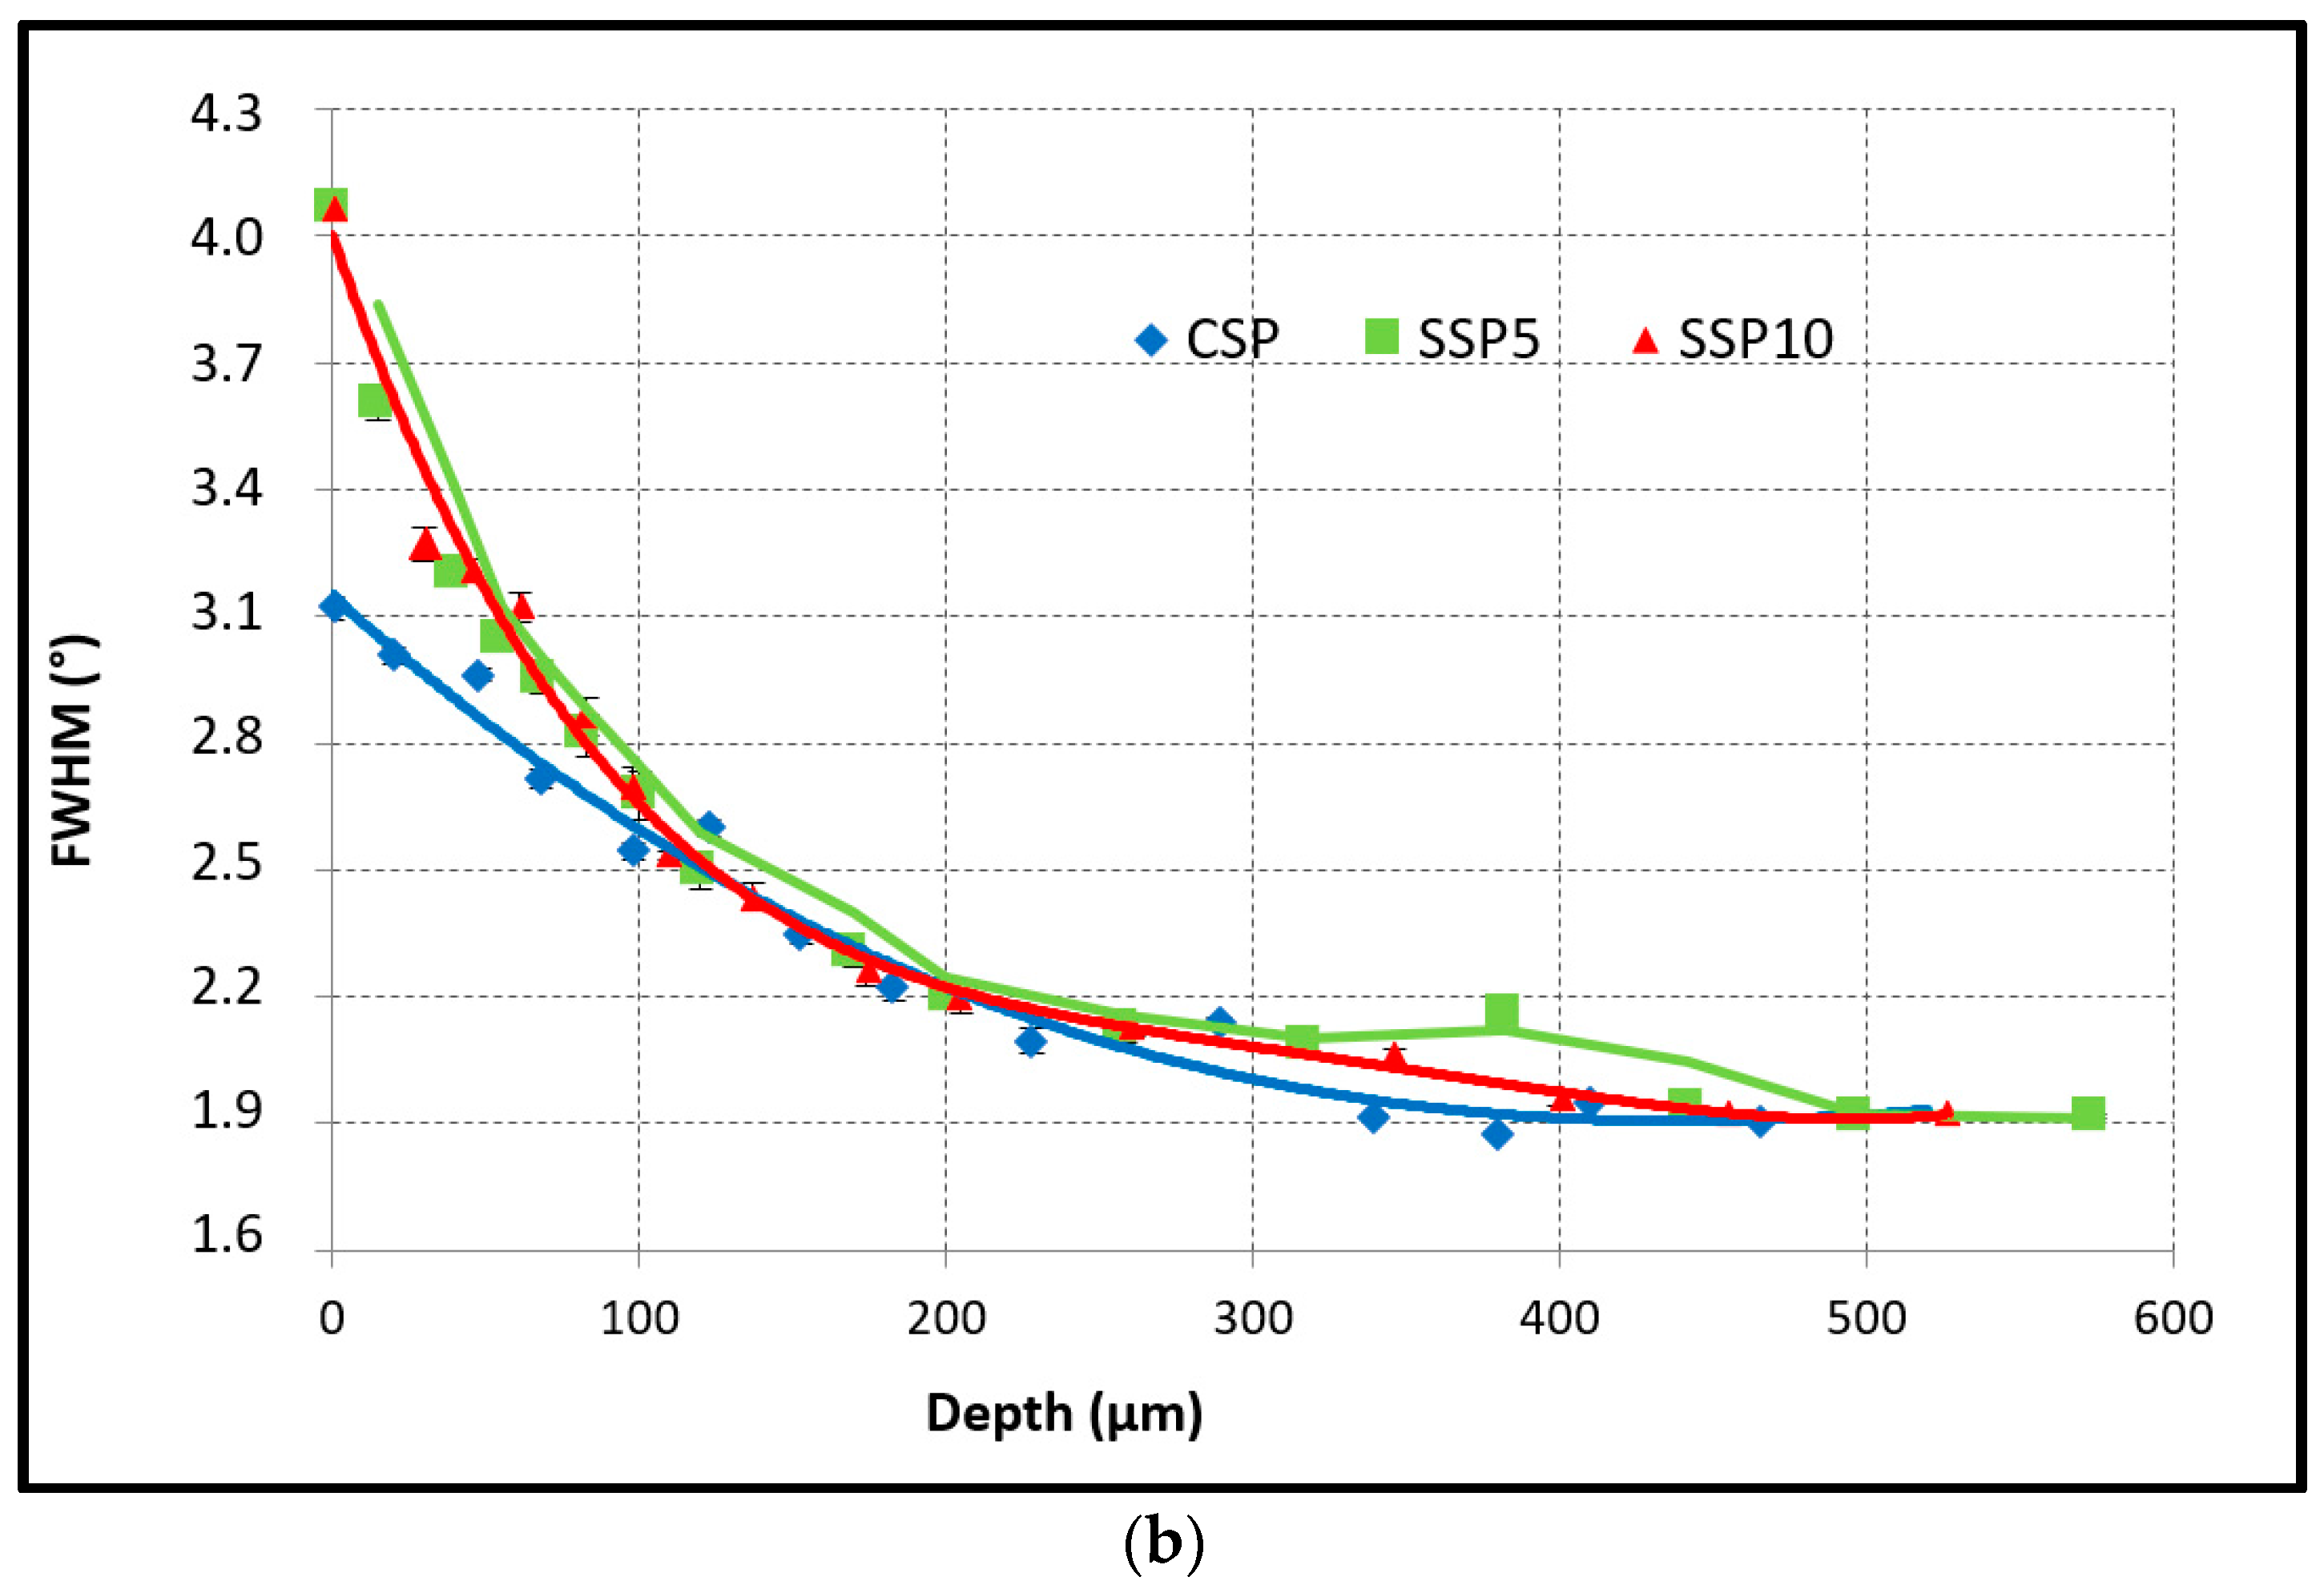
These measurements provide the full width at half maximum (FWHM) parameter, which is related to grain distortion, dislocation density, and residual microstress state and can be considered as a work hardening index [47].
To perform measurements in depth, material was removed from the surface before each measurement by electro-polishing, using a potential difference of 45 V and a reactive agent of 96% acetic acid and 4% perchloric acid.
3. Results and Discussion
3.1. Roughness
High surface roughness is a generally undesired side effect of shot peening that can decrease the fatigue life of the treated part [17]. That is why, normally, special attention is paid to the surface topography after shot peening. Previous studies have clearly indicated that SSP treatment, in general, increases surface roughness of treated materials [17,18]. Table 2 presents the average values of the most representative roughness parameters (Ra, Rz, and Rmax) of treated samples, measured following DIN Standard 4786. Also, in our study, roughness of samples submitted to SSP treatments were higher compared to the CSP samples due to the higher impact energy of the peening process. However, it seems that roughness tends to stabilize after a high level of coverage, as the roughness values of SSP5 samples are quite similar to those of the SSP10 ones.
3.2. Microstructure
3.2.1. Optical Analysis
Optical analysis was performed on CPS, SSP5, and SSP10 samples along a transversal section with the aim to analyze the evolution of the microstructure from the surface to the inner layers as shown in Figure 1. Microstructural observations reveal a highly deformed surface layer that is more evident and deeper in the case of SSP treatments. This is due to the higher plastic deformation generated by the larger number of high kinetic energy impacts in these series. According to our previous observations, this densely deformed layer indicates the grain refinement of the surface microstructure [35]. However, it is not possible to note a significant difference between SSP5 and SSP10 samples with optical microscopy, apart from a slight difference in the thickness of the dark surface layer.
3.2.2. FEGSEM Analysis
The EBSD technique was used to perform qualitative and quantitative microstructural analysis in samples submitted to different shot peening treatments in order to evaluate the grain size evolution from the surface layer down to a depth of 400 μm and to analyze the influence of the surface coverage on the grain refinement process.
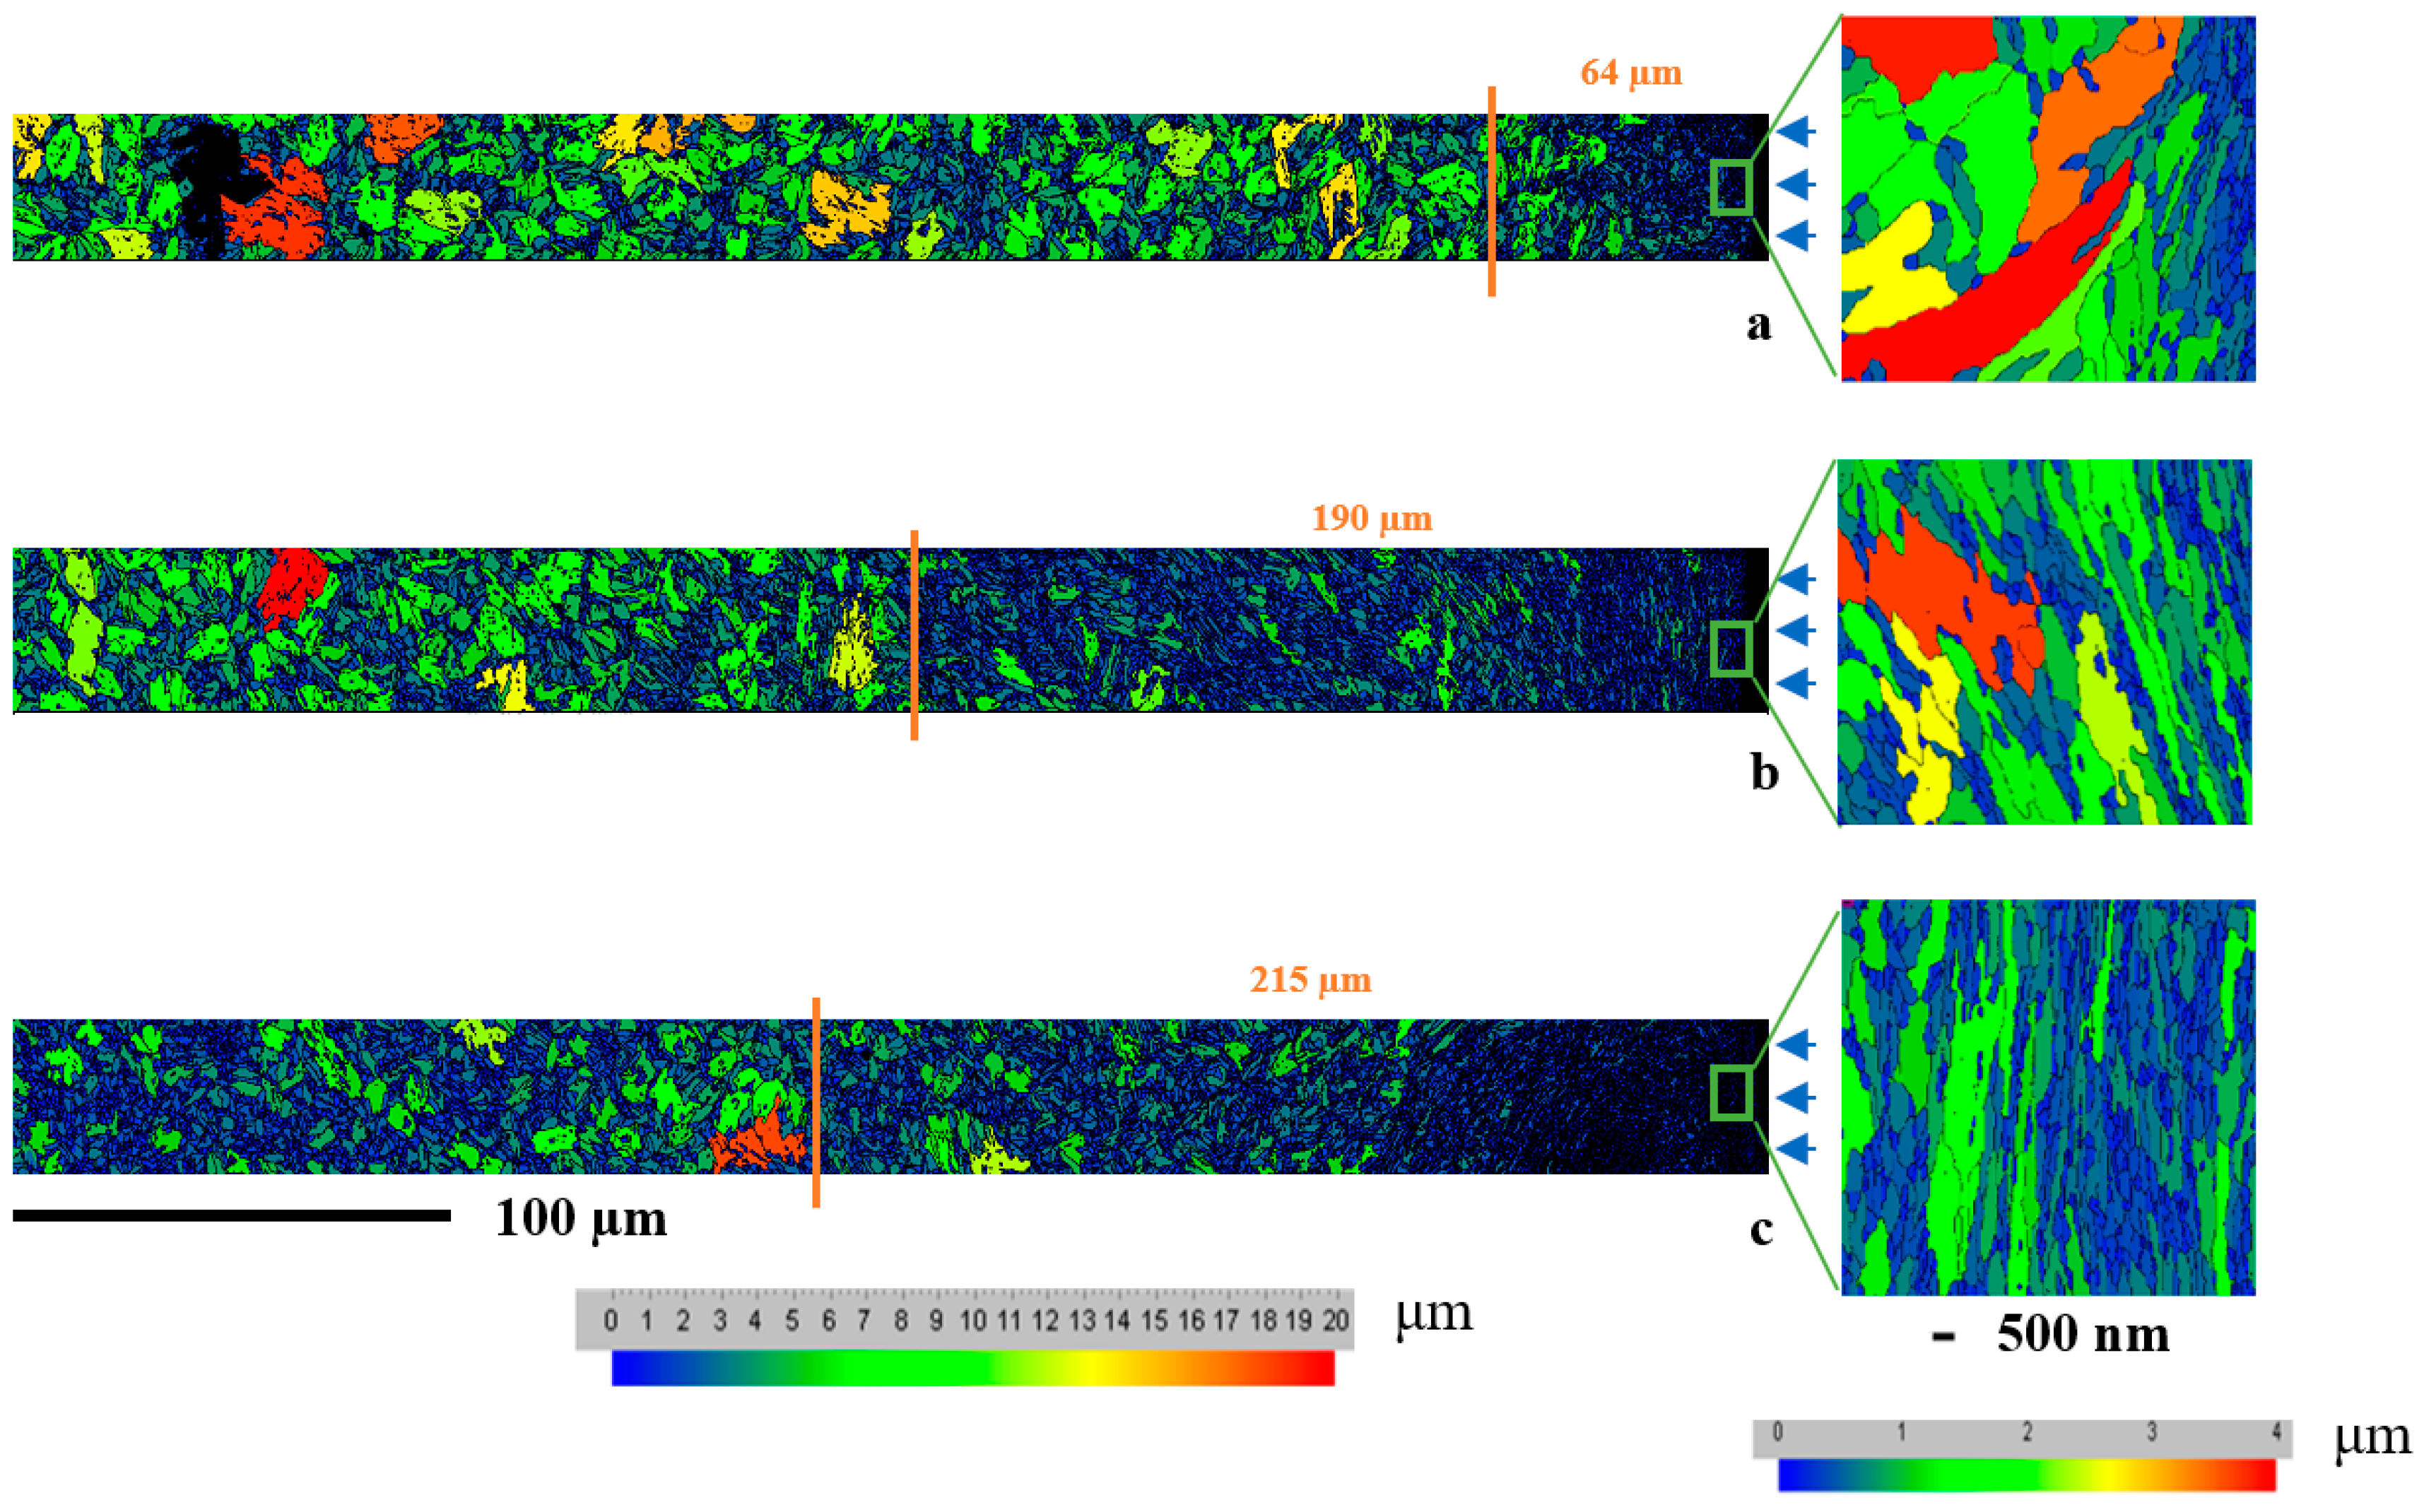
Figure 2a–c shows the grain size evolution of samples submitted to different shot peening treatments. These maps were obtained considering a misorientation between grain boundaries equal or superior to 15°, in an area of 400 × 30 μm2. The as-received material is quenched and tempered steel with an average grain size of around 10 μm showing, in some areas, grains as large as 20 μm as it can be observed at higher depths of the CSP sample (Figure 2a). The data obtained from this analysis presents a clear grain refinement of different depths from the surface of the shot peened samples, as evidenced by the color scale in Figure 2. The inset images of Figure 2 (shown on the right), obtained with a smaller step size of 25 nm, provide more detailed information on the structure of surface grains, evidencing that all grains are smaller than 4 μm on the surface layer of all treated samples and, more specifically, smaller than 2 μm for the SSP10 (sample with the highest surface coverage). In all cases the straightening of the grains took place in the direction perpendicular to shot peening because of the impact strain. The presence of the nanograins on the top surface layer of all samples can also be confirmed considering the scale bar of 500 nm for the inset. Table 3 shows the quantitative analysis performed on the inset images of Figure 2, highlighting that surface grain refinement is a direct function of surface coverage.
It is interesting to note that the thickness of the most evident refined layer is directly affected by surface coverage, estimated to be around 64 μm, 190 μm, and 215 μm for CSP, SSP5, and SSP10 samples, respectively (marked in Figure 2 with vertical solid lines). While SSP treatment is inducing a notable increase in the depth of the grain-refined layer compared to the CSP treatment, the thickness of the affected layer by SSP5 and SSP10 treatments are quite similar, suggesting the existence of a limit for the deformation of the treated material.
Figure 3 shows the IPF of the shot peened samples, which are normally used to analyze the material texture. Here, we are using this figure to provide a much clearer illustration of different zones in the refined layer, highlighting the individual grain size and orientation, considering a misorientation between grain boundaries equal to or greater than 15°. Two distinct layers with different extents of grain refinement can be easily separated with boundaries between them, as shown in Figure 3 for each individual sample. The thickness of the first zone with notable grain refinement is estimated to be around 35 μm, 46 μm, and 80 μm for CSP, SSP5, and SSP10 samples, respectively. These extremely refined layers are followed by another, less refined underlying layer with the estimated thickness of 29 μm, 144 μm, and 135 μm for CSP, SSP5, and SSP10 samples, respectively. It is to be noted that, even at higher depths down to 400 μm, a clear grain refinement can be observed for both SSP samples compared to CSP samples, which is representing the as-received grain structure at such high depths.
Even if the indexing degree in the analysis of SSP samples does not exceed 75–80% on the surface, it can be considered acceptable given the high density of grain boundaries that exist in this area, which emphasizes the small size of the surface grains. The indexing degree increases up to 85–90% in the inner core material.
3.3. Microhardness Measurements
Figure 4 shows the microhardness trend on the cross section of the treated samples. The results indicate that higher coverage levels, i.e., higher exposure time, results in a greater increase of surface layer hardness compared to 100% coverage in the CSP sample. This microhardness increment in surface layers can be due to the grain refinement and increased dislocation density, as confirmed by the microstructural observations [43]. There is not a remarkable difference between the values obtained on SSP5 and SSP10 samples, again confirming the limited work hardening capacity of the material at excessively high surface coverage levels. On the other hand, the thickness of the hardened layer (approximately 200 μm for all samples) does not seem to be directly affected by the coverage level, as will be confirmed later with the FWHM diagram in Figure 5. We postulate that the increase of the depth of the affected zone becomes almost constant after a certain plastic deformation, although higher coverage results in slightly higher surface hardness values. The depth of the affected layer after SP treatments is not constant, and it depends on the SP parameters and material characteristics [48,49].
3.4. XRD Measurements
3.4.1. Residual Stresses
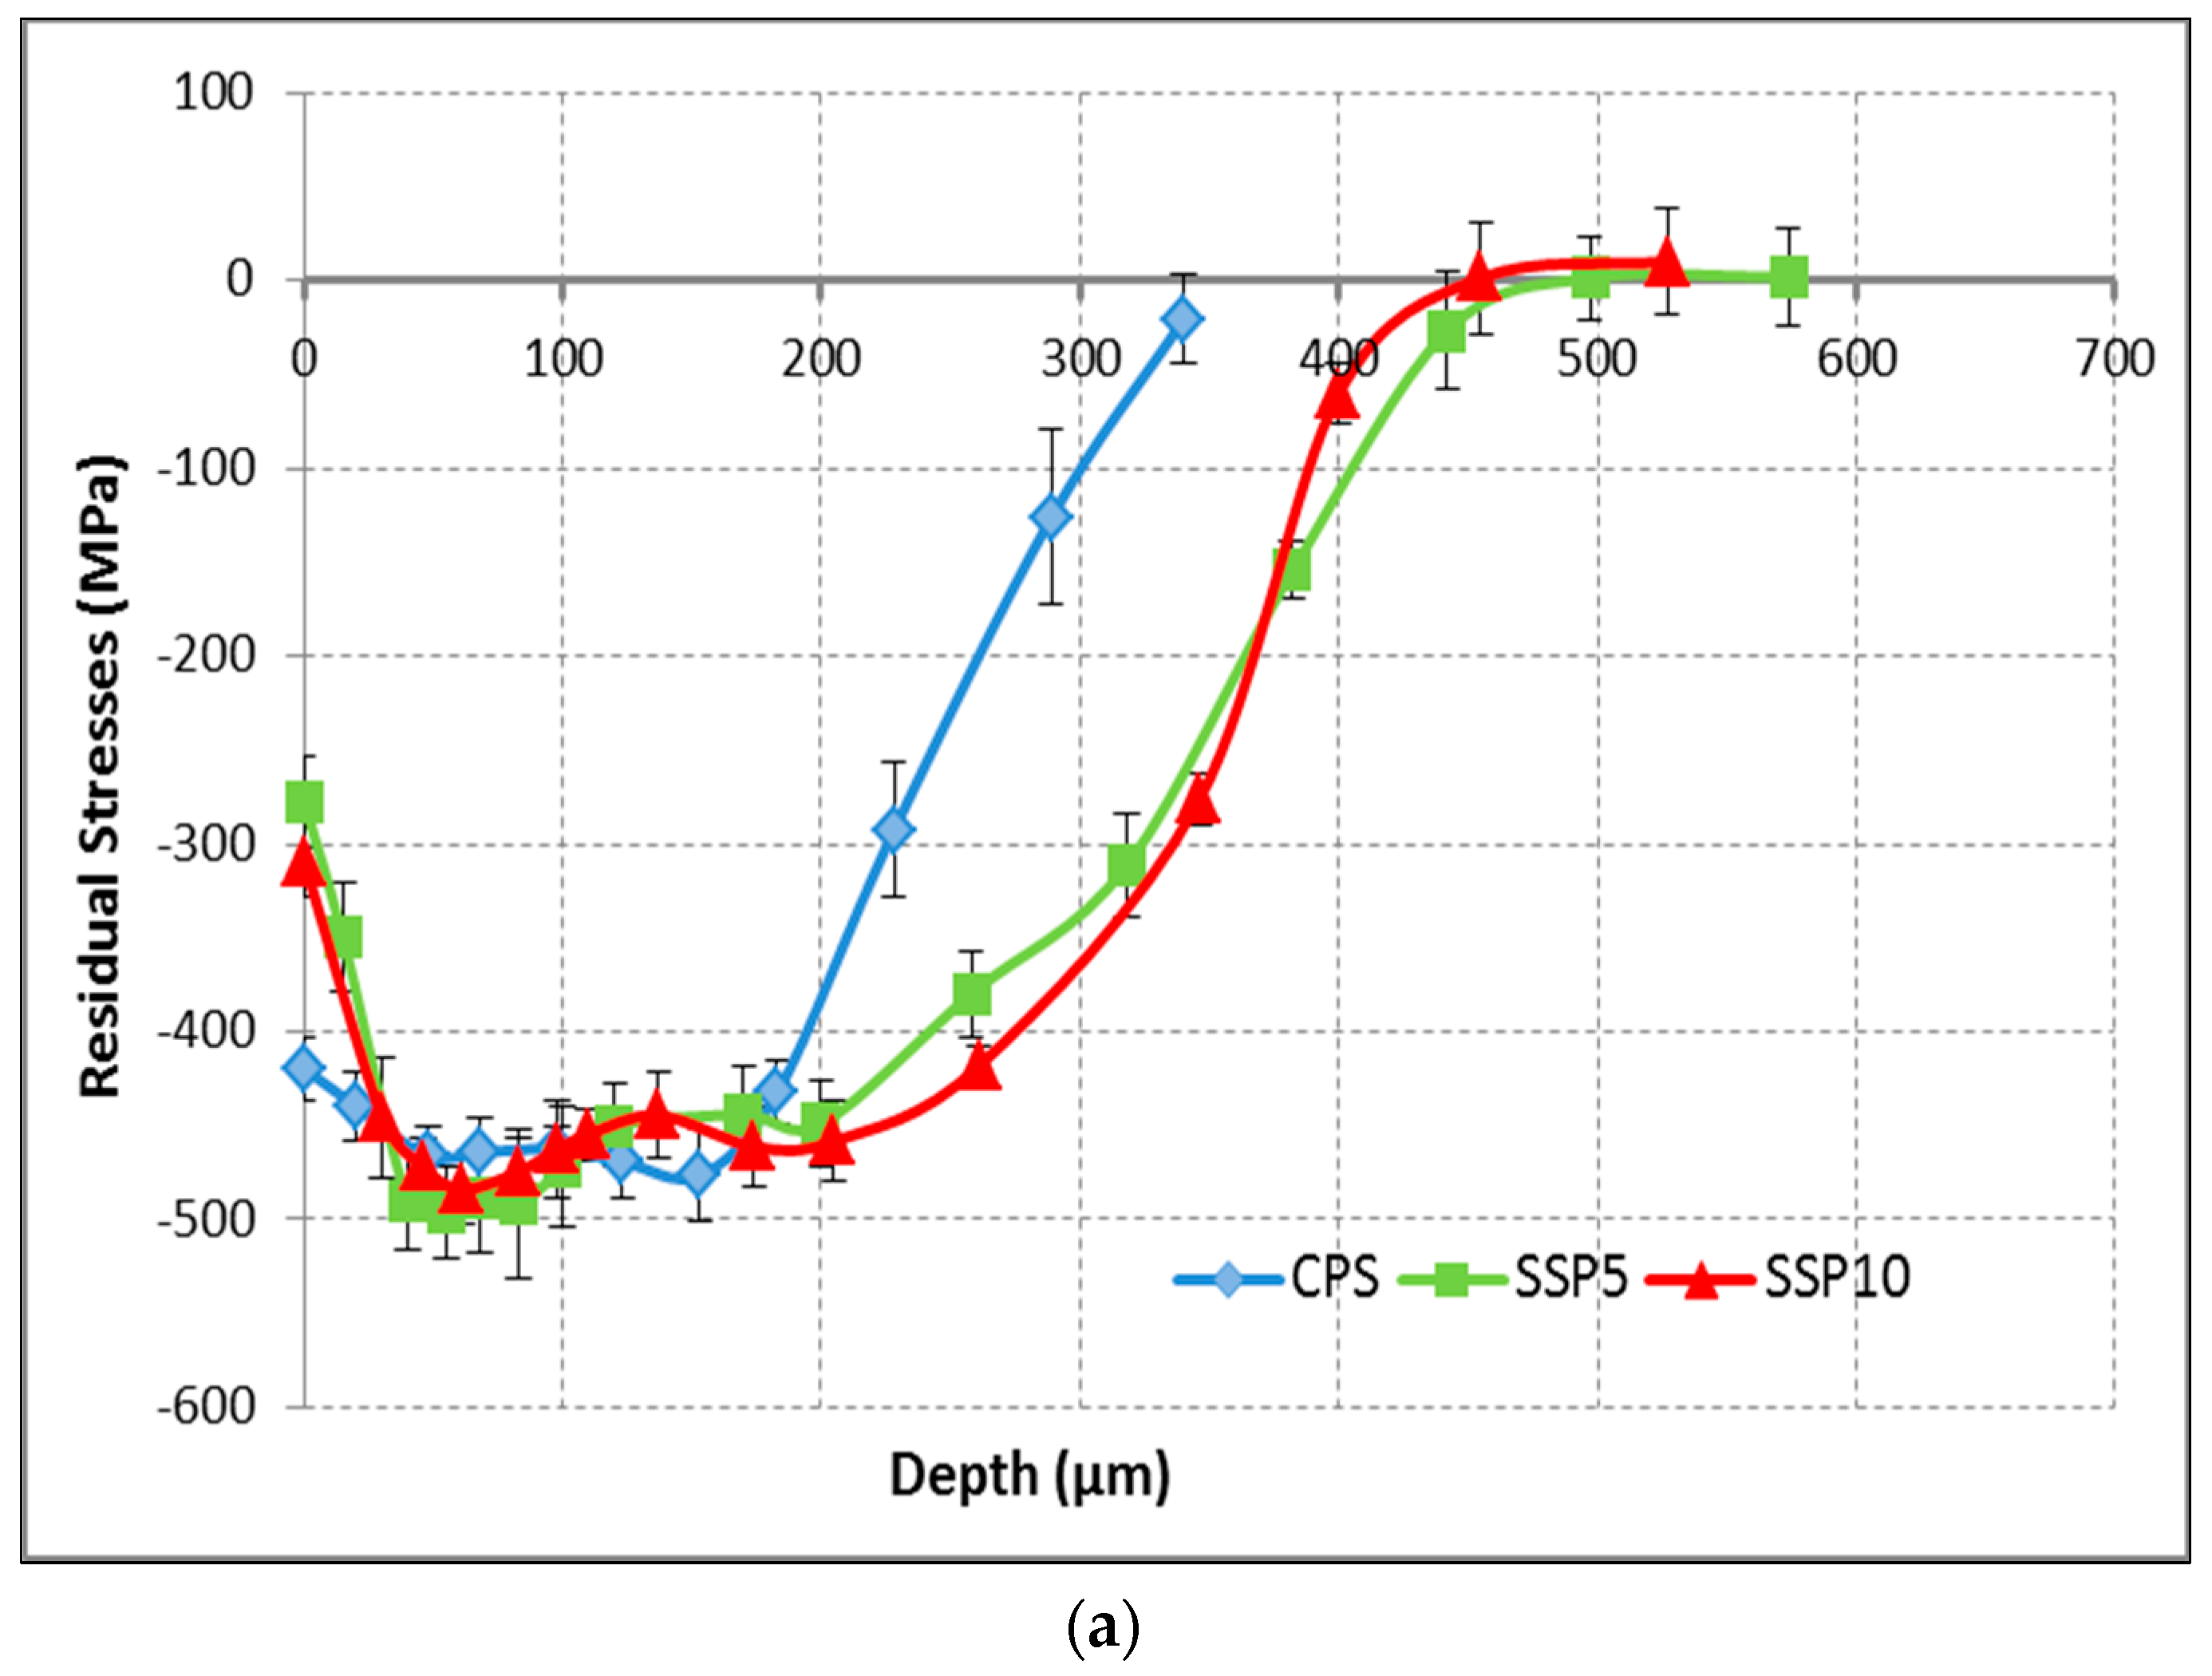
One of the main effects of shot peening treatments is the generation of a compressive residual stress field on the surface layer of the material, which is mainly responsible for fatigue life improvement [17,35,36]. Figure 5a shows the in-depth residual stress trend of the treated samples after X-ray diffraction analysis. The maximum stress value is quite similar for all samples, measured at around −450 MPa, while the thickness of the layer with compressive residual stresses is higher for SSP samples compared to CSP samples; however, there is just a slight difference between the trend of SSP5 and SSP10 samples. A potential justification for the similarity of stress distribution in SSP5 and SSP10 samples can be the limited work hardening capacity of the material, as was also evidenced in microhardness measurements.
3.4.2. Full Width Half Maximum Measurements
FWHM trends shown in Figure 5b indicate a greater surface work hardening on samples submitted to SSP treatments in comparison with the CSP samples. This confirms that higher coverage increases hardening through larger accumulated plastic deformation, with respect to conventional treatment. Similar trends were obtained for SSP5 and SSP10 samples, showing that further increasing the coverage does not induce additional hardening. A similar effect has been found in microhardness trends (Figure 4).
4. Conclusions
Three shot peening treatments, with conventional and severe parameters, were applied to 39NiCrMo3 low alloy steel samples in order to investigate the evolution of microstructural and mechanical characteristics by variation of surface coverage ranging between 100%, 5000%, and 10,000%, while keeping the Almen intensity constant.
The results indicate that surface roughness increases in all cases after shot peening, but higher values were found for the two severe treatments compared to the conventional one.
The shot peening treatments also increase microhardness in all cases. It was observed that higher exposure time resulted in a greater microhardness increment compared to conventional treatment (100% surface coverage), while there is almost no difference between the depths of the hardened layer after the two severe shot peening treatments. This fact can be indicative of a limit in the deformation of the 39NiCrMo3 steel surface layer.
X-ray diffraction measurements reveal higher residual stress in the case of severe processes compared to conventional shot peening, but slight differences between the two SSP treatments were observed.
Studying surface layer microstructure using the EBSD technique allowed for the development of a reliable analysis of the grain size distribution. The results showed a clear grain refinement in the surface layer of all treated samples. The extent of both grain refinement and thickness of the refined area were directly related to the exposure time, i.e., surface coverage. Maximum average grain size was measured to be smaller in severe treatments with higher thickness of the refined layer. Non-homogeneous grain size distribution was observed in all cases, while a slightly more homogeneous grain size distribution was found in the case of the 10,000% coverage.
In summary, it is possible to affirm that while roughness, hardness, and residual stresses greatly improves from 100% to 5000% coverage, no appreciable difference can be found when considering going from 5000% to 10,000% coverage. This makes it possible to affirm that the trend of the latter quantities are asymptotic, and the saturated value is obtained at a coverage of less than 5000%. This means that intermediate values of coverage should be investigated.
On the contrary, with regards to grain refinement, the depth affected by the treatment is not yet saturated at 10,000% coverage. A slight decrease of the grain size and a thicker affected zone is noted if the coverage increases. This indicates that the material has not been saturated from a grain refinement point of view.
The results of the present study also show that, by tuning the coverage and by using an appropriate Almen intensity, it is possible to obtain a surface state with controlled characteristics in terms of roughness, hardness and surface work hardening, residual stresses, and microstructure. This, thus, opens a view on targeted shot peening treatments that considers the final application of the treated part and the characteristics needed to emphasize particular required characteristics.
Author Contributions
Juan González, Luis-Borja Peral, Chiara Colombo and Inés Fernández Pariente conceived and designed the experiments; Juan González and Luis-Borja Peral performed the experiments; Juan González, Luis-Borja Peral analyzed the data together with Chiara Colombo and Inés Fernández Pariente; Juan González wrote the paper, under the supervision of Inés Fernández Pariente.
Conflicts of Interest
The authors declare no conflict of interest.
References
- Yinsheng, H.; Keun-Bong, Y.; Houyu, M.; Keesam, S. Study of the austenitic stainless steel with gradient structured surface fabricated via shot peening. Mater. Lett. 2018, 215, 187–190. [Google Scholar]
- Bandar, A.; Jenn-Ming, Y. Improving the surface quality and mechanical properties by shot-peening of 17-4 stainless steel fabricated by additive manufacturing. Mater. Des. 2016, 110, 914–924. [Google Scholar]
- Benjamin, G.; Etienne, P.; Franck, M.; Catherine, V. A non-local approach to model the combined effects of forging defects and shot-peening on the fatigue strength of a pearlitic steel. Theor. Appl. Fract. Mech. 2018, 93, 19–32. [Google Scholar]
- Bandar, A.; Jenn-Ming, Y. Integration of heat treatment with shot peening of 17-4 stainless steel fabricated by direct metal laser sintering. JOM 2017, 11, 2309–2313. [Google Scholar]
- Segurado, E.; Belzunce, F.J.; Fernández-Pariente, I. Effects of low intensity shot peening treatments applied with different types of shots on the fatigue performance of a high-strength steel. Surf. Coat. Technol. 2018, 340, 25–35. [Google Scholar] [CrossRef]
- Valiev, R.Z.; Estrin, Y.; Horita, Z.; Langdon, T.G.; Zechetbauer, M.J.; Zhu, Y.T. Producing bulk ultra-fine-grained materials by severe plastic deformation. JOM 2006, 58, 33–39. [Google Scholar] [CrossRef]
- Qin, L.Y.; Lian, J.S.; Jiang, Q. Effect of grain size on corrosion behavior of electrodeposited bulk nanocrystalline Ni. Trans. Nonferr. Met. Soc. China 2010, 20, 82–89. [Google Scholar] [CrossRef]
- Youssef, K.M.S.; Koch, C.C.; Fedkiw, P.S. Improved corrosion behavior of nanocrystalline zinc produced by pulse-current electrodeposition. Corros. Sci. 2004, 46, 51–64. [Google Scholar] [CrossRef]
- Kim, H.S.; Bush, M.B. The effects of grain size and porosity on the elastic modulus of nanocrystalline materials. Nanostruct. Mater. 1999, 11, 361–367. [Google Scholar] [CrossRef]
- Suryanarayana, C. The structure and properties of nanocrystalline materials: Issues and concerns. JOM 2002, 54, 24–27. [Google Scholar] [CrossRef]
- Wang, Z.B.; Tao, N.R.; Li, S.; Wang, W.; Liu, G.; Luc, J.; Lua, K. Effect of surface nanocrystallization on friction and wear properties in low carbon steel. Mater. Sci. Eng. 2003, 352, 144–149. [Google Scholar] [CrossRef]
- Vasheghani Farahani, M.; Emadoddin, E.; Emamyb, M.; Honarbakhsh Raouf, A. Effect of grain refinement on mechanical properties and sliding wear resistance of extruded Sc-free 7042 aluminum alloy. Mater. Des. 2014, 54, 361–367. [Google Scholar] [CrossRef]
- Li, G.; Chen, J.; Guan, D. Friction and wear behaviors of nanocrystalline surface layer of medium carbon steel. Tribol. Int. 2010, 43, 2216–2221. [Google Scholar] [CrossRef]
- Palacios, M.; Bagherifard, S.; Guagliano, M.; Fernández Pariente, I. Influence of severe shot peening on wear behaviour of an aluminium alloy. Fatigue Fract. Eng. Mater. Struct. 2014, 37, 821–829. [Google Scholar] [CrossRef]
- Bagherifard, S.; Guagliano, M. Fatigue behavior of a low-alloy steel with nanostructured surface obtained by severe shot peening. Eng. Fract. Mech. 2012, 81, 56–68. [Google Scholar] [CrossRef]
- Bagherifard, S.; Fernández Pariente, I.; Ghelichi, R.; Guagliano, M. Fatigue properties of nanocrystallized surfaces obtained by high energy shot peening. Procedia Eng. 2010, 2, 1683–1690. [Google Scholar] [CrossRef]
- Bagherifard, S.; Fernandez Pariente, I.; Ghelichi, R.; Guagliano, M. Effect of severe shot peening on microstructure and fatigue strength of cast iron. Int. J. Fatigue 2014, 65, 64–70. [Google Scholar] [CrossRef]
- Tian, J.W.; Villegas, J.C.; Yuan, W.; Fielden, D.; Shaw, L.; Liaw, P.K.; Klarstrom, D.L. A study of the effect of nanostructured surface layers on the fatigue behaviors of a C-2000 superalloy. Mater. Sci. Eng. A 2007, 468, 164–170. [Google Scholar] [CrossRef]
- Wang, L.; Lin, Y.; Zeng, Z.; Liu, W.; Xue, Q.; Hu, L.; Zhang, J. Electrochemical corrosion behavior of nanocrystalline Co coatings explained by higher grain boundary density. Electrochim. Acta 2007, 52, 4342–4350. [Google Scholar] [CrossRef]
- Wang, L.; Zhang, J.; Gao, Y.; Xue, Q.; Hua, L.; Xu, T. Grain size effect in corrosion behavior of electrodeposited nanocrystalline Ni coatings in alkaline solution. Scr. Mater. 2006, 55, 657–660. [Google Scholar] [CrossRef]
- Gleiter, H. Nanocrystalline materials. Prog. Mater. Sci. 1989, 33, 223–315. [Google Scholar] [CrossRef]
- Tai, K.; Dillon, S.J. Scaling effects on grain boundary diffusivity; Au in Cu. Acta Mater. 2013, 61, 1851–1861. [Google Scholar] [CrossRef]
- Lu, K.; Sui, M.L. Thermal expansion behaviors in nanocrystalline materials with a wide grain size range. Acta Metall. Mater. 1995, 43, 3325–3332. [Google Scholar] [CrossRef]
- Jang, J.S.C.; Koch, C.C. The hall-petch relationship in nanocrystalline iron produced by ball milling. Scr. Metall. Mater. 1990, 24, 1599–1604. [Google Scholar] [CrossRef]
- Fecht, H.J.; Hellstern, E.; Fu, Z.; Johnson, W.L. Nanocrystalline metals prepared by high-energy ball milling. Metall. Mater. Trans. A 1990, 21, 2333–2337. [Google Scholar] [CrossRef]
- Moelle, C.H.; Fecht, H.J. Thermal stability of nanocrystalline iron prepared by mechanical attrition. Nanostruct. Mater. 1995, 6, 421–424. [Google Scholar] [CrossRef]
- Yin, J.; Umemoto, M.; Liu, Z.G.; Tsuchiya, K. Formation mechanism and annealing behavior of nanocrystalline ferrite in pure Fe fabricated by ball milling. ISIJ Int. 2001, 41, 1389–1396. [Google Scholar] [CrossRef]
- Heilmann, P.; Clark, W.A.T.; Rigney, D.A. Orientation determination of subsurface cells generated by sliding. Acta Metall. 1983, 31, 1293–1305. [Google Scholar] [CrossRef]
- Hughes, D.A.; Dawson, D.B.; Korellis, J.S.; Weingarten, L.I. A microstructurally based method for stress estimates. Wear 1995, 181, 458–468. [Google Scholar] [CrossRef]
- Jiang, X.P.; Wang, X.Y.; Li, J.X.; Li, D.Y.; Manc, C.S.; Shepard, M.J.; Zhai, T. Enhancement of fatigue and corrosion properties of pure Ti by sandblasting. Mater. Sci. Eng. A 2006, 429, 30–35. [Google Scholar] [CrossRef]
- Wang, X.Y.; Li, D. Mechanical and electrochemical behavior of nanocrystalline surface of 304 stainless steel. Electrochim. Acta 2002, 47, 3939–3947. [Google Scholar] [CrossRef]
- Tao, N.R.; Sui, M.L.; Lu, J.; Lua, K. Surface nanocrystallization of iron induced by ultrasonic shot peening. Nanostruct. Mater. 1999, 11, 433–440. [Google Scholar] [CrossRef]
- Liu, G.; Lu, J.; Lu, K. Surface nanocrystallization of 316L stainless steel induced by ultrasonic shot peening. Mater. Sci. Eng. A 2000, 286, 91–95. [Google Scholar] [CrossRef]
- Wu, X.; Tao, N.; Hong, Y.; Xu, B.; Lu, J.; Lu, K. Microstructure and evolution of mechanically-induced ultrafine grain in surface layer of AL-alloy subjected to USSP. Acta Mater. 2002, 50, 2075–2084. [Google Scholar] [CrossRef]
- Bagherifard, S.; Fernandez Pariente, I.; Ghelichi, R.; Guagliano, M. Fatigue behavior of notched steel specimens with nanocrystallized surface obtained by severe shot peening. Mater. Des. 2013, 45, 497–503. [Google Scholar] [CrossRef]
- Bagherifard, S.; Slawik, S.; Fernandez Pariente, I.; Pauly, C.; Mücklich, F.; Guagliano, M. Nanoscale surface modification of AISI 316L stainless steel by severe shot peening. Mater. Des. 2016, 102, 68–77. [Google Scholar] [CrossRef]
- Guagliano, M.; Vergani, L. An approach for prediction of fatigue strength of shot peened components. Eng. Fract. Mech. 2004, 71, 501–512. [Google Scholar] [CrossRef]
- Colombo, C.; Guagliano, M.; Vergani, L. Fatigue crack growth behaviour of nitrided and shot peened specimens. SID 2005, 1, 253–265. [Google Scholar]
- J443: Procedures for Using Standard Shot Peening Almen test Strip; SAE Interational: New York, NY, USA, 2010.
- Umemoto, M.; Todaka, Y.; Tsuchiya, K. Formation of nanocrystalline structure in steels by air blast shot peening. Mater. Trans. 2003, 44, 1488–1493. [Google Scholar] [CrossRef]
- Bagherifard, S.; Guagliano, M. Review of shot peening processes to obtain nanocrystalline surfaces in metal alloys. Surf. Eng. 2009, 25, 3–14. [Google Scholar] [CrossRef]
- Umemoto, M. Nanocrystallization of steels by severe plastic deformation. Mater. Trans. 2003, 44, 1900–1911. [Google Scholar] [CrossRef]
- Dai, K.; Shaw, L. Comparison between shot peening and surface nanocrystallization and hardening processes. Mater. Sci. Eng. A 2007, 463, 46–53. [Google Scholar] [CrossRef]
- Kirk, D.; Abyaneh, M.Y. Theoretical basis of shot peening coverage control. Shot Peener 1999, 9, 28–30. [Google Scholar]
- Bagherifard, S.; Ghelichi, R.; Guagliano, M. On the shot peening surface coverage and its assessment by means of finite element simulation: A critical review and some original developments. Appl. Surf. Sci. 2012, 259, 186–194. [Google Scholar] [CrossRef]
- Unal, O.; Varol, R. Almen intensity effect on microstructure and mechanical properties of low carbon steel subjected to severe shot peening. Appl. Surf. Sci. 2014, 290, 40–47. [Google Scholar] [CrossRef]
- Noyan, I.C.; Cohen, J.B. Residual Stress Measurement by Diffraction and Interpretation; Springer: New York, NY, USA, 1987. [Google Scholar]
- Sadegh, P.A.; Ali-Reza, K.R.; Abolfazl, B. Surface nanocrystallization and gradient microstructural evolutions in the surface layers of 321 stainless steel alloy treated via severe shot peening. Vacuum 2017, 144, 152–159. [Google Scholar]
- Fernández-Pariente, I.; Bagherifard, S.; Guagliano, M.; Ghelichi, R. Fatigue behavior of nitrided and shot peened steel with artificial small surface defects. Eng. Fract. Mech. 2013, 103, 2–9. [Google Scholar] [CrossRef]
Figure 1.
Surface microstructure of 39NiCrMo steel after shot peening treatment (1000×): (a) CSP (100% coverage), (b) SSP5 (5000% coverage), and (c) SSP10 (10,000% coverage).
Figure 1.
Surface microstructure of 39NiCrMo steel after shot peening treatment (1000×): (a) CSP (100% coverage), (b) SSP5 (5000% coverage), and (c) SSP10 (10,000% coverage).
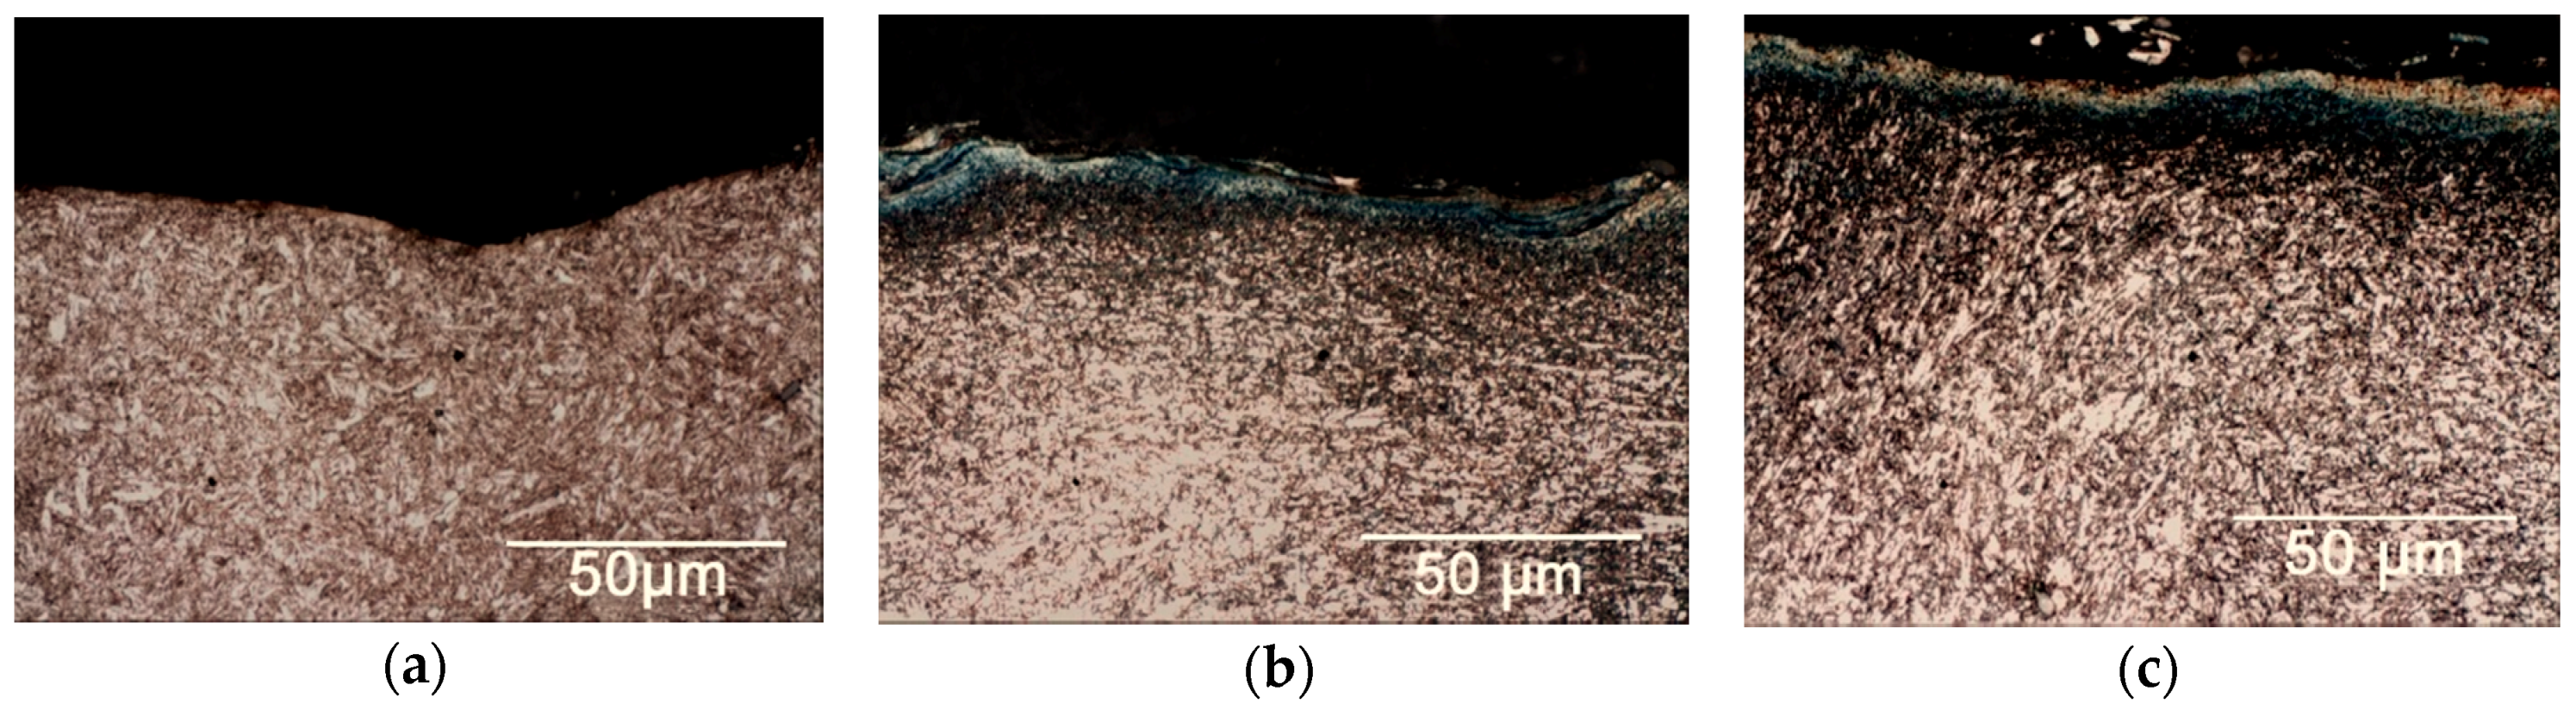
Figure 2.
Grain size evolution in shot peened samples with a misorientation of >15°, a scan area of 400 × 30 μm2, and a step size of 200 nm. The inset is corresponding to an 8 × 6 μm area scanned with a step size of 25 nm. The arrows are indicating the shot peening direction. (a) CSP, (b) SSP5, and (c) SSP10.

Figure 3.
Inverse pole figure (IPF) of shot peened samples with a misorientation of >15°, a scan area of 400 × 30 μm2, and a step size of 200 nm. The arrows are indicating the shot peening direction, (a) CSP, (b) SSP5, and (c) SSP10.
Figure 3.
Inverse pole figure (IPF) of shot peened samples with a misorientation of >15°, a scan area of 400 × 30 μm2, and a step size of 200 nm. The arrows are indicating the shot peening direction, (a) CSP, (b) SSP5, and (c) SSP10.
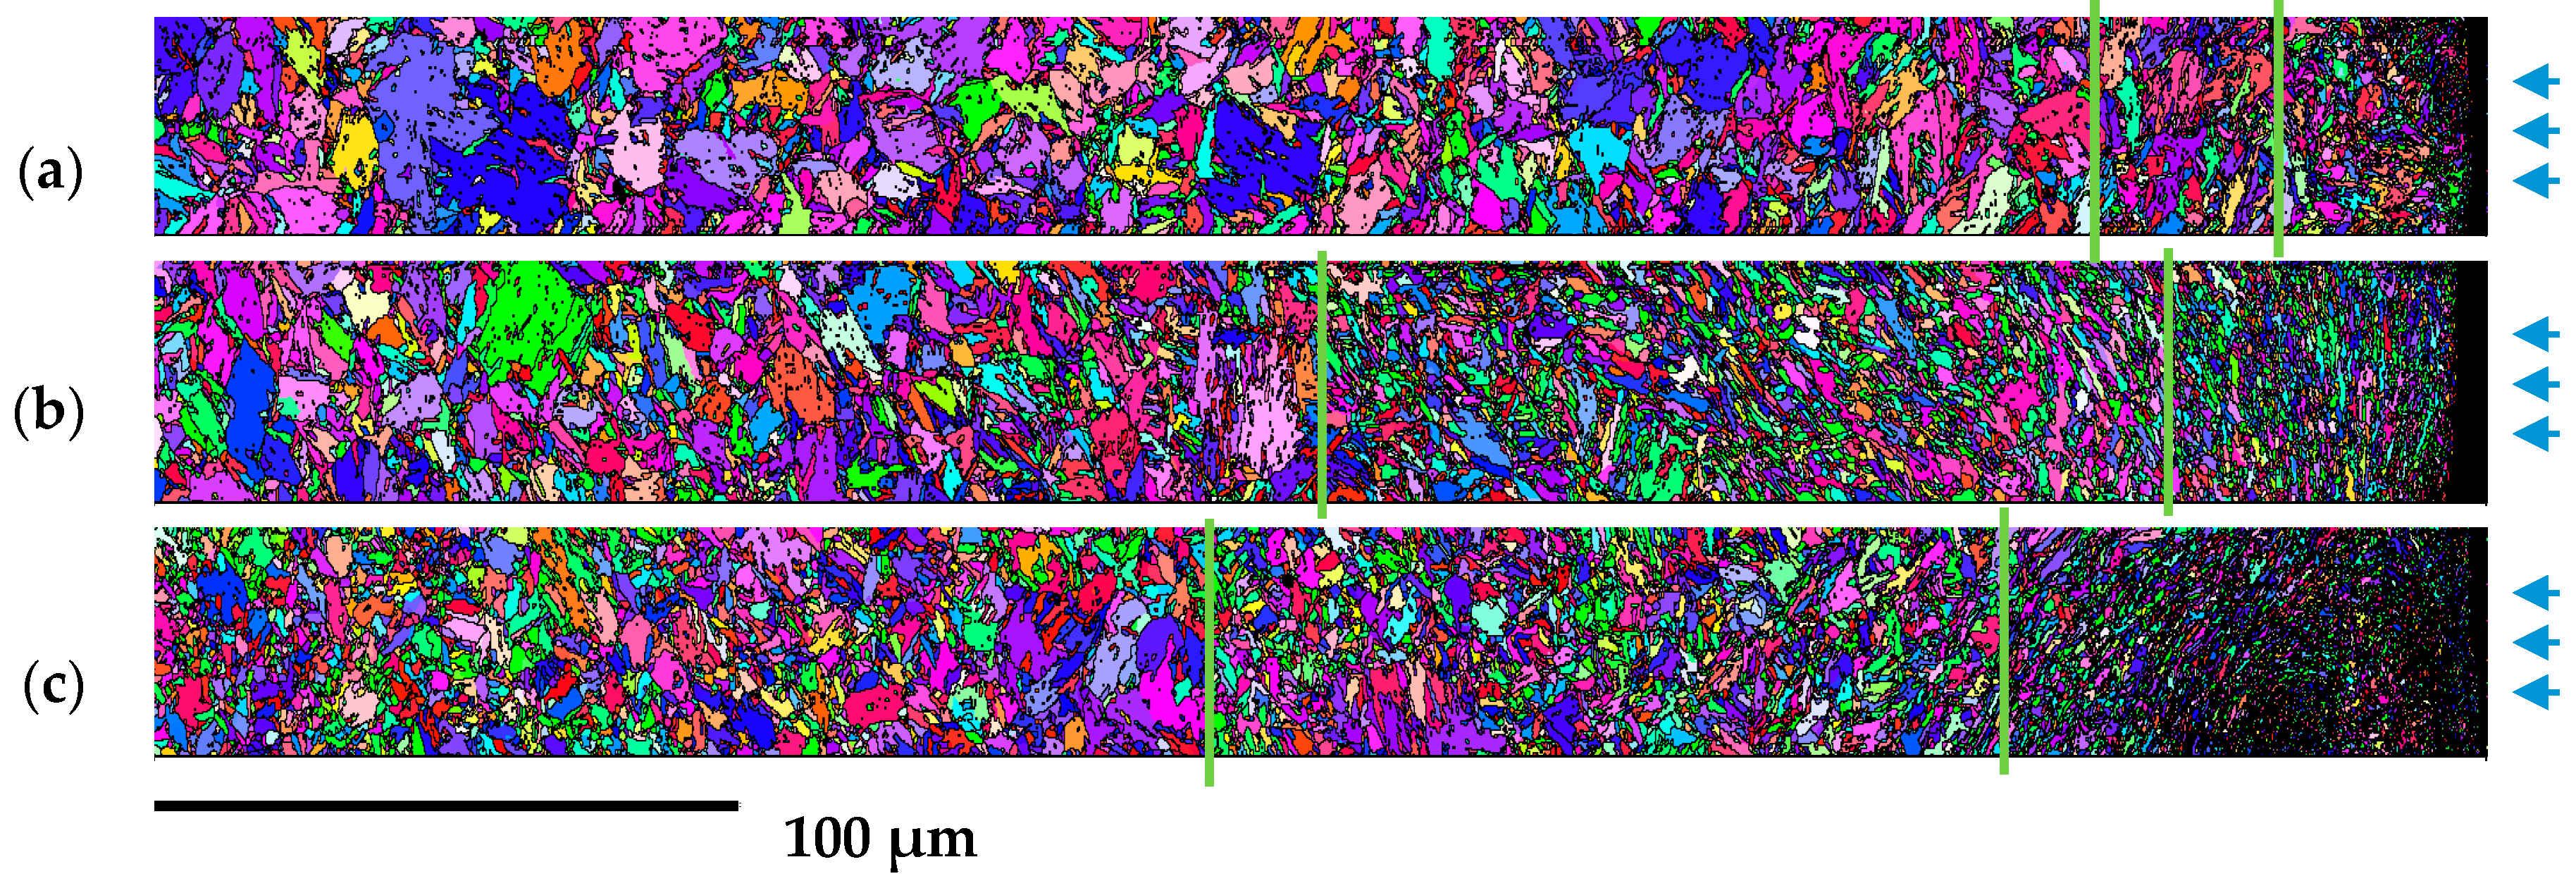
Figure 4.
Microhardness trend of CSP, SSP5, and SSP10 samples.
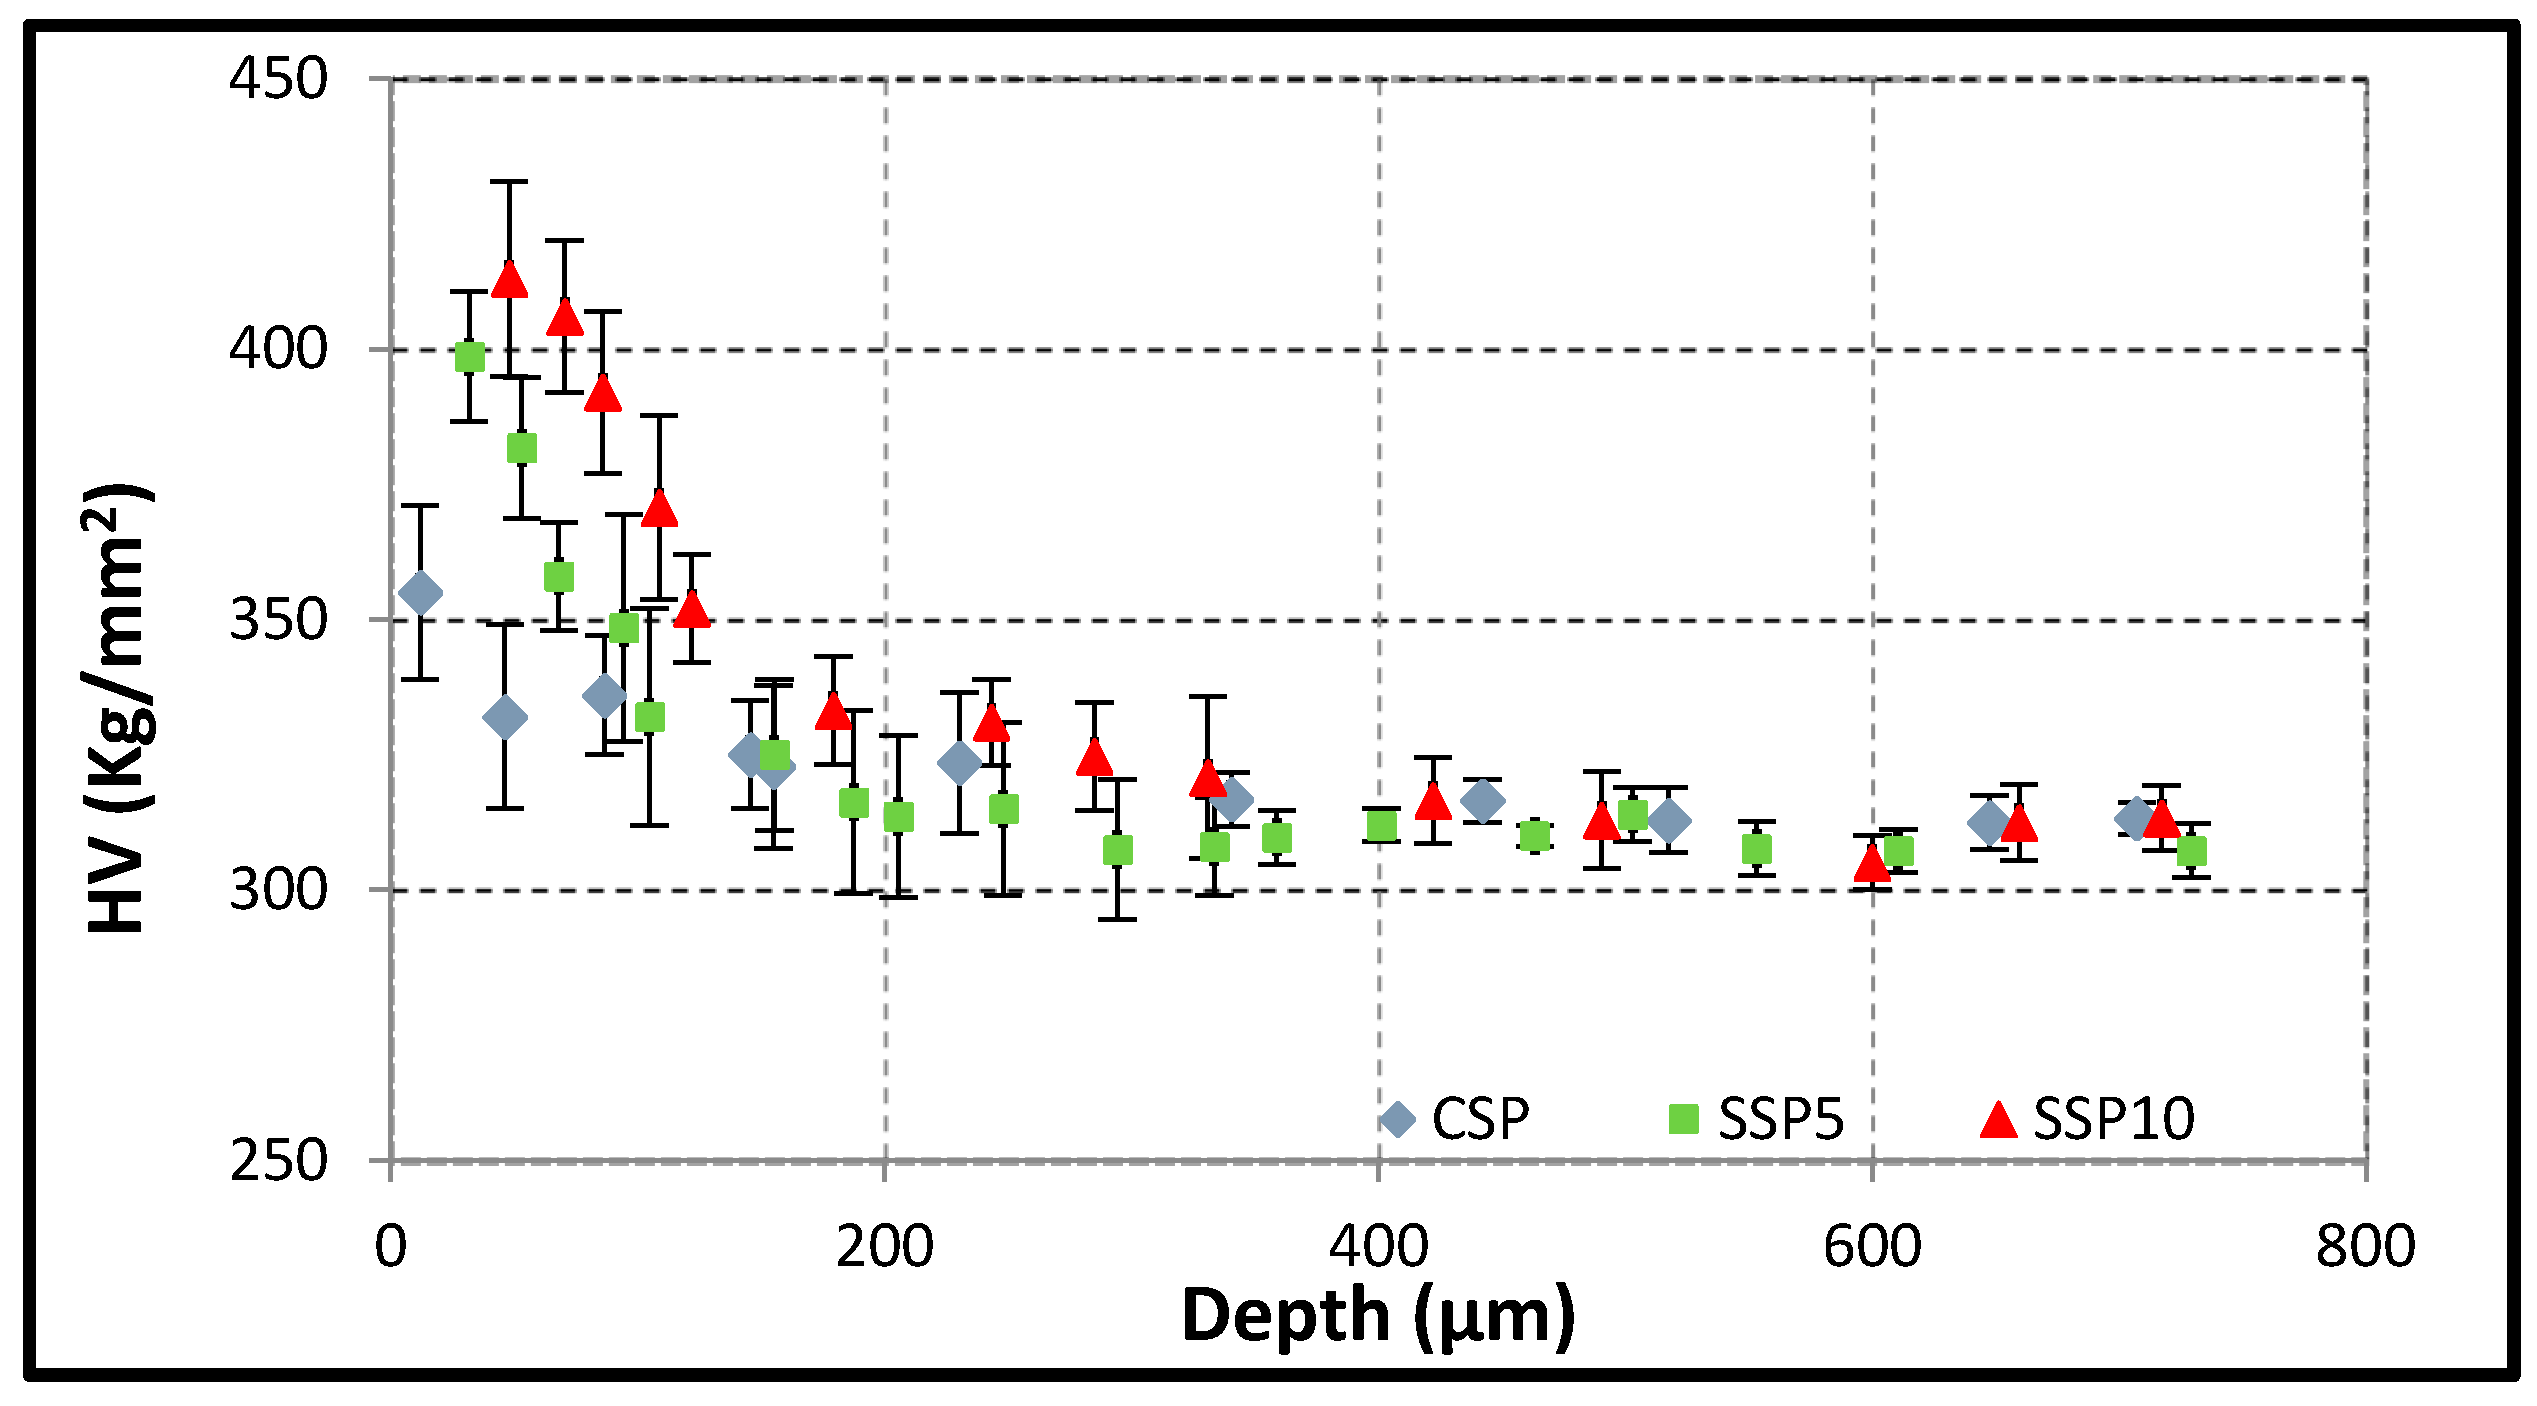
Figure 5.
(a) Residual stress and (b) Full Width at Half Maximum trend for CSP, SSP5, and SSP10 samples.
Figure 5.
(a) Residual stress and (b) Full Width at Half Maximum trend for CSP, SSP5, and SSP10 samples.


Table 1.
Nominal chemical composition 39NiCrMo3 steel (wt %).
| C | Mn | P | S | Cr | Si | Mo | Ni | |||||
|---|---|---|---|---|---|---|---|---|---|---|---|---|
| min | max | min | Max | Max | Max | min | Max | max | min | max | min | max |
| 0.35 | 0.43 | 0.50 | 0.80 | 0.025 | 0.035 | 0.60 | 1.00 | 0.4 | 0.15 | 0.25 | 0.70 | 1.00 |
Table 2.
Roughness values of samples submitted to different shot peening treatments.
| Series | Coverage (%) | Ra (μm) | Rz (μm) | Rmax (μm) |
|---|---|---|---|---|
| CSP | 100 | 5.84 ± 0.50 | 27.94 ± 2.62 | 34.30 ± 4.01 |
| SSP5 | 5000 | 7.05 ± 0.89 | 33.75 ± 3.31 | 44.37 ± 5.81 |
| SSP10 | 10,000 | 6.58 ± 0.51 | 31.71 ± 2.47 | 44.83 ± 8.41 |
Table 3.
Grain size distribution of treated sample surfaces calculated from the inset images of Figure 2.
Table 3.
Grain size distribution of treated sample surfaces calculated from the inset images of Figure 2.
| Serie | Coverage (%) | Average Grain Size in Surface Layer (μm) | Max. Diameter (μm) | Total Number of Grains |
|---|---|---|---|---|
| CSP | 100 | 0.292 ± 0.471 | 3.9398 | 346 |
| SSP5 | 5000 | 0.28 ± 0.363 | 3.6772 | 477 |
| SSP10 | 10,000 | 0.185 ± 0.182 | 1.9633 | 752 |
© 2018 by the authors. Licensee MDPI, Basel, Switzerland. This article is an open access article distributed under the terms and conditions of the Creative Commons Attribution (CC BY) license (http://creativecommons.org/licenses/by/4.0/).
Share and Cite
MDPI and ACS Style
González, J.; Peral, L.-B.; Colombo, C.; Fernández Pariente, I. A Study on the Microstructural Evolution of a Low Alloy Steel by Different Shot Peening Treatments. Metals 2018, 8, 187. https://doi.org/10.3390/met8030187
AMA Style
González J, Peral L-B, Colombo C, Fernández Pariente I. A Study on the Microstructural Evolution of a Low Alloy Steel by Different Shot Peening Treatments. Metals. 2018; 8(3):187. https://doi.org/10.3390/met8030187
Chicago/Turabian StyleGonzález, Juan, Luis-Borja Peral, Chiara Colombo, and Ines Fernández Pariente. 2018. "A Study on the Microstructural Evolution of a Low Alloy Steel by Different Shot Peening Treatments" Metals 8, no. 3: 187. https://doi.org/10.3390/met8030187
Note that from the first issue of 2016, this journal uses article numbers instead of page numbers. See further details here.