Study of the Heat-Treatments Effect on High Strength Ductile Cast Iron Welded Joints
by
 ,
,
Ronny M. Gouveia
1, 
Francisco J. G. Silva
1,*,
Olga C. Paiva
1,
Maria F. Andrade
1,
Luiz Silva
1,2,
Paulo C. Moselli
2 and
Konrad J. M. Papis
3 1
ISEP—School of Engineering, Polytechnic of Porto, 4249-015 Porto, Portugal
2
Campus de Cornélio Procópio, UTFPR—Universidade Tecnológica Federal do Paraná, Cornélio Procópio, PR 86300-000, Brazil
3
Georg Fischer Automotive A.G., 8200 Schaffhausen, Switzerland
*
Author to whom correspondence should be addressed.
Metals 2017, 7(9), 382; https://doi.org/10.3390/met7090382
Submission received: 12 August 2017
/
Revised: 13 September 2017
/
Accepted: 13 September 2017
/
Published: 19 September 2017
Abstract
:Nowadays, ultimate tensile strengths above 400 MPa become usual for ductile irons, thus allowing the implementation of new design paradigms. Large concentrations of carbon and other influencing elements can negatively interfere with the welding process of ductile cast irons. Efforts made by researchers have led to the discovery of solutions which enable good enough operational results to consider welding as a viable repairing or joining method. Although these alloys have been available for quite some time, researchers have mainly focused on issues relating to microstructural phenomena tied to casting and similar processes, leaving much to explore in terms of their weldability. Thus, this work intends to investigate the effect of different heat-treatments on the weldability of a high strength ductile cast iron by assessing the mechanical properties of welded joints as well as structural modifications induced by thermal cycles imposed before and after welding. Successful weld joints were achieved showing a clear heat affected zone (HAZ) close to the joint area. This area is coincident with the fracture area of the welded samples when loaded on a tensile test bench, having obtained promising results regarding mechanical strength and strain. The hardness of the welded zone was also carefully investigated, showing clear changes throughout the joint.
1. Introduction
Ductile cast irons (DCI), also known as nodular cast irons or spheroidal graphite irons, are widely used in complex shaped structural parts that need to obey simultaneously to specific requirements such as high mechanical strength, high fatigue resistance, wear resistance and ease of castability [1,2,3,4,5]. A compilation of a few interesting properties of cast irons can be found in [5,6,7]. Indeed, DCIs allow combining some interesting properties seen in grey cast irons (such as very good castability) with additional properties presented by other cast steels (e.g., grey cast iron and compacted graphite iron), namely toughness. This set of properties allows the creation of parts with similar characteristics to those made with other cast irons but with the added bonus of having high performance mechanical properties. These properties depend mainly on the iron’s chemical composition, inoculation method, ferrite content of the matrix, size and shape of the graphite nodules, among others [8]. The relation between properties and microstructure for DCIs and other cast irons is investigated in [9]. Some heat treatments such as austempering, carried out after the casting process, can increase mechanical properties (such as mechanical strength and fatigue resistance) of certain DCIs, having given rise to the Austempered Ductile Irons (ADIs) (extensive literature about these kinds of cast irons can be seen in [10,11,12,13,14]). The heat treatments usually applied to ADIs are properly described in [15] and related sources. A specific structure combined with the proper heat treatment confer to ADIs a unique set of properties that relate to acicular ferrite and high carbon residual austenite, usually called ausferrite [16]. Several studies about ADIs structure have been carried out, as described by Chaengkham and Srichandr [17]. More recently, some high-strength and ultra-high-strength ductile cast irons have been developed based on solid solution strengthened ductile iron, mainly to satisfy the increasingly demanding requirements set by the automotive industry [18]. Improvements regarding mechanical characteristics (when compared to aluminum alloys) and search for decreasing overall weight of parts relatively to other ferrous alloys are the mains drivers for these advances.
It is well-known that weldability of the DCIs depends on several factors, namely the chemical composition of parent materials and filler metals used, mechanical properties, type of microstructure, adopted welding process and working conditions [19]. DCIs usually present high amounts of carbon in their structure, which diffuses and promotes the formation of austenite during welding operations, allowing the appearance of brittle phases in the joint’s interface [20]. Indeed, DCIs usually present carbon equivalents between 2.0% and 4.0% [21]. Furthermore, welding of DCI alloys is somewhat uncommon due to their well-known poor weldability [1]. However, welding processes may be used to repair machining errors, casting defects in areas with no functionally requirements, existing cracks in large components such as engine blocks or even hard to replace broken parts [2].
Several arc welding technologies have been successfully used to join DCIs, such as Manual Shielded Metal Arc Welding (SMAW), Flux Cored Arc Welding (FCAW), Gas Metal Arc Welding (GMAW), Gas Tungsten Arc Welding (GTAW) and Laser Welding (LW) [2,19], as well as Oxyacetylene Welding (OAW). As one of the main reasons for welding ductile cast irons is usually to perform repairs, as opposed to being a construction method, parts presenting casting defects such as cracks/fissures or shrinkages in non-functional areas can be easily repaired by the use of welding. SMAW is one of the most utilized method for welding DCIs [22] and is an ideal candidate for this application, mainly for allowing easier maneuverability and access of welding electrodes (essential factor for performing repairs). It is also one of the most common and economical methods of welding in the industry. Furthermore, highly productive or automated welding processes such as GMAW and FCAW are not advantageous to perform arbitrary and interrupted tasks such as repairs. Other methods such as GTAW, although being able to promote higher quality weld finishes (which may be considered of low importance for cast parts), have a higher heat input during welding, which is highly detrimental to cast irons by promoting the appearance of brittle microstructures such as martensite and ledeburite. However, welding processes must be used under some restrictions, as the structure of DCIs tends to change during the solidification process, with the formation of martensite mainly in the Heat Affected Zone (HAZ), iron carbides in the interface between the weld bead and parent metal [23] and very hard ledeburite in the Partially Melt Zone (PMZ) [19]. The appearance of such structures negatively affects mechanical properties of the joint and gives rise to a higher probability of crack formation, as described by other authors [24,25,26,27]. Even when using Nickel-iron alloys as a filler metal, these authors found that grey cast irons still demonstrated poor weldability due to the formation of hard/brittle iron carbides in the PMZ as well as due to the high carbon and carbon equivalent content present in the iron’s structure (which may be the main cause of the formation of hard phases in the HAZ and weld interface during the cooling process).
Regarding the welding of DCI, there are mainly three types of alloys considered suitable as filler metals: cast iron filler metal, Ni filler metal and Ni-Fe filler metal alloy [19]. Likewise, mild steel is sometimes considered as suitable mainly due to its reduced cost, but due to different contraction coefficients, mild steel shrinks more than cast iron during the solidification process, generating residual stress in the weld interface [19]. Experiences carried out by Pascual et al. [23] allow observing that the use of cast-iron as a filler metal gave rise to the worse mechanical properties when welding DCIs using SMAW or OAW technologies, while Ni-Fe and Ni alloys led to the best results in terms of mechanical resistance as well as ensuring good strain values and a non-fragile behavior [23].
Heat treatments are the most used method to avoid crack formation on DCIs during the solidification process, mainly pre-heating treatments and sometimes post welding heat treatment (PWHT). Other processes have also been implemented with success, such as buttering [22]. Usually, the selected pre-heating temperature depends on the chemical composition or carbon equivalent (CE) of the iron, which conditions the hardenability of the DCI [20]. Ebrahimnia et al. [26] achieved good results in terms of avoiding crack formation by performing a local pre-heat treatment with a temperature of 300 °C before welding large forming dies (found in presses for the production of vehicle body panels), as well as a PWHT 400–500 °C with different cooling rates when powder welding DCIs. On the other hand, El-Banna [20] tested four preheating temperatures (25 °C, 200 °C, 300 °C and 400 °C), concluding that the best range of temperatures for these types of irons is between 200 °C and 300 °C. Moreover, Bęczkowski [28] refers that the control of interpass temperatures (up to 300 °C) and pre-heating temperatures (up to 200 °C) promotes the quality of the welds when repairing massive castings. Special care regarding the duration of pre-heating treatments must be given to avoid martensite formation and prevent secondary graphite formation in multi-passes welds [20]. Moreover, special care is needed to closely match thermal coefficients of filler and parent metals to decrease stress formation during the solidification process. Askari-Paykani et al. [22] referred that when preheating is used for DCI welding, cooling conditions did not present a significant influence on the Ultimate Tensile Strength (UTS) value of the joined part. However, rapid cooling rates are known for increasing the probability of martensite appearance in the HAZ. According to Mandal [29] and Connor [30] cooling rates should never exceed 6 °C/s at 550 °C as this speed seems to promote satisfactory results for most steels. Cooling rates usually depend on many factors such as the thickness of the part to weld, welding speeds, pre-heating temperatures and interpass temperatures. Another important parameter that directly impacts the properties of the HAZ is the peak temperature achieved during welding, as the higher the peak temperatures achieved, the wider the HAZ area. Moreover, the hardness achieved in the Fusion Zone (FZ) is proportional to the martensite and bainite that is formed, the hardness obtained in the HAZ is proportional to the perlite and martensite generated and in the PMZ the hardness is proportional to the ledeburite and martensite created.
Thus, this work intends to evaluate the effects of heat treatments performed at different temperatures (by the implementation of thermal cycles before and/or after welding) on welded joints of a high-strength ductile cast iron (SiboDur® 450, similar to EN-GJS-450-10, following the DIN EN 1563:2012 standard) used in automotive industry, using SMAW as the joining process and Ni-Fe as a filler metal. It also intends to determine the mechanical properties of welded joints as well as observe changes in the iron’s microstructure, correlating the obtained results with the joint’s hardness profile.
2. Materials and Methods
The underlying goal of this study is to evaluate the effects that heat treatments may have on the mechanical properties of high strength ductile case iron welded joints. Heat treatments can be applied before or after welding and can impact performance differently. As heat treatments directly affect the mechanical properties of welded joints, the desired objective is to determine which type of treatment (pre, post or both) better approaches the mechanical strength of the joints to the original strength of the base material. This is achieved by keeping the welding parameters constant and varying the characteristics of the applied heat treatments. The effect of depositing nickel on the surface of the samples before joint welding was also tested.
To evaluate the mechanical properties of the welded samples, tensile tests were executed (following the standards shown ahead) to determine important properties such as UTS and strain at rupture. Other testing methods such as hardness and metallurgical analysis were carried out in an effort to understand what microstructural changes occurred after the application of these treatments.
2.1. High Strength Ductile Cast Iron
The material under investigation is a DCI commercially denominated as SiboDur® 450. Developed, patented and sold by Georg Fischer (GF) this cast iron seems to presents several appealing characteristics when compared to similar materials, such as: high tensile strength, good strain, and good fatigue resistance, among others.
Samples of the DCI were provided by GF in order to conduct this study. According to the supplied material data sheet, the main chemical composition of the tested batch was (wt %) C% 3.3–3.7, Si% 2.6–2.8, Mn% 0.05–0.3 and Cu% 0.05–0.3. Microstructurally, it presents a perlitic matrix with a ferrite content of ≤20% and a UTS value of 450 N/mm2 in the as-cast-state (without additional heat treatments). Several others material properties can be seen in Table 1 [18].
2.2. Sample Preparation
The raw material was received with the initial geometry seen in Figure 1a. The format of the test specimen shown in Figure 1b was devised to allow for the largest number of test specimens to be extracted from each bar of material. It is well-known that samples’ manufacturing process slightly affects the surface quality of the samples as well as the tensile strength properties (less than 5%) [31]. However, due to the geometry of the raw material, processes as Laser or Water-Jet were not the best way to produce the required samples.
The overall dimensions of the initial bars were 190 mm in length, while presenting three different diameters (Ø1 = 46 mm, Ø2 = 38 mm and Ø3 = 36 mm). A series of machining and cutting operations were executed to allow extracting a sum of nine test specimens from each bar. A total of 42 test specimens were machined to create 21 experimental samples.
The experimental samples consisted of a pair of test specimens welded together by their chamfered edge. The conditions in which the experimental samples were heat treated varied to determine how the quality of the welded joint was affected.
2.3. Heating Cycle Parameters
It was devised that there would be three possible heat treatment cycles that could be executed to an experimental sample: a pre-heating before welding, a PWHT or both. The first pre-heat cycle is meant to raise and homogenize sample temperatures before welding (be it before welding two samples together or before adding Nickel to the chamfered edge). The addition of Nickel to the edges of the test specimens (before joint welding) has the potential purpose of lowering the material’s microstructural carbon concentration at the chamfered area and potentially minimizing generation of defects. As the thickness of the test specimens was 4 mm, a pre-heat temperature of 300 °C for 2 h (illustrated in Figure 2) was sufficient to obtain a stable and uniform temperature throughout all test samples. As the distribution of the samples in the oven was not equal, samples in corner areas of the oven could perhaps have a different heating behavior than samples in the center of the oven, therefore a 2-h long treatment was chosen to positively guarantee that all samples achieved the same temperature at the end of the cycle.
The equipment utilized for this thermal procedure was a Nabertherm N 11/H muffle furnace (Nabertherm GmbH, Lilienthal, Germany). When possible, the test specimens subjected to heat treatments were heated simultaneously to ensure equal process conditions, optimizing equipment and energy utilization.
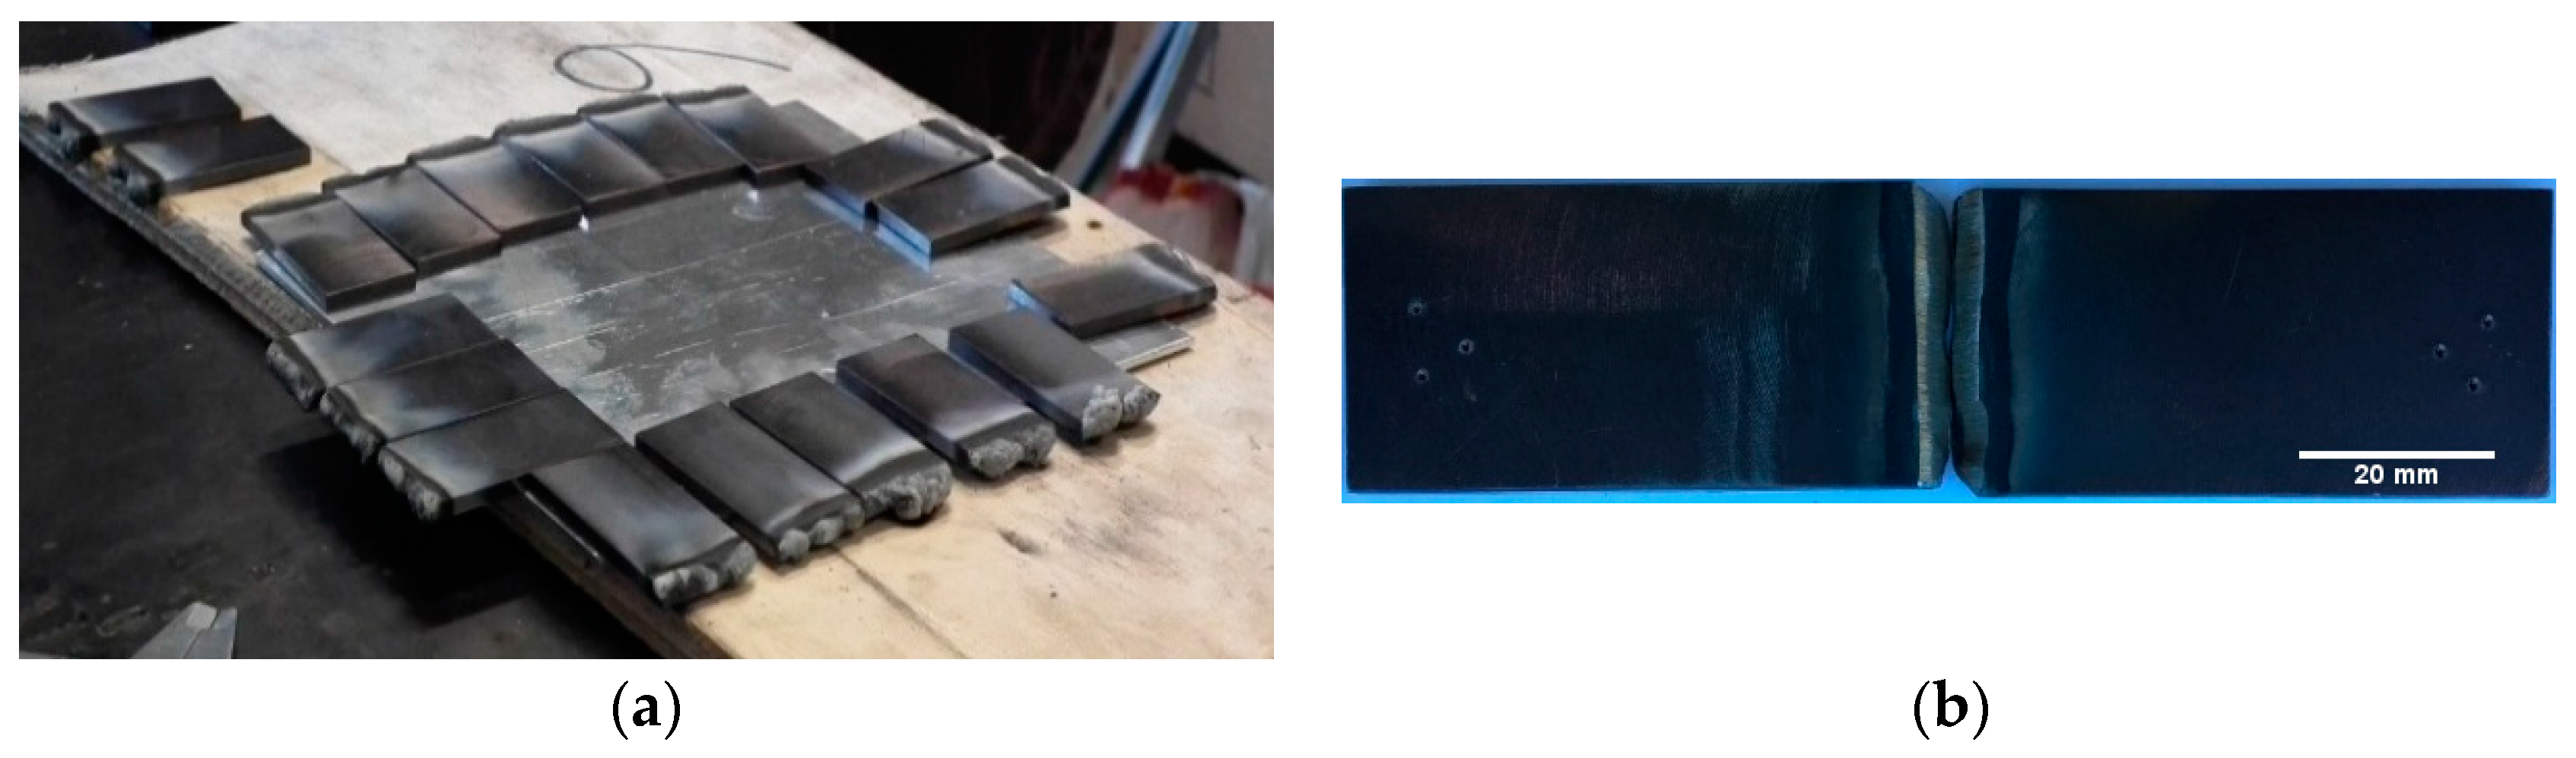
After the addition of Nickel to the chamfered surface of a few selected test specimens, a grinding operation was performed to remove any excess material (seen in Figure 3a) and restore the initial chamfered geometry (shown in Figure 3b). Obviously, to perform this step in a safer manner, it was necessary to allow the samples to cool to room temperature. Thereafter, before performing any additional welding passes, a second heat cycle was executed to, once again, raise and homogenize the temperature of the test specimens.
Parameters remained the same for the second heat cycle (2 h at 300 °C) for all experimental samples, except one set, where the temperature was raised to 700 °C for 2 h before welding. In Figure 4, it is possible to view a finished experimental sample consisting of two plates (test specimens) welded together by their chamfered edge.
Post-welding heat treatments were also applied to some test specimens at either 700 °C or 800 °C for the duration of two hours.
2.4. Welding Parameters
The welding technique chosen to create the experimental samples was SMAW, as it is considered the most suitable welding method to perform repairing tasks. This method allows easier electrode maneuverability, giving the welding technicians a higher degree of precision and versatility when performing repairs on complexed shaped components. Moreover, the recommended consumable material to weld these types of ductile cast iron (Inconel electrodes) is sold only in the form of covered electrode rods.
The welding machine used was an OERLIKON SAXOTIG 1600 welder (OERLIKON, Pfäffikon, Switzerland). The electrode rod chosen for the Nickel deposition procedure was an FN 10 electrode (reference AWS SFA 5.15: E Ni Cl) with a Nickel content of above 98% and 2.5 mm of diameter. A positive pole connection was used alongside with an amperage of 60 A (values recommended by electrode manufacturer). To join the metal plates an Inconel LR 82 (reference AWS SFA 5.11: E Ni Cr Fe-3) electrode with a diameter of 2.5 mm was chosen. Its chemical composition was (wt %) Ni+Co% 67 minimum; Cr% 16; Fe% 7; C% 0.04; Si% 0.4; Mn% 7.5; and Nb% 2. A positive pole connection was also utilized together with an amperage setting of 75 A. This amperage setting was the lowest value recommended by the manufacturer and was chosen by trial and error, creating a weld bead of moderate dimensions (seen in Figure 4). The travel speed used was kept in the range of 90–100 mm per minute, consistent with the speeds used in [19,22].
Three welded samples were produced for each set of testing parameters.
2.5. Weld Joint Analysis
As a joint is only as strong as its weakest link, the presence of defects greatly impacts the strength of a welded connection. Therefore, before testing, several inspection procedures were conducted to ensure defect free samples, thus guaranteeing that the experimental results truly represented the strength of the welded joint and are were not hindered by the presence of defects.
2.5.1. Visual Inspection
This non-destructive inspection method is the easiest of all methods as no special tools or equipment are required for its execution. Commonly performed by the welding operator, it is a first-tier inspection method and allows detecting the presence of large irregularities such of pores, cracks, lack of filling, excess material, overlapping material, misalignment, etc. ISO 17633 (2003) establishes the main guidelines for the execution of the test and suggests that the inspector should be at a distance of 150–600 mm from the welded joint and with a minimum illumination of 500 lux. In Figure 5, it is possible to observe a welded test sample. Based on this method, the sample seen in Figure 5 was accepted as sound and of good quality.
Samples that passed visual inspection were then subjected to other testing methodologies to ensure the absence of defects.
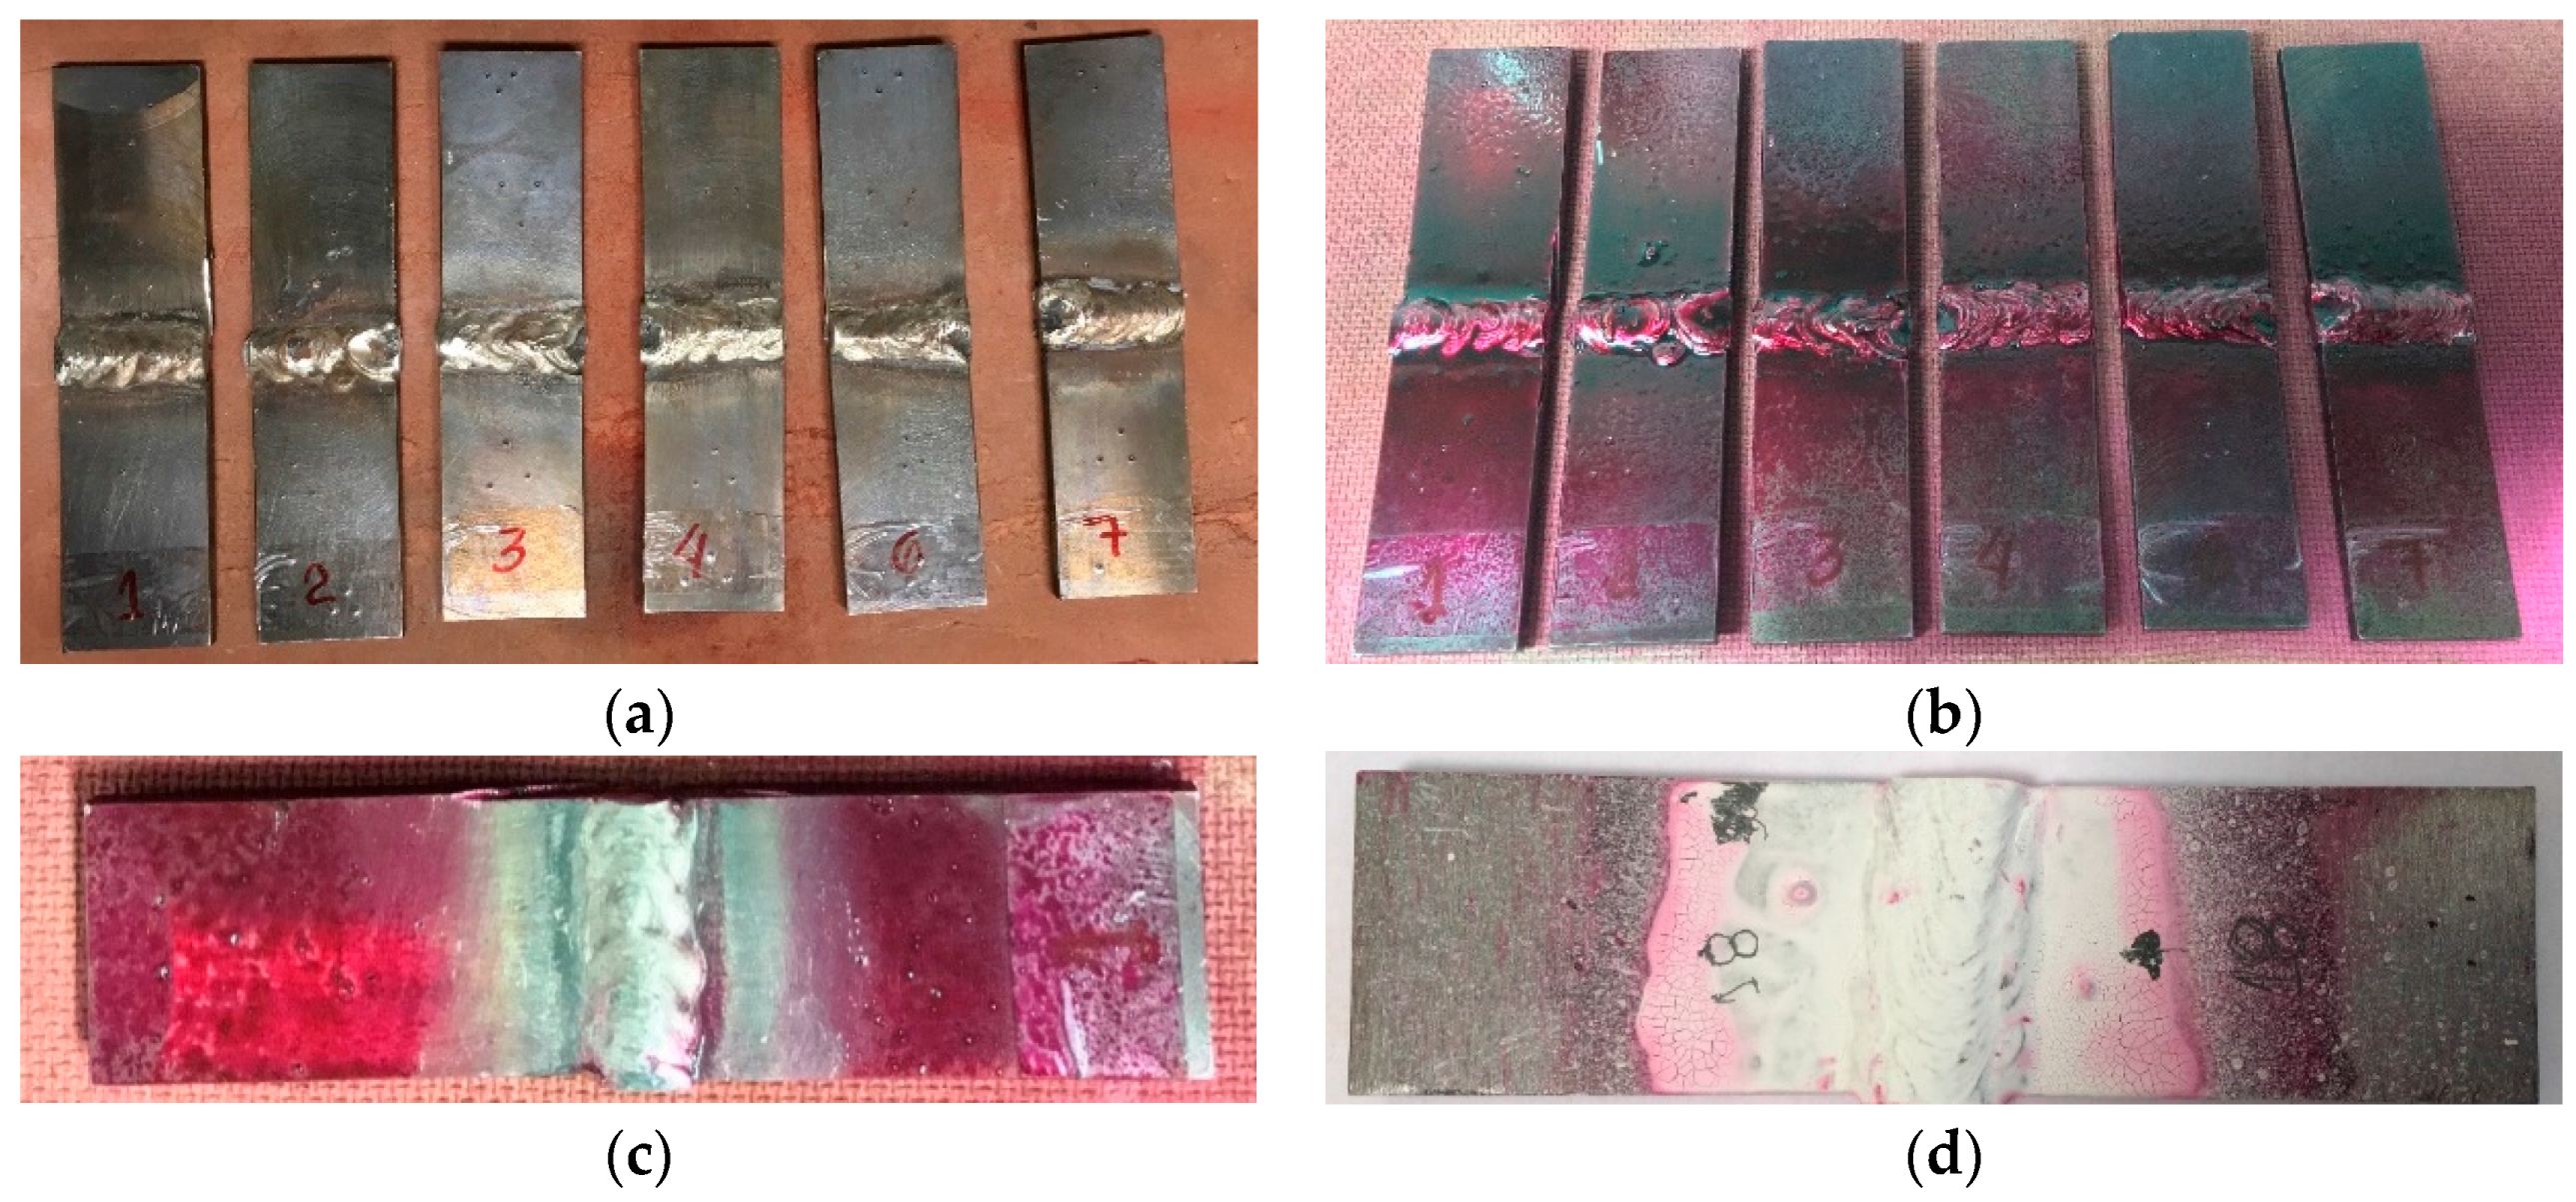
2.5.2. Penetrating Dye Testing
The welded samples that passed visual inspection were then subjected to a penetrating dye test in an effort to detect hidden superficial defects or discontinuities. Following the methodology given by the ISO 23277 (2015) standard, the test is based on the application of a penetrating dye and revealer to help highlight small surface defects.
Consisting of a three-step procedure, the first stage is to clean the samples with a solvent (reference CGM “Velnet-Solnet”-R. 2.60 cleaning solvent) to ensure the absence of grease and surface impurities (seen in Figure 6a). Afterwards, a penetrating dye spray (reference CGM “ROTVEL AVIO B”-R. 2.72) was applied to the surface and allowed to dry for 15 min (Figure 6b). The excess dye was then wiped from the surface, remaining trapped in areas of difficult access (Figure 6c). Finally, a revealer spray (reference CGM “ROTÍVEL U” “WHITE W”-R 2.82 revealing liquid) was applied to the surface and allowed to dry, highlighting the areas with trapped penetrating dye (as shown in Figure 6d). These areas may have defects such as cracks or pores that were not easily observable earlier.
Both penetrating dye and visual inspection methods merely allow evaluating surface defects, therefore internal defects cannot be detected by these procedures. Samples free of defects were subsequently submitted to magnetic particle testing to search for noticeable internal defects.
2.5.3. Magnetic Particle Testing
This testing method can only be applied to ferromagnetic materials and enables the detection of surface or below surface imperfections. The test equipment consisted of electromagnetic yokes, a current flowing equipment and ferritic magnetic particles. Following ISO 23278:2009 standard, the test procedure involved the deposit of ferrous magnetic particles on the samples surface and posteriorly the application of a magnetic field to rearrange these particles distribution. The rearrangement of these particles will help give indication of existing defects. An accumulation of particles in a certain region on the surface may indicate an enclosed pore or discontinuity that could not be seen through visual inspection. A uniform distribution of the particles throughout the surface indicates a uniform structure.
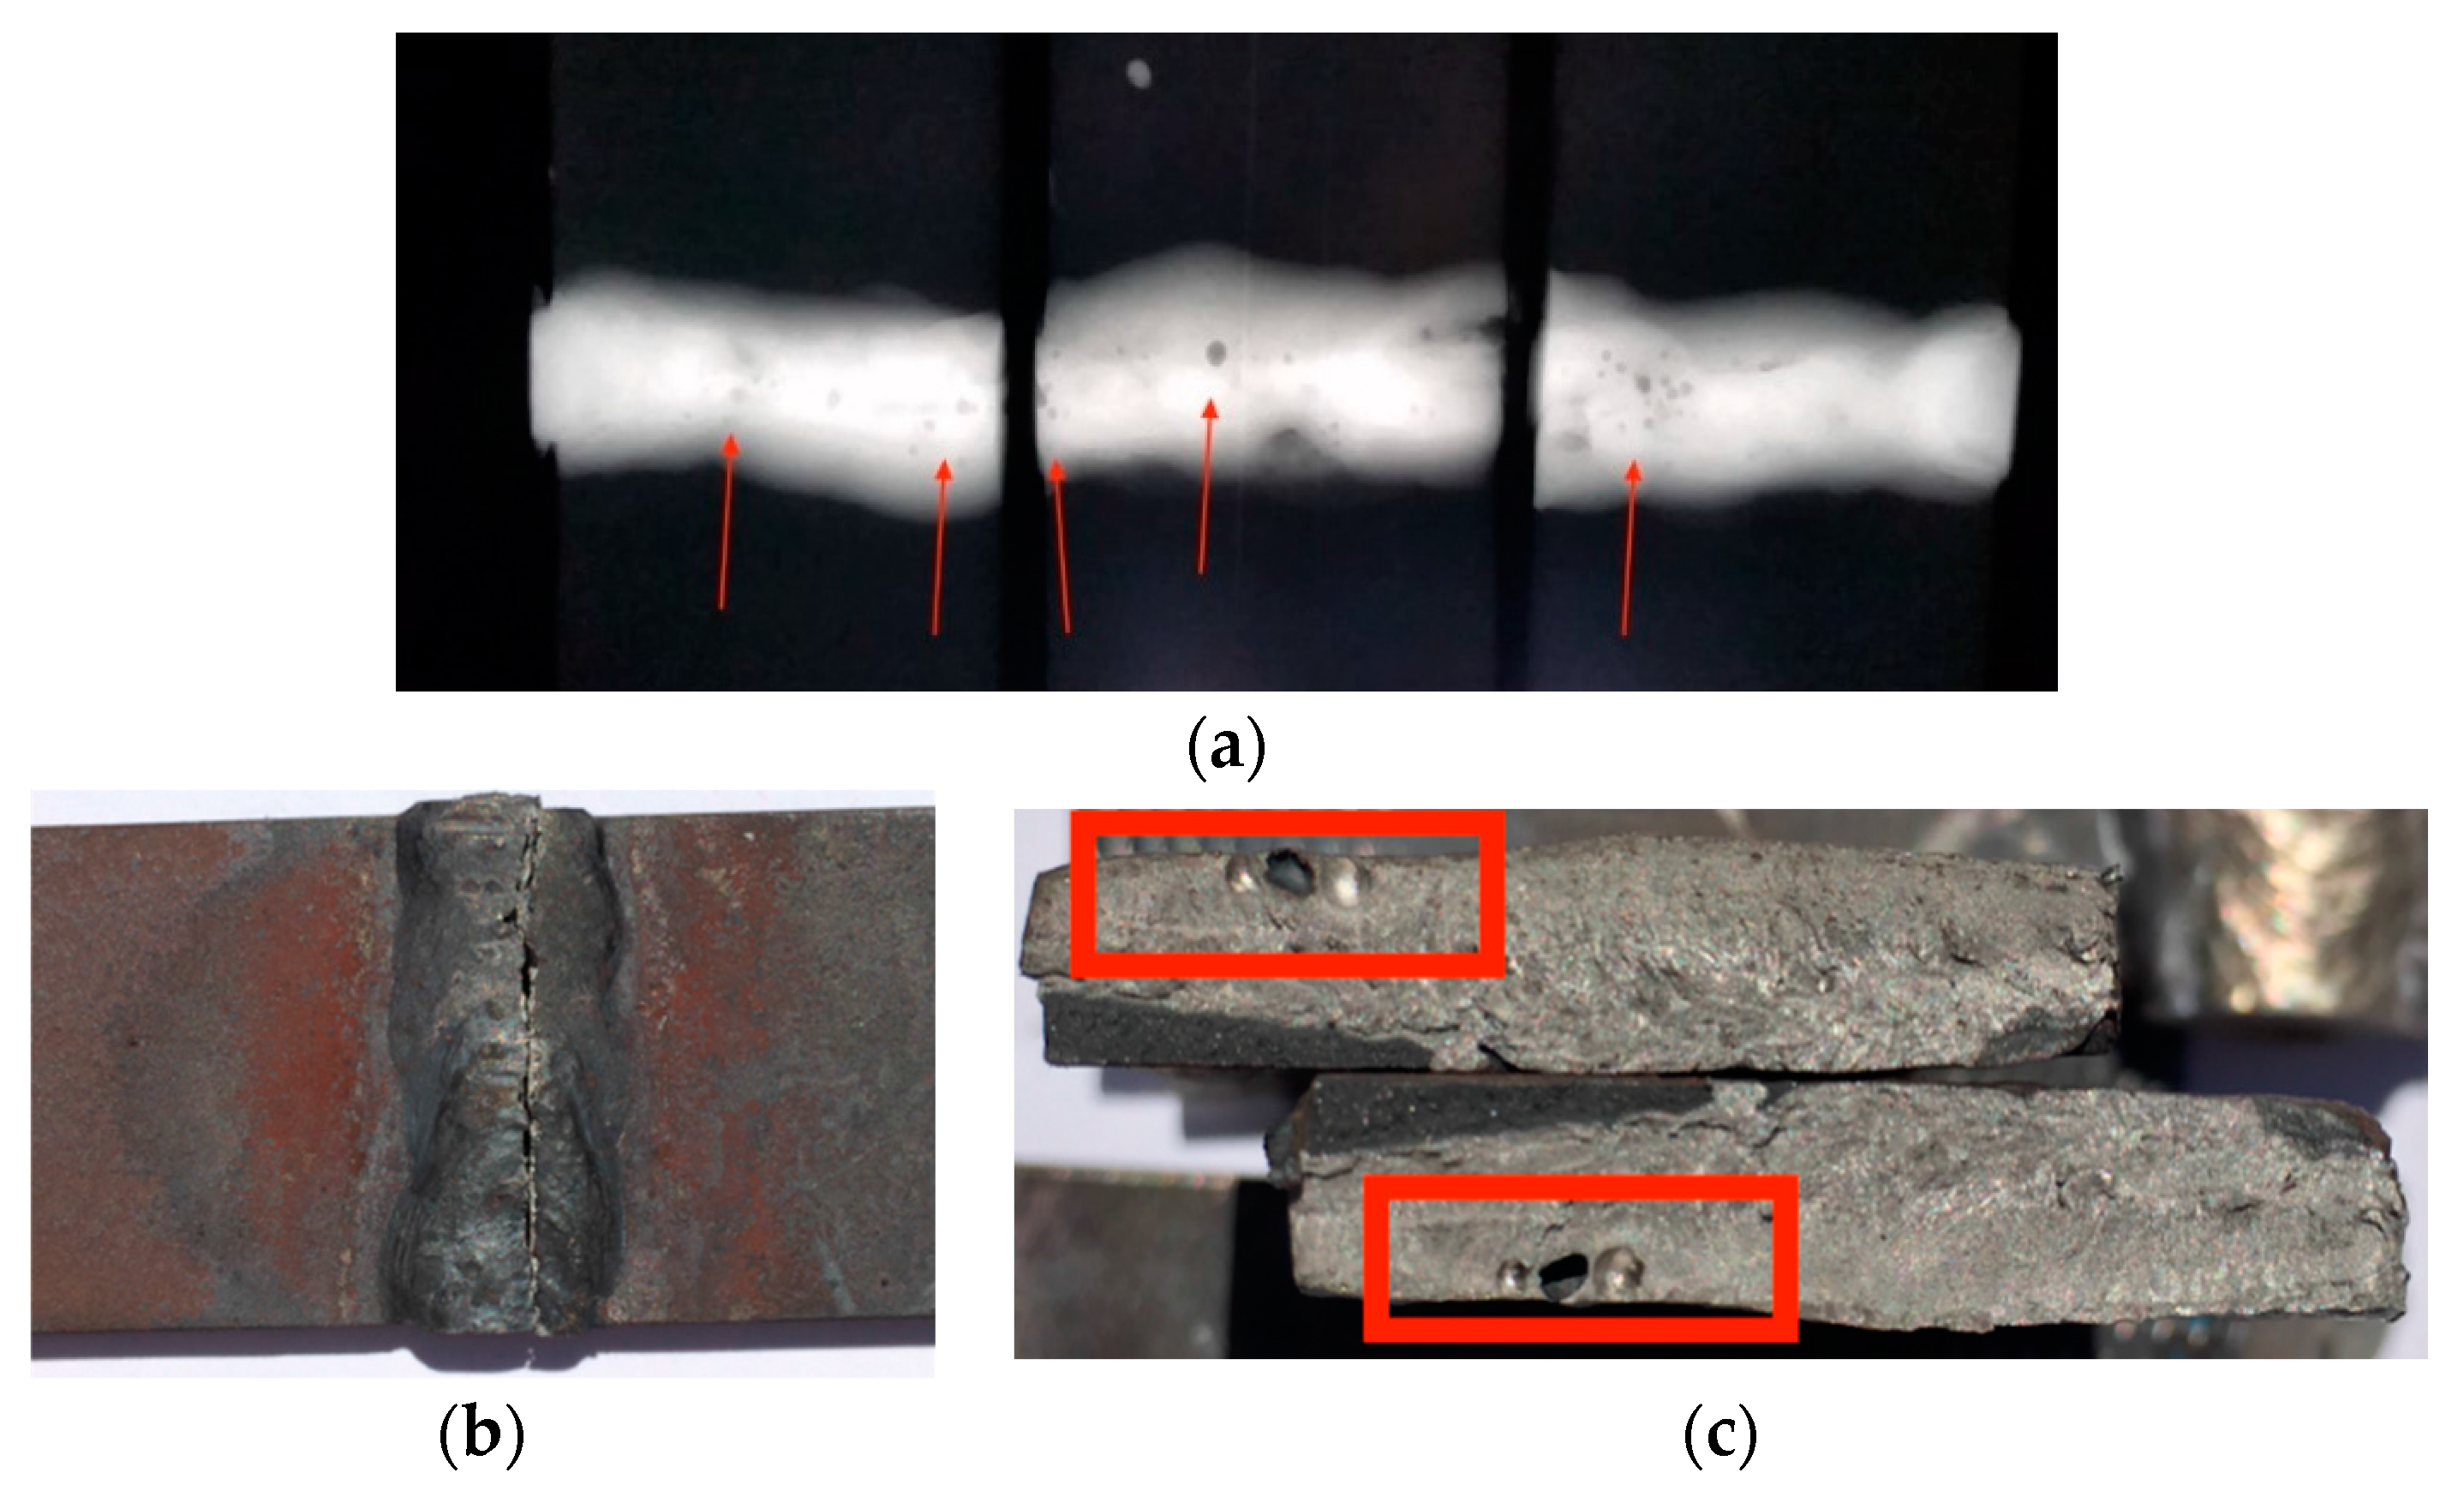
2.5.4. X-ray Inspection
In an effort to achieve the most reliable test results possible, an X-ray inspection was performed on each test specimen in order to rule out hidden defects such as pores or inclusions. The equipment used for this inspection was an ICM 300 kVA X-ray machine (Teledyneicm, Andrimont, Belgium). Samples presenting defects similar to the ones viewed in Figure 7a were considered unreliable and therefore rejected.
Figure 7b,c shows a sample that, despite having large pores, was subjected to a tensile test. The existence of pores clearly impacted the strength of the welded joint as the failure of the shown sample occurred in the weld bead area, coinciding with the existence of three large pores. This type of failure is the most undesirable in welded joints as it is very unpredictable. Samples that passed all of the previous non-destructive methods were considered viable to perform further destructive tests, thus ensuring the best possible outcome of results.
2.6. Sample Reference Coding
To determine the most favorable method to weld and heat treat the DCI in study, several different parameters were tested, such as the use of pre/post welding heating cycles, pre-addition of Nickel filler metal to chamfer edges before joint welding specimens and the number of executed weld passes.
As the amount of experimental samples necessary to contemplate all different parameters was considerably high (a total of 21), a coding sequence was created. Each experimental sample was identified with a reference name based on the following sequence:
where
CP_Px_N_Px_Wz_Py,
- CP—Sample number;
- x—Pre-heating cycle temperature (°C);
- y—Post welding heat treatment cycle temperature (°C);
- 1st P—First pre-weld heat cycle, at temperature x (x equal to zero if no heat cycle is used);
- N—Pre-addition of nickel to chamfered edge (N only appears when Nickel is used);
- 2nd P—Second pre-weld heat cycle, at temperature x (x equal to zero if no heat cycle is used);
- W—Welding having Inconel as filler material;
- z—Number of weld passes; and
- 3rd P—post-weld heat cycle, at temperature y (y equal to zero if no heat cycle is used).
Table 2 demonstrates the different welding and heat treatment parameters adopted for each set of samples.
2.7. Analysis of Mechanical and Metallurgical Properties
2.7.1. Tensile Properties
The objective of tensile testing is to evaluate the tensile properties of the samples. Tensile properties of the base metal, HAZ, PMZ and filler metal can all be simultaneously tested, which allows determining the weakest link. Therefore, testing was performed on a universal Shimadzu Autograph AGS-X-100 kN tensile machine (Shimadzu, Kyoto, Japan) equipped with a 100 kN load cell. Data acquisition was made via Trapezium computer software. Testing followed the ISO 4136 (2012) standard. Selected testing parameters were: 75 mm distance between clamps and a constant test speed of 2 mm/min until complete rupture. Strain was measured at the moment of rupture.
2.7.2. Metallographic Analysis
A metallographic analysis allows revealing features on a macro- and microscopic level, helping to determine and locate eventual microstructural changes that may have occurred during welding. It also makes possible to evaluate the homogeneity and quality of welded surfaces, as well as to view defects such as foreign inclusions, pores or cracks. Being a destructive testing method, several steps are needed to obtain an observable sample. These steps can be seen in Table 3.
Joint surfaces were then analyzed on a SEM microscope (scanning electron microscopy) equipped with an EDS (energy-dispersive X-ray spectroscopy) system. The equipment chosen was a FEI Quanta 400 FED SEM, using several different viewing magnifications (200×, 400×, 1000× and 2500×). A sample of base material (SiboDur® 450 in the as delivered state) was also analyzed on an OLYMPUS BX51M microscope (Olympus, Tokyo, Japan). Images of relevant microstructural features were recorded. All procedures were made following ISO 17639 (2003) international standard.
2.7.3. Hardness Analysis
This additional destructive testing method allowed plotting hardness profiles of the welded joints by measuring their surface hardness. Sample preparation is identical to the one used for metallographic analysis, therefore the same specimens were used for both analysis. Following the ISO 9015-1 (2001) standard, a row of indentations was performed (with a minimum distance between indentations of 0.7 mm) to determine the evolution of surface hardness throughout the welded joint, starting from the unaffected base metal from one side, crossing over the weld metal and HAZ areas, and finishing on the opposite side of unaffected base metal. An EMCO-TEST M4U 025G3 durometer (EMCO-TEST PRÜFMASCHINEN GMBH, Kuchl, Austria) was chosen for this procedure, equipped with a diamond tip pyramidical indenter (136° angle between faces).
Specimens that achieved the best results during the tensile testing were the ones selected for the metallography and hardness analysis.
3. Results
3.1. Tensile Test Results
The information retrieved from tensile tests is considered to be of utmost importance as it allows directly judging the quality of the joint, determine which set of parameters promotes the strongest connection and discover the weakest link in a joint. The obtained results can be seen in Table 4.
No relevant studies regarding the weldability of the chosen high strength DCI exist so no expectations could be had regarding the outcome of the trials. However, starting from the notion that welded joints usually have lower strength than the base material that is being joined, a UTS of 350 MPa or higher (corresponding roughly to 78% of the material’s original UTS of 450 MPa) was considered to be an acceptable and satisfactory value for a welded cast iron. Results below this threshold are seen as poor results with a drastic drop in mechanical strength when compared to the material’s original strength. However, this threshold corresponds to an own assumption and therefore should not be considered valid for all applications, being dependent on parameters such as the product’s design, application and safety parameters.
Therefore, results under 350 MPa were rejected as they did not satisfy the previous established rule. When looking at Table 4, this rule eliminates three sets of samples (“P0_W2”, “P0_W2_P800” and “P300_N_P700_W2_P0”). Table 5 summarizes this seriation of results.
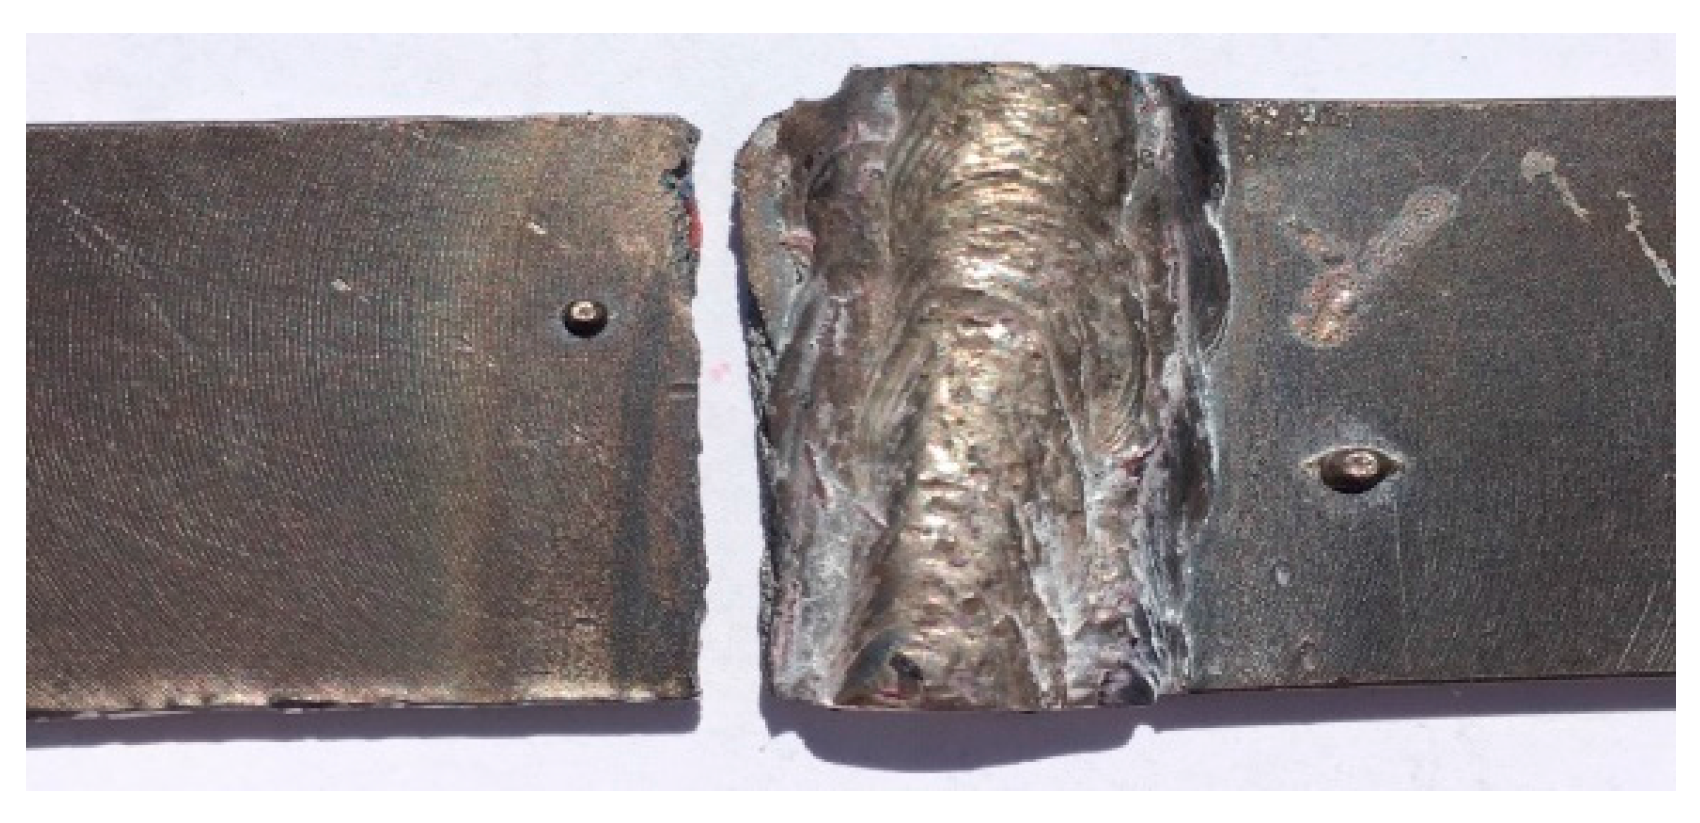
Regarding the accepted experimental samples, Figure 8 shows the most common type of joint failure found during the tensile testing, with rupture initiating in the HAZ area and propagating in through the base material.
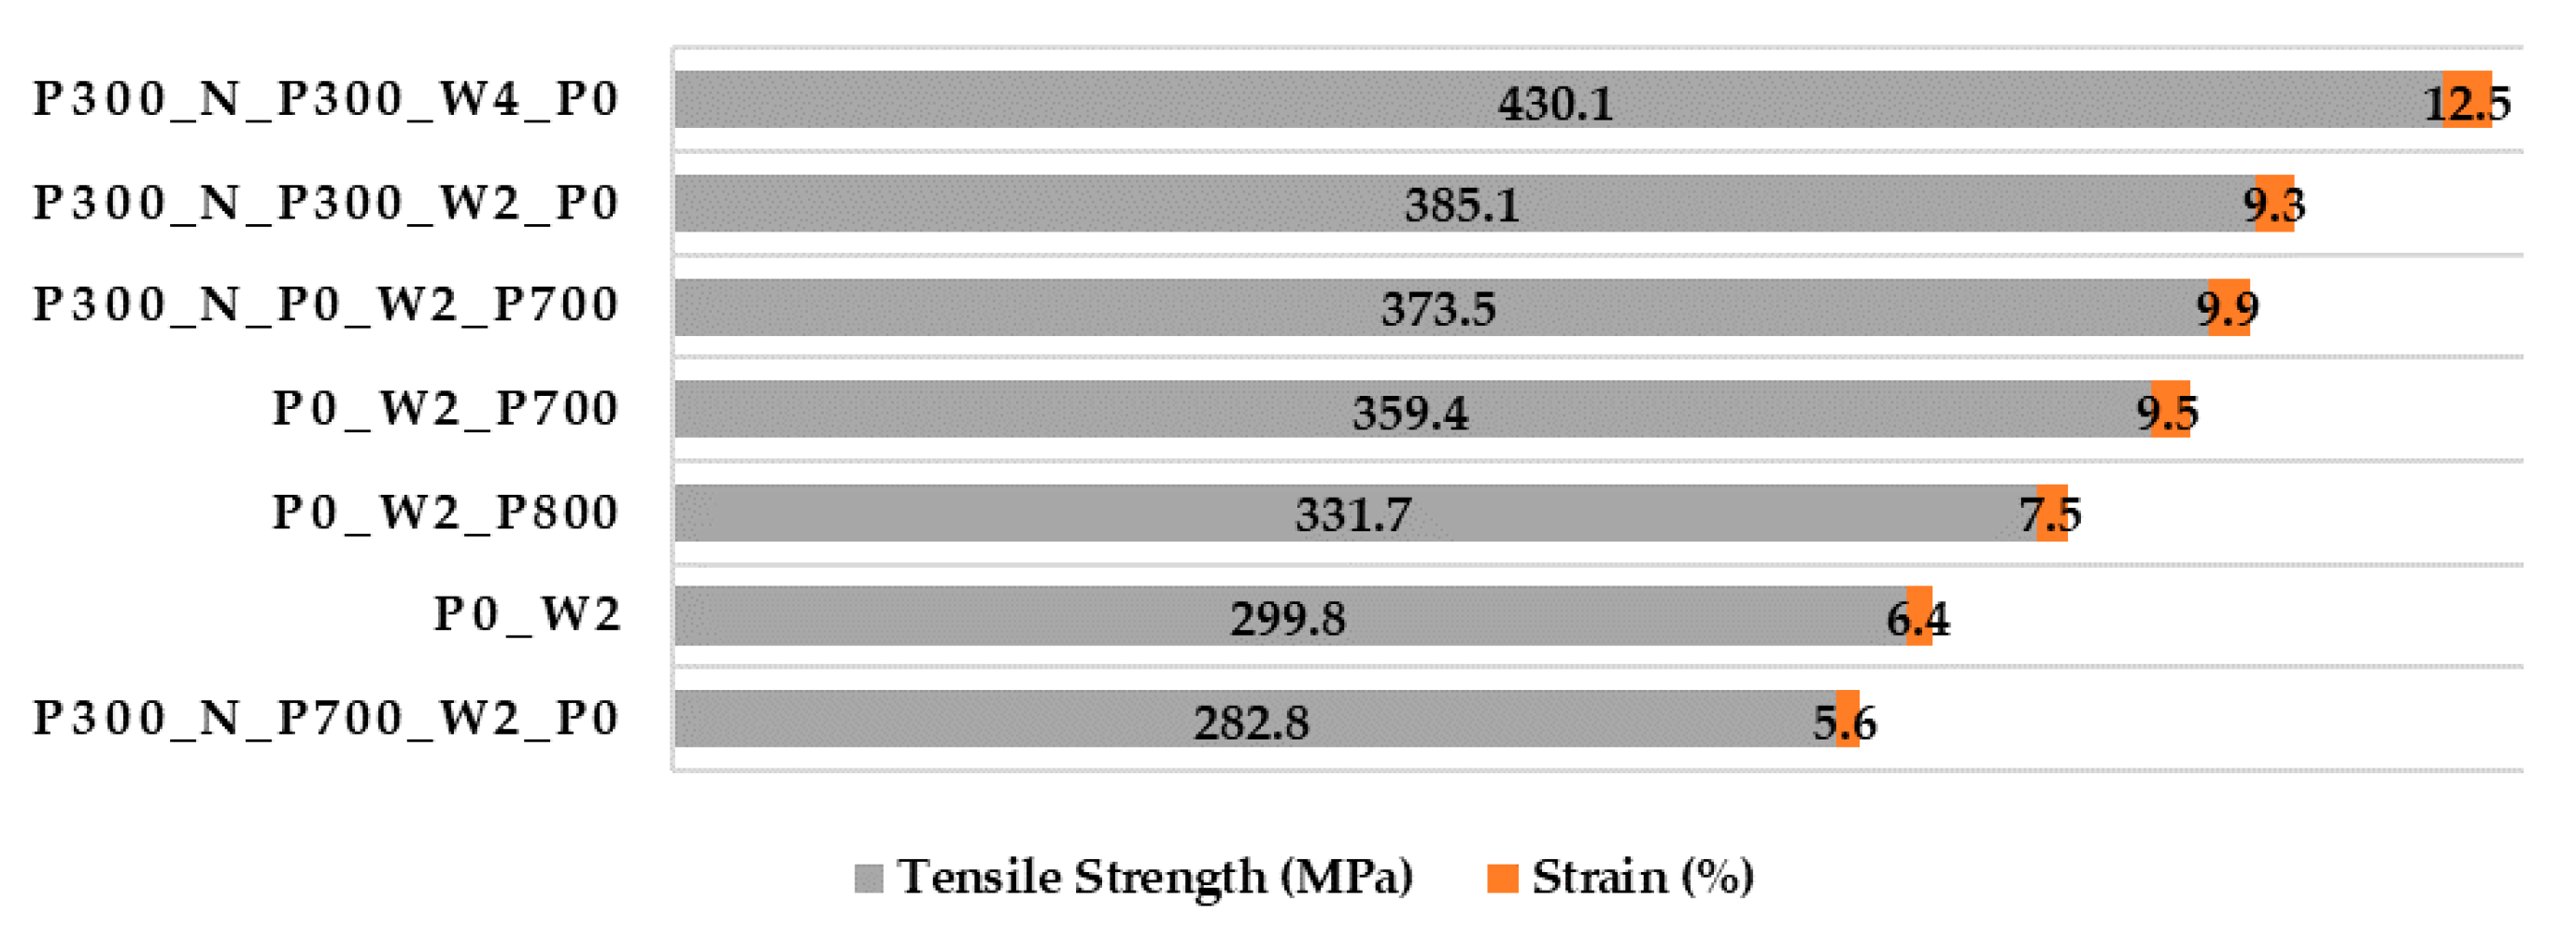
Samples from the P300_N_P700_W2_P0 group returned the lowest tensile strength from all tested samples, averaging approximately 282.8 MPa. The test specimens that achieved the best results were samples from the P300_N_P300_W4_P0 set of parameters, achieving an average tensile strength of 430.1 MPa. Average strain values are all below the value specified by the manufacturer (≥17%).
3.2. Metallography Analysis
Experimental samples that achieved the highest UTS values were chosen to be analyzed under the microscope. 09_P300_N_P300_W2_P0, 14_P300_N_P300_W4_P0 and 18_P300_N_P0_W2_P700 were selected, representing the first three groups shown in Table 5.
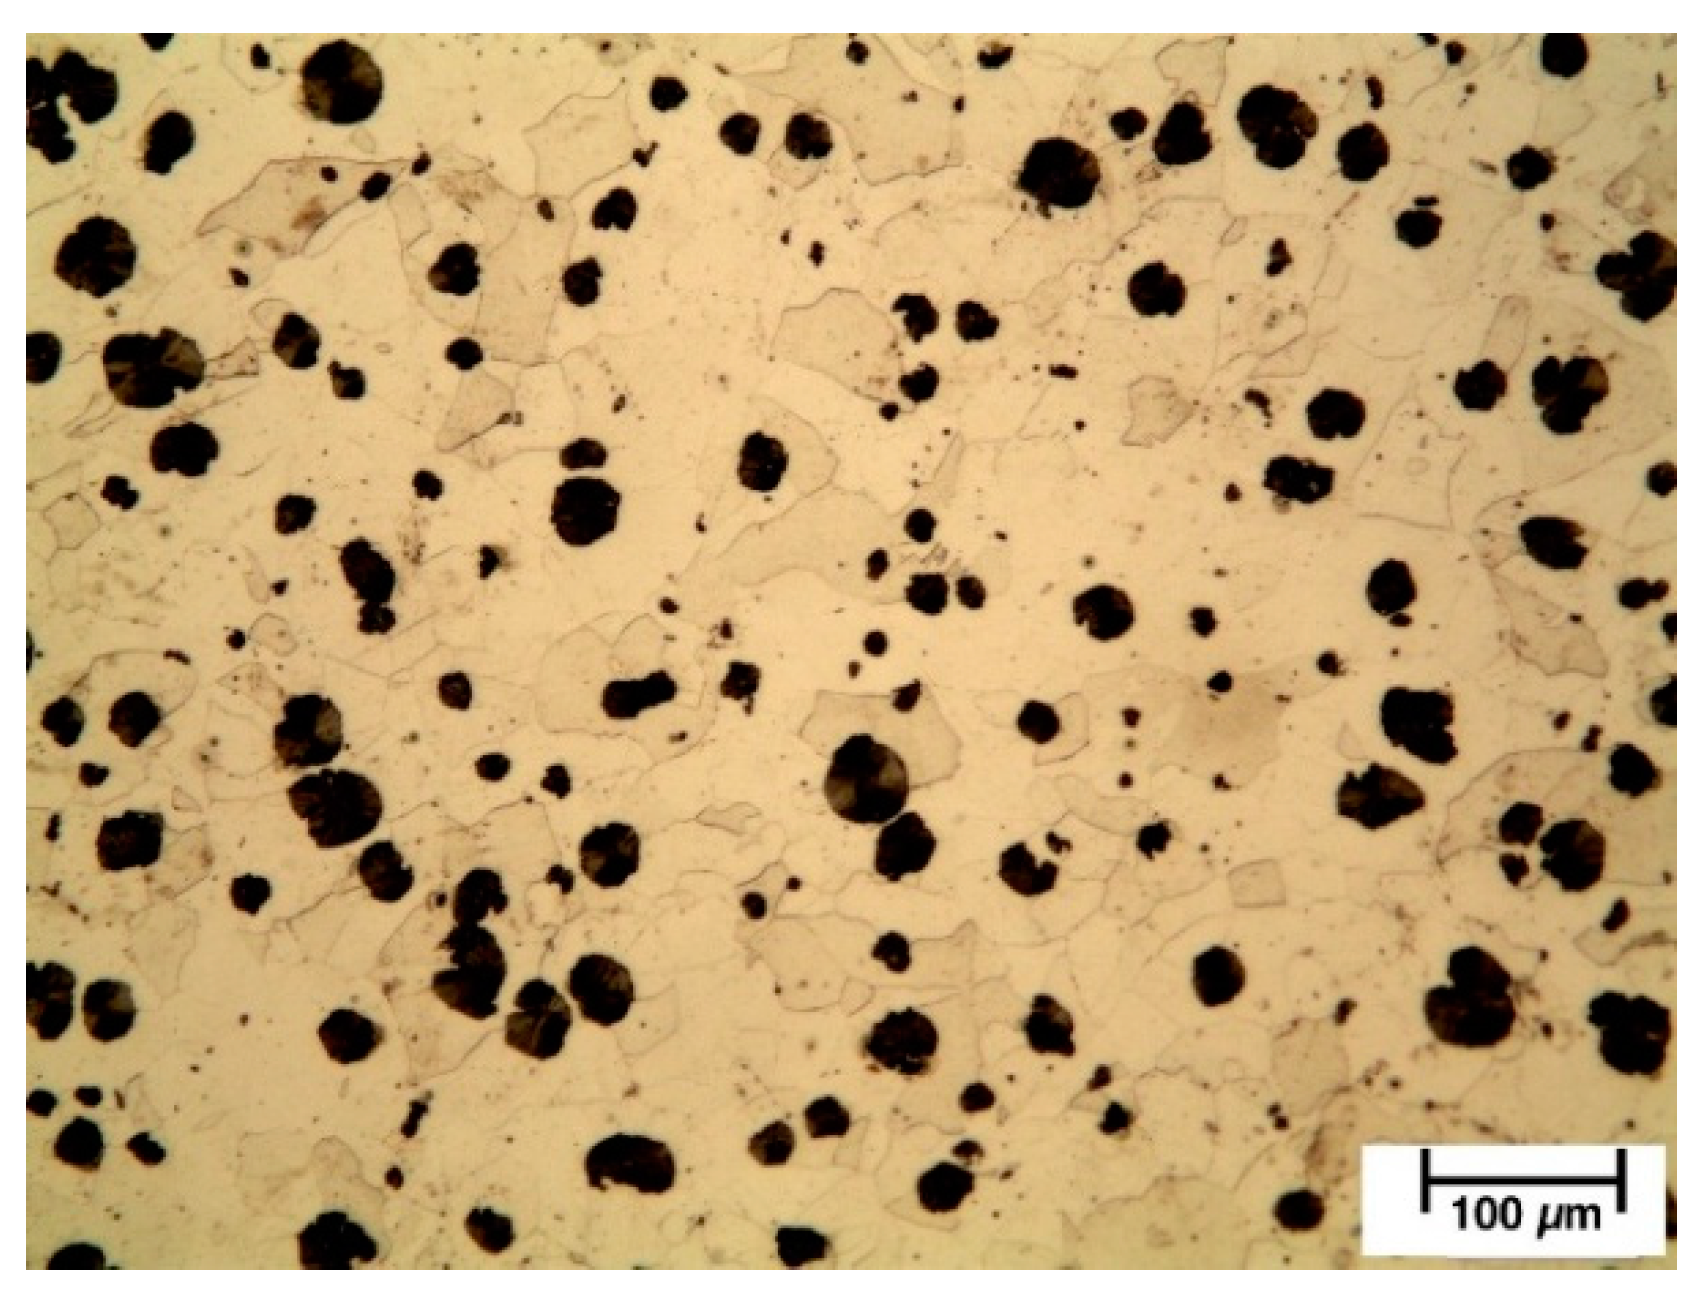
A sample of DCI base material (BM) was also viewed under the microscope to serve as comparison for the analysis, demonstrating the presence of well defined, heterogeneously dimensioned graphite nodules (black nodules) embedded in a predominately ferritic matrix (clear background), shown in Figure 9. This microstructure is coherent with what can be expected for a nodular cast irons.
The microscopic analysis will allow differentiating BM from filler metal (FM), as well as observing, evaluating and measuring the different metallographic structures formed after welding.
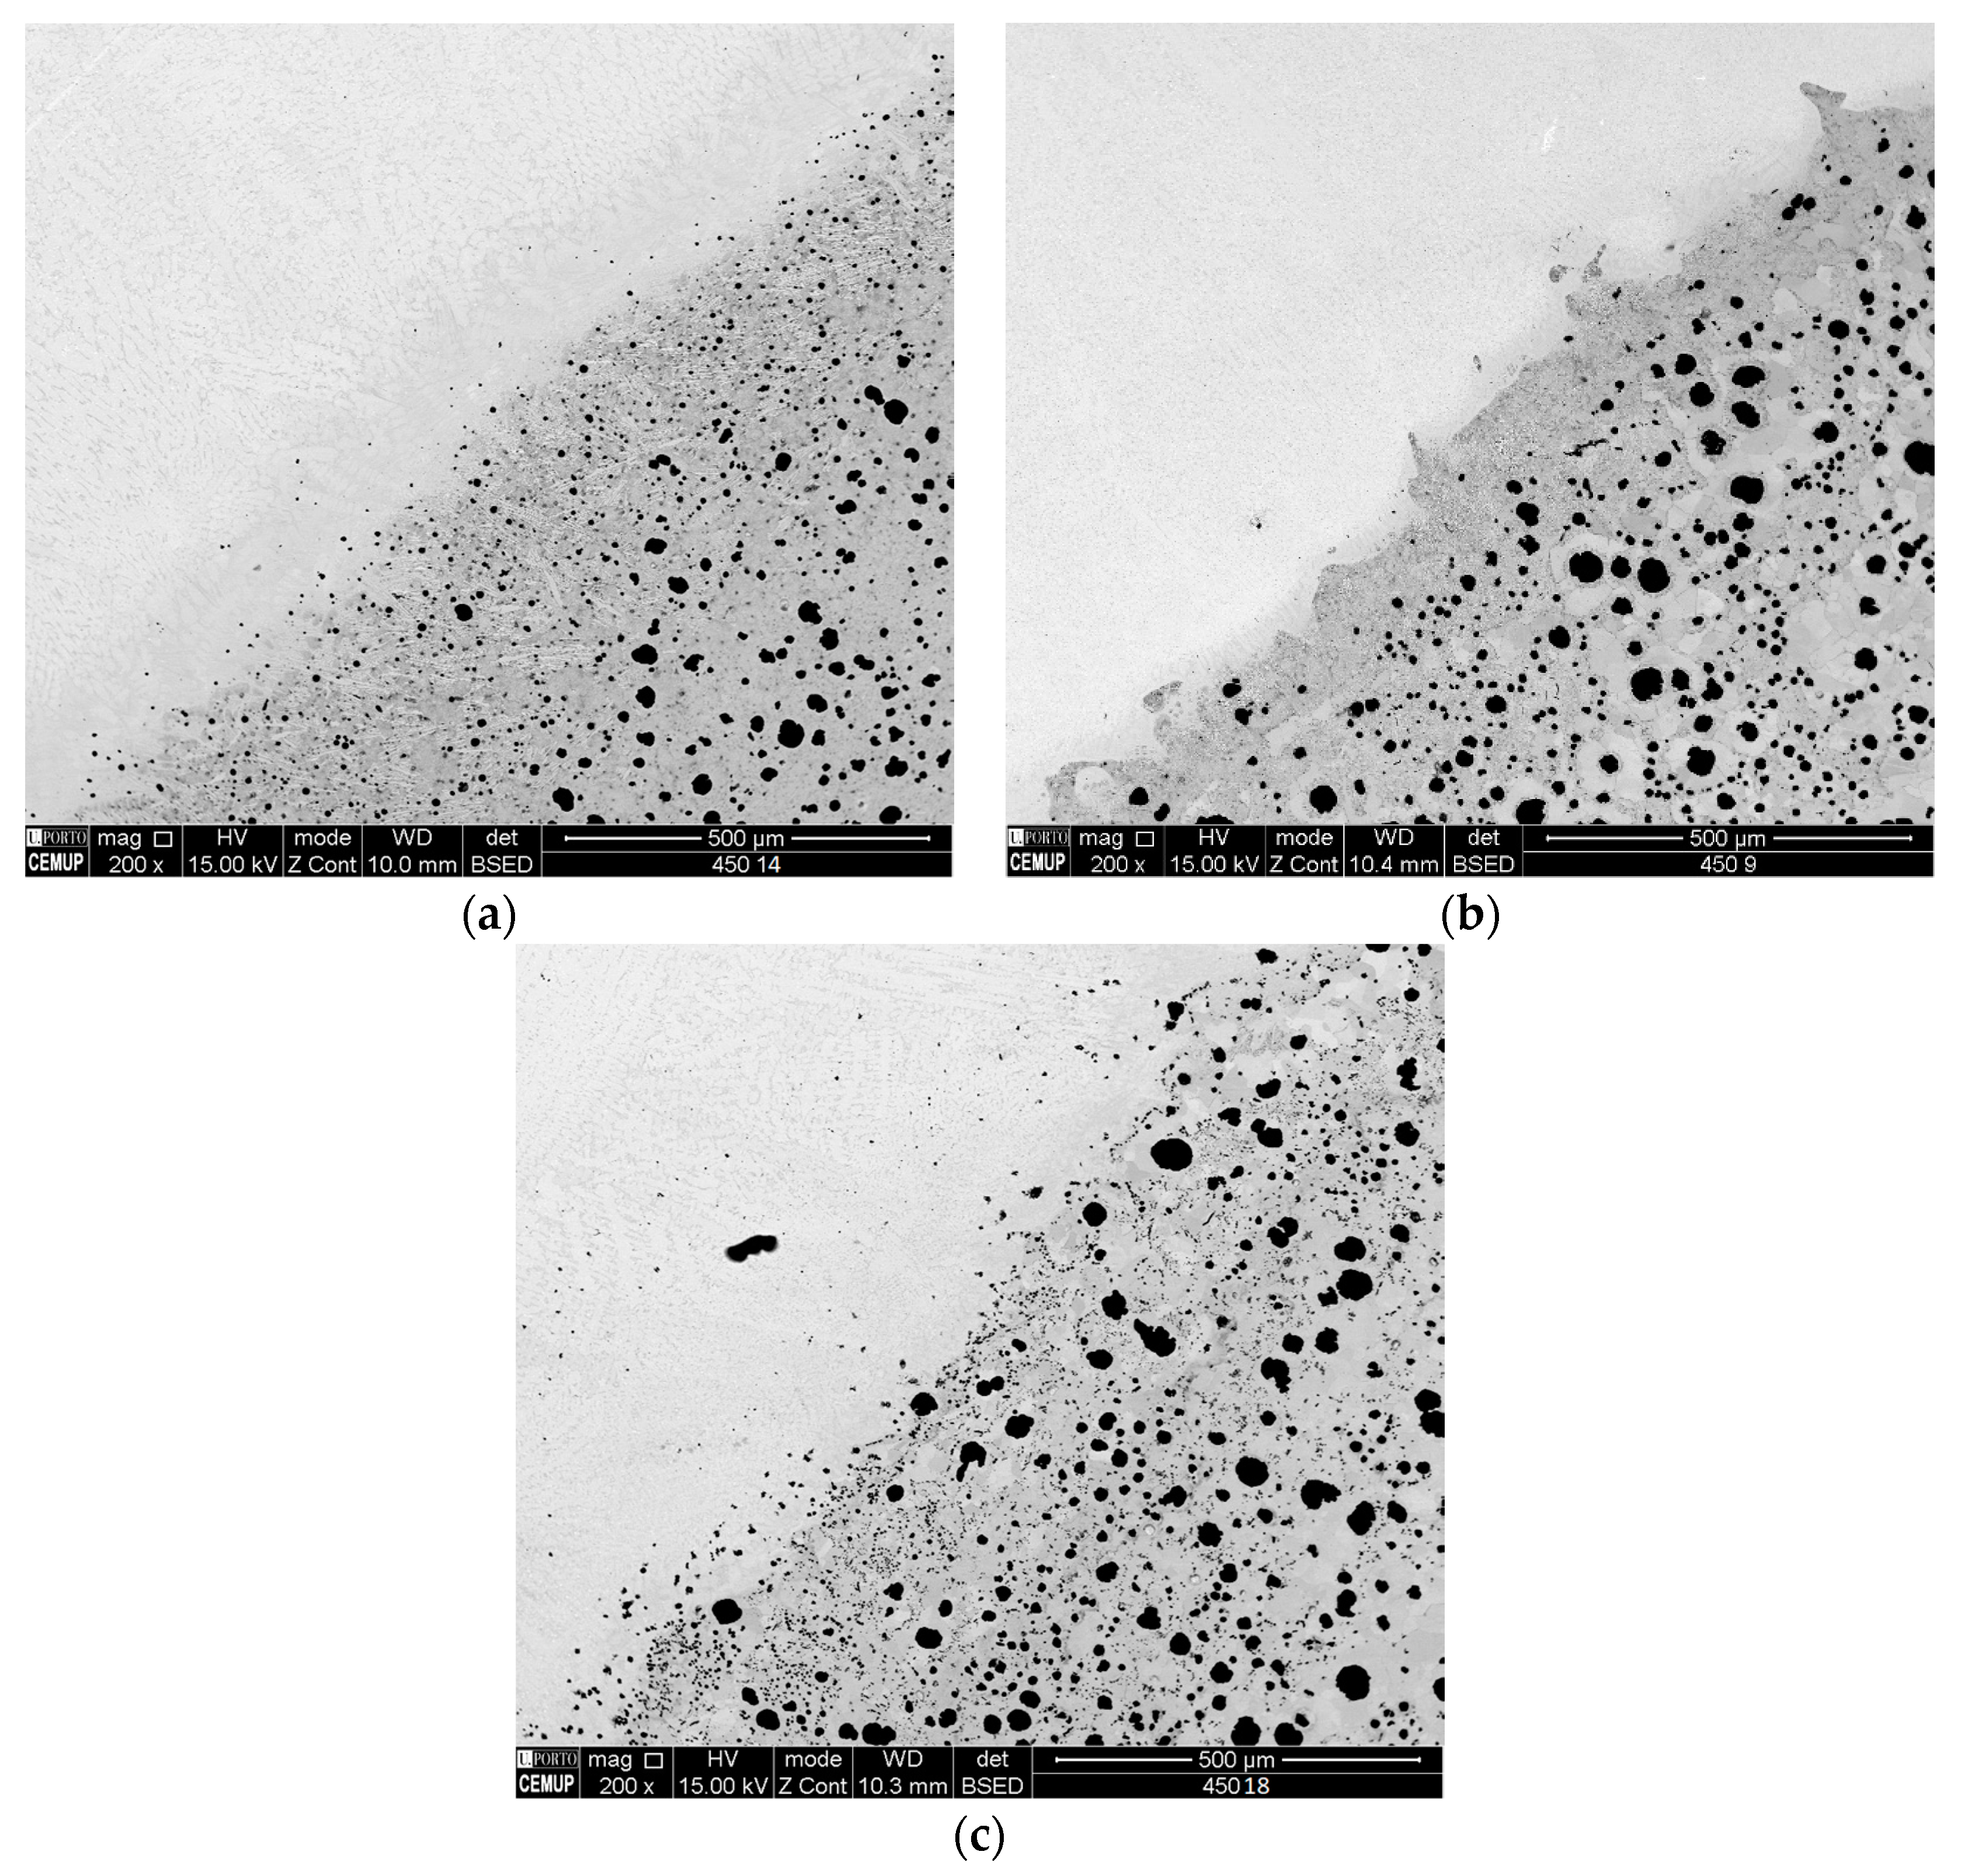
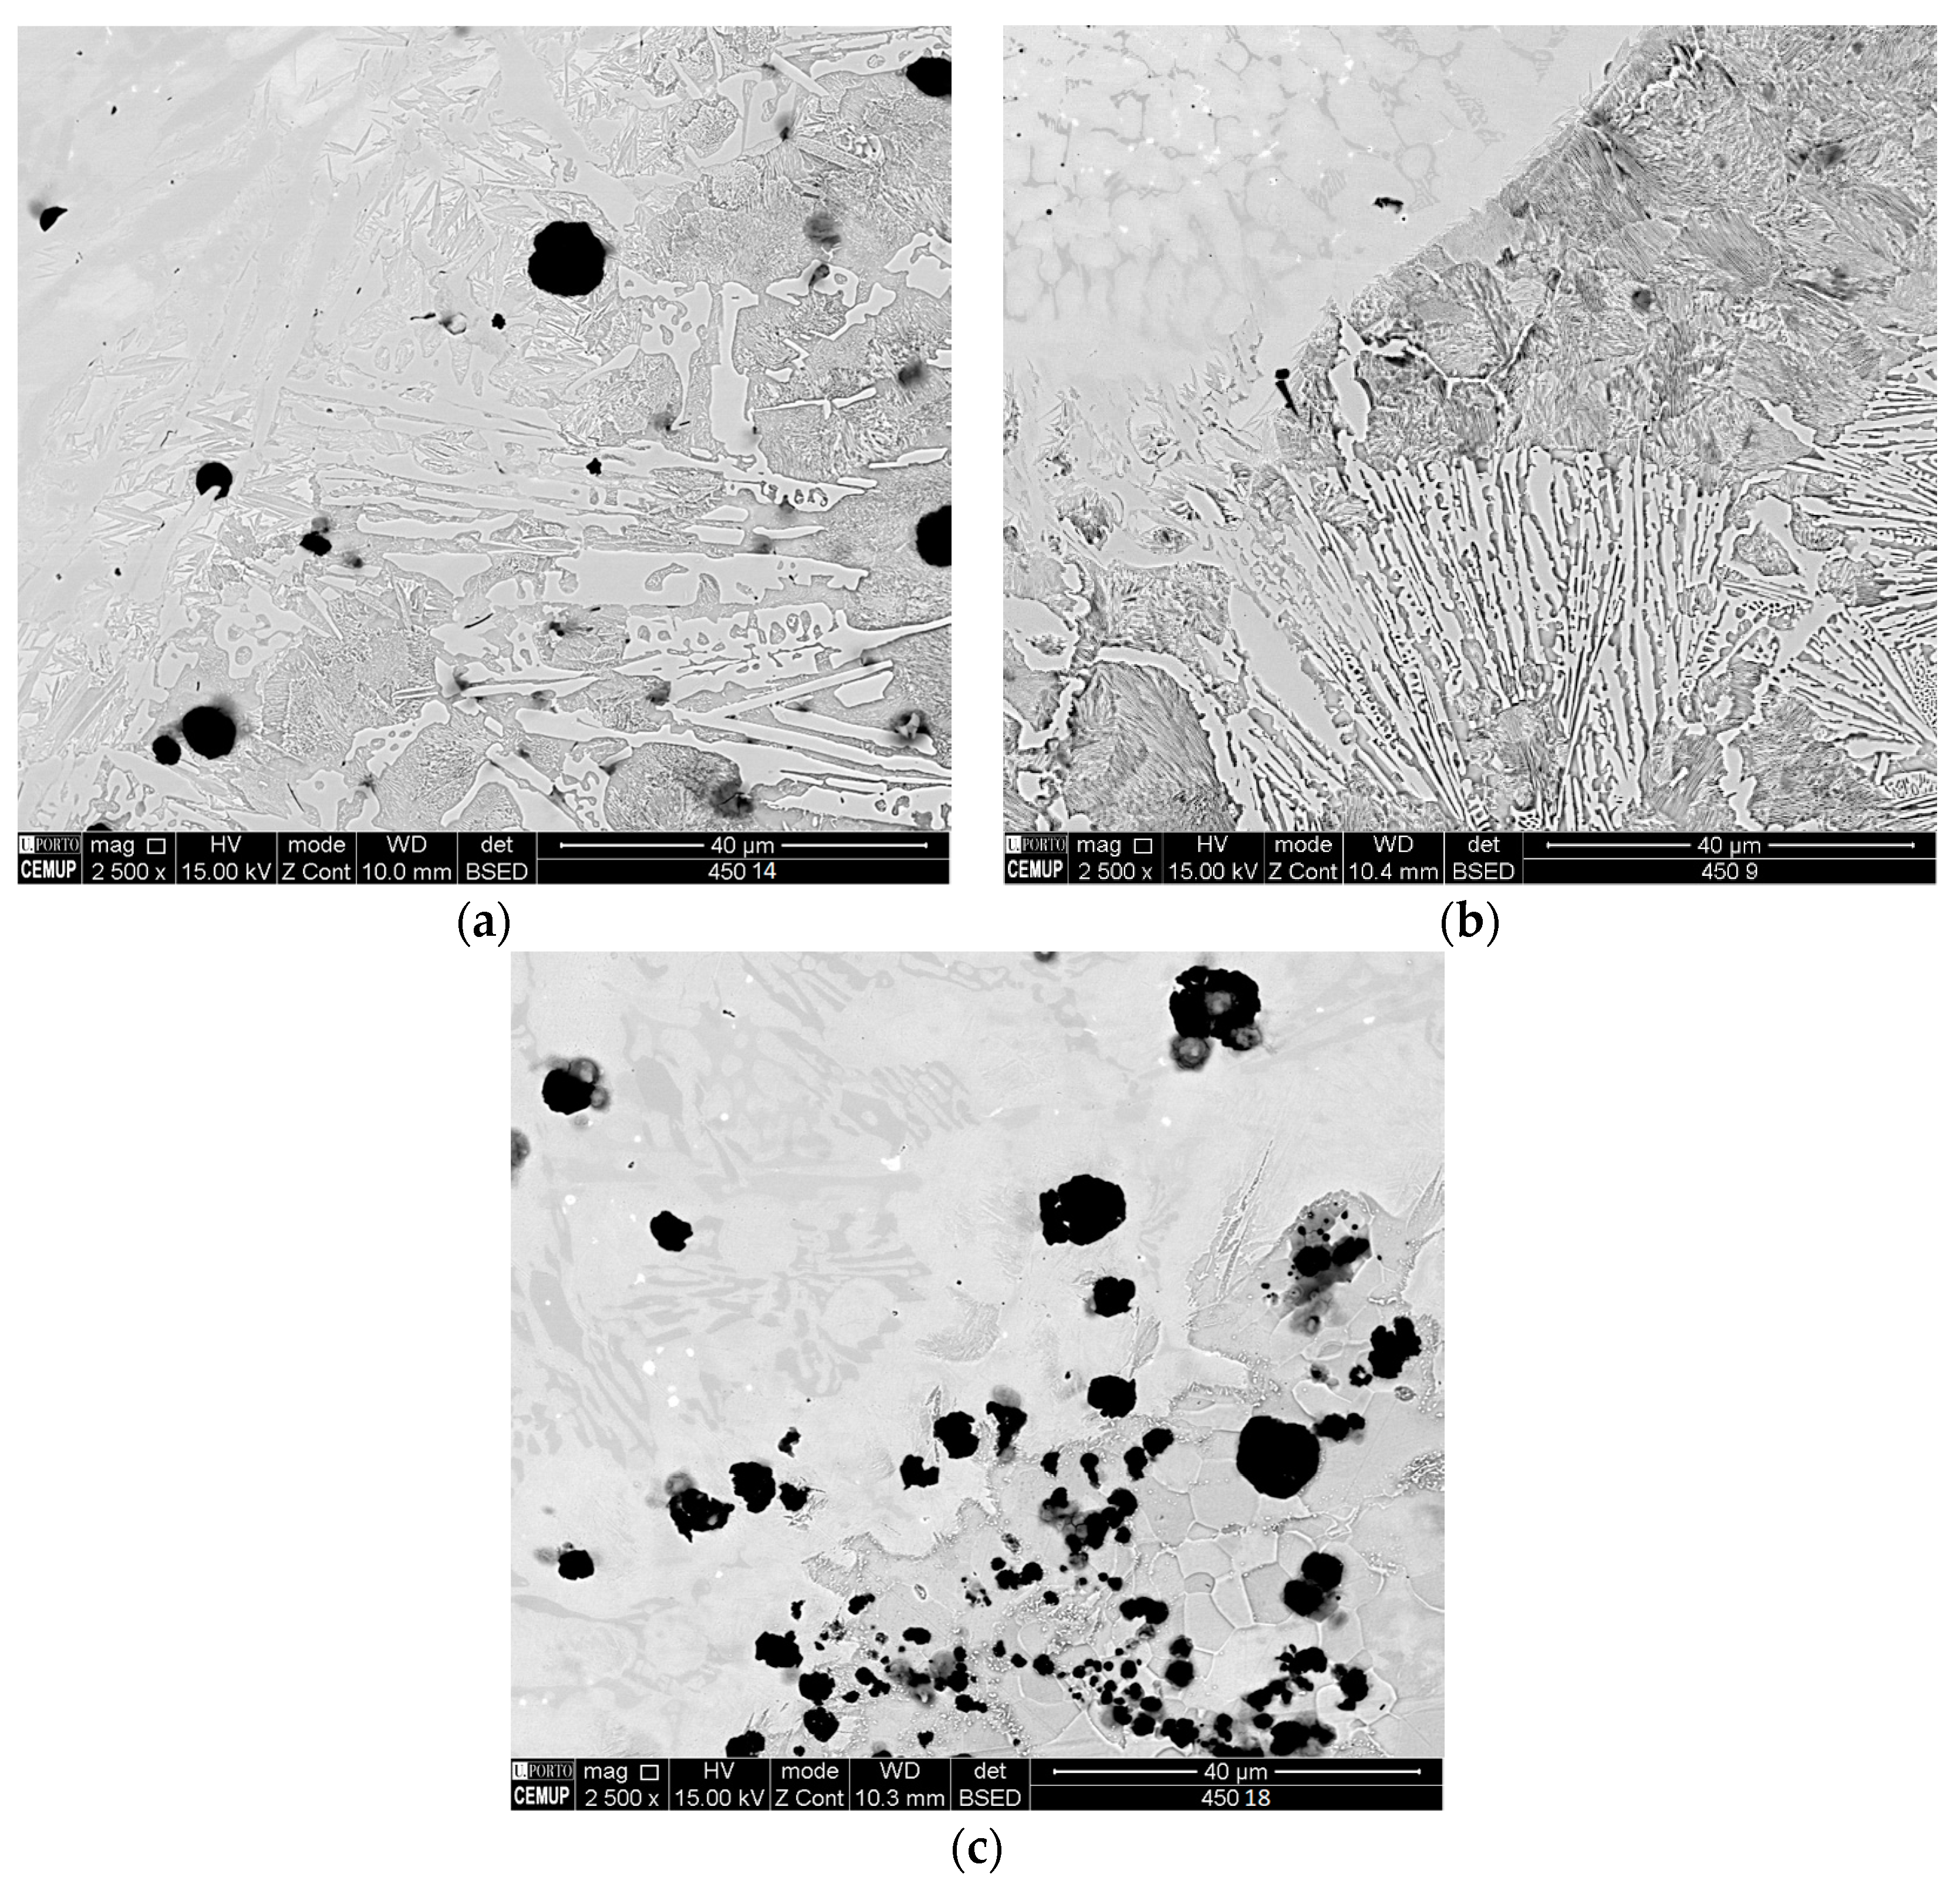
Figure 10, Figure 11, Figure 12 and Figure 13 show the SEM analysis results of the previous selected samples. The BM can be seen on the lower right-hand side of the images, while the FM can be seen in the upper left-hand side of the figures. The HAZ and weld interface can be seen along the upward diagonal of the images.
In Figure 10, several differences between samples at 200× magnification are easily observable. Figure 10a (sample 14_P300_N_P300_W4_P0, pre-heated to 300 °C with 4 welding passes) shows a microstructure with smaller diameter graphite nodules in the HAZ and a smaller weld interface than when compared to the microstructures of Figure 10b,c. The transition from base metal to filler metal is much smoother in Figure 10a, showing a HAZ area with progressively smaller graphite nodules and low carbon diffusion into the FM. Figure 10b,c shows an abrupt transition from one area to the other (a rigid transition). The black graphite nodules seen in Figure 10b appear surrounded by a lighter colored structure. This phenomenon also occurs in Figure 10c in a less intense manner near the weld interface. The carbon diffusion seen in all three samples is very low and coherent with the findings of Pascual et al. [23], which determined that the use of Ni-Cr-Fe electrodes minimizes this phenomenon as well as promoting the best mechanical properties.
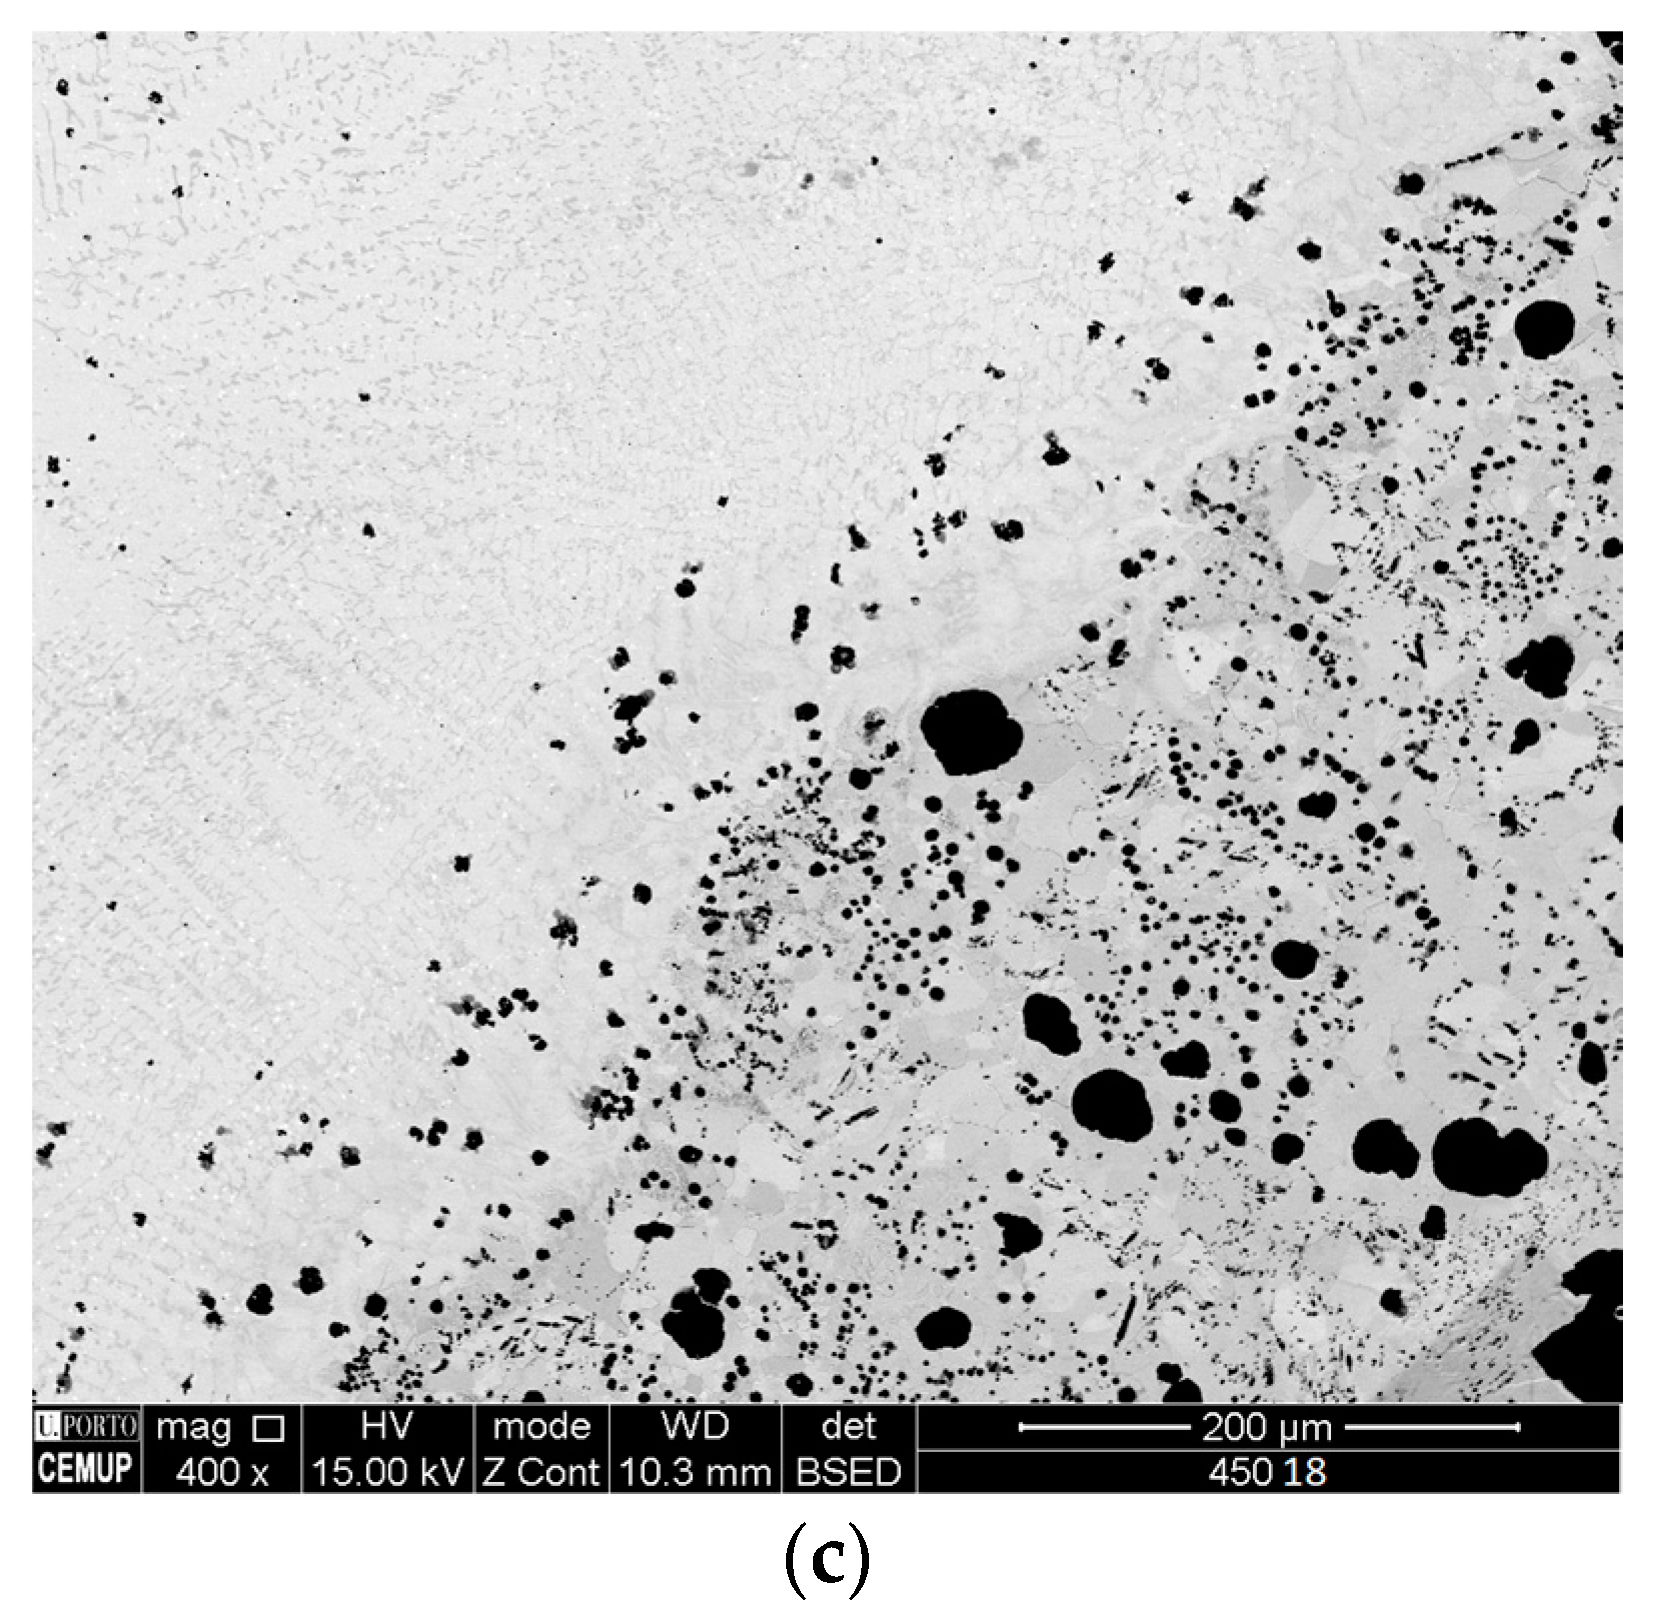
Viewing at 400× magnification, Figure 11 reveals higher surface detail. In Figure 11a, it is possible to observe large needles type structures in the HAZ area between the small graphite nodules. A gradient transition of the FM is also present, showing a noticeable narrow band alongside the weld interface. As previously stated, an abrupt interface transition can be seen in Figure 11b as well as the lighter colored circles surrounding the graphite nodules. This type of structure indicates carbon impoverishment around graphite nodules, meaning that carbon diffusion has occurred to some extent. The size of the carbon nodules is also significantly larger. Figure 11c illustrates a higher amount of diffused carbon into the weld interface, as can be seen by the small black dots in the upper left-hand side of the image, as well as showing a large dispersion of small sized graphite nodules in the HAZ area.
When viewing Figure 12a and Figure 13a, it is possible to observe the presence of ledeburite and small amounts of martensite. The needle type structures seen on the surface of sample 14_P300_N_P300_W4_P0 are consistent with the structure of ledeburite (an eutectic mixture of austenite and cementite). This structure usually presents itself in a somewhat laminar needle shape or in a comb type format and is characterized as being of high hardness and wear resistant. In these two figures, it is also possible to observe a small needle nest shaped structure surrounding the graphite nodules. This structure is commonly found in ADIs and represents the presence of carbon saturated austenite. Both the previously mentions structures play an important role in the achieved UTS results by this sample. Figure 12b and Figure 13b show a higher presence of martensite than the previous sample and a smaller amount of ledeburite. Martensite is known for being a very hard and brittle structure that hinders mechanical strength, being clearly evident due to lower UTS values obtained by both these sample. Figure 12c and Figure 13c demonstrate the presence of disperse and smaller sized graphite nodules.
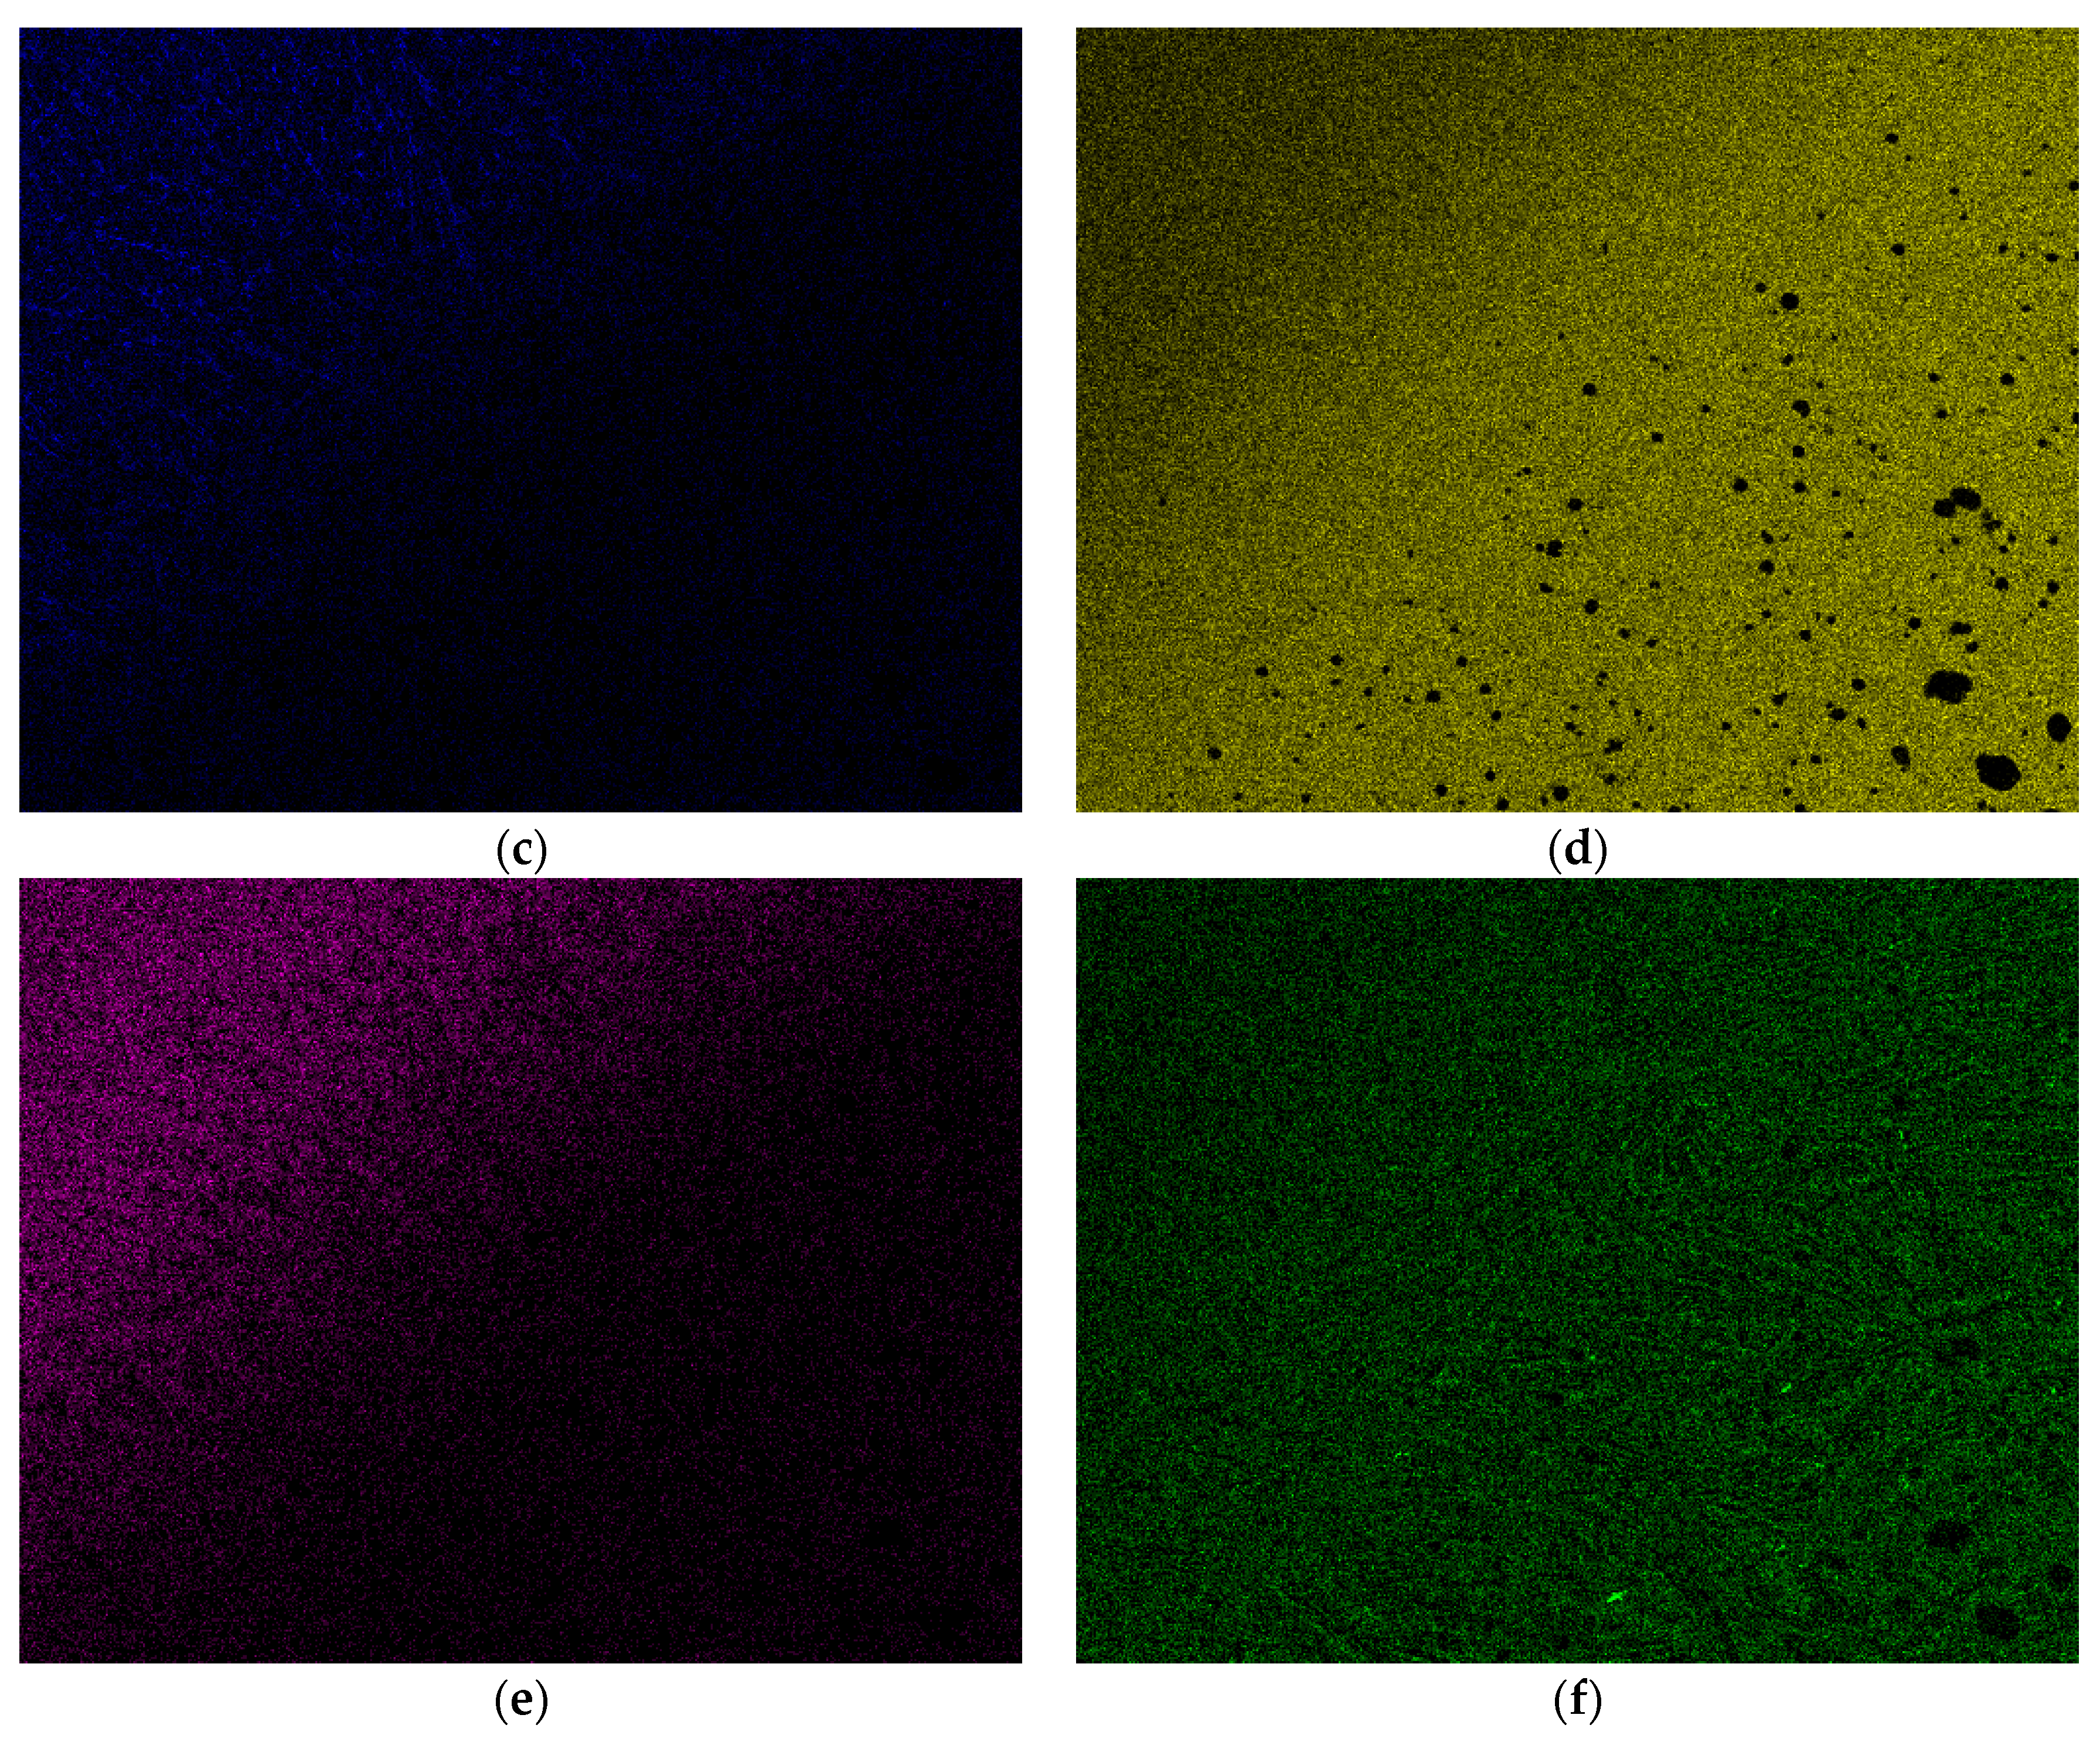
A surface element-mapping was performed on sample 14_P300_N_P300_W4_P0 to better evaluate the occurring interaction between the filler and base metal, as well as assess the diffusion of elements during welding. The filler metal as stated previously was Ni-Cr-Fe (Inconel LR 82) electrode having chemical composition of (wt %) Ni + Co% 67 minimum; Cr% 16; Fe% 7; C% 0.04; Si% 0.4; Mn% 7.5; and Nb% 2 while the base metal is chemical composed by (wt %) C% 3.3–3.7, Si% 2.6–2.8, Mn% 0.05–0.3 and Cu% 0.05–0.3.
As can be seen in Figure 14b, the results of the performed surface mapping show very little carbon diffusion from the BM into the FM. The HAZ area seems to have served as a barrier for the graphite nodules. When comparing this fact with the results obtained by Pascual et al. [23], the amount of carbon diffusion is very low indicating lower chances of martensite, ledeburite and hard carbides formation. Chromium element-mapping (Figure 14c) and nickel element-mapping (Figure 14e) illustrate that the major concentration of these elements is in the FM area (which is expected due to the chemical composition of FM), however these elements are scarcer in the weld interface. Iron is present in the entire observed area; however, the concentration is higher in the BM and weld interface (Figure 14d), as would be expected based on the composition of both metals used. Silicon is also present throughout all of the surface area (Figure 14f), being attributed to a silicon contamination caused by the cutting and sanding/polishing operations performed during the sample preparation process.
3.3. Hardness Test Results
A row of indentations was carried out for each sample, ensuring that all different microstructural areas were evaluated. A bar graph for each sample was created to better visualize the occurring phenomena. Figure 15 shows the recovered hardness profile for each tested sample.
When overlooking the obtained results, a consistent behavior is noted between samples, showing a similar BM hardness of around 140–170 HV (specification given by the manufacturer is of 150–190 HB). FM hardness is consistently higher than parent metal, oscillating between 240 HV and 340 HV. HAZ areas near the weld bead show very high hardness values, having mostly a similar or higher hardness value than of FM. Hardness values found in the HAZ areas range from 370 HV to 464 HV, achieving the highest hardness values registered during tests.
4. Discussion
Gathering all experimental data, it is possible to state that the parameters used to create/treat samples P300_N_P300_W4_P0 demonstrated the best results (seen in Table 6), obtaining an average UTS value of 430.1 MPa, similar to what is specified by the alloy’s manufacturer (minimal UTS of around 450 MPa). The average strain values returned by these set of samples were also the highest of all tests (strain = 12.5%), however, still below the original specification of the BM (strain ≥ 17%).
4.1. Thermal Phenomena
Pre-heating samples to a temperature of 300 °C for 2 h before welding seems to yield good mechanical properties, as shown by the results of samples in the P300_N_P300_W4_P0 and P300_N_P300_W2_P0 group of parameters. The only difference between these two groups of experimental samples was the number of performed weld passes, having achieved a better outcome the group that received more passes. By performing multiple weld passes, a heat treatment effect was accomplished on the previously deposited weld beads. This accumulation of thermal cycles seems to favor the tested mechanical properties (tensile strength and strain) of the welded joint. To better understand the thermal phenomena endured by these samples, mathematical calculations were executed to evaluate certain thermal parameters, such as peak temperatures and cooling rates, that directly affect the metallurgical structure of the HAZ [29].
It is possible to estimate the width of HAZ and how each additional pass thermally influences the previously created HAZ. Peak temperature is determined by the welding parameters chosen for the process and is calculated using the formulas seen in Equation (2) (in this case the equation for thin plates was chosen due to the low thickness of the samples) and Equation (3).
where
- Tp—Peak temperature (°C);
- v—Welding travel speed (mm/s);
- T0—Pre-heat temperature (°C);
- Y—Distance from fusion line (mm);
- Tm—Melting temperature (°C);
- ρ—Density (g/mm3);
- K—Thermal conductivity (J/mm·s·°C);
- Cp—Specific heat capacity (J/g/K);
- g—Material thickness (mm); and
- Q—Heat input (J/mm).
- η—Arc efficiency (%);
- I—Welding current (A);
- V—Welding voltage (V); and
- v—Welding travel speed (mm/s).
By considering an arc efficiency of 90% and rearranging Equation (2), it is possible to calculate the distance from the weld centerline where a peak temperature of 723 °C is reached. This corresponds to the eutectoid temperature of Fe-C irons (lower end of the recrystallization temperature) and represents the lowest temperature at which important microstructural changes occur, leading to the formation, for instance, of martensite. Therefore, areas that are above 723 °C can suffer metallurgical changes, creating a clear distinction between the microstructure of the BM and the HAZ (when viewed under the microscope, a visual border between these two areas can be seen).
Considering all the material properties and welding parameters previously discussed, an estimated HAZ width of 9.55 mm was created during the first pass followed by an 11.3 mm width for the successive passes as seen in Table 7.
Cooling rates directly affect the microstructure that is formed in the HAZ after welding. High cooling rates lead to the appearance of brittles structures such as martensite, which increases material hardness along with the probability of crack propagation. As Sibodur® 450 is still a patented product, there are no continuous cooling transformation (CCT) diagrams available for this steel; therefore, the recommend cooling rate value is unknown. Nevertheless, cooling speeds below 6 °C/s at 550 °C are considered to produce the best results [29,30]. Equation (4) was used to determine the cooling rate of sample P300_N_P300_W4_P0, with the results being shown in Table 8.
where
- R—Cooling rate (mm/s);
- h—Thickness (mm);
- K—Thermal conductivity (J/mm·s·°C);
- Q—Heat input (J/mm);
- ρ—Density (g/mm3);
- Ti—Temperature of interest (°C);
- Cp—Specific heat capacity (J/g/K); and
- T0—Initial temperature (°C).
When correlating the peak temperatures with cooling speeds of sample P300_N_P300_W4_P0, it is possible to affirm:
- The 1st weld pass had the highest cooling rate and originated the smallest HAZ width;
- Successive weld passes originated a wider HAZ than the 1st pass;
- The successive passes rearranged the HAZ created during the 1st weld pass;
- Initial temperature (T0) or interpass temperature is higher during successive passes than the 1st pass, leading to lower cooling rates; and
- All cooling rates are below the recommended maximum values of 6 °C/s at 550 °C.
During the first pass, due to the higher cooling rate, there is a possibility that some martensite was formed in the HAZ region of the weld. However, due to the slower cooling rates and wider HAZ’s created during the successive passes, the martensitic structures were rearranged giving way to the appearance of ledeburite as seen in Figure 12a and Figure 13b, which positively influenced the mechanical properties of the welded joint.
As the heat transfer phenomena seen during welding are extremely complex, a variation between the estimated values and the real-world values most certainly exists. Theoretical peak temperatures and cooling rates do not take into account that the welding jig, welding table and surrounding work area also see an overall increase in temperature when successive weld passes are executed. This increase in temperature alters heat dissipation parameters for these samples, lowering even further the cooling rates. Consequently, during the 4th pass, due to an increase in temperature of all components involved in the welding process, an even lower cooling rate than the one theoretically estimated exists. The upside of having such low cooling rates is that unwanted metallurgical structures are avoided.
Another important detail that should be referred is that the theoretical border between the HAZ and BM, in reality, is not exactly at 11.3 mm from the center line as calculated. Considering that the welding process is manual, the welding technician cannot guarantee that successive weld beads are deposited precisely over previous ones. This lack of precision can enlarge the distance from the centerline, promoting further a heat treatment effect on these border regions, helping to homogenize metallurgical microstructures.
4.2. Microstructural Phenomena
When comparing the effects of four weld passes against two weld passes on the metallographic structures of the experimental samples (Figure 10a,b, Figure 11a,b, Figure 12a,b, and Figure 13a,b), a noticeable difference in terms of graphite nodule size and martensite concentration was found, showing that the sample which received a higher number of weld passes demonstrated smaller graphite nodules and a lower presence of martensite. This occurrence also helps justify the positive results achieved by P300_N_P300_W4_P0 samples as:
- Smaller graphite nodules (with higher nodule count (nodules/mm2)) enable better mechanical properties such as tensile strength, fatigue and fractural toughness. Graphite nodules can act like material discontinuities meaning that a lower nodule diameter translates directly to higher material homogeneity. As graphite is a very brittle microstructure with a low friction coefficient, when under stress, it has the tendency to easily fracture or break free from the embedded surface, creating a clear path for crack propagation.
- Martensite, being very hard and brittle structure, directly contributes to a decrease in ductility; therefore, a lower presence of this structure is beneficial.
Figure 12a and Figure 13a also show the presence of a needle/nest type structure surrounding the graphite nodules (carbon saturated austenite) in the HAZ, being consistent with what is found in ADI’s. This type of structure is responsible for increasing mechanical strength while maintaining strain properties. Thus, it is possible to affirm that the composition and mechanical properties encountered in the HAZ region of this sample are very similar to those of the BM.
4.3. Mechanical Properties
4.3.1. Tensile and Strain
A graphical representation of the tensile test results was created and can be seen in Figure 16.
Despite obtaining slightly lower values, a PWHT at 700 °C for 2 h seems to promote good mechanical properties, as shown by the results of samples in the P300_N_P0_W2_P700 and P0_W2_P700 groups. In addition, the overall difference in terms of UTS and strain between samples P300_N_P300_W2_P0 (pre-heating only with no PWHT) and samples P300_N_P0_W2_P700 (PWHT only with no pre-heating) can be considered almost negligible (as shown in Figure 16 and Table 6). This leads to affirm that performing a pre-heating cycle at 300 °C for 2 h before welding or performing a PWHT cycle at 700 °C for 2 h yields very similar results. Therefore, either cycles can be performed to increase mechanical properties of a welded joint. However, a pre-heating cycle of 300 °C for 2 h is more favorable, as the use of lower temperatures translates into energy and cost savings.
Pre-heating or PWHT cycle temperatures clearly had a large effect on the outcome of the test results. Samples that received a higher pre-heating temperature (700 °C for 2 h) showed a drastic loss in mechanical strength, generating the lowest results from all tested samples. The use of higher pre-heating temperatures in addition with the high heat input generated during welding elevate drastically material temperatures during welding. The magnitude of heat achieved causes certain scattered elements/structures (that are present in the alloy’s matrix and meant to aid mechanical properties) to diffuse and agglomerate. At such high temperatures, carbon and nickel diffusion occurs, creating a decarbonization effect and promoting carbon migration to the interface/surface. Consequently, this migration encourages the formation of hard and brittle structures such as martensite during cooling, lowering mechanical strength. When comparing samples from the P300_N_P300_W2_P0 group with the P300_N_P700_W2_P0 group, where the only parameter changed was the pre-heating temperature (from 300 °C to 700 °C), a decrease of around 100 MPa in average UTS was observed, as well as 5% decrease in strain. This observation seems to be in line with the findings of El-Banna [20] which tested several pre-heating temperatures and concluded that a pre-heating temperature in the 200 °C to 300 °C range before welding promoted the best results. Although less severe, a drop in average UTS and strain was also encountered when utilizing PWHT cycles with temperatures higher than 700 °C (800 °C for 2 h for the P0_W2_P800 sample group). This decrease in mechanical strength can be viewed when comparing results from samples groups P0_W2_P700 and P0_W2_P800 (once again can be seen in Figure 16 or Table 6). However, the PWHT carried out at temperatures higher than 700 °C is less harmful than a pre-heating performed at temperatures close to 700 °C due to the accumulative temperature effect that results from welding pre-heated samples.
Metallographic analysis demonstrated narrower HAZ areas in samples that received PWHT. Once again due to the high heat input and rapid cooling that is generated during welding (the higher the number of weld passes the higher the heat input), structures located near the weld area can be negatively affected. A PWHT helps counteract this phenomenon by promoting mobility in the matrix and enabling the rearrangement of the microstructural elements.
Nickel surface deposition showed no positive effect on mechanical properties, as can be seen by the close results of sample groups P300_N_P0_W2_P700 and P0_W2_P700, having prevailed solemnly the effect of the PWHT. Furthermore, there is no evidence of a clear carbon impoverishment into and close to the HAZ as expected. Thus, the desired effect of combining nickel and carbon within the metal base border (chamfer) was not felt, perhaps due to one of the following causes or the conjugation of both: (a) the carbon impoverishment was too small; or (b) the impoverished section was accidentally removed during the grinding task after the nickel deposition.
4.3.2. Hardness
Hardness test results demonstrated higher hardness values in HAZ areas than in surrounding areas. Higher hardness is usually indicative of brittleness and lower ductility which can lead to easier crack propagation and component failure. This is in tune with the failure method encountered during tensile testing as all samples failed in a similar manner with fracture initiating in the HAZ region and propagating into the BM. If large and harmful concentrations of martensite and ledeburite were to be present in the HAZ area, crack propagation would be expected to run alongside this area or steer off at a 45° shear angle, which did not occur. Therefore, it is possible to state that, although martensitic and ledeburitic structures were present, HAZ areas and BM detained comparable mechanical properties.
5. Conclusions
The results and discussion previously presented allowed drawing several conclusions, being the most important the fact that an average UTS of 430 MPa alongside an average strain value of 12.5% was achieved when welding the chosen high strength ductile case iron with Inconel alloy as a filler metal. This corresponds to an average decrease of only 4.4% in UTS and 26.4% in strain, which is considered as very good result. It is also possible to state that performing a higher number of weld passes:
- Generated the best mechanical properties;
- Minimized the appearance of brittle martensite in the HAZ;
- Promoted the appearance of structures usually seen in ADI’s (graphite nodules surrounded by a needle shaped nest); and
- Simulated the effects of cyclical heat-treatments favoring mechanical properties.
Performing a pre-heating cycle of 300 °C for 2 h before welding or a PWHT of 700 °C for 2 h promotes similar results in terms of mechanical properties, allowing to state that a pre-heating cycle of 300 °C for 2 h is more advantageous due to energy and cost savings. Based on the achieved results, Nickel surface deposition before welding does not generate any significant increase in mechanical strength and therefore is not necessary.
When testing different temperature ranges for heat treatments, it was observed that pre-heating temperatures above 300 °C did not encourage good mechanical properties, being concurrent with the finding of El-Banna [20]. In addition, PWHT temperatures greater than 700 °C hinder mechanical properties although, are not as harmful as when a high pre-heating temperature is chosen. By observing Equations (2) and (4) it is easily deduced that the initial temperature of the material highly impacts the peak temperature reached during welding and cooling rate of the sample. Therefore, when the initial temperature is above the recommend range (200–300 °C [20]), a higher peak temperature is achieved alongside a slower cooling rate, leading to microstructural changes which lower mechanical strength. Likewise, the welding of this DCI without any pre-heating or PWHT severely decreases mechanical properties and should not be considered a viable solution.
These conclusions allow stating that components made of the analyzed high strength ductile iron can be repaired via welding and maintain good mechanical properties. This is achieved by performing a pre-heating cycle to a temperature of 300 °C of the part to repair, where after multiple weld passes may be deposited using Inconel AWS SFA 5.11: E Ni Cr Fe-3 electrodes as filler metal. As components made of this DCI are usually manufactured by casting processes, part thickness is usually large, therefore performing multiple weld passes on such parts is a common practice. Nevertheless, a decrease in strain is present and must be contemplated to ensure if component repair is viable.
6. Outlook
Based on the results achieved by this study, further research will be carried out regarding the effects of:
- PWHT on multiple pass welds;
- Further welding methods such as plasma, electron beam and laser;
- The use of a different filler material to create a benchmark and evaluate how the implementation of a slightly different chemical composition may affect joint strength; and
- Additional PWHT temperatures should be tested in an effort to decrease HAZ region size and hardness without negatively affecting important mechanical properties.
Acknowledgments
The authors gratefully acknowledge Konrad Papis from Georg Fischer Automotive, A.G. for his crucial support, providing the raw material needed for this work. Authors also thank Rui Rocha from CEMUP for his strong commitment to the Authors’ needs, providing a critical analysis in SEM and EDS analyses.
Author Contributions
Ronny M. Gouveia carried out some analyses and wrote the paper; Francisco J. G. Silva conceived and designed the experiments, supervised the experimental work, carried out some analyses and helped writing the paper; Olga C. Paiva conceived and designed the experiments, supervised the experimental work and provided critical analyses about metallurgical phenomena; Maria F. Andrade prepared all samples and carried out some experimental work; Luiz Silva carried out some experimental work; Paulo C. Moselli supervised Luiz Silva; and Konrad J. M. Papis provided the raw material to carry out this work.
Conflicts of Interest
The authors declare no conflict of interest.
References
- Davis, J.R. Cast Irons: ASM Specialty Handbook, 2nd ed.; ASM International: Materials Park, OH, USA, 1996; pp. 393–460. ISBN 978-0-87170-564-8. [Google Scholar]
- Winiczenko, R.; Salat, R.; Awtoniuk, M. Estimation of tensile strength of ductile iron friction welded joints using hybrid intelligent methods. Trans. Nonferrous Met. Soc. China 2013, 23, 385–391. [Google Scholar] [CrossRef]
- Konecná, R.; Nicoletto, G.; Bubenko, L.; Fintová, S. A comparative study of the fatigue behavior of two heat-treated nodular cast irons. Eng. Fract. Mech. 2013, 108, 251–262; [Google Scholar] [CrossRef]
- Fragassa, C. Material selection in machine design: The change of cast iron for improving the high-quality in woodworking. J. Mech. Eng. Sci. 2017, 231, 18–30. [Google Scholar] [CrossRef]
- Fragassa, C.; Radovic, N.; Pavlovic, A.; Minak, G. Comparison of mechanical properties in compacted and spheroidal graphite irons. Tribol. Ind. 2016, 38, 49–59. [Google Scholar]
- Fragassa, C.; Zigulic, R.; Pavlovic, A. Push-pull fatigue test on ductile and vermicular cast irons. Eng. Rev. 2016, 36, 269–280. [Google Scholar]
- Mullins, D.J. Engineering Properties, Specifications and Physical Constants of Specific Ductile Irons. In Ductile Iron Handbook; American Foundrymen’s Society, Inc.: Des Plaines, IL, USA, 1993; pp. 20–51. ISBN 9780874331240. [Google Scholar]
- De Santis, A.; Di Bartolomeo, O.; Iacoviello, D.; Iacoviello, F. Quantitative shape evaluation of graphite particles in ductile iron. J. Mater. Process. Technol. 2004, 196, 292–302. [Google Scholar] [CrossRef]
- Fragassa, C.; Minak, G.; Pavlovic, A. Tribological aspects of cast iron investigated via fracture toughness. Tribol. Ind. 2016, 38, 1–10. [Google Scholar]
- Panneerselvam, S.; Putatunda, S.K.; Gundlach, R.; Boileau, J. Influence of intercritical austempering on the microstructure and mechanical properties of austempered ductile cast iron (ADI). Mater. Sci. Eng. A 2017, 694, 72–80. [Google Scholar] [CrossRef]
- Dorazil, E. High Strength Austempered Ductile iron; Michigan University: Ann Arbor, MI, USA, 1991; pp. 22–54. ISBN 9780133886610. [Google Scholar]
- Trudel, A.; Gagne, M. Effect of Heat Treatment Parameters on the Characteristics of Austempered Ductile Irons; Pergamon Press: Willowdale, ON, Canada, 1997; pp. 289–298. [Google Scholar]
- Sohi, M.H.; Ahmadabadi, M.N.; Vahdat, A.B. The role of austempering parameters on the structure and mechanical properties of heavy section ADI. J. Mater. Process. Technol. 2004, 153–154, 203–208. [Google Scholar] [CrossRef]
- Harding, R.A. The production, properties and automotive applications of austempered ductile iron. Kovove Mater. 2007, 45, 1–16. [Google Scholar]
- Guerra, F.V.; Bedolla-Jacuinde, A.; Mejía, I.; Zuno, J.; Maldonado, C. Effects of boron addition and austempering time on microstructure, hardness, and tensile properties of ductile irons. Mater. Sci. Eng. A 2015, 648, 193–201. [Google Scholar] [CrossRef]
- Putatunda, S.K. Development of austempered ductile cast iron (ADI) with simultaneous high yield strength and fracture toughness by novel two-step austempering process. Mater. Sci. Eng. 2001, 315, 70–80. [Google Scholar] [CrossRef]
- Chaengkham, P.; Srichandr, P. Continuously cast ductile iron: Processing, structures, and properties. J. Mater. Process. Technol. 2011, 211, 1372–1378. [Google Scholar] [CrossRef]
- Automotive, G.F. Ductile iron: SiboDur® and GJS family. In Material Data Sheets, Research and Development; Georg Fischer Automotive: Schaffhausen, Switzerland, 2015. [Google Scholar]
- Pouranvari, M. On the weldability of grey cast iron using Nickel based filler metal. Mater. Des. 2010, 31, 3253–3258. [Google Scholar] [CrossRef]
- El-Banna, E.M. Effect of preheat on welding of ductile cast iron. Mater. Lett. 1999, 41, 20–26. [Google Scholar] [CrossRef]
- Mirhedayatian, S.M.; Vahdat, S.E.; Jelodar, M.J.; Saen, R.F. Welding process selection for repairing nodular cast iron engine block by integrated fuzzy data envelopment analysis and TOPSIS approaches. Mater. Des. 2013, 43, 272–282. [Google Scholar] [CrossRef]
- Askary-Paykani, M.; Shayan, M.; Shamanian, M. Weldability of Ferritic Ductile Cast Iron Using Full Factorial Design of Experiment. J. Iron Steel Res. Int. 2014, 21, 252–263. [Google Scholar] [CrossRef]
- Pascual, M.; Cembrero, J.; Salas, F.; Pascual-Martínez, M. Analysis of the weldability of ductile iron. Mater. Lett. 2008, 62, 1359–1362. [Google Scholar] [CrossRef]
- Ghaini, F.M.; Ebrahimnia, M.; Gholizade, S. Characteristics of cracks in heat affected zone of ductile cast iron in powder welding process. Eng. Fail. Anal. 2011, 18, 47–51. [Google Scholar] [CrossRef]
- Arabi-Jeshvaghani, R.; Harati, E.; Shamanian, M. Effects of surface alloying on microstructure and wear behavior of ductile iron surface-modified with a Nickel-based alloy using shielded metal arc welding. Mater. Des. 2011, 32, 1531–1536. [Google Scholar] [CrossRef]
- Ebrahimnia, M.; Ghaini, F.M.; Gholizade, S.; Salari, M. Effect of cooling rate and powder characteristics on the soundness of heat affected zone in powder welding of ductile cast iron. Mater. Des. 2012, 33, 551–556. [Google Scholar] [CrossRef]
- Arabi-Jeshvaghani, R.; Shamanian, M.; Jaberzadeh, M. Enhancement of wear resistance of ductile iron surface alloyed by stellite 6. Mater. Des. 2011, 32, 2028–2033. [Google Scholar] [CrossRef]
- Bęczkowski, R. Repair welding of the massive cast. Arch. Foundry Eng. 2017, 17, 5–8. [Google Scholar] [CrossRef]
- Mandal, N.R. Ship Construction and Welding, Springer Series on Naval Architecture, Marine Engineering, Shipbuilding and Shipping; Springer: Singapore, 2017; pp. 170–174. ISBN 978-981-10-2953-0. [Google Scholar]
- Connor, L.P. Welding technology. In Welding Hand Book, 8th ed.; American Welding Society: Miami, FL, USA, 1987; Volume 1, pp. 169–178. ISBN 978-0871712813. [Google Scholar]
- Krahmer, D.M.; Polvorosa, R.; de Lacalle, L.N.L.; Alonso-Pinillos, U.; Abate, G.; Riu, F. Alternatives for specimen manufacturing in tensile testing of steel plates. Exp. Tech. 2016, 40, 1555–1565. [Google Scholar] [CrossRef]
Figure 1.
Geometry of received raw material bar and test specimens: (a) raw material mounted to turning chuck; and (b) weld test specimen geometry.
Figure 1.
Geometry of received raw material bar and test specimens: (a) raw material mounted to turning chuck; and (b) weld test specimen geometry.
Figure 2.
Test specimen pre-heating cycle for Nickel deposition or joint weld.
Figure 3.
Test specimens after Nickel filler metal deposition: (a) welded Nickel bead to chamfer edge; and (b) re-chamfered edges after Nickel deposition.
Figure 3.
Test specimens after Nickel filler metal deposition: (a) welded Nickel bead to chamfer edge; and (b) re-chamfered edges after Nickel deposition.

Figure 4.
View of a welded experimental sample.
Figure 5.
Visual inspection of welded test specimens.
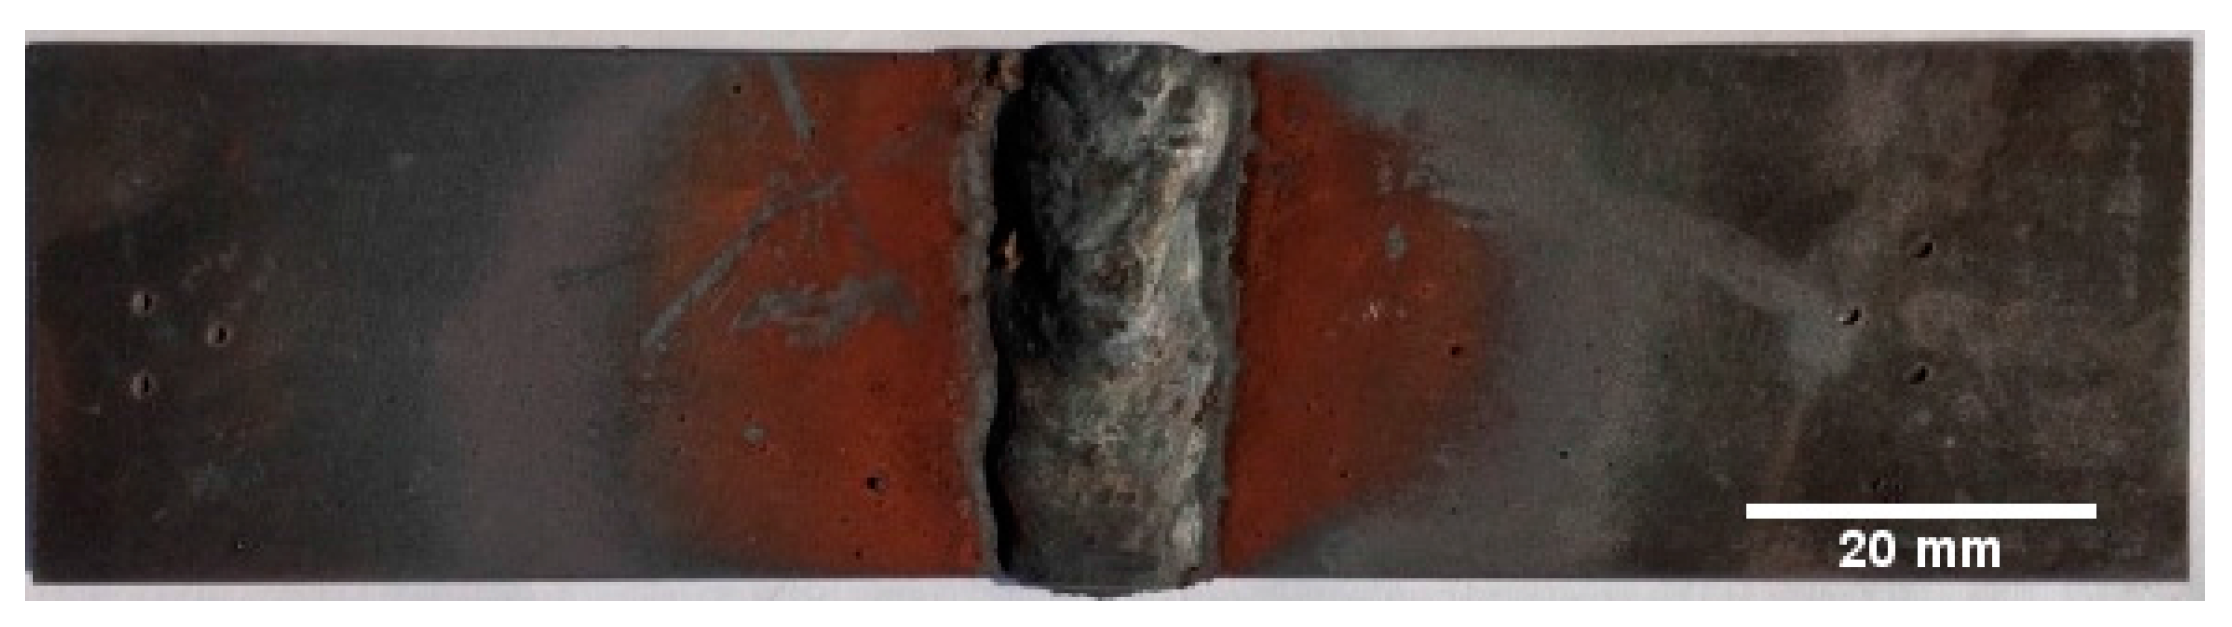
Figure 6.
Penetrating dye test procedure: (a) sample cleaning with solvent agent; (b) application of penetrating dye spray; (c) cleaning of excess penetrating dye from sample surface; and (d) sample with revealer applied to surface.
Figure 6.
Penetrating dye test procedure: (a) sample cleaning with solvent agent; (b) application of penetrating dye spray; (c) cleaning of excess penetrating dye from sample surface; and (d) sample with revealer applied to surface.

Figure 7.
View of several rejected samples: (a) X-ray example of rejected samples due to the presence of defects in the weld bead (filler metal); (b) rejected sample which ruptured through filler metal due to the presence of pores; and (c) view of pores in the filler metal.
Figure 7.
View of several rejected samples: (a) X-ray example of rejected samples due to the presence of defects in the weld bead (filler metal); (b) rejected sample which ruptured through filler metal due to the presence of pores; and (c) view of pores in the filler metal.

Figure 8.
Type of sample failure found during tensile tests; failure due to initial rupture in the HAZ area.
Figure 8.
Type of sample failure found during tensile tests; failure due to initial rupture in the HAZ area.

Figure 9.
High strength DCI base material without etching (magnification 200×).

Figure 10.
SEM (Scanning Electron Microscopy) analysis of samples at 200× magnification with 4% Nital etching: (a) sample 14_P300_N_P300_W4_P0 (UTS 448.0 MPa); (b) sample 09_P300_N_P300_W2_P0 (UTS 389.8 MPa); and (c) sample 18_P300_N_P0_W2_P700 (UTS 390.7 MPa).
Figure 10.
SEM (Scanning Electron Microscopy) analysis of samples at 200× magnification with 4% Nital etching: (a) sample 14_P300_N_P300_W4_P0 (UTS 448.0 MPa); (b) sample 09_P300_N_P300_W2_P0 (UTS 389.8 MPa); and (c) sample 18_P300_N_P0_W2_P700 (UTS 390.7 MPa).

Figure 11.
SEM analysis of samples at 400× magnification with 4% Nital etching: (a) sample 14_P300_N_P300_W4_P0 (UTS 448.0 MPa); (b) sample 09_P300_N_P300_W2_P0 (UTS 389.8 MPa); and (c) sample 18_P300_N_P0_W2_P700 (UTS 390.7 MPa).
Figure 11.
SEM analysis of samples at 400× magnification with 4% Nital etching: (a) sample 14_P300_N_P300_W4_P0 (UTS 448.0 MPa); (b) sample 09_P300_N_P300_W2_P0 (UTS 389.8 MPa); and (c) sample 18_P300_N_P0_W2_P700 (UTS 390.7 MPa).
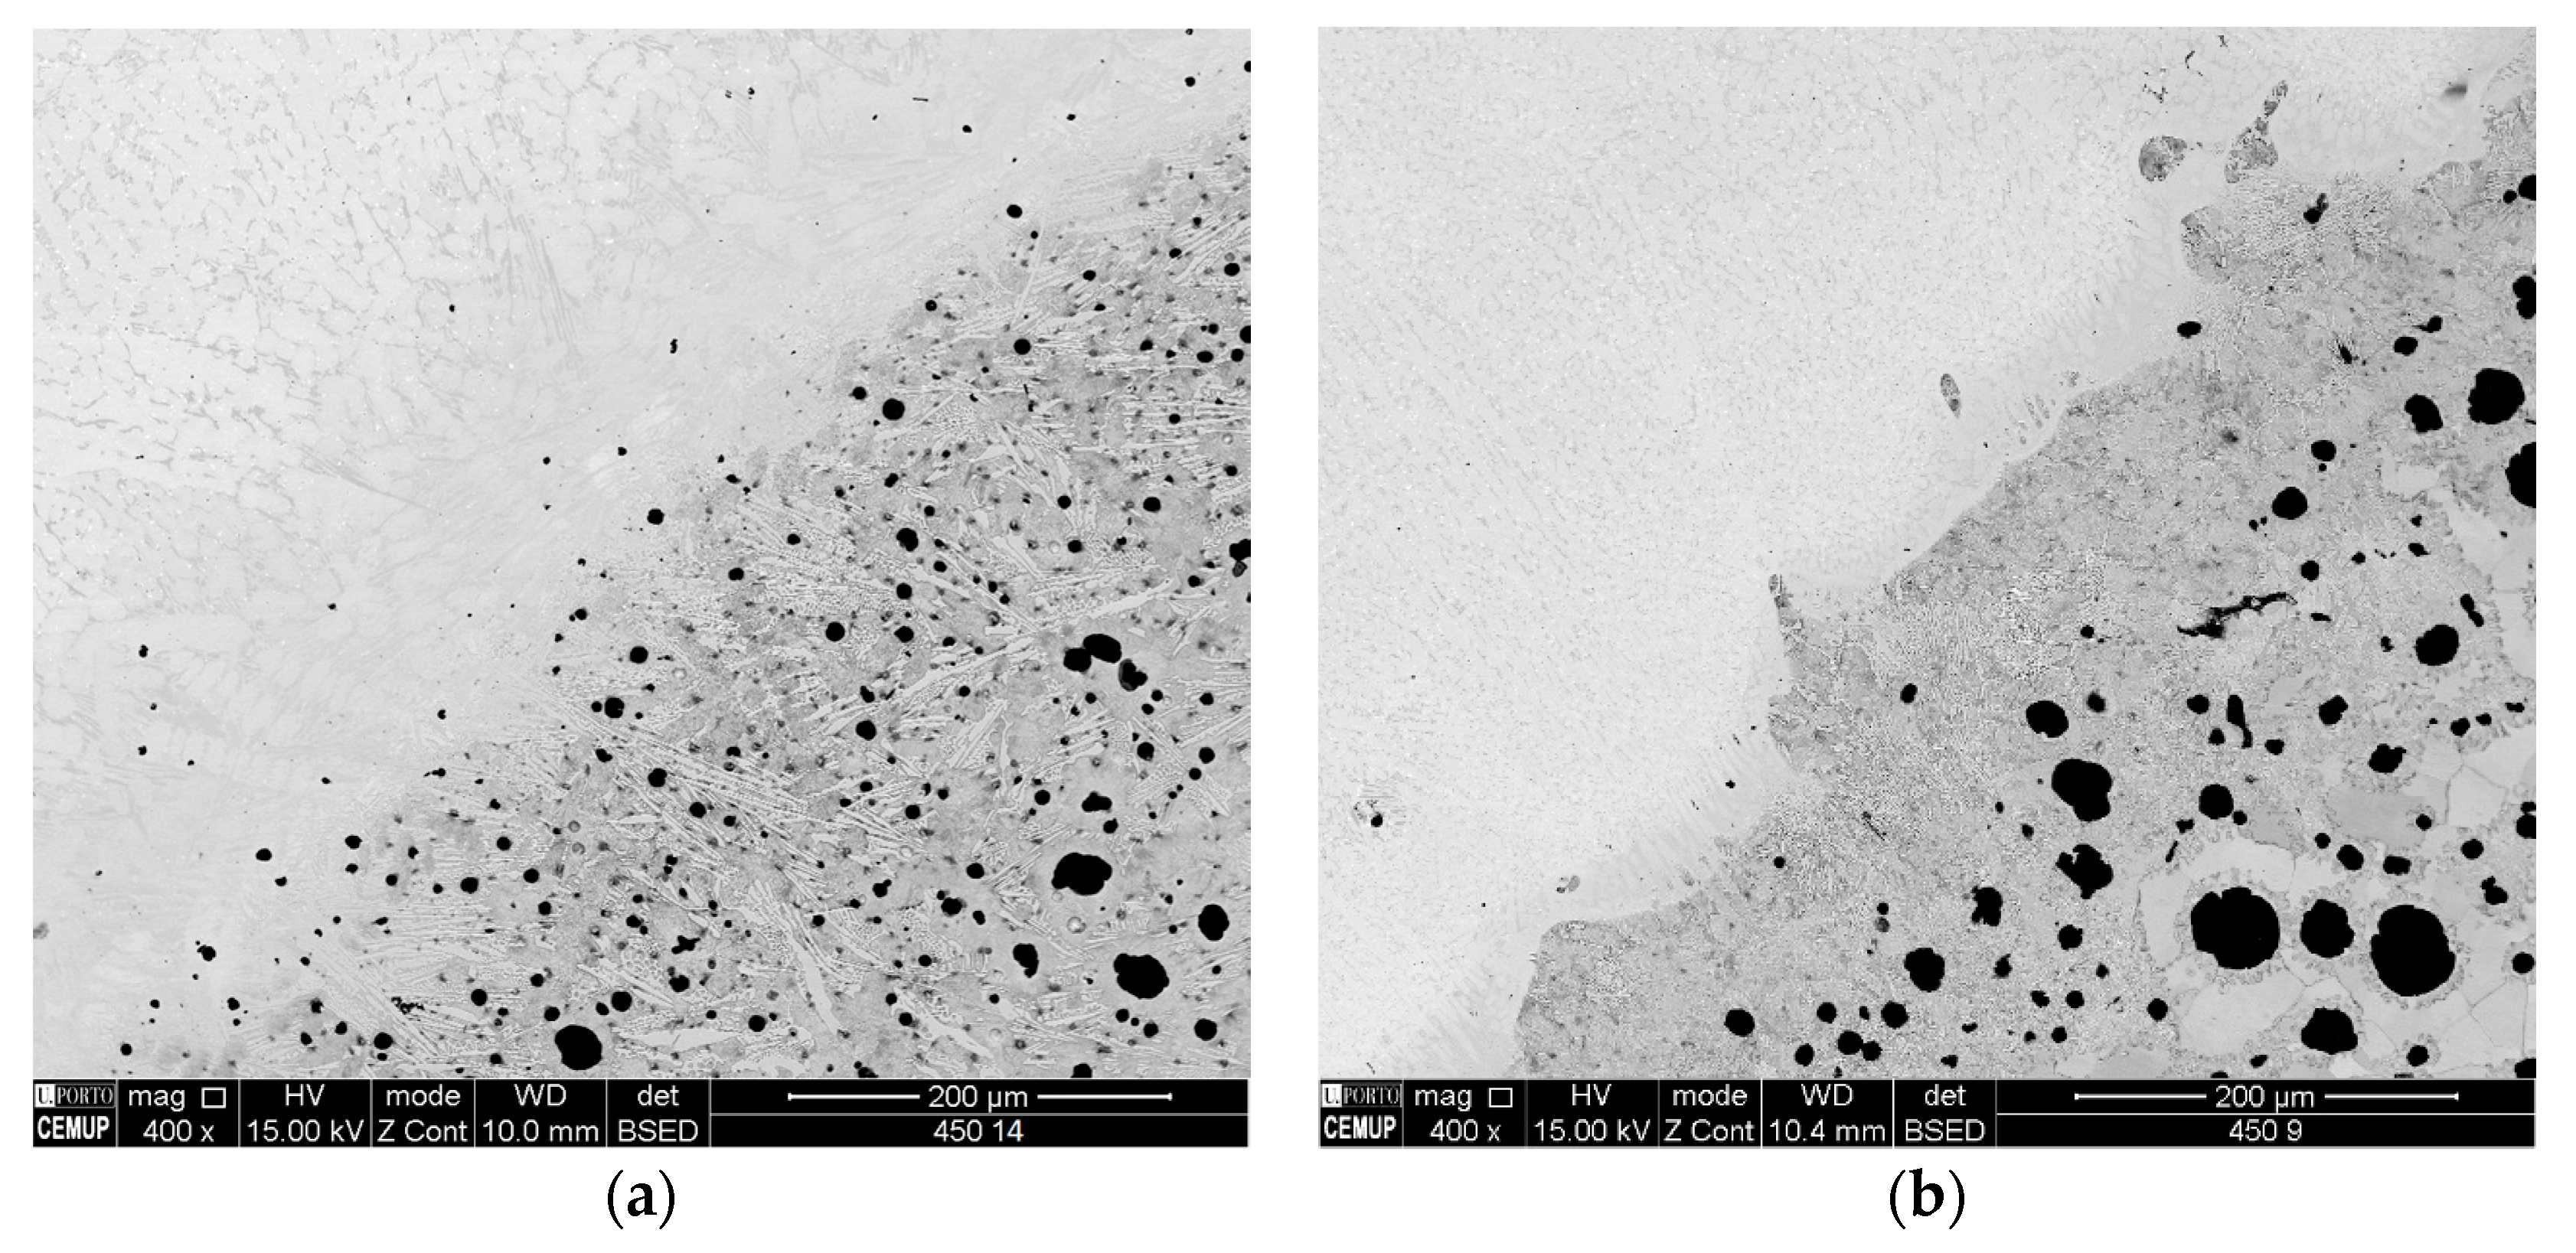

Figure 12.
SEM analysis of samples at 1000× magnification with 4% Nital etching: (a) sample 14_P300_N_P300_W4_P0 (UTS 448.0 MPa); (b) sample 09_P300_N_P300_W2_P0 (UTS 389.8 MPa); and (c) sample 18_P300_N_P0_W2_P700 (UTS 390.7 MPa).
Figure 12.
SEM analysis of samples at 1000× magnification with 4% Nital etching: (a) sample 14_P300_N_P300_W4_P0 (UTS 448.0 MPa); (b) sample 09_P300_N_P300_W2_P0 (UTS 389.8 MPa); and (c) sample 18_P300_N_P0_W2_P700 (UTS 390.7 MPa).
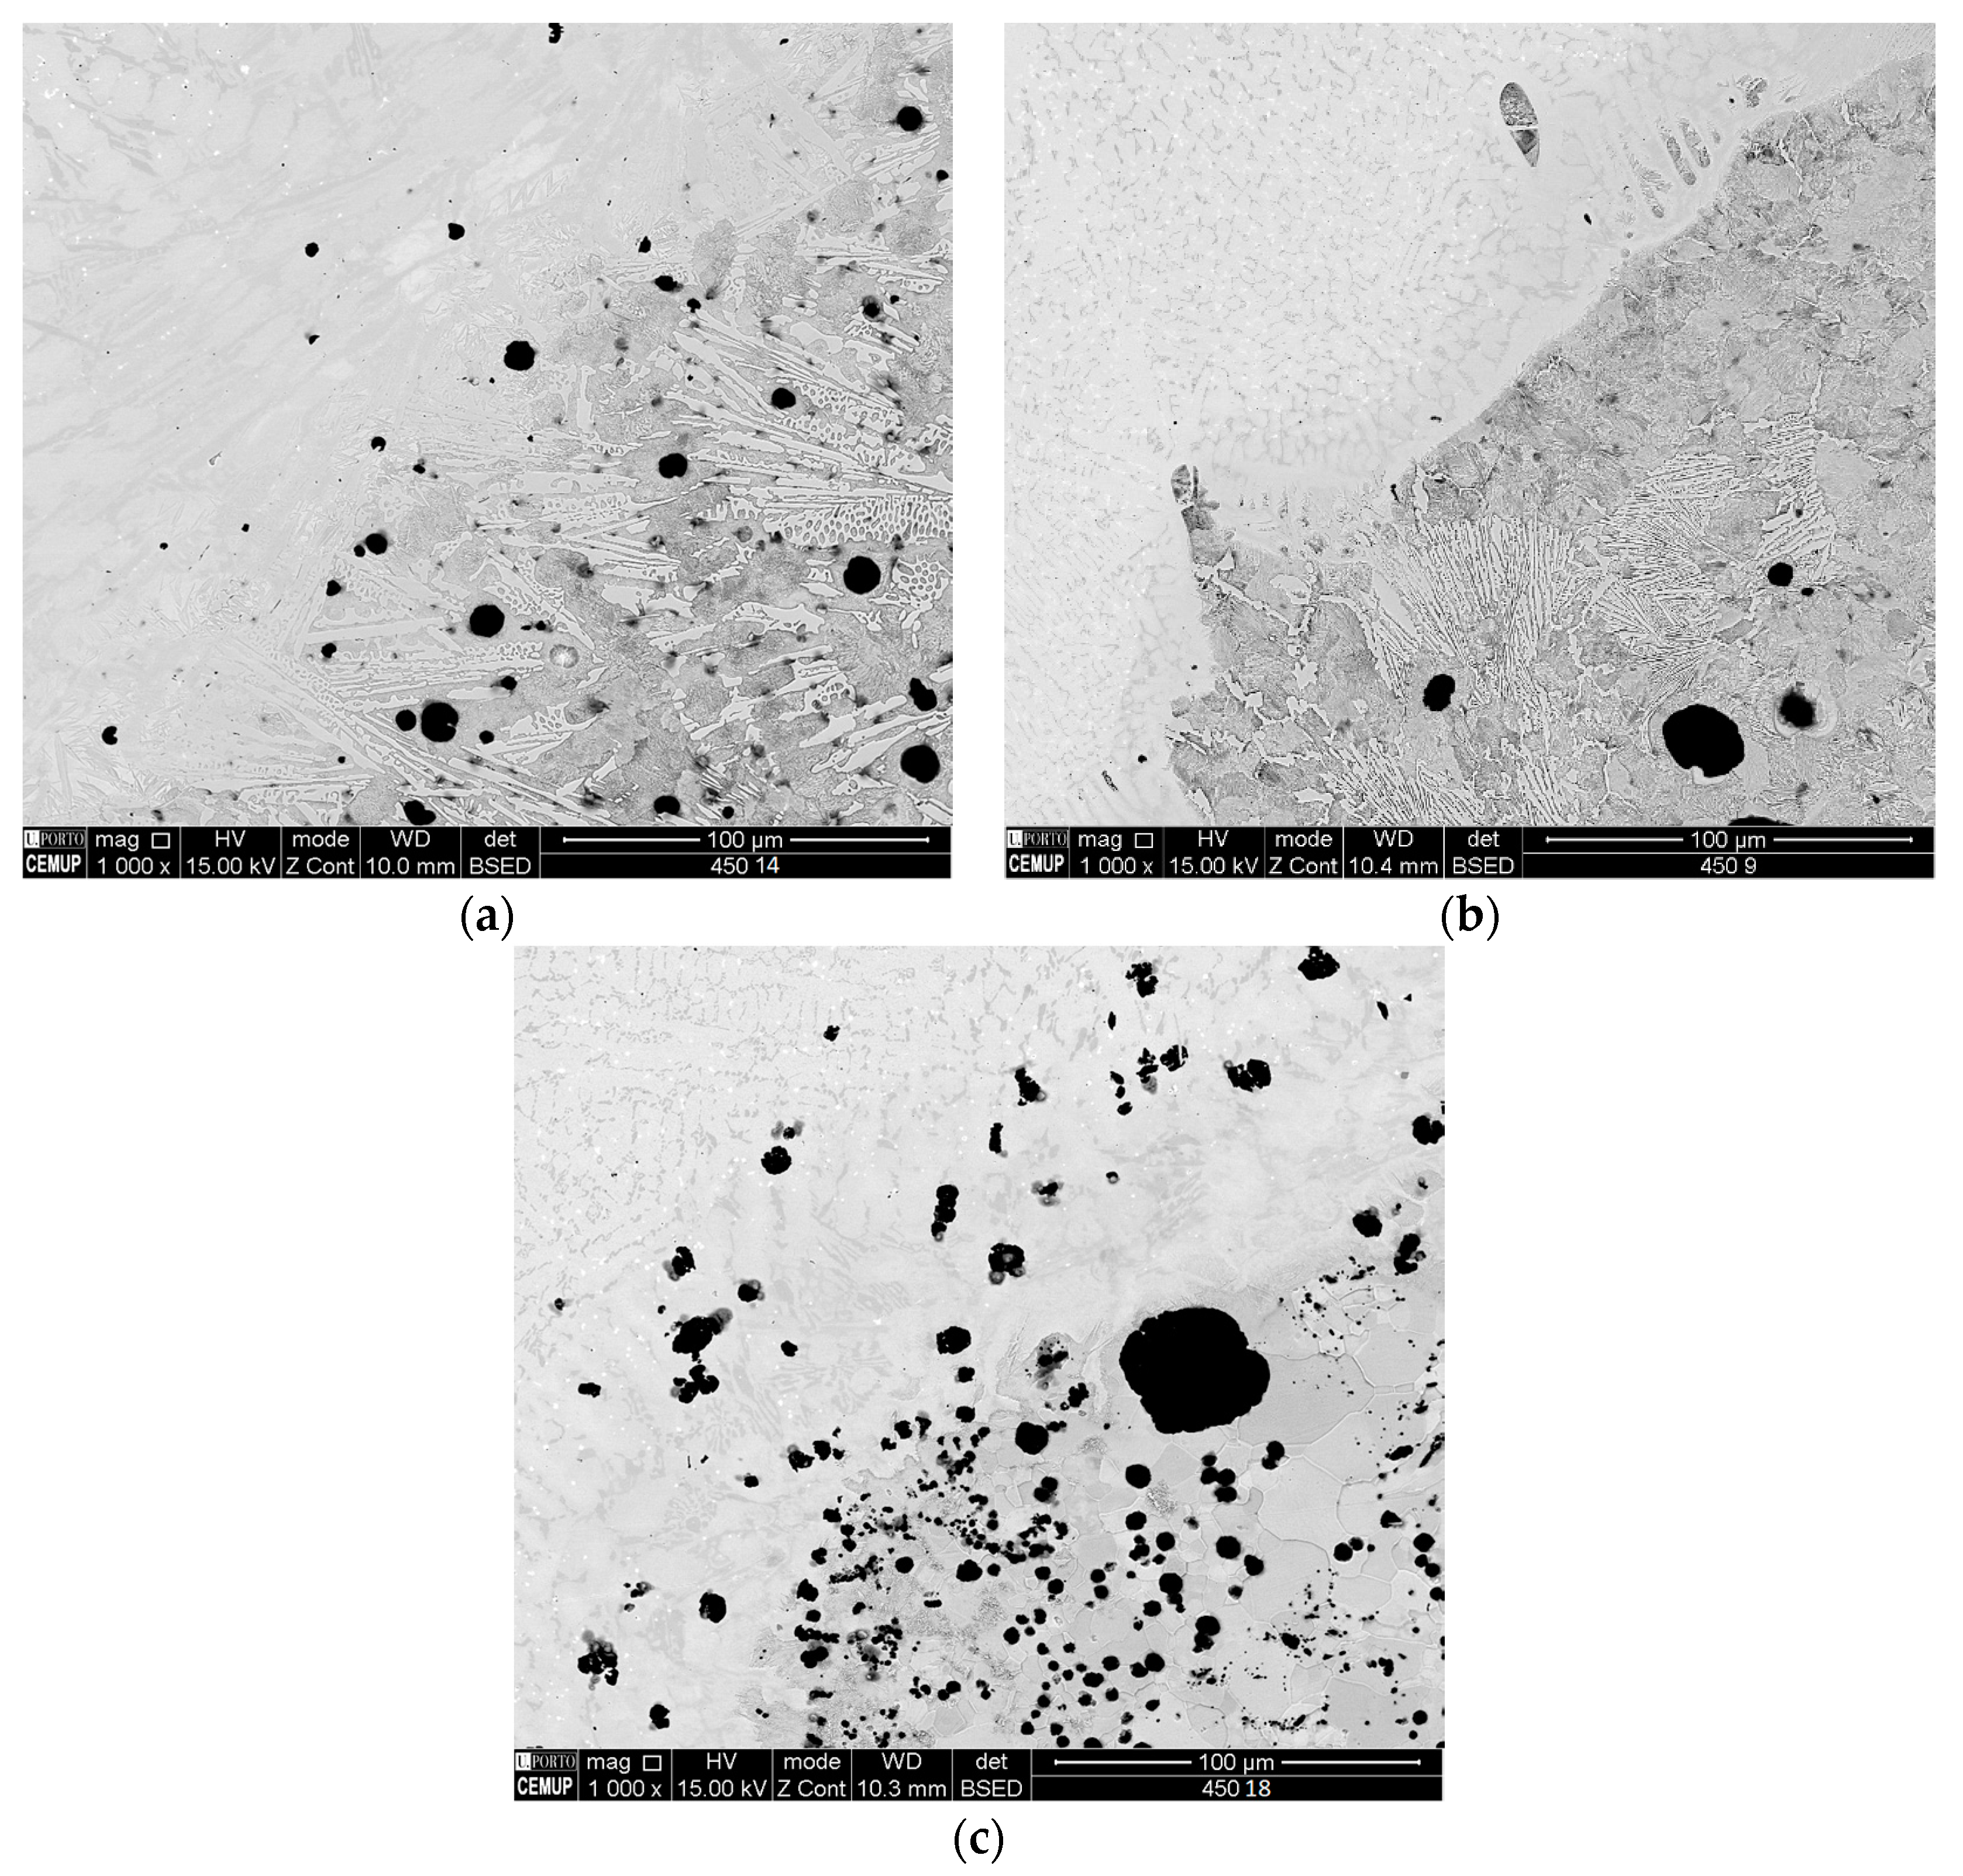
Figure 13.
SEM analysis of samples at 2500× magnification with 4% Nital etching: (a) sample 14_P300_N_P300_W4_P0 (UTS 448.0 MPa); (b) sample 09_P300_N_P300_W2_P0 (UTS 389.8 MPa); and (c) sample 18_P300_N_P0_W2_P700 (UTS 390.7 MPa).
Figure 13.
SEM analysis of samples at 2500× magnification with 4% Nital etching: (a) sample 14_P300_N_P300_W4_P0 (UTS 448.0 MPa); (b) sample 09_P300_N_P300_W2_P0 (UTS 389.8 MPa); and (c) sample 18_P300_N_P0_W2_P700 (UTS 390.7 MPa).

Figure 14.
Surface elements mapping for sample 14_P300_N_P300_W4_P0 (UTS of 448.0 MPa): (a) overview of mapped area; (b) carbon element-mapping; (c) chromium element-mapping; (d) iron element-mapping; (e) nickel element-mapping; and (f) silicon element-mapping.
Figure 14.
Surface elements mapping for sample 14_P300_N_P300_W4_P0 (UTS of 448.0 MPa): (a) overview of mapped area; (b) carbon element-mapping; (c) chromium element-mapping; (d) iron element-mapping; (e) nickel element-mapping; and (f) silicon element-mapping.
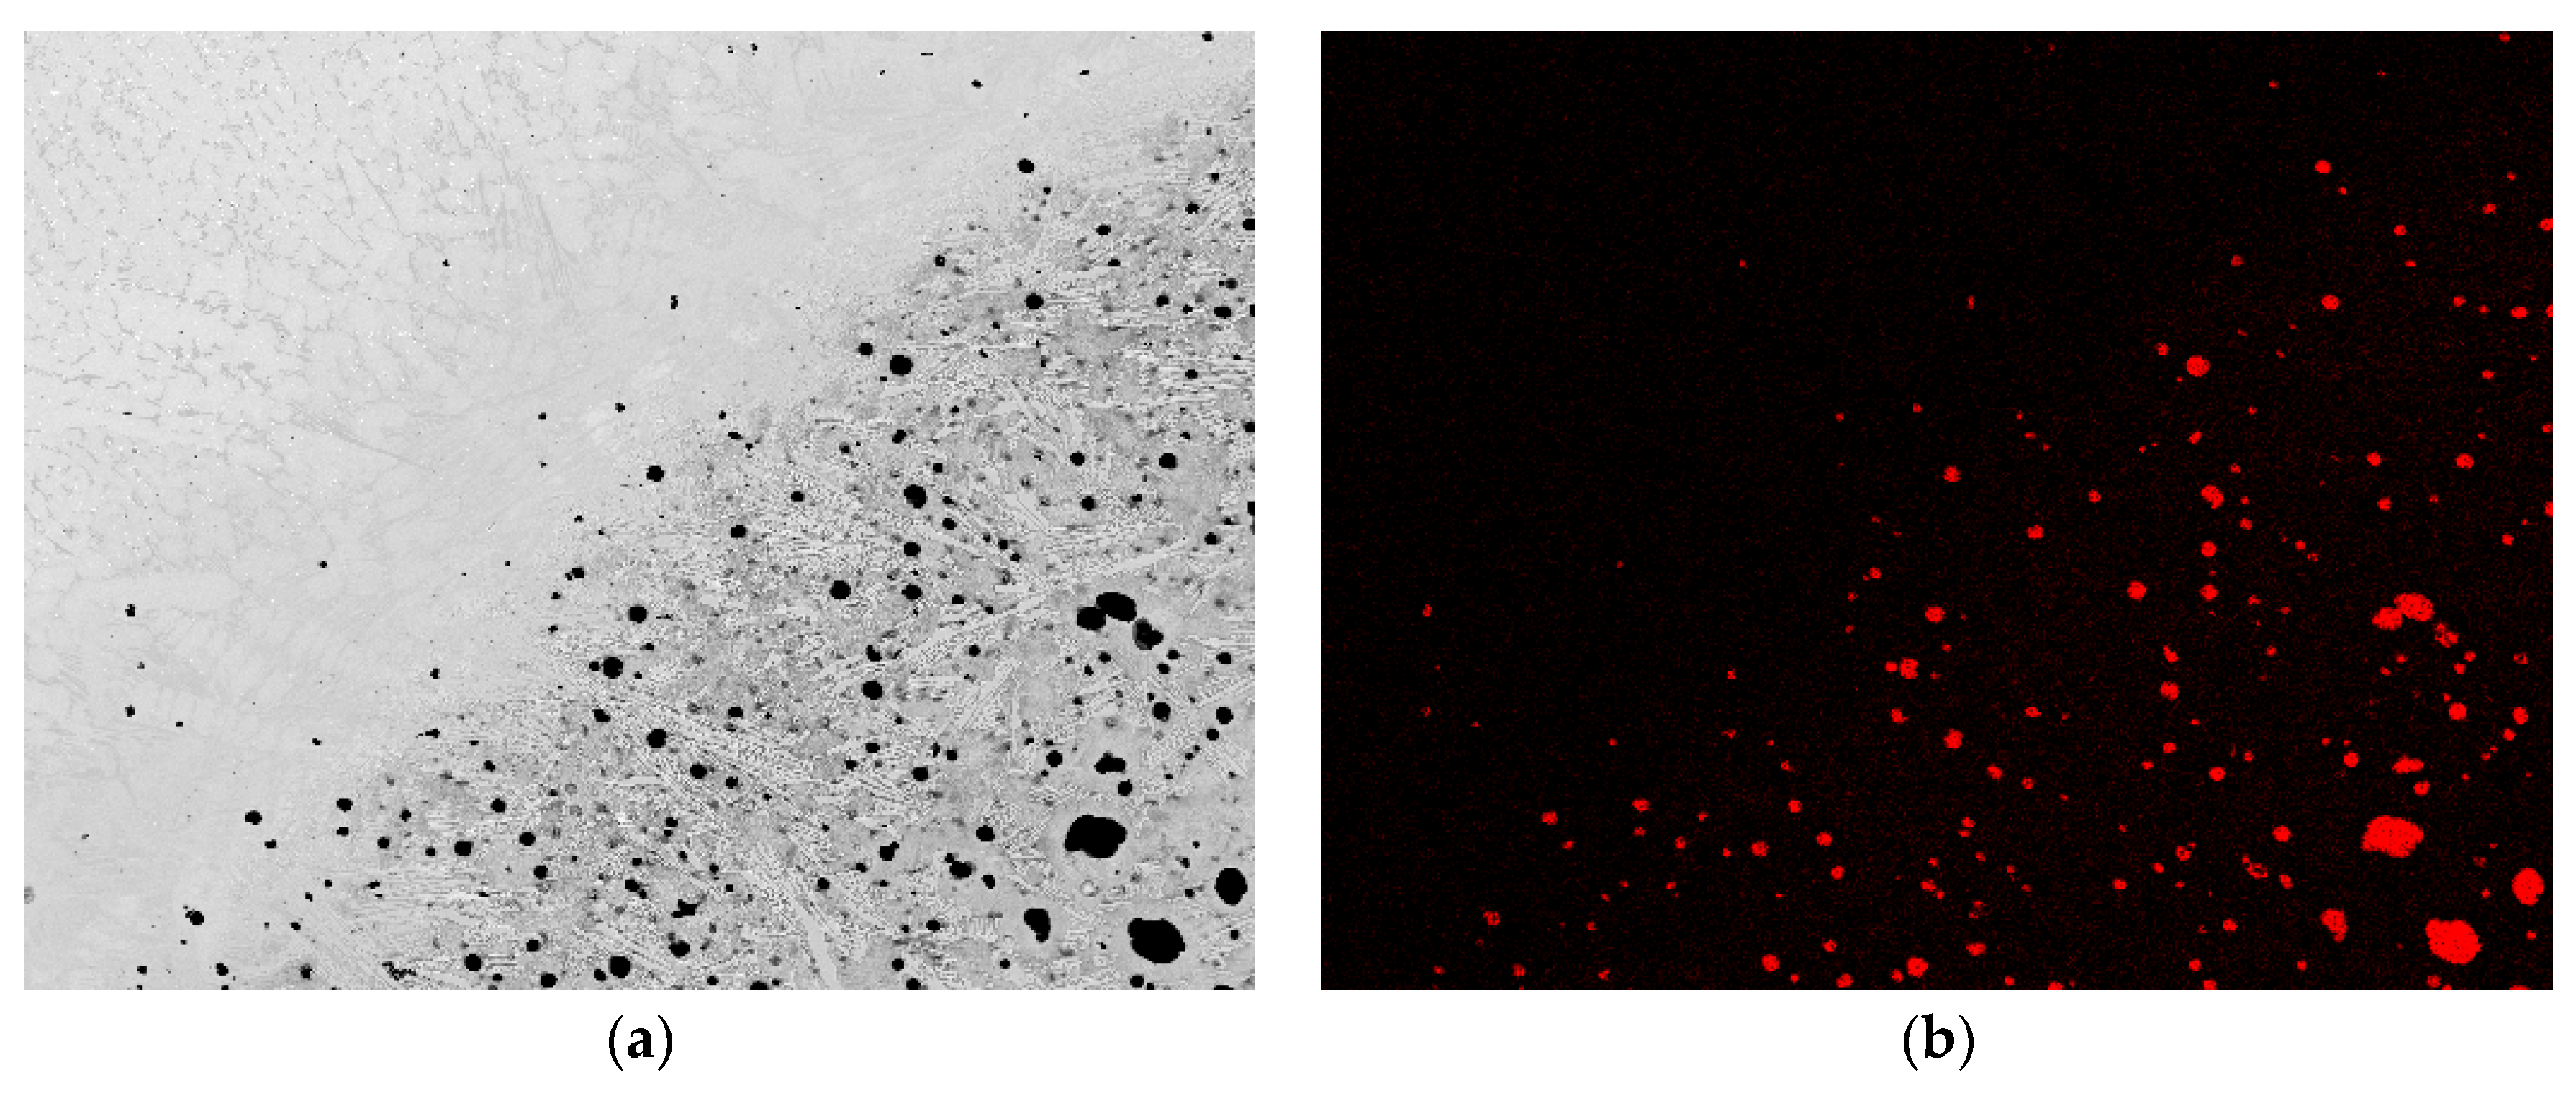

Figure 15.
Hardness test analysis results: (a) illustration of indentations row on sample 18_P300_N_P0_W2_P700; (b) hardness profile for sample 18_P300_N_P0_W2_P700 (UTS: 390.7 MPa); (c) hardness profile for sample 09_P300_N_P300_W2_P0 (UTS: 389.8 MPa); and (d) hardness profile for sample 14_P300_N_P300_W4_P0 (UTS: 448.0 MPa).
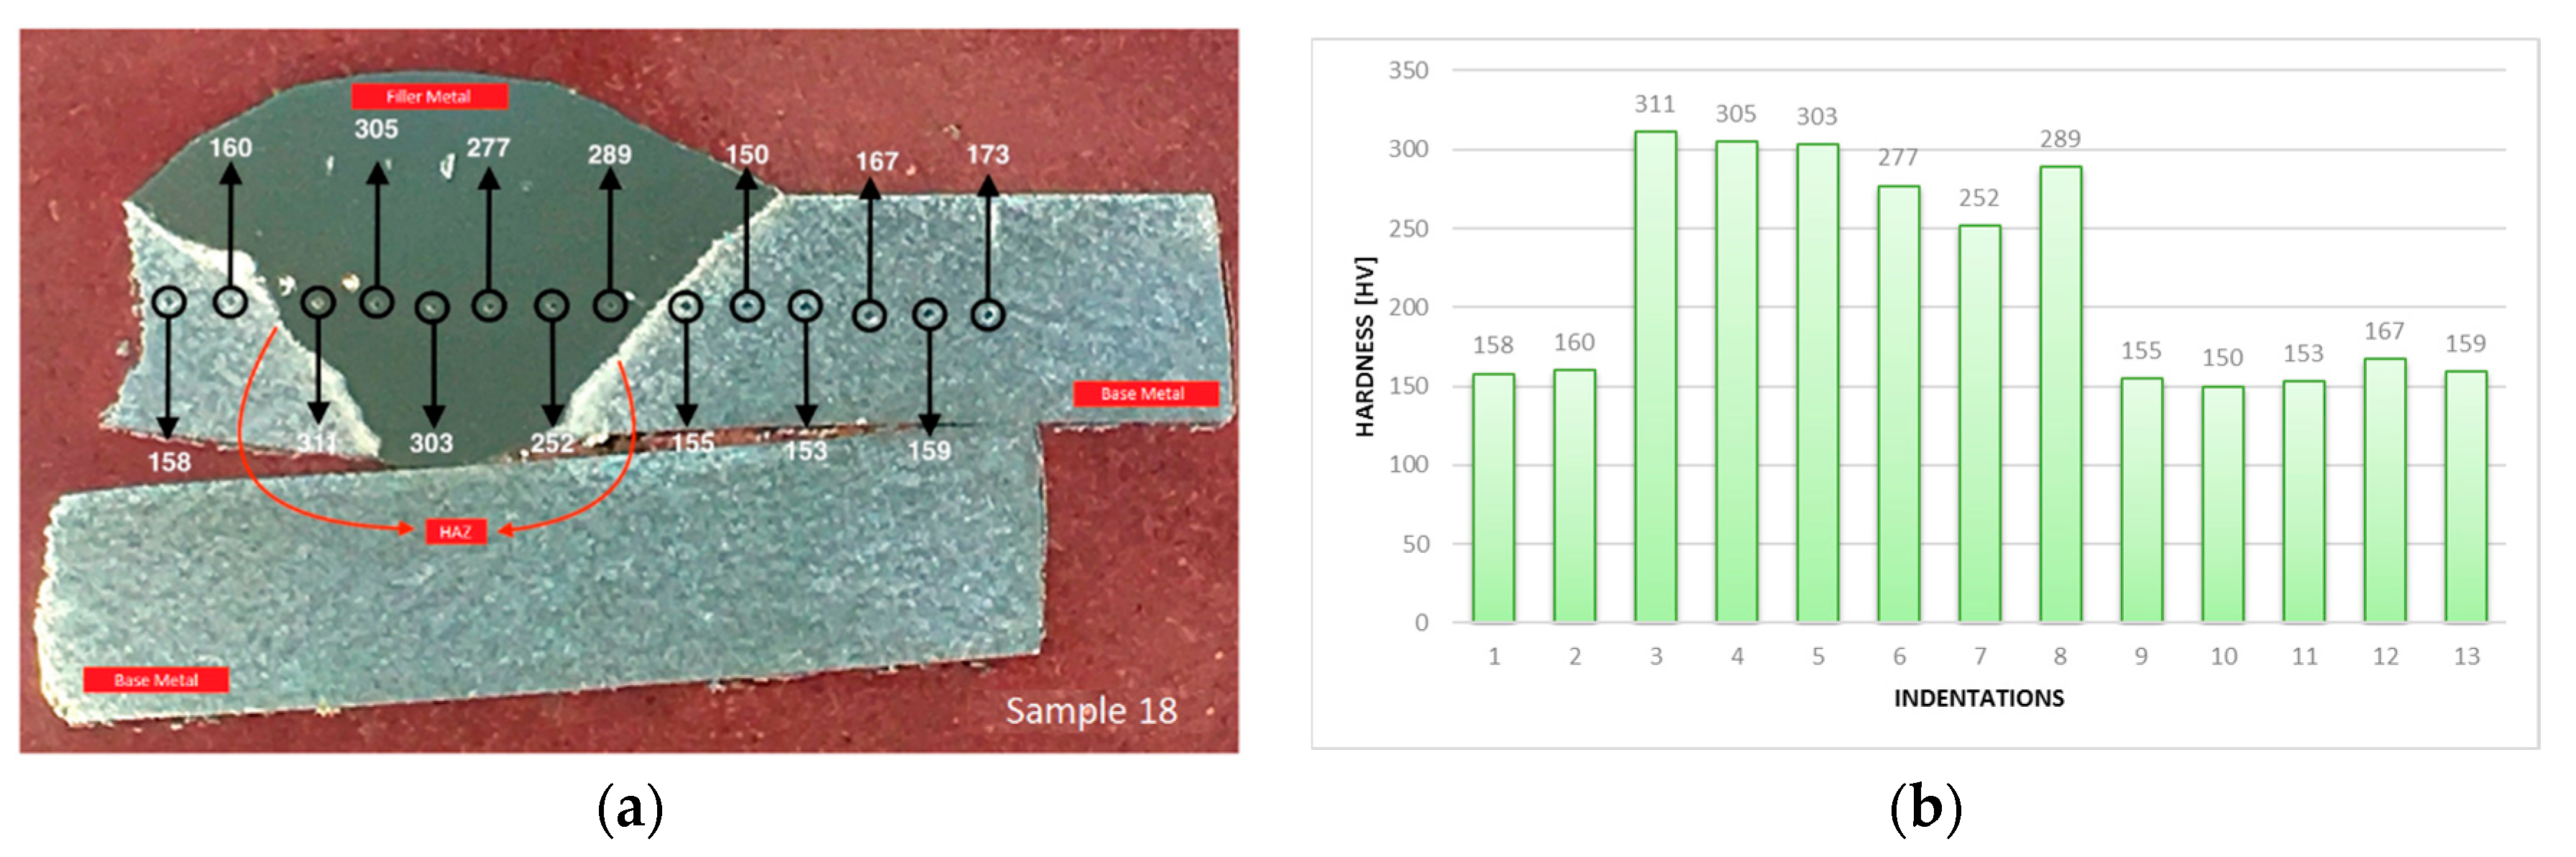
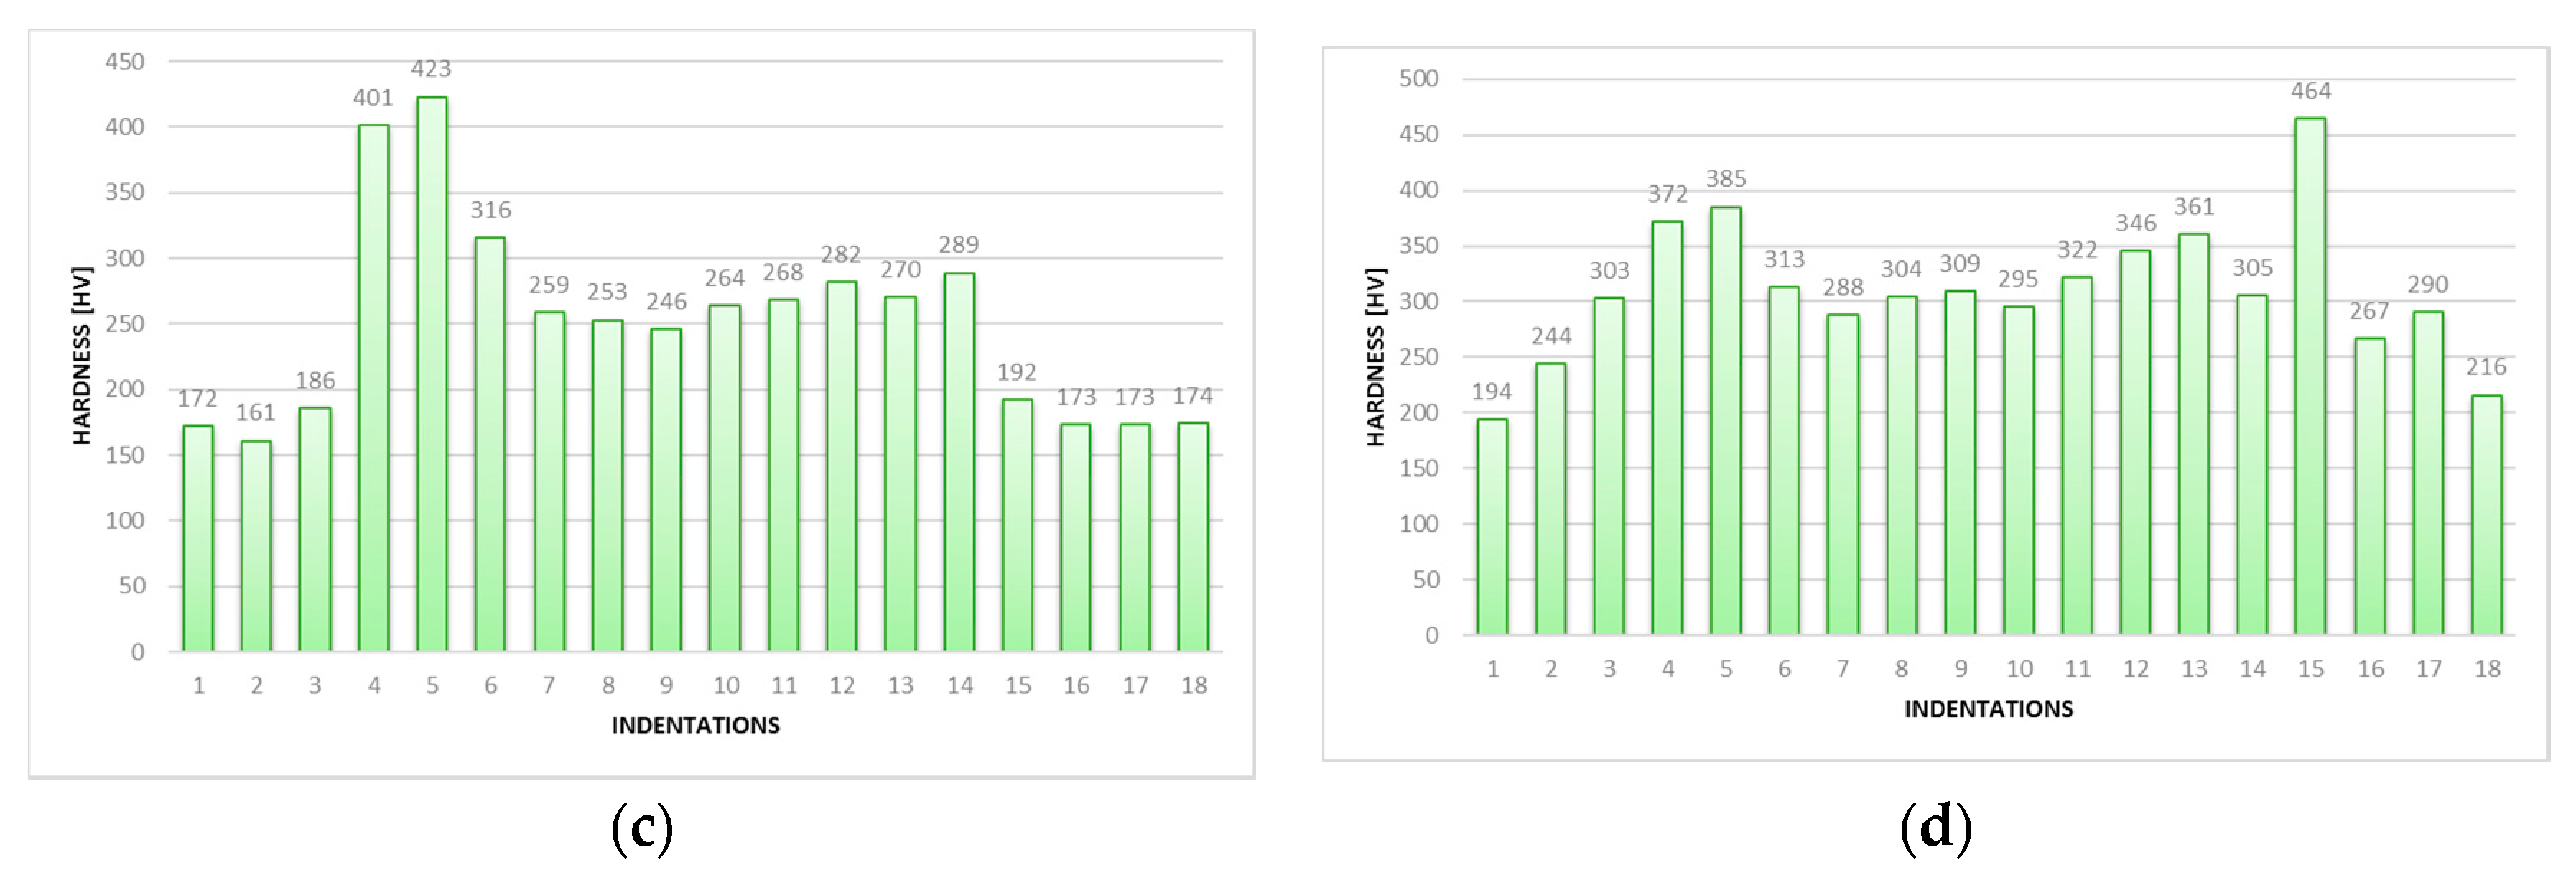
Figure 16.
Graphical representation of tensile test results.

Table 1.
SiboDur® 450-17 HD main material properties [18].
Table 1.
SiboDur® 450-17 HD main material properties [18].
| SiboDur® 450-17 HD Material Properties | |||
|---|---|---|---|
| ultimate yield strength (Rm) | ≥450 N/mm2 | hardness (HB) | 150–190 HBW |
| offset yield strength (Rp0.2) | ≥350 N/mm2 | density (ρ) | 7.1 (RT)–6.9 (600 °C) g/cm3 |
| strain (A) | ≥17% | ISO-V NOTCH impact (ak) | 6 (−40 °C) 15 (RT 1) J/cm2 |
| offset compressive strength (σd0.2) | ≥370 N/mm2 | thermal expansion coefficient | 12.2 (20–100 °C) 13.6 (20–600 °C) 10-6/K |
| shear stress (TaB) | ≥370 N/mm2 | specific thermal capacity | 0.51 (100 °C) 0.74 (600°C) J/(g·K) |
| young’s modulus (E) | 170 (RT 1) 155 (400 °C) kN/mm2 | specific electrical resistivity | 0.51 (RT 1) 0.95 (600 °C) μΩ·m |
| shear modulus (G) | 68 kN/mm2 | thermal conductivity | 30.9 (100 °C) 27.9 (600 °C) W/(K·m) |
1 Room temperature.
Table 2.
Welding and heat cycle parameters used to produce experimental samples.
| Sample Reference | Parameters/Sequence | ||||
|---|---|---|---|---|---|
| 1st Pre-Weld Heat Cycle | Ni Edge Weld Deposition | 2nd Pre-Weld Heat Cycle | Inconel Joint Welding | Post-Weld Heat Cycle | |
| 00_P0_W2 | - | - | - | 80 A/2 passes | - |
| 01_P0_W2 | |||||
| 02_P0_W2 | |||||
| 03_P0_W2_P700 | - | - | - | 80 A/2 passes | 700 °C/2 h * |
| 04_P0_W2_P700 | |||||
| 05_P0_W2_P700 | |||||
| 06_P0_W2_P800 | - | - | - | 80 A/2 passes | 800 °C/2 h * |
| 07_P0_W2_P800 | |||||
| 08_P0_W2_P800 | |||||
| 09_P300_N_P300_W2_P0 | 300 °C/2 h | 60 A | 300 °C/2 h | 80 A/2 passes | - |
| 10_P300_N_P300_W2_P0 | |||||
| 11_P300_N_P300_W2_P0 | |||||
| 12_P300_N_P300_W4_P0 | 300 °C/2 h | 60 A | 300 °C/2 h | 80 A/4 passes | - |
| 13_P300_N_P300_W4_P0 | |||||
| 14_P300_N_P300_W4_P0 | |||||
| 15_P300_N_P700_W2_P0 | 300 °C/2 h | 60 A | 700 °C/2 h | 80 A/2 passes | - |
| 16_P300_N_P700_W2_P0 | |||||
| 17_P300_N_P700_W2_P0 | |||||
| 18_P300_N_P0_W2_P700 | 300 °C/2 h | 60 A | - | 80 A/2 passes | 700 °C/2 h * |
| 19_P300_N_P0_W2_P700 | |||||
| 20_P300_N_P0_W2_P700 | |||||
* Samples cooled slowly to room temperature inside muffle furnace.
Table 3.
Sample preparation steps for viewing on microscope.
| Step | Description | Equipment | Procedure/Parameters | View of Equipment |
|---|---|---|---|---|
| 1 | Transverse sectional cut of the welded joint, exposing simultaneously the base metal, HAZ and weld metal. | Discotom 2 | Silicon carbide disc; cutting speed—45 m/s. |  |
| 2 | Mounting of cut section to a resin base/disc for ease of maneuverability | Struers Predopress | Thermohardening resin; disc diameter: 30 mm; pressure: 20 kN; temperature: 180 °C; time: 8 + 4 min. |  |
| 3 | Sample sanding to decrease surface roughness using sanding discs with different grit sizes | Struers Rotopol 1 | Speed: 150 rpm; Sanding grit disc sequence: 220, 500 and 1000 mesh (grain/in2); 90° sample rotation between grit sizes. |  |
| 4 | Sample polishing to decrease surface roughness using polishing buffer discs with diamond abrasive liquid solutions | Struers Rotopol 1 | Speed: 150 rpm; 1st polish: lubricant + 3 μm diamond abrasive solution; 2nd polish: 1 μm diamond abrasive solution; Rinse with water and alcohol. |  |
| 5 | Etching on sample surface to highlight micro structures | Hood | Nital 4% solution: a solution of HN03 at 64% v/v- >4 mL) mixed with 96% ethyl alcohol; exposure time: 15 s. | - |
Table 4.
Tensile test results.
| Sample Reference | Tensile Test Results | |||
|---|---|---|---|---|
| UTS (MPa) | Average UTS (MPa) | Strain (%) | Average Strain (%) | |
| 00_P0_W2 | 302.8 | 299.8 ± 8.9 | 6.4 | 6.4 |
| 01_P0_W2 | 293.5 | 6.0 | ||
| 02_P0_W2 | 306.2 | 6.8 | ||
| 03_P0_W2_P700 | 337.6 | 359.4 ± 23.1 | 7.4 | 9.5 |
| 04_P0_W2_P700 | 357.0 | 8.3 | ||
| 05_P0_W2_P700 | 383.6 | 12.9 | ||
| 06_P0_W2_P800 | 322.6 | 331.7 ± 26.3 | 7.1 | 7.5 |
| 07_P0_W2_P800 | 361.4 | 8.8 | ||
| 08_P0_W2_P800 | 311.2 | 6.5 | ||
| 09_P300_N_P300_W2_P0 | 389.8 | 385.1 ± 13.3 | 10.2 | 9.3 |
| 10_P300_N_P300_W2_P0 | 394.9 | 8.9 | ||
| 11_P300_N_P300_W2_P0 | 371.3 | 8.7 | ||
| 12_P300_N_P300_W4_P0 | 410.3 | 430.1 ± 25.2 | 11.5 | 12.5 |
| 13_P300_N_P300_W4_P0 | 432.1 | 12.9 | ||
| 14_P300_N_P300_W4_P0 | 448.0 | 13.1 | ||
| 15_P300_N_P700_W2_P0 | 255.8 | 282.8 ± 23.5 | 5.2 | 5.6 |
| 16_P300_N_P700_W2_P0 | 299.0 | 5.2 | ||
| 17_P300_N_P700_W2_P0 | 293.6 | 6.5 | ||
| 18_P300_N_P0_W2_P700 | 390.7 | 373.5 ± 16.0 | 11.4 | 9.9 |
| 19_P300_N_P0_W2_P700 | 370.9 | 9.4 | ||
| 20_P300_N_P0_W2_P700 | 359.1 | 8.9 | ||
Table 5.
Sample seriation.
| Group of Parameters | Sample Reference | Average UTS (MPa) |
|---|---|---|
| Accepted | P300_N_P300_W4_P0 | 430.1 ± 25.2 |
| P300_N_P300_W2_P0 | 385.1 ± 13.3 | |
| P300_N_P0_W2_P700 | 373.5 ± 16.0 | |
| P0_W2_P700 | 359.4 ± 23.1 | |
| Rejected | P0_W2_P800 | 331.7 ± 26.3 |
| P0_W2 | 299.8 ± 8.9 | |
| P300_N_P700_W2_P0 | 282.8 ± 23.5 |
Table 6.
Comparison between experimental results and sample preparation parameters.
| Group of Parameters | Average UTS (MPa) | Average Strain (%) | 1st Pre-Weld Heat Cycle | Ni edge Weld Deposition | 2nd Pre-Weld Heat Cycle | Inconel Joint Welding | PWHT |
|---|---|---|---|---|---|---|---|
| P300_N_P300_W4_P0 | 430.1 ± 25.2 | 12.5 | 300 °C/2 h | 60 A | 300 °C/2 h | 80 A/4 passes | - |
| P300_N_P300_W2_P0 | 385.1 ± 13.3 | 9.3 | 300°C/2 h | 60 A | 300 °C/2 h | 80 A/2 passes | - |
| P300_N_P0_W2_P700 | 373.5 ± 16.0 | 9.9 | 300°C/2 h | 60 A | - | 80 A/2 passes | 700 °C/2 h |
| P0_W2_P700 | 359.4 ± 23.1 | 9.5 | - | - | - | 80 A/2 passes | 700 °C/2 h |
| P0_W2_P800 | 331.7 ± 26.3 | 7.5 | - | - | - | 80 A/2 passes | 800 °C/2 h |
| P0_W2 | 299.8 ± 8.9 | 6.4 | - | - | - | 80 A/2 passes | - |
| P300_N_P700_W2_P0 | 282.8 ± 23.5 | 5.6 | 300 °C/2 h | 60 A | 700 °C/2 h | 80 A/2 passes | - |
Table 7.
HAZ width at peak temperature of 723 °C.
| Pass | Y | Tp | Tm | T0 | k | g | Q | V | α | ρ | Cp |
|---|---|---|---|---|---|---|---|---|---|---|---|
| 1st | 9.55 | 723 | 1200 | 250 * | 0.279 | 4 | 810 | 1.5 | 77.05 | 0.0071 | 0.51 |
| 2nd | 11.3 | 723 | 1200 | 300 | 0.279 | 4 | 810 | 1.5 | 77.05 | 0.0071 | 0.51 |
| 3rd | 11.3 | 723 | 1200 | 300 | 0.279 | 4 | 810 | 1.5 | 77.05 | 0.0071 | 0.51 |
| 4th | 11.3 | 723 | 1200 | 300 | 0.279 | 4 | 810 | 1.5 | 77.05 | 0.0071 | 0.51 |
* Corresponding to a 50 °C drop in pre-heat temperature due to sample transportation and jig positioning.
Table 8.
Weld centerline cooling rates for sample P300_N_P300_W4_P0.
| Pass | R | K | ρ | Cp | h | Q | Ti | T0 |
|---|---|---|---|---|---|---|---|---|
| 1st | 4.18 | 0.28 | 0.0071 | 0.51 | 4 | 810 | 550 | 250 * |
| 2nd | 2.42 | 0.28 | 0.0071 | 0.51 | 4 | 810 | 550 | 300 |
| 3rd | 2.42 | 0.28 | 0.0071 | 0.51 | 4 | 810 | 550 | 300 |
| 4th | 2.42 | 0.28 | 0.0071 | 0.51 | 4 | 810 | 550 | 300 |
* Corresponding to a 50 °C drop in pre-heat temperature due to sample transportation and jig positioning.
© 2017 by the authors. Licensee MDPI, Basel, Switzerland. This article is an open access article distributed under the terms and conditions of the Creative Commons Attribution (CC BY) license (http://creativecommons.org/licenses/by/4.0/).
Share and Cite
MDPI and ACS Style
Gouveia, R.M.; Silva, F.J.G.; Paiva, O.C.; Andrade, M.F.; Silva, L.; Moselli, P.C.; Papis, K.J.M. Study of the Heat-Treatments Effect on High Strength Ductile Cast Iron Welded Joints. Metals 2017, 7, 382. https://doi.org/10.3390/met7090382
AMA Style
Gouveia RM, Silva FJG, Paiva OC, Andrade MF, Silva L, Moselli PC, Papis KJM. Study of the Heat-Treatments Effect on High Strength Ductile Cast Iron Welded Joints. Metals. 2017; 7(9):382. https://doi.org/10.3390/met7090382
Chicago/Turabian StyleGouveia, Ronny M., Francisco J. G. Silva, Olga C. Paiva, Maria F. Andrade, Luiz Silva, Paulo C. Moselli, and Konrad J. M. Papis. 2017. "Study of the Heat-Treatments Effect on High Strength Ductile Cast Iron Welded Joints" Metals 7, no. 9: 382. https://doi.org/10.3390/met7090382
Note that from the first issue of 2016, this journal uses article numbers instead of page numbers. See further details here.