A Combined Experimental-Numerical Approach for Investigating Texture Evolution of NiTi Shape Memory Alloy under Uniaxial Compression

College of Mechanical and Electrical Engineering, Harbin Engineering University, Harbin 150001, China
*
Author to whom correspondence should be addressed.
Metals 2017, 7(9), 356; https://doi.org/10.3390/met7090356
Submission received: 26 July 2017
/
Revised: 29 August 2017
/
Accepted: 7 September 2017
/
Published: 9 September 2017
(This article belongs to the Special Issue Shape Memory Alloys 2017)
Abstract
:Texture evolution of NiTi shape memory alloy was investigated during uniaxial compression deformation at 673 K (400 °C) by combining crystal plasticity finite element method with electron back-scattered diffraction experiment and transmission electron microscope experiment. Transmission electron microscope observation indicates that dislocation slip rather than deformation twinning plays a dominant role in plastic deformation of B2 austenite NiTi shape memory alloy at 673 K (400 °C). Electron back-scattered diffraction experiment illustrates heterogeneous microstructure evolution resulting from dislocation slip in NiTi shape memory alloy at 673 K (400 °C). {110}<100>, {010}<100> and {110}<111> slip systems are introduced into a crystal plasticity constitutive model. Based on the constructed representative volume element model and the extracted crystallographic orientations, particle swarm optimization algorithm is used to identify crystal plasticity parameters from experimental results of NiTi shape memory alloy. Using the fitted material parameters, a crystal plasticity finite element method is used to predict texture evolution of NiTi shape memory alloy during uniaxial compression deformation. The simulation results agree well with the experimental ones. With the progression of plastic deformation, a crystallographic plane of NiTi shape memory alloy gradually rotates to be vertical to the loading direction, which lays the foundation for forming the <111> fiber texture.
1. Introduction
NiTi shape memory alloy (SMA) has attracted increasing attention in the field of materials science and engineering because of its excellent shape memory effect, outstanding superelasticity and perfect biological compatibility [1,2,3]. Plastic deformation plays a significant role in manufacturing the products of NiTi SMA. Over the past decades, a number of investigations have attempted to identify, quantify or at least clarify the nature and significance of various mechanisms that contribute to understanding plastic deformation of NiTi SMA under different deformation conditions. In general, a plastic deformation mechanism of NiTi SMA is temperature-dependent and thus exhibits a predominant distinction in the case of various temperatures, where multiple plastic deformation mechanisms can occur, including stress-induced martensite phase transformation, dislocation slip, deformation twinning, grain boundary slide, grain rotation, dislocation climb and grain boundary migration [4,5]. In particular, above the austenite finish temperature (), stress-induced martensite transformation occurs up to the martensite desist temperature (). Above the temperature, stress-induced martensite transformation can no longer take place and NiTi SMA still exhibits high ductility (exceeding 30%), which is unusual for B2 intermetallics [6]. Therefore, it is of considerable importance to experimentally investigate plastic deformation of NiTi SMA above the temperature. Moreover, it can be generally accepted that dislocation slip plays a dominant role in plastic deformation of NiTi SMA above the temperature. The slip modes {110}<100> and {010}<100> are identified and commonly reported during plastic deformation of NiTi SMA [7,8,9]. However, these two slip modes provide only three independent slip systems, and thus they are unable to accommodate all the strains for generalized polycrystalline plasticity since at least five independent slip systems are required for dislocations to accommodate arbitrary plastic deformation [10]. Consequently, in addition to <100> slip processes, alternate deformation mechanisms must be activated to contribute to enhancing the plasticity. Benafan et al. [5] have proposed that there are two possibilities to help satisfy the requirements for generalized plasticity. One possibility is the activation of a secondary slip system, especially the {110}<111> slip system, which is also validated by Ezaz et al. [11]. The other possibility is deformation twinning, especially (114) compound twinning, which is also observed by Ezaz et al. [12]. Furthermore, it is very necessary to clarify and understand the influence of plastic deformation mechanisms on the overall mechanical response of NiTi SMA above the temperature, which contributes to giving a deep insight into the microstructural evolution of NiTi SMA during plastic deformation and further broadening the engineering applications of NiTi SMA.
So far, many theoretical analyses and numerical simulations, which focus on coupling plasticity and phase transformation of NiTi SMA, have attracted a great deal of attention. Different macroscopic phenomenological models [13,14] and micromechanical models [8,15] have been constructed to describe corresponding thermo-mechanical properties of NiTi SMA and these models have played an important role in promoting the extensive engineering application of NiTi SMA. By contrast, in terms of simulating plastic deformation of NiTi SMA above the temperature, our literature search has shown that both the microscale and macroscale simulations have not been fully addressed yet. In particular, the microscale simulations, which deal with various plastic deformation mechanisms of NiTi SMA, need to be considered.
The goal of the present study is to develop an experiment-based crystal plasticity finite element model to investigate the texture evolution of NiTi SMA subjected to uniaxial compression deformation at 673 K (400 °C). Particle swarm optimization (PSO) algorithm is used to calibrate crystal plasticity parameters from experimental data. Numerical results of polycrystalline model are then compared with correspondingly experimental results. It is worth noting that the procedure of calibrating crystal plasticity parameters on the basis of the PSO algorithm and the investigation of uniaxial compression deformation of NiTi SMA at 673 K (400 °C) by means of crystal plasticity finite element method (CPFEM) at the grain scale has never been reported in the literature.
2. Materials and Methods
The as-received NiTi SMA bar with a diameter of 12 mm, which possesses a nominal composition of Ni50.9Ti49.1 (at %), was prepared by virtue of vacuum induction melting method and subsequent rolling at 1073 K (800 °C). The NiTi SMA samples with the diameter of 4 mm and the height of 6 mm were all taken from the as-received NiTi SMA bar via electro-discharge machining (EDM, DK7725, Jiangsu Dongqing CNC Machine Tool Co. Ltd, Taizhou, China) The NiTi SMA samples were placed between the top anvil and the bottom one of INSTRON-5500R universal testing machine (Instron Corporation, Norwood, MA, USA) and then were compressed at the various deformation degrees by 20%, 30% and 40%, respectively, at the strain rate of 0.001 s−1 and at the temperature of 673 K (400 °C).
To acquire the plastic deformation mechanism of NiTi SMA subjected to uniaxial compression at the temperature of 673 K (400 °C), NiTi SMA sample subjected to compression deformation degree of 40% was characterized by transmission electron microscope (TEM). The foil for TEM observation was firstly ground to 70 μm thickness through mechanical polishing and then was thinned by twin-jet polishing in an electrolyte consisting of 6% HClO4, 34% C4H10O and 60% CH3OH by volume fraction at 253 K (−20 °C) at a potential of 30 V. Finally, TEM observations were conducted on a FEI TECNAI G220 microscope (FEI Corporation, Hillsboro, OR, USA) with point resolution of 0.23 nm and linear resolution of 0.14 nm at an accelerating voltage of 200 kV. Furthermore, to investigate the evolution of microstructure and crystallographic orientation of NiTi SMA samples, electron back-scattered diffraction (EBSD) experiments were conducted on these samples using a Zeiss Supra 55 scanning electron microscope (SEM, Carle Carl Zeiss Company, Oberkochen, German) coupled with OXFORD EBSD (Oxford Instruments, Oxford, UK) instrument. To obtain a suitable surface for EBSD observation, electro-polishing was conducted in an electrolyte consisting of 10% HNO3 and 90% CH3OH by volume fraction at 253 K (−20 °C) at a potential of 18 V. Due to the relatively large scanning area, the scan step was chosen to be 2 μm in simultaneous consideration of scanning time and scanning resolution.
3. Results and Discussion
3.1. Investigation on Microstructure Evolution
Figure 1 demonstrates TEM bright field image, the corresponding dark field image and a selected area electron diffraction (SAED) pattern of an NiTi SMA sample subjected to uniaxial compression at the deformation degree of 40% at 673 K (400 °C). It can be observed from Figure 1 that the matrix of NiTi SMA belongs to B2 austenite according to the SAED pattern. In addition, plenty of dislocations appear in the matrix of NiTi SMA and deformation band is formed. This observation provides a direct experimental evidence that in the case of uniaxial compression at 673 K (400 °C), no deformation twins are found, and thus dislocation slip is responsible for plastic deformation mechanism of NiTi SMA.
Figure 2 demonstrates the initial microstructure of the cross-section of NiTi SMA specimen obtained from EBSD experiment, where RD and ND stand for rolling direction and normal direction, respectively. It can be seen from Figure 2 that the microstructure is characterized by the equiaxed ones. In addition, the average grain diameter of individual grains is determined to be about 25 μm by means of the statistical analysis of individual grains in the scanning area. Moreover, these equiaxed grains indicate that recrystallization seems to occur during thermo-mechanical processing of the as-received NiTi SMA, which would result in a relatively weak texture compared with most alloys processed at room or moderate temperature [5].
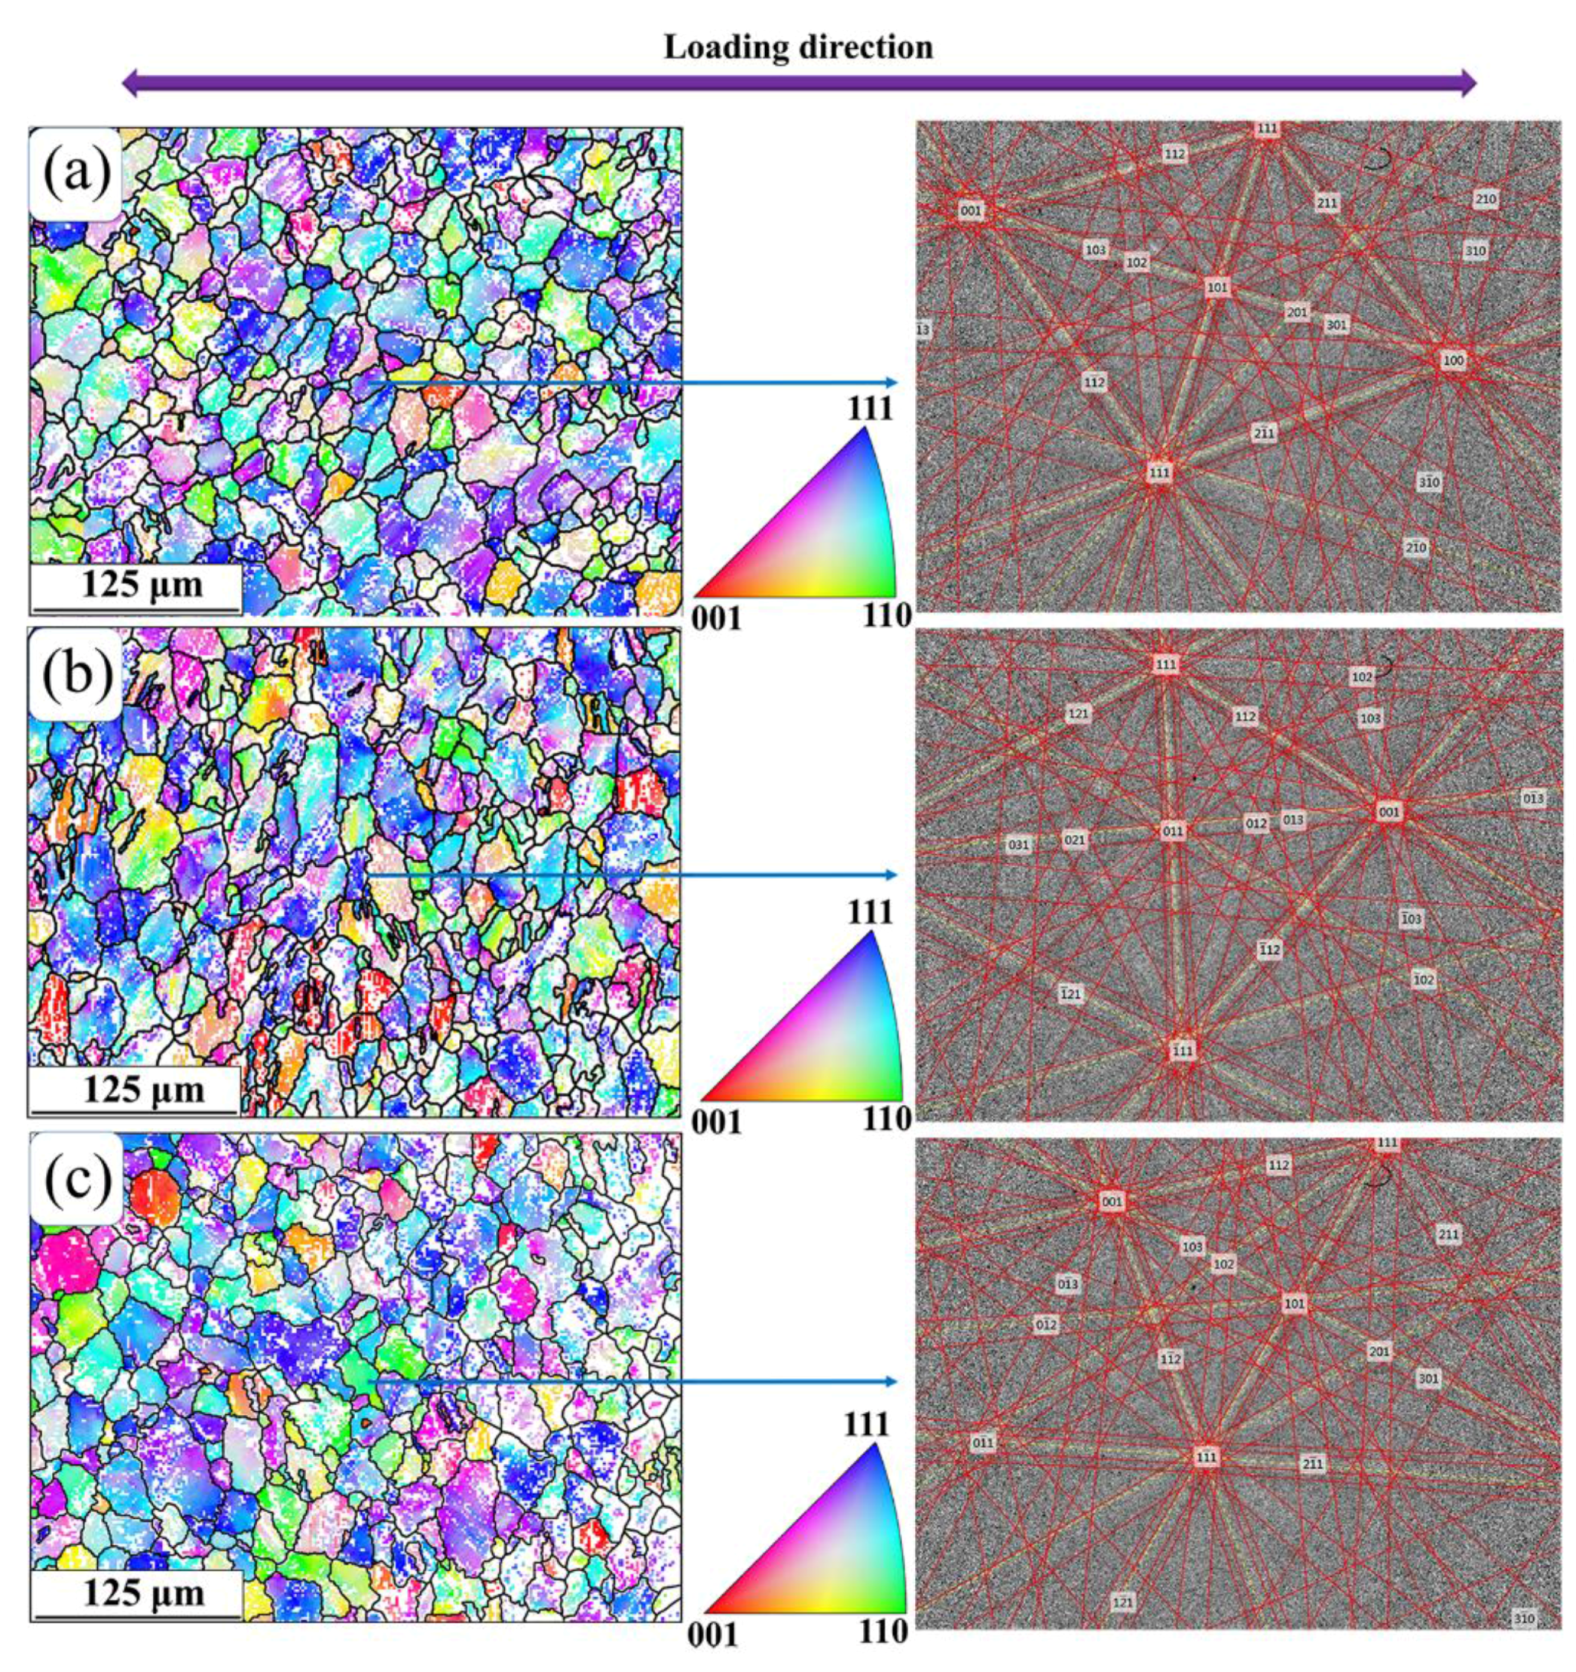
Figure 3 shows the microstructure evolution of NiTi SMA sample subjected to uniaxial compression at the deformation degree of 20%, 30% and 40%, respectively. It can be noted from Figure 3 that, with the progression of plastic deformation, the morphologies of individual grains indicate the existence of some manner of similarity that the shape of individual grain is elongated in a way along the direction that is vertical to the loading direction. Furthermore, orientations in different parts of the same grain show some discrepancy and this observation is due to the fact that dislocation slip exhibits a certain difference in individual grains owing to the differences in terms of grain orientation and grain morphology within the polycrystalline NiTi SMA, and thus an inhomogeneous plastic response of individual grain emerges in order to accommodate arbitrary plastic deformation. Another interesting result in Figure 3 is that, as the deformation degree becomes larger, the quality of EBSD measurement gets worse, namely, more and more locations cannot be identified by EBSD scanning. A Kikuchi pattern is characteristic of the crystal structure and orientation of the scanning region from which it is generated, and then it is used in EBSD measurement to identify a grain orientation in the test area of the specimen. The indexed Kikuchi patterns in the center of the scanning area at various deformation degrees are illustrated in Figure 3, and they correspond to the regions with relatively low dislocation density. Moreover, regions having high dislocation density could lead to misindexing due to poor band contrast, hence a mistake in identifying the Kikuchi patterns [16]. Therefore, the poor identification of EBSD scanning is enhanced as the dislocation density increases with the progression of plastic deformation in uniaxial compression of NiTi SMA.
To more specifically investigate the microstructure evolution resulting from the dislocation slip during plastic deformation, maps of grain boundaries at various deformation degrees are illustrated in Figure 4, where the blue lines indicate that the misorientation between neighboring grains boundaries are greater than 15°, and the red lines indicate that the misorientation between neighboring grain boundaries is between 5° and 15°. The 5° criterion contributes to weeding out such substructures that can not be considered to be grains. It is worth noting that, in Figure 4a, the red lines showing a small misorientation are far less than the blue lines, indicating that the initial microstructure is mainly composed of grains with high-angle grain boundaries. In addition, few subgrain substructures are observed in Figure 4a. With the progression of plastic deformation, dislocation density is sharply increased in the case of uniaxial compression of NiTi SMA at 673 K (400 °C), as dislocation slip is the only way to sustain plastic strain in each grain. Moreover, the individual grains of a polycrystal NiTi SMA subjected to plastic deformation shall be constrained by the neighboring grains. Therefore, plastic deformation may be quite different in the different regions of the same grain. Consequently, subgrain substructures are finally formed and heterogeneously distributed in the polycrystal NiTi SMA, as shown in Figure 4b–d, where the red lines are grouped into walls.
3.2. Investigation on Texture Evolution Based on CPFEM
3.2.1. Crystal Plasticity Constitutive Model
Due to the aforementioned microstructure evolution analysis, it can be noted that in the present study, dislocation slip rather than deformation twinning is found to be responsible for plastic deformation mechanism of NiTi SMA. Due to the fact that at least five independent slip systems are required for dislocations to accommodate arbitrary plastic deformation, it is necessary to introduce a secondary slip system {110}<111> into the proposed crystal plasticity finite element model in addition to {110}<100> and {010}<100> slip systems that are commonly reported [5].
Therefore, in the present study, the framework of crystal plasticity theory is based on dislocation slip. In the framework of rate-dependent single crystal plasticity, the elastic constitutive equation is specified by [17,18]:
where is the second order identity tensor, is the tensor of elastic modulus having the full set of symmetries , and is the symmetric stretching rate of the lattice. The Jaumann rate is the corotational stress rate on the axes that rotate with the crystal lattice, which is related to the corotational stress rate on the axes that rotate with the material by the following equation:
where and stands for the Cauchy stress. In addition, and are the total lattice spin tensor and plastic part of the total lattice spin tensor, respectively.
The crystal was assumed to behave as an elasto-viscoplastic solid, so the slipping shear rate in individual slip system is of great importance in crystal plasticity calculation. Based on the Schmid law, the slipping shear rate can be determined by a simple rate-dependent power law relation, namely
where n stands for the rate dependency and if the material is rate-independent, a large value can be chosen up to 50, whereas if the material is highly rate-dependent, a typical value of 10 can be used [19]. In the present study, the value of n is chosen to be 20, indicating a certain rate dependency as reported in [20]. is a reference shear strain rate and is determined to be 0.001 s−1 in consideration of quasi-static loading rate. and are resolved shear stress on the slip system and slip resistance of this system, respectively. Furthermore, the change rate of slip resistance in each slip system is given as follows:
where are the slip hardening modulus, and the sum operation is performed over all the activated slip systems. Here, is known as self-hardening modulus and it is derived from the hardening of slip system itself. In addition, () is called latent-hardening modulus, which indicates that the hardening is caused by another slip system.
A simple hardening model is given by [21]:
where is the initial hardening modulus, is the initial yield stress, is the saturation stress, is the total shear strain in all the slip systems, and q is the ratio of latent-hardening to self-hardening and q = 1.4 is used in the present study [8].
The aforementioned crystallographic formulations are implemented numerically into an ABAQUS standard solver through a user-defined material subroutine (UMAT), where the implicit (Euler backward) integration algorithm is adopted [18].
3.2.2. Establishment of RVE Model
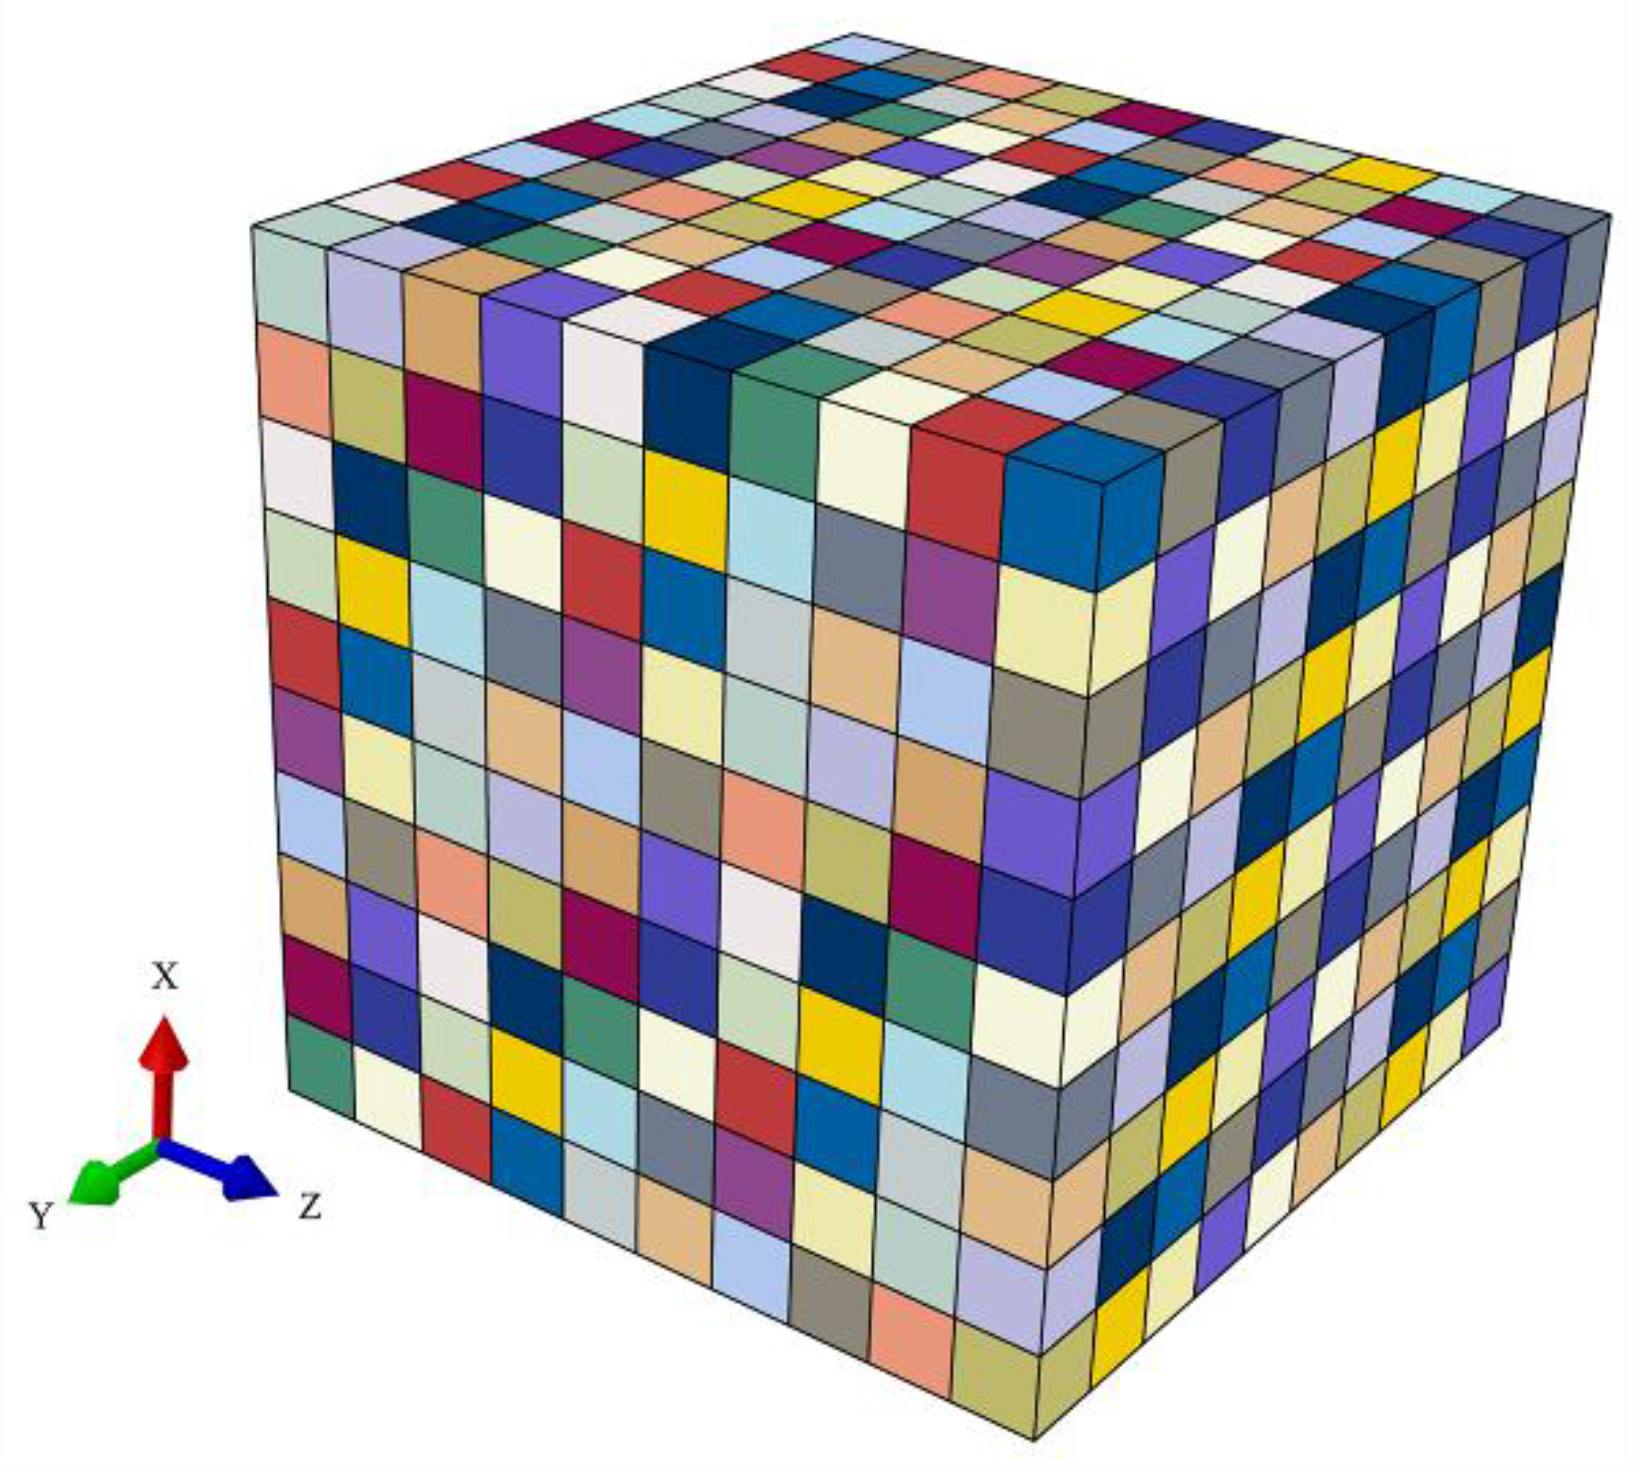
In the present study, representative volume element (RVE) model based on the voxel model is used since it can effectively represent the mechanical behavior and texture evolution of polycrystalline NiTi SMA using a minimum number of grains, as shown in Figure 5. The voxel model deals with a simple computation model including very coarse three-dimensional meshes, where only one element stands for one grain [22]. Though these voxel RVE models possess rather simplified geometrical representations, they can provide very good results, which are in agreement with experimental texture measurement and mechanical response with high accuracy and computational efficiency [8,22].
3.2.3. Parameters Calibration
Based on the three-dimensional voxel model, the parameters of the crystal plasticity finite element model proposed for NiTi SMA are calibrated from the result of the macroscale uniaxial compression experiment. Since Lv et al. [23] has reported that grain number has an influence on the overall stress of the voxel RVE model, so the starting point of the parameter calibration is to determine the optimal grain number in the RVE model, and convergence studies are carried out on five aggregates containing 64, 216, 512, 1000 and 1728 grains, respectively. Twenty independent computations are performed for each aggregate. Furthermore, prior to each computation, orientations of all the grains are regenerated randomly. In addition, the boundary conditions applied in the present study are realized by means of periodic boundary conditions in x, y, and z directions of the RVE model, which would be compressed in the x-direction at the strain rate of 0.001 s−1. Compared to boundary conditions just by causing all surfaces to be plane, though it has been confirmed that there are no large differences in the results of stress-strain curves anyway [24], the latter induces a higher constraint in the crystal plasticity finite element model.
The stress-strain responses of each computation on the basis of various grain numbers and the corresponding overall stress-strain responses are simulated, as shown in Figure 6. To obtain the macroscopic stress-strain response of NiTi SMA, homogenization based on averaging theorem over the voxel-based RVE model is adopted to make the transition from micro- to macro-variables of the RVE model. The averaged stress and strain values at each time step are defined as and (N is the total number of elements multiplied by the number of integration points at per element, is the component of stress tensor at each integration point and is the component of strain tensor at each integration point) [19]. This can be realized by programming a post-processing numerical subroutine using computer language PYTHON with the help of ABAQUS interface. It can be seen from Figure 6 that with the increase of grain number in the voxel model, the scatter on the predicted stress-strain responses with random orientations decreases obviously. In addition, according to the overall stress-strain responses, the stress-strain curve based on 1000 grains is viewed as a compromise between the stress-strain curves corresponding to the selected grain numbers. Therefore, the voxel model adopted in the present study is determined to contain 1000 C3D8 elements, which stand for 1000 grains.
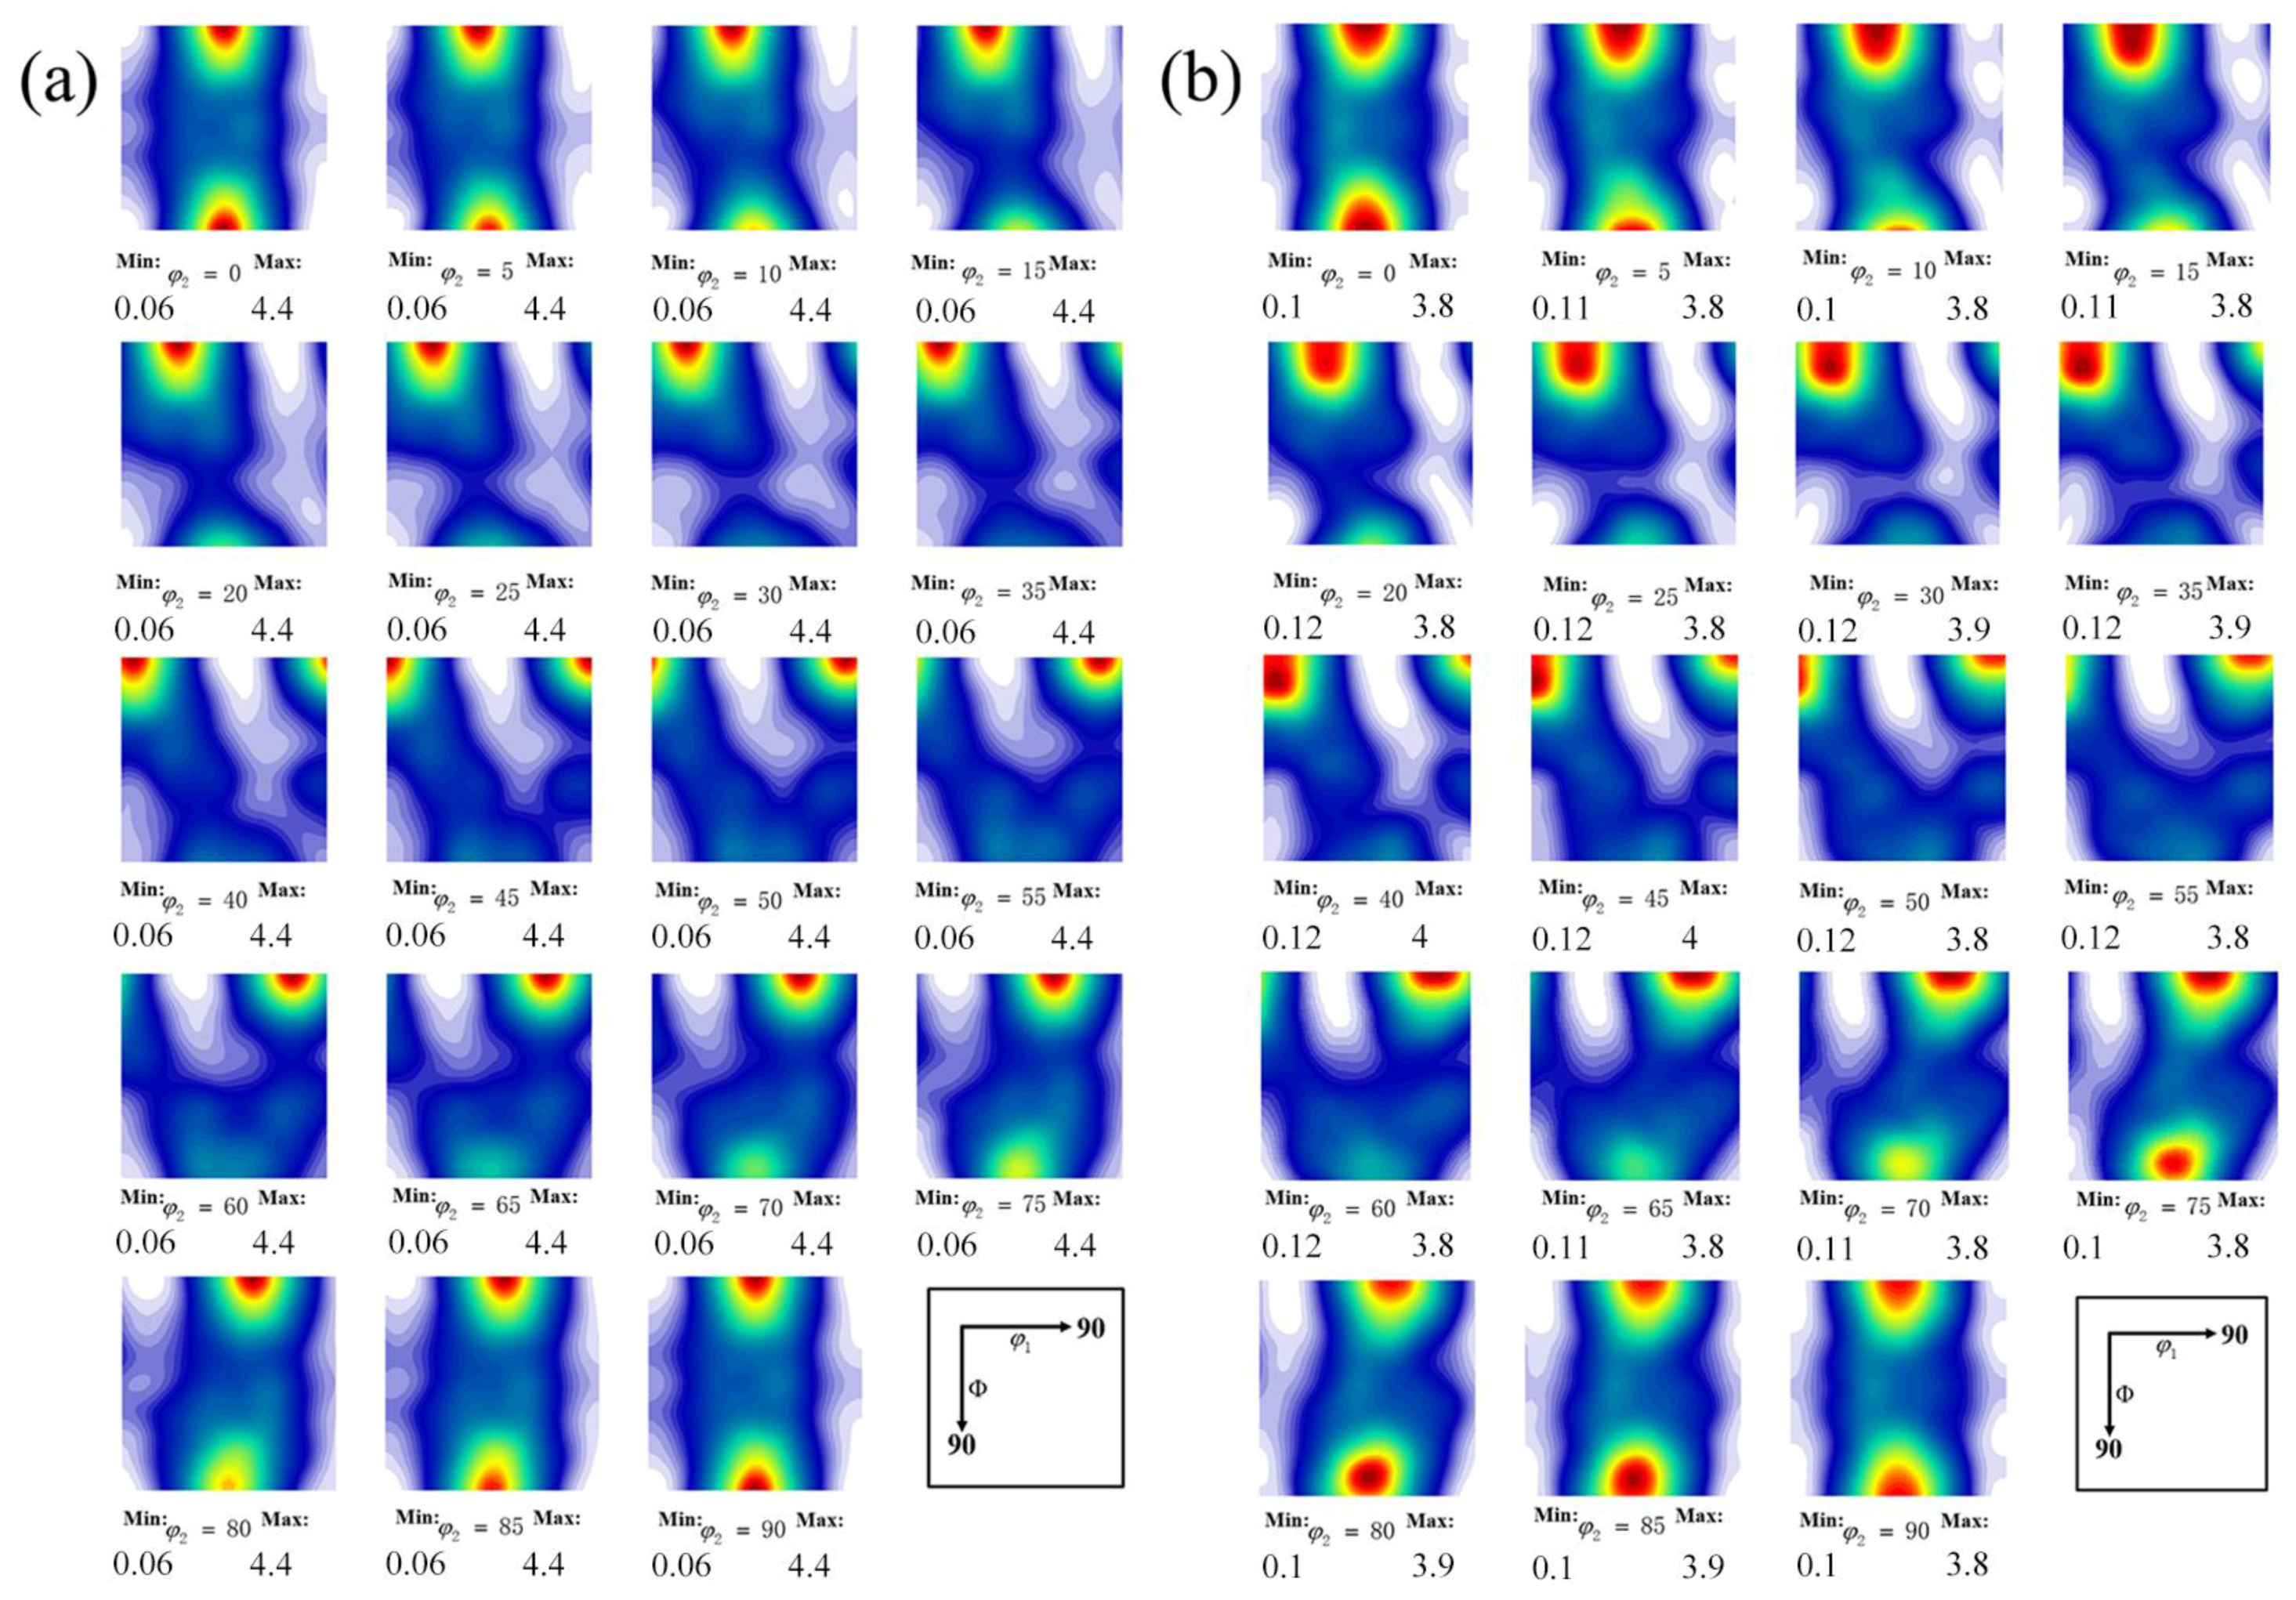
In general, plastic deformation is assumed to be highly sensitive to the overall texture of metal materials. Therefore, it is necessary to assign appropriate crystallographic orientations to the elements prior to finite element simulation. In the present study, 1000 grain orientations are extracted from the EBSD data by discretizing the orientation distribution function (ODF). Figure 7 shows a comparison between the measured texture from initial microstructure and the corresponding simulated texture based on 1000 extracted grain orientations. It can be seen from Figure 7a that the initial texture consists mainly of a preferred {001}<110> texture in section of ODF. This fact contributes to demonstrating that there exists a preferred orientation of grains, where the <110> direction is parallel to the RD direction. Such a texture is probably attributed to thermo-mechanical processing of the as-received NiTi SMA. Furthermore, the simulated ODF sections are depicted in Figure 7b. Obviously, these simulated ODF sections well reproduce the main features of the experimental ODF ones.
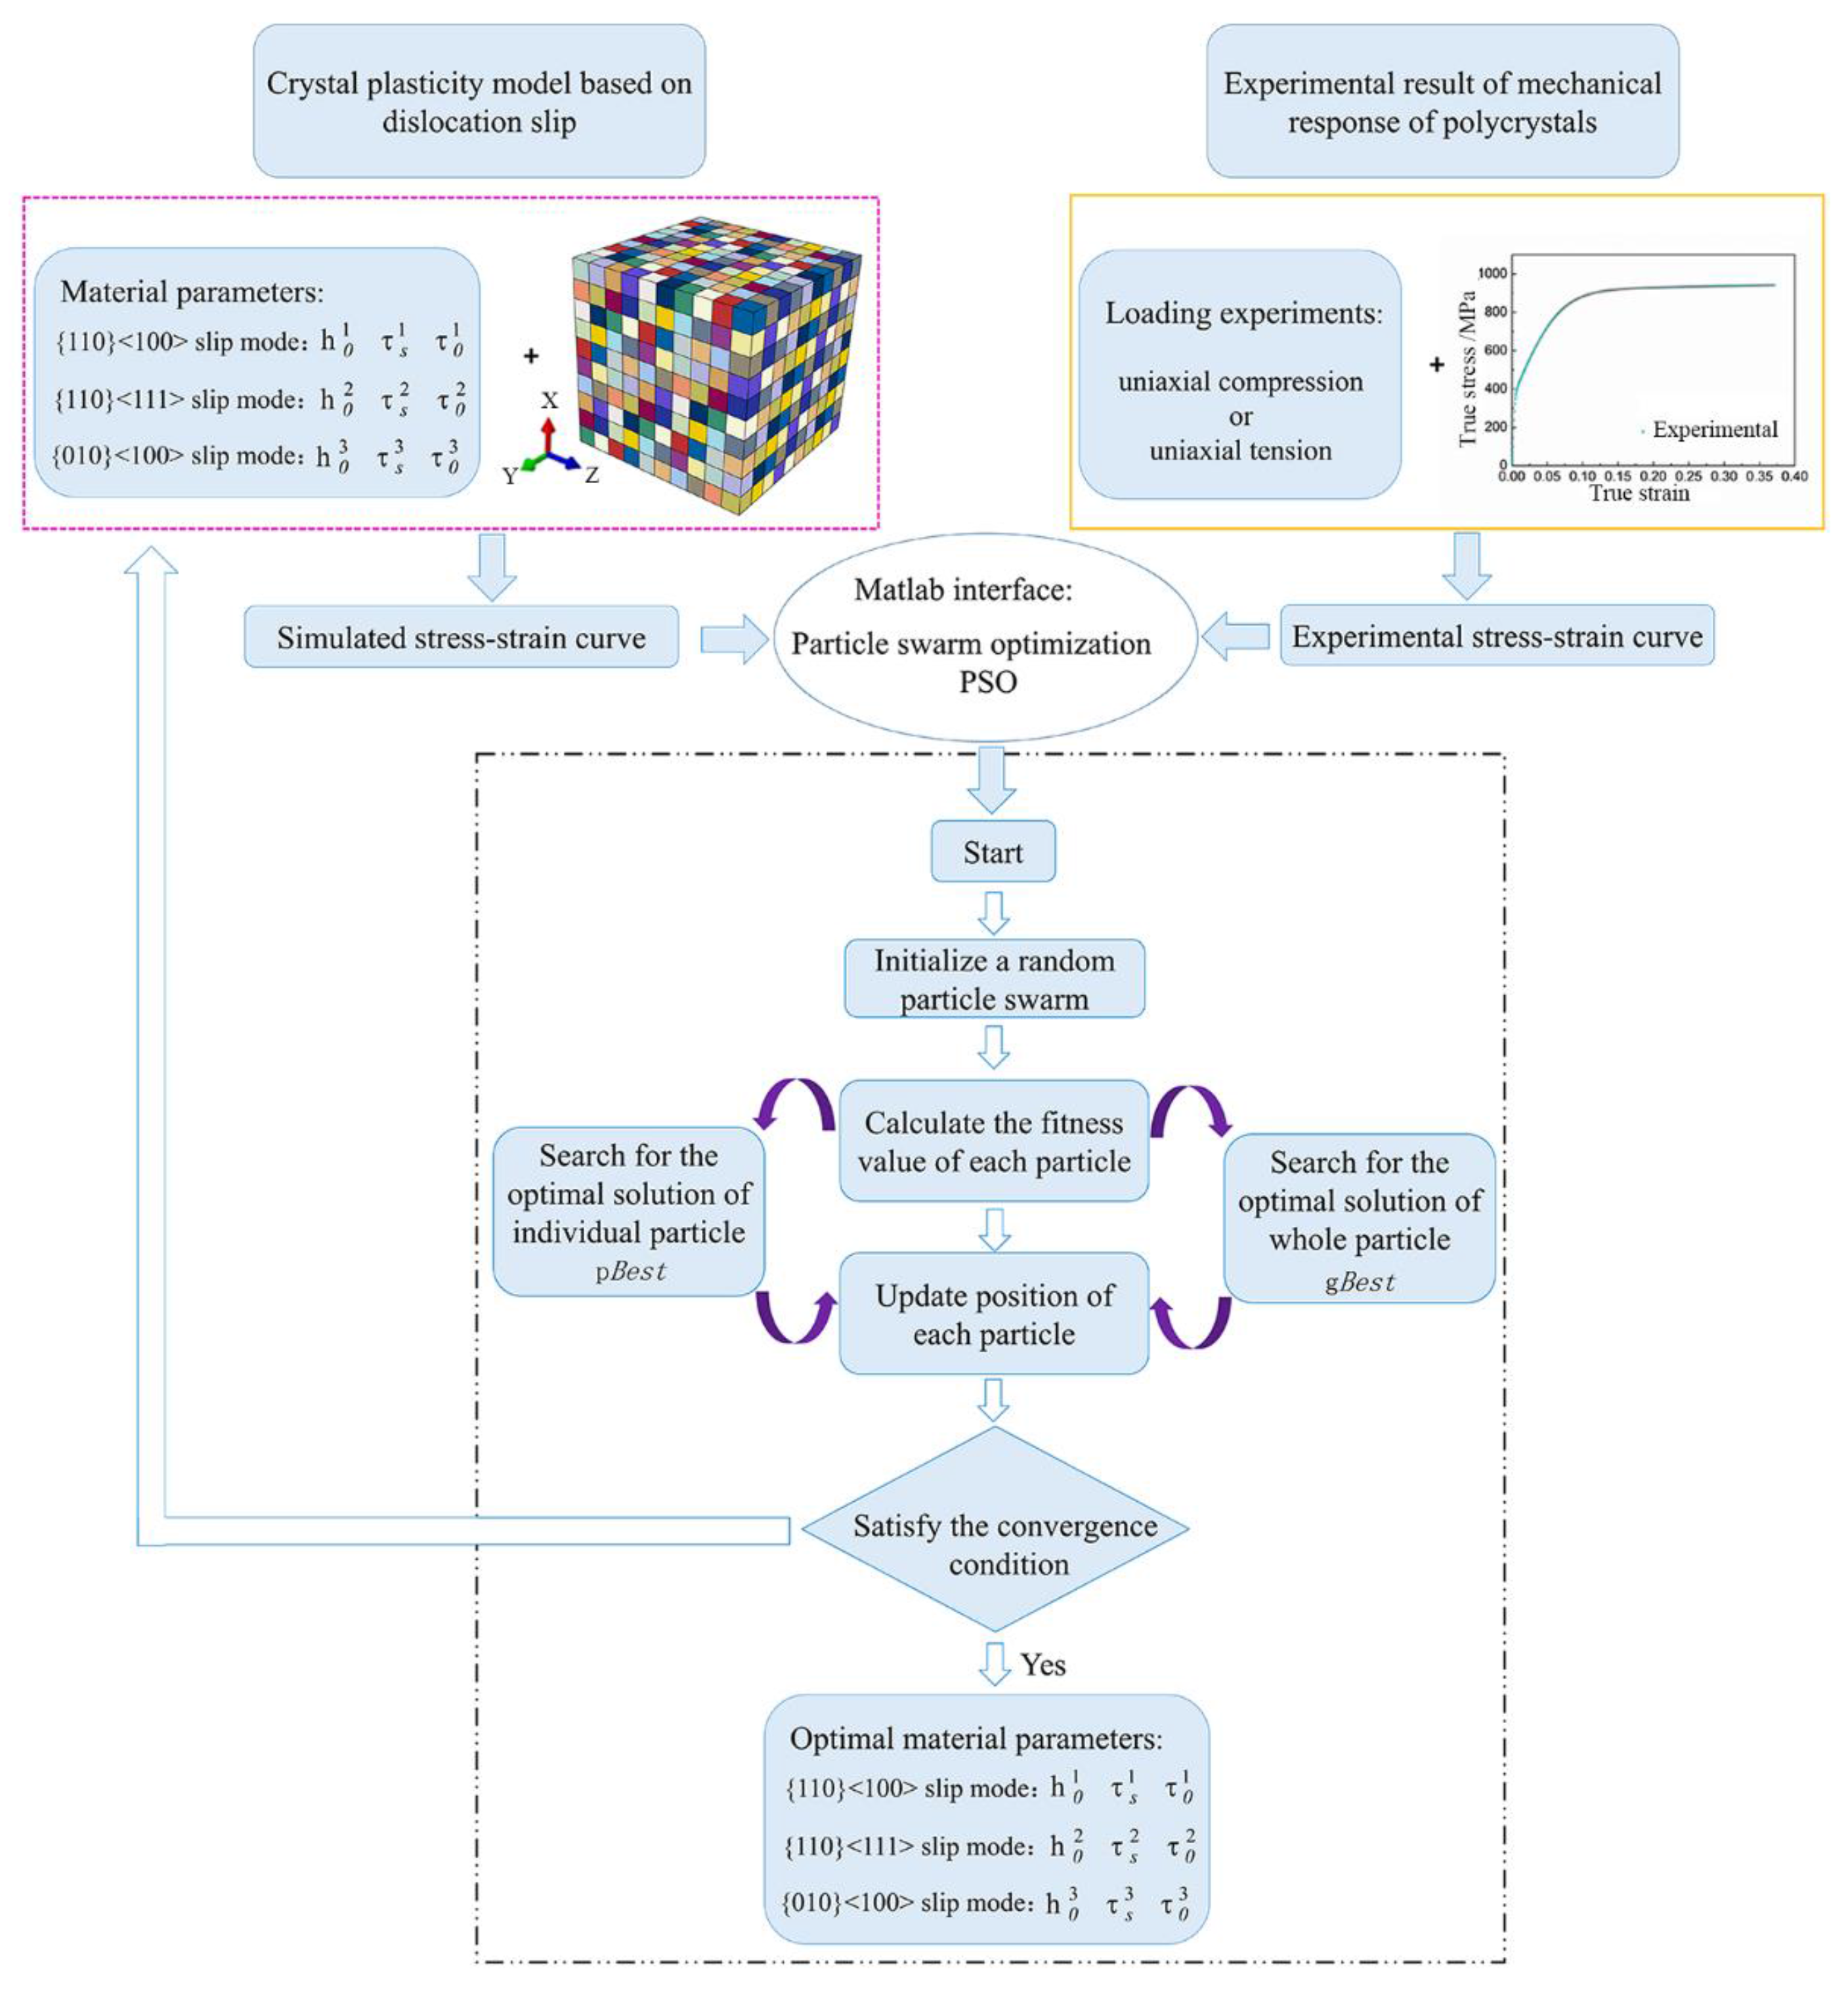
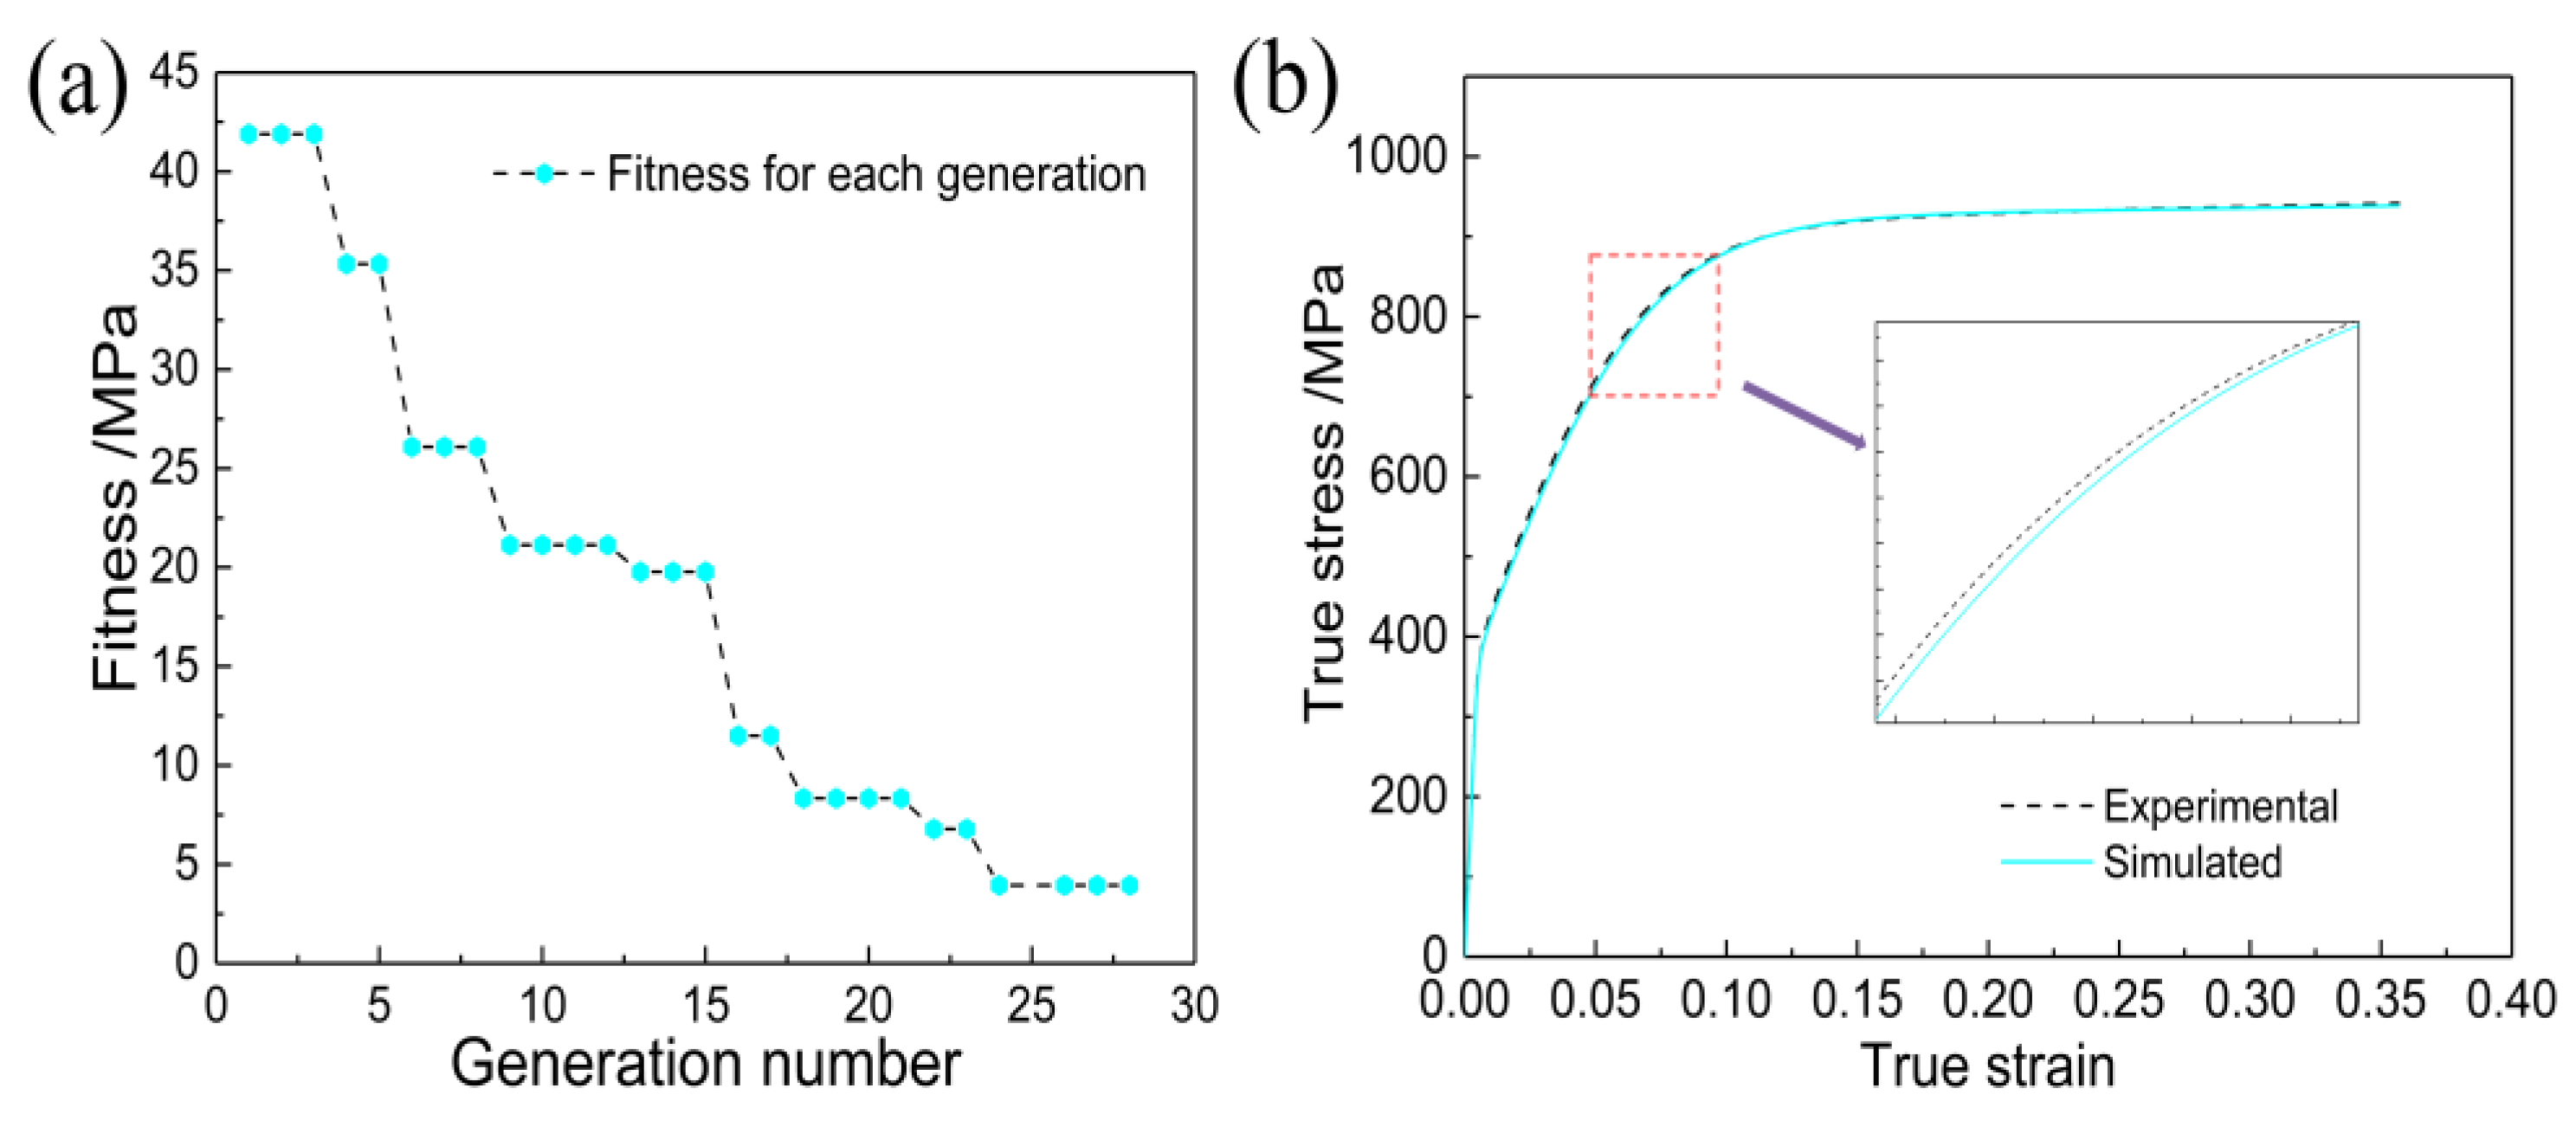
The values of anisotropically elastic parameters of single crystal NiTi SMA can be determined as , and [8]. Based on the constructed three-dimensional voxel-based RVE model as well as the extracted orientations from ODF measured by EBSD experiment, the remaining crystal plasticity parameters in the single-crystal constitutive equations in terms of hardening effect in different slip systems have to be determined by back-fitting the mechanical result in the constructed RVE model to the mechanical response in uniaxial compression experiment. Ezaz et al. [11] has reported that the ideal critical stress for slip systems {110}<100>, {010}<100> and {110}<111> are 2667 MPa, 9320 MPa and 5561 MPa, indicating that these three slip systems used in the present study have different hardening parameters and the slip system with a higher ideal critical stress also has higher hardening parameters, namely , and [25]. In addition, Lee et al. [26] has reported that in the case of crystal plasticity finite element simulation, the global stress-strain curve is sensitive to the adopted material parameters. Therefore, systematic variations of material parameters are important in the procedure of parameter identification. In terms of varying the material parameters, a method used frequently is “trial-error” algorithm, and it is used to optimize the numerical results by means of the optical observation on the difference between the numerical stress-strain curve and the experimental one. It is worth noting that such an optical coincidence procedure may finally result in high accuracy [24]. However, in the “trial-error” procedure, systematic variations of material parameters require a phenomenological interpretation and an understanding of the respective efforts on the mechanical response of the polycrystalline model. Therefore, such calibration is a nontrivial effort due to the number of material parameters involved. As a consequence, in the present study, the “trial-error” algorithm is never easy to find nine parameters manually. Based on the target function that depends on the user’s definition, many other mathematical optimization algorithms have been proposed to facilitate the procedure of parameter identification, including the genetic algorithm (GA) method, continuous function optimization method [27,28,29] and their individual advantages and limitations would not be discussed in detail here. In the present study, a particle swarm optimization (PSO) algorithm is implemented for the purpose of parameter identification and the detailed introduction about PSO algorithm can be found in the literature [30]. As for the PSO algorithm, all population members generated in the first trial continuously update their problem solutions by tracking personal Best (pBest), which results in the minimal target function value by comparison with itself, and global Best (gBest), which results in the minimal target function value by comparison with all the population members in each iteration. As for combining the PSO algorithm and crystal plasticity finite element model, the coupling procedure is illustrated in Figure 8. The target function or fitness function used in the present study is identified as follows [27]:
where k is a number denoting the amplitude of 151 different true strains that range from 0.02 to 0.32 with the interval of 0.002. and are the true stresses measured in the experimental and simulated stress-strain curves for kth strain amplitude, respectively. In the present study, the population size is taken to be 9, which indicates that there are nine material parameters to be determined.
Figure 9a shows the fitness-generation curve, which indicates the PSO algorithm convergence with the number of generations. It can be found from Figure 9a that, after 24 generations, the fitness value converges to a constant value of 3.95 MPa, indicating that the PSO algorithm has implemented the best optimization. The material parameters obtained by this calibration process are listed in Table 1. In addition, Figure 9b shows the experimental and simulated stress-strain curves of NiTi SMA subjected to uniaxial compression at the deformation degree of 30%. It can be found from Figure 9b that the simulated result is consistent with the experimental one and this phenomenon confirms the validity of the fitted parameters used in CPFEM.
3.2.4. Texture Evolution of NiTi SMA under Uniaxial Compression
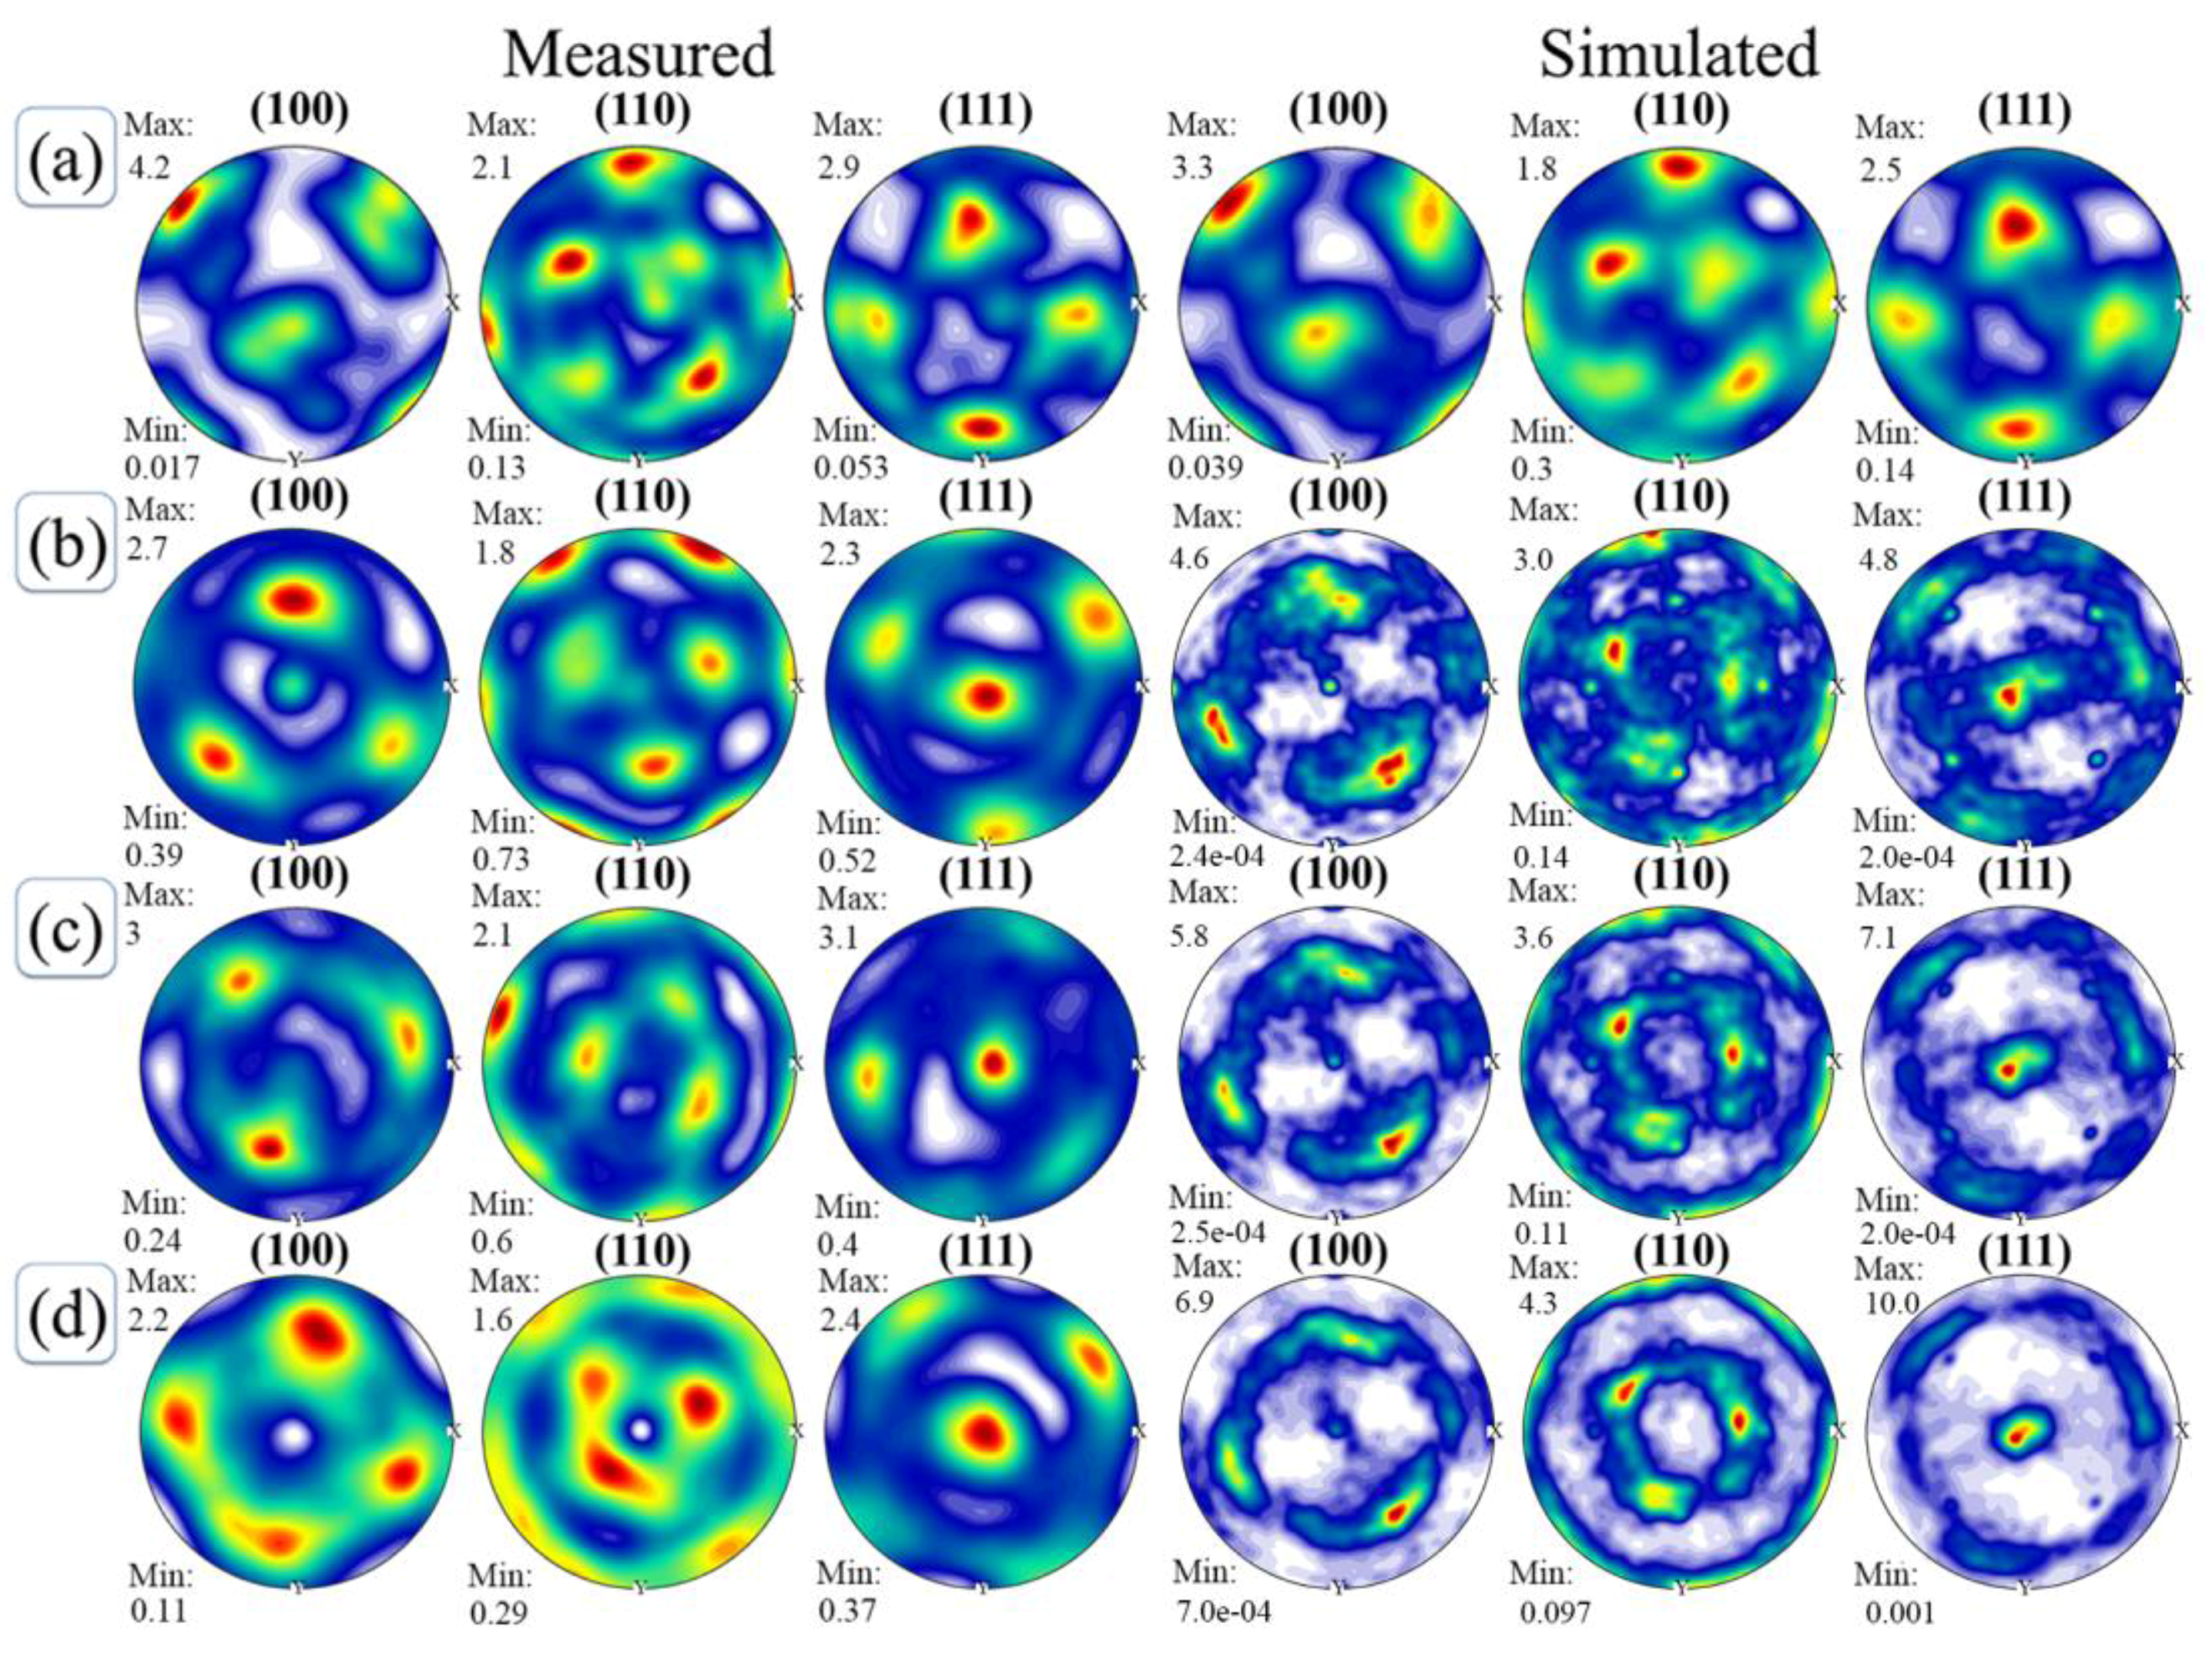
It is well known that the texture has a significant influence on the mechanical properties of NiTi SMA. Therefore, it is of great importance to predict texture evolution of NiTi SMA during plastic deformation. Based on the fitted material parameters, the constructed voxel RVE model is used to simulate the uniaxial compression process of NiTi SMA at various deformation degrees. As a consequence, the corresponding values of Euler angles at each integration point are extracted to predict texture evolution. This can be realized by programming a post-processing numerical subroutine using computer language PYTHON with the help of the ABAQUS interface. It can be generally accepted that the pole figure is an important approach to characterize the texture of metal materials during uniaxial compression or tension. Figure 10 illustrates the pole figures of NiTi SMA subjected to the various deformation degrees including 0%, 20%, 30% and 40%, which are obtained by means of EBSD experiments and CPFEM simulation. It can be seen from Figure 10 that the simulated results are in good accordance with the experimental ones, except from the legend values at various deformation degrees. The legend values show that the maximum pole density in experiment results is less than the corresponding simulated ones. This may be attributed to the limited EBSD scanning areas in EBSD experiments and the increased regions of poor identification in scanning areas. However, it can be concluded that CPFEM based on the constructed RVE model is a superior candidate for predicting texture evolution of NiTi SMA during uniaxial compression deformation. With the progression of plastic deformation, a crystallographic plane of NiTi SMA gradually rotates to be vertical to the loading direction, which lays the foundation for forming the <111> fiber texture in the case of uniaxial compression.
4. Conclusions
- (1)
- TEM observation demonstrates that dislocation slip rather than deformation twinning is responsible for plastic deformation mechanisms of B2 austenite NiTi SMA at 673 K (400 °C). EBSD experiment demonstrates the heterogeneous microstructure evolution during uniaxial compression, where subgrain substructures are formed and distributed within individual grains.
- (2)
- Based on the experimental observations, {110}<100>, {010}<100> and {110}<111> slip systems are introduced into the single-crystal constitutive equations in order to accommodate plastic deformation of NiTi SMA. Particle swarm optimization (PSO) algorithm is used to identify crystal plasticity parameters from experimental results of NiTi SMA. The validity of the fitted material parameters is well confirmed based on the fact that the simulated stress-strain curve on the basis of constructed Voxel RVE model is in good agreement with the experimental result.
- (3)
- CPFEM based on the constructed RVE model is able to accurately predict texture evolution of NiTi SMA during uniaxial compression deformation. The simulation results are in good agreement with the experimental ones. With the progression of plastic deformation, a crystallographic plane of NiTi SMA gradually rotates to be vertical to the loading direction, which lays the foundation for forming the <111> fiber texture.
Acknowledgments
The work was financially supported by National Natural Science Foundation of China (Nos. 51475101, 51305091 and 51305092).
Author Contributions
Li Hu performed the crystal plasticity finite element simulation and wrote the manuscript; Shuyong Jiang supervised the research; Yanqiu Zhang performed TEM analysis and EBSD analysis.
Conflicts of Interest
The authors declare no conflict of interest.
References
- Vojtěch, D.; Michalcova, A.; Čapek, J.; Marek, I.; Dragounova, L. Structural and mechanical stability of the nano-crystalline Ni–Ti (50.9 at.% ni) shape memory alloy during short-term heat treatments. Intermetallics 2014, 49, 7–13. [Google Scholar] [CrossRef]
- Sharifi, E.M.; Karimzadeh, F.; Kermanpur, A. The effect of cold rolling and annealing on microstructure and tensile properties of the nanostructured Ni 50 Ti 50 shape memory alloy. Mater. Sci. Eng. A Struct. Mater. 2014, 607, 33–37. [Google Scholar] [CrossRef]
- Delobelle, V.; Chagnon, G.; Favier, D.; Alonso, T. Study of electropulse heat treatment of cold worked NiTi wire: From uniform to localised tensile behaviour. J. Mater. Process. Technol. 2016, 227, 244–250. [Google Scholar] [CrossRef]
- Hu, L.; Jiang, S.H.; Zhang, Y.Q.; Zhao, Y.N.; Liu, S.W.; Zhao, C.Z. Multiple plastic deformation mechanisms of NiTi shape memory alloy based on local canning compression at various temperatures. Intermetallics 2016, 70, 45–52. [Google Scholar] [CrossRef]
- Benafan, O.; Noebe, R.; Padula, S.; Garg, A.; Clausen, B.; Vogel, S.; Vaidyanathan, R. Temperature dependent deformation of the B2 austenite phase of a NiTi shape memory alloy. Int. J. Plast. 2013, 51, 103–121. [Google Scholar] [CrossRef]
- Duerig, T. Some unsolved aspects of Nitinol. Mater. Sci. Eng. A Struct. Mater. 2006, 438, 69–74. [Google Scholar] [CrossRef]
- Lin, Y.S.; Cak, M.; Paidar, V.; Vitek, V. Why is the slip direction different in different B2 alloys? Acta Mater. 2012, 60, 881–888. [Google Scholar] [CrossRef]
- Manchiraju, S.; Anderson, P.M. Coupling between martensitic phase transformations and plasticity: A microstructure-based finite element model. Int. J. Plast. 2010, 26, 1508–1526. [Google Scholar] [CrossRef]
- Yu, C.; Kang, G.; Kan, Q. A micromechanical constitutive model for anisotropic cyclic deformation of super-elastic niti shape memory alloy single crystals. J. Mech. Phys. Solids 2015, 82, 97–136. [Google Scholar] [CrossRef]
- Pelton, A.; Huang, G.; Moine, P.; Sinclair, R. Effects of thermal cycling on microstructure and properties in Nitinol. Mater. Sci. Eng. A Struct. Mater. 2012, 532, 130–138. [Google Scholar] [CrossRef]
- Ezaz, T.; Wang, J.; Sehitoglu, H.; Maier, H. Plastic deformation of NiTi shape memory alloys. Acta Mater. 2013, 61, 67–78. [Google Scholar] [CrossRef]
- Ezaz, T.; Sehitoglu, H.; Maier, H.J. Energetics of (114) twinning in B2 NiTi under coupled shear and shuffle. Acta Mater. 2012, 60, 339–348. [Google Scholar] [CrossRef]
- Zaki, W.; Moumni, Z. A three-dimensional model of the thermomechanical behavior of shape memory alloys. J. Mech. Phys. Solids 2007, 55, 2455–2490. [Google Scholar] [CrossRef]
- Auricchio, F.; Reali, A.; Stefanelli, U. A three-dimensional model describing stress-induced solid phase transformation with permanent inelasticity. Int. J. Plast. 2007, 23, 207–226. [Google Scholar] [CrossRef]
- Yu, C.; Kang, G.; Song, D.; Kan, Q. Micromechanical constitutive model considering plasticity for super-elastic NiTi shape memory alloy. Comput. Mater. Sci. 2012, 56, 1–5. [Google Scholar] [CrossRef]
- Suwas, S.; Ray, R.K. Crystallographic Texture of Materials; Springer: London, UK, 2014; pp. 11–38. [Google Scholar]
- Hill, R.; Rice, J. Constitutive analysis of elastic-plastic crystals at arbitrary strain. J. Mech. Phys. Solids 1972, 20, 401–413. [Google Scholar] [CrossRef]
- Huang, Y.G. A User-Material Subroutine Incroporating Single Crystal Plasticity in the Abaqus Finite Element Program; Harvard University: Cambridge, MA, USA, 1991. [Google Scholar]
- Abdolvand, H.; Daymond, M.R.; Mareau, C. Incorporation of twinning into a crystal plasticity finite element model: Evolution of lattice strains and texture in zircaloy-2. Int. J. Plast. 2011, 27, 1721–1738. [Google Scholar] [CrossRef]
- Jiang, S.H.; Zhang, Y.Q.; Zhao, Y.N.; Tang, M.; Yi, W.L. Constitutive behavior of Ni-Ti shape memory alloy under hot compression. J. Cent. South Univ. Technol. 2013, 20, 24–29. [Google Scholar] [CrossRef]
- Cailletaud, G. A micromechanical approach to inelastic behaviour of metals. Int. J. Plast. 1992, 8, 55–73. [Google Scholar] [CrossRef]
- Diard, O.; Leclercq, S.; Rousselier, G.; Cailletaud, G. Evaluation of finite element based analysis of 3D multicrystalline aggregates plasticity: Application to crystal plasticity model identification and the study of stress and strain fields near grain boundaries. Int. J. Plast. 2005, 21, 691–722. [Google Scholar] [CrossRef]
- Lv, L.; Zhen, L. Crystal plasticity simulation of polycrystalline aluminum and the effect of mesh refinement on mechanical responses. Mater. Sci. Eng. A Struct. Mater. 2011, 528, 6673–6679. [Google Scholar] [CrossRef]
- Zhang, K.S.; Ju, J.W.; Li, Z.; Bai, Y.L.; Brocks, W. Micromechanics based fatigue life prediction of a polycrystalline metal applying crystal plasticity. Mech. Mater. 2015, 85, 16–37. [Google Scholar] [CrossRef]
- Wang, Y.; Sun, X.; Wang, Y.; Hu, X.; Zbib, H.M. A mechanism-based model for deformation twinning in polycrystalline FCC steel. Mater. Sci. Eng. A Struct. Mater. 2014, 607, 206–218. [Google Scholar] [CrossRef]
- Lee, M.G.; Wang, J.; Anderson, P.M. Texture evolution maps for upset deformation of body-centered cubic metals. Mater. Sci. Eng. A Struct. Mater. 2007, 463, 263–270. [Google Scholar] [CrossRef]
- Xie, C.; Ghosh, S.; Groeber, M. Modeling cyclic deformation of HSLA steels using crystal plasticity. J. Eng. Mater. Technol. Trans. ASME 2004, 126, 339–352. [Google Scholar] [CrossRef]
- Cheng, J.; Ghosh, S. A crystal plasticity FE model for deformation with twin nucleation in magnesium alloys. Int. J. Plast. 2015, 67, 148–170. [Google Scholar] [CrossRef]
- Hasija, V.; Ghosh, S.; Mills, M.J.; Joseph, D.S. Deformation and creep modeling in polycrystalline Ti-6Al alloys. Acta Mater. 2003, 51, 4533–4549. [Google Scholar] [CrossRef]
- Esmin, A.A.; Coelho, R.A.; Matwin, S. A review on particle swarm optimization algorithm and its variants to clustering high-dimensional data. Artif. Intell. Rev. 2015, 44, 23–45. [Google Scholar] [CrossRef]
Figure 1.
TEM micrographs of NiTi SMA sample subjected to uniaxial compression at the deformation degree of 40%: (a) bright field image; (b) dark field image; (c) SAED (selected area electron diffraction) pattern of (b).
Figure 1.
TEM micrographs of NiTi SMA sample subjected to uniaxial compression at the deformation degree of 40%: (a) bright field image; (b) dark field image; (c) SAED (selected area electron diffraction) pattern of (b).
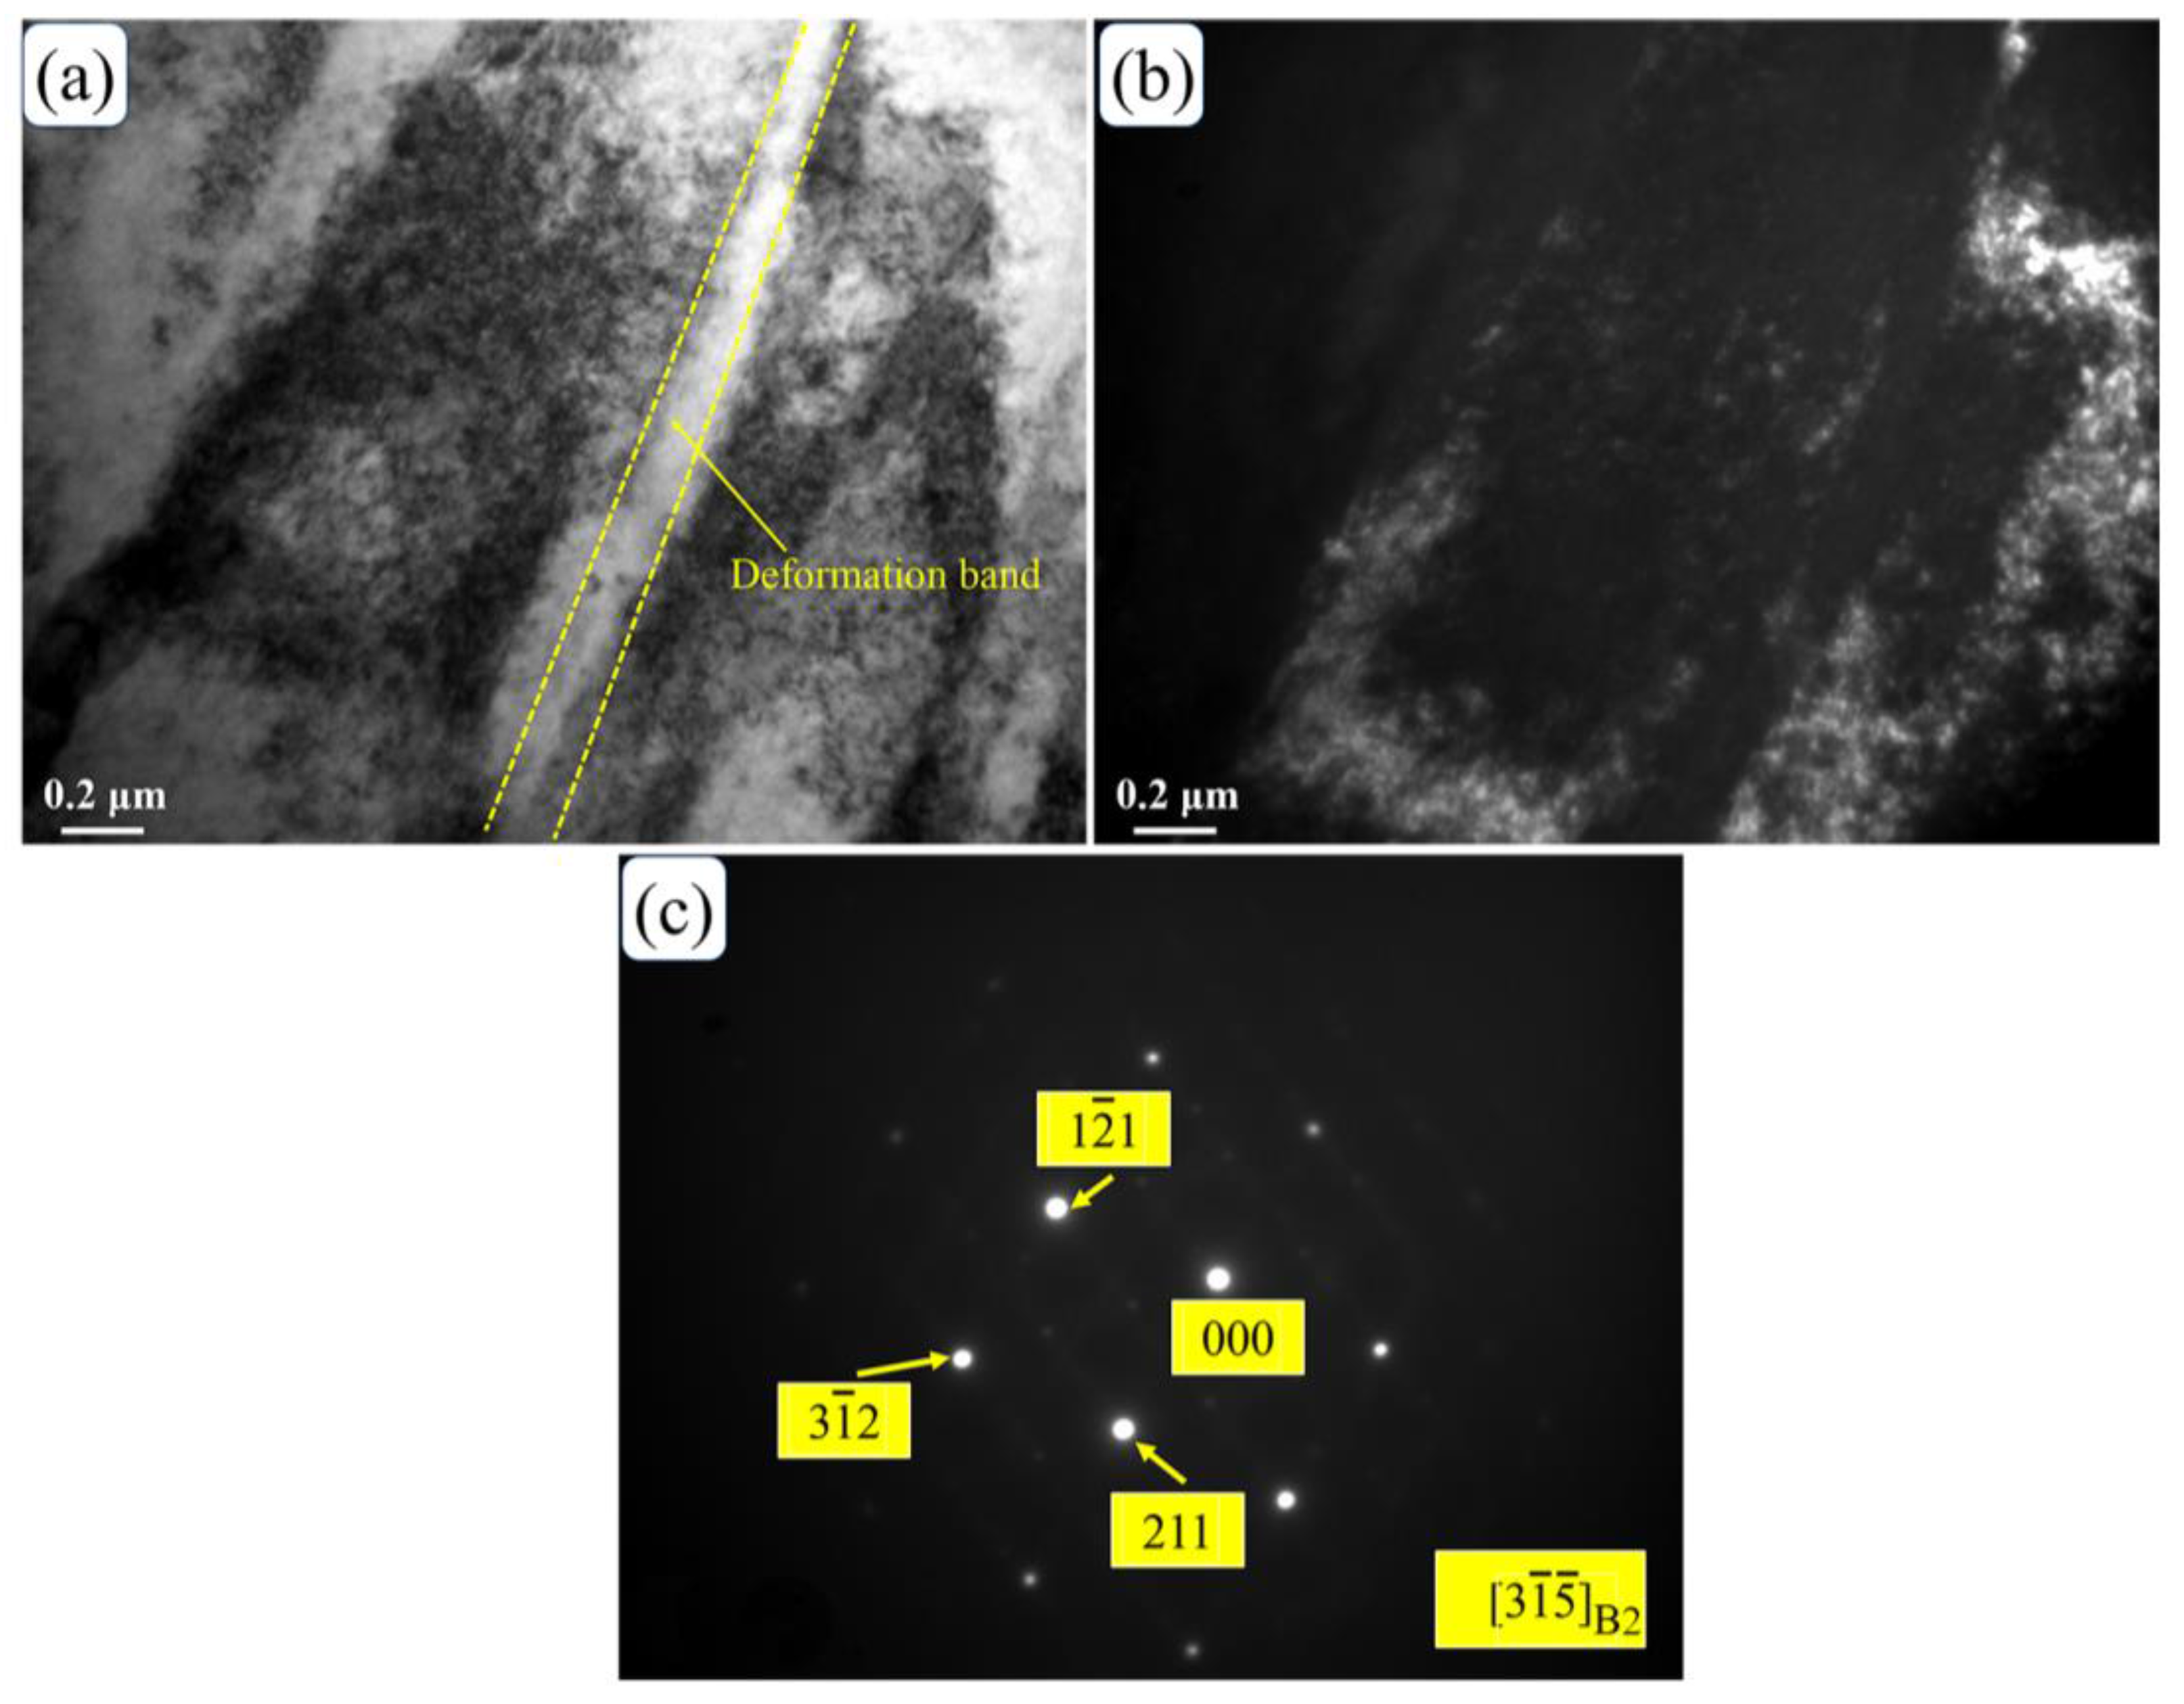
Figure 2.
Initial microstructure of as-received NiTi SMA based on a EBSD (electron back-scattered diffraction) experiment: (a) EBSD scan area in Rolling-Normal (RD–ND) plane; (b) statistical analysis of equivalent grain diameter in the Rolling-Normal (RD–ND) plane.
Figure 2.
Initial microstructure of as-received NiTi SMA based on a EBSD (electron back-scattered diffraction) experiment: (a) EBSD scan area in Rolling-Normal (RD–ND) plane; (b) statistical analysis of equivalent grain diameter in the Rolling-Normal (RD–ND) plane.
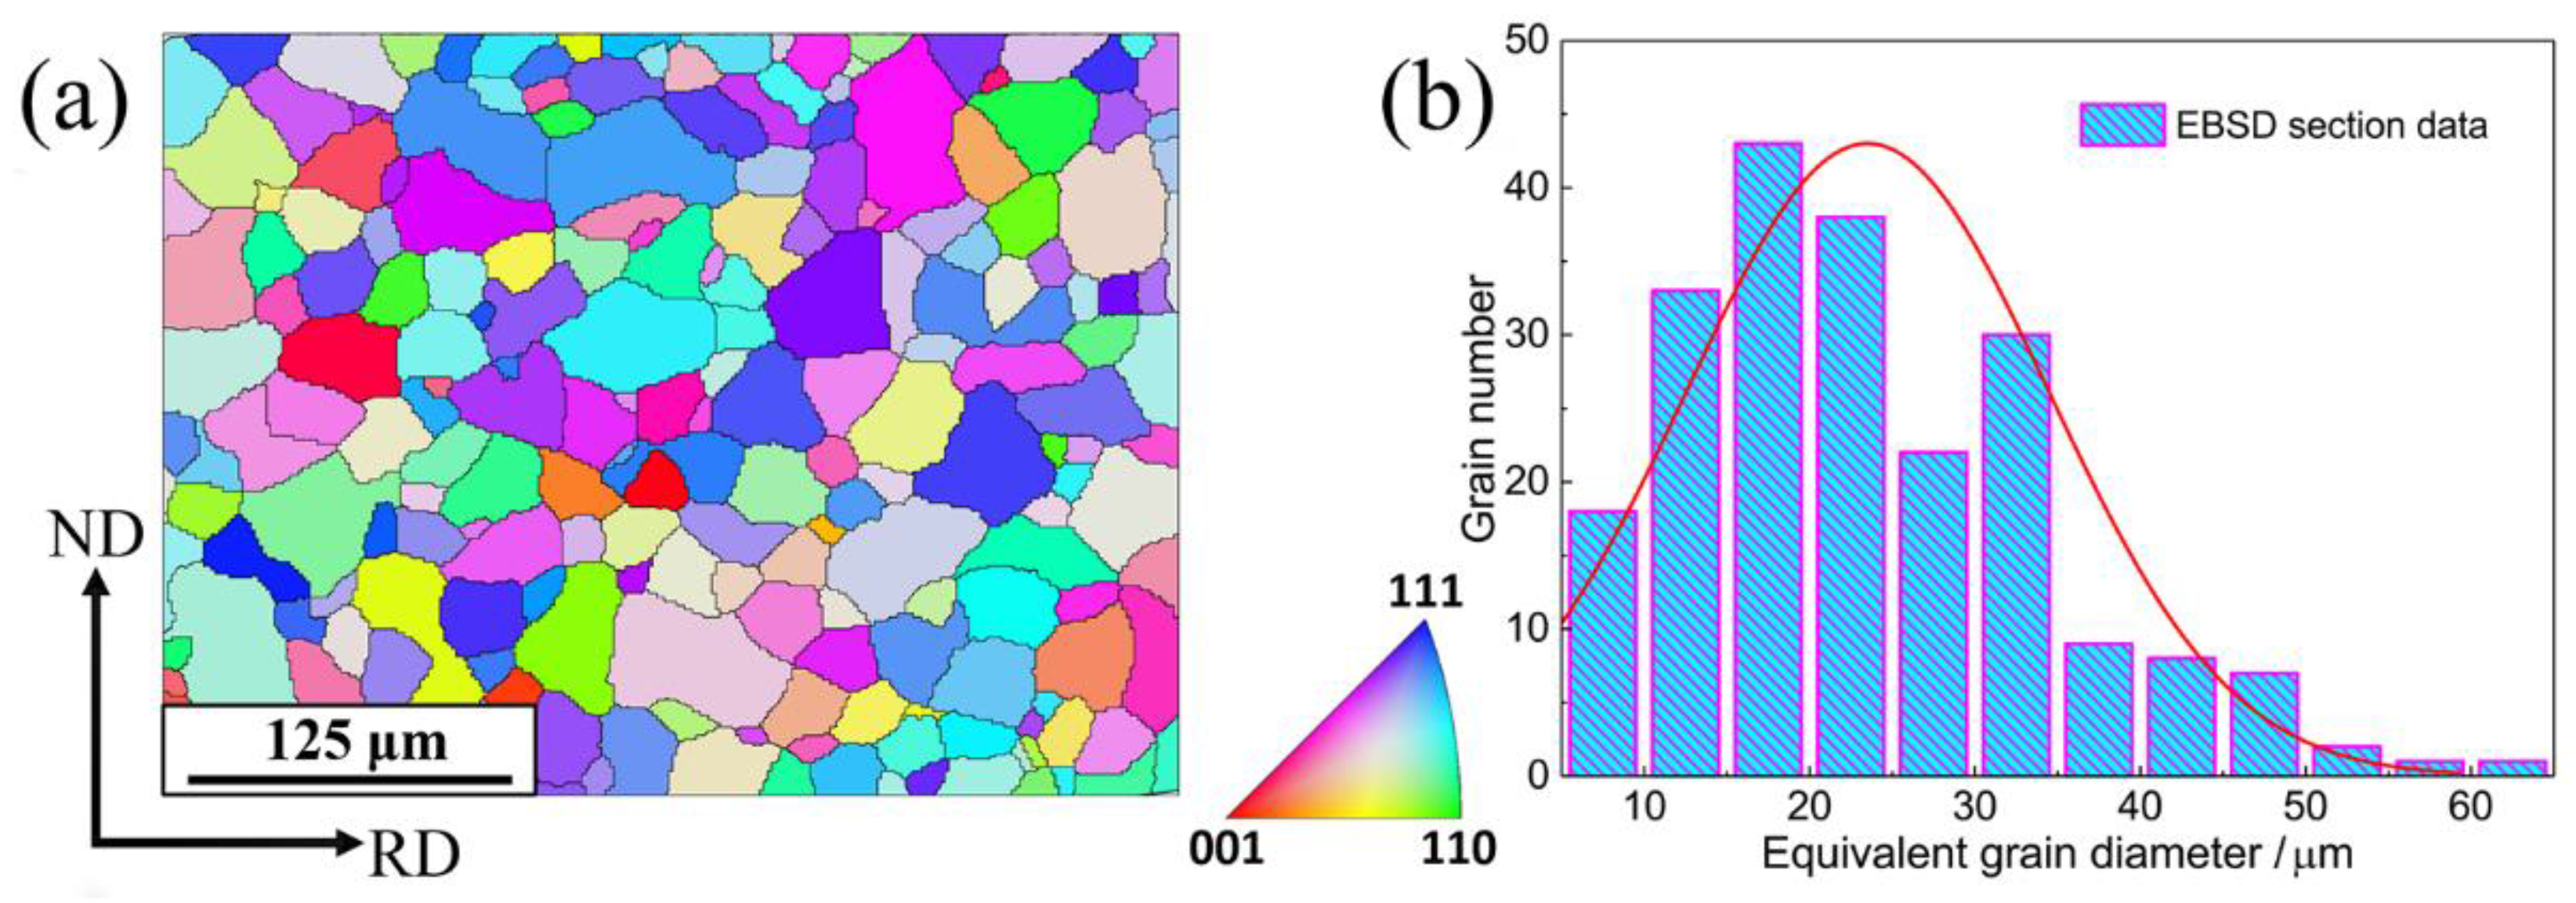
Figure 3.
Microstructure evolution and corresponding Kikuchi patterns of NiTi SMA subjected to various deformation degrees: (a) 20%; (b) 30%; (c) 40%.
Figure 3.
Microstructure evolution and corresponding Kikuchi patterns of NiTi SMA subjected to various deformation degrees: (a) 20%; (b) 30%; (c) 40%.

Figure 4.
Maps of grain boundaries obtained from EBSD measurement in NiTi SMA samples subjected to various deformation degrees: (a) 0%; (b) 20%; (c) 30%; (d) 40%. The blue lines represent grain boundaries whose misorientation is greater than 15° and the red lines stand for grain boundaries whose misorientation ranges from 5° to 15°.
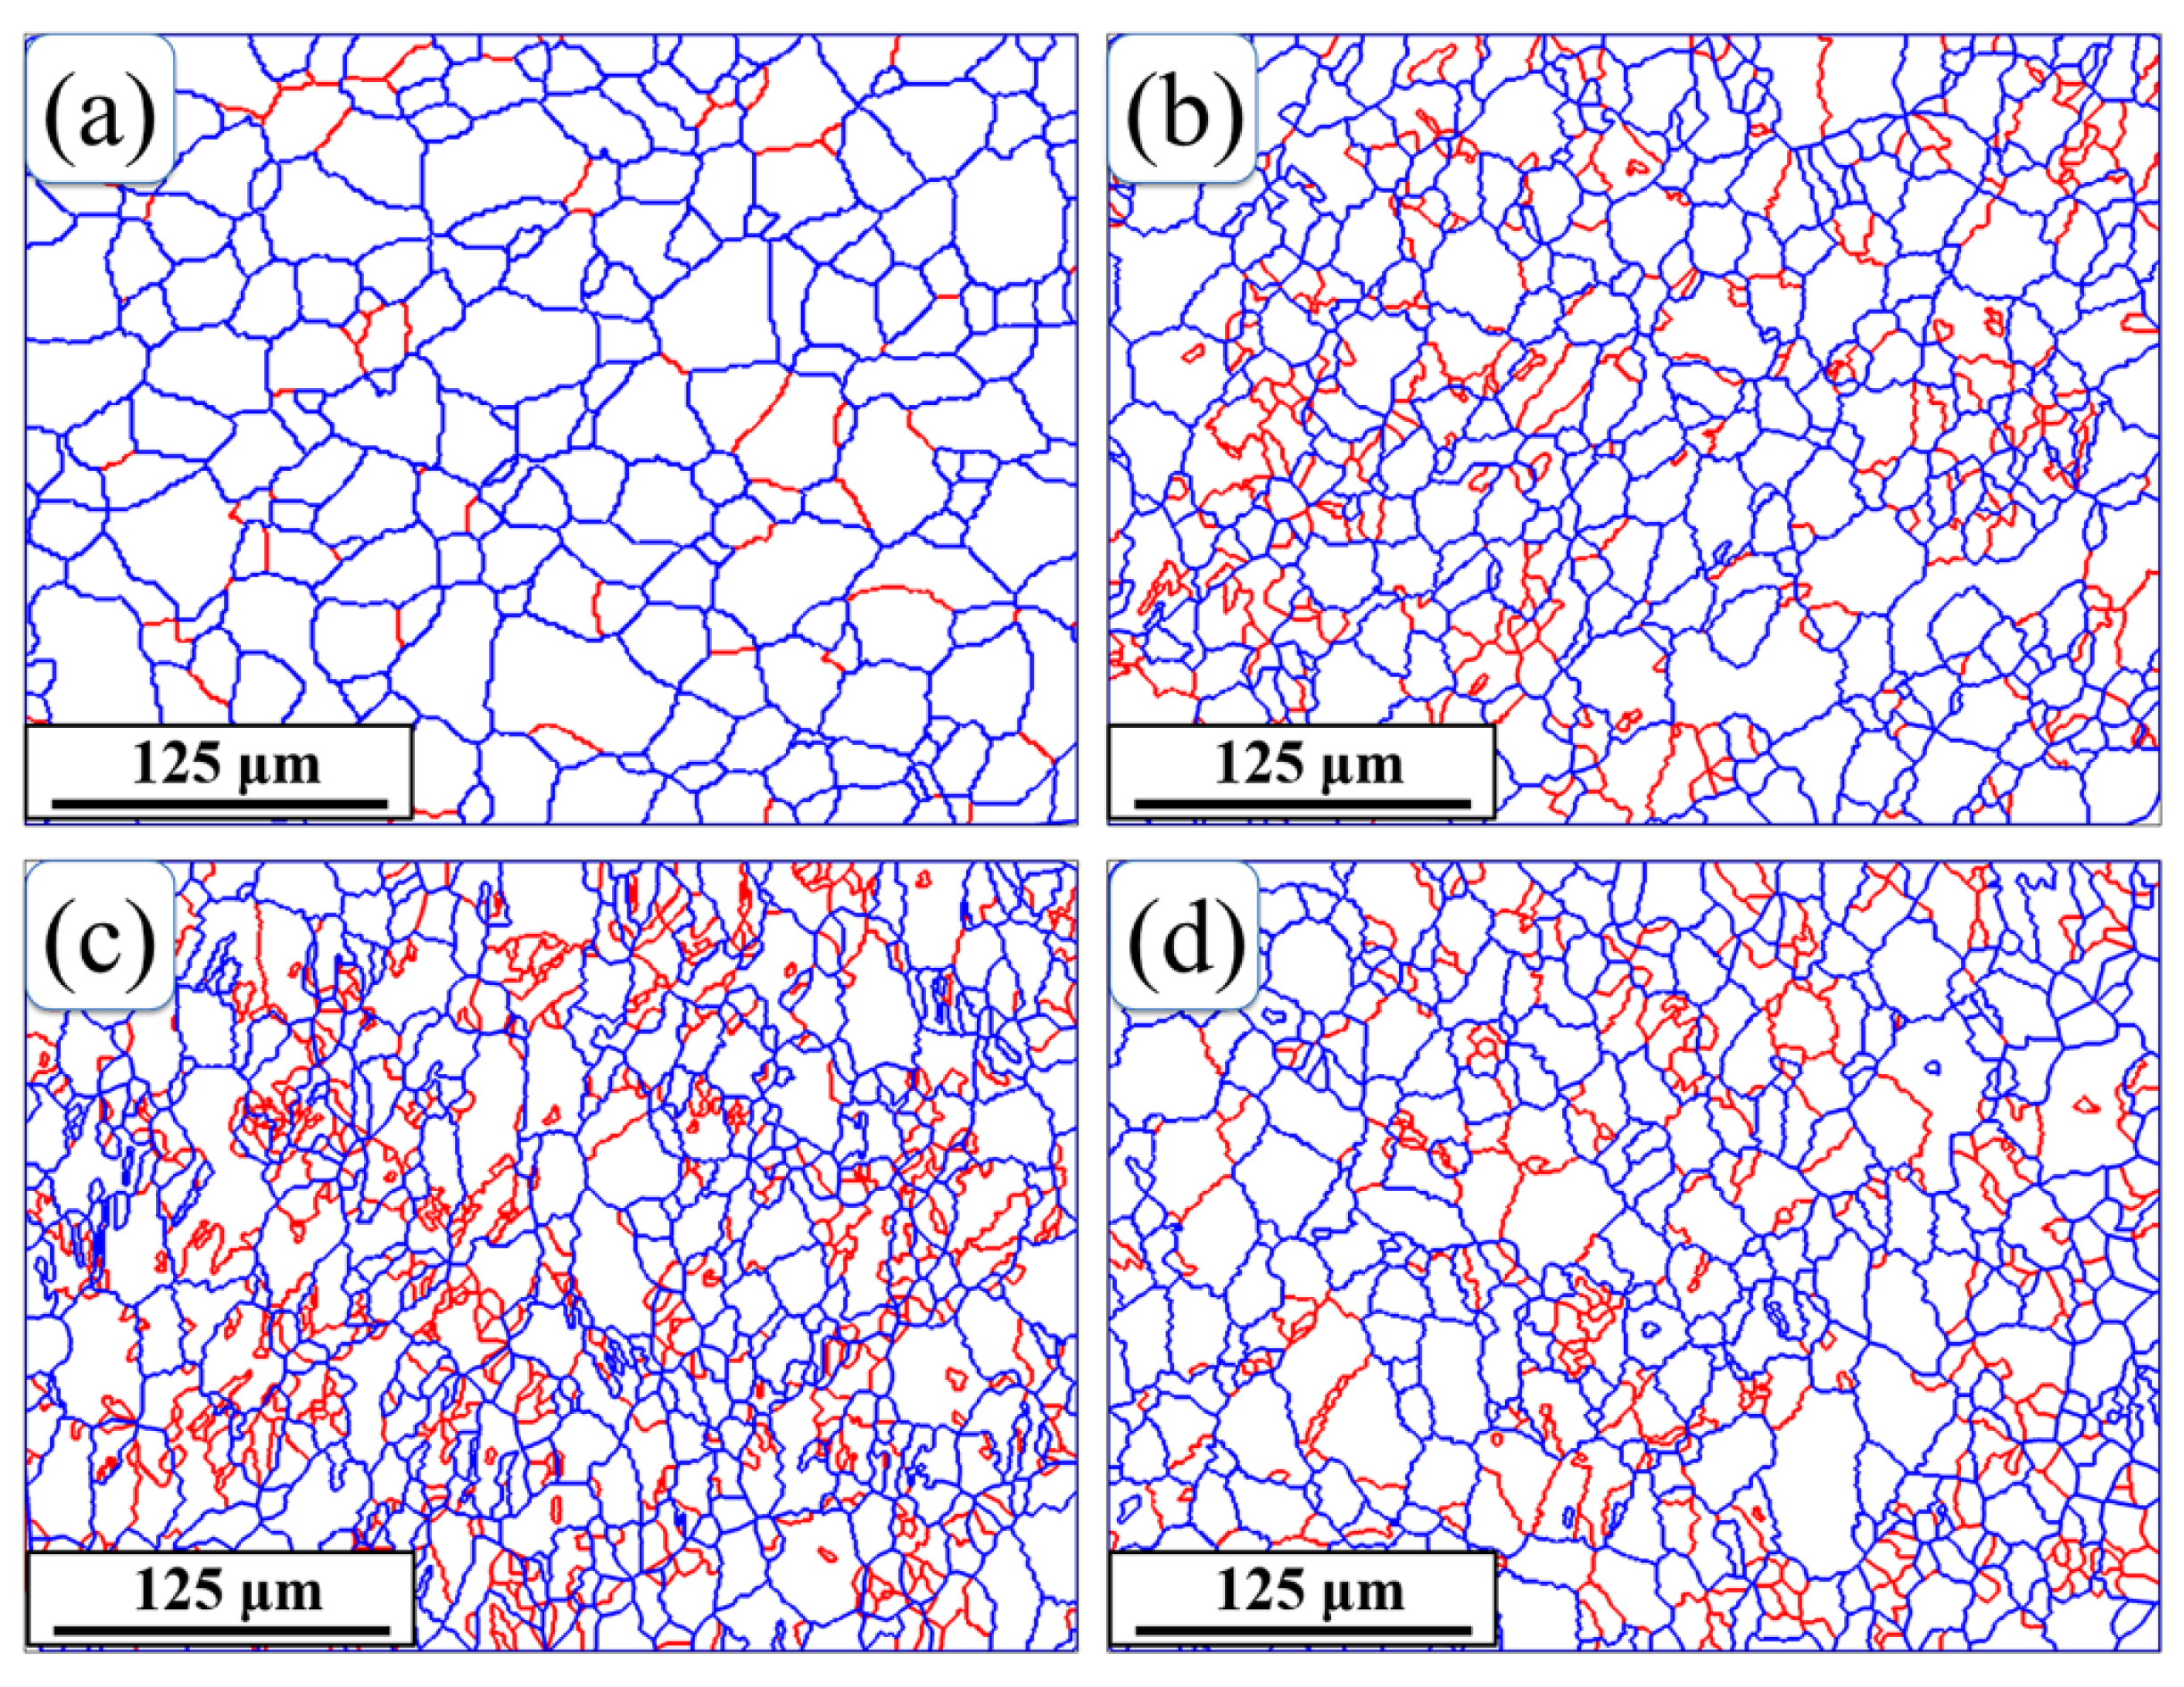
Figure 5.
RVE (representative volume element model) of polycrystalline NiTi SMA based on the voxel model.
Figure 5.
RVE (representative volume element model) of polycrystalline NiTi SMA based on the voxel model.

Figure 6.
Simulated stress-strain curves from 20 realizations of uniaxial compression deformation of voxel model with various initial orientations: (a) 64 grains; (b) 216 grains; (c) 512 grains; (d) 1000 grains; (e) 1728 grains; (f) the averaged stress-strain curves corresponding to different grain numbers.
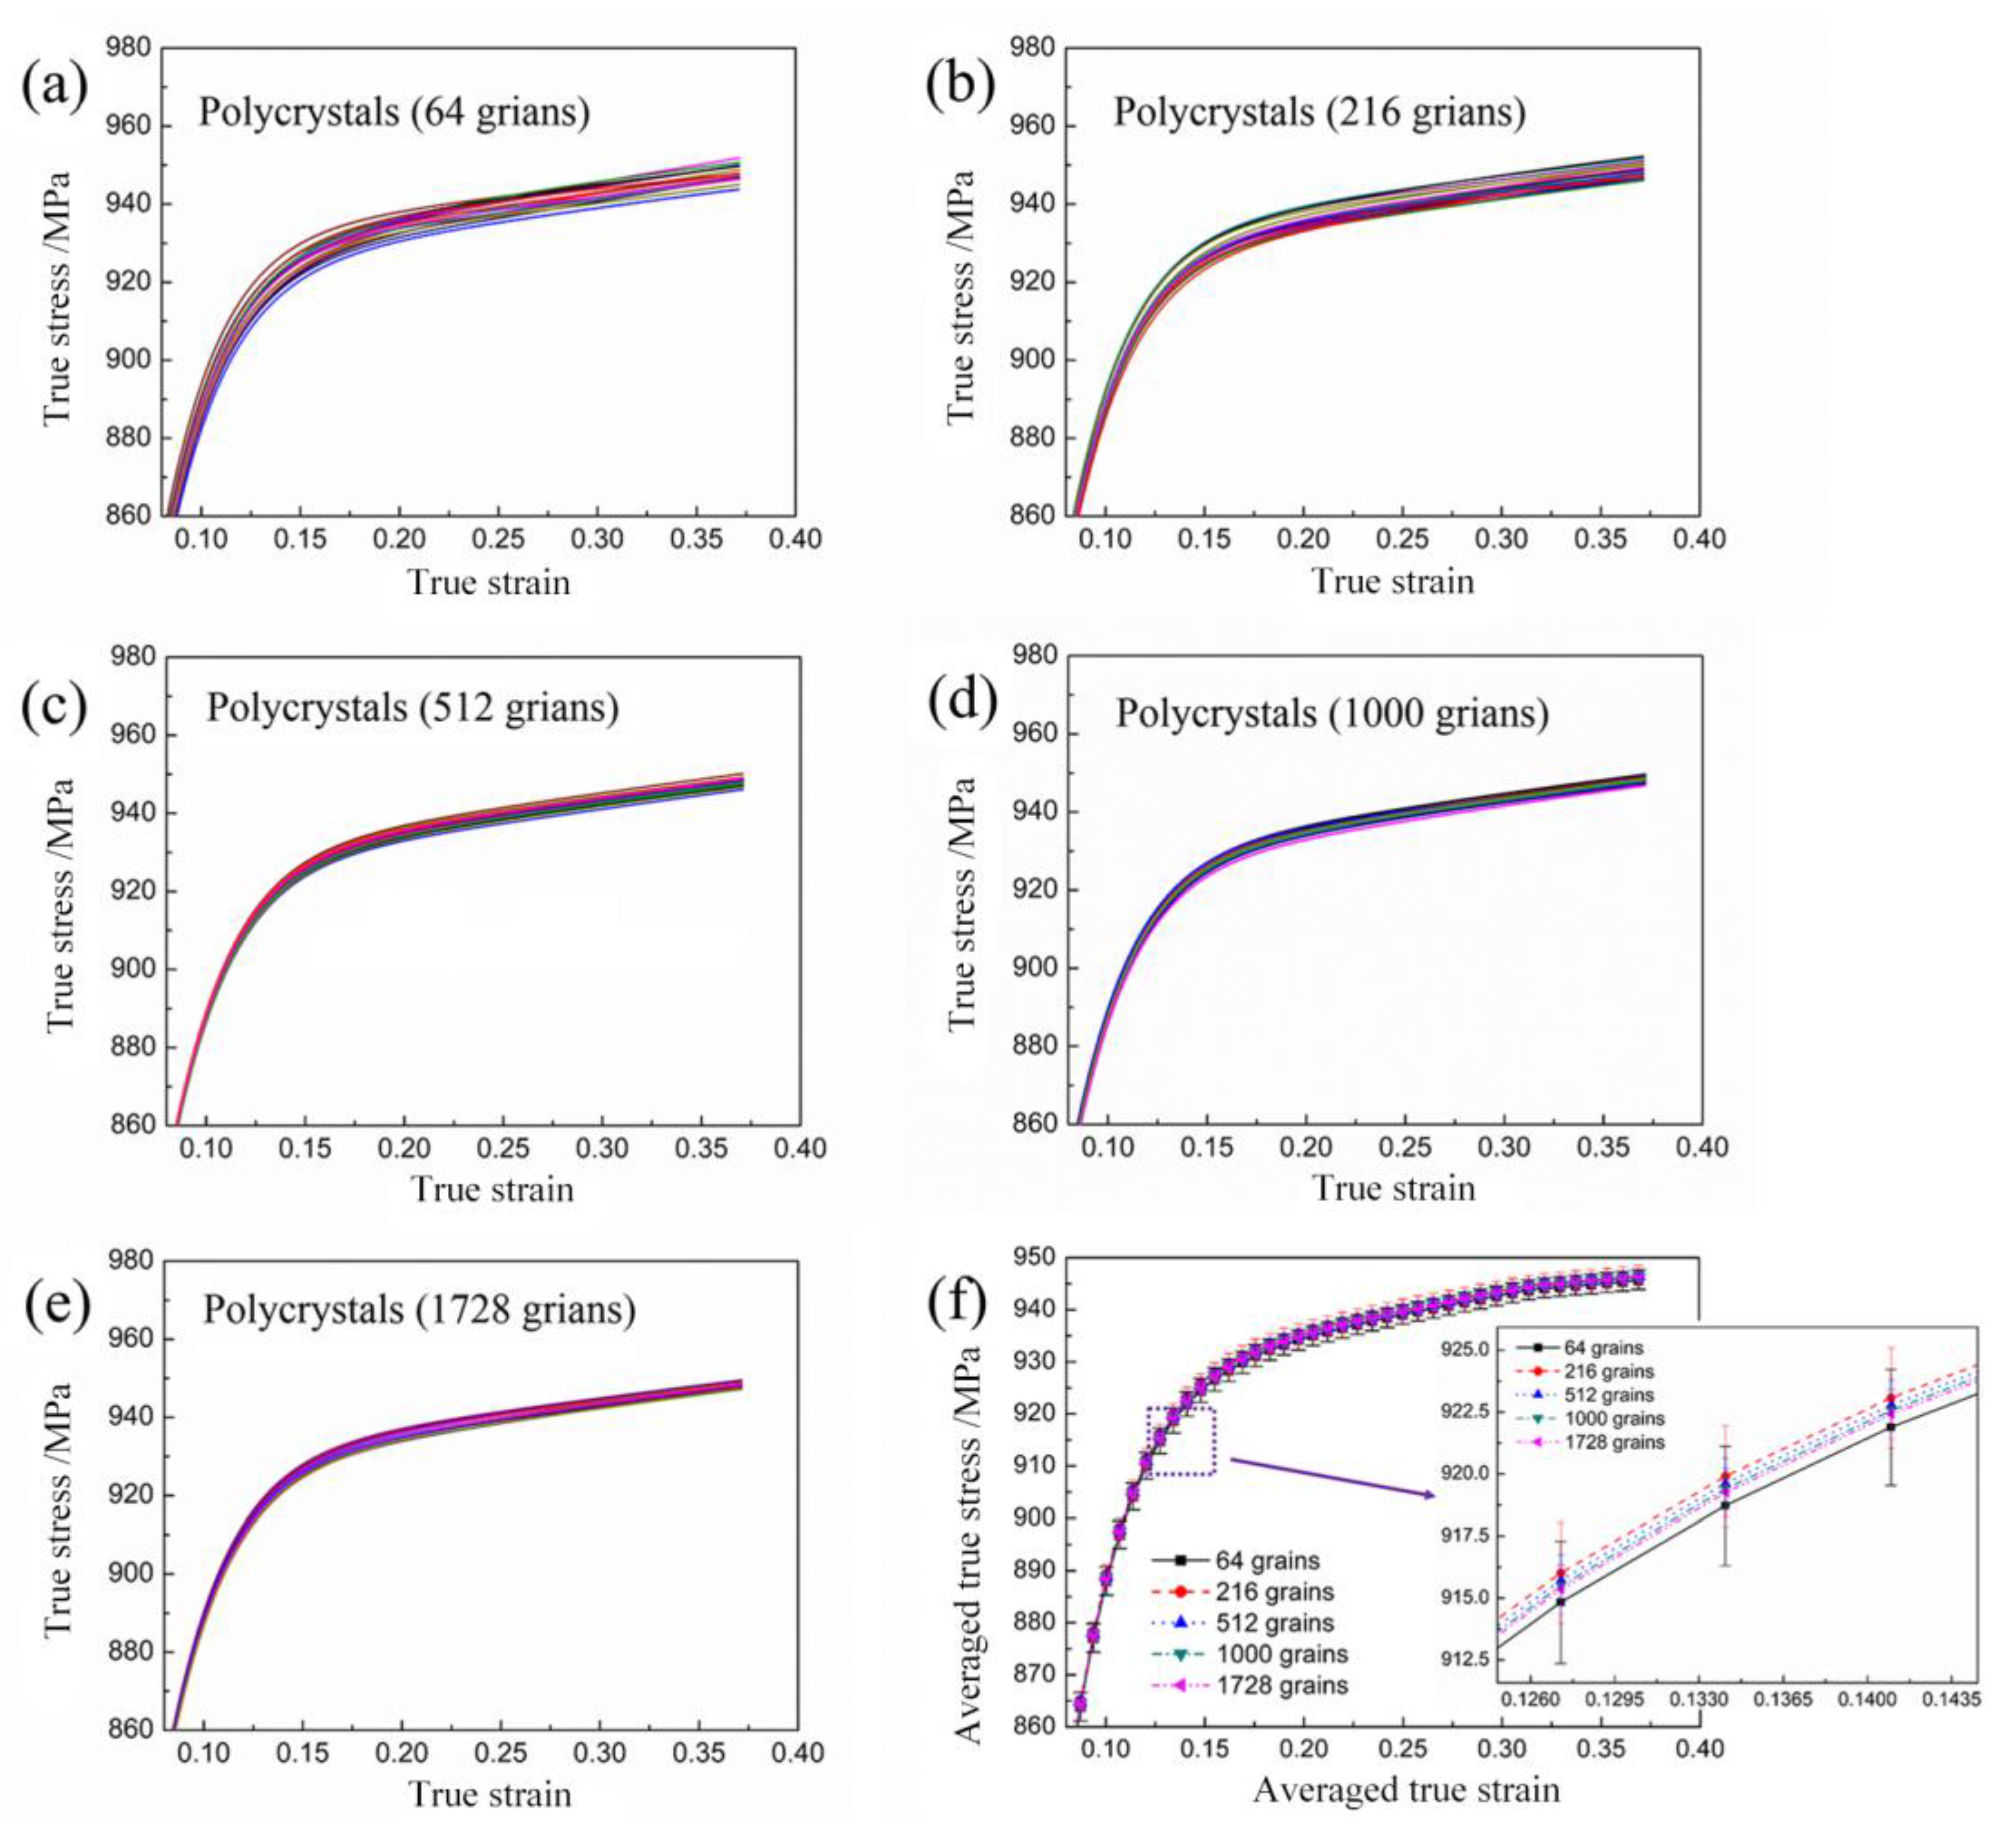
Figure 7.
Orientation distribution function sections of as-received NiTi SMA used for describing initial texture: (a) based on EBSD experiment; (b) based on simulation via 1000 extracted grain orientations.
Figure 7.
Orientation distribution function sections of as-received NiTi SMA used for describing initial texture: (a) based on EBSD experiment; (b) based on simulation via 1000 extracted grain orientations.

Figure 8.
Flow chart of material parameter identification based on PSO (Particle swarm optimization).
Figure 8.
Flow chart of material parameter identification based on PSO (Particle swarm optimization).

Figure 9.
The convergence of PSO algorithm in the aspect of parameter identification and the validity of material parameters: (a) fitness function convergence as a function of generation number; (b) macroscopic stress-strain response of NiTi SMA subjected to uniaxial compression based on compression experiment and crystal plasticity finite element simulation.

Figure 10.
Pole figures showing texture evolution of NiTi SMA subjected to uniaxial compression at various deformation degrees: (a) 0%; (b) 20%; (c) 30%; (d) 40%.
Figure 10.
Pole figures showing texture evolution of NiTi SMA subjected to uniaxial compression at various deformation degrees: (a) 0%; (b) 20%; (c) 30%; (d) 40%.


Table 1.
Material parameters of as-received NiTi SMA used for simulation.
| Slip Mode | q | n | ||||
|---|---|---|---|---|---|---|
| {110}<100> slip system | 1283.29 MPa | 354.59 MPa | 134.53 MPa | 0.001 s−1 | 1.40 | 20 |
| {010}<100> slip system | 5191.62 MPa | 505.90 MPa | 489.93 MPa | 0.001 s−1 | 1.40 | 20 |
| {110}<111> slip system | 3574.64 MPa | 390.27 MPa | 239.58 MPa | 0.001 s−1 | 1.40 | 20 |
© 2017 by the authors. Licensee MDPI, Basel, Switzerland. This article is an open access article distributed under the terms and conditions of the Creative Commons Attribution (CC BY) license (http://creativecommons.org/licenses/by/4.0/).
Share and Cite
MDPI and ACS Style
Hu, L.; Jiang, S.; Zhang, Y. A Combined Experimental-Numerical Approach for Investigating Texture Evolution of NiTi Shape Memory Alloy under Uniaxial Compression. Metals 2017, 7, 356. https://doi.org/10.3390/met7090356
AMA Style
Hu L, Jiang S, Zhang Y. A Combined Experimental-Numerical Approach for Investigating Texture Evolution of NiTi Shape Memory Alloy under Uniaxial Compression. Metals. 2017; 7(9):356. https://doi.org/10.3390/met7090356
Chicago/Turabian StyleHu, Li, Shuyong Jiang, and Yanqiu Zhang. 2017. "A Combined Experimental-Numerical Approach for Investigating Texture Evolution of NiTi Shape Memory Alloy under Uniaxial Compression" Metals 7, no. 9: 356. https://doi.org/10.3390/met7090356
Note that from the first issue of 2016, this journal uses article numbers instead of page numbers. See further details here.