Article

Optimization by Using Taguchi Method of the Production of Magnesium-Matrix Carbide Reinforced Composites by Powder Metallurgy Method

by
Özkan Küçük
1,*,
Tayeb Taher Kalefe Elfarah
2,
Serkan Islak
1 and
Cihan Özorak
1
1
Materials Science and Nanotechnology Engineering Department, Engineering-Architecture Faculty, Kastamonu University, 37150 Kastamonu, Turkey
2
Materials Science and Engineering, Institute of Science, Kastamonu University, 37150 Kastamonu, Turkey
*
Author to whom correspondence should be addressed.
Metals 2017, 7(9), 352; https://doi.org/10.3390/met7090352
Submission received: 28 July 2017 / Revised: 22 August 2017 / Accepted: 3 September 2017 / Published: 7 September 2017

Abstract

:
The aim of this study was to determine the optimum production parameters in the production of magnesium matrix carbide-reinforced composites by using the powder metallurgy method. The parameter levels maximizing density (%), hardness (HB10), and bending strength (MPa) values were found by using the Taguchi method. The type of reinforcement, the amount of reinforcement, the sintering time, the sintering temperature, additive type, and additive rate were selected as the production parameters. Since the production of Mg and its alloys by using casting methods is problematic, the hot pressing method, a powder metallurgy method, was preferred in this study. Ceramic-based carbide particles were used as reinforcing materials in Mg matrix composite materials. B4C, SiC, Mo2C, and TiC carbides were preferred as the carbide. Microstructure and phase composition of the produced materials was examined with scanning electron microscope (SEM), X-ray diffractogram (XRD) and X-ray energy dispersive spectrometry (EDS). The hardness of the materials was measured by using a Universal Hardness device. The relative densities of the materials were determined according to Archimedes’ principle. The bending strength properties of the materials were determined by using the three-point bending test. The optimum conditions were a sintering temperature of 500 °C, sintering duration of 5 min, additive type of B4C and additive rate of 2.5%, and the results obtained at these conditions were found to be as follows; relative density of 98.74 (%), hardness of 87.16 HB10 and bending strength of 193.65 MPa. SEM images taken from the fracture surfaces showed that the carbides added to the matrix had a relatively homogeneous distribution. XRD analyses revealed that the matrix was oxidized very little, and no phase formation occurred between the matrix and the carbides. Carbide addition caused a distinct hardness increase by showing the effect of distribution strengthening in the matrix.

1. Introduction

Magnesium alloys have extremely important properties, such as good damping capacity, high specific heat capacity, high sound absorption and excellent sealing properties, as well as low density (e.g., two-thirds that of aluminum, a quarter that of zinc, and one fifth that of steel). Despite these excellent properties, magnesium alloys have low strength, especially at high temperatures [1]. In order to improve the mechanical properties of magnesium alloys, secondary phases are formed in the matrix, or hard particles are added to the matrix. The second phases obtained by the first method lose their properties by dissolving above certain temperatures. For this reason, metal matrix composites (MMCs) are produced by using the second method, and their strength is increased. Recently, MMCs have been extensively investigated and implemented due to their promising advanced properties. Reinforcing particles, which are compatible with the matrix, are preferred in these composites [2,3,4,5,6,7,8]. Once again, nanoparticle-reinforced metal matrix composites are promising materials, and they are suitable for many applications [9].
High-quality MMCs offer superior mechanical properties compared to their monolithic equivalents. They show wear resistance that increases with increased hardness, tensile and fatigue strength, improved creep resistance and high temperature features [10,11]. In general, Mg-MMCs are strengthened with various ceramic particles, such as SiC, Al2O3, Mg2Si and carbon nanotubes. Esmaily et al. [12] produced AM50 and AZ91D matrix SiC reinforced composites by using the casting method. Oxidation was avoided by using fine-grained SiC particles. In addition, a significant increase was obtained in hardness due to the intermetallic phases in the matrix and the carbide added externally. As material technologies progress, the use of nanoparticles in composite materials has also increased. Sun et al. [13] produced magnesium matrix carbon nanotube-reinforced (Mg/CNT) composite materials by using the powder metallurgy method. Before this process, the chemical vapor deposition method was used to homogeneously distribute carbon nanotubes in Mg. The tensile strength of the produced Mg/CNT composites increased by 45% compared to unreinforced magnesium.
Metal matrix composites (MMCs) are produced using various methods such as mixing casting [14], gas pressure infiltration [15], powder metallurgy [16], compression casting [17], spray deposition [18], injection molding [19], and so on. When the literature is examined, it can be seen that the use of design by the Taguchi method in the production of composites is very limited.
The aim of this study was to determine the optimum production parameters in the production of magnesium matrix carbide-reinforced composites by using the powder metallurgy method, and accordingly the parameter levels maximizing density (%), hardness (HB10) and bending strength (MPa) values were found by using Taguchi method.

2. Materials and Methods

2.1. Preparation of Materials and Experimental Plan

In this study, MgAl matrix carbide-reinforced composite materials were produced by the hot pressing method, one of the powder metallurgy methods. These composites were produced by using the Taguchi method to determine the optimum production parameters. B4C, SiC, Mo2C, and TiC were used as additives. Magnesium with 99.8% purity and −325 mesh grain size and aluminum powder mixture (95% Mg + 5% Al) alloy with 99.5% purity and −325 mesh grain size were used as matrix material in all tests. The carbides had −325 mesh grain size and 99.5% purity. Table 1 shows the parameters used in the production of composites and their levels. In the optimization studies conducted by using the Taguchi method, reinforcement type, additive amount of reinforcement, sintering time, and sintering temperature were used as parameter and each test was repeated at least twice. In the study, L16(44) orthogonal factorial design was used. Table 2 shows the experimental design of this study.
In order to give the desired performance of the powders selected in the composite production, it is extremely important to distribute them homogeneously in the matrix. For this purpose, mixers working on the three-axis rotation principle were used. Firstly, 5 wt % aluminum was added into the ready magnesium powder. This mixture was stirred at 20 rpm for 30 min. B4C, SiC, Mo2C and TiC powders were then added into this mixture at different rates and mixed in the mixer at 20 rpm for 120 min. 1 wt % PEG (polyethylene glycol) was added into the composite powder mixture in order not to disturb the distribution, in order for the matrix powders not to pour out from the graphite molds, and in order for the frictions between the mold and powder to be minimized. After the mixing process was completed, the mixture was kept in storage tubes in order prevent oxidation by contact with the air. Powder mixtures mixed in a mixer working on the three-axis rotation principle were pressed in the hydraulic cold pressing machine. The purpose of cold pressing is the easy placement of powder alloys into the graphite molds before the hot pressing and the use of molds with smaller volumes. The cold-molded composites were then placed in graphite molds. The composites placed in the graphite molds were hot-pressed using a Programmable Logic Controllers (PLC) controlled SMVB (C)/3 model vacuum hot press machine (Zhengzhou Golden Highway Co. Ltd., Zhengzhou, China) operating on the direct resistance heating principle according to the Taguchi Experimental Plan in Table 2.
In order to find out the composite densities, the densities of all the samples were measured according to Archimedes’ principle as specified in the ASTM B 311-08 standard. In order to understand in which ratio the composites obtained as a result of sintering after obtaining those values can be sintered according to the theoretical, i.e., calculated density, relative densities of the samples were calculated according to the following formula.
ρ b = ρ ρ k × 100 ,
where
  • ρb = Relative density (%);
  • ρ = Experimentally measured density (gr/cm3);
  • ρk = Theoretical density calculated based on powder mixture ratios (gr/cm3).
In order to determine the hardness of the samples, the hardness of the samples was measured in Brinell with a load of 62.5 kg and a ball with 2.5 mm diameter in the brinell hardness testing device. Three-point bending testing was carried out at a test speed of 1 mm/min and according to the ASTM B 528-83a standard in a universal tensile testing device with 50 kN capacity in order to determine the fracture toughness. For the three-point bending test, samples in dimensions of 40 mm × 10 mm × 10 mm were used. In order to determine the bending strength, the following formula was used:
P = 3 F L 2 b h 2 ,
where
  • P = Bending strength (MPa);
  • F = The force applied to the sample at the moment of the fracture (N);
  • L = Distance between support points (mm);
  • b = Sample width (mm);
  • h = Sample height (mm).
A FEI QUANTA 250 FEG brand SEM device (FEI Inc., Hillsboro, OR, USA) was used for SEM analysis. In addition to SEM, EDS analyses were also performed to determine the chemical composition of the microstructure. X-ray analysis was performed to determine the phases forming in the microstructure. X-ray analyses were performed by using a Bruker D8 Advance device (Bruker Optik GmbH, Ettlingen, Germany).

2.2. Taguchi Method

One of the methods based on the principle of performing the minimum number of experiments to minimize costs is the “Taguchi Method”, developed by Japanese Scientist Genichi Taguchi [20]. The difference between this method and other statistical experimental design methods is that it categorizes the effective parameters in an experiment into two groups—controllable and uncontrollable—and allows the investigation of multiple parameters at more than two levels. Generally, the performance characteristic of each product or process needs to have a nominal value or target value. The goal is to reduce the variability around this target value. Optimum working conditions determined at the end of the experimental study should always give the same or very close performance value to each other in different operating environments or at different times. For this reason, the optimization criterion should control the minimization of the variability in the performance value. According to the Taguchi method, such an optimization criterion is a performance statistic.
The optimum condition is determined by studying the main effects of each factor, and these main effects show the general tendencies of the effects of the factors. When it is known that either a high or a low value gives the desired result, it becomes possible to estimate the levels of the factors expected to yield the best results. Analysis of variance (ANOVA) is a common statistical process applied mostly to experimental results to determine the percentage effect of each factor. The ANOVA table given for an analysis helps to determine which factors need to be controlled.
Since the quality of any product is measured with a single criterion, or the combination of multiple criteria, regardless of the quality of the measurement, the performed measurement will belong to one of the following three characteristics [21].
  • The bigger, the better;
  • The smaller, the better;
  • Nominal values are better.
Performance statistics formulas of the above three characteristics for determination of the optimum levels of the parameters are as follows.
For the characteristic of “the bigger, the better”:
In this case, the target value of y is infinite and the signal-to-noise ratio is defined as:
S N L = 10 log 1 n n = 1 n 1 y 2 .
For the characteristic of “the smaller, the better”:
In such problems, the target value of quality variable y is zero. In this case, the signal-to-noise ratio is defined as:
S N S = 10 log [ 1 n n = 1 n y 2 ] .
For the characteristic of “nominal values are better”:
In such problems, a certain target value is given for Y. In this case,
S N N = 10 log ( y 2 ¯ / S ) .
In all three problems, the goal is to maximize the SN ratio. According to the Taguchi method, maximizing the SN ratios increases the signal on the one hand, and reduces the variance on the other hand [20].
In the above equations, n is the number of repeated experimental tests, y is the performance value (it is relative density, hardness or bending strength in this study). If the purpose of a process is to reach the maximum value, the parameter levels maximizing the SNL value are optimum. If the goal is to reach the minimum value, in this case, the parameter levels maximizing the SNS are optimal.
In the Taguchi method, if the experiment corresponding to optimum working conditions is not present in the experiment plan, the performance value can be estimated with the help of the following equation [22].
Y i = μ + X i + e i ,
where Y i is the estimated performance value of the i experiment, X i is the total efficiency dimension of the parameter levels used in the i experiment, and e i is the experimental error.
If the experimental results are given as a percentage, omega-transformation of the percentage values obtained before using Equation (6) is carried out. The omega (Ω) value estimated from these values for the optimum conditions is then found and, finally, the inverse transformation is performed using the same equation [23].
Ω ( db ) = 10 log ( 1 p 1 ) ,
where, Ω(db) is the decibel value, p is the percentage value obtained experimentally. Since Equation (6) is an estimation calculated by using experimental data in order to determine whether the additional model is appropriate, the confidence interval for the estimated error needs to be evaluated [22]. The estimated error is the difference between the observed p and the estimated p. The confidence interval (Se) for the estimated error is found with the help of the following equation.
S e = ± 2 ( 1 n 0 ) σ e 2 + ( 1 n r ) σ e 2 ,
σ e 2 = Sum of error squares Freedom degree for error ,
1 n 0 = 1 n + [ 1 n A i 1 n ] + [ 1 n B i 1 n ] + [ 1 n C i 1 n ] + ,
where Se is the confidence interval of two standard deviations, n is the number of experiments in the experimental design, nr is the number of repetition of verification test and n A i , n B i , n C i ,... are the number of i levels of A, B, C parameters. If the estimated error is beyond these limits, it is assumed that this model is not suitable. Otherwise, the additive model can be considered to be adequate [22].
A verification experiment is a powerful tool for detecting the presence of interactions among the control parameters. If the predicted response under the optimum conditions does not match the observed response, then it implies that the interactions are important. If the predicted response matches the observed response, then the interactions are probably not important and the additive model is a good approximation [23].

3. Results and Discussion

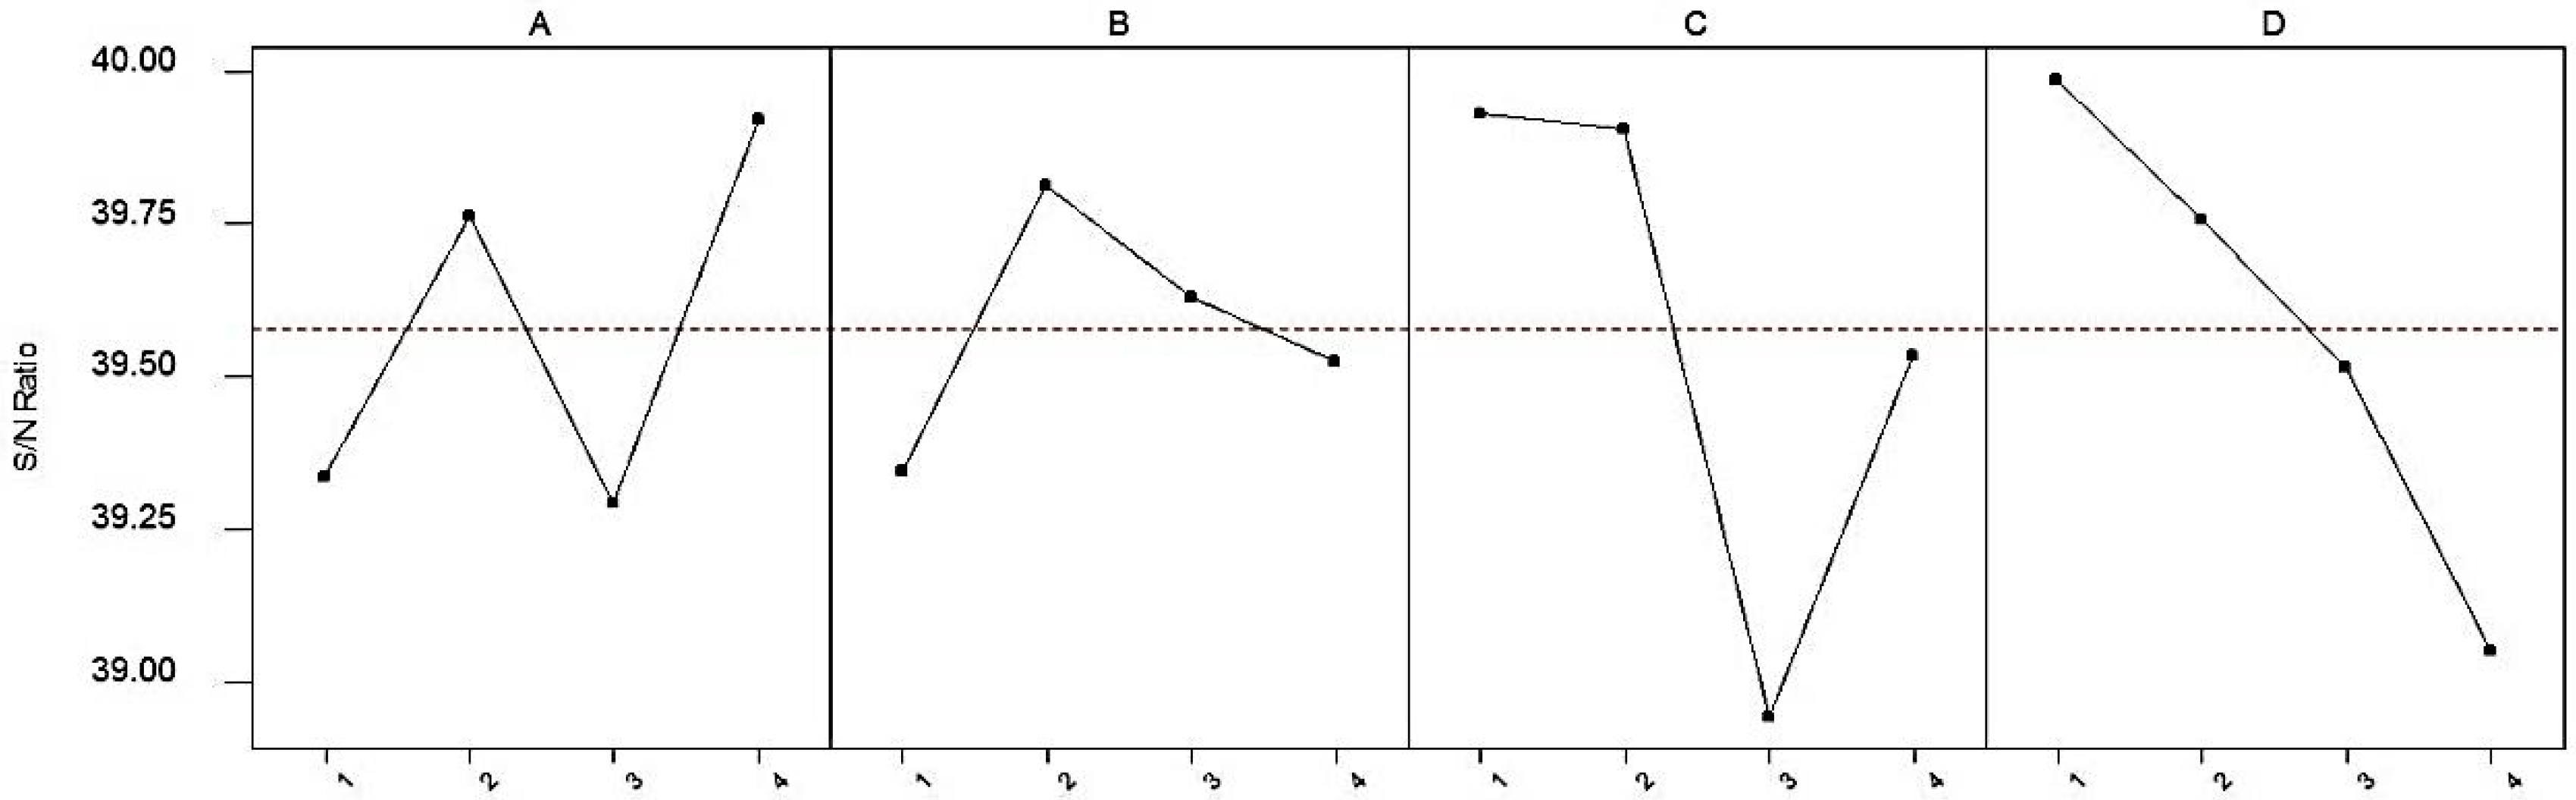
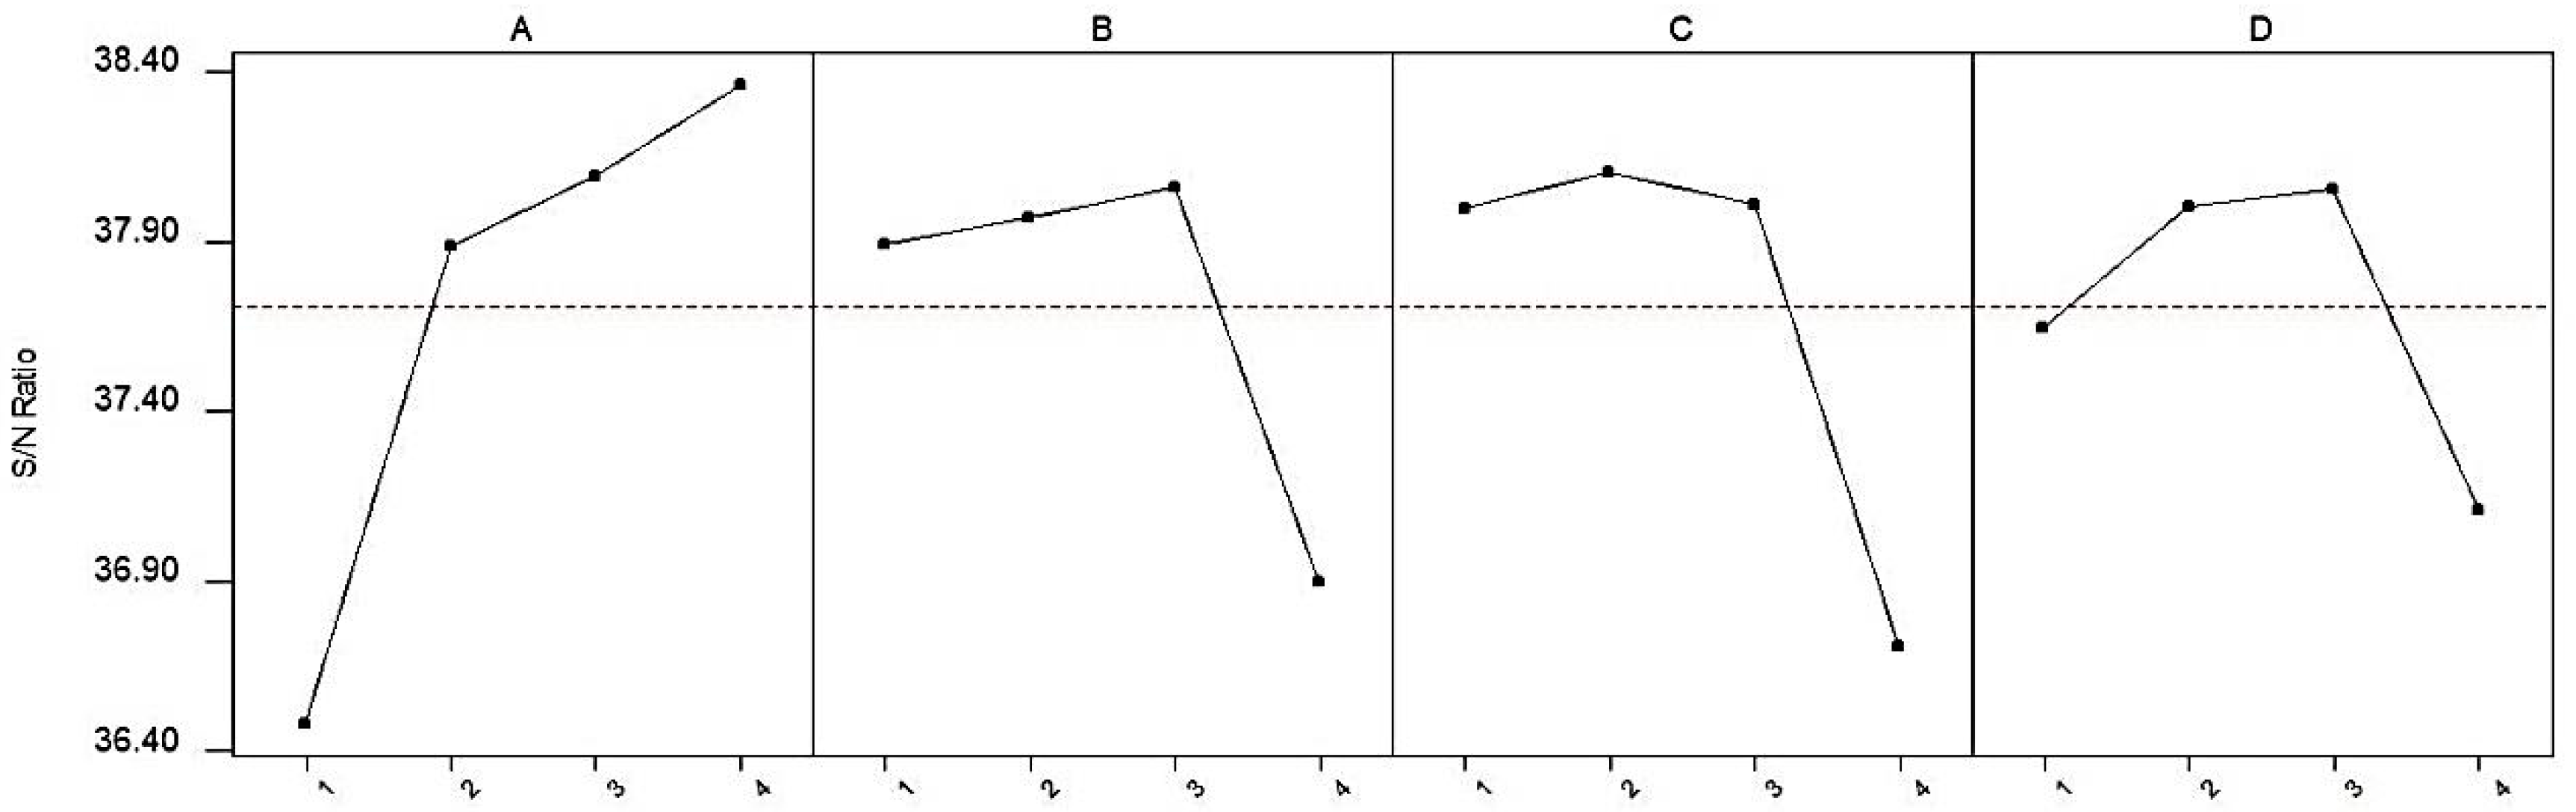
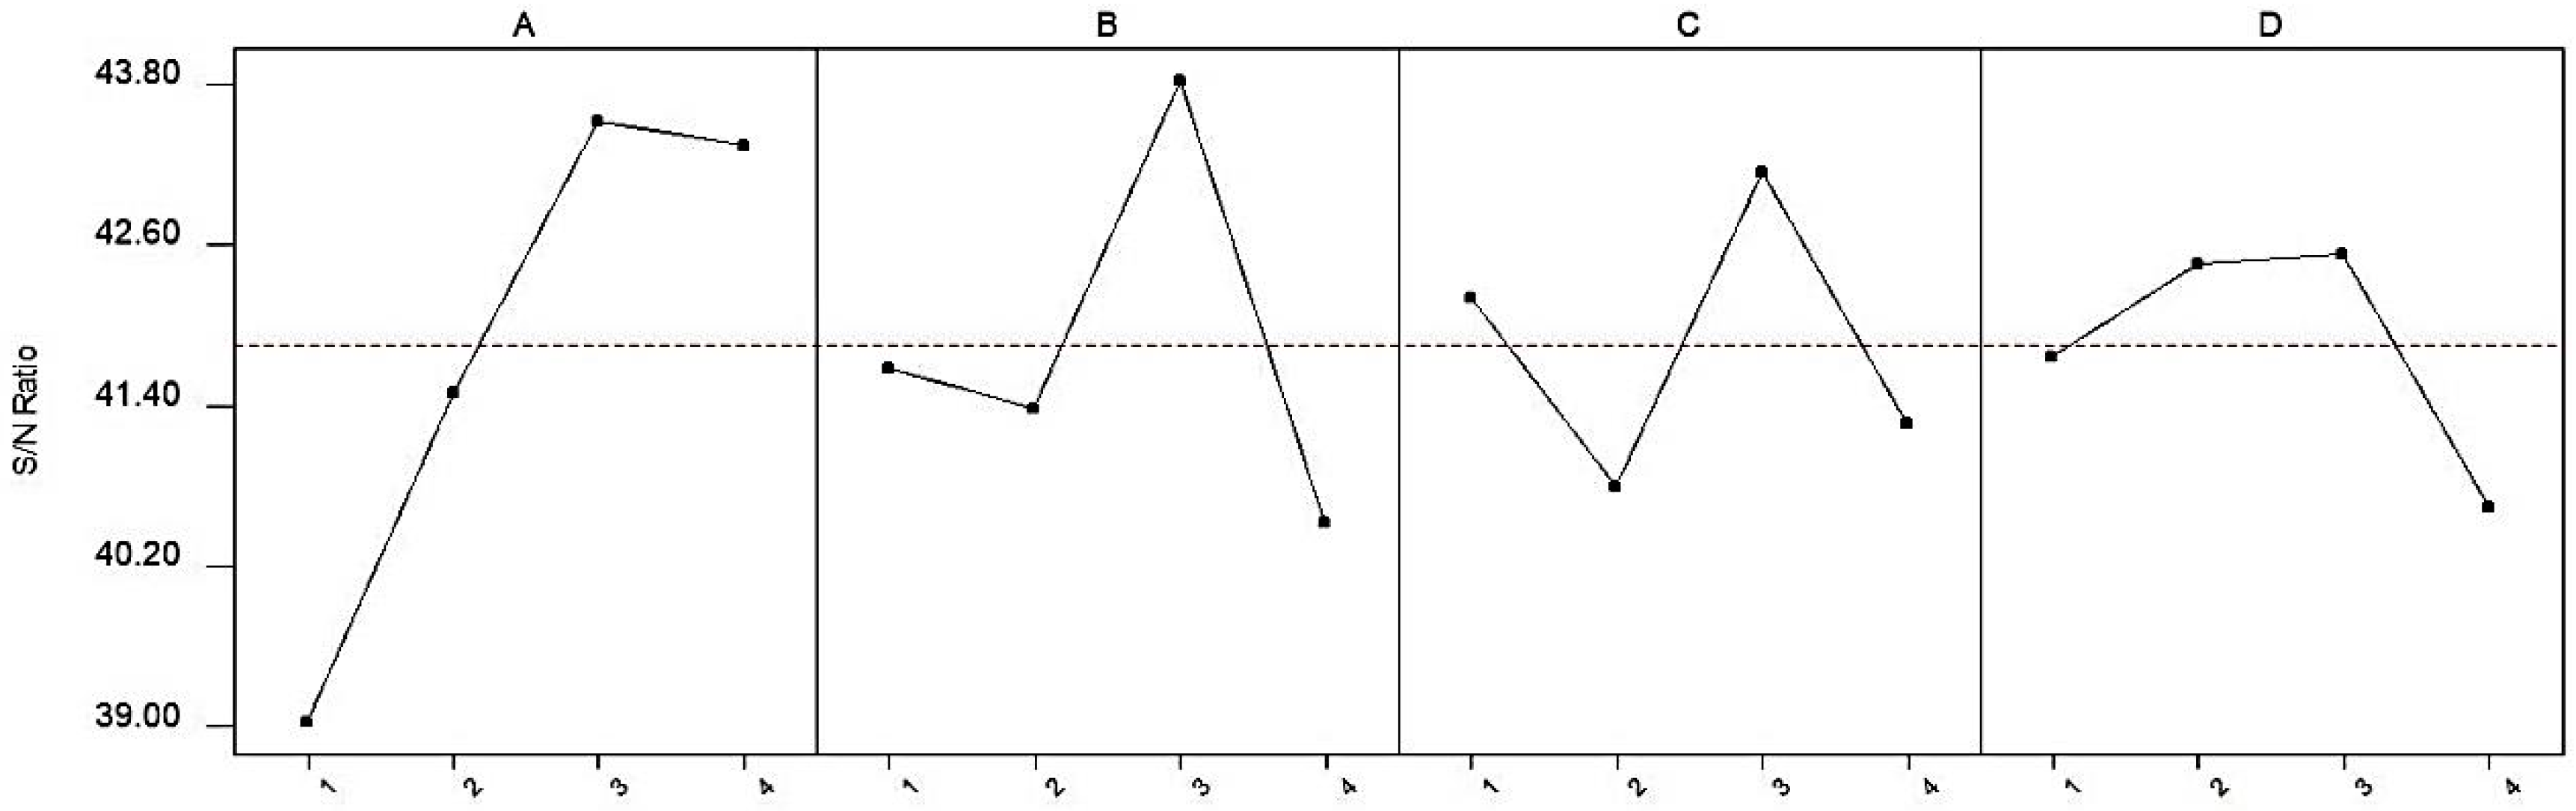
3.1. Statistical Analysis

In this study, an L16(44) Taguchi orthogonal design was used. Relative density (%), Hardness (HB10), and Bending Strength (MPa) were taken as the performance statistics, and Table 3 shows the experimental results.
The SNL equation was used to determine the parameter levels that maximize the density (%), hardness (HB10) and bending strength (MPa) values in the production of magnesium matrix carbide-reinforced composites by the powder metallurgy method. SN values were found from Equation (3) to determine the parameter levels that maximize the performance statistics. The results obtained by calculating the SNort marginal average performance statistic values for parameter levels with the help of these SN values are shown graphically in Figure 1 for density, in Figure 2 for hardness, and in Figure 3 for bending strength. Equation (6) was used to estimate the performance value of the parameter levels that maximize the SNort values.
When Figure 1 is examined, it can be seen that the parameter levels maximizing the SNort value are A4, B2, C1 and D1. Therefore, the parameter values maximizing the relative density would be A4, B2, C1 and D1. Optimum conditions were sintering temperature of 550 °C, sintering time of 3 min, additive type of B4C, and additive rate of %0. The relative density % estimated under optimum conditions was 100.00, and the value found experimentally was also 100.00%. When Figure 2 is examined, the parameter levels maximizing the SNort value are A4, B3, C2 and D3. Therefore, the parameter values maximizing the hardness would be A4, B3, C2 and D3. Optimum conditions were sintering temperature of 550 °C, sintering time of 5 min, additive type of SiC, and additive ratio of 5. Hardness (HB10) found under optimum conditions was 91.21. When Figure 3 is examined, parameter levels maximizing the SNort value are A3, B3, C3 and D3. Thus, the parameter values maximizing the relative density would be A3, B3, C3 and D3. Optimum conditions were sintering temperature of 500 °C, sintering time of 5 min, additive type of Mo2C, and additive ratio of 5%. The bending strength found under optimum conditions was 202.27 (MPa).
The F test is a tool to see which process parameters have a significant effect on the relative density, hardness and bending strength values. The F value for each process parameter is simply a ratio of the mean of the squared deviations to the mean of squared error. Usually, the larger the F value, the greater the effect on the relative density, hardness and the bending strength values due to the change of the process parameter. With the performance characteristics and ANOVA analyses, the optimal combination of process parameters can be predicted [24]. The variance of analysis was also performed for relative density, hardness and bending strength and their values are present in Table 4, Table 5 and Table 6. When Table 4 is examined, it can be observed that all parameters have an effect on the relative density of the produced material, and the most effective parameter was additive type, followed by the additive ratio, sintering temperature and sintering time, respectively. When Table 5 is examined, it can be observed that only sintering time has an effect, and additive type was less effective. When Table 6 is examined, it can be observed that all parameters are effective but the one with the least effect is additive ratio.
When all these results were examined, the presence of optimum conditions was investigated by including all of the performance statistical values, and the optimum conditions were determined using MINITAB program (Minitab Release 13.0, Copyright TM 2000 MINITAB INC., State College, PA, USA) as A3, B3, C1 and D2. These conditions were sintering temperature of 500 °C, sintering time of 5 min, additive type of B4C, and additive ratio of 2.5%. The results obtained under these observed optimum conditions were found to be 98.74 (%) for relative density, 87.16 HB10 for hardness, and 193.65 MPa for the bending strength. How the confidence interval of prediction is calculated is given in the literature [25].
Thus, it should be noted that the values in Table 7 are the predicted results from Equations (6) and (7) and the observed results for the same conditions. Also, the results in Table 7 are confidence limits of predictions. In order to test the predicted results, confirmation experiments were carried out twice under the same working conditions. The fact that the values from confirmation experiments were within the confidence intervals calculated from Equations (8)–(10) (see Table 7) shows that the experimental results were within confidence limits. This indicates that there is a good agreement between the predicted values and experimental values, and the interactive effects of the parameters are indeed negligible. It may be concluded that the additive model is adequate for describing the dependence of this process on the various parameters [26].

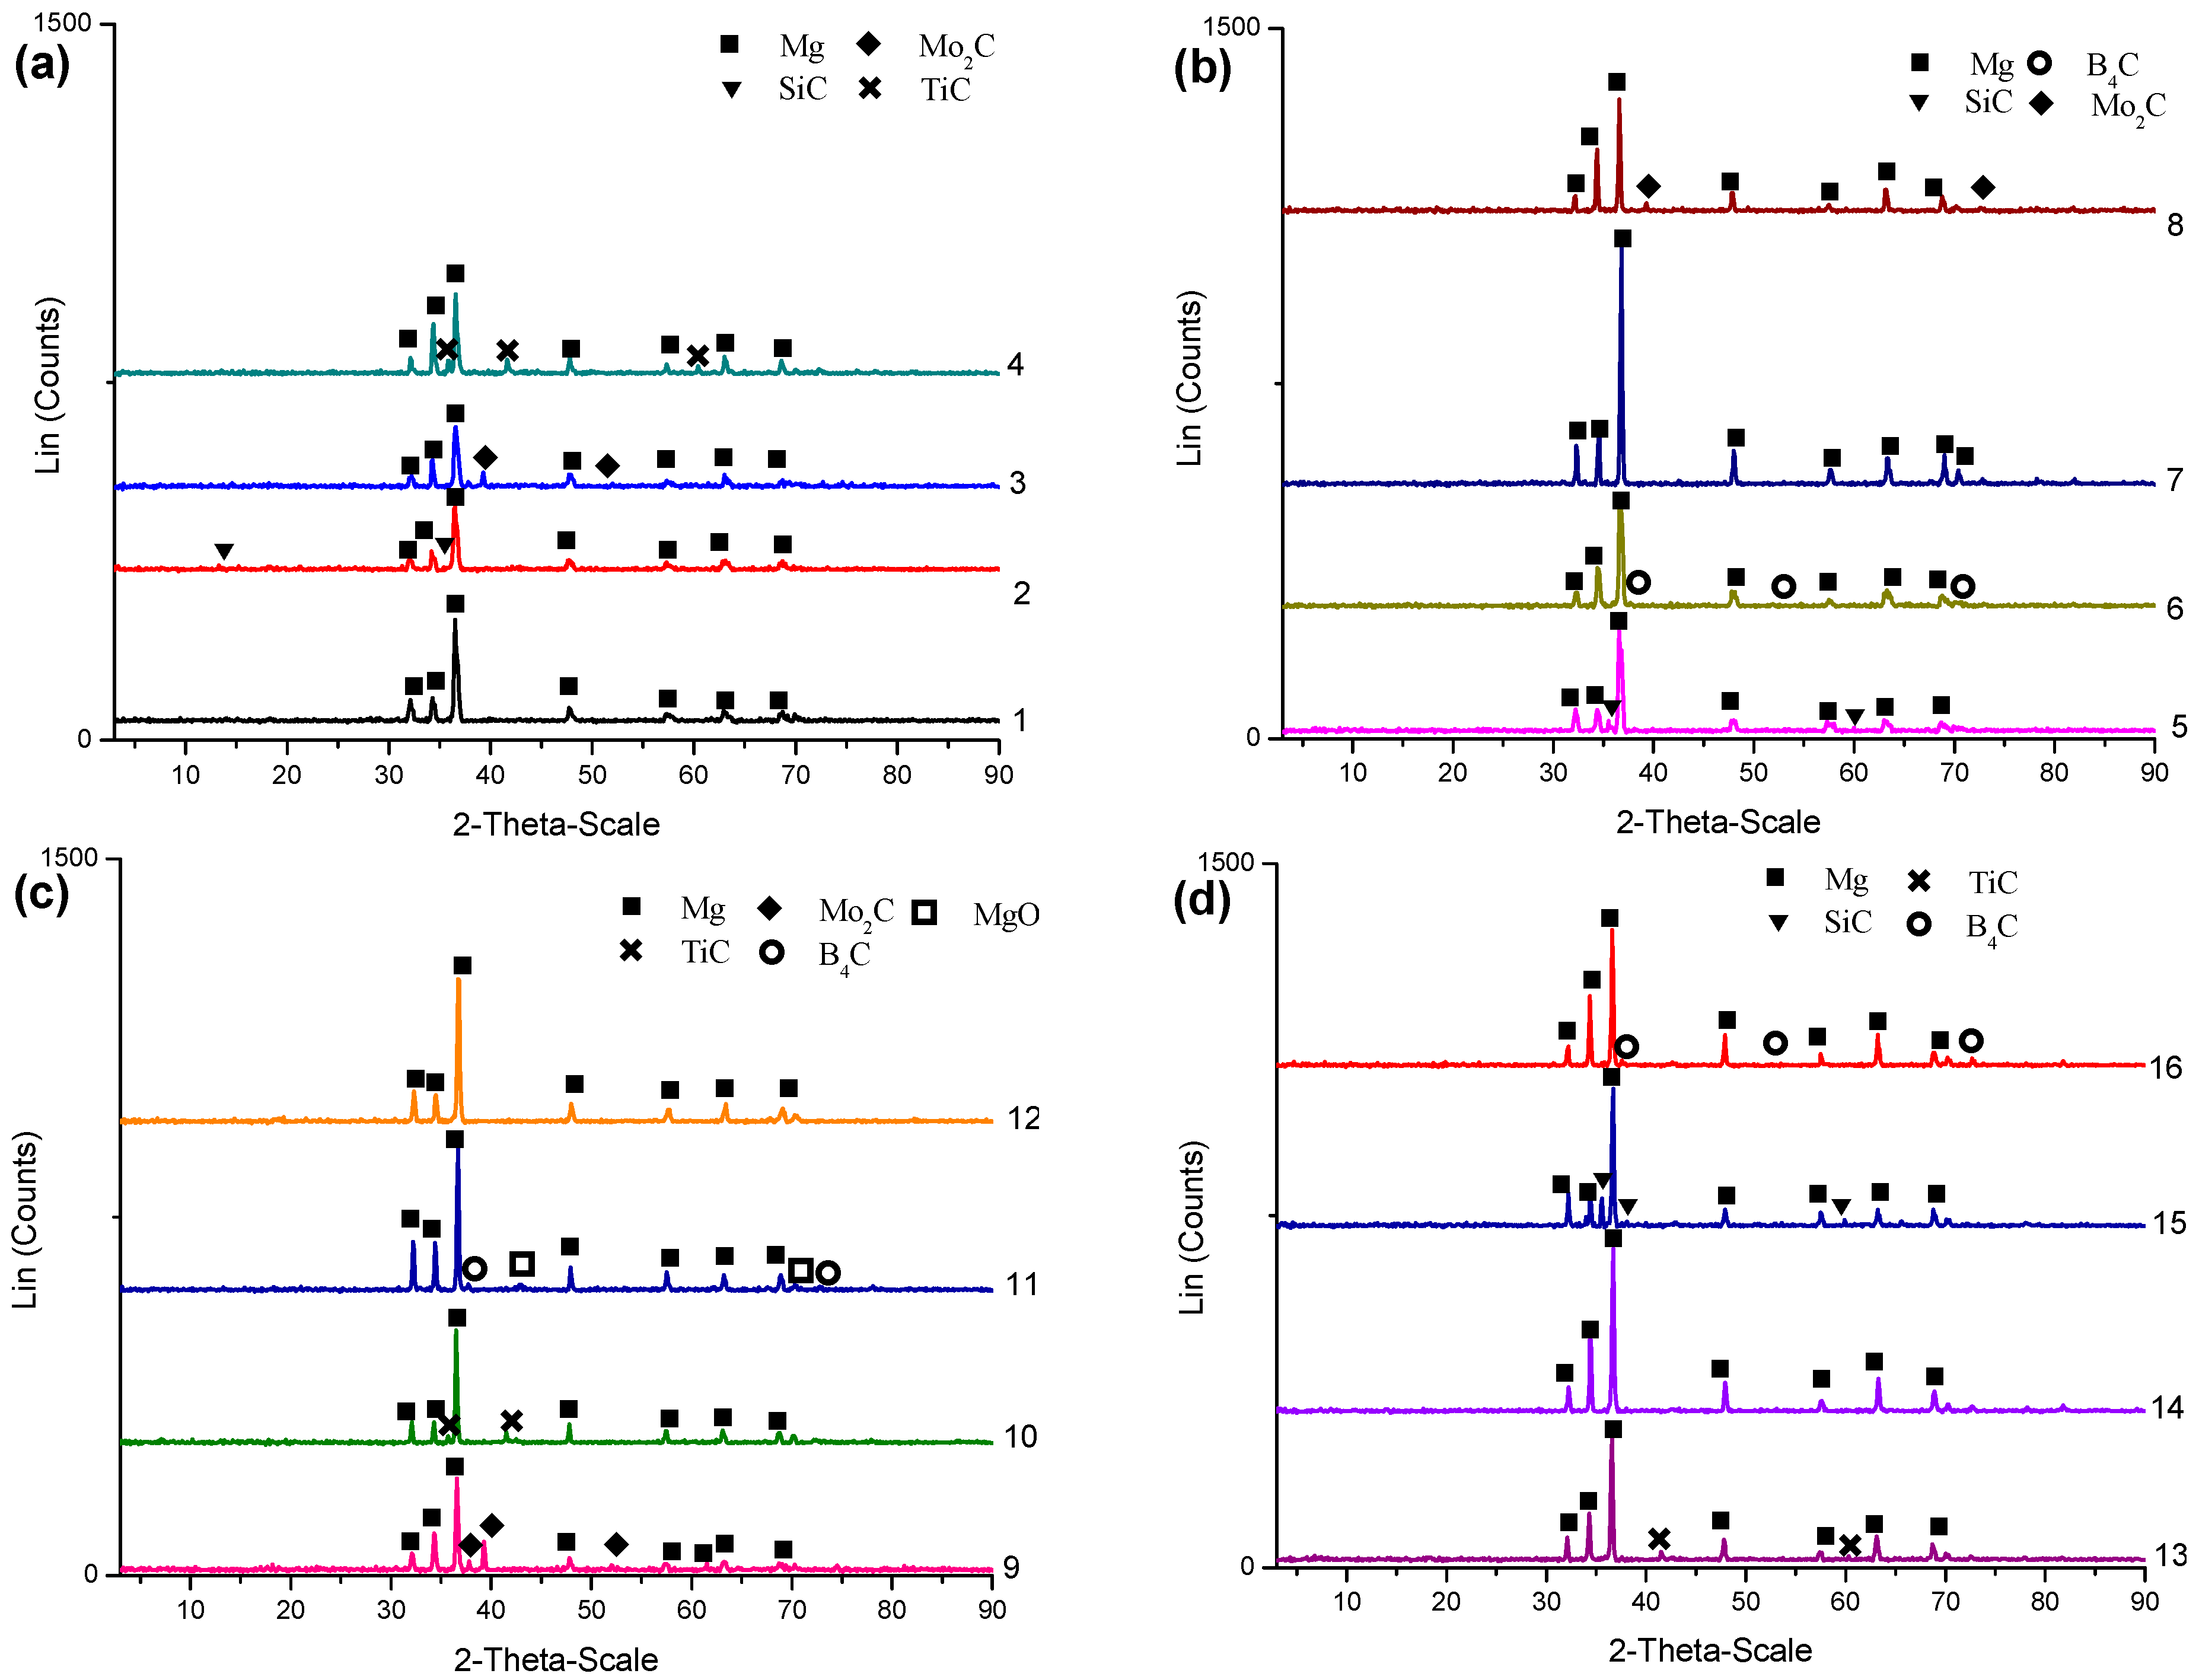
3.2. SEM-EDS and XRD Studies

Figure 4 shows SEM images and EDS analysis of the microstructure and fracture surface of the sample. When the microstructure image of the composite in Figure 4a is examined, it can easily be seen that the boron carbide grains are homogeneously distributed in the MgAl matrix. It is strongly emphasized in the literature that if reinforced particles distribute homogeneously, this situation would positively affect the mechanical properties of the composite [27,28]. In addition, point and area EDS analyses are also seen in the microstructure. It is seen from the fracture surface in Figure 4b that boron carbide addition causes pore formation in the composite materials. The dimples in the matrix are the signs of ductile fracture. EDS analysis was also taken from the fractured surface of the composite. EDS analysis of both microstructure and fractured surface shows the formation of oxide in the structure. It is thought that this oxide formation occurred during the production of the samples.
The XRD analysis is given in Figure 5 to determine whether or not a phase causing the bonding was formed at the interface of the powder particles depending on the sintering parameters and how the state of the existing phases changed. In general, Mg, MgO, B4C, TiC, Mo2C and SiC phases were seen depending on the production parameters and additives in all graphics. Although the purpose of the Al addition to Mg is to form hard secondary phases such as Mg17Al12, which further increases the strength of the composite, this phase was not formed or detected. At the same time, the reason for not seeing Al in the graphs was that it dissolved in Mg and formed a solid solution.

4. Conclusions

As a result of the analysis of MgAl-carbide composites according to the Taguchi Method, the following information, results and conclusions were obtained in terms of microstructure, hardness, relative density and bending strength.
  • While the all parameters have an effect on relative density (%) and bending strength, the most effective parameters on hardness HB10 are the sintering time and additive type.
  • Optimum conditions determined by considering all experiments were sintering temperature of 500 °C, sintering time of 5 min, additive type of B4C, and additive ratio of 2.5%. The results obtained under these conditions were 98.74 (%) for relative density, 87.16 HB10 for hardness, and 193.65 MPa for bending strength.
  • Since the optimum conditions determined by the Taguchi method in the laboratory environment can also be produced in real production environments, the results of this study can be very useful for industrial scale machining.
  • In the Taguchi method, only selected combinations are tested. These combinations are determined by considering studies in the literature. The parameters that affect the study are known. Experiments are carried out by determining the levels of parameters. However, experiments can be analyzed by using methods such as artificial neural networks, where all the values considered can be tested [29,30].
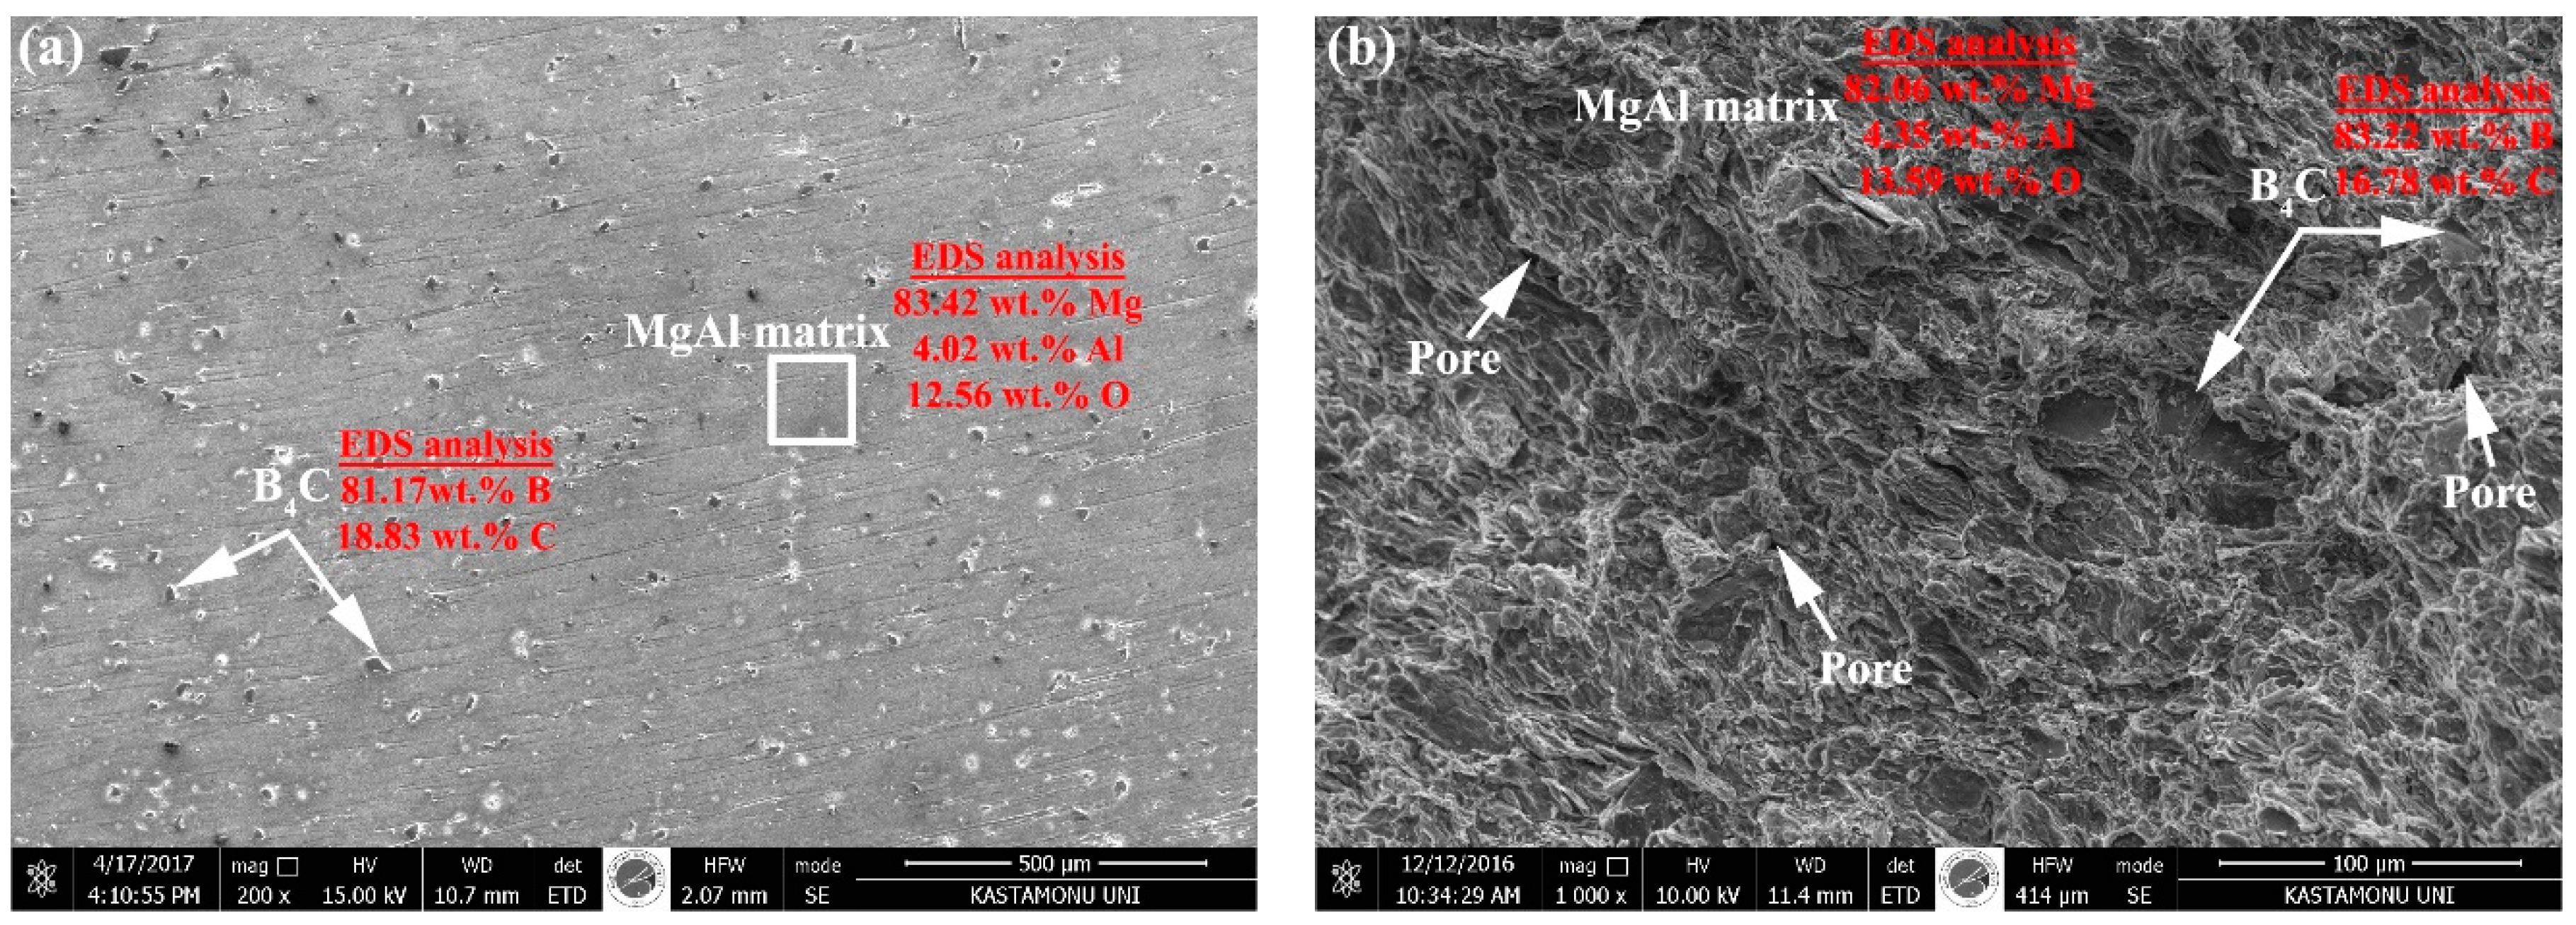
  • SEM studies showed that distribution of the carbides in the MgAl matrix were homogeneous. In addition, the addition of carbide caused the formation of pores.
  • According to XRD analysis, Mg, MgO, B4C, TiC, Mo2C, and SiC phases were observed in the composites. The reason for not seeing Al in the graphs is that it was dissolved in Mg and formed a solid solution.

Acknowledgments

This study was conducted within the scope of KUBAP-01/2014-25 project supported by Kastamonu University Scientific Research Projects Commission. The authors appreciate financial support from Kastamonu University.

Author Contributions

Özkan Küçük conceived and designed the experiments; Tayeb Taher Kalefe Elfarah and Cihan Özorak performed the experiments; Serkan Islak and Özkan Küçük analyzed the data; Özkan Küçük and Serkan Islak wrote the paper.

Conflicts of Interest

The authors declare no conflict of interest.

References

  1. Ye, H.Z.; Liu, X.Y. Review of recent studies in magnesium matrix composites. J. Mater. Sci. 2004, 39, 6153–6173. [Google Scholar] [CrossRef]
  2. Chang, S.Y.; Sung, J.C.; Hong, S.K.; Dong, H.S. Microstructure and tensile properties of bimaterials with macro-interface between unreinforced magnesium and composite. J. Alloys Compd. 2001, 316, 275–279. [Google Scholar] [CrossRef]
  3. Jayalakshmi, S.; Kailas, S.V.; Seshan, S. Tensile behaviour of squeeze cast AM100 magnesium alloy and its Al2O3 fibre reinforced composites. Compos. Part A Appl. Sci. Manuf. 2002, 33, 1135–1140. [Google Scholar] [CrossRef]
  4. Hassan, S.F.; Gupta, M. Development of a novel magnesium/nickel composite with improved mechanical properties. J. Alloys Compd. 2002, 335, L10–L15. [Google Scholar] [CrossRef]
  5. Zheng, M.Y.; Wu, K.; Yao, C.K. Effect of interfacial reaction on mechanical behavior of SiCw/AZ91 magnesium matrix composites. Mater. Sci. Eng. A 2001, 318, 50–56. [Google Scholar] [CrossRef]
  6. Jiang, Q.C.; Wang, H.Y.; Ma, B.X.; Wang, Y.; Zhao, F. Fabrication of B4C particulate reinforced magnesium matrix composite by powder metallurgy. J. Alloys Compd. 2005, 386, 177–181. [Google Scholar] [CrossRef]
  7. Islak, S.; Çelik, E.; Kir, D.; Özorak, C. Characterization of hot pressed CuAl-TiC composites with different TiC grain sizes. Russ. J. Non-Ferrous Met. 2016, 57, 374–380. [Google Scholar] [CrossRef]
  8. Buytoz, S.; Dagdelen, F.; Islak, S.; Kok, M.; Kir, D.; Ercan, E. Effect of the TiC content on microstructure and thermal properties of Cu-TiC composites prepared by powder metallurgy. J. Therm. Anal. Calorim. 2014, 117, 1277–1283. [Google Scholar] [CrossRef]
  9. Casati, R.; Vedani, M. Metal matrix composites reinforced by nano-particles—A review. Metals 2014, 4, 65–83. [Google Scholar] [CrossRef]
  10. Chawla, N.; Chawla, K.K. Metal Matrix Composites, 1st ed.; Springer: New York, NY, USA, 2006; pp. 43–63. [Google Scholar]
  11. Clyne, T.W.; Withers, P.J. An Introduction to Metal Matrix Composites, 1st ed.; Cambridge University Press: Cambridge, UK, 1993. [Google Scholar]
  12. Esmaily, M.; Mortazavi, N.; Svensson, J.E.; Halvarsson, M.; Wessén, M.; Johansson, L.G.; Jarfors, A.E. A new semi-solid casting technique for fabricating SiC-reinforced Mg alloys matrix composites. Compos. Part B Eng. 2016, 94, 176–189. [Google Scholar] [CrossRef]
  13. Sun, F.; Shi, C.; Rhee, K.Y.; Zhao, N. In situ synthesis of CNTs in Mg powder at low temperature for fabricating reinforced Mg composites. J. Alloys Compd. 2013, 551, 496–501. [Google Scholar] [CrossRef]
  14. Gui, M.; Li, P.; Han, J. Fabrication and characterization of cast magnesium matrix composites by vacuum stir casting process. J. Mater. Eng. Perform. 2003, 12, 128–134. [Google Scholar]
  15. Degischer, H.P.; Schulz, P.A.; Lacom, W. Properties of continuous fibre reinforced Al and Mg-matrix composites produced by gas pressure infiltration. Key Eng. Mater. 1996, 127, 99–110. [Google Scholar] [CrossRef]
  16. Tun, K.S.; Gupta, M. Improving mechanical properties of magnesium using nanoyttria reinforcement and microwave assisted powder metallurgy method. Compos. Sci. Technol. 2007, 67, 2657–2664. [Google Scholar] [CrossRef]
  17. Hu, H. Squeeze casting of magnesium alloys and their composites. J. Mater. Sci. 1998, 33, 1579–1589. [Google Scholar] [CrossRef]
  18. White, J.; Willis, T.C. The production of metal matrix composites by spray deposition. Mater. Des. 1989, 10, 121–127. [Google Scholar] [CrossRef]
  19. Loh, N.H.; Tor, S.B.; Khor, K.A. Production of metal matrix composite part by powder injection molding. J. Mater. Process. Technol. 2001, 108, 398–407. [Google Scholar] [CrossRef]
  20. Şirvancı, M. Kalite Için Deney Tasarımı, 2nd ed.; Literatür Yayınları: İstanbul, Türkiye, 2011; pp. 13–18. [Google Scholar]
  21. Roy, R.K. A Primer on the Taguchi Method, 1st ed.; Van Nostrand Reinhold Company: New York, NY, USA, 1990; p. 247. [Google Scholar]
  22. Phadke, M.S.; Kackar, R.N.; Speeney, D.D.; Grioce, M.J. Off-line quality control in integrated circuit fabrication using experimental design. Bell Syst. Tech. J. 1983, 62, 1273–1309. [Google Scholar] [CrossRef]
  23. Taguchi, G. System of Experimental Design; Quality Resources: New York, NY, USA, 1987; Volume 1. [Google Scholar]
  24. Çopur, M. An optimization study of dissolution of Zn and Cu in ZnS concentrate with HNO3 solutions. Chem. Biochem. Eng. Q. 2002, 15, 191. [Google Scholar]
  25. Küçük, Ö. Application of Taguchi method in the optimization of dissolution of ulexite in NH4Cl solutions. Korean J. Chem. Eng. 2006, 23, 21. [Google Scholar] [CrossRef]
  26. Phadke, M.S. Quality Engineering Using Robust Design; Prentice Hall: Upper Saddle River, NJ, USA, 1989; pp. 61–292. [Google Scholar]
  27. Islak, S.; Kir, D.; Buytoz, S. Effect of sintering temperature on electrical and microstructure properties of hot pressed Cu-TiC composites. Sci. Sinter. 2014, 46, 15–21. [Google Scholar] [CrossRef]
  28. Lee, D.W.; Ha, G.H.; Kim, B.K. Synthesis of Cu-Al2O3 nano composite powder. Scr. Mater. 2001, 44, 2137–2140. [Google Scholar] [CrossRef]
  29. Arnaiz-González, A.; Fernández-Valdivielso, A.; Bustillo, A.; Norberto López de Lacalle, N. Using artificial neural networks for the prediction of dimensional error on inclined surfaces manufactured by ball-end milling. Int. J. Adv. Manuf. Technol. 2016, 83, 847–859. [Google Scholar] [CrossRef]
  30. Ukar, E.; Lamikiz, A.; Martínez, S.; Tabernero, I.; López de Lacalle, L.N. Roughness prediction on laser polished surfaces. J. Mater. Process. Technol. 2012, 212, 1305–1313. [Google Scholar] [CrossRef]
Figure 1. SNort values according to parameter levels for density.
Metals 07 00352 g001
Figure 2. SNort values according to parameter levels for hardness.
Metals 07 00352 g002
Figure 3. SNort values according to parameter levels for bending strength.
Metals 07 00352 g003
Figure 4. MgAl-2.5% B4C composite sintered at 500 °C and for 5 min; (a) SEM image and EDS analysis of microstructure and (b) SEM image and EDS analysis of fracture surface.
Metals 07 00352 g004
Figure 5. XRD graphics: (a) 1—400 °C, 1 min, additive-free; 2—400 °C, 3 min, 2.5% SiC; 3—400 °C, 5 min, 5% Mo2C; 4—400 °C, 7 min, 10% TiC; (b) 5—450 °C, 1 min, 5% SiC; 6—450 °C, 3 min, 10% B4C; 7—450 °C, 5 min, additive-free; 8—450 °C, 7 min, 2.5% Mo2C; (c) 9—500 °C, 1 min, 10% Mo2C; 10—500 °C, 3 min, 5% TiC; 11—500 °C, 5 min, 2.5% B4C; 12—500 °C, 7 min, additive-free; (d) 13—550 °C, 1 min, 2.5% TiC; 14—550 °C, 3 min, additive-free; 15—550 °C, 5 min, 10% SiC; 16—550 °C, 7 min, 5% B4C.
Metals 07 00352 g005
Table 1. Parameters used in the production of composite and their levels.
ParametersLevels
1234
ASintering Temperature (°C)400450500550
BSintering Time (min)1357
CAdditive TypeB4CSiCMo2CTiC
DAddition Rate (% by weight)02.5510
Table 2. L16(44) Orthogonal factorial Taguchi experimental design.
No.ParametersParameter Values
ABCDABCD
111114001B4C0
212224003SiC2.5
313334005Mo2C5
414444007TiC10
521234501SiC5
622144503B4C10
723414505TiC-0
824324507Mo2C2.5
931345001Mo2C10
1032435003TiC5
1133125005B4C2.5
1234215007SiC0
1341425501TiC2.5
1442315503Mo2C0
1543245505SiC10
1644135507B4C5
Table 3. Experimental design plan and experimental results according to production parameters.
No.CompoundProduction ParametersRelative Density (%)Hardness (HB10)Bending Strength (MPa)
MgAlAdditive Material % by WeightTemperature (°C)Time (min)Pressure (MPa)
1100Additive-free40014099.8073.599.11
297.52.5% SiC400398.6876.583.56
3955% Mo2C400586.1477.2142.61
49010% TiC400786.8245.554.16
5955% SiC450198.3978.596.74
69010% B4C450398.1480.5103.17
7100Additive-free450599.8374.3143.48
897.52.5% Mo2C450792.9980.4139.18
99010% Mo2C500176.7381.5154.69
10955% TiC500394.8180.7157.32
1197.52.5% B4C500599.3680.6183.09
12100Additive-free500799.8878.5114.28
1397.52.5% TiC550198.1680.5146.28
14100Additive-free550399.9279.0138.80
159010% SiC550598.7588.6155.74
16955% B4C550799.5983.5147.90
Table 4. Analysis of variance of the design made for relative density (%).
ParametersDegree of FreedomSum of SquaresMean SquaresFEffectiveness
ASintering Temperature (°C)3249.6883.2341.27Effective
BSintering Time (min)391.2530.4215.08Effective
CAdditive Type3551.28183.7691.12Effective
DAdditive Ratio (% by weight)3414.88138.2968.57Effective
-Error1938.322.02--
-Total311345.40---
Table 5. Analysis of variance of the design made for hardness.
ParametersDegree of FreedomSum of SquaresMean SquaresFEffectiveness
ASintering Temperature (°C)3999.55333.1813.33Effective
BSintering Time (min)3331.83110.614.43Not Effective
CAdditive Type3559.25186.427.46Less Effective
DAdditive Ratio (% by weight)3188.5962.862.52Not Effective
-Error19474.8024.99--
-Total312554.04---
Table 6. Analysis of variance of the design made for bending strength.
ParametersDegree of FreedomSum of SquaresMean SquaresFEffectiveness
ASintering Temperature (°C)316,885.95628.463.05Effective
BSintering Time (min)38492.22830.731.71Effective
CAdditive Type34170.21390.115.57Effective
DAdditive Ratio (% by weight)32428.4809.59.07Less Effective
-Error191696.089.3--
-Total3133,672.0---
Table 7. Optimum working conditions, predicted and observed values, and confidence limits.
ParametersCase
ValueLevel
ASintering Temperature (°C)5003
BSintering Time (min)53
CAdditive TypeB4C1
DAddition Rate (% by weight)2.52
Observed Values (Respectively, relative density, hardness, and the bending strength)98.74 (%), 87.16 HB10 and 193.65 MPa
Predicted Values (Respectively, relative density, hardness, and the bending strength)99.36 (%), 80.6 HB10 and 183.09 MPa
Confidence limits of prediction “Se” (Respectively, relative density, hardness, and the bending strength)±3.62, ±12.75 and ±24.09

