Effect of Fe-Content on the Mechanical Properties of Recycled Al Alloys during Hot Compression


1
School of Resources and Environmental Engineering, East China University of Science and Technology, Meilong Road 130, Xuhui District, Shanghai 200237, China
2
State Key Laboratory of Rolling & Automation, Northeastern University, Box 105, No. 11, Lane 3, Wenhua Road, Heping District, Shenyang 110819, China
3
China Automotive Engineering Research Institute, No. 9 Jinyu Ave., New North Zone, Chongqing 401122, China
*
Author to whom correspondence should be addressed.
Metals 2017, 7(7), 262; https://doi.org/10.3390/met7070262
Submission received: 10 June 2017
/
Revised: 28 June 2017
/
Accepted: 7 July 2017
/
Published: 10 July 2017
(This article belongs to the Special Issue Light Weight Alloys: Processing, Properties and Their Applications)
Abstract
:It is unavoidable that Fe impurities will be mixed into Al alloys during recycling of automotive aluminum parts, and the Fe content has a significant effect on the mechanical properties of the recycled Al alloys. In this work, hot compression tests of two Fe-containing Al alloys were carried out at elevated temperatures within a wide strain rate range from 0.01 s−1 to 10 s−1. The effect of Fe content on the peak stress of the stress vs. strain curves, strain rate sensitivity and activation energy for dynamic recrystallization are analyzed. Results show that the recycled Al alloy containing 0.5 wt % Fe exhibits higher peak stresses and larger activation energy than the recycled Al alloy containing 0.1 wt % Fe, which results from the fact that there are more dispersed AlMgFeSi and/or AlFeSi precipitates in the recycled Al alloy containing 0.5 wt % Fe as confirmed by SEM observation and energy spectrum analysis. It is also shown that the Fe content has little effect on the strain rate sensitivity of the recycled Al alloys.
1. Introduction
Energy saving and emission reduction are the motivations of remanufacturing Al alloys recycled from automotive parts. The energy consumption of remanufacturing recycled Al alloys is only about 2.8 kWh/kg [1], compared to 45 kWh/kg in producing Al alloys from pure Al. Additionally, the emission of CO2 in remanufacturing of recycled Al alloy is only 5% of that when using pure Al to produce Al alloys. As reported by Das [2], there are four challenges in remanufacturing recycled automotive Al alloys: (1) improvement of the recycling efficiency of Al alloy parts; (2) wide application of automatic shredding and sorting technologies; (3) development of new Al alloys which can be directly remanufactured from the recycled automotive Al alloys; and (4) investigation of the effect of impurity elements (e.g., Fe) on the Al alloy properties; where aspect (3) is the most challenging. During the recycling and remanufacturing of automotive Al alloys, it is unavoidable that a certain amount of Fe will be mixed into the original Al alloys [3]. Das et al. [4] and Adam et al. [5] reported that the Fe content in Al alloy sheets remanufactured from recycled Al alloys can reach up to 1.0 wt %.
Fe has been regarded as harmful to the mechanical properties of Al alloys, especially to casting Al alloys. This is mainly due to the fact that the solubility of Fe in Al is very low and Fe exists as brittle AlFe phase or AlFeSi phase in Al alloys. Nevertheless, Fe is a natural impurity to Al alloys, since Fe can be mixed in to Al alloys during electrolytic Al production, metallurgy melting, casting, alloying processes etc. [6]. During automotive recycling, steel parts may be mixed into Al alloys due to non-prompt sorting, which could be the main reason contributing to rich Fe in recycled Al alloys. At present, many efforts have been made to control or eliminate the impact of Fe-rich phases in Al alloys [7,8]. For example, physical methods, e.g., precipitation method, dilution method, filtration method, centrifugal removal method, electromagnetic removal method etc., have been applied to decrease the Fe content in recycled Al alloys during melting process; other possible approaches are to change the forms of Fe-rich phases in Al alloys to decrease the formation of acicular or lath Fe-rich phases, or to improve the morphologies of Fe-rich phases in Al alloys to reduce the harmful effects of Fe impurities. As an extensive process that is mainly employed in the recycling of vehicles, it is difficult to further reduce the Fe content in remanufactured Al alloys. In addition, the current Al alloy purification methods are difficult to apply in industry. Matsubar et al. [9] decreased the Fe content from 2.07 wt % to 0.27 wt % in Al alloys by using the centrifugal removal method in the laboratory. However, this method is complicated and difficult to control. The electromagnetic removal method was also applied in decreasing the Fe content from 1.13 wt % to 0.41 wt % in Al alloys [10], but it exhibited low cost performance.
The effect of Fe impurities on the deformation behavior as well as mechanical properties of recycled Al alloys will be studied in this work. Hot compression tests at various strain rates and elevated temperatures are performed to acquire stress vs. strain curves and therefore analyze the effect of Fe content on strain rate sensitivity and activation energy of the recycled Al alloys, which are helpful to design rolling process for recycled Al alloys containing Fe.
2. Materials and Methods
Table 1 lists the chemical compositions of the two recycled Al alloys containing 0.1 wt % Fe and 0.5 wt % Fe, respectively. Casting ingots were prepared first for the two recycled Al alloys. After homogenizing treatment, cylindrical specimens with a diameter of 10 mm and a length of 15 mm were machined from each ingot. For all specimens, a groove with a depth of 0.2 mm and a diameter of 9 mm was machined at each end to contain a certain of lubricant composed of 75% graphite, 20% oil and 5% trimethyl nitrate, which minimized the friction effect on measuring flow stress during hot compression. The detailed geometries of the specimen are illustrated in Figure 1a.
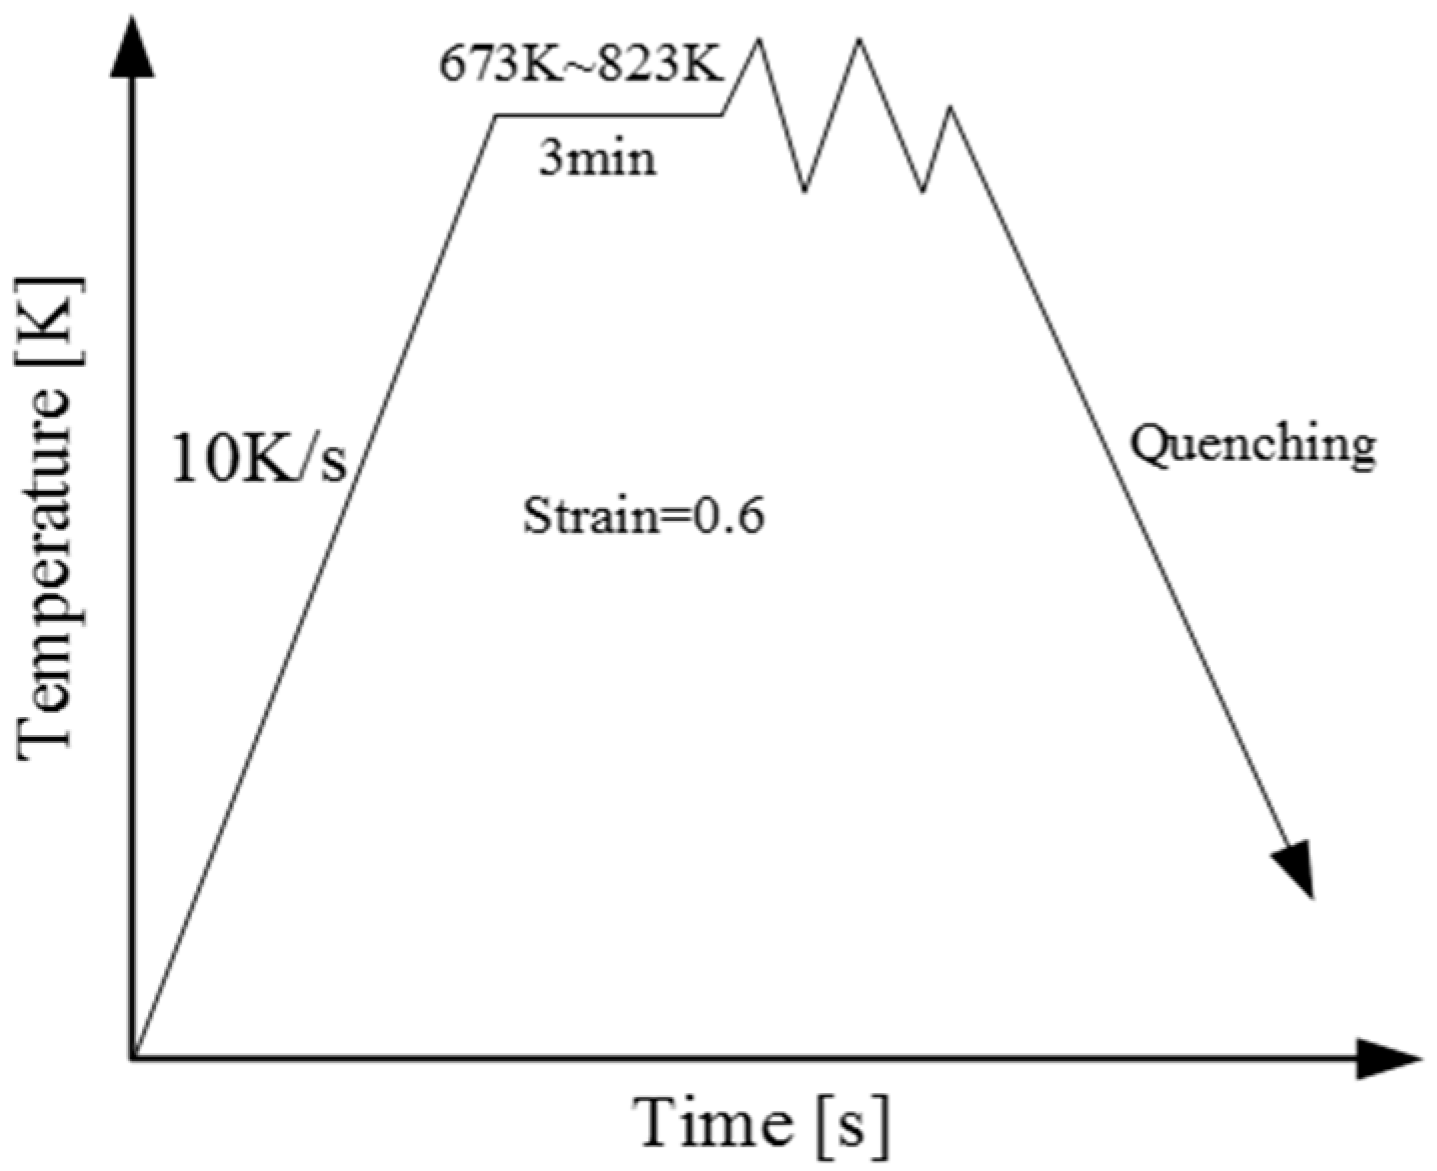
Hot compression tests were conducted on a MMS300 thermo-mechanical simulator (Northeastern University, Shenyang, China), which is capable of automatically recording compressive true stress, true strain, etc. Temperatures were measured by a thermocouple as shown in Figure 1b and controlled by a feed-back program. Specimens were heated by applying direct current, namely, resistance heating, where the heating rate was set at 10 K/s. Each specimen was soaked at the preset deformation temperature for 3 min to make the temperature of the tested specimen uniform. The deformation temperatures were 673 K, 723 K, 773 K and 823 K. At each temperature, four groups of specimens were tested at nominal strain rates () of 0.01 s−1, 0.1 s−1, 1 s−1 and 10 s−1. Each test was stopped when the specimen was compressed to a strain level of 0.6, and then the specimen was water quenched to room temperature. The temperature history of each specimen is plotted in Figure 2.
3. Results
3.1. Flow Curves
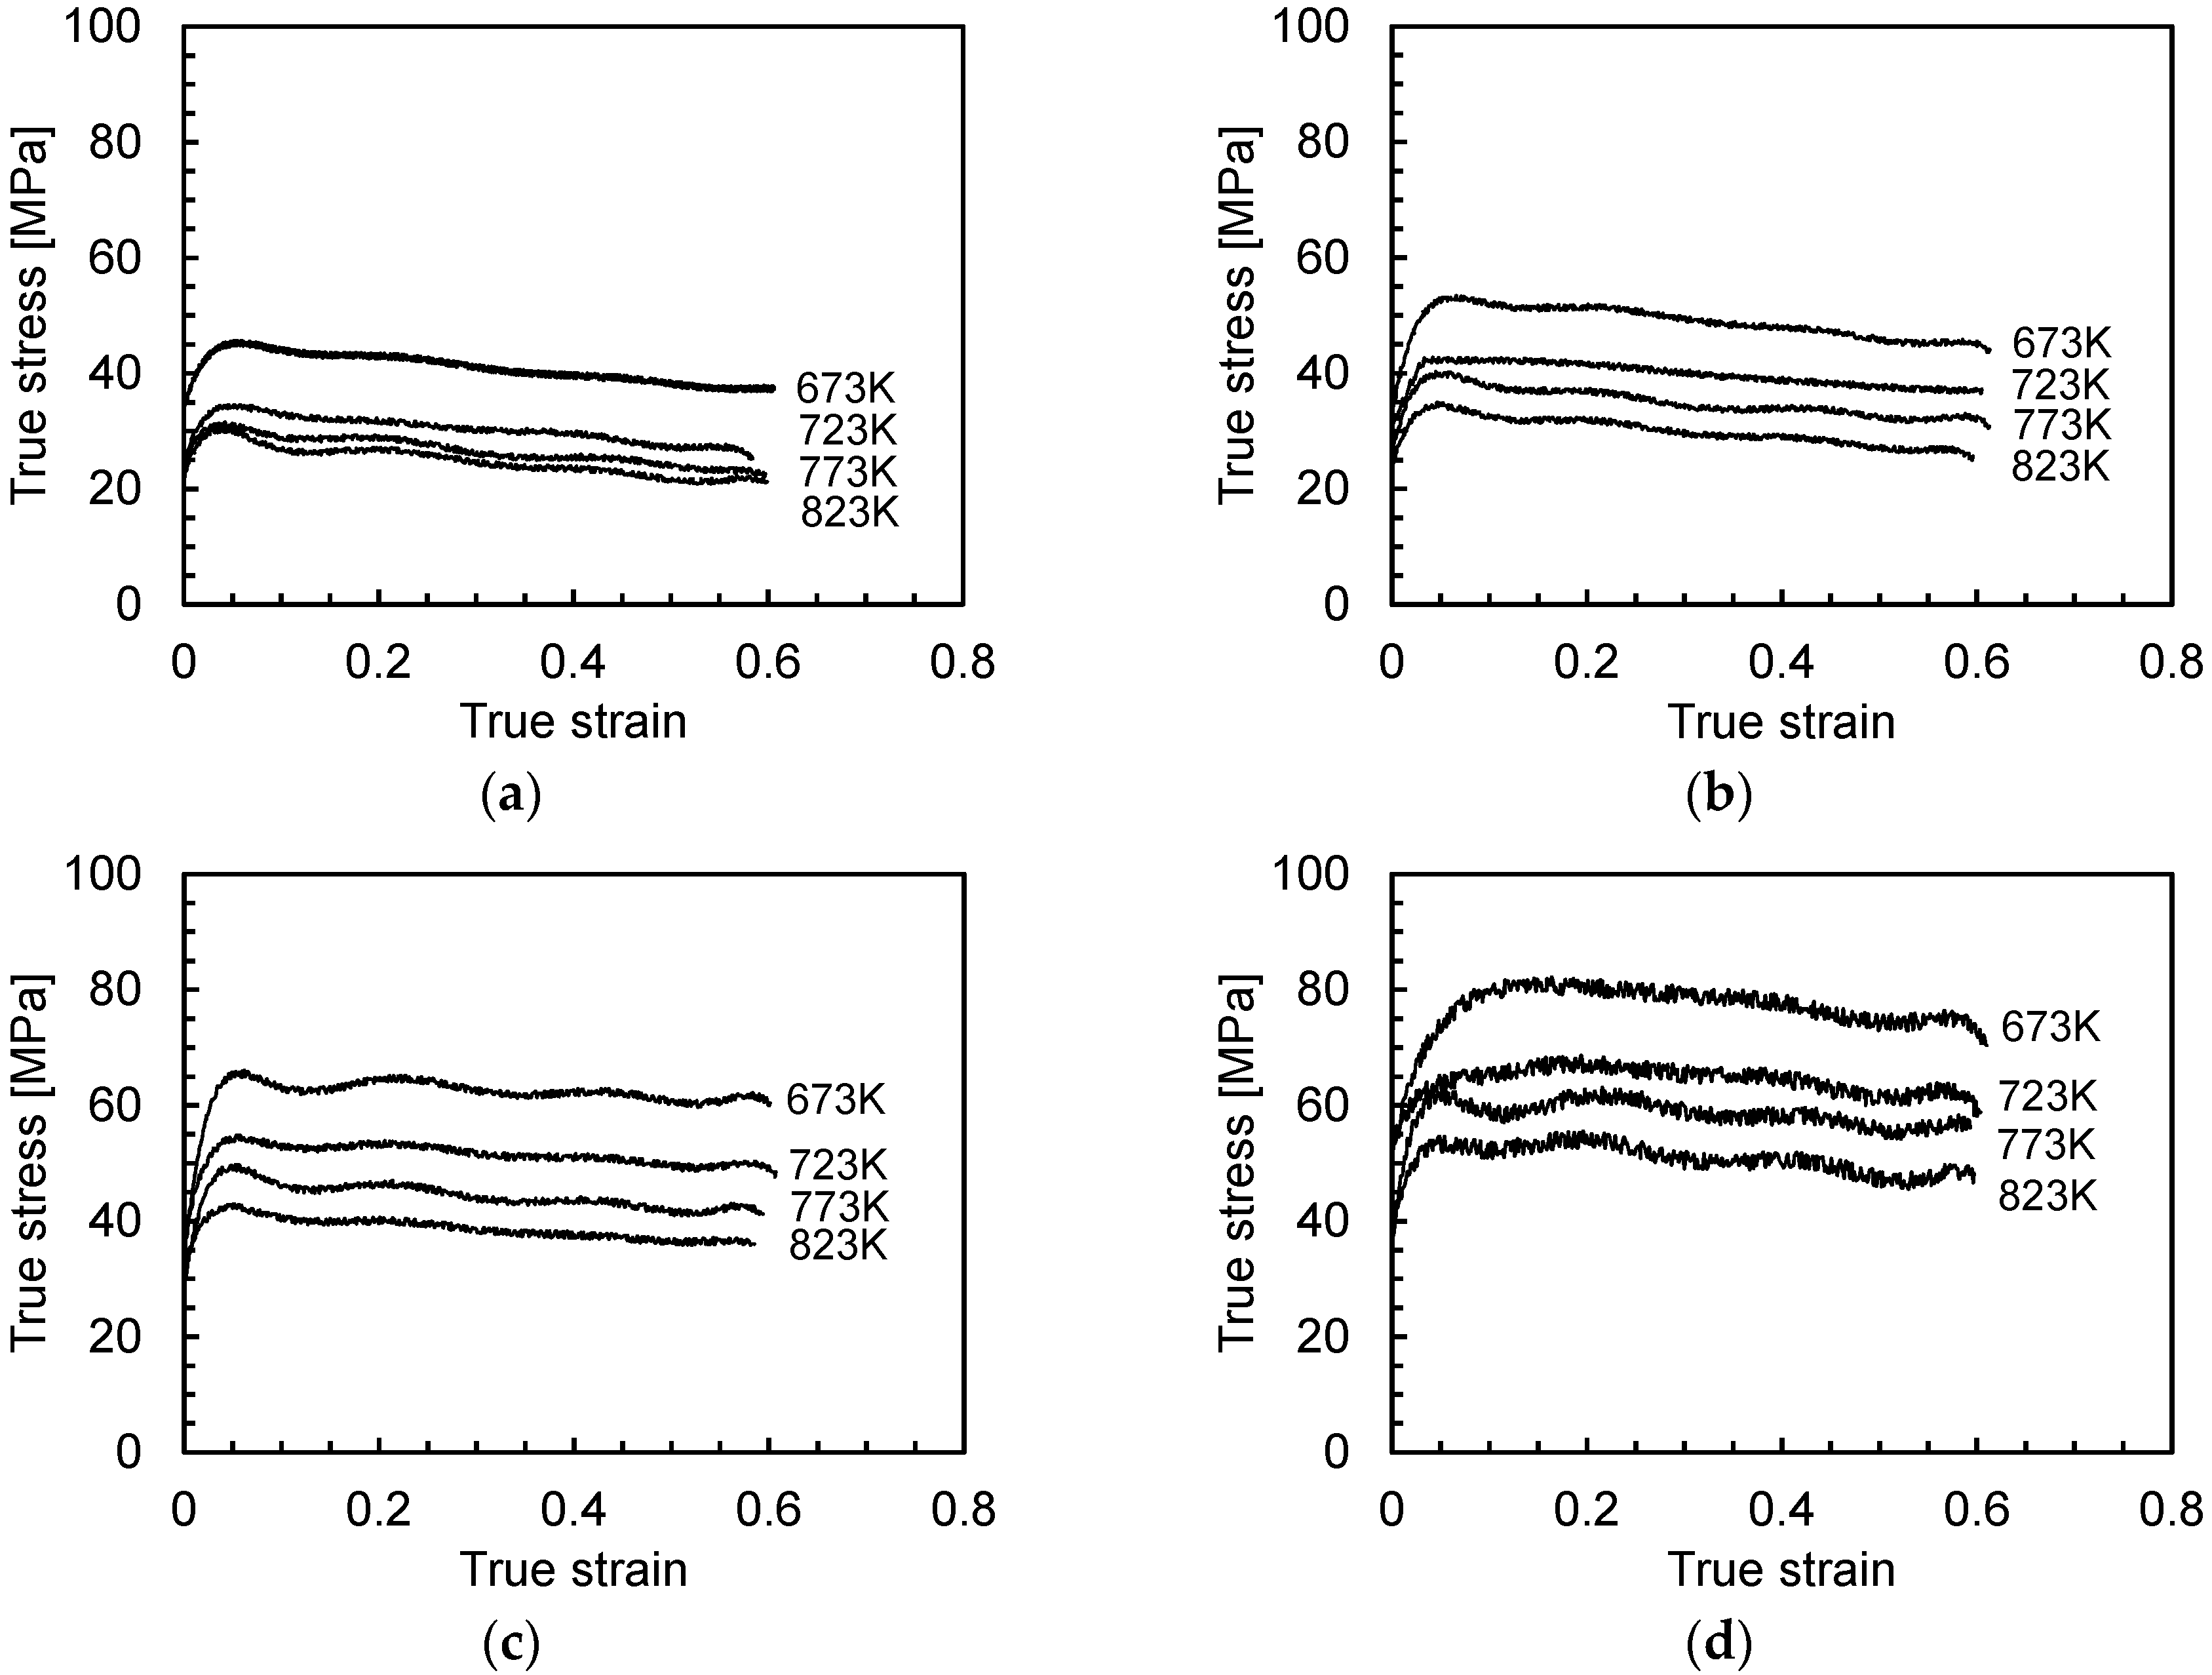
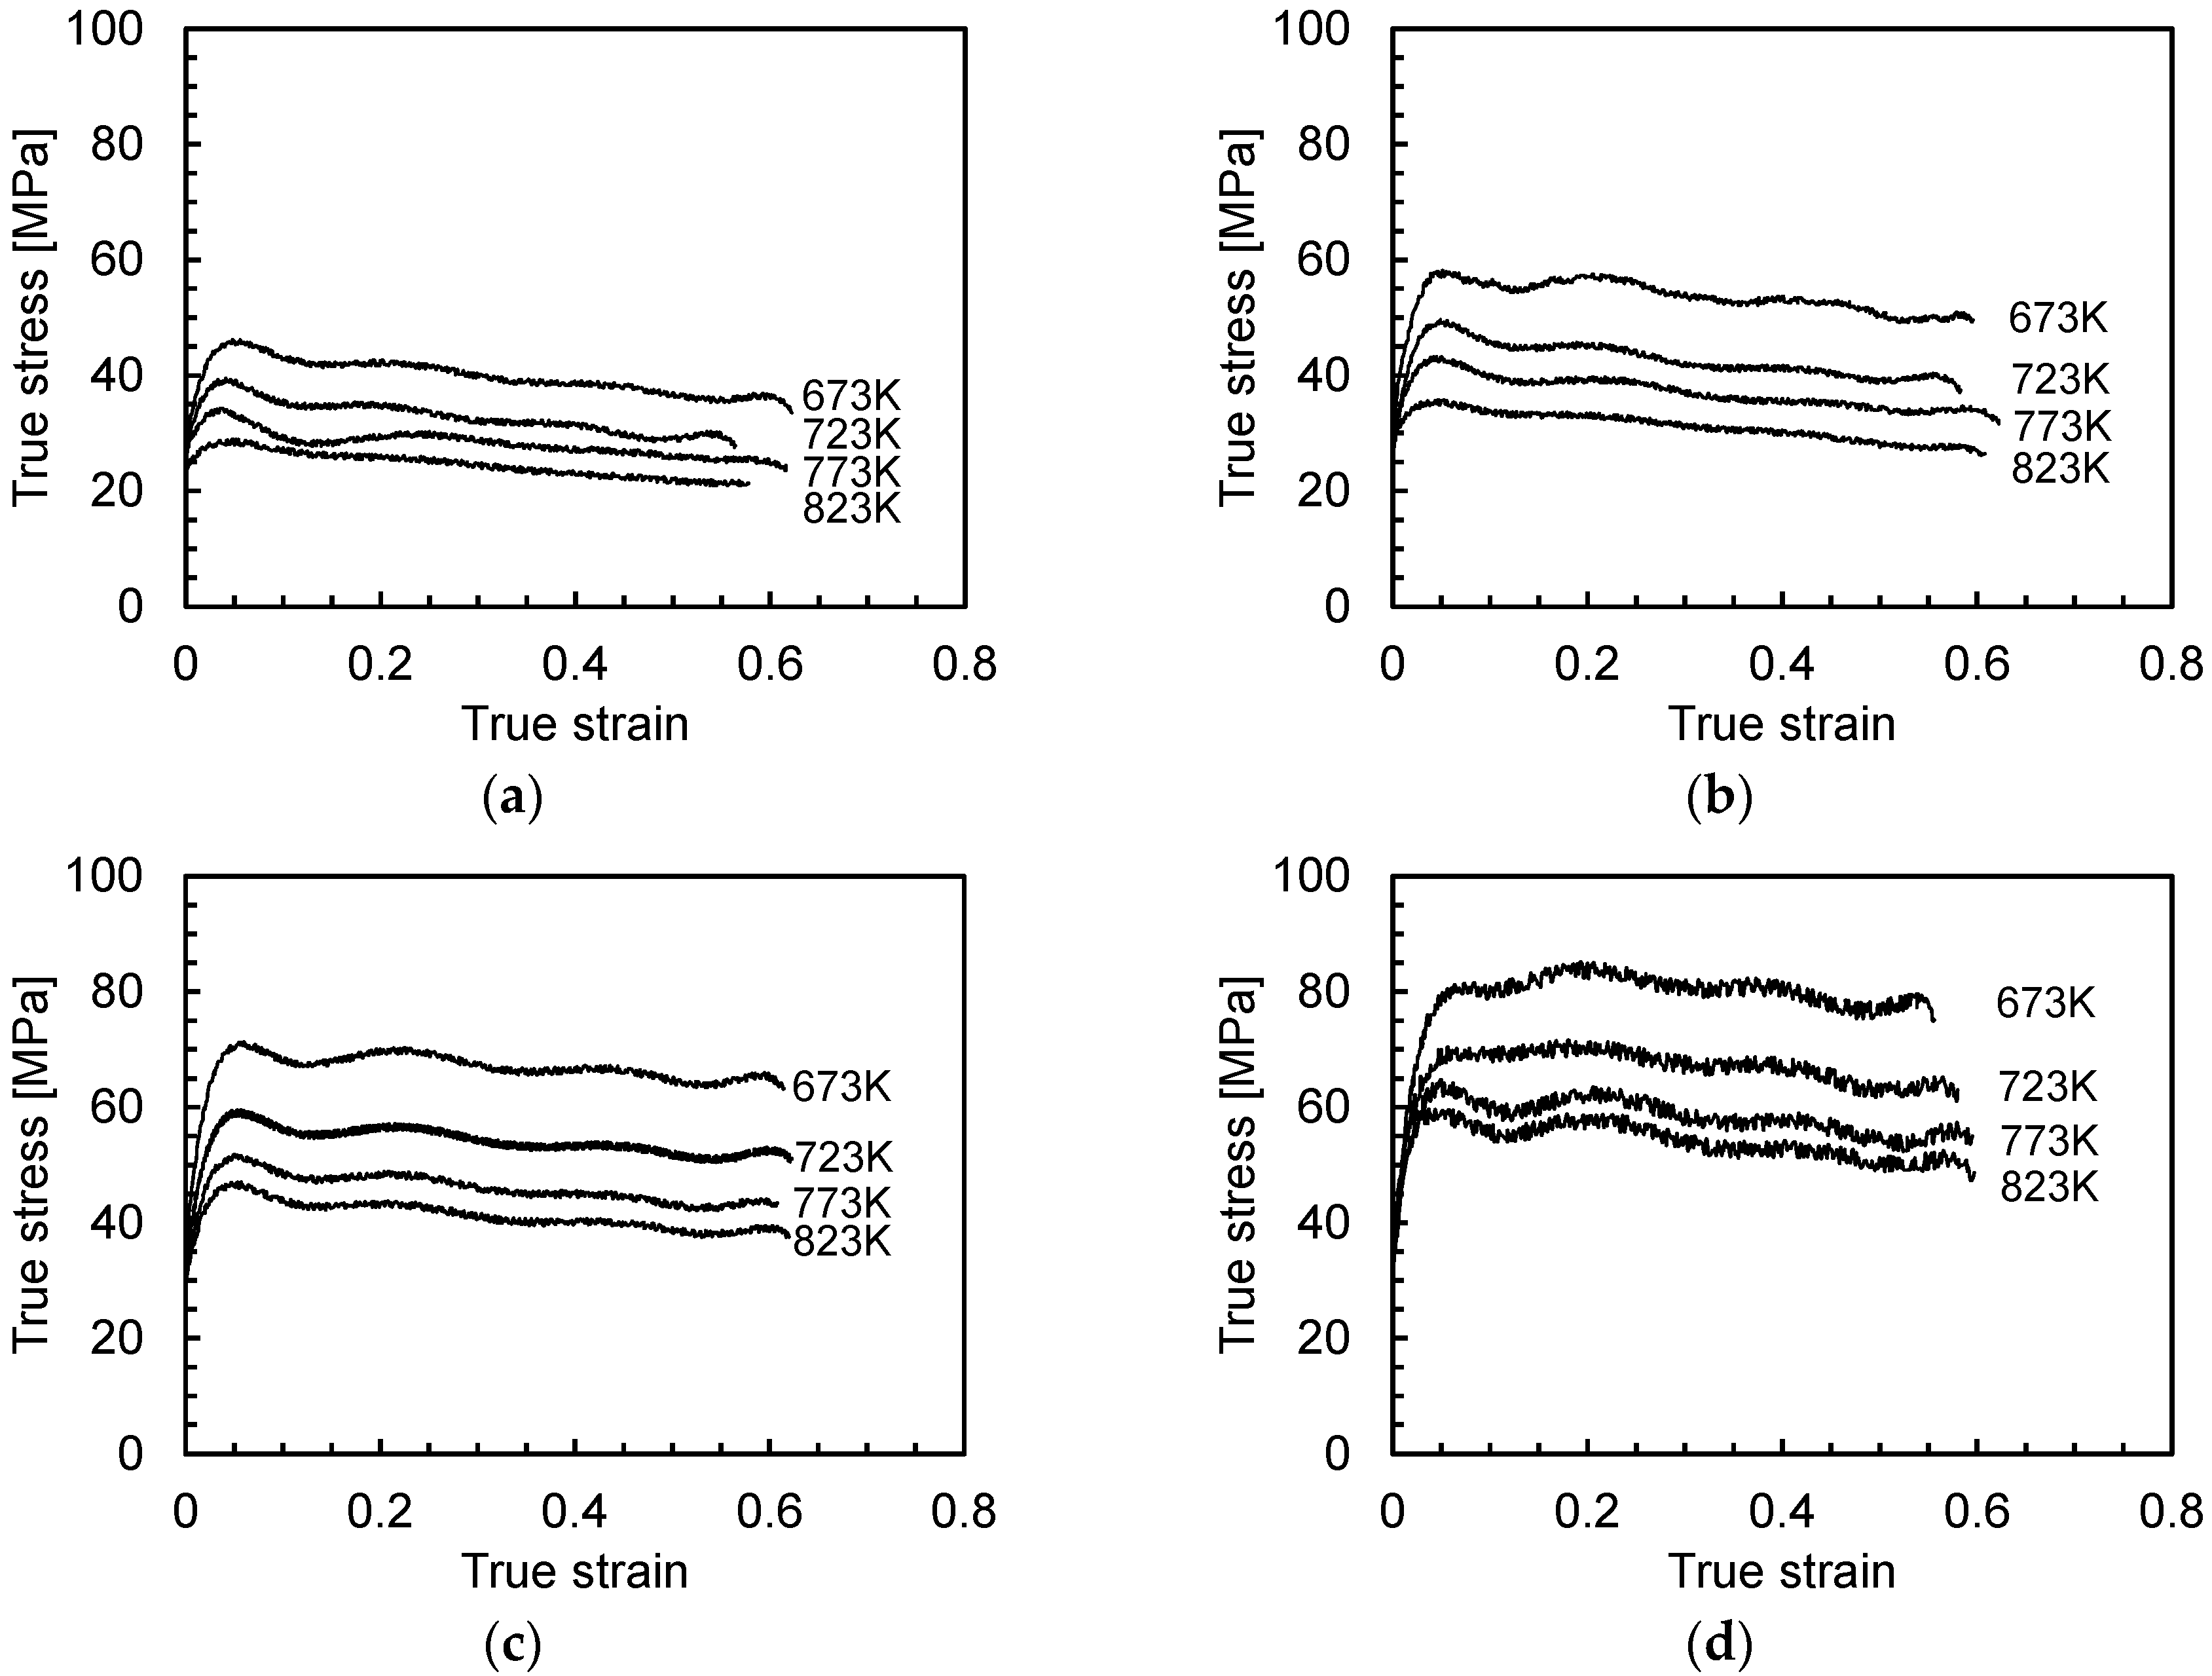
The compressive true stress vs. true strain curves of the 0.1 wt % Fe and 0.5 wt % Fe containing Al alloys are presented in Figure 3 and Figure 4, respectively. For both Al alloys, most curves indicate that typical dynamic recrystallization, especially discontinuous dynamic recrystallization (DDRX), occurred during hot compression, which is evident from work hardening occurred at the initial deformation stage firstly, followed by a peak stress, then the flow stress decreases due to recrystallization. After recrystallization, the newly formed grain work hardens, and recrystallization occurs again, which is repeated as deformation proceeds and results in wavy true stress vs. true strain curves in later stages. Beyond the peak stress, the overall trend is that the flow stress decreases as the true strain increases, which could result from dynamic recovery, as dynamic recovery is always regarded to be accompanied by dynamic recrystallization during hot deformation of metals. Both dynamic recrystallization and dynamic recovery are softening mechanisms during hot deformation. At the larger , i.e., 10 s−1 (Figure 3d and Figure 4d), the phenomenon of DDRX, especially at lower temperatures (i.e., 673 K and 723 K), is not as obvious as that observed from the true stress vs. true strain curves tested under other conditions, and continuous dynamic recrystallization (CDRX) and dynamic recovery may dominate the softening mechanism in those specimens. This may be due to the fact that time was limited for DDRX during hot compression at = 10 s−1, e.g., there was only 0.06 s when the specimen was deformed to a strain of 0.6, in particular, at lower deformation temperatures. A similar phenomenon was noted by Haghdadi et al. [11] when they investigated the DRX phenomenon in the ferrite phase of austenite/ferrite steel.
3.2. Strain Rate Sensitivity
The peak stresses () of the Fe-containing recycled Al alloys are summarized in Figure 5a, where the data of the 0.1 wt % Fe containing Al alloy and the 0.5 wt % Fe containing Al alloy are indicated by solid and dashed curves, respectively. It is observed that the Al alloy containing 0.5 wt % Fe exhibited greater than that containing 0.1 wt % Fe at all testing conditions except the test at 823 K and 0.01 s−1. At all tested temperatures, of both Fe-containing Al alloys increases with increasing strain rate; with increasing temperature, decreases. The approach following Min et al. [12] and Sung et al. [13], as expressed by Equation (1), was used to evaluate the strain rate sensitivity of .
where M is the strain rate sensitivity exponent. A difference method was here applied to calculate the average M at each temperature, , by considering the values at four strain rates from 0.01 s−1 to 10 s−1.
where , , and are the peak stresses at strain rates of 0.01 s−1, 0.1 s−1, 1 s−1 and 10 s−1, respectively. values of both Al alloys are presented in Figure 5b as a function of temperature. Although the 0.5 wt % Fe containing Al alloy exhibits greater , Fe content does not have an obvious effect on . Both Al alloys exhibit nearly identical at 673 K. For the 0.1 wt % Fe containing Al alloy, increases from 8.68 × 10⁻² s−2 to 1.01 × 10⁻¹ s−2 when T increases from 673 K to 723 K; beyond 723 K, decreases as T increases. M of the 0.5 wt % Fe containing Al alloy exhibits a different behavior as the temperature increases, e.g., changes little as T increases from 673 K to 773 K, and increases to 1.03 × 10⁻¹ s−2 at T = 823 K.
3.3. Activation Energy for Dynamic Recrystallization and Peak Stress Model
The peak stress is of significance to the design of rolling processes and predicting the maximum rolling forces. The peak stress () is the result of dynamic balance between work hardening and softening mechanisms (e.g., dynamic recrystallization) of the material during hot deformation. Dynamic recrystallization is regarded to be related to the activation energy (Q). In this section, Q will be calculated for the Fe-containing recycled Al alloys, and a model will be deduced to predict as a function of strain rate () and deformation temperature (T).
3.3.1. Governing Equations
According to Jonas et al. [14], Huang et al. [15], and Shi et al. [16], the strain rate () can be expressed as a function of flow stress (σ) by Equation (3)
or by Equation (4).
where A1, m, A2, and β are material parameters non-related to temperature. To describe the relationship between and σ in a wider temperature range, Zener et al. [17] proposed a temperature-compensated strain rate factor as there is a thermal activation process during hot deformation, i.e., the Zener-Hollomon parameter Z, which is expressed as
where A and n are material parameters, and R is the air constant (8.314 J·mol−1·K−1). In addition, Jonas et al. [14] proposed a hyperbolic sine function, Equation (6), which includes Q and T compared to Equations (3) and (4), to describe the relationship between and σ.
where
As a result, the flow stress (σ) can be expressed as a function of strain rate () and temperature (T) by Equation (8)
3.3.2. Identification of Parameters
As the peak stress () is an important parameter to the rolling process, σ and in Equation (8) will be replaced by and , respectively. Therefore, is expressed as a function of and T by following Equation (8). The material parameters in Equation (8) will be identified for the investigated Fe-containing recycled Al alloys.
According to Jonas et al. [14], Huang et al. [15], and Shi et al. [16], it is assumed that the relationship between and at temperatures 673–723 K and 773–823 K follows Equations (4) and (3), respectively. After applying logarithmic function to both sides of Equations (3) and (4), we have
By performing linear regression analysis, β and m are calculated as the average slopes of the vs. data at 673–723 K and 773–823 K as presented in Figures S1 and S5, respectively. Then α is calculated by Equation (7). By applying logarithm function to both sides of Equation (6), we have
or
Then n and Q/nR can be obtained as the average slope from linear regression analysis on the vs. and vs. 1/T data at the four temperatures, respectively, which refer to Figures S2, S6, S3 and S7. Consequently, the activation energy Q can be solved. By noting Equation (5), Equation (11) can be rewritten as
By substituting the known α, n, Q, , T and data at all test conditions into Equation (13), we can plot vs. as Figures S4 and S8. Apparently, has a linear relationship with , and the slope of the fitted line is very close to 1/n. Thus, A can be solved from the intercept, i.e., .
To this end, not only the activation energies for dynamic recrystallization of the Fe-containing recycled Al alloys are calculated, but also all material parameters in the model predicting (refer to Equations (14) and (15)) are identified, which are listed in Table 2.
Based on Equations (14) and (15), the predicted peak stresses () and experimentally measured peak stresses () are listed and compared in Table 3. It is seen that the maximum error (δ) defined by occurs at = 0.01 s−1 and T = 823 K, which is −9.87%, while most of the errors are smaller than 5%.
4. Discussion
Although the effects of temperature and strain rate on the flow stress of commercialized Al alloys have been extensively reported, the effect of Fe content on hot deformation behavior has rarely been investigated. From Figure 5a, increasing the Fe content in the recycled Al alloy results in an increase of the peak stress, which suggests that the recycled Al alloy containing higher Fe content is more difficult to deform. Nevertheless, the strain rate sensitivity is nearly independent on the Fe content, as compared in Figure 5b.
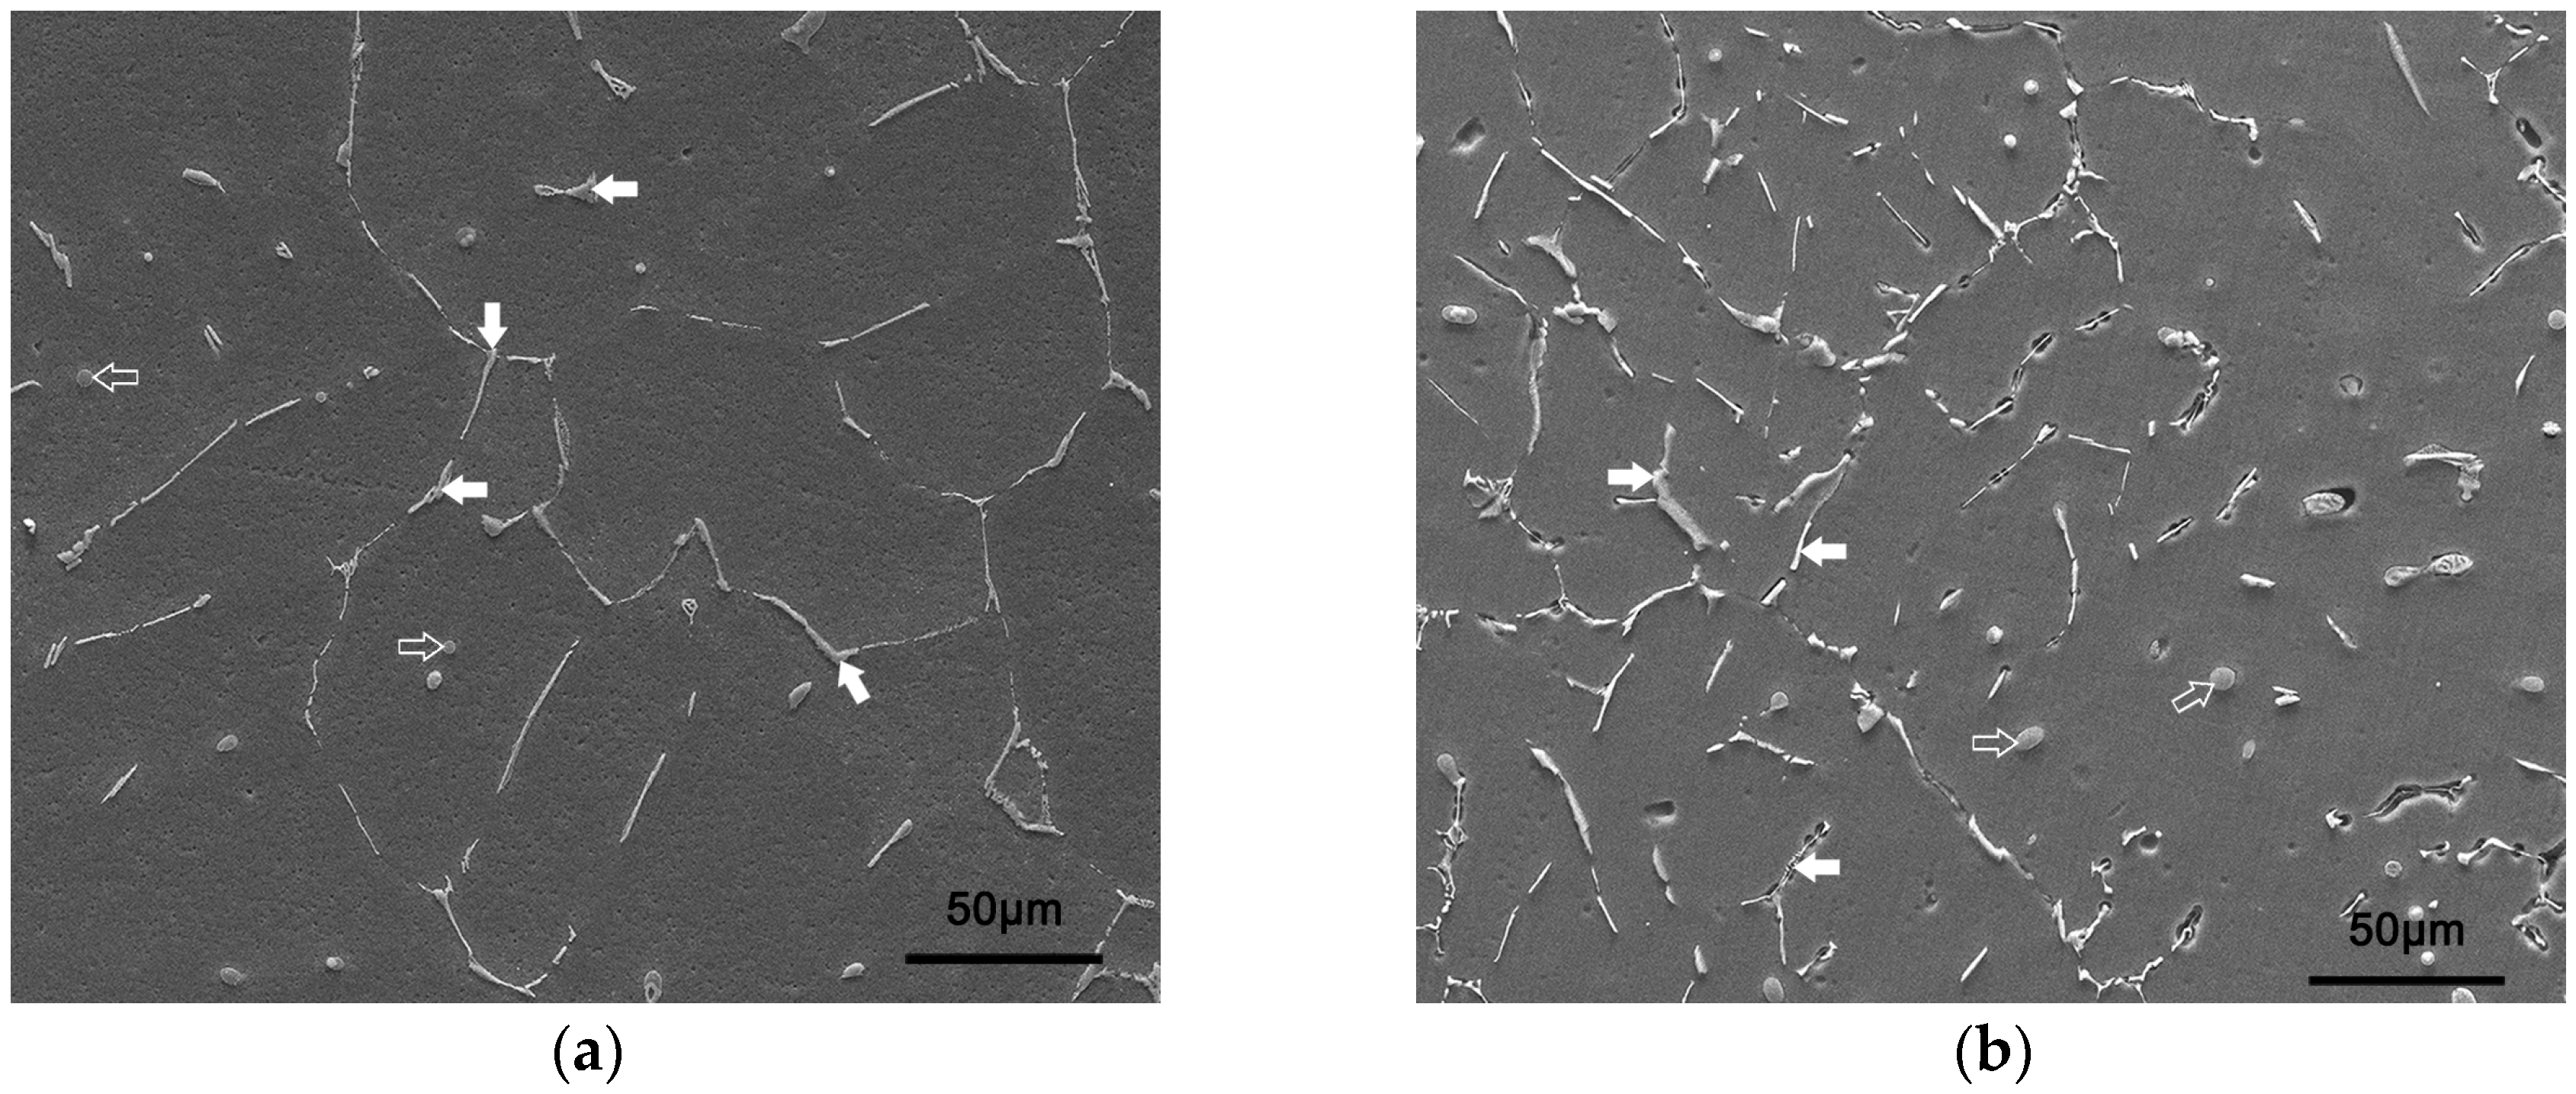
Before reaching the peak stress, the flow stress increases rapidly first, and then more slowly as the strain increases, which is different from the continuous work hardening of most metals deformed at room temperature. In this stage, dislocation accumulation is the main hardening mechanism and the main softening mechanism is dynamic recovery, which is due to dislocation annihilation and/or dislocation rearrangement. During the competition of work hardening and softening, dislocation cells and walls were formed. When the flow stress reached the peak stress, the grains were elongated and recrystallization occurred. The grains nucleated preferably at the original grain boundaries, and the newly formed sub-grain boundaries evident by dislocation cells/walls. The recycled Al alloy containing 0.5 wt % Fe requires larger activation energy for dynamic recrystallization of the alloy with a lower Fe content, which may be due to the fact that the Al alloy containing a higher Fe content exhibits larger flow stress. This result is consistent with the report from Jeniski et al. [18]: Fe-containing dispersed precipitates can increase the resistance for dislocation movements and dynamic recrystallization. It is noted that the activation energy of recycled Al alloy containing 0.1 wt % Fe is very close to the activation energy for bulk self-diffusion of pure aluminum, 142 kJ·mol−1. However, the activation energies of both investigated Al alloys are much lower than those of both AA2026 [19] and AA7150 [20], but close to that of cast A356 Al alloy [21], during hot compression. Figure 6 presents the SEM images of the as-cast recycled Al alloys. There are two types of precipitates in both alloys: rod precipitates (denoted by solid arrows) and round precipitates (denoted by hollow arrows). According to energy spectrum analysis, the rod precipitates are either AlMgFeSi or AlFeSi phases, while the round precipitates are mainly Mg2Si phase. By applying the Image-Pro plus 6.0 software, the statistical analysis results of the precipitates having a size range from 1 μm to 200 μm shown in Figure 6 are listed in Table 4. Note that the precipitates smaller than 1 μm are ignored here. It is seen that the maximum diameter and average diameter of the precipitates in both recycled Al alloys are similar, while the number density and the area density of the precipitates in the 0.5 wt % Fe containing Al alloy are two times that in the 0.1 wt % Fe containing Al alloy. As there are more dispersed precipitates in the 0.5 wt % Fe containing Al alloy and the deformation of the dispersed precipitates is also dependent on the Fe content, the resistance of dynamic recrystallization is larger, and the required activation energy is higher in the 0.5 wt % Fe containing Al alloy than in the 0.1 wt % Fe containing Al alloy.
It is of significance to control the microstructure of Fe-containing Al alloys before annealing and cold rolling. Lee et al. [22] discussed how the microstructure and texture after hot rolling affected the microstructure, texture and surface roughness of the cold rolled sheet. As the Fe-containing phases can be dissolved in the Al matrix during hot rolling, breaking the relatively larger Fe-containing phases by hot rolling becomes more important. The recycled Al alloy containing higher Fe content exhibits larger peak stress and activation energy than that containing lower Fe content; therefore, the recycled Al alloy containing a higher Fe content needs larger forming force and/or rolling reduction in the hot rolling process, which is beneficial to breaking the larger Fe-containing dispersed phases and can contribute to the higher strength and greater ductility of the cold rolled recycled Al alloy sheet containing higher Fe content. The effect of the Fe content on the mechanical properties of the cold rolled recycled Al alloy sheet will be reported elsewhere in future.
5. Conclusions
Casting ingots of recycled Al alloys containing 0.1 wt % Fe and 0.5 wt % Fe were prepared for hot compression tests in a temperature range from 673 K to 823 K and a wide strain rate range from 0.01 s−1 to 10 s−1. Both Al alloys exhibited dynamic recrystallization during hot compression, which is evident from the wavy true stress vs. true strain curves with a decreasing trend after reaching the peak. A model is established for the peak stress and the parameters in the model have been identified. A higher Fe content leads to a larger peak stress in the recycled Al alloy, which results from the following two aspects: (1) more/larger Fe-containing dispersed phases in the Al alloy containing higher Fe content; and (2) the deformation of Fe-containing dispersed phase is more difficult to deform at higher Fe content. These two aspects also increase the resistance of dislocation movement and dynamic recrystallization, and therefore, the 0.5 wt % Fe containing Al alloy requires greater activation energy (154.5 kJ∙mol−1) than the 0.1 wt % Fe containing Al alloy (140.5 kJ∙mol−1). As a result, the Al alloy containing higher Fe content needs larger rolling force and/or rolling reduction in hot rolling, which may help to break the Fe-containing dispersed phases and consequently to increase the strength and ductility of the cold rolled Fe-containing recycled Al alloy sheets. The mechanical properties of the cold rolled recycled Al alloy sheets containing different Fe contents will be published elsewhere.
Supplementary Materials
The following are available online at https://www.mdpi.com/2075-4701/7/7/262/s1, Figure S1: (a) vs. curves at 673 K and 723 K and (b) vs. curves at 773 K and 823 K of the recycled Al alloy containing 0.1 wt % Fe, Figure S2: vs. curves of the recycled Al alloy containing 0.1 wt % Fe, Figure S3: vs. 1/T curves of the recycled Al alloy containing 0.1 wt % Fe, Figure S4: Correlation between and of the recycled Al alloy containing 0.1 wt % Fe, Figure S5: (a) vs. curves at 673 K and 723 K and (b) vs. curves at 773 K and 823 K of the recycled Al alloy containing 0.5 wt % Fe, Figure S6: vs. curves of the recycled Al alloy containing 0.5 wt % Fe, Figure S7: vs. 1/T curves of the recycled Al alloy containing 0.5 wt % Fe, Figure S8: correlation between and of the recycled Al alloy containing 0.5 wt % Fe.
Acknowledgments
The authors would like to acknowledge the financial contribution from the National Science & Technology Pillar Program during the 12th Five-year Plan Period (grant No. 2011BAG03B00). The authors also thank the reviewers of Metals for the suggestive comments which improve the technical content of this paper.
Author Contributions
Guimin Lu, Hongzhou Lu and Mingtu Ma conceived and designed the experiments; Zeran Hou and Hongzhou Lu performed the experiments; Hongzhou Lu analyzed the data; Hongzhou Lu wrote the paper.
Conflicts of Interest
The authors declare no conflict of interest.
References
- Choate, W.T.; Green, J.A.S. Modeling the impact of secondary recovery (recycling) on the U.S. Aluminum supply and nominal energy requirements. In Light Metals, 2004th ed.; Tabereaux, A.T., Ed.; John Wiley and Sons Ltd.: Warrendale, PA, USA, 2004; pp. 913–918. [Google Scholar]
- Das, S.K. Designing aluminium alloys for a recycling friendly world. Mater. Sci. Forum 2006, 519–521, 1239–1244. [Google Scholar] [CrossRef]
- Sarkar, J.; Kutty, T.R.G.; Conlon, K.T.; Wilkinson, D.S.; Embury, J.D.; Lloyd, D.J. Tensile and bending properties of AA5754 aluminum alloys. Mater. Sci. Eng. A 2001, 316, 52–59. [Google Scholar] [CrossRef]
- Das, S.K.; Green, J.A.S.; Kaufman, J.G. The development of recycle-friendly automotive aluminum alloys. JOM 2007, 59, 47–51. [Google Scholar] [CrossRef]
- Gesing, A.; Berry, L.; Dalton, R.; Wolanski, R. Assuring continued recyclability of automotive aluminum alloys: Grouping of wrought alloys by color, X-ray absorption and chemical composition-based sorting. In Proceedings of the TMS 2002 Annual Meeting: Automotive Alloys and Aluminum Sheet and Plate Rolling and Finishing Technology Symposia, Warrendale, PA, USA, 18–21 Feburary 2002; pp. 3–15. [Google Scholar]
- Pan, F.; Zhang, D. Aluminium Alloy and Application; Chemical Industry Press: Beijing, China, 2006. (In Chinese) [Google Scholar]
- Staley, J.T.; Lege, D.J. Advances in aluminium alloy products for structural applications in transportation. J. Phys. IV 1993, 3, 179–190. [Google Scholar] [CrossRef]
- Shabestari, S.G. The effect of iron and manganese on the formation of intermetallic compounds in aluminum-silicon alloys. Mater. Sci. Eng. A 2004, 383, 289–298. [Google Scholar] [CrossRef]
- Matsubara, H.; Izawa, N.; Nakanishi, M. Macroscopic segregation in Al-11 mass % Si slloy containing 2 mass % Fe solidified under centrifugal force. J. Jpn. Inst. Light Met. 1998, 48, 93–97. [Google Scholar] [CrossRef]
- Joon-Pyou, P.; Sassa, K.; Asai, S. Elimination of iron in molten Al-Si alloys by electromagnetic force. J. Jpn. Inst. Light Met. 1995, 59, 312–318. [Google Scholar]
- Haghdadi, N.; Cizek, P.; Beladi, H.; Hodgson, P.D. A novel high-strain-rate ferrite dynamic softening mechanism facilitated by the interphase in the austenite/ferrite microstructure. Acta Mater. 2017, 126, 44–57. [Google Scholar] [CrossRef]
- Min, J.; Hector, L.G., Jr.; Zhang, L.; Sun, L.; Carsley, J.E.; Lin, J. Plastic instability at elevated temperatures in a trip-assisted steel. Mater. Des. 2016, 95, 370–386. [Google Scholar] [CrossRef]
- Ji, H.S.; Ji, H.K.; Wagoner, R.H. A plastic constitutive equation incorporating strain, strain-rate, and temperature. Int. J. Plast. 2010, 26, 1746–1771. [Google Scholar]
- Jonas, J.J.; Sellars, C.M.; Tegart, W.J.M. Strength and structure under hot-working conditions. Int. Mater. Rev. 1969, 14, 1–24. [Google Scholar] [CrossRef]
- Huang, C.-Q.; Diao, J.-P.; Deng, H.; Li, B.-J.; Hu, X.-H. Microstructure evolution of 6016 aluminum alloy during compression at elevated temperatures by hot rolling emulation. Trans. Nonferr. Met. Soc. China 2013, 23, 1576–1582. [Google Scholar] [CrossRef]
- Shi, H.; Mclaren, A.J.; Sellars, C.M.; Shahani, R.; Bolingbroke, R. Constitutive equations for high temperature flow stress of aluminium alloys. Mater. Sci. Technol. 1997, 13, 210–216. [Google Scholar] [CrossRef]
- Zener, C.; Hollomon, J.H. Effect of strain rate upon plastic flow of steel. J. Appl. Phys. 1944, 15, 22–32. [Google Scholar] [CrossRef]
- Jeniski, R.A.; Thanaboonsombut, B.; Sanders, T.H. The effect of iron and manganese on the recrystallization behavior of hotrolled and solution-heat-treated aluminum alloy 6013. Metall. Mater. Trans. A 1996, 27, 19–27. [Google Scholar] [CrossRef]
- Huang, X.; Zhang, H.; Han, Y.; Wu, W.; Chen, J. Hot deformation behavior of 2026 aluminum alloy during compression at elevated temperature. Mater. Sci. Eng. A 2010, 527, 485–490. [Google Scholar] [CrossRef]
- Jin, N.; Zhang, H.; Han, Y.; Wu, W.; Chen, J. Hot deformation behavior of 7150 aluminum alloy during compression at elevated temperature. Mater. Charact. 2009, 60, 530–536. [Google Scholar] [CrossRef]
- Haghdadi, N.; Zarei-Hanzaki, A.; Abedi, H.R. The flow behavior modeling of cast A356 aluminum alloy at elevated temperatures considering the effect of strain. Mater. Sci. Eng. A 2012, 535, 252–257. [Google Scholar] [CrossRef]
- Lee, K.J.; Woo, K.D. Effect of the hot-rolling microstructure on texture and surface roughening of Al-Mg-Si series aluminum alloy sheets. Met. Mater. Int. 2011, 17, 689–695. [Google Scholar] [CrossRef]
Figure 1.
(a) Geometries of the cylindrical specimen for hot compression tests (units in mm) and (b) and illustration of hot compression in the MMS300 thermo-mechanical simulator.
Figure 1.
(a) Geometries of the cylindrical specimen for hot compression tests (units in mm) and (b) and illustration of hot compression in the MMS300 thermo-mechanical simulator.
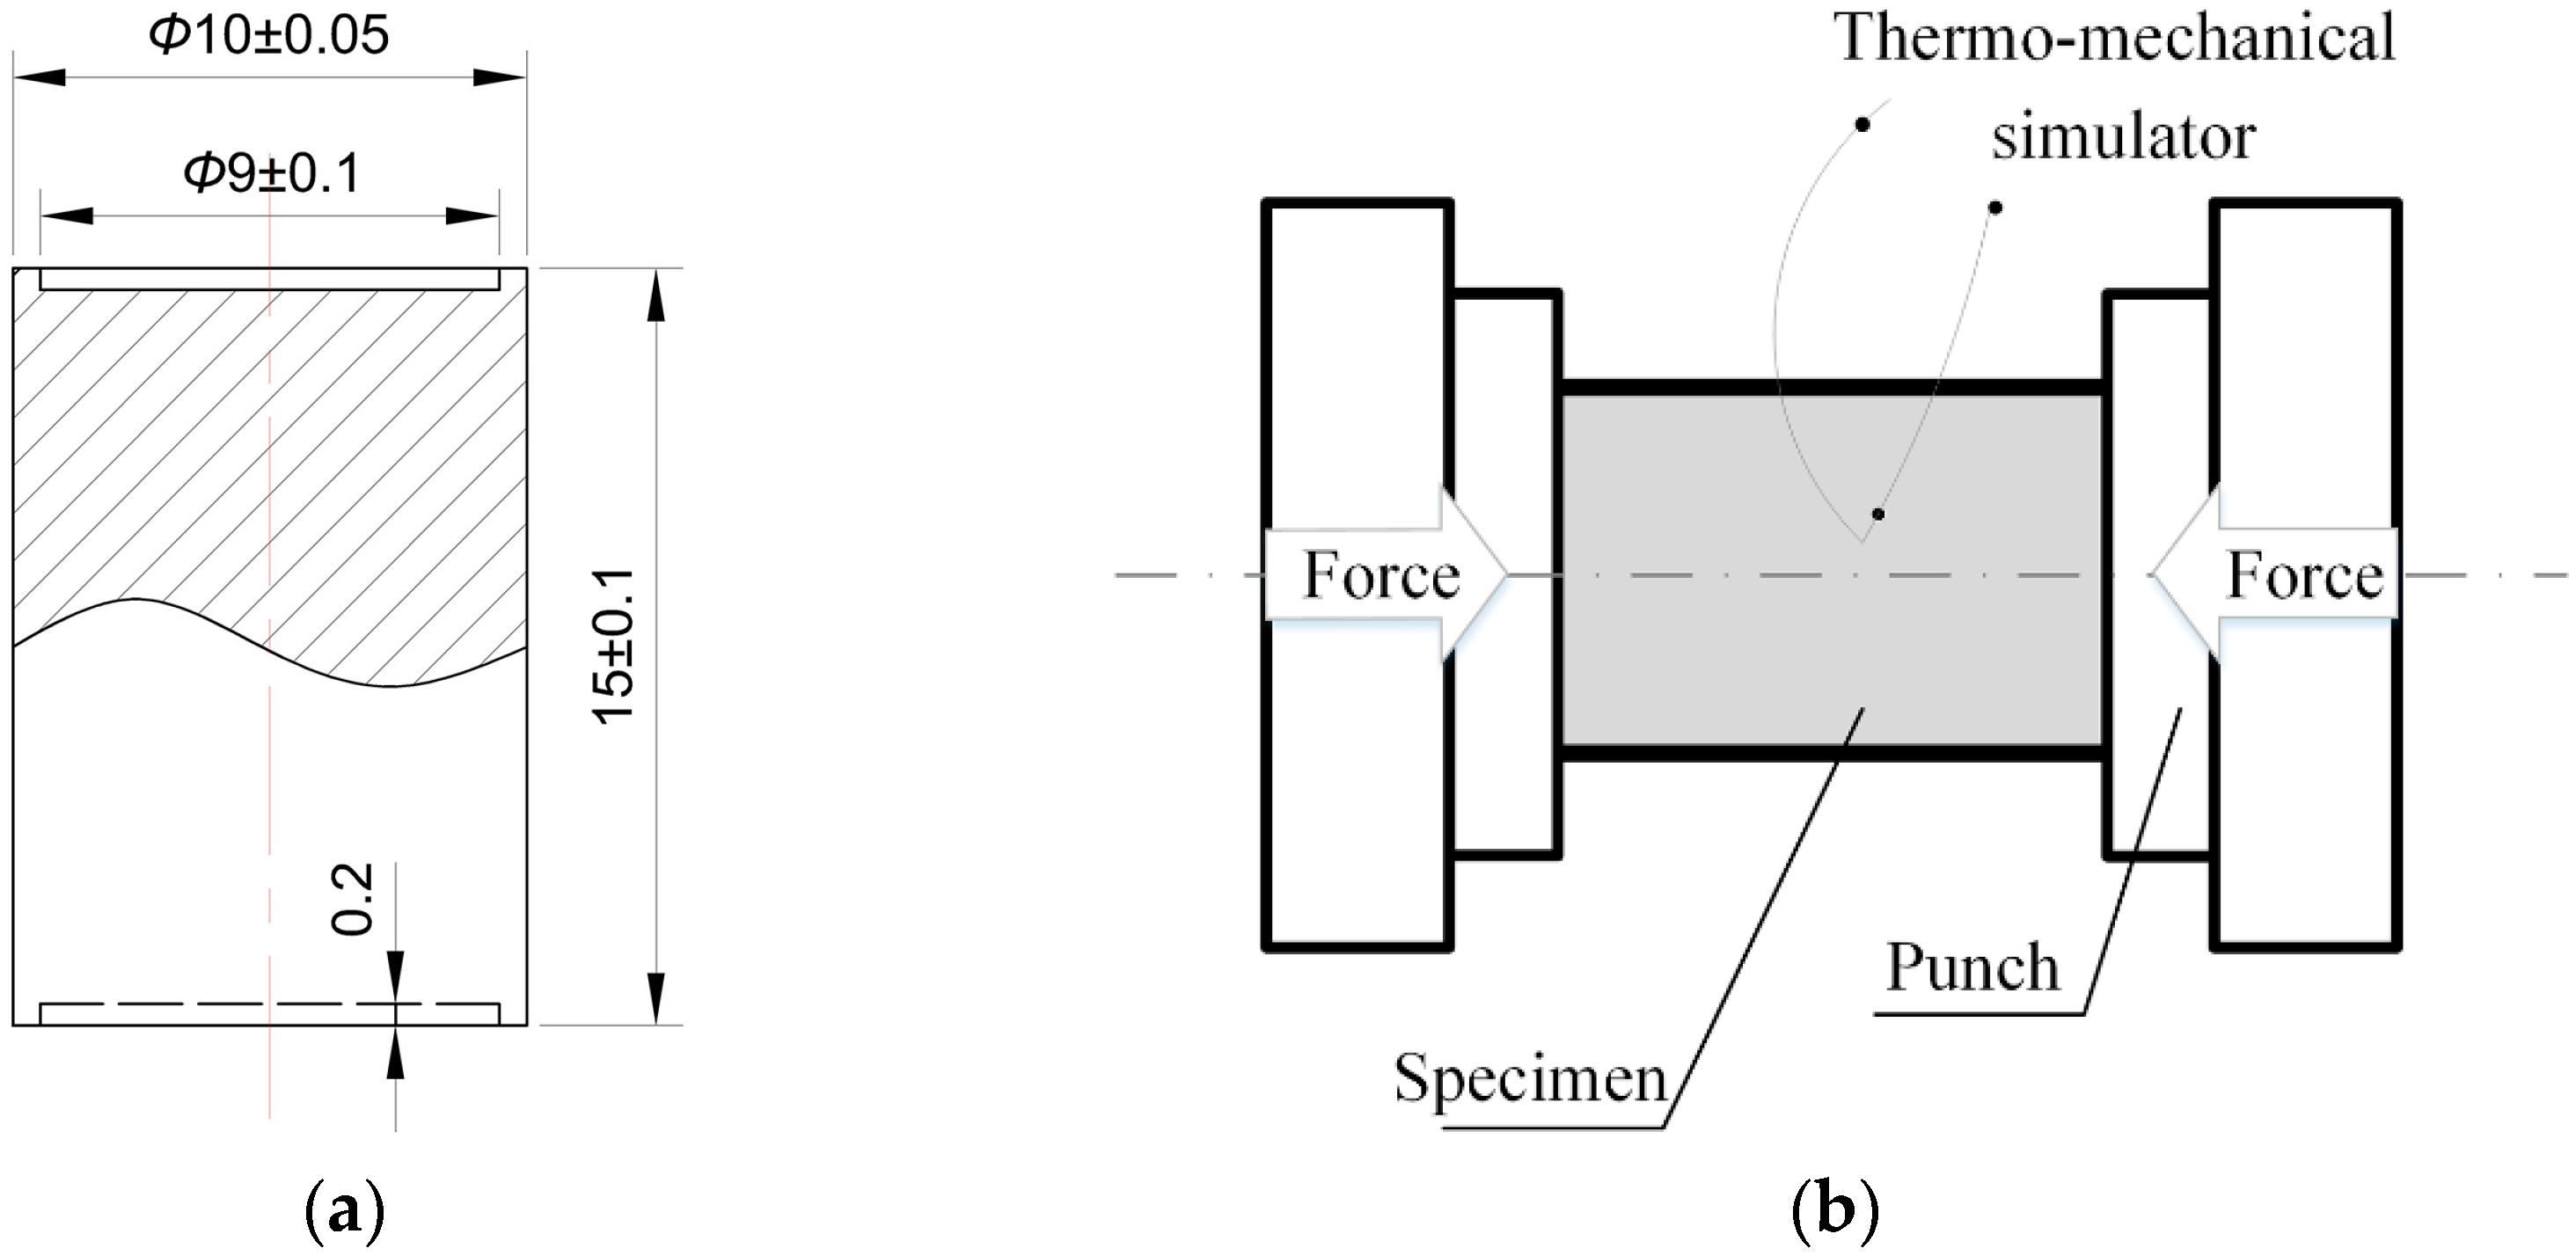
Figure 2.
A schematic diagram of the temperature history in hot compression test.

Figure 3.
Compressive true stress vs. true strain curves of the recycled Al alloy containing 0.1 wt % Fe at nominal strain rates (a) = 0.01 s−1; (b) = 0.1 s−1; (c) = 1 s−1; and (d) = 10 s−1.
Figure 3.
Compressive true stress vs. true strain curves of the recycled Al alloy containing 0.1 wt % Fe at nominal strain rates (a) = 0.01 s−1; (b) = 0.1 s−1; (c) = 1 s−1; and (d) = 10 s−1.

Figure 4.
Compressive true stress vs. true strain curves of the recycled Al alloy containing 0.5 wt % Fe at nominal strain rates (a) = 0.01 s−1; (b) = 0.1 s−1; (c) = 1 s−1; and (d) = 10 s−1.
Figure 4.
Compressive true stress vs. true strain curves of the recycled Al alloy containing 0.5 wt % Fe at nominal strain rates (a) = 0.01 s−1; (b) = 0.1 s−1; (c) = 1 s−1; and (d) = 10 s−1.

Figure 5.
(a) Peak stress () vs. nominal strain rate () curves and (b) the average strain rate sensitivity exponent (, Equation (2)) of both recycled Al alloys.
Figure 5.
(a) Peak stress () vs. nominal strain rate () curves and (b) the average strain rate sensitivity exponent (, Equation (2)) of both recycled Al alloys.
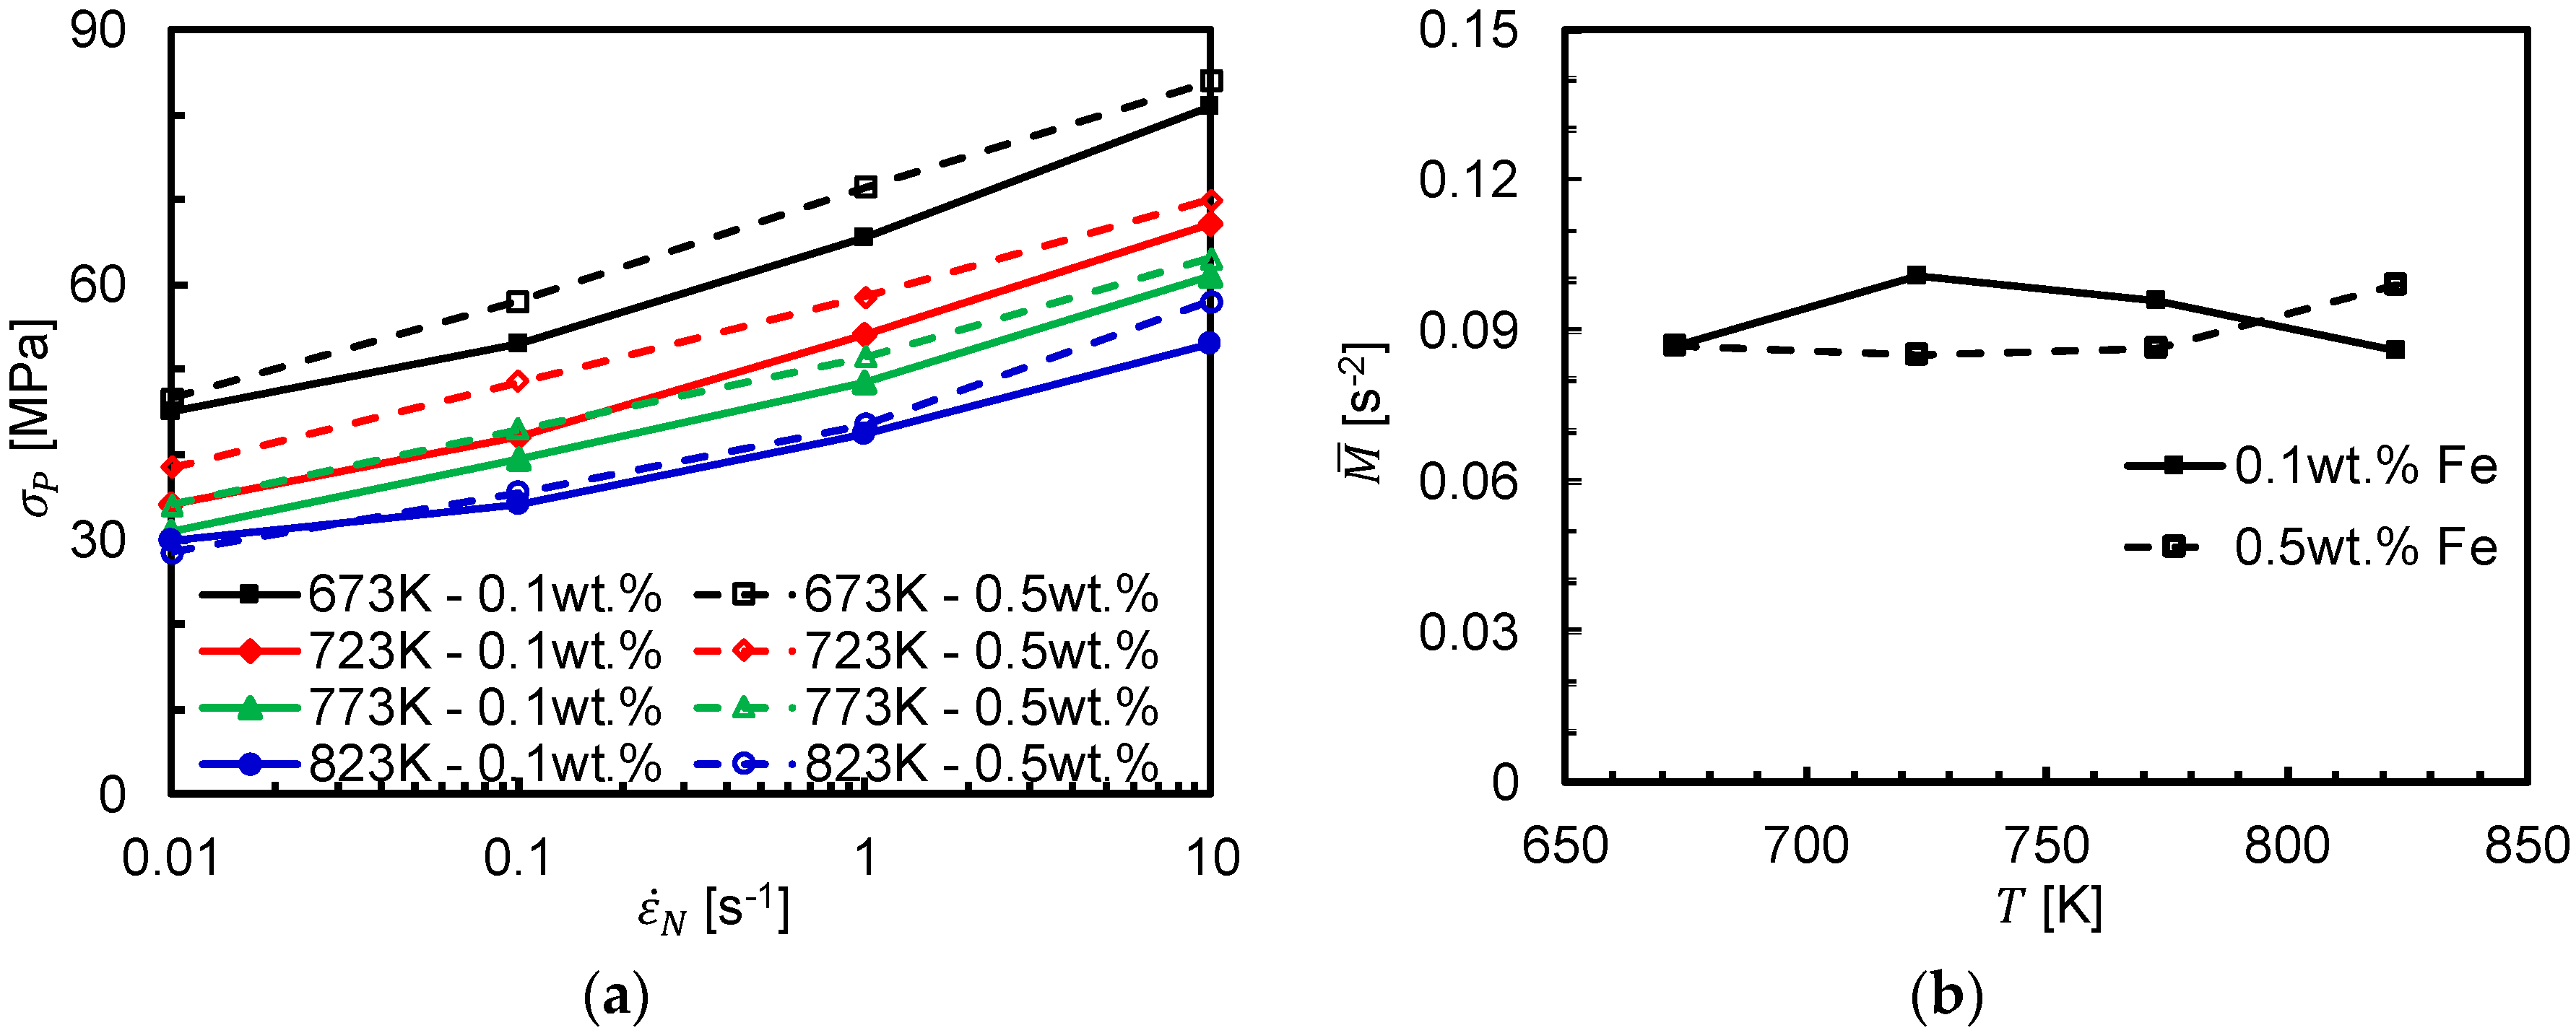
Figure 6.
SEM images showing constituent particles in the as-cast recycled Al alloys containing (a) 0.1 wt % Fe and (b) 0.5 wt % Fe.
Figure 6.
SEM images showing constituent particles in the as-cast recycled Al alloys containing (a) 0.1 wt % Fe and (b) 0.5 wt % Fe.


Table 1.
The chemical composition of the recycled Al alloys with different contents of Fe (unit in wt %).
Table 1.
The chemical composition of the recycled Al alloys with different contents of Fe (unit in wt %).
| Si | Mg | Fe | Mn | Al |
|---|---|---|---|---|
| 1.05 | 0.54 | 0.10 | 0.069 | Balance |
| 0.97 | 0.56 | 0.50 | 0.071 | Balance |
Table 2.
Material parameters of the Fe-containing recycled Al alloys.
| Al Alloys | m | β | α | n | Q [kJ mol−1] | A |
|---|---|---|---|---|---|---|
| 0.1 Fe 1 | 11.02 | 0.1963 | 0.01781 | 8.760 | 140.5 | 3.550 × 10⁹ |
| 0.5 Fe 1 | 9.452 | 0.2013 | 0.02130 | 8.030 | 154.5 | 2.569 × 10⁹ |
1 “0.1 Fe” and “0.5 Fe” indicate the recycled Al alloys containing 0.1 wt % Fe and 0.5 wt % Fe, respectively.
Table 3.
Comparison between the predicted peak stresses () and experimental peak stresses () at the investigated strain rates () of the two Fe-containing Al alloys.
Table 3.
Comparison between the predicted peak stresses () and experimental peak stresses () at the investigated strain rates () of the two Fe-containing Al alloys.
| Alloys | [s−1] | T [K] | [MPa] | [MPa] | δ [%] |
|---|---|---|---|---|---|
| 0.1 Fe | 0.01 | 673 | 45.0 | 43.0 | −4.38% |
| 723 | 34.0 | 36.3 | 6.69% | ||
| 773 | 31.0 | 31.1 | 0.26% | ||
| 823 | 30.0 | 27.0 | −9.87% | ||
| 0.1 | 673 | 53.0 | 53.3 | 0.48% | |
| 723 | 42.0 | 45.4 | 8.13% | ||
| 773 | 39.5 | 39.2 | −0.64% | ||
| 823 | 34.0 | 34.4 | 1.05% | ||
| 1 | 673 | 65.5 | 64.8 | −1.11% | |
| 723 | 54.0 | 56.0 | 3.66% | ||
| 773 | 48.5 | 48.9 | 0.80% | ||
| 823 | 42.5 | 43.2 | 1.53% | ||
| 10 | 673 | 81.0 | 77.3 | −4.53% | |
| 723 | 67.0 | 67.8 | 1.16% | ||
| 773 | 61.0 | 59.9 | −1.80% | ||
| 823 | 53.0 | 53.4 | 0.75% | ||
| 0.5 Fe | 0.01 | 673 | 46.5 | 47.8 | 2.90% |
| 723 | 38.5 | 39.8 | 3.31% | ||
| 773 | 34.0 | 33.6 | −1.29% | ||
| 823 | 28.5 | 28.7 | 0.86% | ||
| 0.1 | 673 | 58.0 | 58.8 | 1.37% | |
| 723 | 48.5 | 49.6 | 2.33% | ||
| 773 | 43.0 | 42.4 | −1.46% | ||
| 823 | 35.5 | 36.6 | 3.13% | ||
| 1 | 673 | 71.5 | 70.8 | −0.94% | |
| 723 | 58.5 | 60.8 | 3.90% | ||
| 773 | 51.5 | 52.6 | 2.16% | ||
| 823 | 43.5 | 46.0 | 5.65% | ||
| 10 | 673 | 84.0 | 83.7 | −0.39% | |
| 723 | 70.0 | 73.0 | 4.25% | ||
| 773 | 63.0 | 64.1 | 1.71% | ||
| 823 | 58.0 | 56.7 | −2.28% |
Table 4.
Statistical analysis result of the precipitates limited to a size range from 1 μm to 200 μm.
Table 4.
Statistical analysis result of the precipitates limited to a size range from 1 μm to 200 μm.
| Fe Content (wt %) | 0.1 | 0.5 |
|---|---|---|
| Numbers of lager intermetallic particles (1–200 μm) in Figure 6 [mm−2] | 2068 | 4826 |
| Area [%] | 1.839 | 3.706 |
| Max diameter [μm] | 18.20 | 18.04 |
| Average diameter [μm] | 3.425 | 3.339 |
© 2017 by the authors. Licensee MDPI, Basel, Switzerland. This article is an open access article distributed under the terms and conditions of the Creative Commons Attribution (CC BY) license (http://creativecommons.org/licenses/by/4.0/).
Share and Cite
MDPI and ACS Style
Lu, H.; Hou, Z.; Ma, M.; Lu, G. Effect of Fe-Content on the Mechanical Properties of Recycled Al Alloys during Hot Compression. Metals 2017, 7, 262. https://doi.org/10.3390/met7070262
AMA Style
Lu H, Hou Z, Ma M, Lu G. Effect of Fe-Content on the Mechanical Properties of Recycled Al Alloys during Hot Compression. Metals. 2017; 7(7):262. https://doi.org/10.3390/met7070262
Chicago/Turabian StyleLu, Hongzhou, Zeran Hou, Mingtu Ma, and Guimin Lu. 2017. "Effect of Fe-Content on the Mechanical Properties of Recycled Al Alloys during Hot Compression" Metals 7, no. 7: 262. https://doi.org/10.3390/met7070262
Note that from the first issue of 2016, this journal uses article numbers instead of page numbers. See further details here.