
Microstructure and Corrosion Behavior of Simulated Welding HAZ of Q315NS Steel in Sulfuric Acid Solution †

1
State Key Laboratory of Advanced Welding and Joining, Harbin Institute of Technology, Harbin 150001, China
2
Shandong Provincial Key Lab of Special Welding Technology, Harbin Institute of Technology at Weihai, Weihai 264209, China
3
State Key Laboratory of Rolling and Automation, Northeastern University, Shenyang 110819, China
*
Author to whom correspondence should be addressed.
†
This paper is an extended version of paper published in AIP Conference on the 2017 International Workshop on Advances in Energy Science and Environment Engineering, Hangzhou, Zhejiang, China, 7–9 April 2017.
Metals 2017, 7(6), 194; https://doi.org/10.3390/met7060194
Submission received: 17 April 2017
/
Revised: 20 May 2017
/
Accepted: 21 May 2017
/
Published: 26 May 2017
Abstract
:The microstructure evolution and the corrosion behavior of welding heat affected zone (HAZ) of Q315NS steel in 50 wt % H2SO4 at 20 °C was investigated with thermal simulation technique, surface analysis and electrochemical tests. The microstructure of ferrite and pearlite was observed in base metal (BM), fine grained region (FGHAZ) and inter critical region (ICHAZ) while coarse grained region (CGHAZ) consisted of granular bainite. The CGHAZ exhibited the highest microhardness and the largest average grain size. The passivation process occurred on the surface of all specimens. Different microstructure give birth to different corrosion behaviors between CGHAZ and BM, FGHAZ, ICHAZ. The dense oxide film were formed on the surface of ferrite while oxide film with micro voids were formed on the surface of pearlite in BM, FGHAZ and ICHAZ after immersion in 50 wt % H2SO4 solution for 12 h. The rod-shaped corrosion product was formed on the surface of CGHAZ while the porous-structured corrosion product was formed on the surface of BM, FGHAZ and ICHAZ after immersion in 50 wt % H2SO4 solution for 72 h. The corrosion resistance of BM, CGHAZ, FGHAZ and ICHAZ increased during the first 12 h and then declined slowly with increasing immersion time. The BM had the best corrosion resistance while the CGHAZ had the lowest corrosion resistance throughout the corrosion process.
1. Introduction
As the main corrosion form of coal- or heavy oil-fired boilers, sulfuric acid dew-point corrosion occurs when sulphur in fossil fuels is converted to sulfuric acid at low temperature (<200 °C) on various parts (economizers, air preheaters, chimneys, etc.) [1,2,3]. When the service temperature is lowered to improve energy efficiency, sulfuric acid dew-point corrosion becomes more serious [4]. Sulfuric acid dew-point corrosion-resistant steel like Q315NS steel produced by appropriate alloy design, has been used to reduce cost by increasing service time due to its excellent sulfuric acid dew-point corrosion resistance. Welding is widely used in the manufacture of fired boilers, and the microstructure and properties of heat affected zone (HAZ) are more complex than the base metal (BM) and weld metal (WM) due to the presence of microstructure gradients caused by welding thermal cycle [5]. The microstructure evolution and mechanical properties of HAZ have been studied [6,7,8,9,10,11,12,13], but research focused on corrosion behavior and corrosion mechanisms in HAZ is lacking.
Electrochemical measurement technique is an efficient and rapid method to analyze the corrosion behavior and it is able to provide much information on corrosion behavior. Several studies have shown that the corrosion behavior of HAZ was different from BM and the corrosion resistance decreased after welding thermal cycle [14,15,16,17,18,19]. Dastgiri [14] carried out failure analysis of the welded pipe made of AISI 1518 low carbon steel based on the available documents, metallographic studies and corrosion behavior. Electrochemical impedance spectroscopy (EIS) investigations showed that HAZ and WM were susceptible to corrosive media. Wei [15] studied the corrosion resistance of HAZ of 22SiMn2TiB ultra-high strength steel weld joint in 3.5 wt % NaCl solution by polarization measurement, then the relation between the microstructure and the HAZ corrosion resistance was established. Zhang [16,17] researched the corrosion behavior of welded X70 pipeline steel by polarization, electrochemical impedance spectroscopy (EIS) and scanning vibrating electrode technique (SVET). Bordbar [18] investigated the effect of heat treatment on the corrosion properties and the protective properties of the corrosion products layer of X70 welded joint by EIS measurements. Verma and Taiwade [19] assessed the intergranular corrosion resistance and pitting characteristics of the dissimilar welds between 22% Cr series duplex 2205 and 316L austenitic stainless steel by polarization measurements.
In this work, thermal simulation experiments were carried out on the HAZ of Q315NS steel with excellent dew-point corrosion-resistant to sulfuric acid. Surface analysis were conducted to investigate the microstructure evolution of the HAZ and the corresponding corrosion behavior in sulfuric acid solution. Electrochemical tests were carried out to evaluate the corrosion resistance of different zones identified with different microstructure in the HAZ.
2. Experimental
2.1. HAZ Thermal Simulation
To investigate microstructural evolution in the HAZ, thermal simulation experiments were performed using the computer-controlled Gleeble-3800 (DSI, Poestenkill, NY, USA) thermal-force simulation testing machine which is capable of providing rapid and programmable heating and cooling cycles. For steels, the microstructure varied greatly in the different regions of the HAZ due to different peak temperatures. Complete austenitizing occurs in coarse grained region (CGHAZ) when the peak temperature is significantly above the end temperature of ferrite to austenite transformation (Ac3). However, it occurs in fine grained region (FGHAZ) even when the peak temperature is slightly above the Ac3. Incomplete austenitizing often occurs in inter critical region (ICHAZ) because the peak temperature is between Ac3 and the start temperature of ferrite to austenite transformation (Ac1) [20,21,22].
The chemical compositions (wt %) of Q315NS steel used in this study is as follows: 0.06% C, 0.27% Si, 0.87% Mn, 0.02% S, 0.01% P, 0.11% Ni, 0.10% Mo, 0.31% Cu, 0.09% Sb and bal Fe. Austenite formation temperatures (Ac1 and Ac3) can be predicted according to the following empirical equation proposed by Andrews [23]:
where ω(X) is the mass fraction of elements (X = Mn, Ni, Si, etc.). It was found that Ac1 was 721 °C while Ac3 was 909 °C. As a result, 1320, 930 and 830 °C were selected as the peak temperature in CGHAZ, FGHAZ and ICHAZ simulation procedure. The heat input is usually 10–20 kJ/cm in welding process of Q315NS steel. The heat input of thermal simulation experiments was set as 15 kJ/cm. Therefore the cooling rate and the cooling time from 800 to 500 °C (t8/5) were 20 °C/s and 15 s respectively, according to the equation (3) proposed by Vwer [24].
where T0 is the initial temperature of steel (°C), Q is the heat input of welding process (J/cm), δ is the thickness of steel (cm) and F is the shape factor (F = 1 in 2D heat transfer model of thin steel plate welding).
Ac1 (°C) = 732 − 10.7 ω(Mn) − 3.9 ω(Ni) + 29 ω(Si) + 16.7 ω(Cr) + 290 ω(As) + 6.38 ω(W)
Ac3 (°C) = 910 − 230 ω(C)0.5 − 15.2 ω(Ni) + 44.7 ω(Si) + 104 ω(V) + 31.5 ω(Mo) + 13.1 ω(W)
t8/5 = (0.043 − 4.3 × 10⁻⁵ T0)[1/(500 − T0)2 − 1/(800 − T0)2] Q2·δ−2·F
The specimens were heated to the peak temperature at a linear rate of 150 °C/s, maintained for 1 s, and then cooled at cooling rate of 20 °C/s. The heating and cooling parameters selected to simulate the welding thermal cycles are shown in Table 1. The simulated HAZ specimens with sizes of 10 mm × 10 mm × 55 mm were prepared from a hot-rolled Q315NS steel plate with the longitudinal axis parallel to the rolling direction. Cuboid specimens measuring of 10 mm × 10 mm × 3 mm were used for microstructure observation and for electrochemical experiments, the specimens were sectioned from the middle of simulated HAZ specimens.
2.2. Microstructure Observation
The BM and simulated welding HAZ specimens were ground with emery paper to 1200# and then polished by flannelette for less than 1 min. All specimens were cleaned in an ultrasonic bath with ethanol for 5 min and then dried in hot air. The microstructure of the BM and simulated welding HAZ were observed by a Zeiss Merlin Compact field emission scanning electron microscope (FESEM, ZEISS, Oberkochen, Germany) after being etched with an alcohol solution containing 4 vol % nitric acid. The average grain size were measured by Intercept Procedure according to the Chinese national technique standard GB/T 6394-2002. In addition, the corrosion product morphologies after different immersion time in 50 wt % H2SO4 solution were observed by FESEM.
2.3. Electrochemical Experiments
The polarization measurements were conducted in accordance with the Chinese national technique standard GB/T 24196-2009. A three-electrode electrochemical system was set up, in which a Saturated calomel electrode (SCE) was used as the reference electrode with a platinum electrode as the auxiliary electrode and the simulated welding HAZ as working electrodes. The aggressive solution was 50 wt % H2SO4 which was prepared by dilution of analytical reagent grade 98 wt % H2SO4 with de-ionized water. Before the electrochemical experiments, the working electrodes were welded with wire, mounted in epoxy resin, ground with 1200# emery paper, cleaned with alcohol and dried with cool air. The area of the working electrode exposed to 50 wt % H2SO4 for electrochemical experiments was 10 mm × 10 mm. Potentiodynamic polarization curve tests were conducted with a sweep rate of 0.5 mV/s. Electrochemical impedance spectroscopy (EIS) plots were measured with 10 mV amplitude and within 10 mHz to 10 kHz frequencies. All electrochemical experiments and immersion experiments were performed at 20 °C and exposed to air. All potential is relative to SCE if not specified.
3. Results and Discussion
3.1. Microstructure Evolution
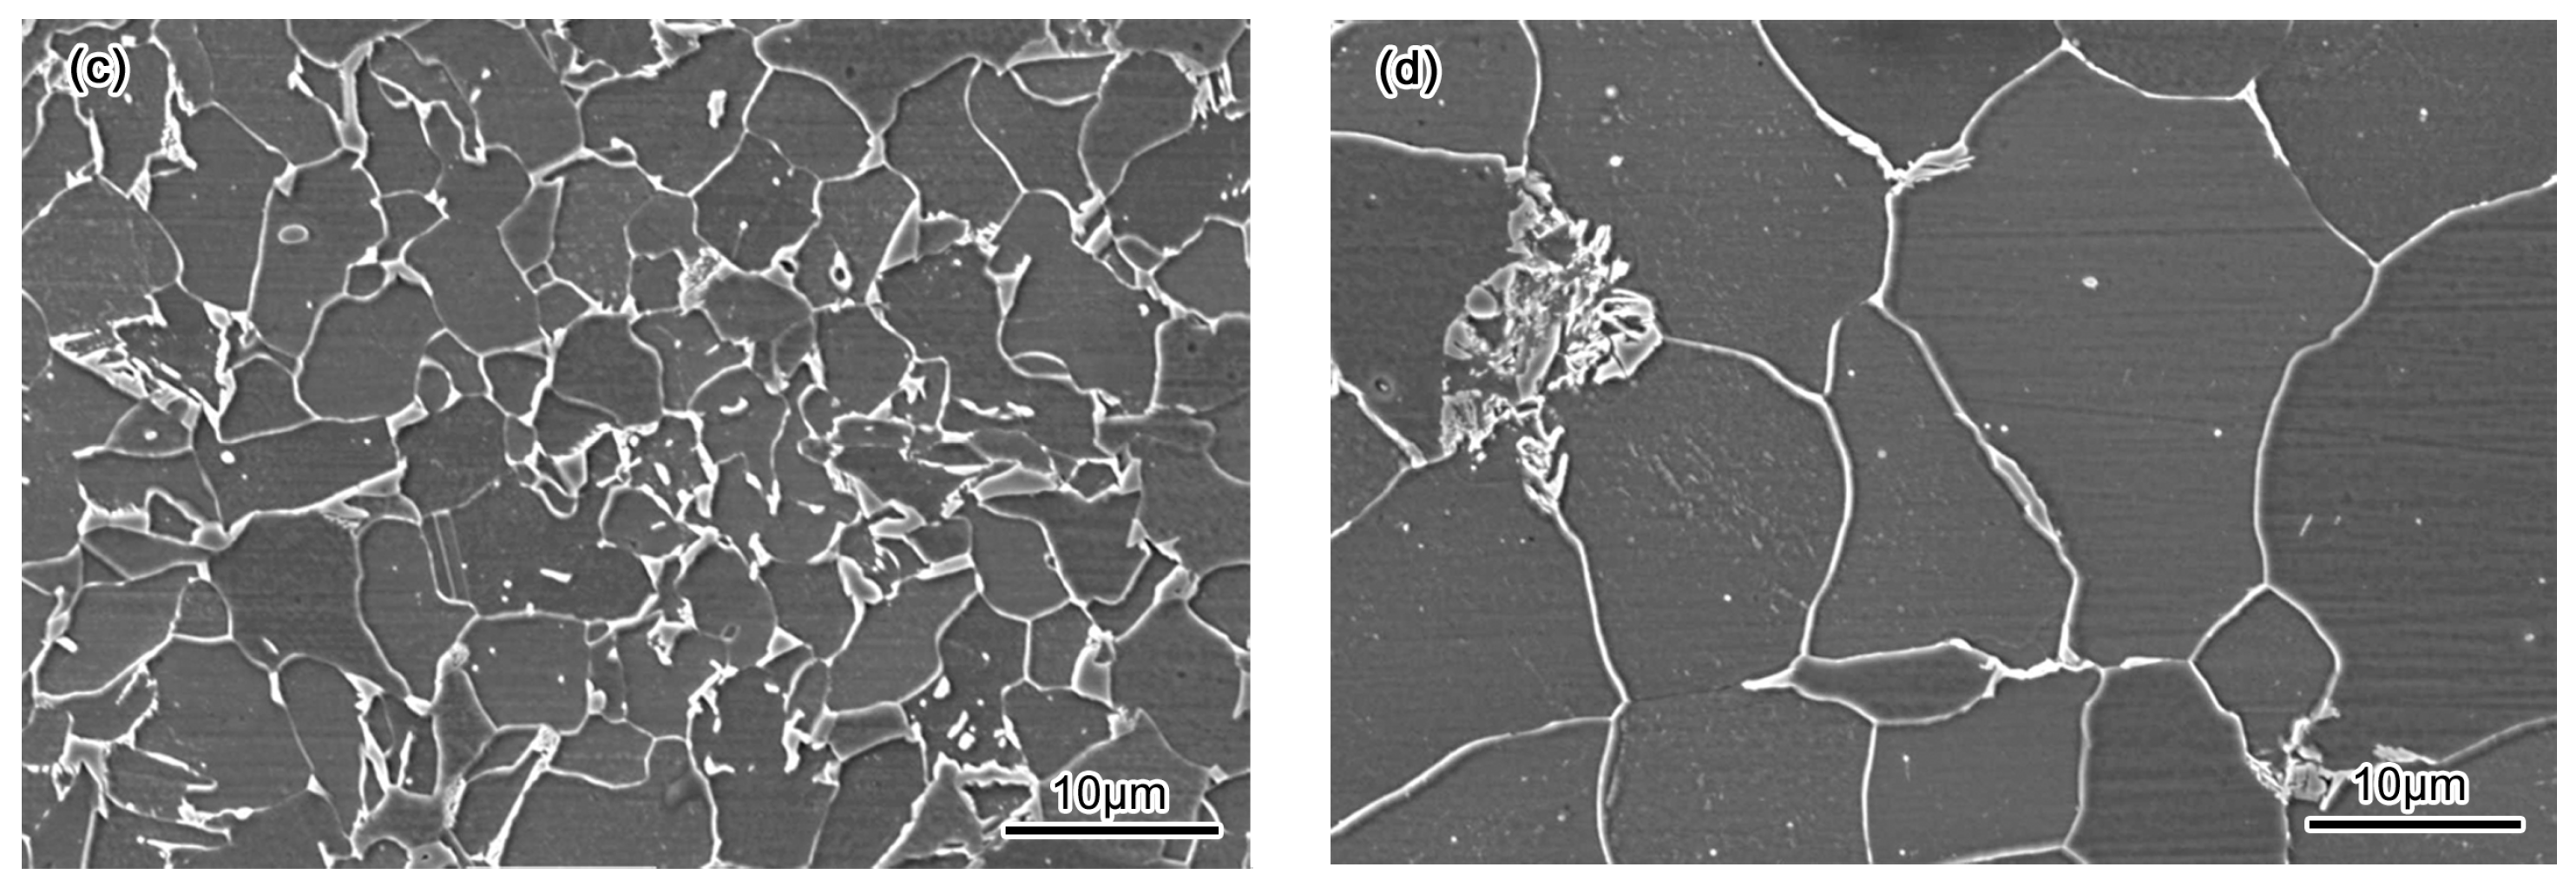
The SEM images of Q315NS steel and simulated welding HAZ are shown in Figure 1. Besides, the average grain size and hardness values of the various zones are as shown in Figure 2. The BM of Q315NS steel exhibits a typical microstructure of polygonal ferrite (F) and pearlite (P) as shown in Figure 1a. The final microstructure of the HAZ is largely determined by the applied thermal cycle. In the CGHAZ as shown in Figure 1b, a granular bainite (GB) with coarse primary austenite grain boundaries were observed. GB consisted of bainitic ferrite matrix and the martensite/austenite (M/A) phase as the second phase [25]. The M/A islands were systematically arranged between the bainitic ferrites and accompanied by surface relief effect. This structure formed because the carbon quickly diffused away from the ferrite/austenite interface as compared to the upper bainite, and there was no simultaneous formation of interlath cementite [26]. Carbonenriched austenite regions are formed by rejecting of carbon from ferrite to austenite following the transformation of bainite ferrite. With further cooling down to room temperature, the retained austenite may completely or partially transform to martensite. The content of martensite naturally depends upon the content of carbon and the other alloying elements in the austenite and the cooling rate. The M/A phases exhibiting beam-like or granular morphology were parallel to each other in the prior-austenite grains. Both FGHAZ and ICHAZ consist of ferrite and pearlite. During heating of FGHAZ and ICHAZ, austenitizing occurred when the temperature reached above Ac1. Then the austenite was transformed to ferrite (F) and pearlite (P), which resulted in the microstructure of FGHAZ and ICHAZ as shown in Figure 1c,d, respectively.
Figure 1b also shows that the grain size of CGHAZ is larger than that of BM, FGHAZ and ICHAZ. It is well known that peak temperature affects the microstructure by changing the austenite grain size [27]. The austenite grain size increases with peak temperature because the mobility of solute atoms at high temperature is higher than that of low temperature [28]. The diffusion rate of carbon atoms can be calculated according to an Arrhenius equation as follows [29,30]:
where D0 is the initial diffusion rate (6.2 × 10⁻⁷ m2∙s−1), Q is the diffusion activation energy (80 kJ∙mol−1), R is the ideal gas constant (8.31 J∙mol−1∙K−1) and T is the absolute temperature. As a result, the CGHAZ with the highest peak temperature had the largest diffusion rate. The CGHAZ had the largest grain size as shown in Figure 1. The grain of FGHAZ was even refined due to fast cooling rate when austenite transformed to ferrite and pearlite.
D = D0 exp(−Q∙R−1∙T−1)
In addition, the micro-hardness of CGHAZ was the highest which was the result of the existence of GB. The grain size and micro-hardness of BM, FGHAZ and ICHAZ were at the same level.
3.2. Corrosion Behavior
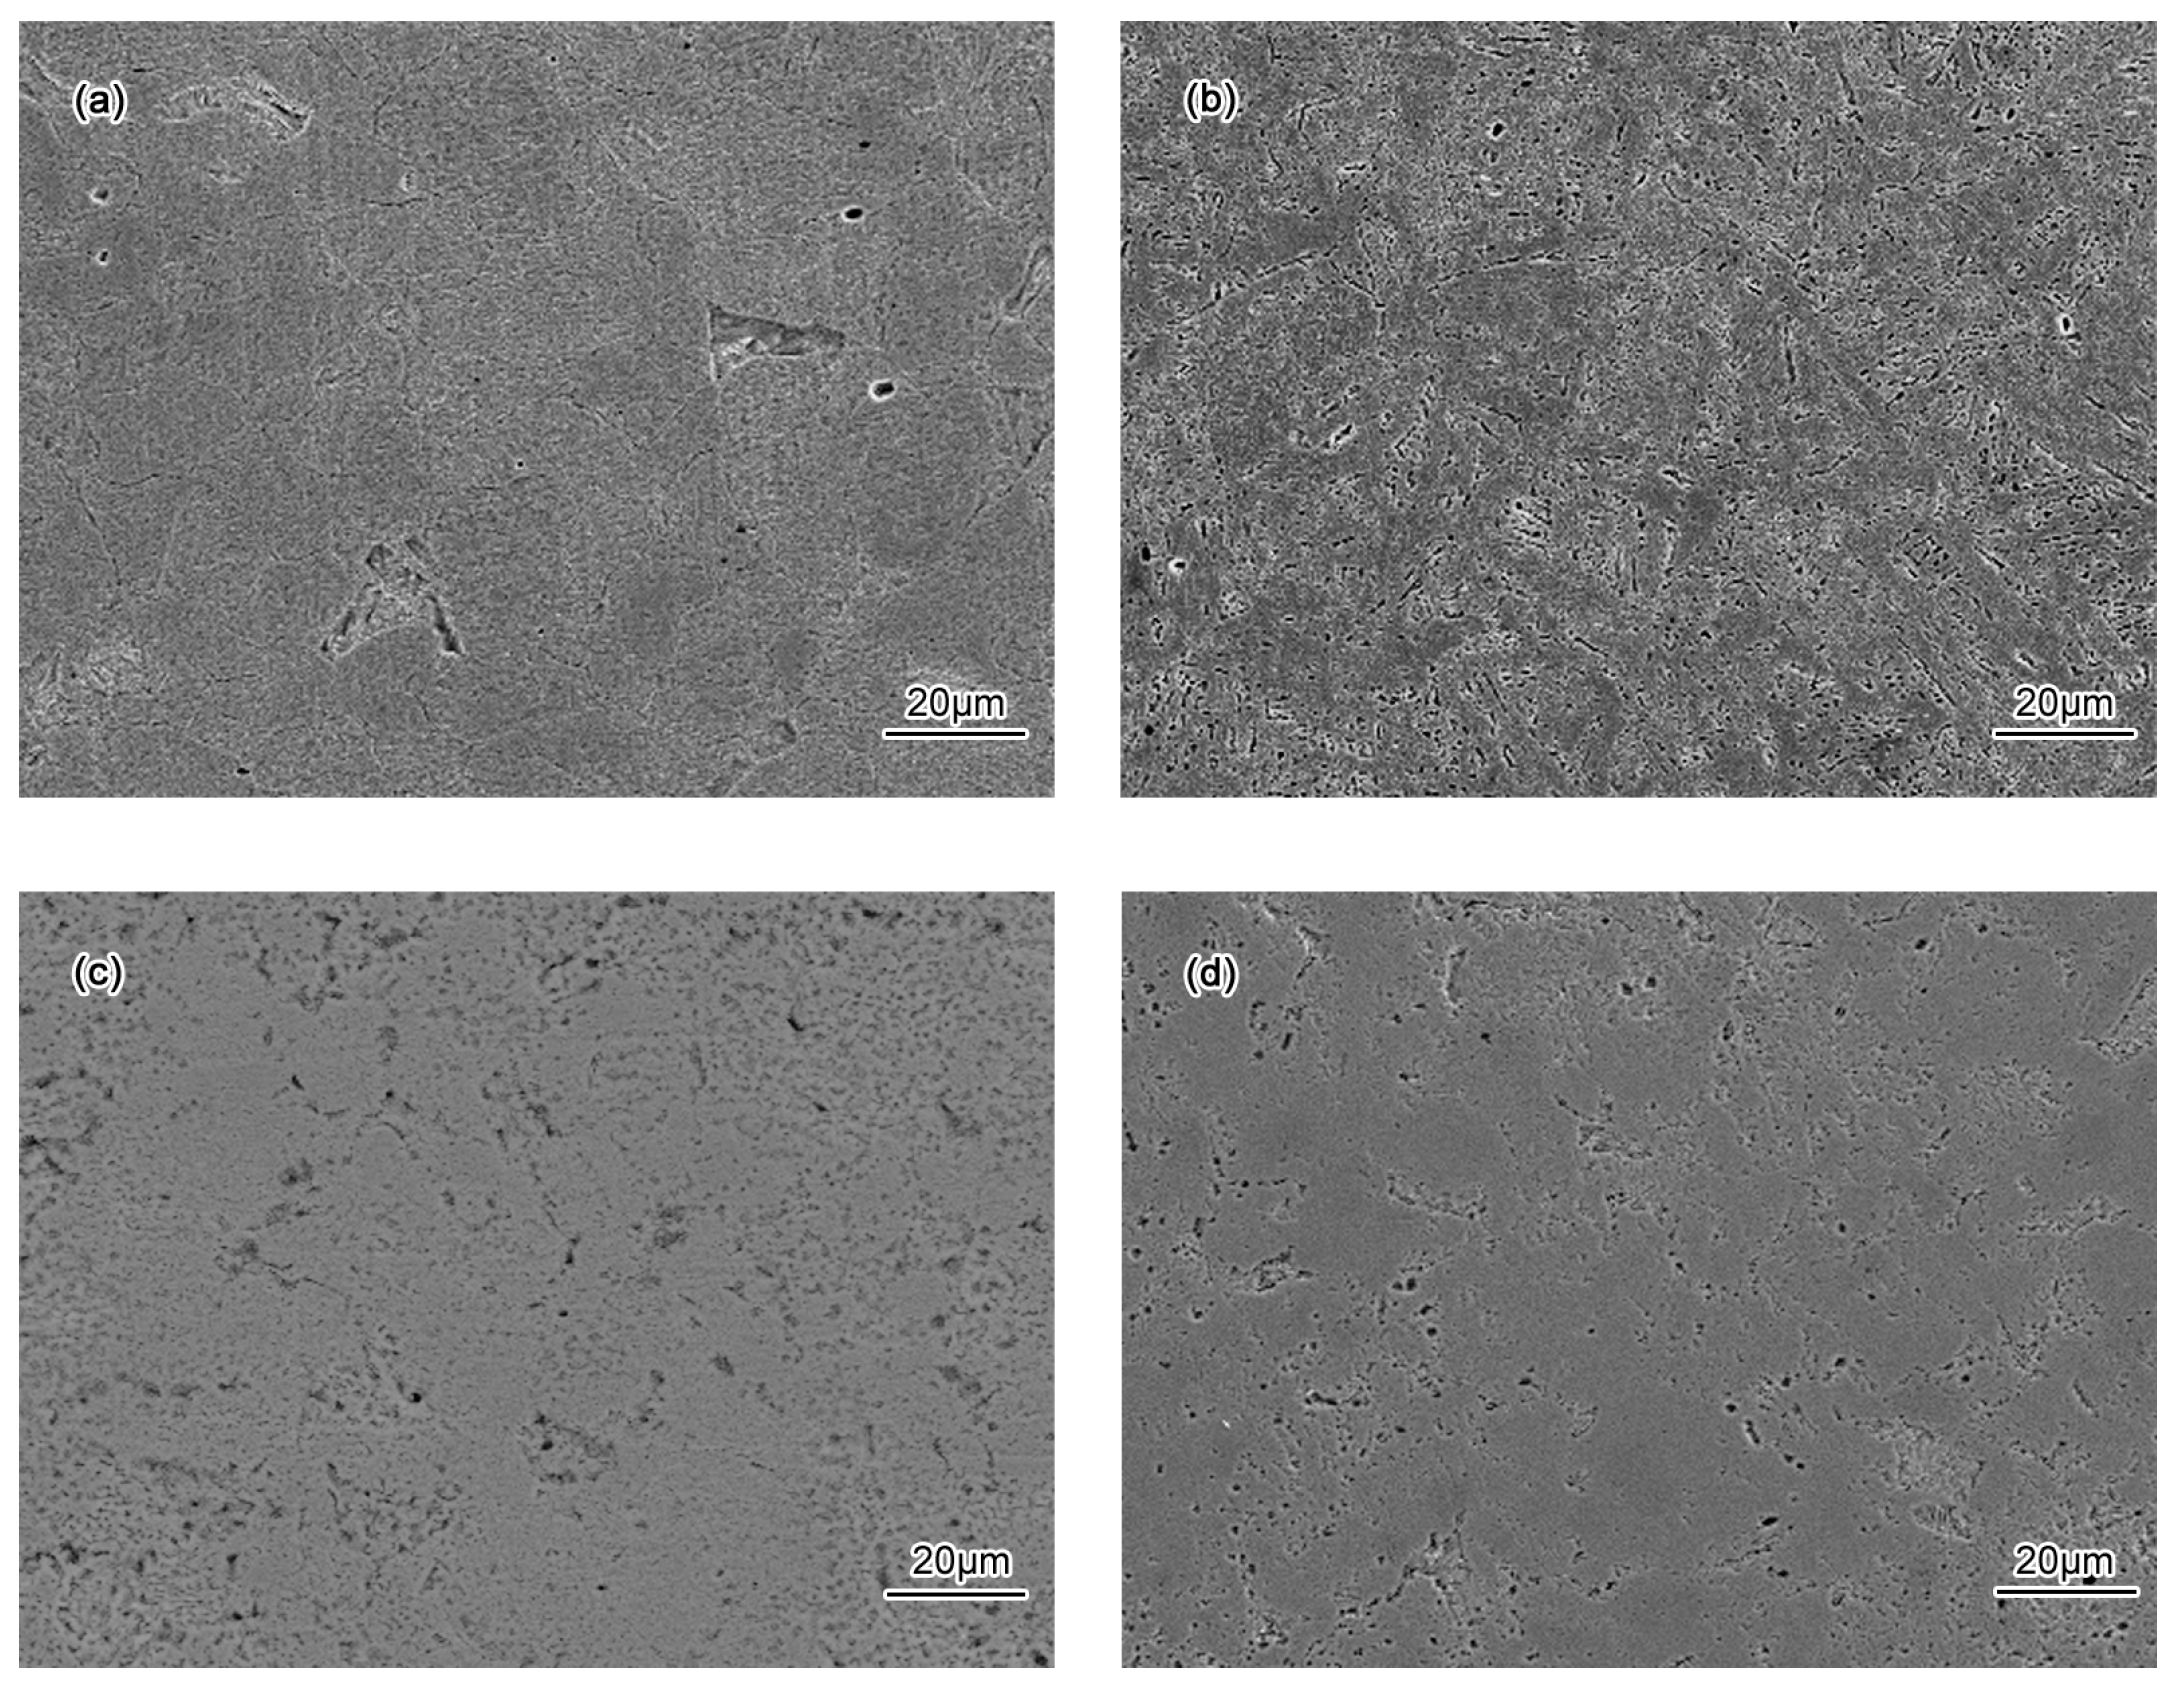
The biggest challenge in corrosion research is to accurately predict how materials will dissolve in a given environment [31]. In this paper, the corrosion behaviors of the specimens were studied through observing the surface morphology after different corrosion time. The SEM images of the surface of BM and HAZ immersed in 50 wt % H2SO4 solution for different time are shown in Figure 3, Figure 4 and Figure 5. As shown in Figure 3a, dense oxide film were formed on part of the surface of BM after immersion for 4 h, mainly on the surface of ferrite zone. There were even micro voids rather than dense oxide film on the surface of pearlite zone. The pearlite without the dense oxide film was corroded more seriously. As a result, the oxide film with micro voids was formed on pearlite after immersion for 12 h as shown in Figure 4a. The porous-structured corrosion product was formed on the surface of the BM after immersion for 72 h as shown in Figure 5a. There was oxide film formed on the surface of CGHAZ throughout the corrosion process as shown in Figure 3b and Figure 4b. The oxide film formed on the surface of CGHAZ was not dense and can not inhibit the corrosion well. A rod-shaped corrosion product was formed on the surface of CGHAZ after immersion for 72 h as shown in Figure 5b. The corrosion product of the FGHAZ is similar to that of the BM, but the surface of the FGHAZ corroded for 72 h was rougher with deeper holes. There was almost no difference in the surface morphology, size and density of the corrosion product between BM and ICHAZ.
The difference in corrosion product between BM and CGHAZ means that BM and CGHAZ have undergone the different corrosion processes. Some studies on the dissolution of steel in acidic solutions have been undertaken showing that anodic reaction is the oxidation of steel [32]. The passive film (dense oxide film) was formed on the surface of BM due to concentrated sulfuric acid solution. However, the dense oxide film was almost formed on the surface of ferrite zone in the initial stage of corrosion. The film inhibited the corrosion of ferrite. Then the pearlite of BM was preferentially corroded acting as an anode in the corrosion reaction. The original grain boundaries of BM were still obvious after 12 h corrosion as shown in Figure 4b. Under the condition of continuous corrosion, the pearlite zone of BM was severely corroded and the oxide film formed on the ferrite zone was partly dissolved. As a result, the porous-structured corrosion product as shown in Figure 5a was formed. The SEM images of FGHAZ and ICHAZ as shown in Figure 3, Figure 4 and Figure 5 suggested that FGHAZ and ICHAZ underwent the similar corrosion process to BM. There was oxide film formed on the surface of CGHAZ after immersion for 4 h in 50 wt % H2SO4 solution. The oxide film formed on the surface of CGHAZ was sparser than the oxide film formed on the surface of BM as shown in Figure 4b, which may result in more severe corrosion process in CGHAZ. The rod-shaped corrosion product was formed on the surface of CGHAZ after immersion for 72 h as shown in Figure 5b, which may be resulted from the preferential growth of corrosion product on the surface.
The corrosion product formed on the surface of electrodes usually inhibited the corrosion process. However, the porous and rod-shaped structure may have negative effects upon inhibiting corrosion. Moreover, the porous-structured corrosion product may exhibit better performances in inhibiting corrosion than the rod-shaped corrosion product did because the compactness of the porous-structured corrosion product was higher than that of the rod-shaped corrosion product.
3.3. Electrochemical Characteristics in H2SO4 solution
The open circuit potential (OCP) of different electrodes at the initial immersion stages (after 10 min) are shown in Table 2. It can be found that the OCP of the BM is lowest, and the OCP of CGHAZ is slightly higher than that of FGHAZ and ICHAZ. It is indicated that the electrode potential of Q315NS can be turned positive after experiencing welding thermal cycle.
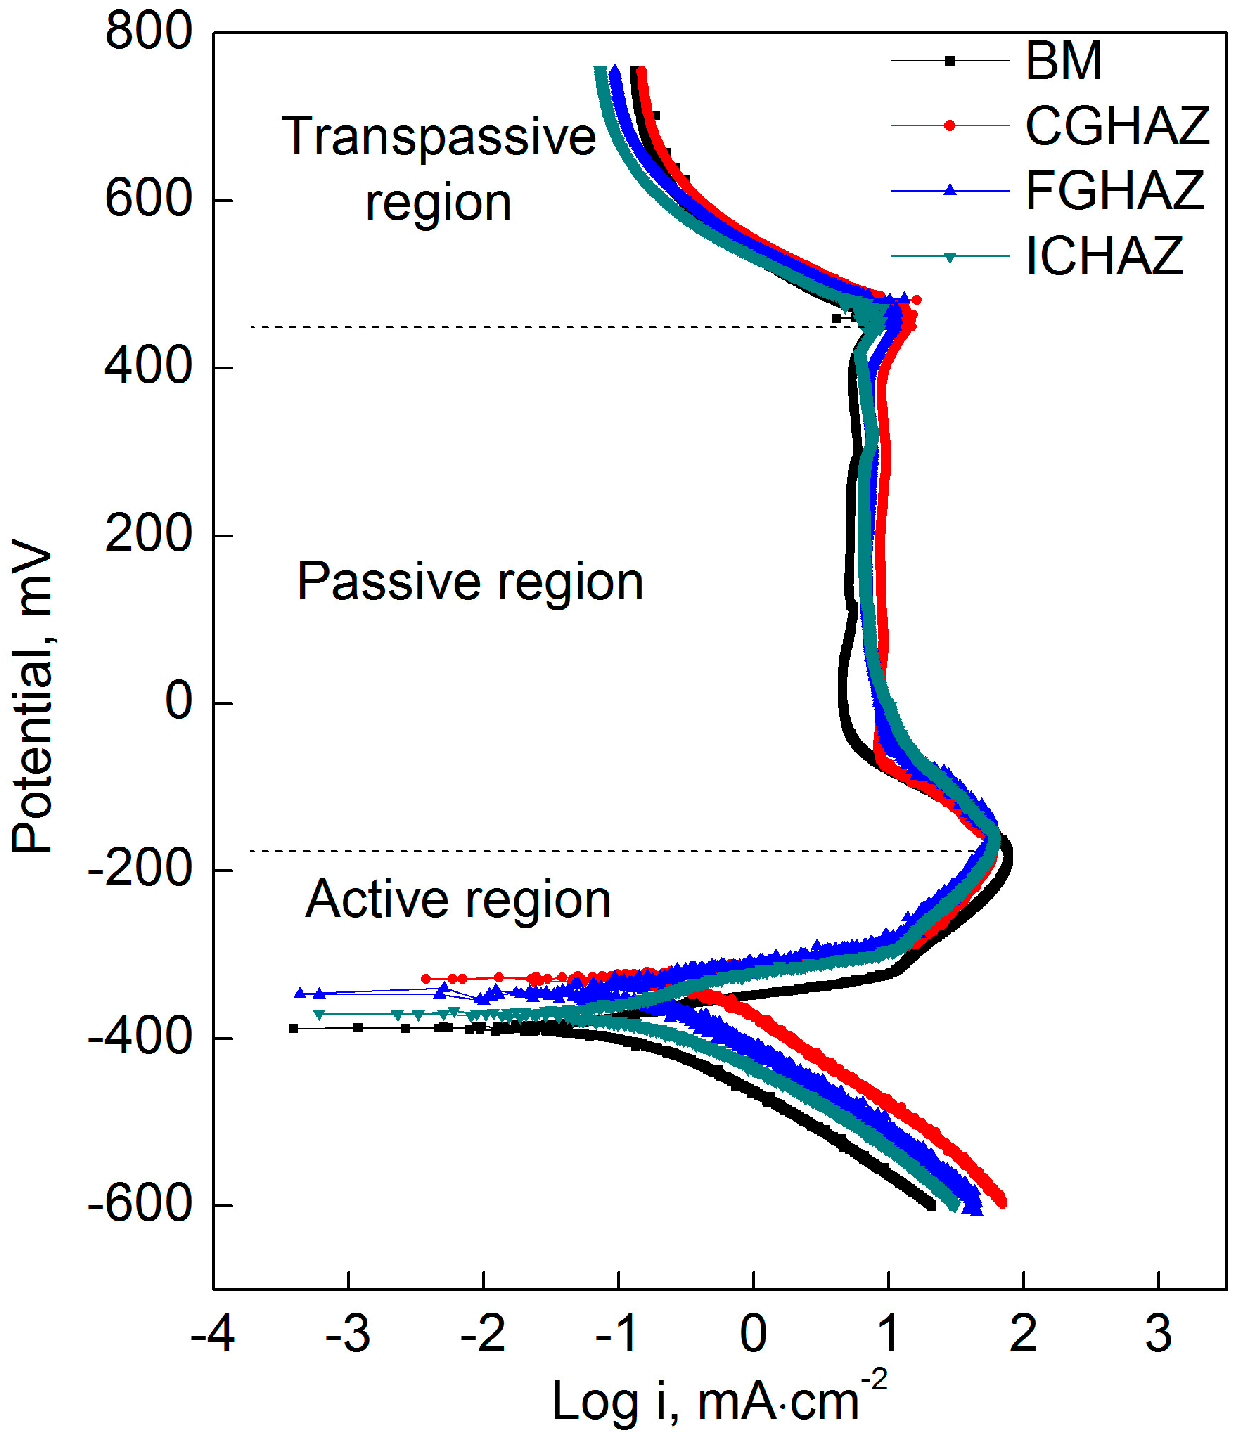
The polarization curves of BM, CGHAZ, FGHAZ and ICHAZ in 50 wt % H2SO4 solution are shown in Figure 6. It can be seen that the shape of the cathode polarization curves of all the specimens was basically the same and the slope had no significant difference. It was indicated that they had undergone a similar polarization process during cathodic polarization. Generally, hydrogen was generated in the cathodic polarization of steel under strong acid condition [33,34]. The anodic polarization curves can be divided into three regions: active region, passive region and transpassive region. In active region, the anode current density increased rapidly with the increase of the scanning potential. In passive region, the anode current density obviously decreased firstly, which indicated that the passive film started to be formed in this region. Then the anode current density got steady rather than fluctuated indicating that the passive film was able to prevent deepening corrosion. In transpassive region, the anode current density obviously decreased again with the increase of the scanning potential, which meant that the secondary passivation process occurred.
Electrochemical parameters including corrosion potential Ecorr (mV), corrosion current density icorr (µA/cm2), cathodic Tafel slopes βc (mV/dec), anodic Tafel slopes βa (mV/dec), passive potential Epp (mV), breakdown potential Eb (mV), passive current density ip (µA/cm2) and corrosion rate (mm/a) were calculated from the polarization curves and presented in Table 3 which provide more information about the kinetics of corrosion. The corrosion parameters were calculated by the method (Tafel Curve Fitting) proposed by Cao [35]. It can be found from Table 3 that Ecorr was at its lowest value for the BM while the Ecorr of CGHAZ was more positive than the others, which is consistent with the OCP values. In addition, the CGHAZ has the highest icorr while icorr of BM, FGHAZ, ICHAZ were about at the same level with the maximum difference of no more than 25%. It may be contributed to the different passivation process occurred in CGHAZ and the other specimens. The CGHAZ had the highest ip with the lowest Eb indicating the lowest stability of the passive film of CGHAZ. The corrosion resistance of CGHAZ was suggested to be the poorest by the above analysis while the corrosion resistance of BM was the greatest.
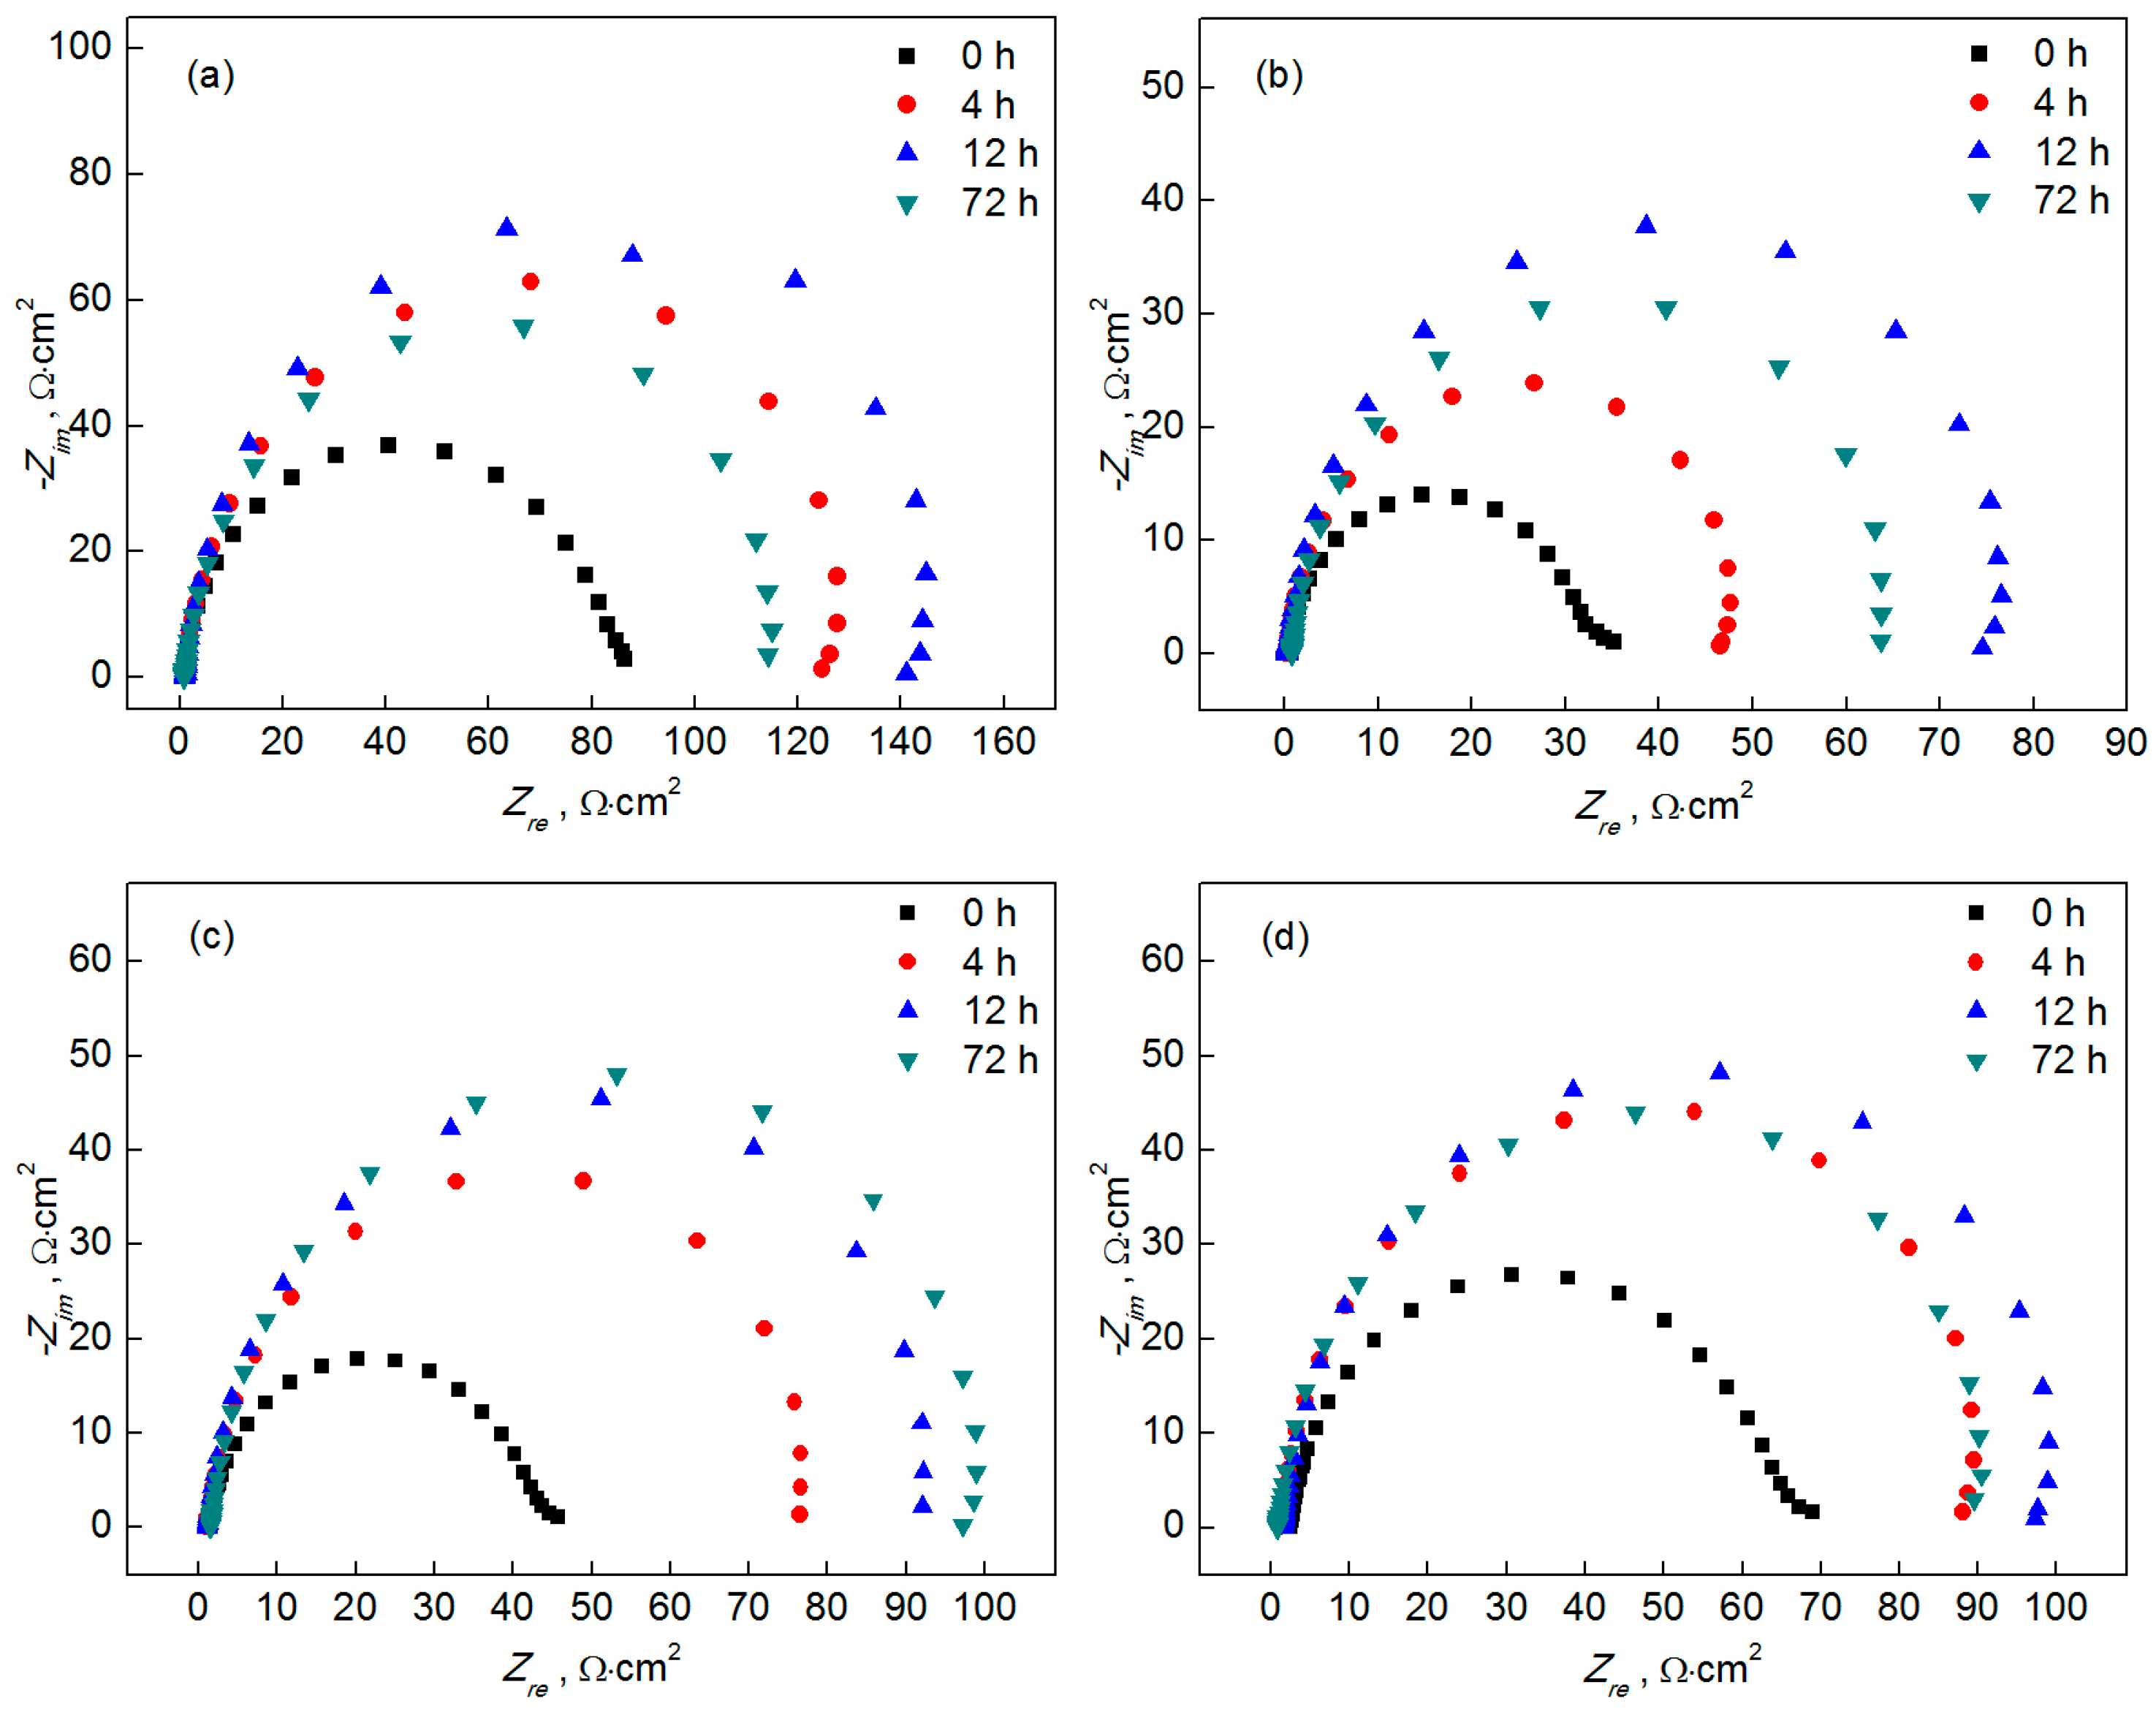
To further reveal the corrosion mechanism of the BM and HAZ of Q315NS in 50 wt % H2SO4 solution, EIS tests were carried out to acquire more information about the corrosion process at the open circuit potentials. Nyquist plots for the BM and simulated welding HAZ immersed in 50 wt % H2SO4 solutions for different time are shown in Figure 7. It was shown that the plot was one single semi-circular without obvious Warburg-type diffusion, which suggested that the corrosion of all specimens in 50 wt % H2SO4 solutions was mostly dependent upon charge transfer processes [36]. The radius of the Nyquist plot curves increased along the immersion time, which indicated the corrosion resistance increased.
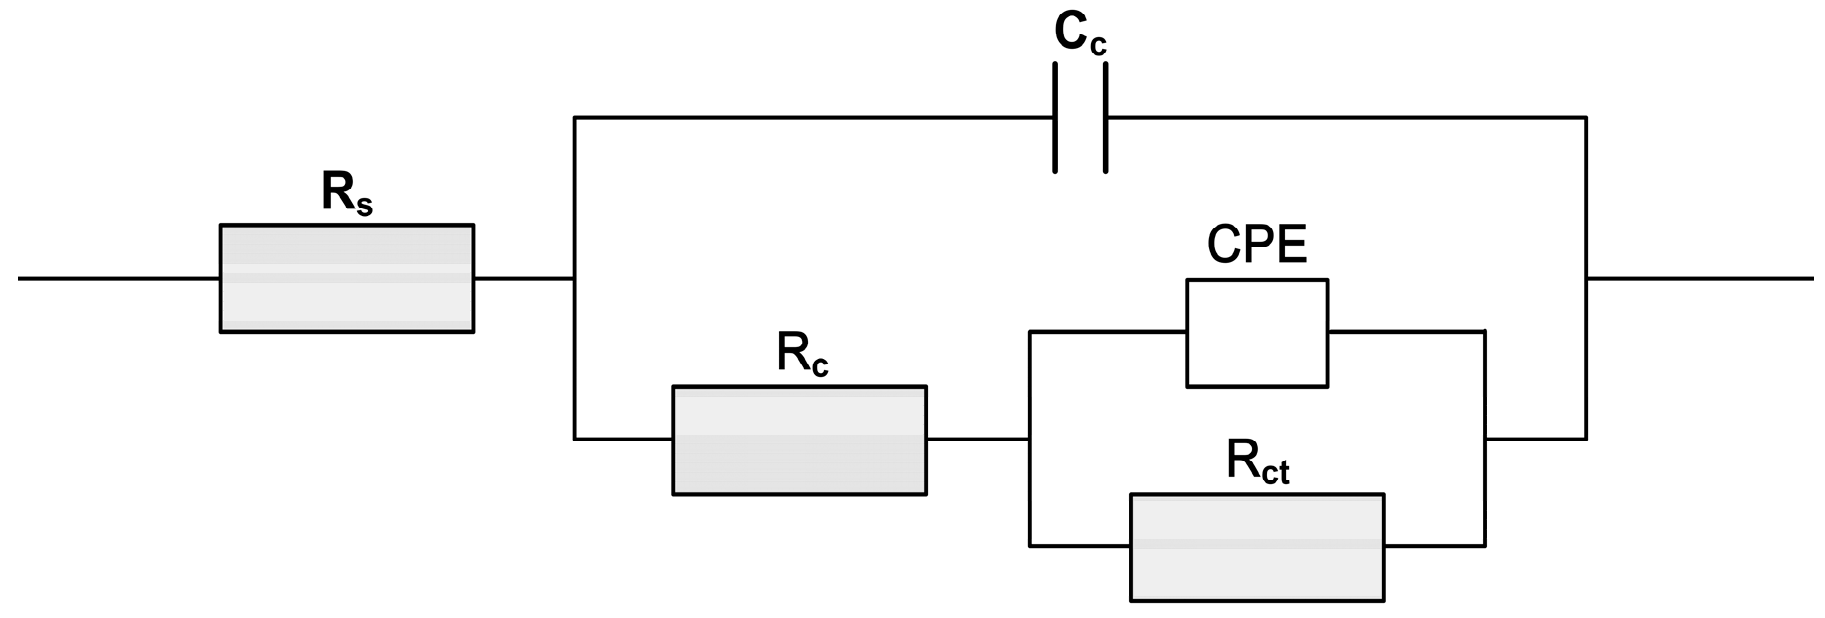
Furthermore, the equivalent circuit as shown in Figure 8 was adopted to simulate the solid/liquid interface of electrodes immersed in 50 wt % H2SO4 solution. This circuit was used by M. Shirinzadeh Dastgir et al. in 1 M H2SO4 solution to investigate the corrosion behaviors of the welded joint of AISI 1518 low carbon steel pipeline [14]. Rs, Rc, Cc and Rct represented the solution resistance, the resistance owing to the corrosion product formed on the surface, the capacitance of corrosion product and the charge transfer resistance. Constant phase element (CPE) was used for the double layer to account for the interfacial heterogeneities [37].
Table 4 presented the electrochemical parameters calculated by ZSimpWin (3.30d, Echem Software, Ann Arbor, MI, USA, 2004) for EIS data obtained after different immersion time. It was be found that Rct was obviously greater than Rc and Rs meaning the corrosion of all specimens in 85 wt % H2SO4 solution was mainly controlled by charge transfer process [38,39]. The Rct of BM, CGHAZ, FGHAZ and ICHAZ increased during the first 12 hours and then declined slowly. The increasing of Rct indicated that the increasing of the corrosion product layer blocks the ion and charge transport effectively, increases the electrochemical reaction impedance, and improves the corrosion resistance [40]. The Rct declined slowly duo to the erosion of corrosion product besides the growth of corrosion product. The value of Cc is closely related to the morphology of corrosion product layer. The value of Cc gets smaller as the layer gets denser. On the contrary, the higher Cc means looser corrosion product layer [41]. The Cc of CGHAZ was the biggest and correspond to the loosest corrosion product layer. The CGHAZ also showed the lowest Rc and the highest Y0 of CPE while Rc and Y0 were at the same level, respectively, for BM, FGHAZ and ICHAZ. This observation indicated that there were differences in corrosion product and the electrical double layer between CGHAZ and the other zones including BM, FGHAZ and ICHAZ.
4. Conclusions
This work investigates the microstructure and corrosion resistance of simulated welding HAZ of Q315NS steel in 50 wt % H2SO4 solution. The main conclusions drawn based on the experimental results are as follows:
- (1)
- The BM, FGHAZ and ICHAZ consisted of ferrite and pearlite, whereas the microstructure in the CGHAZ was mainly granular bainite. The CGHAZ has the highest microhardness and the largest average grain size due to the highest peak temperature.
- (2)
- Passivation process occured in all specimens in 50 wt % H2SO4 solution. A porous structure product was formed on the surface of the BM while a rod-shaped structure corrosion product was formed on CGHAZ after immersion for 72 h in 50 wt % H2SO4 solution.
- (3)
- All specimens underwent the similar polarization process. The electrochemical tests showed that the corrosion current density of CGHAZ was the largest while the corrosion current density of BM was the lowest.
- (4)
- The corrosion process of all specimens was mainly controlled by charge transportation process. The charge transfer resistance of BM and CGHAZ were the greatest and the weakest respectively. The corrosion product of CGHAZ had the biggest capacitance due to the loosest distribution character.
Acknowledgments
The authors are grateful for the support of the Harbin Institute of Technology Innovation Fund (No. IDGA18102104).
Author Contributions
Suqiang Zhang was the first author of the manuscript, took part in every step of the research and wrote the main part of the paper. Fengyuan Shu suggested the research method and finished paper modification. Hongyun Zhao, Guodong Wang had provided us with financial support for the research and conducted the research subject. Wenxiong He had finished the welding thermal simulation experiment and analysis to investigate the microstructure.
Conflicts of Interest
The authors declare no conflict of interest.
References
- Lins, V.F.C.; Guimarães, E.M. Failure of a heat exchanger generated by an excess of SO2 and H2 in the sulfur recovery unit of a petroleum refinery. J. Loss Prev. Process Ind. 2007, 20, 91–97. [Google Scholar] [CrossRef]
- Cheng, X.Q.; Sun, F.L.; Lv, S.J.; Li, X.G. A new steel with good low-temperature sulfuric acid dew point corrosion resistance. Mater. Corros. 2012, 63, 598–606. [Google Scholar] [CrossRef]
- Yang, Y.G.; Zhang, T.; Shao, Y.W.; Meng, G.Z.; Wang, F.H. In situ study of dew point corrosion by electrochemical measurement. Corros. Sci. 2013, 71, 62–71. [Google Scholar] [CrossRef]
- Wang, Y.G.; Ma, H.D.; Liang, Z.Y.; Chen, H.; Zhao, Q.X.; Jin, X. Experimental study on dew point corrosion characteristics of the heating surface in a 65 t/h biomass-fired circulating fluidized bed boiler. Appl. Therm. Eng. 2016, 96, 76–82. [Google Scholar] [CrossRef]
- Luk-Cyr, J.; El-Bawab, R.; Champliaud, H.; Lanteigne, J.; Vadean, A. Mechanical properties of 75% Ar/25% CO2 flux-cored arc welded E309L austenitic stainless steel. Mat. Sci. Eng. A 2016, 678, 197–203. [Google Scholar] [CrossRef]
- Haugen, V.G.; Rogne, B.R.S.; Akselsen, O.M.; Thaulow, C.; Østby, E. Local mechanical properties of intercritically reheated coarse grained heat affected zone in low alloy steel. Mater. Des. 2014, 59, 135–140. [Google Scholar] [CrossRef]
- You, Y.; Shang, C.J.; Chen, L.; Subramanian, S. Investigation on the crystallography of the transformation products of reverted austenite in intercritically reheated coarse grained heat affected zone. Mater. Des. 2013, 43, 485–491. [Google Scholar] [CrossRef]
- Li, X.D.; Fan, Y.R.; Ma, X.P.; Subramanian, S.V.; Shang, C.J. Influence of Martensite–Austenite constituents formed at different intercritical temperatures on toughness. Mater. Des. 2015, 67, 457–463. [Google Scholar] [CrossRef]
- Li, X.D.; Ma, X.P.; Subramanian, S.V.; Shang, C.J.; Misra, R.D.K. Influence of prior austenite grain size on martensite–austenite constituent and toughness in the heat affected zone of 700 MPa high strength linepipe steel. Mat. Sci. Eng. A 2014, 616, 141–147. [Google Scholar] [CrossRef]
- Kim, S.; Kang, D.; Kim, T.W.; Lee, J.; Lee, C. Fatigue crack growth behavior of the simulated HAZ of 800 MPa grade high-performance steel. Mater. Sci. Eng. A 2011, 528, 2331–2338. [Google Scholar] [CrossRef]
- Moeinifar, S.; Kokabi, A.H.; Hosseini, H.R.M. Influence of peak temperature during simulation and real thermal cycles on microstructure and fracture properties of the reheated zones. Mater. Des. 2010, 31, 2948–2955. [Google Scholar] [CrossRef]
- Wang, X.L.; Wang, X.M.; Shang, C.J.; Misra, R.D. K Characterization of the multi-pass weld metal and the impact of retained austenite obtained through intercritical heat treatment on low temperature toughness. Mater. Sci. Eng. A 2016, 649, 282–292. [Google Scholar] [CrossRef]
- Zhu, Z.X.; Kuzmikova, L.; Li, H.J.; Barbaro, F. Effect of inter-critically reheating temperature on microstructure and properties of simulated inter-critically reheated coarse grained heat affected zone in X70 steel. Mater. Sci. Eng. A 2014, 605, 8–13. [Google Scholar] [CrossRef]
- Dastgiri, M.S.; Mohammadi, J.; Behnamian, Y.; Eghlimi, A.; Mostafaei, A. Metallurgical investigations and corrosion behavior of failed weld joint in AISI 1518 low carbon steel pipeline. Eng. Fail. Anal. 2015, 53, 78–96. [Google Scholar] [CrossRef]
- Tan, W.; Xu, B.S.; Han, W.A.; Feng, S.W.; Feng, J.L.; Zhong, Q.P. HAZ corrosion of 22SiMn2TiB ultra-strength steel weldment in 3.5% NaCl solution. Acta. Metall. Sin. 2004, 40, 197–201. [Google Scholar] [CrossRef]
- Zhang, G.A.; Cheng, Y.F. Micro-electrochemical characterization of corrosion of welded X70 pipeline steel in near-neutral pH solution. Corros. Sci. 2009, 51, 1714–1724. [Google Scholar] [CrossRef]
- Zhang, G.A.; Cheng, Y.F. Micro-electrochemical characterization and Mott–Schottky analysis of corrosion of welded X70 pipeline steel in carbonate/bicarbonate solution. Electrochim. Acta 2009, 55, 316–324. [Google Scholar] [CrossRef]
- Bordbar, S.; Alizadeh, M.; Hashemi, S.H. Effects of microstructure alteration on corrosion behavior of welded joint in API X70 pipeline steel. Mater. Des. 2013, 45, 597–604. [Google Scholar] [CrossRef]
- Eliyan, F.F.; Alfantazi, A. Corrosion of the Heat-Affected Zones (HAZs) of API-X100 pipeline steel in dilute bicarbonate solutions at 90 °C—An electrochemical evaluation. Corros. Sci. 2013, 74, 297–307. [Google Scholar] [CrossRef]
- Yu, X.H.; Caron, J.L.; Babu, S.S.; Lippold, J.C.; Isheim, D.; Seidman, D.N. Characterization of microstructural strengthening in the heat-affected zone of a blast-resistant naval steel. Acta Mater. 2010, 58, 5596–5609. [Google Scholar] [CrossRef]
- Wang, Y.Y.; Kannan, R.; Li, L.J. Characterization of as-welded microstructure of heat-affected zone in modified 9Cr–1Mo–V–Nb steel weldment. Mater. Charact. 2016, 118, 225–234. [Google Scholar] [CrossRef]
- Hu, J.; Du, L.X.; Xie, H.; Dong, F.T.; Misra, R.D.K. Effect of weld peak temperature on the microstructure, hardness, and transformation kinetics of simulated heat affected zone of hot rolled ultra-low carbon high strength Ti–Mo ferritic steel. Mater. Des. 2014, 60, 302–309. [Google Scholar] [CrossRef]
- Hayat, F.; Uzun, H. Effect of heat treatment on microstructure mechanical properties and fracture behaviour of ship and dual phase steels, J. Iron Steel Res. Int. 2011, 18, 65–72. [Google Scholar] [CrossRef]
- Zhang, W.Y. Welding Metallurgy (Basic Principle); China Machine Press: Beijing, China, 1996; pp. 167–174. [Google Scholar]
- Cui, Z.Q.; Liu, B.X. Metallurgy and Treatment Theory, 3rd ed.; Harbin Institute of Technology Press: Harbin, China, 2007; pp. 206–209. [Google Scholar]
- Wang, L.W.; Liu, Z.Y.; Cui, Z.Y.; Du, C.W.; Wang, X.H.; Li, X.G. In situ corrosion characterization of simulated weld heat affected zone on API X80 pipeline steel. Corros. Sci. 2014, 85, 401–410. [Google Scholar] [CrossRef]
- Olasolo, M.; Uranga, P.; Rodriguez-Ibabe, J.M.; López, B. Effect of austenite microstructure and cooling rate on transformation characteristics in a low carbon Nb–V microalloyed steel. Mater. Sci. Eng. A 2011, 528, 2559–2569. [Google Scholar] [CrossRef]
- Moon, J; Lee, J.; Lee, C. Prediction for the austenite grain size in the presence of growing particles in the weld HAZ of Ti-microalloyed steel. Mater. Sci. Eng. A 2007, 459, 40–46. [Google Scholar] [CrossRef]
- Mittemeijer, E.J. Fundamentals of Materials Science: The Microstructure-Property Relationship Using Metals as Model Systems, 1st ed.; Springer: Heidelberg, Germany, 2010; pp. 349–354. [Google Scholar]
- Callister, W.D.; Rethwisch, D.G. Materials Science and Engineering: An Introduction, 8th ed.; John Wiley & Sons Inc.: Hoboken, NJ, USA, 2010; pp. 352–355. [Google Scholar]
- Li, X.G.; Zhang, D.W.; Liu, Z.Y.; Li, Z.; Du, C.W.; Dong, C.F. Materials science: Share corrosion data. Nature 2015, 527, 441–442. [Google Scholar] [CrossRef] [PubMed]
- Zhao, W.; Zou, Y.; Matsuda, K.; Zou, Z.D. Corrosion behaviour of reheated CGHAZ of X80 pipeline steel in H2S-containing environments. Mater. Des. 2016, 99, 44–56. [Google Scholar] [CrossRef]
- Liu, Z.Y.; Wang, C.P.; Du, C.W.; Li, X.G. Effect of applied potentials on stress corrosion cracting of X80 pipeline steel in simulated Yingtan soil solution. Acta. Metall. Sin. 2011, 47, 1434–1439. [Google Scholar] [CrossRef]
- Wang, Z.H; Huang, Y.H.; Li, J.; Yang, L.; Xie, D.H. Effect of Nb on corrosion behavior of simulated weld HAZs of X80 pipeline steel in simulated seawater environments corresponding to shallow sea and deep sea. J. Chin. Soc. Corros. Prot. 2016, 36, 604–610. [Google Scholar] [CrossRef]
- Cao, C.N. Principles of Electrochemisty of Corrosion, 3rd ed.; Chemical Industry Press: Beijing, China, 2008; pp. 74–79. [Google Scholar]
- Naderi, E.; Ehteshamzadeh, M.; Jafari, A.H.; Hosseini, M.G. Effect of carbon steel microstructure and molecular structure of two new Schiff base compounds on inhibition performance in 1 M HCl solution by DC, SEM and XRD studies. Mater. Chem. Phys. 2010, 120, 134–141. [Google Scholar] [CrossRef]
- Jüttner, K. Electrochemical impedance spectroscopy (EIS) of corrosion processes on inhomogeneous surfaces. Electrochim. Acta 1990, 35, 1501–1508. [Google Scholar] [CrossRef]
- Zhang, Q.B.; Hua, Y.X. Corrosion inhibition of mild steel by alkylimidazolium ionic liquids in hydrochloric acid. Electrochim. Acta 2009, 54, 1881–1887. [Google Scholar] [CrossRef]
- Achouri, M.E.; Kertit, S.; Gouttaya, H.M.; Nciri, B.; Bensouda, Y.; Perez, L.; Infante, M.R.; Elkacemi, K. Corrosion inhibition of iron in 1 M HCl by some gemini surfactants in the series of alkanediyl-α,ω-bis-(dimethyl tetradecyl ammonium bromide). Prog. Org. Coat. 2001, 43, 267–273. [Google Scholar] [CrossRef]
- Wang, X.X.; Gao, Y.M.; Li, K.; Yan, J.B.; Li, Y.F.; Feng, J.B. Effect of yttrium on the corrosion behaviour of 09CrCuSb alloy in concentrated sulphuric acid. Corros. Sci. 2013, 69, 369–375. [Google Scholar] [CrossRef]
- Wang, X.X.; Gao, Y.M.; Li, Y.F.; Yang, T. Effect of yttrium on the corrosion behavior of 09CrCuSb alloy in NaCl Solution. Corros. Sci. 2014, 87, 211–217. [Google Scholar] [CrossRef]
Figure 1.
Scanning electron microscope (SEM) images of base metal (BM) and simulated welding heat affected zone (HAZ) of Q315NS: (a) BM; (b) coarse grained region (CGHAZ); (c) fine grained region (FGHAZ); (d) inter critical region (ICHAZ).
Figure 1.
Scanning electron microscope (SEM) images of base metal (BM) and simulated welding heat affected zone (HAZ) of Q315NS: (a) BM; (b) coarse grained region (CGHAZ); (c) fine grained region (FGHAZ); (d) inter critical region (ICHAZ).
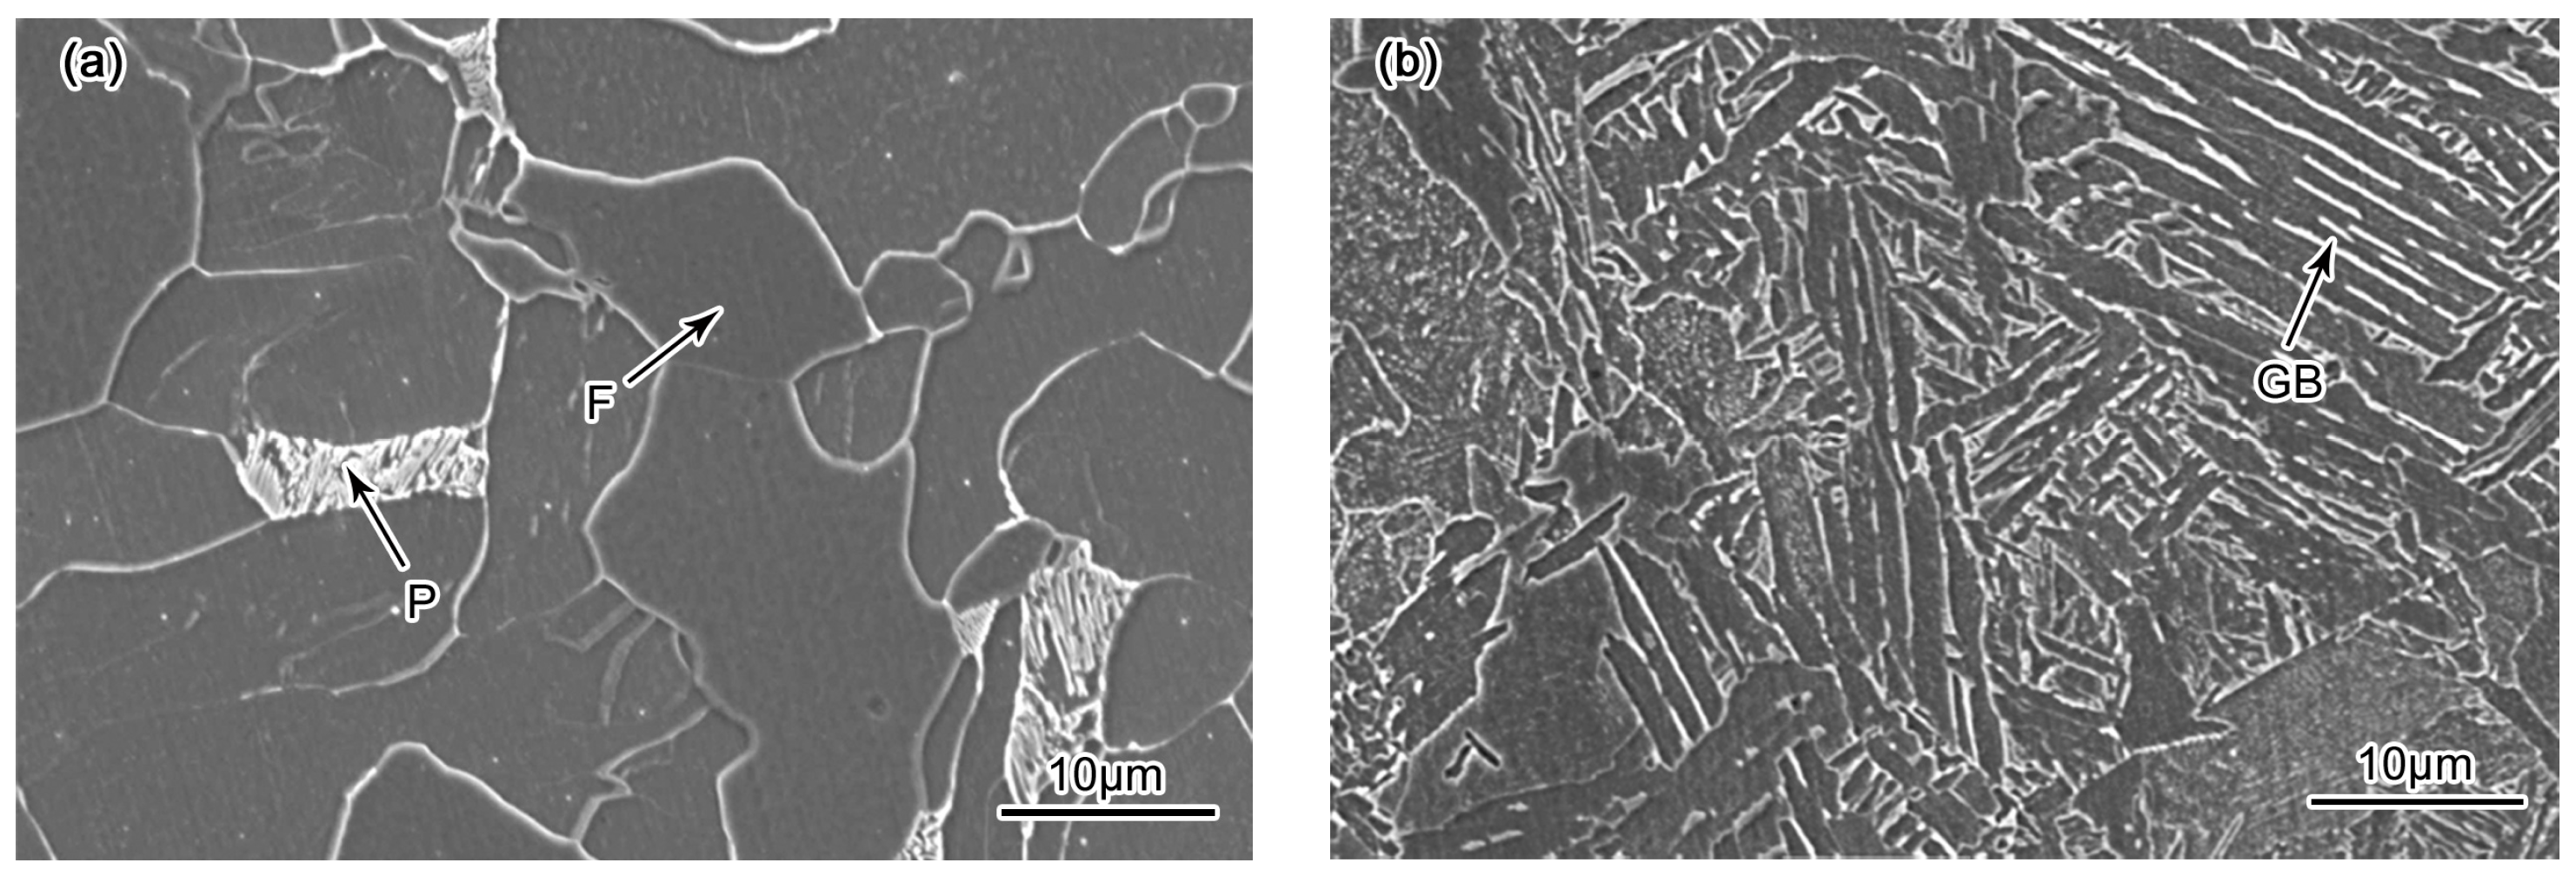

Figure 2.
The micro-hardness and average grain size of BM and simulated welding HAZ of Q315NS: (a) BM; (b) CGHAZ; (c) FGHAZ; (d) ICHAZ.
Figure 2.
The micro-hardness and average grain size of BM and simulated welding HAZ of Q315NS: (a) BM; (b) CGHAZ; (c) FGHAZ; (d) ICHAZ.
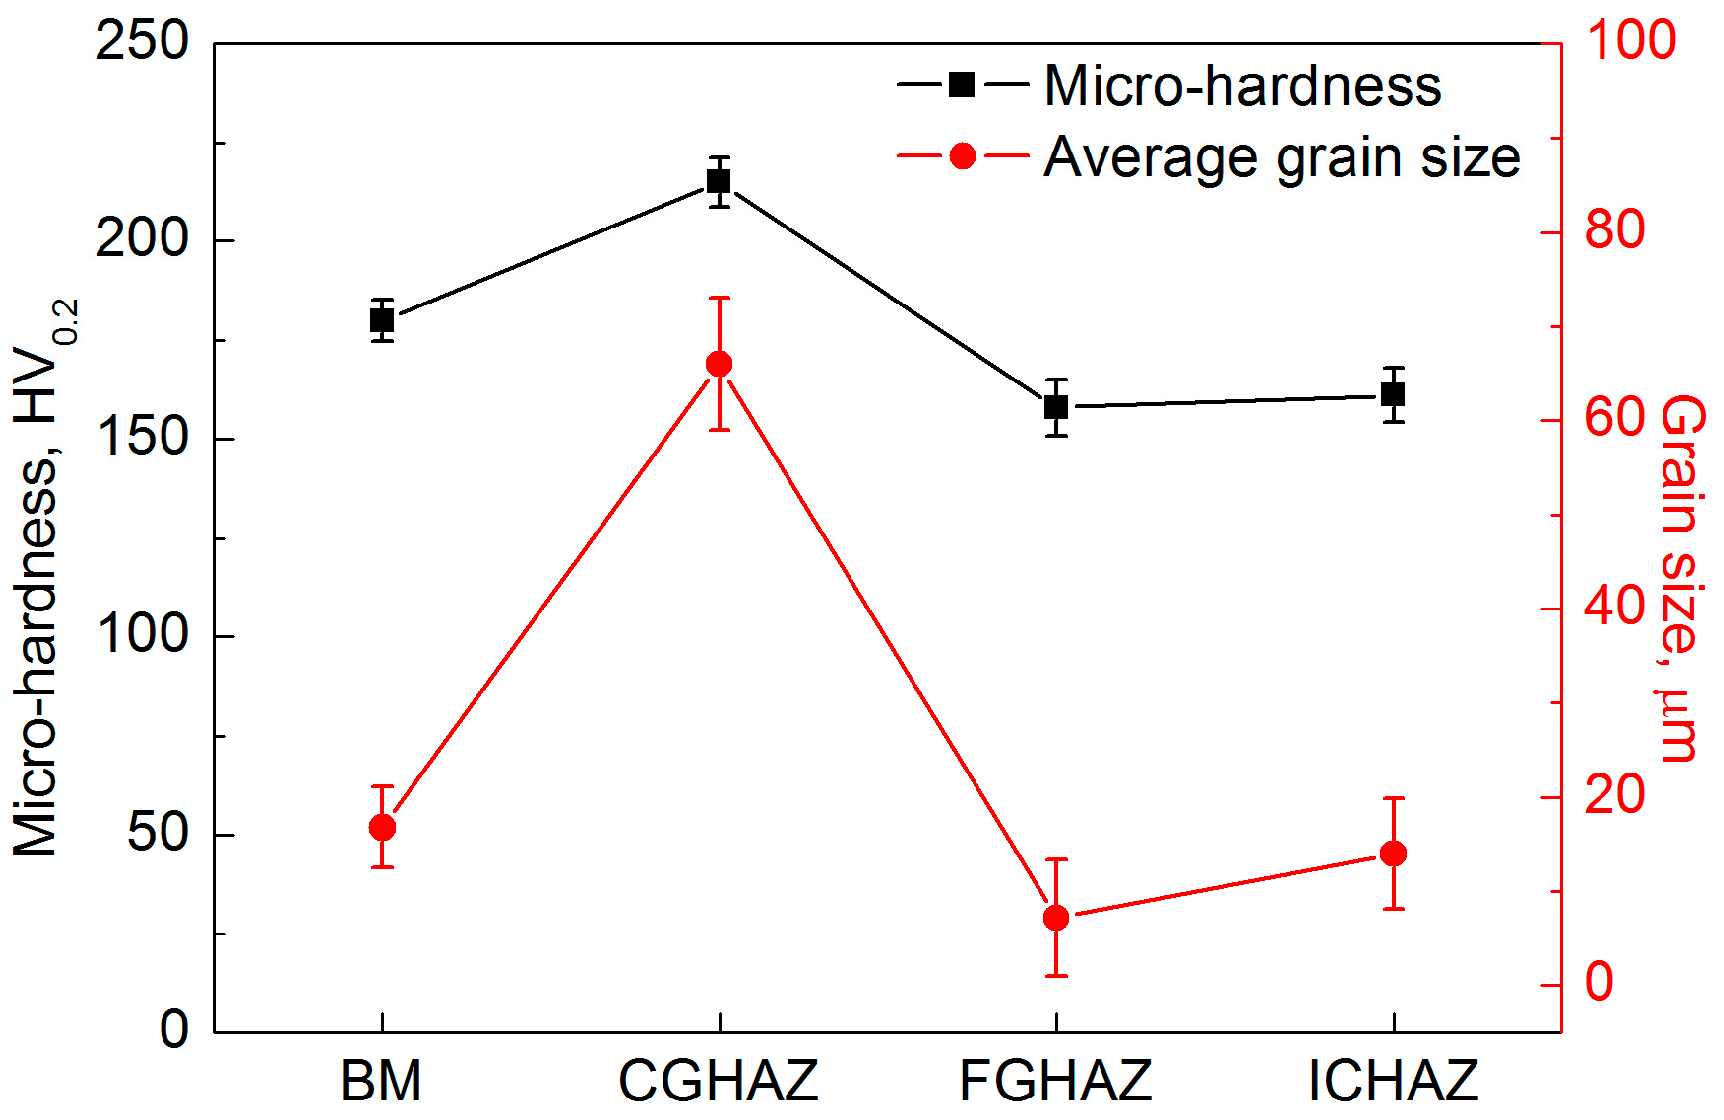
Figure 3.
SEM images of specimens after immersion for 4 h in 50 wt % H2SO4 solution: (a) BM; (b) CGHAZ; (c) FGHAZ; (d) ICHAZ.
Figure 3.
SEM images of specimens after immersion for 4 h in 50 wt % H2SO4 solution: (a) BM; (b) CGHAZ; (c) FGHAZ; (d) ICHAZ.

Figure 4.
SEM images of specimens after immersion for 12 h in 50 wt % H2SO4 solution: (a) BM; (b) CGHAZ; (c) FGHAZ; (d) ICHAZ.
Figure 4.
SEM images of specimens after immersion for 12 h in 50 wt % H2SO4 solution: (a) BM; (b) CGHAZ; (c) FGHAZ; (d) ICHAZ.
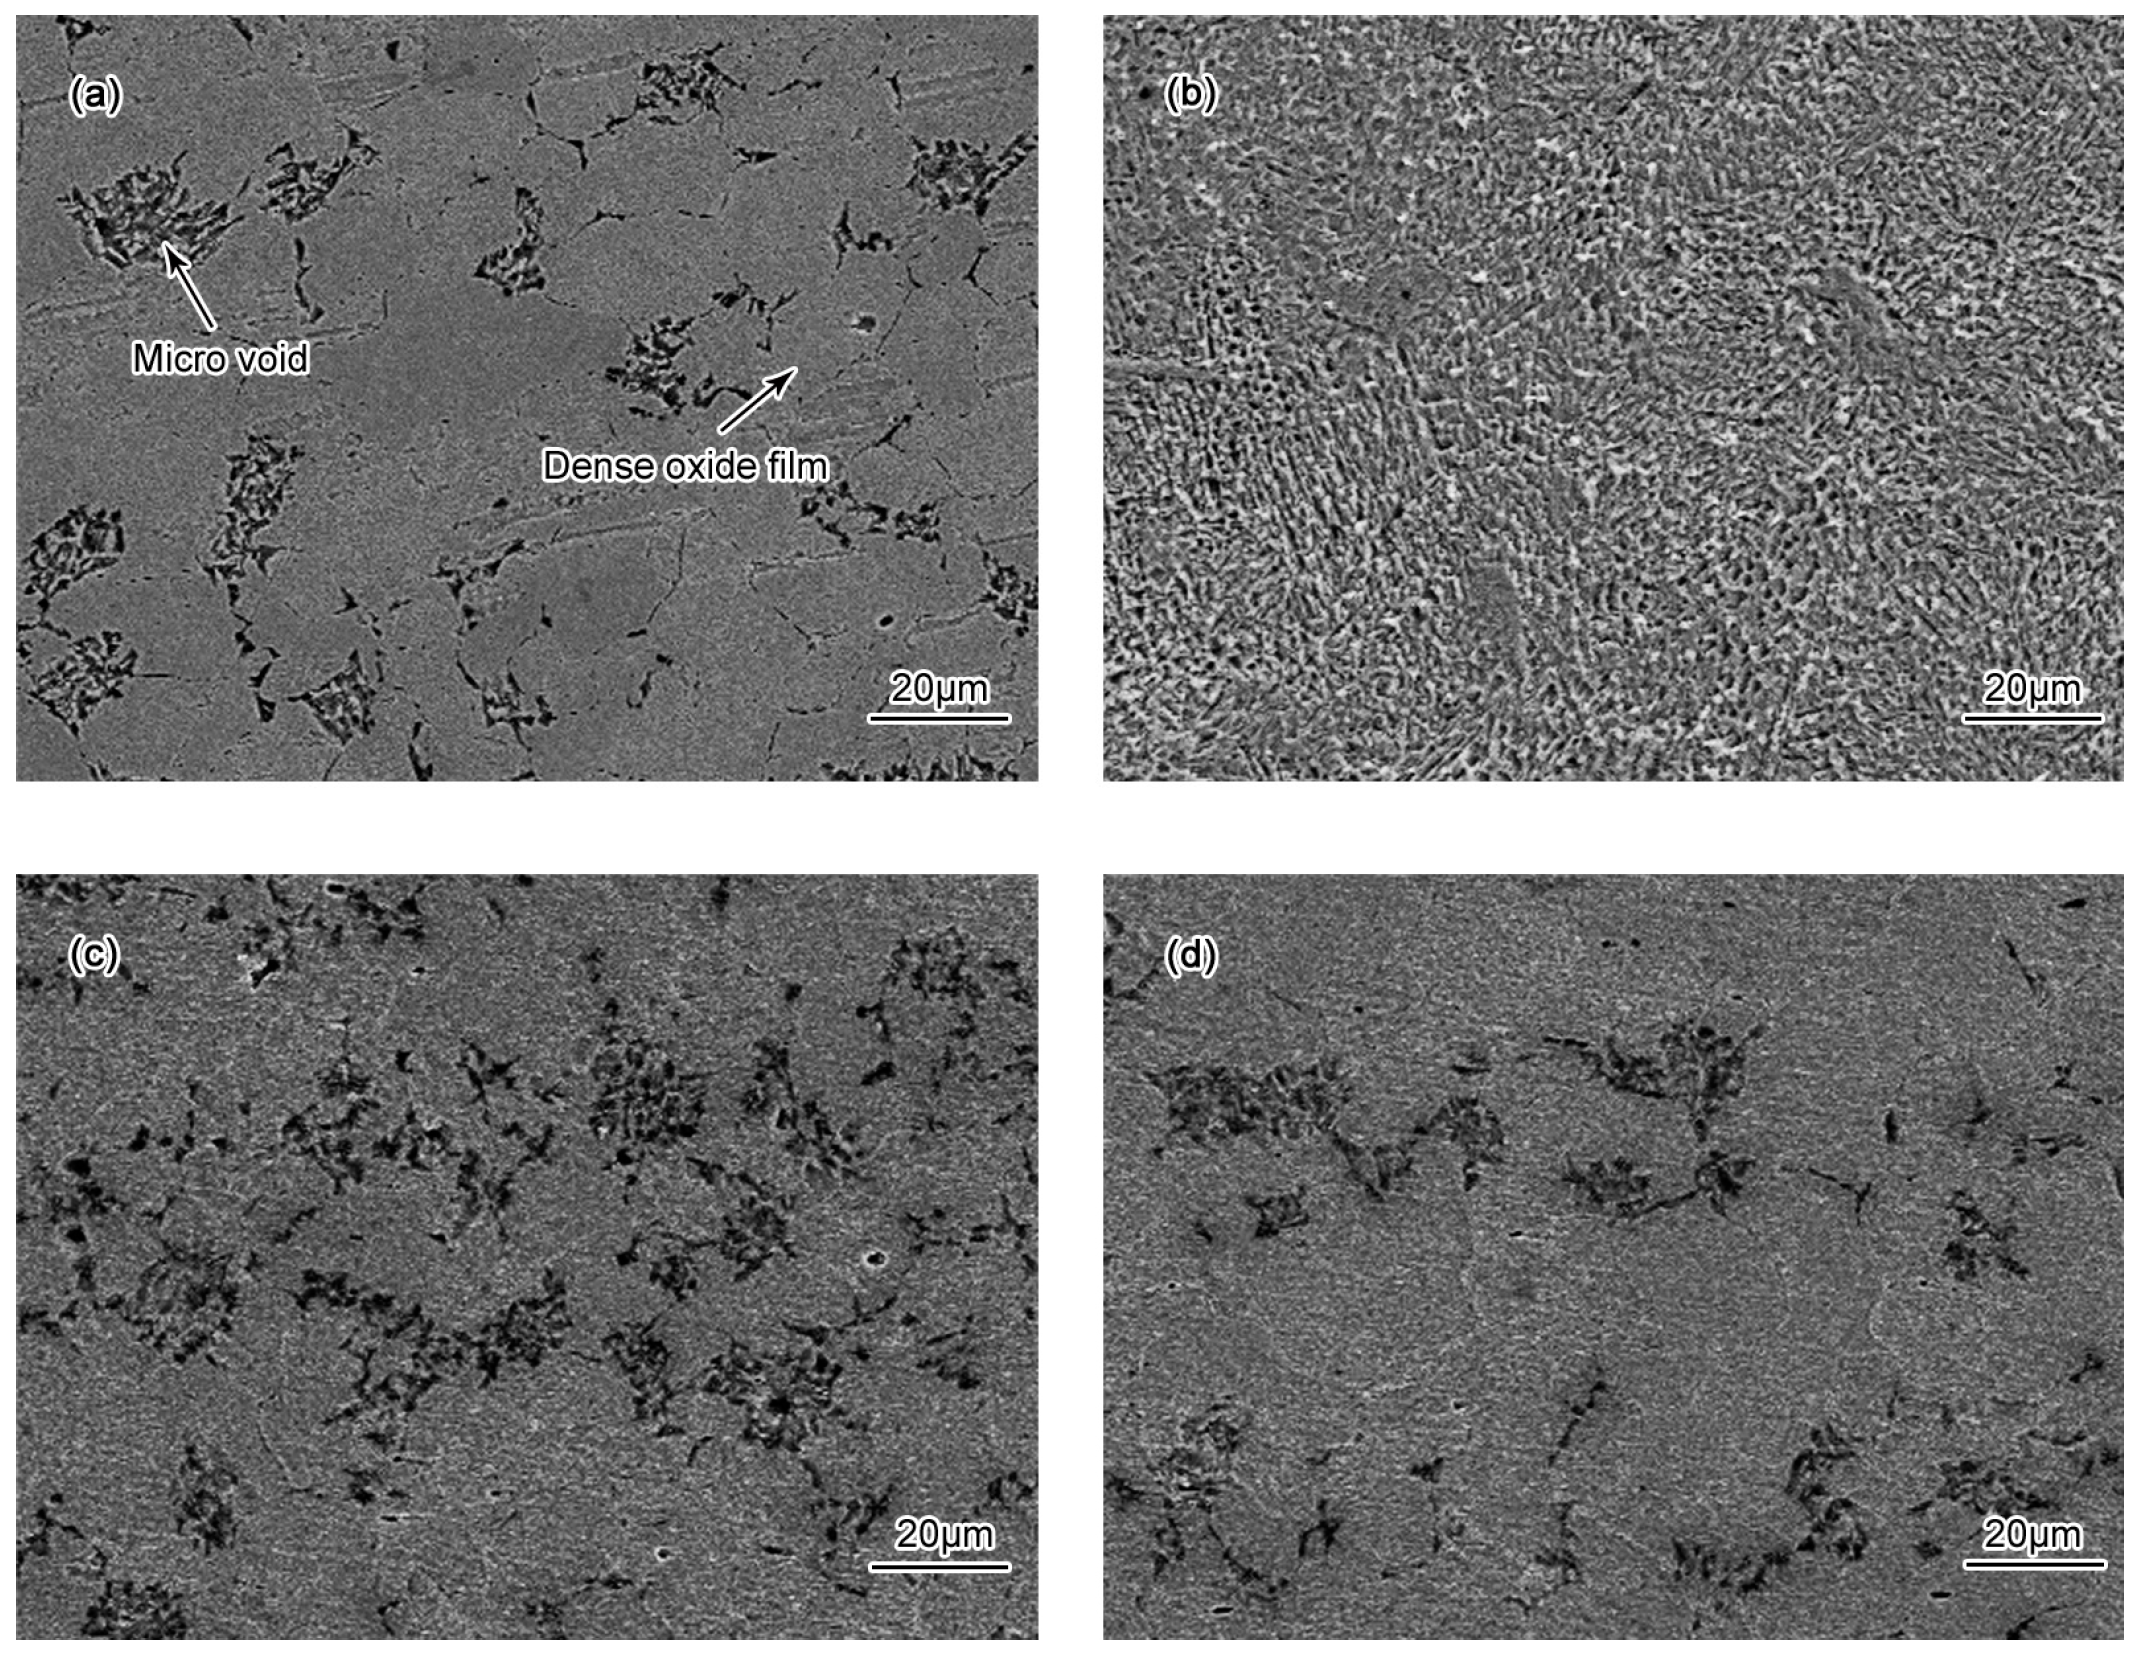
Figure 5.
SEM images of specimens after immersion for 72 h in 50 wt % H2SO4 solution: (a) BM; (b) CGHAZ; (c) FGHAZ; (d) ICHAZ.
Figure 5.
SEM images of specimens after immersion for 72 h in 50 wt % H2SO4 solution: (a) BM; (b) CGHAZ; (c) FGHAZ; (d) ICHAZ.
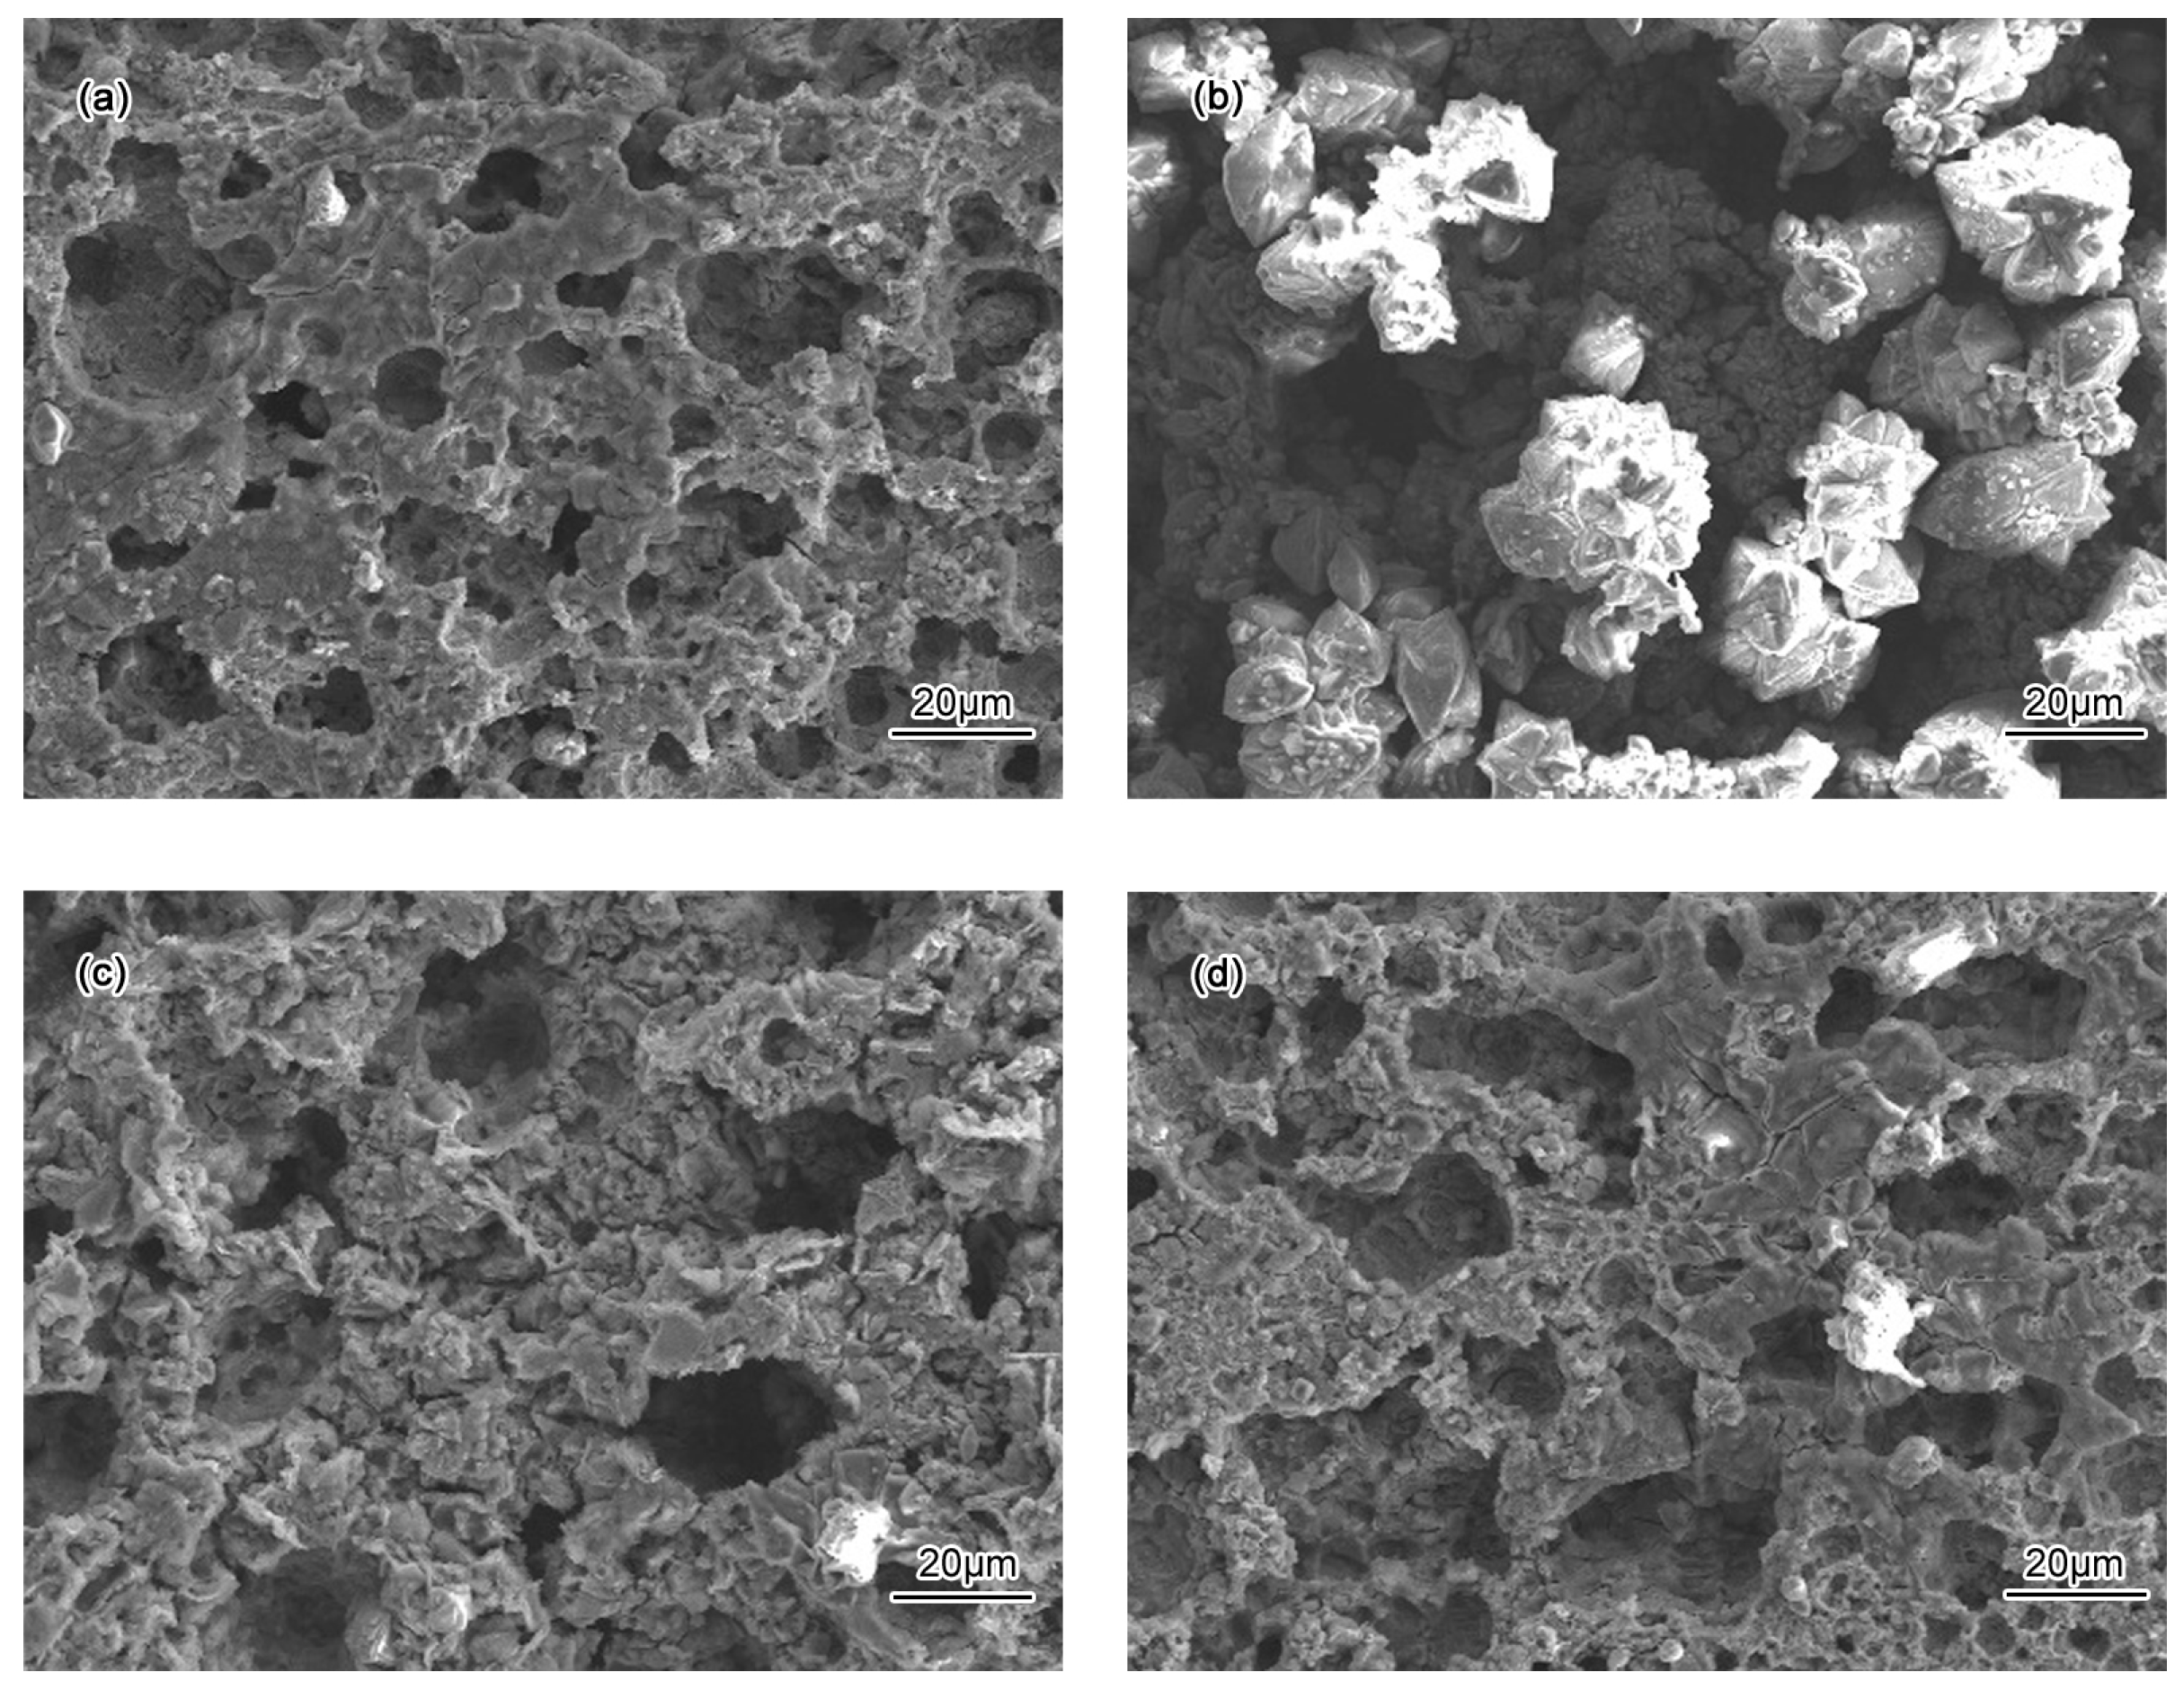
Figure 6.
Tafel polarization curves for electrodes immersed in 50 wt % H2SO4 solution.

Figure 7.
Nyquist plots for electrodes immersed in 50 wt % H2SO4 solution for different time: (a) BM; (b) CGHAZ; (c) FGHAZ; (d) ICHAZ.
Figure 7.
Nyquist plots for electrodes immersed in 50 wt % H2SO4 solution for different time: (a) BM; (b) CGHAZ; (c) FGHAZ; (d) ICHAZ.

Figure 8.
Equivalent circuit for fitting the obtained electrochemical impedance spectroscopy (EIS) data.
Figure 8.
Equivalent circuit for fitting the obtained electrochemical impedance spectroscopy (EIS) data.


Table 1.
Parameters of thermal cycles in welding heat affected zone (HAZ) simulation experiment.
| Simulated Welding HAZ | Peak Temperature, °C | Heating Rate, °C/s | Holding Time at Peak Temperature, s | Cooling Rate, °C/s |
|---|---|---|---|---|
| CGHAZ | 1320 | 150 | 1 | 20 |
| FGHAZ | 930 | 150 | 1 | 20 |
| ICHAZ | 830 | 150 | 1 | 20 |
Table 2.
Open circuit potential (OCP) for BM and simulated welding HAZ immersed in 50 wt % H2SO4 solution.
Table 2.
Open circuit potential (OCP) for BM and simulated welding HAZ immersed in 50 wt % H2SO4 solution.
| Electrode | BM | CGHAZ | FGHAZ | ICHAZ |
|---|---|---|---|---|
| OCP value, mV | −431.24 | −339.15 | −379.22 | −353.73 |
Table 3.
Electrochemical parameters for the BM and simulated welding HAZ immersed in 50 wt % H2SO4.
| Specimens | Ecorr, mV | icorr, µA/cm2 | βc, mV/dec | βa, mV/dec | Epp, mV | Eb, mV | ip, µA/cm2 | Corrosion Rate, mm/a |
|---|---|---|---|---|---|---|---|---|
| BM | −371.9 | 121.2 | 91.6 | 22.2 | −184 | 425 | 5.19 | 3.313 |
| CGHAZ | −321.3 | 316.9 | 98.7 | 23.6 | −159 | 403 | 8.71 | 7.39 |
| FGHAZ | −333.9 | 148.4 | 91.7 | 25.3 | −165 | 409 | 6.87 | 3.927 |
| ICHAZ | −358.8 | 124.3 | 89.1 | 22.4 | −162 | 420 | 6.60 | 3.419 |
Table 4.
Electrochemical parameters for the BM and simulated welding HAZ immersed in 50 wt % H2SO4.
| Specimens | Immersion Time, h | Rsol, Ω∙cm2 | Cc, μF | Rc, Ω∙cm2 | Rct, Ω∙cm2 | CPE | |
|---|---|---|---|---|---|---|---|
| Y, S·sn/cm2 | n | ||||||
| BM | 0 | 1.004 × 10⁻¹³ | 1.177 | 0.947 | 81.86 | 6.966 × 10⁻⁵ | 0.9628 |
| 4 | 1.225 × 10⁻⁹ | 0.9849 | 0.9551 | 131.6 | 3.728 × 10⁻⁴ | 0.9381 | |
| 12 | 1.003 × 10⁻⁷ | 1.142 | 1.189 | 147.2 | 5.024 × 10⁻⁴ | 0.9647 | |
| 72 | 9.999 × 10⁻⁸ | 1.282 | 1.031 | 116.6 | 5.362 × 10⁻⁴ | 0.9626 | |
| CGHAZ | 0 | 9.924 × 10⁻⁸ | 1.929 | 0.669 | 31.38 | 1.381 × 10⁻⁴ | 0.9719 |
| 4 | 2.467 × 10⁻¹¹ | 3.422 | 0.4024 | 48.74 | 8.371 × 10⁻⁴ | 0.9552 | |
| 12 | 8.983 × 10⁻¹² | 2.967 | 0.4973 | 77.23 | 7.9 × 10⁻⁴ | 0.9681 | |
| 72 | 2.45 × 10⁻⁶ | 1.296 | 0.8698 | 65.55 | 9.823 × 10⁻⁴ | 0.9422 | |
| FGHAZ | 0 | 7.662 × 10⁻⁷ | 0.4751 | 1.576 | 41.24 | 5.826 × 10⁻⁵ | 0.9391 |
| 4 | 1 × 10⁻⁷ | 0.8941 | 1.171 | 78.75 | 7.8 × 10⁻⁴ | 0.9410 | |
| 12 | 1.269 × 10⁻⁹ | 0.9385 | 1.214 | 94.12 | 7.193 × 10⁻⁴ | 0.9564 | |
| 72 | 1.001 × 10⁻⁷ | 0.7065 | 1.699 | 99.41 | 6.427 × 10⁻⁴ | 0.9565 | |
| ICHAZ | 0 | 9.571 × 10⁻⁸ | 0.2447 | 2.681 | 62.06 | 4.027 × 10⁻⁵ | 0.9349 |
| 4 | 5.769 × 10⁻⁸ | 0.9239 | 1.321 | 91.47 | 4.287 × 10⁻⁴ | 0.9528 | |
| 12 | 7.769 × 10⁻¹² | 0.6154 | 1.865 | 99.58 | 5.969 × 10⁻⁴ | 0.9573 | |
| 72 | 1.495 × 10⁻⁷ | 1.19 | 1.048 | 91.55 | 7.242 × 10⁻⁴ | 0.9582 | |
© 2017 by the authors. Licensee MDPI, Basel, Switzerland. This article is an open access article distributed under the terms and conditions of the Creative Commons Attribution (CC BY) license (http://creativecommons.org/licenses/by/4.0/).
Share and Cite
MDPI and ACS Style
Zhang, S.; Zhao, H.; Shu, F.; He, W.; Wang, G. Microstructure and Corrosion Behavior of Simulated Welding HAZ of Q315NS Steel in Sulfuric Acid Solution. Metals 2017, 7, 194. https://doi.org/10.3390/met7060194
AMA Style
Zhang S, Zhao H, Shu F, He W, Wang G. Microstructure and Corrosion Behavior of Simulated Welding HAZ of Q315NS Steel in Sulfuric Acid Solution. Metals. 2017; 7(6):194. https://doi.org/10.3390/met7060194
Chicago/Turabian StyleZhang, Suqiang, Hongyun Zhao, Fengyuan Shu, Wenxiong He, and Guodong Wang. 2017. "Microstructure and Corrosion Behavior of Simulated Welding HAZ of Q315NS Steel in Sulfuric Acid Solution" Metals 7, no. 6: 194. https://doi.org/10.3390/met7060194
Note that from the first issue of 2016, this journal uses article numbers instead of page numbers. See further details here.