
Reduced Fracture Toughness of Metallic Glass at Cryogenic Temperature
by
Yihao Zhou
1,2, 
Jiaxin Liu
1,2,
Dongxue Han
1,2,
Xiangru Chen
1,2,*,
Gang Wang
1,2 and
Qijie Zhai
2 1
Laboratory for Microstructures, Institute of Materials, Shanghai University, Shanghai 20044, China
2
State Key Laboratory of Advanced Special Steel & Shanghai Key Laboratory of Advanced Ferrometallurgy & School of Materials Science and Engineering, Shanghai University, Shanghai 200072, China
*
Author to whom correspondence should be addressed.
Metals 2017, 7(4), 151; https://doi.org/10.3390/met7040151
Submission received: 27 February 2017
/
Revised: 16 April 2017
/
Accepted: 18 April 2017
/
Published: 23 April 2017
Abstract
:The effects of cryogenic temperature on the toughness of a Zr-based metallic glass are investigated. Based on three-dimensional fracture morphologies at different temperatures, the crack formation and propagation are analyzed. Through the calculation of the shear transformation zone volume, the shear modulus and bulk modulus of the metallic glass at different temperatures and the crack formation mechanism associated with the temperature is discussed. Once the crack commences propagation, the hyperelasticity model is used to elucidate the fractographic evolution of crack propagation.
1. Introduction
Metallic glass (MG) generally exhibits superior strength, high hardness, and good elasticity combined with a unique processability in the supercooled liquid region, which makes MG an excellent candidate for structural materials applied in some extreme conditions, such as cryogenic temperature and high strain rate, etc. [1,2,3,4]. Regarding its good, comprehensively mechanical properties, different types of MG are expected to be used in spacecraft applications, that require materials that function at cryogenic temperature [5]. It is therefore necessary to investigate the service behaviors of MG at cryogenic temperature. Since the 1970s, tremendous work has been devoted to elucidate the mechanical behaviors of MG at cryogenic temperature [6,7,8,9,10,11,12,13]. It was found that MG possesses simultaneously enhanced strength and plasticity (especially compressive plasticity) at cryogenic temperature, which is totally different from most crystalline materials that exhibit a trade-off between ductility and strength [14]. However, the effects of cryogenic temperature on the fracture behaviors of MG are still not fully understood. Generally, MG is expected to have improved fracture toughness at cryogenic temperature, because a MG with improved strength and ductility should by correspondingly tough. However, many experimental results have revealed a different behavior. Yi, et al. [15] reported that the notch fracture toughness of a Zr-based MG at 77 K was comparable to that at room temperature. Hufnagel, et al. [16] observed a significant loss of toughness with decreasing temperature in a Zr-based MG. The elucidation of the variation of fracture behaviors at cryogenic temperatures in MG is not only from a fundamental research point of utmost importance to understand the structure-property relationship of MG, but also necessary for the application of MG as structural materials.
In the present study, we choose a representative, well-studied Zr52.5Cu17.9Ni14.6Al10Ti5 (at %) MG as the model material to investigate the effects of cryogenic temperature on the fracture behaviors of MG. A series of notch fracture toughness, KQ, tests were performed in a temperature range of 123–298 K. The results reveal a significant decrease in fracture toughness of the MG. In addition, to further elucidate the fracture behaviors of the MG at cryogenic temperature, the fracture surface is carefully examined based on three-dimensional (3D) fractographies.
2. Experimental Procedure
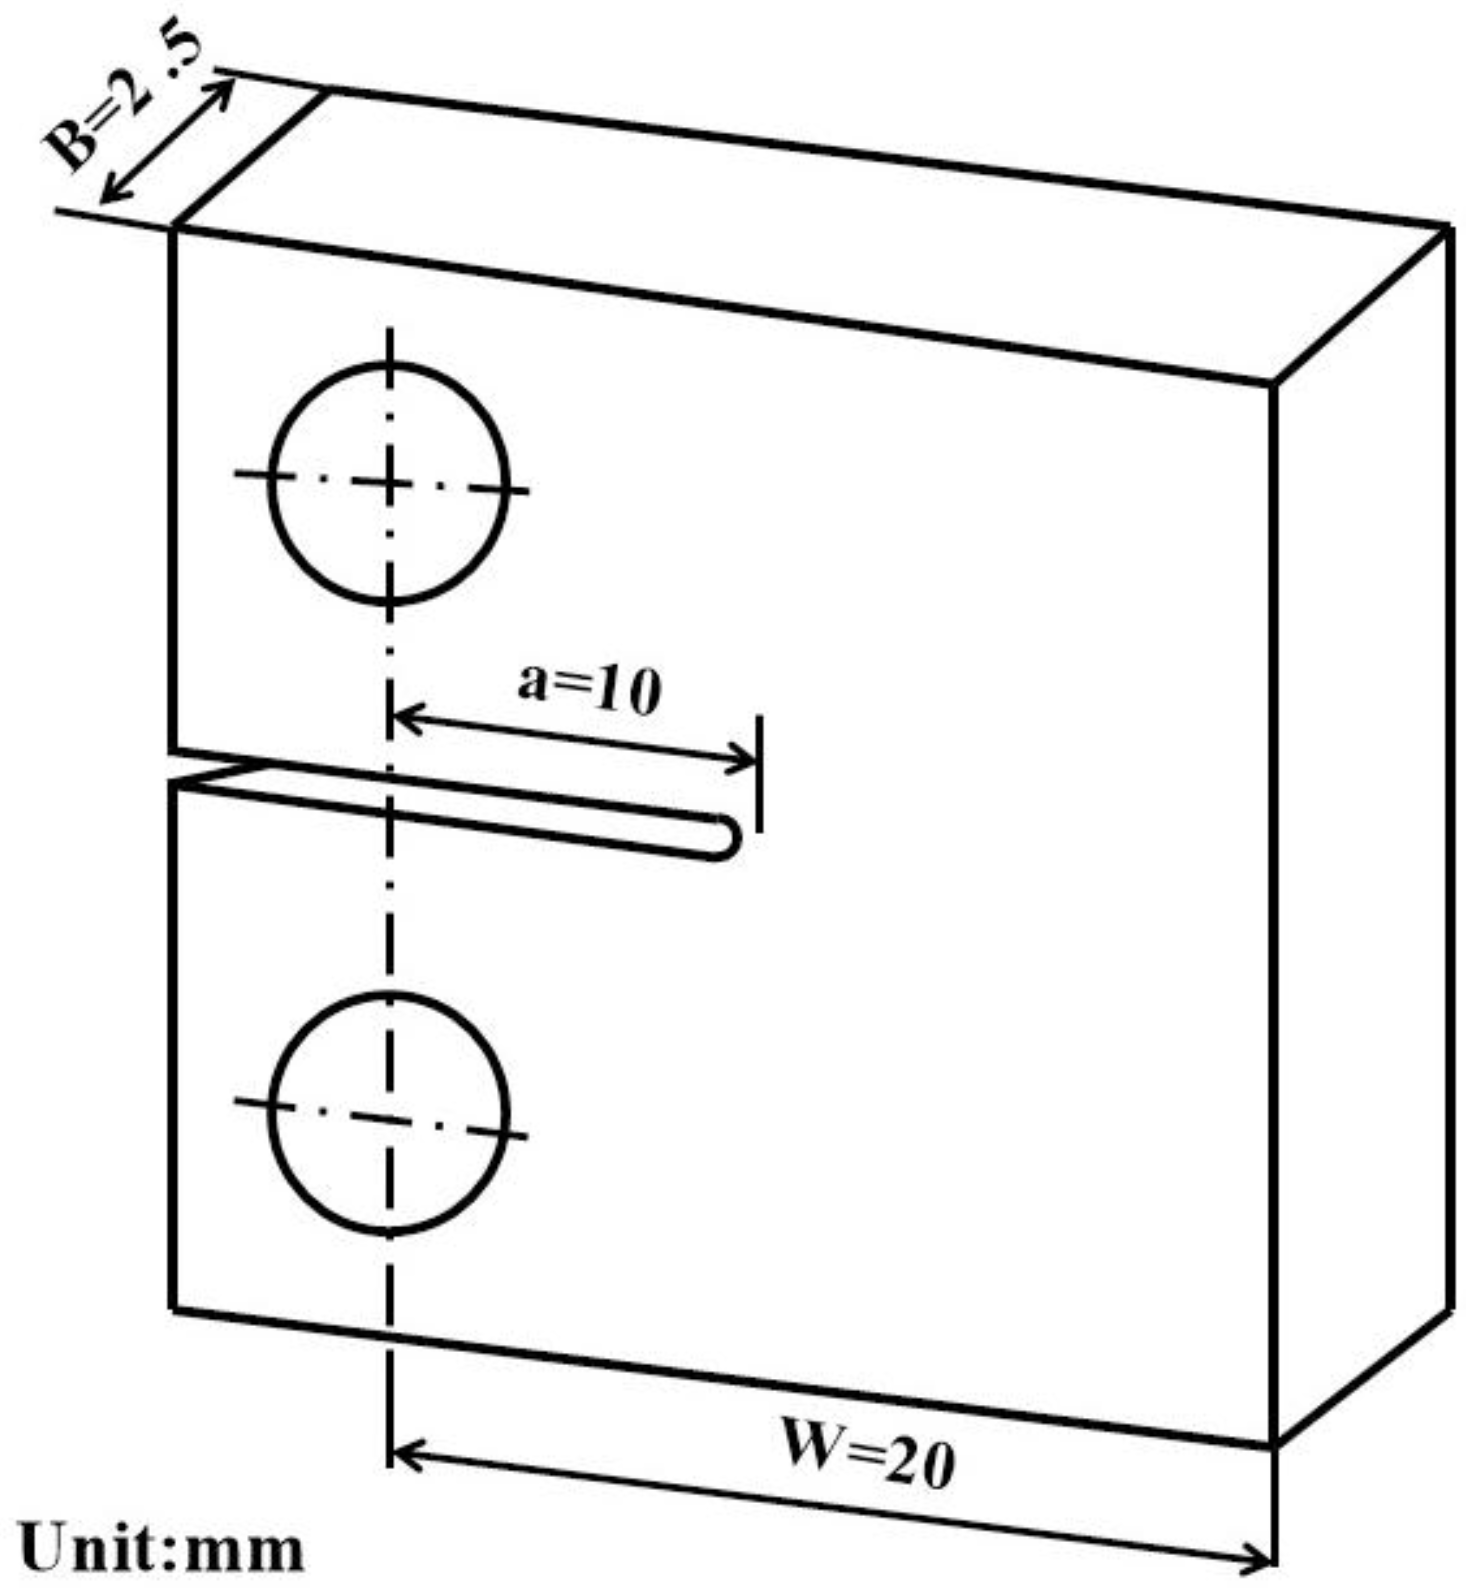
Master ingots of the Zr52.5Cu17.9Ni14.6Al10Ti5 MG were prepared by arc-melting pure elements with purities higher than 99.99% in a Ti-gettered argon atmosphere. The ingots were subsequently melted by vacuum induction and centrifugally cast into a Cu mold to form a plate-like sample with the dimensions of 80 × 60 × 2.6 mm3. The fully glassy structure of the plates was ascertained by X-ray diffraction (XRD) using a Rigaku D\max-2550 diffractometer (Rigaku, Tokyo, Japan) with Cu-Kα radiation generated at 40 KV. A compact tension (CT) specimen was fabricated in general accordance with ASTM E399 [17]. A straight, through-thickness notch with a root radius of 125 μm was introduced at a depth of 0.5 W (where W is the width of the specimen) using the electrical discharge machining process. The profile of the CT specimen is shown in Figure 1, with a sample dimension of B (thickness) = 2.5 mm, a (notch length) = 10 mm, and W (width) = 20 mm. The surfaces of the specimen were mechanically polished to a mirror finish. Notch toughness tests were carried out on a computer-controlled SANS CMT 5205 testing machine (Meitesi Industry System, Minneapolis, MN, USA) at a constant displacement rate of 1 μm/s. During the test, the CT specimen was first cooled to the testing temperature in an environmental box with a temperature accuracy of ±2 K. The fractographies were examined by a HITACHI SU-1500 scanning-electron microscope (SEM) (HITACHI, Tokyo, Japan) and a Phenom G2 scanning-electron microscope (SEM) (FEI, Hillsboro, OR, USA) with the 3D roughness reconstruction.
3. Results
The compact tension at each temperature was repeated four times to exclude the occasional case. The representative curves of the load versus the displacement, tested at different temperatures, are plotted in Figure 2, which all exhibit a linearly elastic deformation followed by catastrophic fracture. Thus, the KQ value can be calculated from the load at fracture, Pmax. According to ASTM E399, the notch fracture toughness, KQ, can be calculated by [17]:
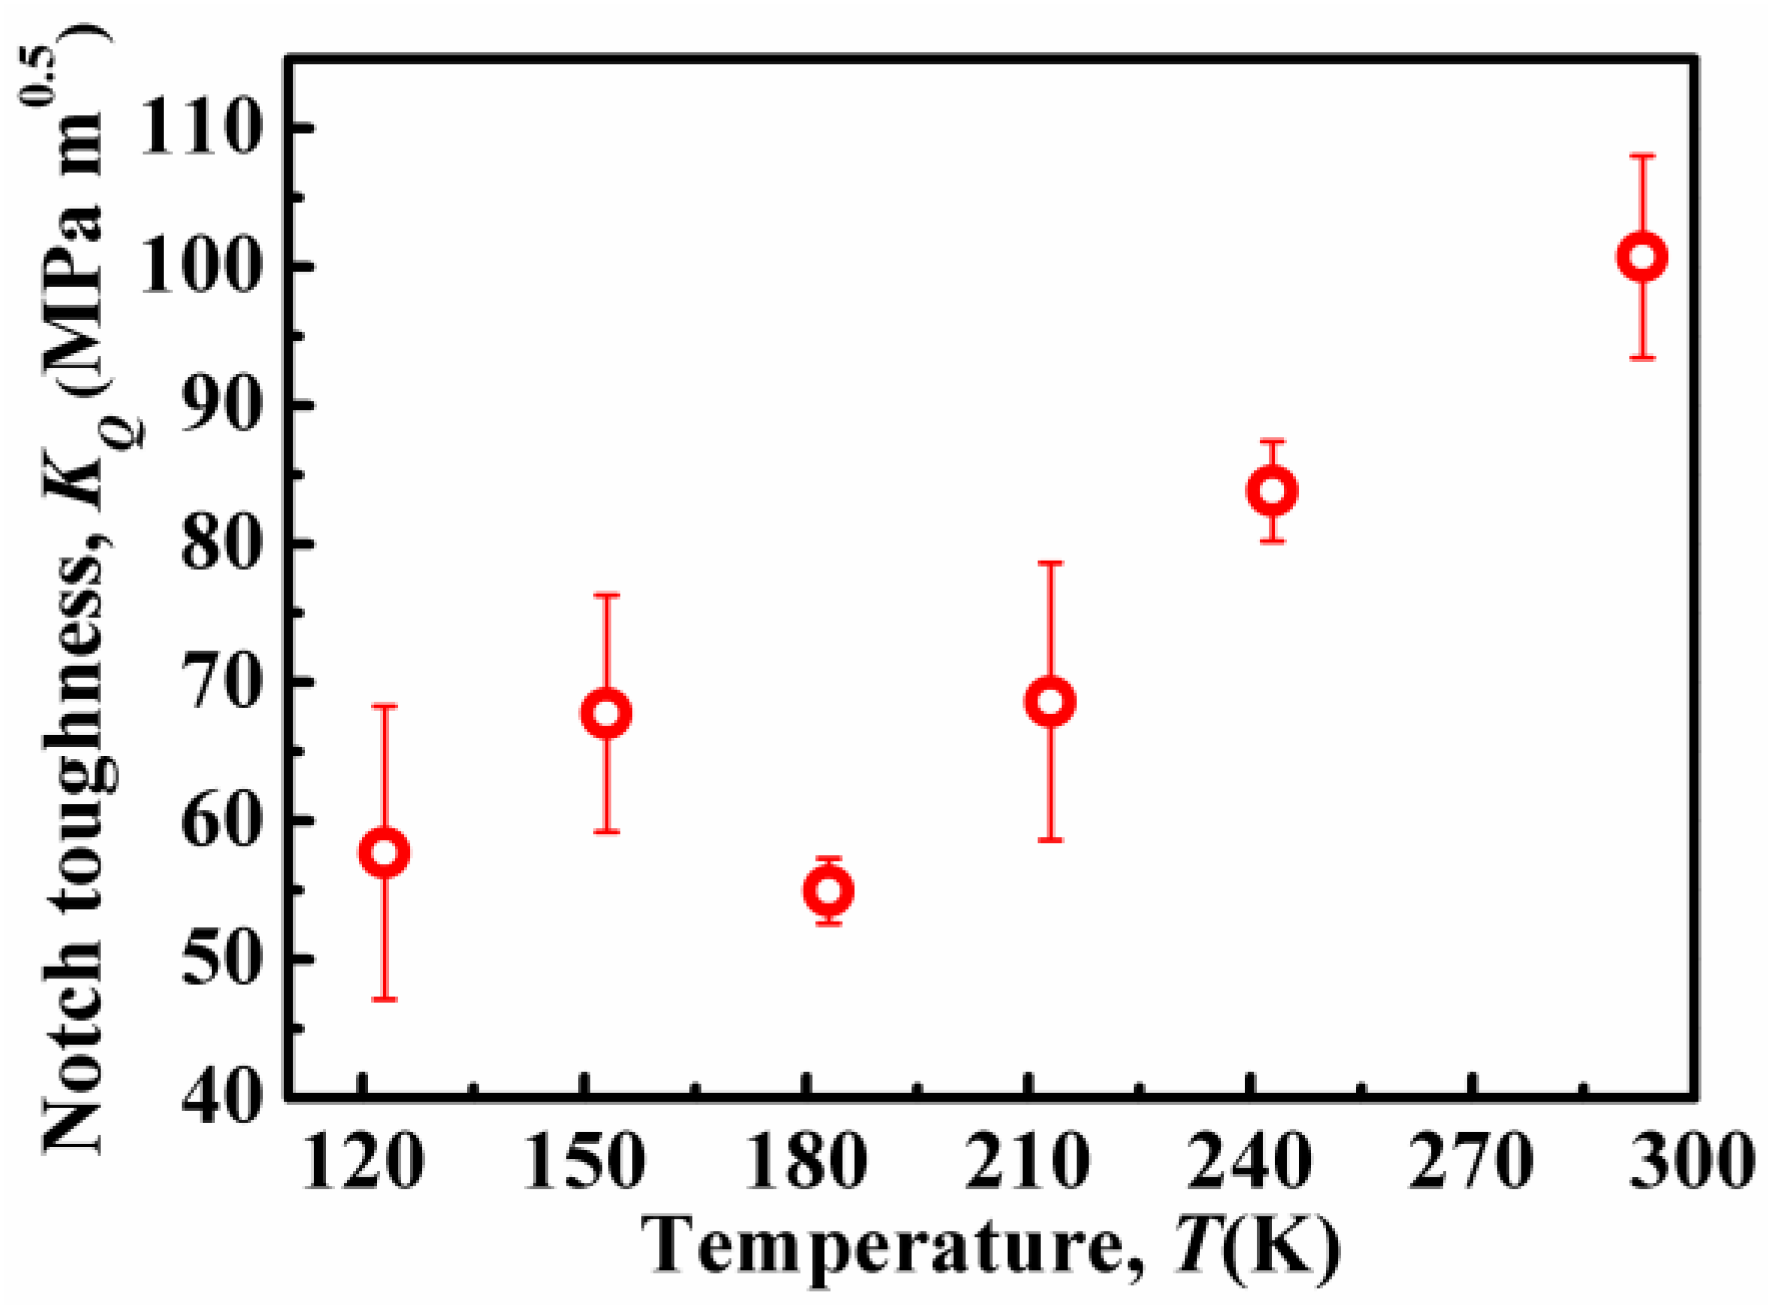
where B is the thickness, a is the notch length and W is the width. Note, although the notch toughness is usually higher than the valid fracture toughness, KIc, the comparison of the notch toughness values at different cryogenic temperatures is trustable and can be used to assess the effects of cryogenic temperature on the fracture toughness of the MG. The measured KQ values at different temperatures are summarized in Figure 3. The MG at room temperature possesses the highest KQ value, that reaches an average value of 101 ± 7 MPa m0.5. This value at room temperature is consistent with the previously reported value of 94 MPa m0.5, although the notch radius of 5–10 μm therein was significantly smaller than the value of 125 μm in the current study [18], which suggests that the notch introduced by electrical discharge machining does not significantly influence the results in the present study. It is also important to note that the fatigue pre-cracked notch toughness, KIc, measurement, which is commonly used in measuring the toughness, can introduce a sharper notch in MG as compared to that in the notch toughness, KQ, measurement. Although a notch with a small radius can more accurately reflect the toughness, the current study focuses on the relative changes in the toughness value with decreasing temperature. Thus, it is not necessary to use the fatigue pre-cracked notch toughness measurement in the present study. From Figure 3, a remarkable drop can be seen in the KQ value with decreasing temperature. In the temperature range from 298 to 183 K, the KQ value almost linearly decreases from 101 ± 7 to 55 ± 2 MPa m0.5. After that, upon further decreasing the temperature, the KQ value fluctuates around 60 MPa m0.5.
The changes in the notch toughness with the temperature must be manifested on the fracture surface. Therefore, the observations of the fracture surface are carried out to further characterize the change in the notch toughness. A presentative overview of the fracture surface that is fractured at 243 K is shown in Figure 4a. From the notch point to the end of the crack propagation, it can be seen that the surface roughness is decreased (Figure 4a). The fractographies at the other four temperatures tested also show a decrease in the surface roughness with cracking, which is summarized in the supplementary information (Figures S1–S5). To characterize the whole profile of the fracture surface along the crack propagation direction, six regions are enlarged and shown in Figure 4b–g. At the point I, i.e., the place of crack initiation, the surface is very rough. The 3D image in Figure 4b shows that a jagged “rough zone” with ridge and valley patterns is formed. With the crack propagation, the height of the ridge pattern is reduced. Figure 4c–g characterize the surface morphologies at different positions of the crack surface. It can be seen that when the crack propagation distance approaches the point IV, the jagged pattern almost disappears and the roughness becomes very minimal.
To quantitatively characterize the surface roughness of the fracture surface, the roughness values, Ra, at different positons of the crack surface are measured along the crack propagation direction. For each sample, 19 areas are analyzed based on the 3D images shown in Figure 4. The interval distance between neighboring observation areas is approximately 500 μm. The Ra value as a function of the crack propagation distance is plotted in Figure 5. The area for the measurement of the Ra value is 497 μm2. The fracture surfaces fractured at six temperatures show that the Ra values decrease as the crack propagation distance, L, increases. According to Figure 5, for the samples fractured at 298, 243, 213, 183, 153, and 123 K, the maximum Ra values always appear in the areas close to the notch point, which are 61, 50, 34, 29, 20 and 19 μm, respectively. Decreasing the temperature causes the maximum Ra value to decrease. After the crack runs a critical distance, Lc, the Ra value approaches the minimum and constant value of approximately 9 μm. The Lc values are approximately 8500, 8000, 7500, 7000, 7000 and 3000 μm at 293, 243, 213, 183, 153 and 123 K, respectively.
Demetriou et al. [19] reported that high toughness is obtained through stabilizing the plastic flow process at the opening crack tip to form a distributed damage zone. In MG, plastic flow is achieved by shear bands initiation and propagation. Thus, the toughness is reflected in the shear bands density and the extension zone size ahead of the notch tip. For the MG tested at 123 K with KQ = 47 MPa m0.5, no noticeable shear bands emanated from the notch tip (Figure 6a). Upon increasing the temperature to 153 K, several shear bands appeared, and along the crack propagation direction the shear bands can propagate approximately 209 μm before the crack is formed (Figure 6b). Upon increasing the temperature further, the density of the shear bands significantly increased, and the shear bands propagation distance increased to be 356 μm at 183 K, 557 μm at 213 K, 400 μm at 243 K and 692 μm at 298 K (Figure 6c–e). The shear bands propagation distances are marked in Figure 6. It can be seen that the MG with a larger fracture toughness has more shear bands initiating from the notch tip, and the shear bands propagate a longer distance.
4. Discussion
It is well known that the formation of the plastic zone in the front of the crack tip is dominated by a competition process between the shear flow and the cavitation [19,20]. In MG, a small shear modulus, G, means that the shear flow is easily activated, and a high bulk modulus, B, makes the operation of cavitation energetically difficult. Therefore, MG with a low G/B corresponds to high fracture toughness [20,21]. Previous studies have found that the elastic parameters, including elastic modulus, shear modulus and bulk modulus, of MG are temperature-dependent. The temperature dependence of the elastic constant, C(T), can be expressed as [22]:
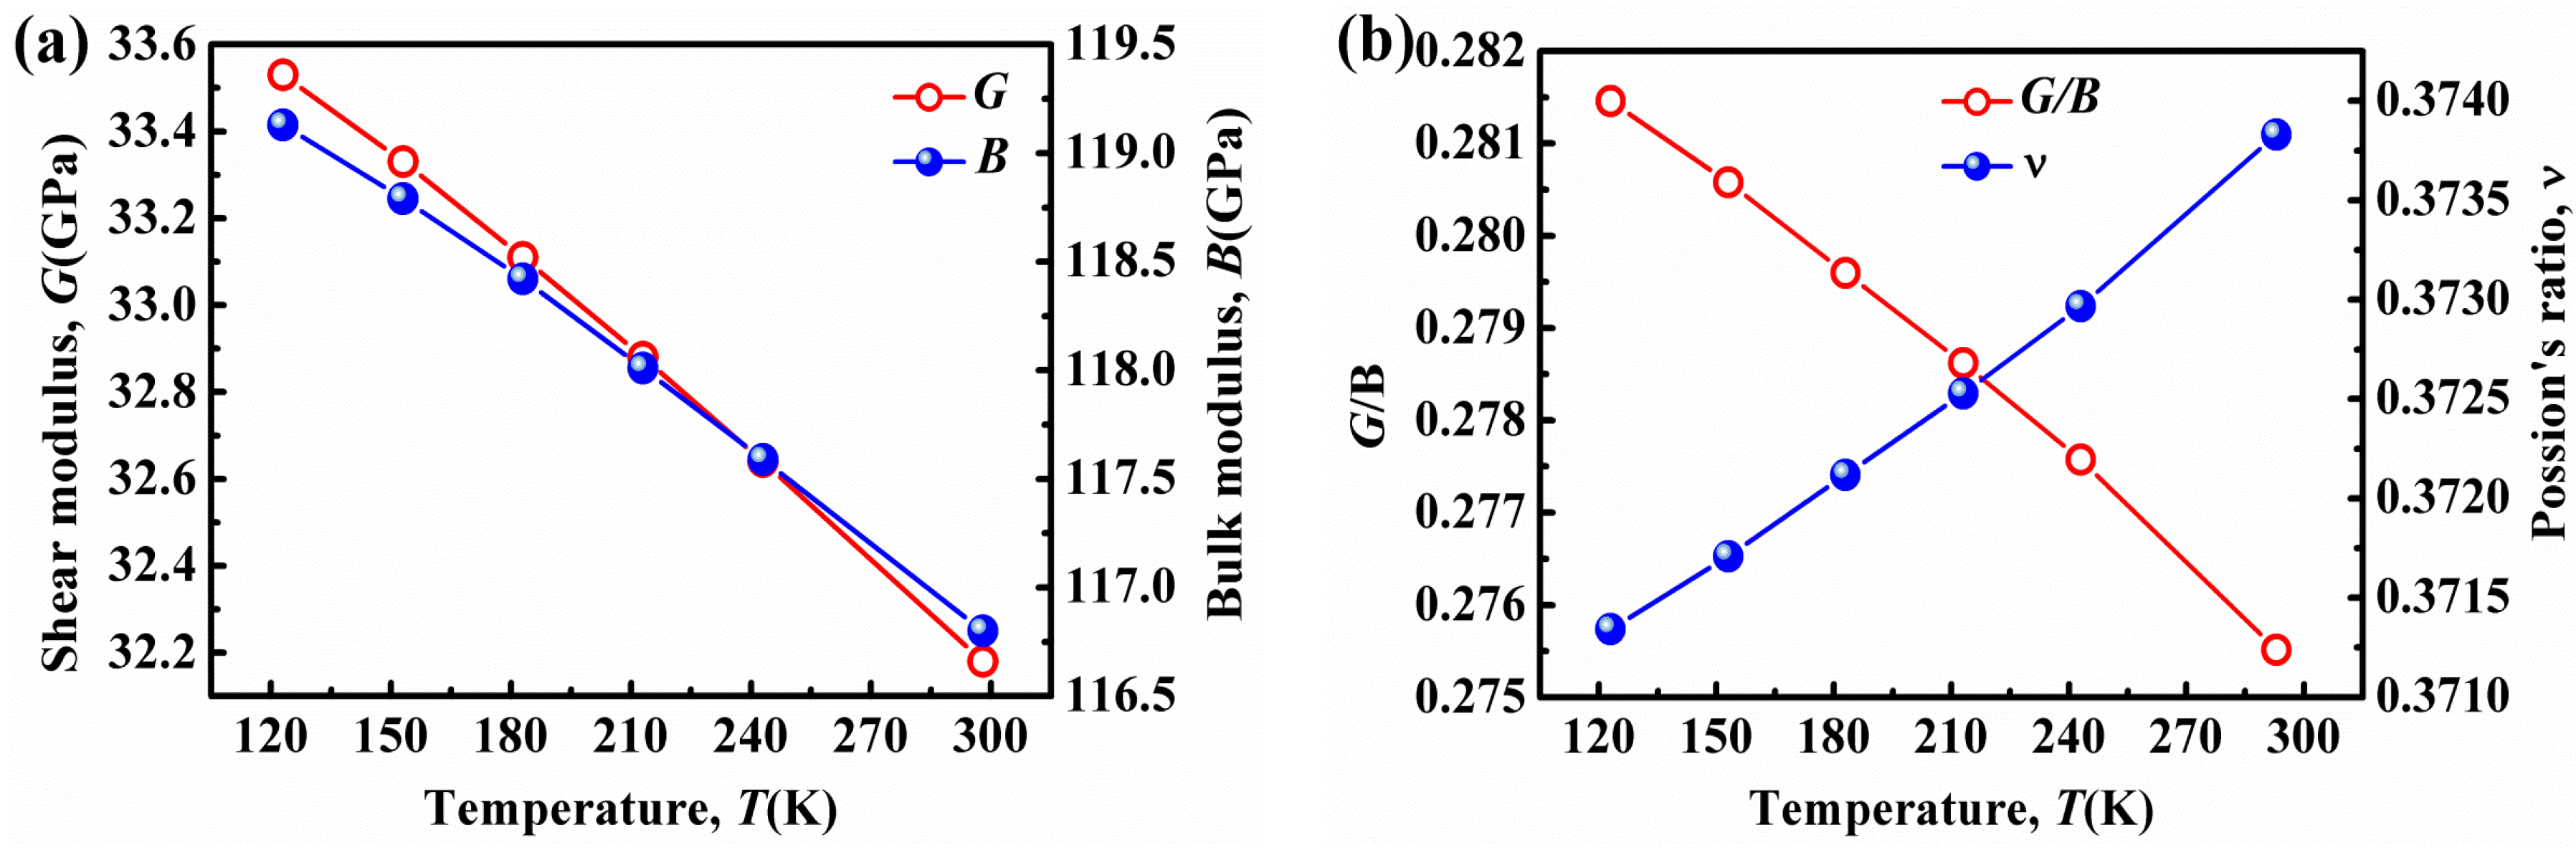
where C(TR) is the elastic parameter at room temperature, T is the temperature, ΘD is the Debye temperature, and s is the fitting parameter that represents the parameter for the bulk modulus, sB, and the one for the shear modulus, sG. According to Equation (3), one can predict B and G as a function of temperature. Then, Poisson’s ratio, ν, can be calculated by . In the present study, the shear modulus at room temperature, G(TR), is 32.2 GPa, the bulk modulus at room temperature, B(TR), is 116.8 GPa, the sB and sG values are 4.419 and 2.556, respectively, and the ΘD value is 279.7 K [22]. Accordingly, the G and B values vs. temperature, plotted in Figure 7a, show that both the G and B values increase monotonously with decreasing temperature. The increase in the G and B values indicate that the activations of shear flow and cavitation become difficult simultaneously as the temperature decreases. Figure 7b illustrates the temperature dependence of the G/B and ν values. G/B increases monotonously as the temperature decreases. The change of the ν value exhibits an increase as the temperature increases. Therefore, the decrease of the G/B value and the increase of the ν value with increasing temperature cause an improved shear-banding ability, which means that the more shear bands should be activated at room temperature as compared to the cases at cryogenic temperatures. Therefore, the density of shear bands activated on the notch tip is increased with increasing temperature, which is confirmed by Figure 6. Furthermore, Poisson’s ratio, ν, also indirectly reflects the competition between the shear flow and the cavitation, which can influence the stress state ahead of the crack tip [16].
The changes in the G/B and ν values at cryogenic temperatures should correspond to a significant structural rearrangement [23]. Usually, the plastic shear flow is accommodated by a series of cooperatively inelastic rearrangements in shear transformation zones (STZs) [19,24]. Hence, the fracture toughness of the MG is expected to intrinsically depend on the volume of STZs, Ω. Jiang et al. [25] modified the cooperative shearing model (CSM) proposed by Johnson and Samwer [24] by adding a free volume-related activation factor, exp. Thus, the volume of STZs can be expressed as [25]:
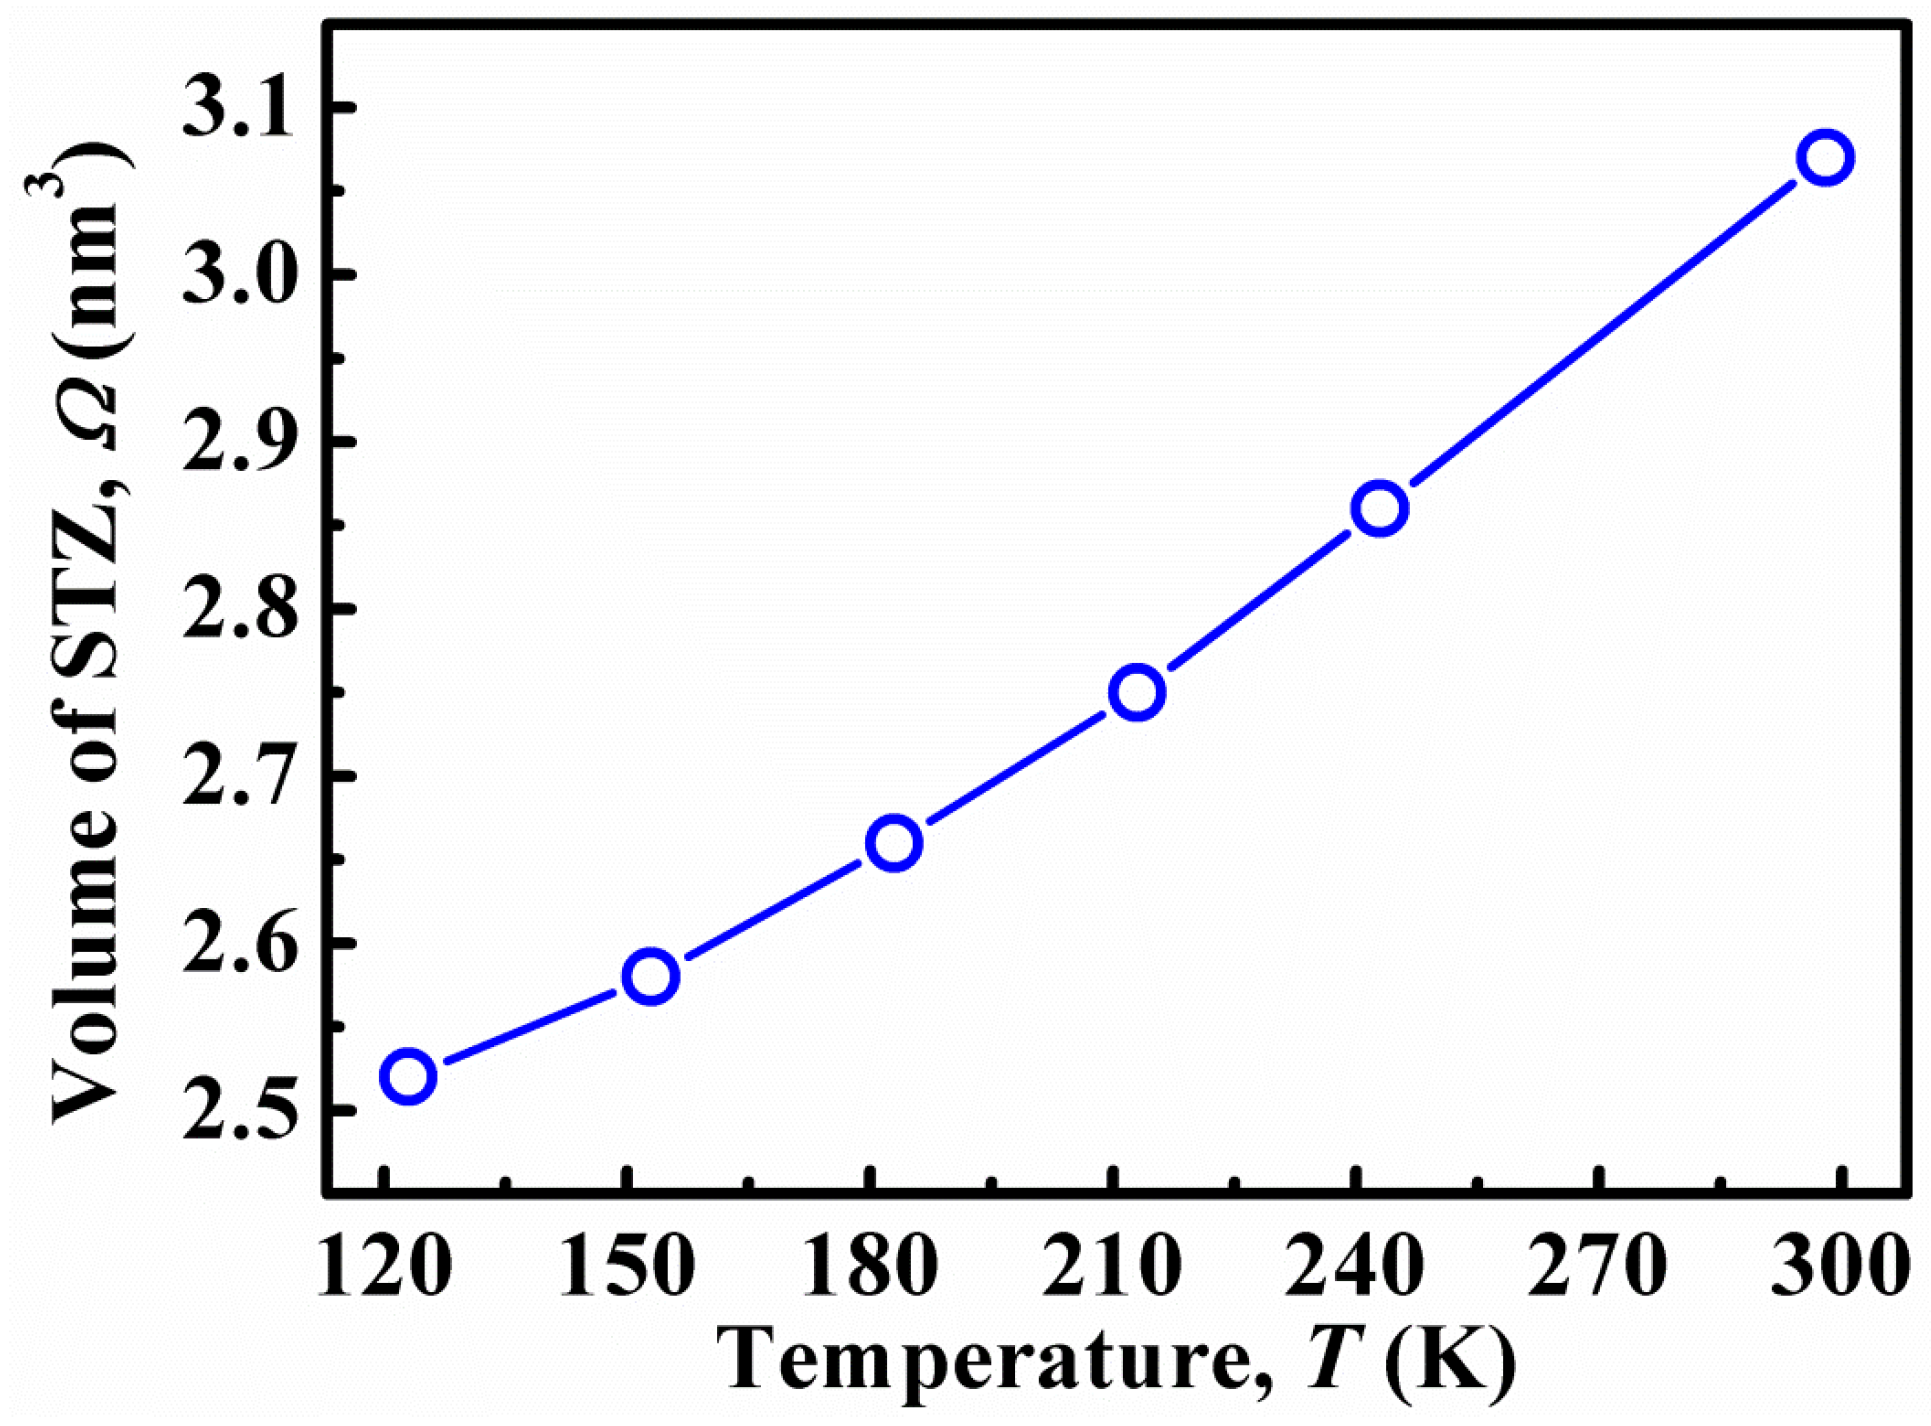
where k is Boltzmann constant (1.381 × 10⁻²³ J/K), T is the temperature, , R is the “fold ratio” (≈0.25), GT is the shear modulus at the temperature of T, γC is the critical shear strain, ζ is a correction factor (≈1/3), τCT and τC0 are the critical shear stresses at the temperature of T and 0 K, respectively. The shear modulus, GT, at different temperatures is already shown in Figure 7a. According to the cooperative shear model (CSM) [24], , where γC0 = 0.036, and γC1 = 0.016. The actual critical strain at τCT is τCT/G corrected by a factor of π/2 arising from nonlinear elasticity [24], i.e., πτCT/2. The calculated volume of STZ is plotted in Figure 8. With decreasing temperature from room temperature to 123 K, the volume of STZ decreases from 3.07 to 2.51 nm3. As compared to that in the MG with large STZs, the plastic shear flow in the MG with small STZs must involve more activated STZs to cooperate with the nucleation of a shear band. In addition, a large STZ during the plastic deformation process can generate a large internal stress concentration, indicating that the thermally activating flow event becomes easy [26]. Hence, the small STZs weaken the shear capability of the MG, i.e., the plastic flow, which is consistent with the observations in Figure 6 and the evolutions of the G/B and ν values with the temperature. Recently, An et al. [27,28] found that a low toughness in MG indicated a decreased activation energy barrier for the cavitation event. In our present study, the small STZs of the MG at cryogenic temperature indicate that the thermal activation of the plastic flow is decreased. Thus, the cavitation behavior of the MG at cryogenic temperature is enhanced, which causes the decreased toughness.
At the beginning of crack propagation, i.e., the point I in Figure 4, the jagged patterns are believed to be related to the crack formation and propagation processes [23,29,30], although the origin of the jagged patterns is still not yet clear. Suh et al. [29] conjectured that the nonplanar ridged fatigue fracture surfaces were a necessary condition for the formation of a jagged rough zone. However, in the present study, even without fatigue pre-crack, jagged patterns are still observed. The irregularity caused by kinks or steps along the crack front possibly causes a complex stress state in front of the crack and contributes to the jagged morphology. Once the crack commences propagation, regarding the stress and/or strain concentration and the adiabatic heating in metals [31], a plastic process zone is believed to be formed in the front of the crack tip, in which the glassy phase appears to have a viscous flow. Thus, a nonlinear behavior in the front of the crack tip is produced. In this case, a hyperelasticity model is introduced to depict the nonlinear behavior in the crack tip [32,33]. The plastic process zone with a radius of rH is therefore called a hyperelastic region where elastically softening occurs. Based on the hyperelastic model, the elastic energy stored in the specimen can be transferred to the crack tip, and thus support the crack propagation. When the crack penetrates into the glassy phase, a local energy flux with a characteristic length of γ, which is from the elastic-energy storing region around the crack tip, can flow into the hyperelastic region to support the crack propagation, i.e., the formation of new fracture surfaces. During the crack propagation, the hyperelastic region seems to act like a buffering region to absorb the local energy flux [32]. A large hyperelastic region can accumulate a large local energy flux, which causes a softening behavior in the front of the crack tip. On the other hand, the local energy flux from the region around the crack tip cannot be effectively accumulated in a small hyperelastic region. In this case, the hyperelastic region causes a stiffening behavior. It is obvious that the onset of the dynamic crack propagation instability is dominated by a competition between the stiffening behavior and the softening behavior, which can be simply expressed as a ratio of rH/γ [33]. When the rH value is comparable to the γ value, the energy required for crack motion can be transported from the hyperelastic region and elastic softening occurs. If the rH value is much smaller than the γ value, the local energy flux will be directly transported to the crack tip without any buffering from the hyperelastic region. Thus, elastically stiffening governs the crack instability, and more energy flows into the crack tip from the larger, linearly elastic region to sustain crack propagation as compared to the case of elastic softening. The characteristic energy length of γ can be expressed as [32]:
where χ is the surface energy, E is the elastic modulus, and σ is the applied stress. For an MG, the χ value is almost a constant. Based on Figure 7, the elastic modulus can increase 3% when the temperature decreases from 298 to 123 K, which can be ignored in the present study. Thus, the γ value largely depends on the 1/σ2 value. The applied stress in the present study is roughly equivalent to the fracture load shown in Figure 2. Accordingly, the 1/σ2 value increases approximately 44.5 times with decreasing temperature. For the rH value, the hyperelastic region is associated with the plastic process zone [34,35], i.e., depending on the size of the plastic process zone, R (, where σY is the yield strength of the MG). According to Figure 3, the KQ value decreases approximately 43% when the temperature is decreased from 298 to 123 K. In the meantime, the decrease in the temperature causes the yield strength of the MG to increase roughly 20% [36]. Therefore, the R value at 298 K is almost 4.4 times larger than the value at 123 K. The increased γ value and the reduced rH value with the decreasing temperature suggests that the softening behavior is weakened, which is the main reason causing the difference in the fracture surfaces generated at different temperatures. A large rH value indicates that the local elastic energy flux can be effectively stored in the hyperelastic region, causing the formation and operation of shear transformation zones (STZs). Thus, the shear bands can be fully developed in this region, which produces multiple shear bands, as shown in Figure 6. When the crack is preferentially formed in the hyperelastic region, the multiple shear bands can result in a jagged rough morphology at 298 K. Decreasing the temperature can reduce the rH value, in which shear banding is confined to a small region. Therefore, the roughness of the fracture surface at the beginning stage of the crack propagation is decreased with decreasing the temperature, as shown in Figure 5.
Once the crack propagation commences, the dynamic propagation of the crack is associated with the fracture energy. According to the Irwin relationship, the fracture energy, Γ, during the crack propagation process is expressed as [37]:
where ν is the Poisson ratio, V is the crack propagation speed, VR is the Rayleigh wave speed, and KI is the stress intensity. The VR value is associated with the shear modulus that can be considered as a constant with decreasing the temperature to the cryogenic level. Thus, the VR value is a constant. When the crack propagation commences, the KI value decreases with dynamic crack propagation, and V increases with crack propagation [34,38], suggesting that the Γ value decreases with crack propagation. In this case, the necessary energy for supporting the crack running is reduced. The rH value is also reduced with crack propagation [35]. As such, the crack propagation is dominated by elastically stiffening behavior. The reduced elastic softening and decreased fracture energy during the crack propagation may lead to the decreased surface roughness along the crack propagation direction. Therefore, the Ra value approaches the constant of 9 μm.
5. Conclusions
The effects of cryogenic temperature on the fracture behaviors of a Zr-based MG are investigated. A significant reduction in the fracture toughness is found at cryogenic temperatures, with the average values falling from 101 ± 7 MPa m0.5 at room temperature to 58 ± 10 MPa m0.5 at 123 K. Decreasing the temperature to the cryogenic level leads the shear flow to gradually play a less important role in the competition against the cavitation process. Furthermore, a drop in the STZ volumes at cryogenic temperature is responsible for the weakened shear-banding capability. Cryogenic temperature can also reduce the effect of the elastic softening behavior on the crack tip. With crack propagation, the crack speed increases to a dynamic behavior, which causes the elastic softening behavior to weaken. Weak softening behavior means that the development of shear bands in the front of the crack tip becomes frustrated. As a result, the fracture surface roughness decreases along the crack propagation direction with decreasing the temperature. The present results can help in understanding the deformation and fracture mechanism of MG, and provide a solid experimental guidance for the application of MG at cryogenic temperatures.
Supplementary Materials
The following are available online at https://www.mdpi.com/2075-4701/7/4/151/s1. Figure S1: Fractographic evolution for the specimen tested at room temperature with notch toughness value of 102 MPa m0.5. (a) Overview (arrow indicates the crack propagation direction); (b–g) are 3D fractographies at point І, П, Ш, IV, V and VI in (a), respectively. Figure S2: Fractographic evolution for the specimen tested at 213 K with notch toughness value of 79 MPa m0.5. (a) Overview (arrow indicates the crack propagation direction); (b–g) are 3D fractographies at point І, П, Ш, IV, V and VI in (a), respectively. Figure S3: Fractographic evolution for the specimen tested at 183 K with notch toughness value of 53 MPa m0.5. (a) Overview (arrow indicates the crack propagation direction); (b–g) are 3D fractographies at point І, П, Ш, IV, V and VI in (a), respectively. Figure S4: Fractographic evolution for the specimen tested at 153 K with notch toughness value of 59 MPa m0.5. (a) Overview (arrow indicates the crack propagation direction); (b–g) are 3D fractographies at point І, П, Ш, IV, V and VI in (a), respectively. Figure S5: Fractographic evolution for the specimen tested at 123 K with notch toughness value of 47 MPa m0.5. (a) Overview (arrow indicates the crack propagation direction); (b–g) are 3D fractographies at point І, П, Ш, IV, V and VI in (a), respectively.
Acknowledgments
The authors would like to acknowledge the financial support from the National Key Basic Research Program from MOST (No. 2015CB856800), the NSFC (Grant Nos. 51671120, 51404150 and 51501106), and the 111 project.
Author Contributions
X.C., G.W. and Q.Z. conceived and designed the experiments. Y.Z., J.L. and D.H. performed the experiments. X.C. and Y.Z. wrote the paper.
Conflicts of Interest
The authors declare no conflict of interest.
References
- Johnson, W.L. Bulk glass-forming metallic alloys: Science and technology. MRS Bull. 1999, 24, 42–56. [Google Scholar] [CrossRef]
- Wang, W.H.; Dong, C.; Shek, C.H. Bulk metallic glasses. Mater. Sci. Eng. R 2004, 44, 45–89. [Google Scholar] [CrossRef]
- Schuh, C.; Hufnagel, T.; Ramamurty, U. Mechanical behavior of amorphous alloys. Acta Mater. 2007, 55, 4067–4109. [Google Scholar] [CrossRef]
- Egami, T.; Iwashita, T.; Dmowski, W. Mechanical properties of metallic glasses. Metals 2013, 3, 77–113. [Google Scholar] [CrossRef]
- Kruzic, J.J. Bulk metallic glasses as structural materials: A review. Adv. Eng. Mater. 2016, 18, 1308–1331. [Google Scholar] [CrossRef]
- Pampillo, C.; Chen, H. Comprehensive plastic deformation of a bulk metallic glass. Mater. Sci. Eng. 1974, 13, 181–188. [Google Scholar] [CrossRef]
- Takeuchi, S.; Kakegawa, T.; Hashimoto, T.; Tsai, A.-P.; Inoue, A. Low temperature mechanical properties of bulk metallic glasses. Mater. Trans. JIM 2000, 41, 1443–1447. [Google Scholar] [CrossRef]
- Li, H.; Fan, C.; Tao, K.; Choo, H.; Liaw, P.K. Compressive behavior of a Zr-based metallic glass at cryogenic temperatures. Adv. Mater. 2006, 18, 752–754. [Google Scholar] [CrossRef]
- Kawashima, A.; Zeng, Y.; Fukuhara, M.; Kurishita, H.; Nishiyama, N.; Miki, H.; Inoue, A. Mechanical properties of a Ni60Pd20P17B3 bulk glassy alloy at cryogenic temperatures. Mater. Sci. Eng. A 2008, 498, 475–481. [Google Scholar] [CrossRef]
- Vinogradov, A.; Lazarev, A.; Louzguine-Luzgin, D.V.; Yokoyama, Y.; Li, S.; Yavari, A.R.; Inoue, A. Propagation of shear bands in metallic glasses and transition from serrated to non-serrated plastic flow at low temperatures. Acta Mater. 2010, 58, 6736–6743. [Google Scholar] [CrossRef]
- Louzguine-Luzgin, D.V.; Louzguina-Luzgina, L.V.; Churyumov, A. Mechanical properties and deformation behavior of bulk metallic glasses. Metals 2012, 3, 1–22. [Google Scholar] [CrossRef]
- Wang, Y.W.; Bian, X.L.; Wu, S.W.; Hussain, I.; Jia, Y.D.; Yi, J.; Wang, G. Rate dependent of strength in metallic glasses at different temperatures. Sci. Rep. 2016, 6, 27747. [Google Scholar] [CrossRef] [PubMed]
- Bian, X.; Wang, G.; Wang, Q.; Sun, B.; Hussain, I.; Zhai, Q.; Mattern, N.; Bednarčík, J.; Eckert, J. Cryogenic-temperature-induced structural transformation of a metallic glass. Mater. Res. Lett. 2016, 1–8. [Google Scholar] [CrossRef]
- Ritchie, R.O. The conflicts between strength and toughness. Nat. Mater. 2011, 10, 817–822. [Google Scholar] [CrossRef] [PubMed]
- Yi, J.; Seifi, S.M.; Wang, W.; Lewandowski, J.J. A damage-tolerant bulk metallic glass at liquid-nitrogen temperature. J. Mater. Sci. Technol. 2014, 30, 627–630. [Google Scholar] [CrossRef]
- Hufnagel, T.C.; Vempati, U.K.; Almer, J.D. Crack-tip strain field mapping and the toughness of metallic glasses. PLoS ONE 2013, 8, e83289. [Google Scholar] [CrossRef] [PubMed]
- ASTM E399. Standard Test Method for Linear-Elastic Plane-Strain Fracture Toughness KIc of Metallic Materials; ASTM: West Conshohocken, PA, USA, 2009. [Google Scholar]
- Gludovatz, B.; Naleway, S.E.; Ritchie, R.O.; Kruzic, J.J. Size-dependent fracture toughness of bulk metallic glasses. Acta Mater. 2014, 70, 198–207. [Google Scholar] [CrossRef]
- Demetriou, M.D.; Launey, M.E.; Garrett, G.; Schramm, J.P.; Hofmann, D.C.; Johnson, W.L.; Ritchie, R.O. A damage-tolerant glass. Nat. Mater. 2011, 10, 123–128. [Google Scholar] [CrossRef] [PubMed]
- Schroers, J.; Johnson, W.L. Ductile bulk metallic glass. Phys. Rev. Lett. 2004, 93, 255506. [Google Scholar] [CrossRef] [PubMed]
- Lewandowski, J.J.; Wang, W.H.; Greer, A.L. Intrinsic plasticity or brittleness of metallic glasses. Philos. Mag. Lett. 2005, 85, 77–87. [Google Scholar] [CrossRef]
- Zhang, Z.; Keppens, V.; Egami, T. A simple model to predict the temperature dependence of elastic moduli of bulk metallic glasses. J. Appl. Phys. 2007, 102, 123508. [Google Scholar] [CrossRef]
- Garrett, G.R.; Demetriou, M.D.; Chen, J.; Johnson, W.L. Effect of microalloying on the toughness of metallic glasses. Appl. Phys. Lett. 2012, 101, 241913. [Google Scholar] [CrossRef]
- Johnson, W.L.; Samwer, K. A universal criterion for plastic yielding of metallic glasses with a (T/Tg) 2/3 temperature dependence. Phys. Rev. Lett. 2005, 95, 195501. [Google Scholar] [CrossRef] [PubMed]
- Jiang, F.; Jiang, M.Q.; Wang, H.F.; Zhao, Y.L.; He, L.; Sun, J. Shear transformation zone volume determining ductile–brittle transition of bulk metallic glasses. Acta Mater. 2011, 59, 2057–2068. [Google Scholar] [CrossRef]
- Pan, D.; Inoue, A.; Sakurai, T.; Chen, M.W. Experimental characterization of shear transformation zones for plastic flow of bulk metallic glasses. Proc. Natl. Acad. Sci. USA 2008, 105, 14769–14772. [Google Scholar] [CrossRef] [PubMed]
- An, Q.; Garrett, G.; Samwer, K.; Liu, Y.; Zybin, S.V.; Luo, S.N.; Demetriou, M.D.; Johnson, W.L.; Goddard, W.A. Atomistic characterization of stochastic cavitation of a binary metallic liquid under negative pressure. J. Phys. Chem. Lett. 2011, 2, 1320–1323. [Google Scholar] [CrossRef] [PubMed]
- An, Q.; Samwer, K.; Demetriou, M.D.; Floyd, M.C.; Duggins, D.O.; Johnson, W.L.; Goddard, W.A. How the toughness in metallic glasses depends on topological and chemical heterogeneity. Proc. Natl. Acad. Sci. USA 2016, 113, 7053–7058. [Google Scholar] [CrossRef] [PubMed]
- Suh, J.Y.; Dale Conner, R.; Paul Kim, C.; Demetriou, M.D.; Johnson, W.L. Correlation between fracture surface morphology and toughness in Zr-based bulk metallic glasses. J. Mater. Res. 2011, 25, 982–990. [Google Scholar] [CrossRef]
- Garrett, G.R.; Demetriou, M.D.; Launey, M.E.; Johnson, W.L. Origin of embrittlement in metallic glasses. Proc. Natl. Acad. Sci. USA 2016, 113, 10257–10262. [Google Scholar] [CrossRef] [PubMed]
- Wang, G.; Zhao, D.Q.; Bai, H.Y.; Pan, M.X.; Xia, A.L.; Han, B.S.; Xi, X.K.; Wu, Y.; Wang, W.H. Nanoscale periodic morphologies on the fracture surface of brittle metallic glasses. Phys. Rev. Lett. 2007, 98, 235501. [Google Scholar] [CrossRef] [PubMed]
- Buehler, M.J.; Abraham, F.F.; Gao, H. Hyperelasticity governs dynamic fracture at a critical length scale. Nature 2003, 426, 141–146. [Google Scholar] [CrossRef] [PubMed]
- Buehler, M.J.; Gao, H. Dynamical fracture instabilities due to local hyperelasticity at crack tips. Nature 2006, 439, 307–310. [Google Scholar] [CrossRef] [PubMed]
- Wang, G.; Chan, K.C.; Xu, X.H.; Wang, W.H. Instability of crack propagation in brittle bulk metallic glass. Acta Mater. 2008, 56, 5845–5860. [Google Scholar] [CrossRef]
- Li, J.; Wang, Y.W.; Yi, J.; Hussain, I.; Li, R.; Zhang, B.; Wang, G. Strain-energy transport during fracture of metallic glasses. J. Alloy. Compd. 2016, 680, 43–53. [Google Scholar] [CrossRef]
- Liu, Z.Y.; Wang, G.; Chan, K.C.; Ren, J.L.; Huang, Y.J.; Bian, X.L.; Xu, X.H.; Zhang, D.S.; Gao, Y.L.; Zhai, Q.J. Temperature dependent dynamics transition of intermittent plastic flow in a metallic glass. І. Experimental investigations. J. Appl. Phys. 2013, 114, 033520. [Google Scholar] [CrossRef]
- Fineberg, J. The dynamics of rapidly moving tensile cracks in brittle amorphous material. In Dynamic Fracture Mechanics; World Scientific: Hong Kong, China, 2006; pp. 104–146. [Google Scholar]
- Wang, G.; Han, Y.N.; Xu, X.H.; Ke, F.J.; Han, B.S.; Wang, W.H. Ductile to brittle transition in dynamic fracture of brittle bulk metallic glass. J. Appl. Phys. 2008, 103, 093520. [Google Scholar] [CrossRef]
Figure 1.
Geometric size of the compact tension specimen.

Figure 2.
Load-displacement curves at different temperatures.
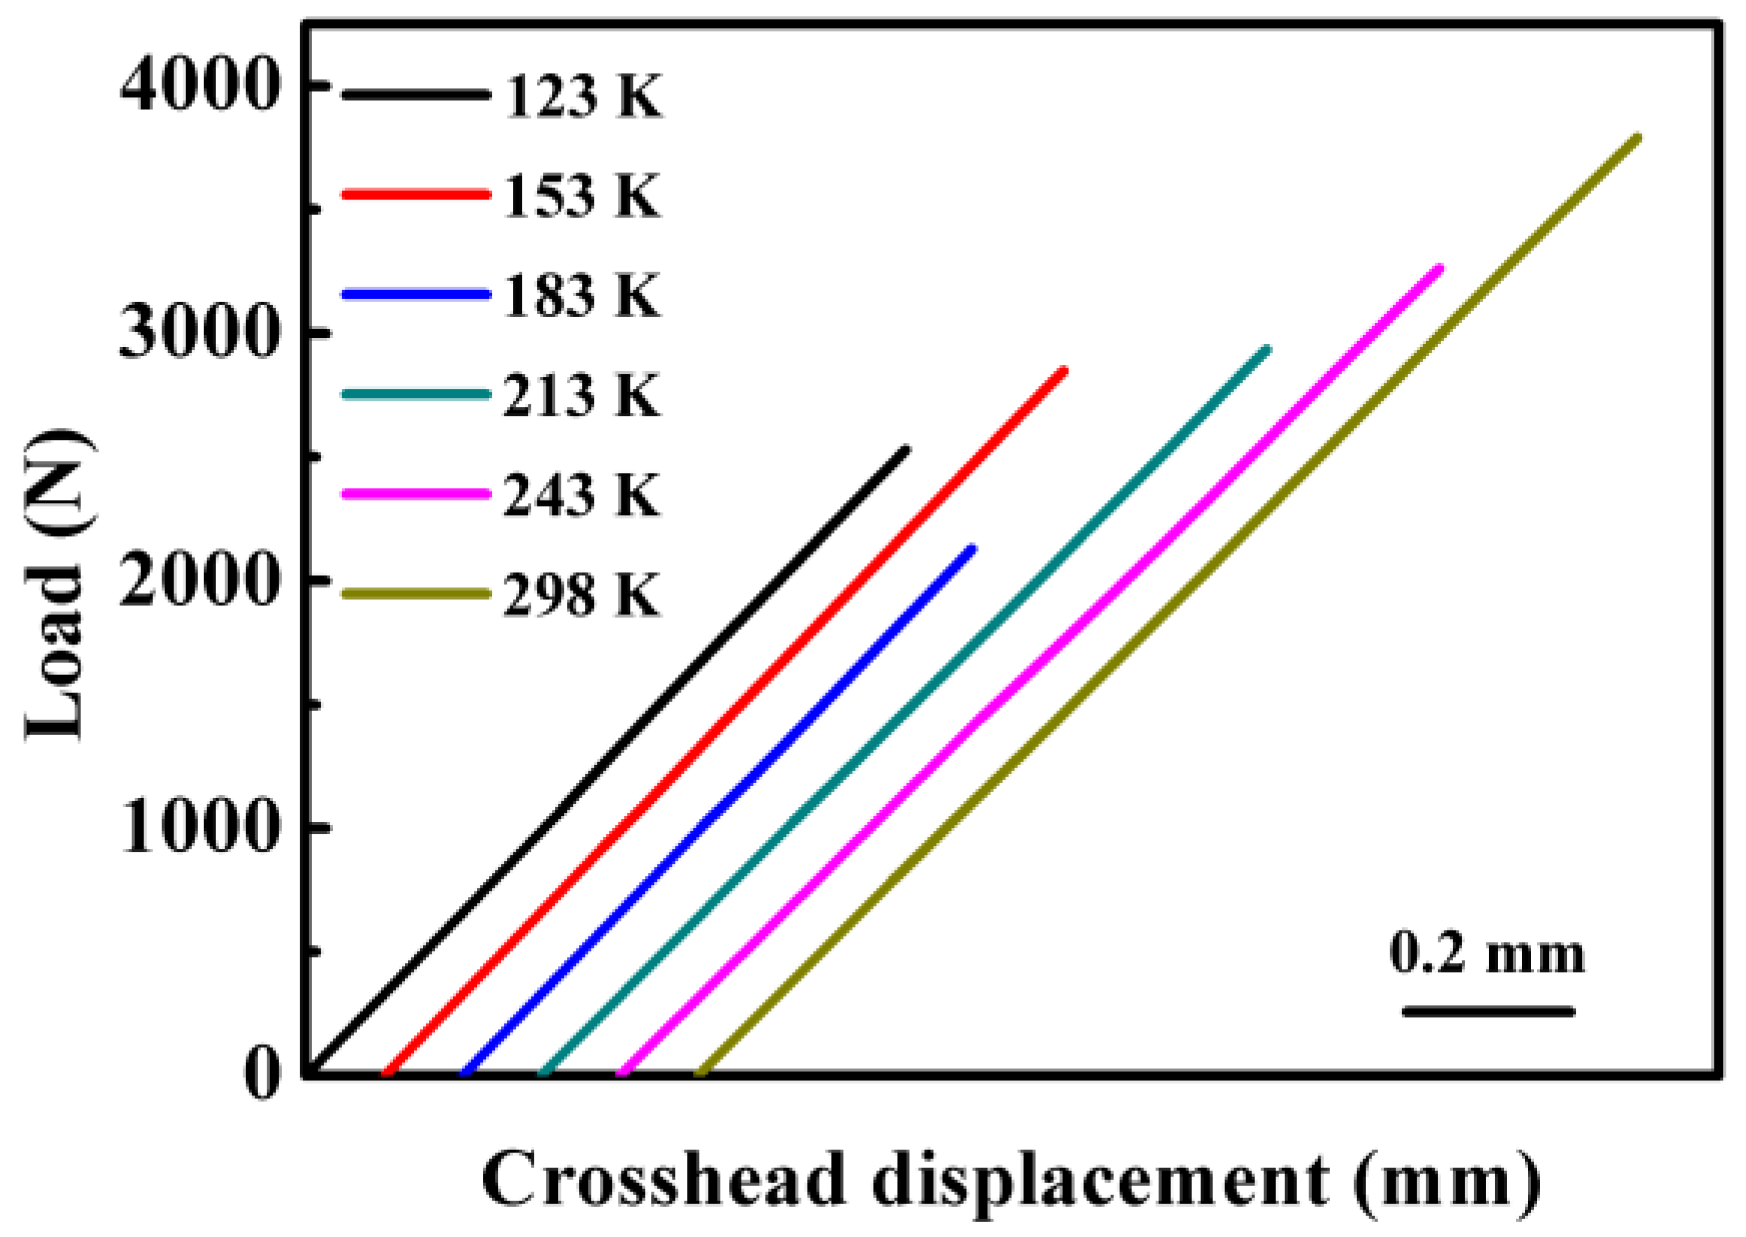
Figure 3.
Notch fracture toughness, KQ, of the metallic glass (MG) as a function of temperature.

Figure 4.
Representative fractographic evolution for the MG. (a) Overview (arrow indicates the crack propagation direction); (b–g) 3D fractographies at points І, II, Ш, IV, V and VI in (a), respectively.
Figure 4.
Representative fractographic evolution for the MG. (a) Overview (arrow indicates the crack propagation direction); (b–g) 3D fractographies at points І, II, Ш, IV, V and VI in (a), respectively.
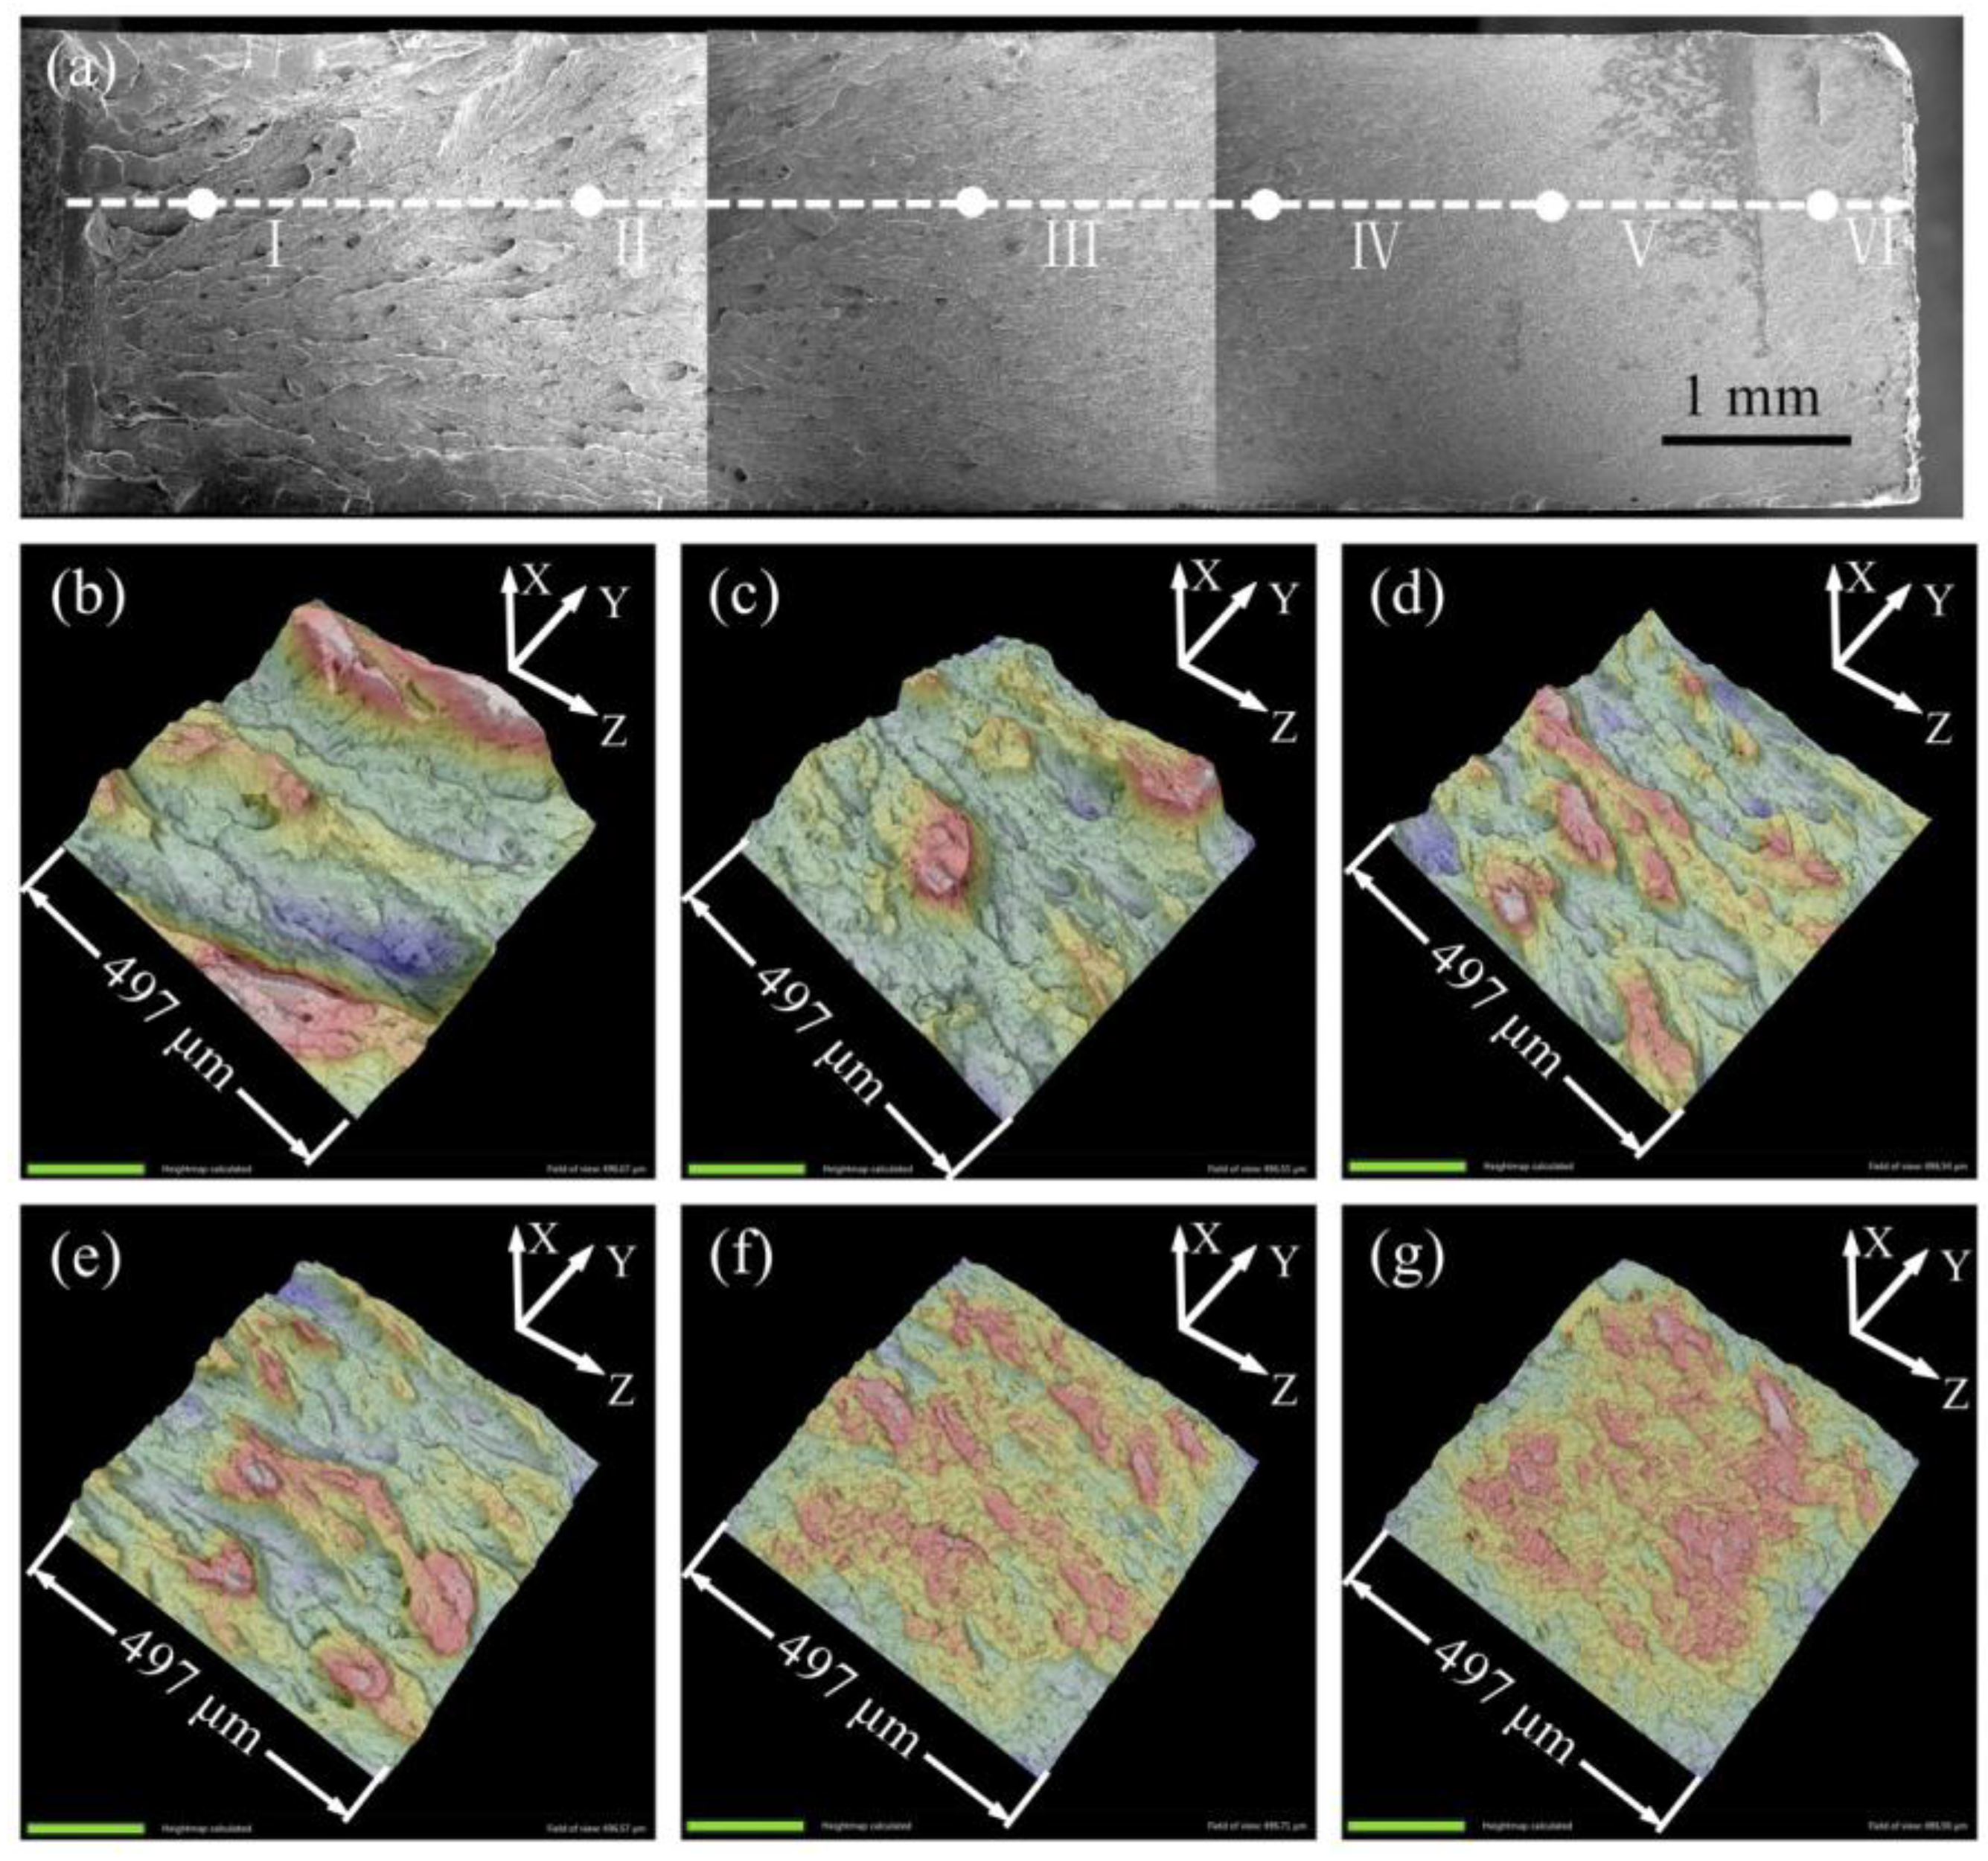
Figure 5.
Fracture surface roughness, Ra, as a function of crack propagation distance, L, at different temperatures.
Figure 5.
Fracture surface roughness, Ra, as a function of crack propagation distance, L, at different temperatures.
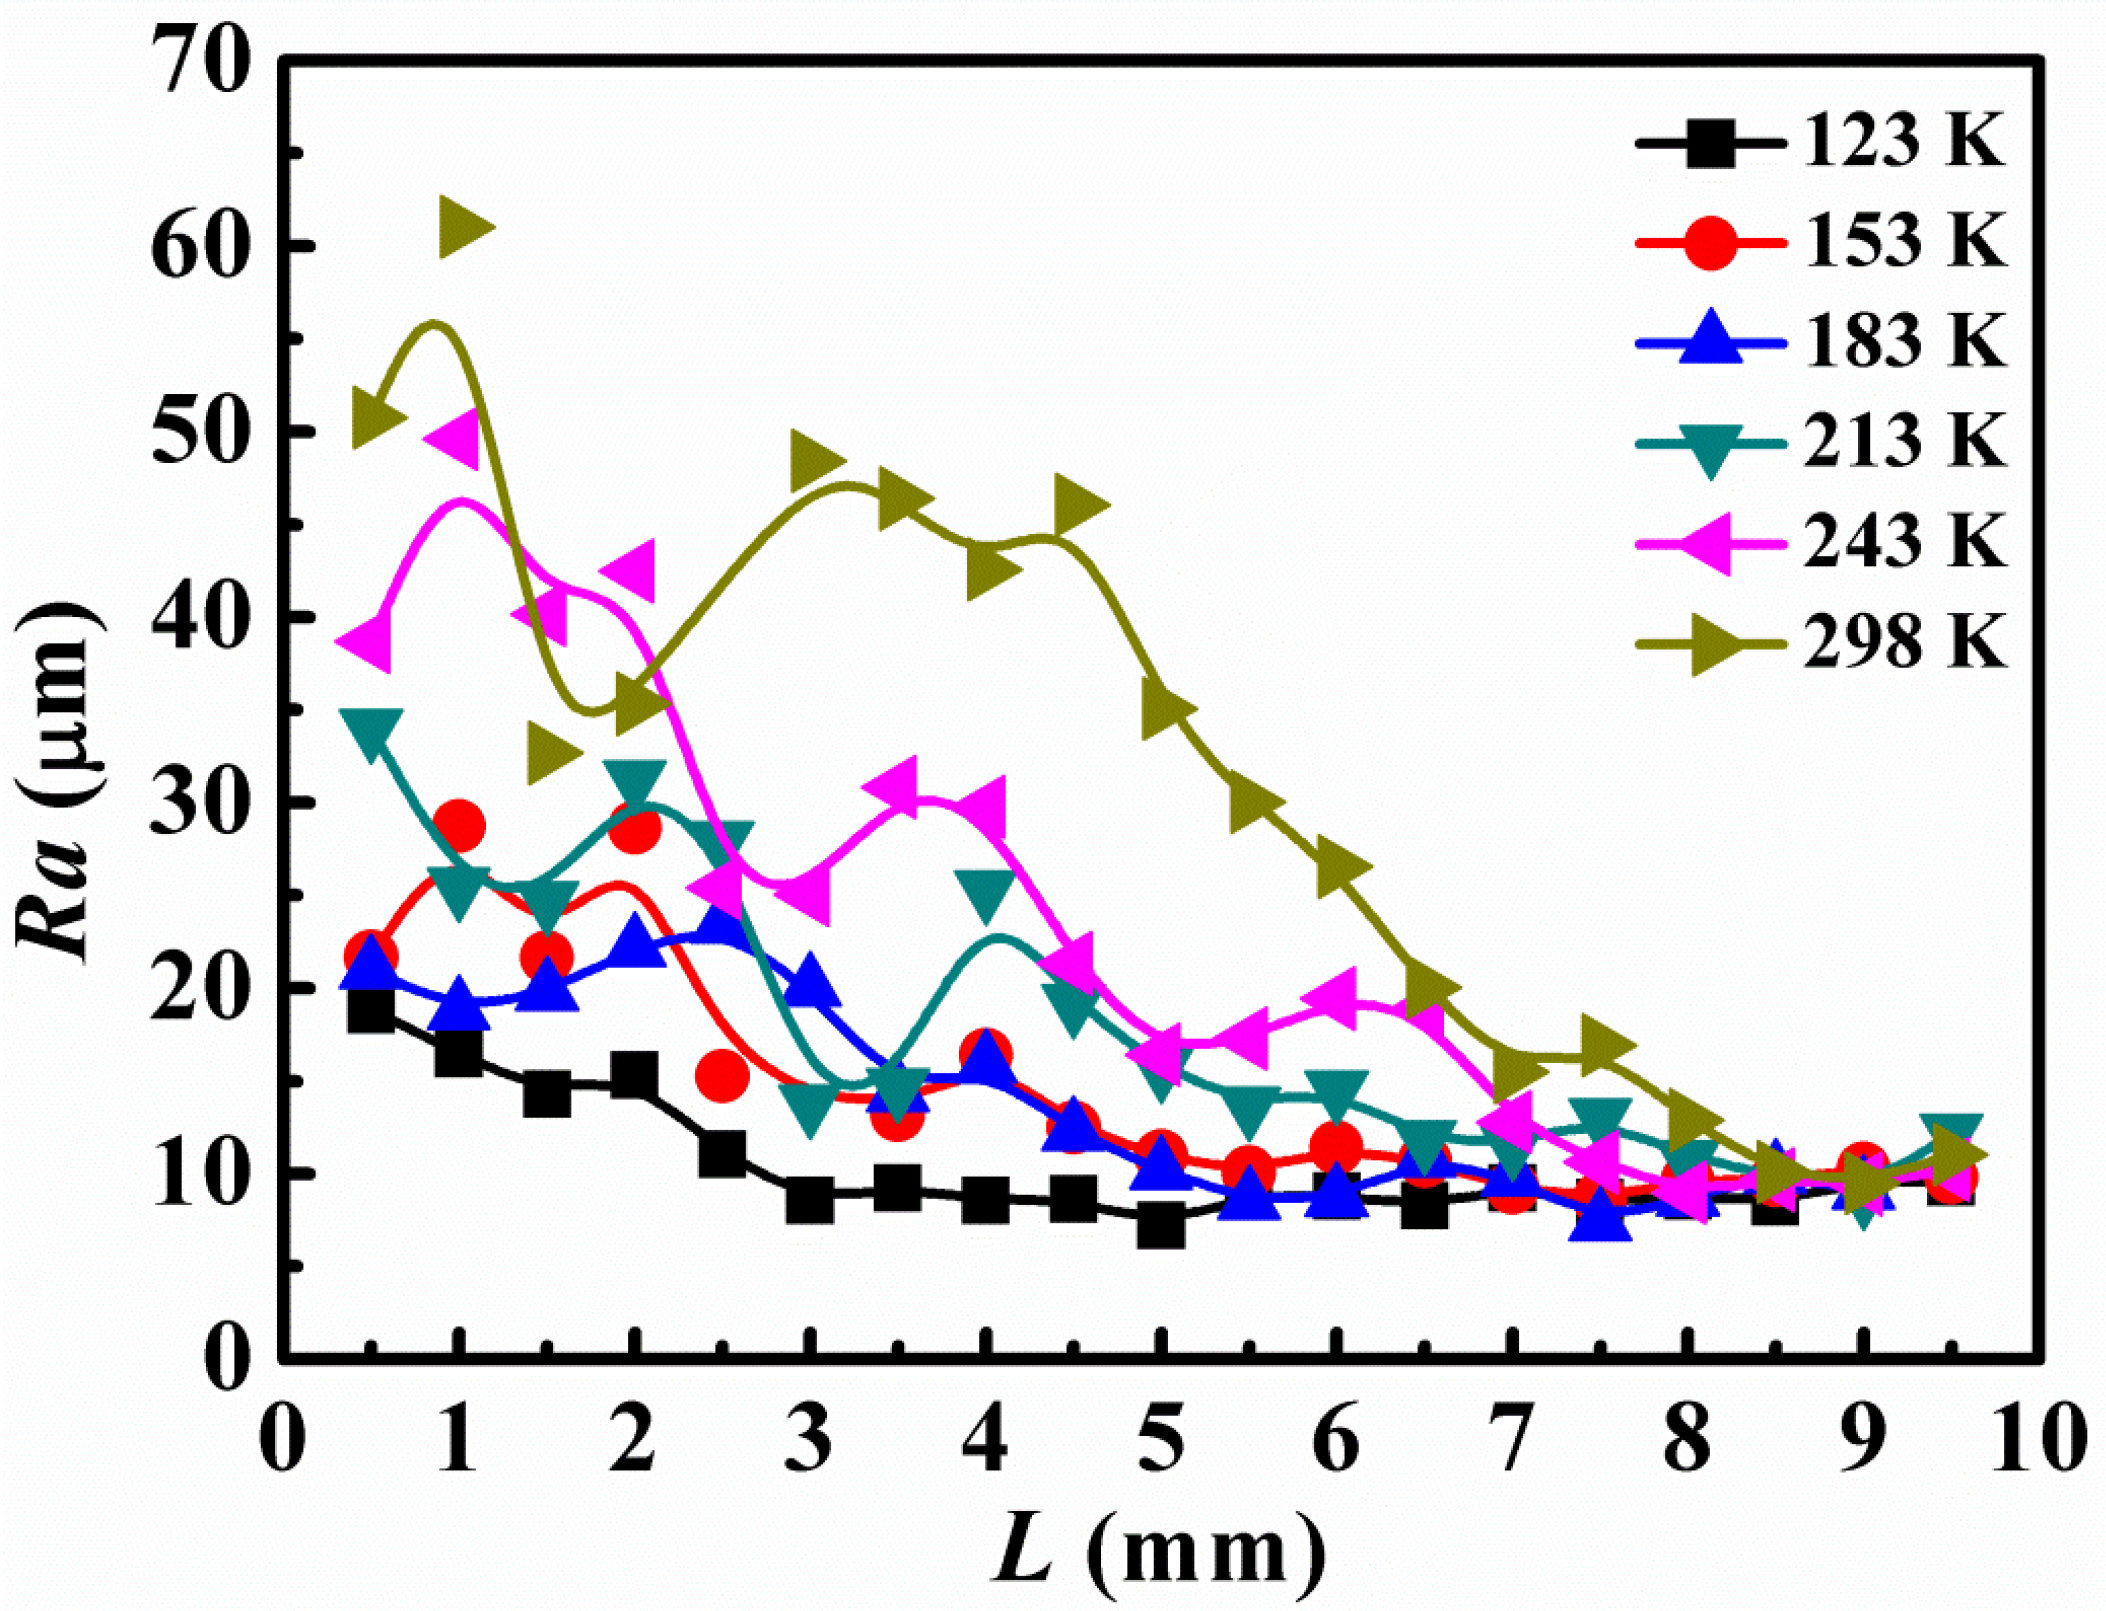
Figure 6.
SEM images of the lateral surface of the MG samples after fracture at different temperatures. (a) 123 K; (b) 153 K; (c) 183 K; (d) 213 K; (e) 243 K; (f) 298 K.
Figure 6.
SEM images of the lateral surface of the MG samples after fracture at different temperatures. (a) 123 K; (b) 153 K; (c) 183 K; (d) 213 K; (e) 243 K; (f) 298 K.
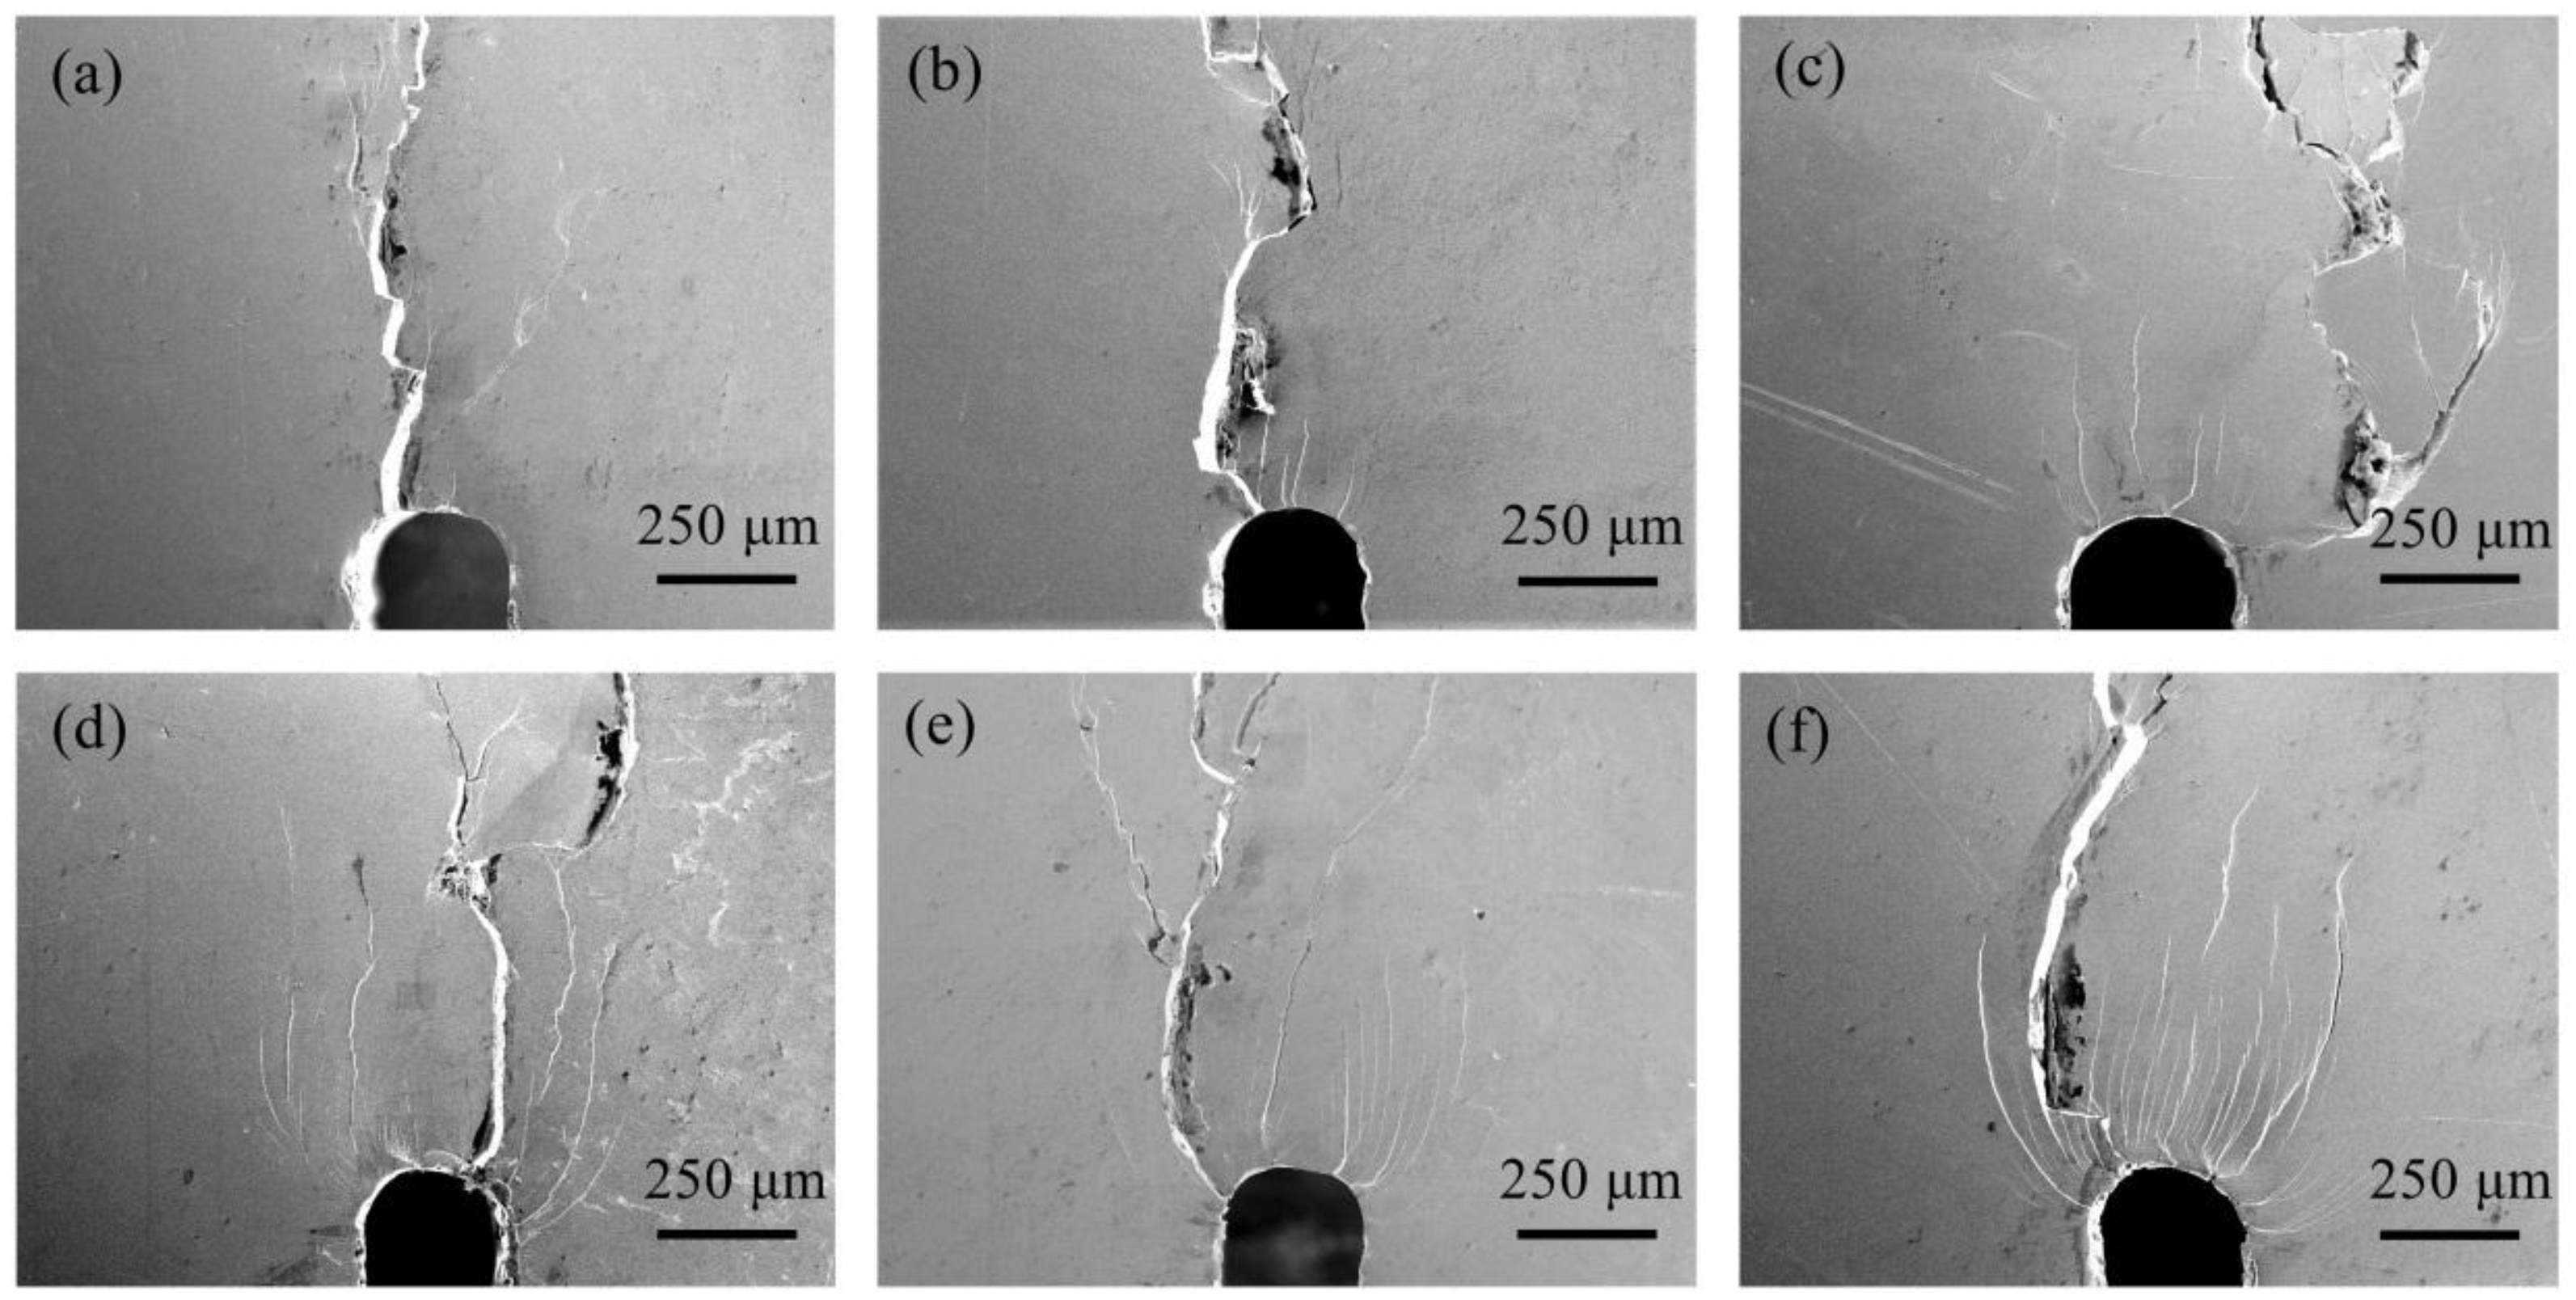
Figure 7.
(a) Variation of shear modulus, G, and bulk modulus, B, with decreasing temperature; (b) variation of Possion’s ratio, ν, and the ratio of G/B with decreasing temperature.
Figure 7.
(a) Variation of shear modulus, G, and bulk modulus, B, with decreasing temperature; (b) variation of Possion’s ratio, ν, and the ratio of G/B with decreasing temperature.

Figure 8.
The shear transformation zone (STZ) volume as a function of temperature.
© 2017 by the authors. Licensee MDPI, Basel, Switzerland. This article is an open access article distributed under the terms and conditions of the Creative Commons Attribution (CC BY) license (http://creativecommons.org/licenses/by/4.0/).
Share and Cite
MDPI and ACS Style
Zhou, Y.; Liu, J.; Han, D.; Chen, X.; Wang, G.; Zhai, Q. Reduced Fracture Toughness of Metallic Glass at Cryogenic Temperature. Metals 2017, 7, 151. https://doi.org/10.3390/met7040151
AMA Style
Zhou Y, Liu J, Han D, Chen X, Wang G, Zhai Q. Reduced Fracture Toughness of Metallic Glass at Cryogenic Temperature. Metals. 2017; 7(4):151. https://doi.org/10.3390/met7040151
Chicago/Turabian StyleZhou, Yihao, Jiaxin Liu, Dongxue Han, Xiangru Chen, Gang Wang, and Qijie Zhai. 2017. "Reduced Fracture Toughness of Metallic Glass at Cryogenic Temperature" Metals 7, no. 4: 151. https://doi.org/10.3390/met7040151
Note that from the first issue of 2016, this journal uses article numbers instead of page numbers. See further details here.