
A Non-Destructive Technique for the On-Line Quality Control of Green and Baked Anodes †


University Research Centre on Aluminum (CURAL)—Aluminum Research Centre (REGAL), University of Quebec at Chicoutimi, Chicoutimi, QC G7H 2B1, Canada
*
Author to whom correspondence should be addressed.
Metals 2017, 7(4), 128; https://doi.org/10.3390/met7040128
Submission received: 13 February 2017
/
Revised: 27 March 2017
/
Accepted: 1 April 2017
/
Published: 6 April 2017
(This article belongs to the Special Issue Selected Papers from the International Committee for Study of Bauxite, Alumina & Aluminium 2016)
Abstract
:Carbon anodes play an important role in the electrolytic production of aluminum. They have a significant economic and environmental impact. Carbon anodes are made of dry aggregates, composed of petroleum coke, recycled rejects, and butts, bound by coal tar pitch. Due to several factors, defects (cracks/pores) appear in anodes during the fabrication process, affecting their quality. It is thus essential to control the quality of anodes before their use in the electrolysis cell. Current practice for the quality evaluation (visual inspection, core analysis) gives limited information. As an alternative to this practice, electrical resistivity measurements can be used. Electrical resistivity is one of the key indicators for anode quality and its homogeneity. A simple and non-destructive method has been developed for the specific electrical resistivity measurement of anodes (SERMA) for on-line control of anode quality. Various tests have been carried out at both lab scale and industrial scale. In this study, the electrical resistivity distributions in the lab-scale anodes were measured and compared with those of the tomography analysis. The method is able to detect defective anodes even before the baking process.
1. Introduction
Carbon anodes are used in the electrolysis cell for the production of primary aluminum according to the Hall–Hérault process. These anodes are made of a dry aggregate composed of calcined petroleum coke, butts, and green and baked rejects. The dry aggregate particles are bound by coal tar pitch. The dry aggregate and the pitch are mixed to make the anode paste. Then, the paste is compacted in a press or a vibro-compactor to produce green anodes. Nowadays, industries use mostly vibro-compactors equipped with a vacuum. This improves the compaction of particles by adjusting their orientation and facilitates the removal of the pitch volatiles. The green anodes are baked in a baking furnace. During the baking process, the volatiles in pitch are removed from the carbon material. Cracks are created in the anode material due to the pressure induced by the volatiles [1,2,3]. These defects affect the final quality of the anode and increase the production cost and energy consumption.
In industry, the anode quality is usually inspected by two methods: visual inspection of the anode surface and analysis of a cylindrical sample (core) taken from the anode. The visual inspection gives only limited information since the inside of the anode cannot be examined. Core analysis can provide significant information; however, it is a destructive technique and can only be applied to a few anodes (about 1.5% of the anodes produced) during anode production. Also, the sample is taken from a region near the top of the anode, which does not necessarily represent the entire anode [1].
There are some non-destructive methods which are used to evaluate anode quality in the laboratory but are not applied to the inspection of industrial anodes. Among these methods, ultrasound inspection is used for the detection of defects, dimensional measurement and material characterization. This non-destructive method has been widely used in the inspection of composite materials [4,5,6]. However, applications of the acoustic method for testing complex porous materials are not common. This method is usually used in materials that are expected to be free of internal voids. The main issue with porous materials is separating defects (cracks) from the internal porosity as both types of voids attenuate the propagation of the acoustic waves through the materials [7]. Its application is difficult on rough, irregular, and heterogeneous porous materials [8]. Amrani et al. [9,10] performed an ultrasound inspection on core samples from carbon anodes and were able to detect the cracks in these samples. Boubaker et al. [7] identified defects in industrial anodes. It may be noted that they cut the anode in slices, and then measured the defects in each of the slices. They also used acoustic coupling (gel type) to ensure a good contact between the acoustic sensors and the baked anode samples.
Eddy current testing is a method used for the detection of defects in a conducting material. The application of this technique has been published in the literature [4,11,12]. Haldemann and Fawzi [5] developed an eddy-current based system to detect flaws in carbon anodes. In their system, the eddy current was induced by a coil surrounding the carbon block. Then, by measuring the impedance of the coil, it was possible to detect the presence of cracks. The authors complemented this method with the electrical resistivity measurement using the four-point method. The main drawback of this system is the limited penetration of the eddy current into large anodes, and the influence of external magnetic fields. The eddy-current testing method is limited to thin samples because of the short penetration of the electromagnetic field into the carbon material.
Audet and Parent [6] designed a system made of one emitting coil and two receiving coils connected to a sensing device. A carbon anode sample was moved in the emitting coil resulting in the modification of the electromagnetic field. Thus, a current was induced in the receiving coils. By comparing the measured signal to that obtained using a reference sample, the authors were able to estimate the electrical conductivity of the sample. This system was limited by the short penetration of the electromagnetic field into the sample. The large size of the coils also restricted the industrial implementation. Moreover, it required calibration using a homogeneous reference anode which is difficult to do in practice. In addition, the systems developed by Haldemann and Fawzi [5], and Audet and Parent [6] give bulk information about the sample but cannot locate the position of the defect.
As explained above, both the ultrasound and the eddy-current testing methods have certain limitations while measuring defects in carbon anodes which have rough surfaces, large dimensions as well as cracks/pores. To overcome this limitation, the electrical resistivity measurement can be used and is an efficient and promising non-destructive testing method. This method is widely used in mining, civil engineering and composite material characterization. Matsui et al. [13] developed a system to measure the electrical resistivity of various rock samples. They related the measured resistivity to the physical properties of the rock. Schueler et al. [14] used electrical impedance tomography to detect damages in carbon-fiber-reinforced polymers. Electrical impedance tomography is a non-destructive imaging technique in which the electrical conductivity, permittivity, or impedance of a sample is inferred from surface electrode measurements and used to form a tomographic image of that sample. Karhunen et al. [15] reported a 3D imaging of concrete using impedance tomography. Lataste et al. [16] developed a four-point electrical resistivity measurement system to detect defects in concrete. There are some publications where electrical resistivity measurement has been applied to carbon anodes [17,18,19,20,21]. Seger [17] developed a system to measure the electrical resistivity of baked anodes. In this system, the current was injected into the anode from the top through the stub holes and left the anode through a set of probes in contact with the bottom surface. The electrical resistivity was obtained by measuring the voltage drop between the stub and the contact probes and the current flowing through each probe. Later, Chollier-Bryn et al. [18] and Léonard et al. [19] developed similar systems where they tried to reproduce the current distribution in a baked anode in the electrolysis cell. In this system, the current entered the anode through the stub holes (initially using inflatable metallic bags which were later replaced by metallic contacts) and left it from the bottom surface through a metallic brush carpet. The voltage drop was measured between a reference point on the top surface and predefined points on the side surfaces. The electrical resistivity was calculated by comparing the voltage drop to that obtained by a numerical simulation of the current distribution in the anode. The system [17,18,19] gave an idea of the overall quality of the anode. These systems were applied only to baked anodes, and not to green anodes.
A non-destructive testing method based on the electrical resistivity measurement has been developed and tested on lab-scale and industrial anodes (SERMA—Specific Electrical Resistance Measurement of Anodes) [20,21]. The principle of this system is also given in the same references. It is able to not only detect flaws in carbon anodes, but also localize these flaws and give an indication about the anode heterogeneity. The measurement of electrical resistivity distribution in green anodes is difficult due to the high resistivity of the anode, non-homogeneous distribution of pitch, and poor conductivity of pitch. The system is designed for both green and baked anodes; and this offers the advantage of rejecting defective green anodes that will help save the cost of baking. In the lab, it is possible to produce anodes under different conditions and with or without specific defects, and the study of these anodes allows the verification of SERMA for its capacity to identify those defects. In this article, the results of the tests on the laboratory anodes produced with specific defects as well as their comparison with those obtained by the X-ray tomographic analysis are presented.
2. Methodology
2.1. Fabrication of Anodes in the Laboratory
The experiments were carried out on anodes fabricated in the laboratory of the University of Quebec at Chicoutimi, Canada. The granulometry and the fabrication procedure were similar to those employed in industry. Only the dimensions were different, which are, of course, much smaller compared to the industrial anodes. Each anode weighs about 10 kg. The dimensions are not given due to confidentiality. Three anodes were used for the purpose of this study. The recipes used for the three anodes are summarized in Table 1. The detailed recipe and the values of X, Y and Z were not revealed due to confidentiality. In all the anodes, the same amount of pitch was added. In this work, all the experiments were done relative to the recipe of Anode 1. The materials were supplied by the industry and were used as received. The received butt particles were hard butt particles.
The first one (Anode 1) was made using the recipe described in Table 1. Anode 2 was similar to Anode 1 except that medium butt particles were replaced by medium coke particles. On the other hand, the amount of coarse butt particles was increased and the amount of coarse coke particles was decreased by the same amount used to modify medium butt and coke particles. The overall granulometry (total coarse, medium and fine particles) was maintained the same. The presence of such large butt particles affects the anode properties such as density, porosity, and electrical resistivity. Finally, Anode 3 was fabricated following a special preparation procedure. The mold was divided into three sections (two bottom sections side by side and one top section covering the entire area) as shown in Figure 1. The paste containing the dry aggregate particles was sieved and divided into three parts according to their size. Paste containing the particles of the fraction identified as 6.3 mm − 4 mm + (mentioned as 4 mm fraction) was placed in one of the bottom sections of the mold (see Figure 1). Paste containing the particles of the fraction identified as 4 mm − 2 mm + (mentioned as 2 mm fraction) was put in the second bottom section. The paste containing the remaining particles was added above these two sections. In this manner, an anode was fabricated with high heterogeneity (see Figure 1). All anodes were fabricated under similar forming and baking conditions.
2.2. Measurement of Electrical Resistivity
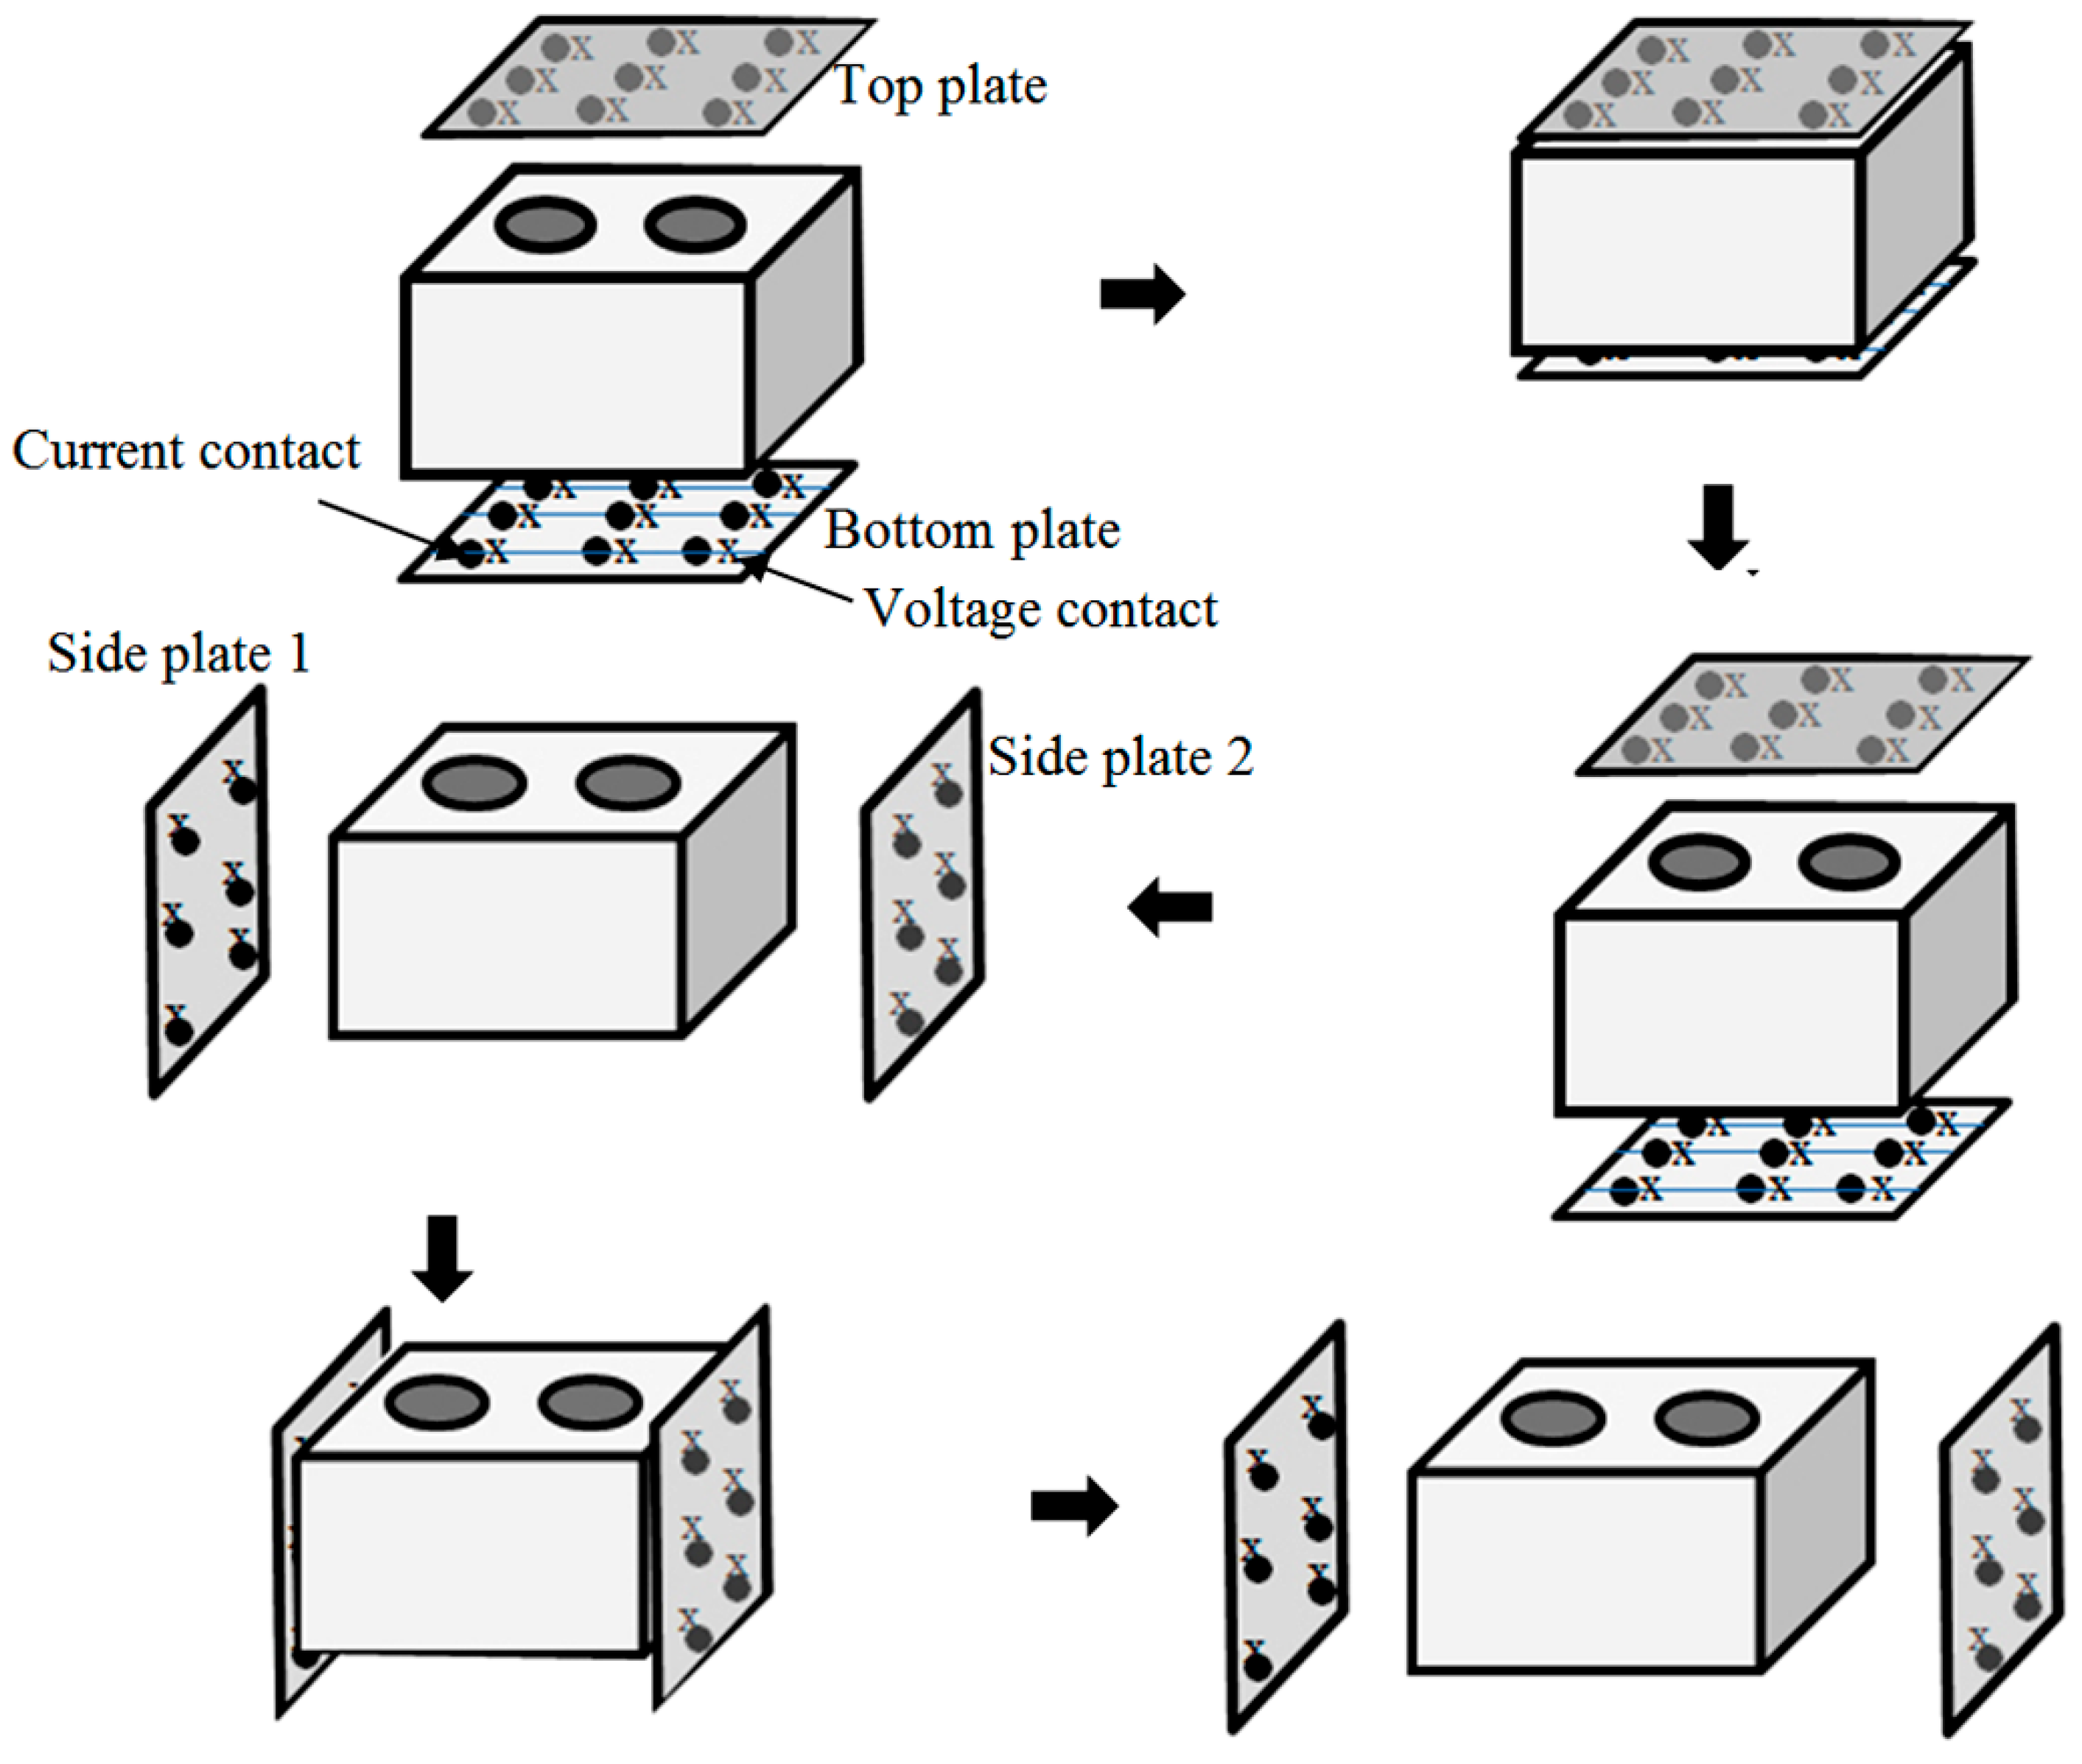
The method presented in this study consists of measuring the electrical resistivity of carbon anodes using a quick and simple procedure that can easily be implemented on-line to monitor anode quality during the anode production process. The technique is based on passing a known current through an anode using multiple points between two opposite faces and measuring the corresponding voltage drops at each point. Four plates were used for the measurements: two plates between the top and bottom surfaces of the anode and two plates between the side surfaces. Each pair of plates contained a certain number of contacts at exactly the same positions to feed current from one anode surface and to receive current from the opposite anode surface. These contacts were connected to a power supply of 5 A. The voltage contacts were installed, adjacent to the current contacts, on both plates to be able to measure the voltage drop at a given position. The current and voltage contacts were distributed over the plate covering the entire anode surface. Thirty (5 × 6 grid) and twenty-five (5 × 5 grid) contacts were used for the top/bottom and side surfaces, respectively. Figure 2 describes schematically the measurement method.
The experimental procedure consists of two main steps. In the first step, the voltage measurements were carried out between the top and bottom faces of the anode. These measurements were plotted to get a map of the electrical resistivity distribution in the horizontal direction. In the second step, the voltage measurements were carried out between the small side faces. The results were also plotted to get a map of the electrical resistivity distribution in the vertical direction. The highly resistive regions indicated the presence of a defect. The intersection of the highly resistive sections measured by the two steps helped identify the position of the defective/cracked regions in the anode. This method was applied to the anodes before and after baking. The electrical resistivity measurement equipment not only permits the detection of a defect in the anode, but also helps identify the problems during the fabrication process.
2.3. Analysis of Tomography Results
An X-ray tomography analysis was carried out on the baked anodes at the National Institute for Scientific Research (INRS, Québec, QC, Canada). X-ray tomography is a non-destructive technique to visualize the interior features within solid objects. The tomography provides image files representing slices of the anode taken at consecutive positions. Each image is made of a number of voxels of a resolution of about 0.3 to 0.4 mm and a thickness of about 0.6 mm. For each voxel, a value of the optical density, resulting from the X-ray beaming, is assigned. The optical density is expressed in Hounsfield unit (HU). In HU scale, air and distilled water at standard temperature and pressure have optical densities of −1000 and 0 HU, respectively. Usually, the optical density increases with increasing solid density. In tomography figures, the cracks (low density regions) appear dark. The value of a voxel is directly correlated to the density of the material at that location. Thus, a threshold value for the optical density can be applied to identify the defects or cracks which usually have low optical density. A custom-made Matlab program (Matlab version: 2015a, the custom-made software was developed by the carbon research group of UQAC, Chicoutimi, QC, Canada) was used to do the analysis.
2.4. Comparison of Electrical Resistivity and Tomography Results
The tomography results were obtained from top to bottom for each of the baked anodes. It is possible to calculate the defects in different layers of the anode by analyzing the tomography results. In that case, the tomography results cannot be compared with the electrical resistivity measurements of the baked anodes since, in electrical resistivity measurement, the overall resistivities at different points were measured between the top and the bottom surfaces. Thus, in the tomographic analysis, the defects in different horizontal layers were added to determine the overall distribution of defects between the top and the bottom surfaces. These two results were compared. A highly resistive region in the horizontal direction should ideally correspond to a region with more defects obtained from the tomography results.
3. Results and Discussion
3.1. Analysis of the Electrical Resistivity Measurement
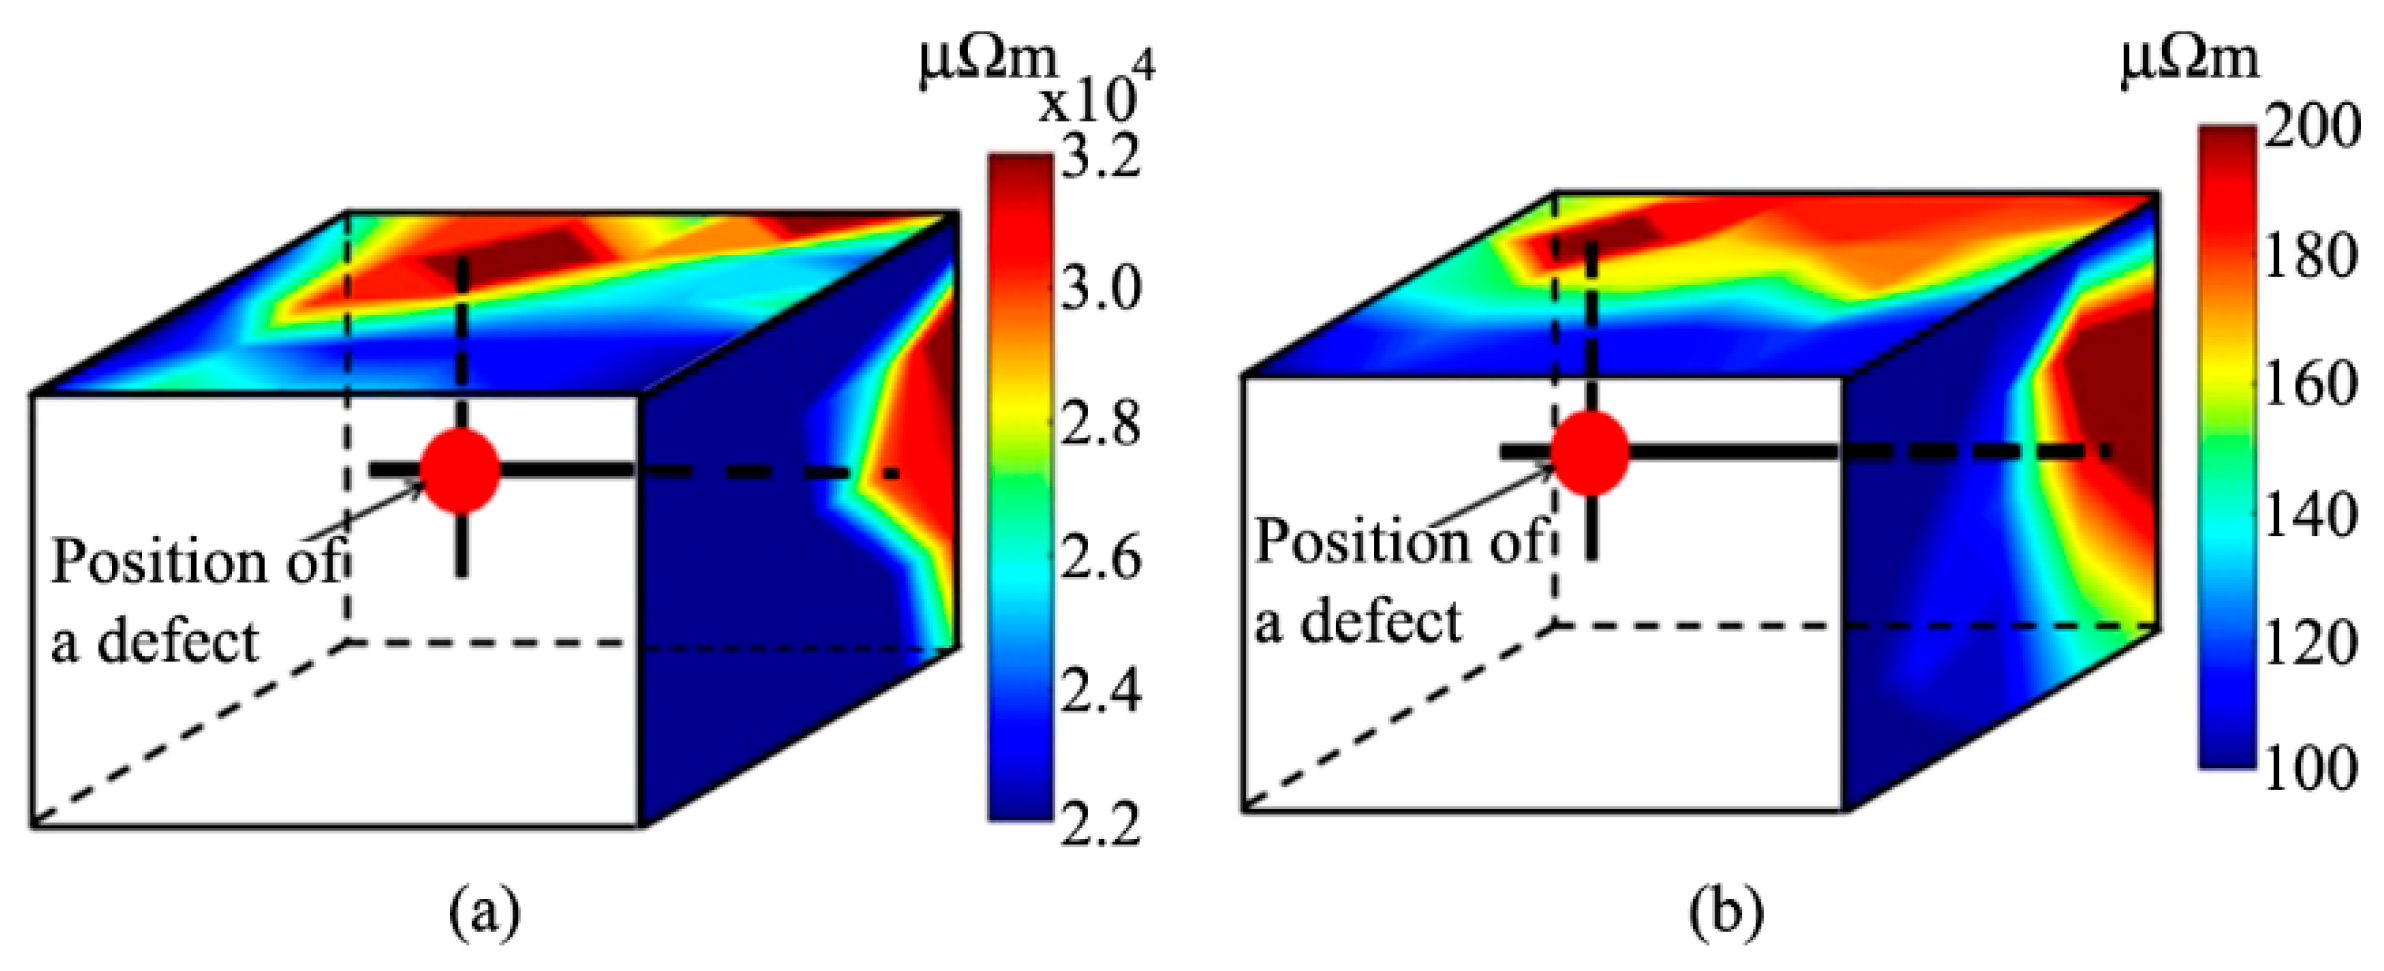
The SERMA set-up, as described previously, was used to measure the electrical resistivity for the three anodes before and after baking. The results of the baked anodes are presented in detail in this paper in order to compare the results with the tomography analysis of the baked anodes. One example of the electrical resistivity distribution in a green anode is also presented. Figure 3a,b show the electrical resistivity distribution of Anode 3 in two directions before and after baking, respectively. As can be seen from this figure, there is a good correspondence between the high electrical resistivity regions of green and baked anodes. The highly resistive point in the green anode showed some movement, probably due to the redistribution of pitch and the volatile release during the baking process. Thus, the green anode quality is an indicator of the baked anode quality. The electrical resistivity distribution matched also with the specific distribution of particles in the anode (see Figure 1).
Figure 3 also shows an example of how a cracked/defective region could be located using the current equipment. The intersections of the highly resistive regions in two directions show the position of that defective region in the anode.
The values of the electrical resistivity distribution between the top and bottom surfaces of the baked anodes were compared with the tomography results. These are shown in Figure 4, Figure 5 and Figure 6 for Anodes 1, 2, and 3, respectively.
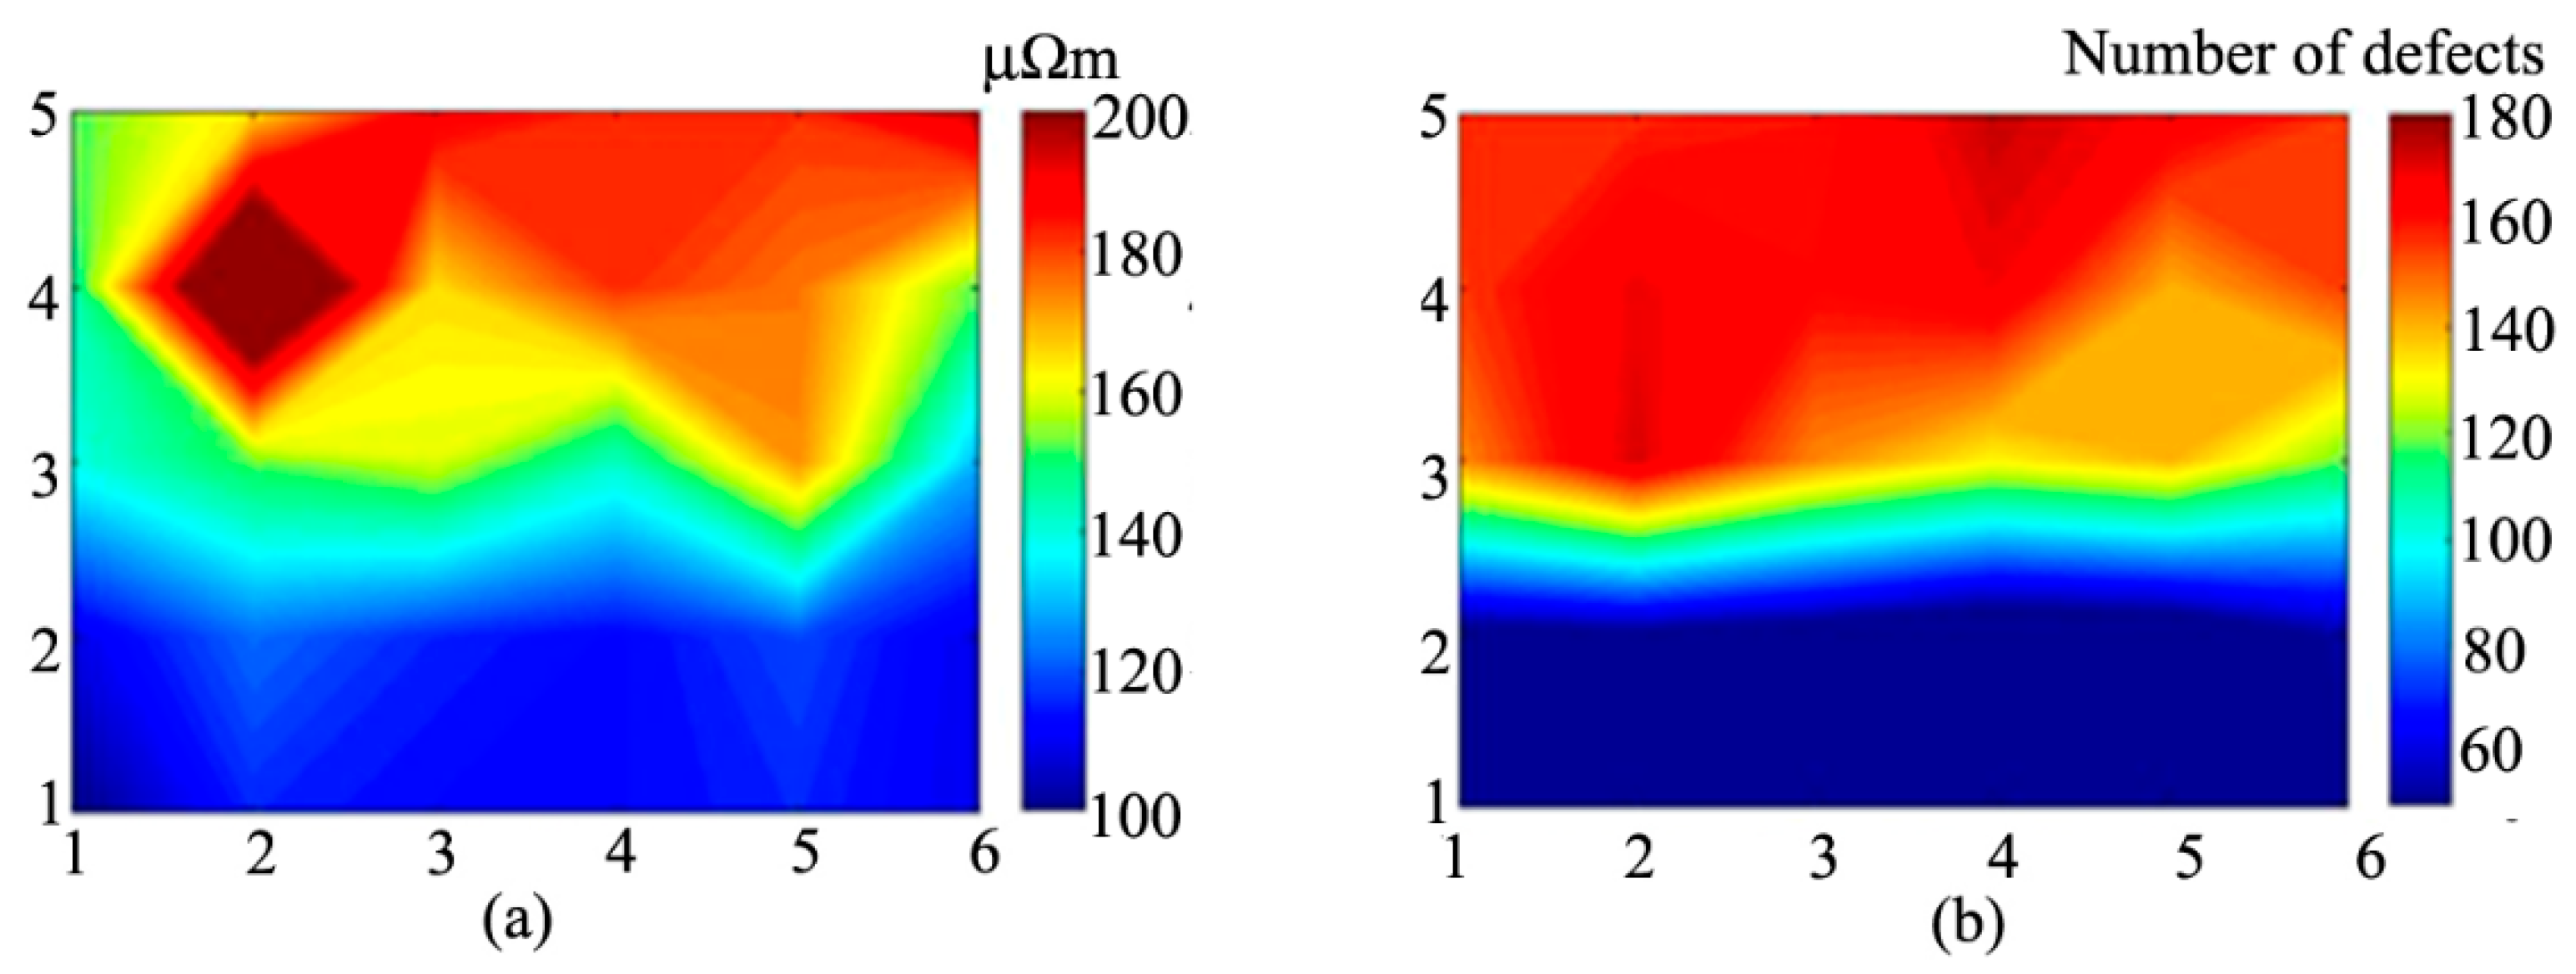
Figure 4a, Figure 5a and Figure 6a show the electrical resistivity distribution between the top and bottom surfaces for Anodes 1, 2, and 3, respectively, after baking. In all the anodes, high resistive points can be found. The positions with high electrical resistivity indicate the presence of defects/cracks. The average electrical resistivity value of Anode 2 was lower than that of Anode 1. The presence of large butt particles in Anode 2 likely affected the average electrical resistivity since butt particles are usually denser and relatively better conductors compared to the more porous fresh coke particles.
For Anode 3, two distinct regions with different electrical resistivity values can be observed. This is due to the particle distribution in the anode. The large particles in one section increased the porosity, and consequently increased the electrical resistivity in that zone. This is an extreme situation that does not normally happen in an industrial anode; however, it helped test the ability of the system to detect highly resistive regions in a heterogeneous anode.
3.2. Tomographic Analysis
As explained previously, an X-ray tomography analysis was carried out on the baked anodes used in this study. A simple visualization of a tomographic image may not necessarily permit a good comparison between this tomographic analysis and the electrical resistivity measurement. The defects are sometimes small, discontinuous and spread everywhere inside the anode. On the other hand, the measured electrical resistivity reflects the total resistance encountered by the current in its path due to those defects. Therefore, it is important to quantify the cumulative number of defects in vertical lines between the top and the bottom surfaces of the anode in the tomographic analysis (Figure 4b, Figure 5b and Figure 6b).
Figure 4, Figure 5 and Figure 6 compare the cumulative number of defects (cracks/pores) obtained from the tomographic analysis with the electrical resistivity measurement in the vertical direction. In order to make this comparison easier, the cumulative number of defects was calculated at the same points as for those of the electrical resistivity measurement. A high value in the tomography result shows the presence of a large number of defects. Similarly, a high value of electrical resistivity represents the presence of crack/defects. Thus, a high value in one of the figures should ideally correspond to a high value in the other figure. These figures show that there is globally a good agreement between the electrical resistivity measurements and the tomographic analyses for the three anodes. Despite having few differences, most of the regions showing high electrical resistivity values corresponded to those with a high cumulative number of defects. It is important to keep in mind that these contours were plotted only on the measurement points and not on all the voxels. The difference between the two plots might also be explained by the uncertainty on the probe position in the experimental setup, the roughness of the anode surfaces, and the threshold value of the optical density chosen to detect the defects. It should be noted that the optical density at each voxel is the weighted average of the optical densities of different components (coke, pitch, pores/cracks) present in the voxel (0.3 mm × 0.4 mm × 0.6 mm). Thus, it is possible that X-ray tomography might not be able to identify small cracks in different cases. On the other hand, electrical resistivity values are influenced even in the presence of small cracks and can be identified with SERMA.
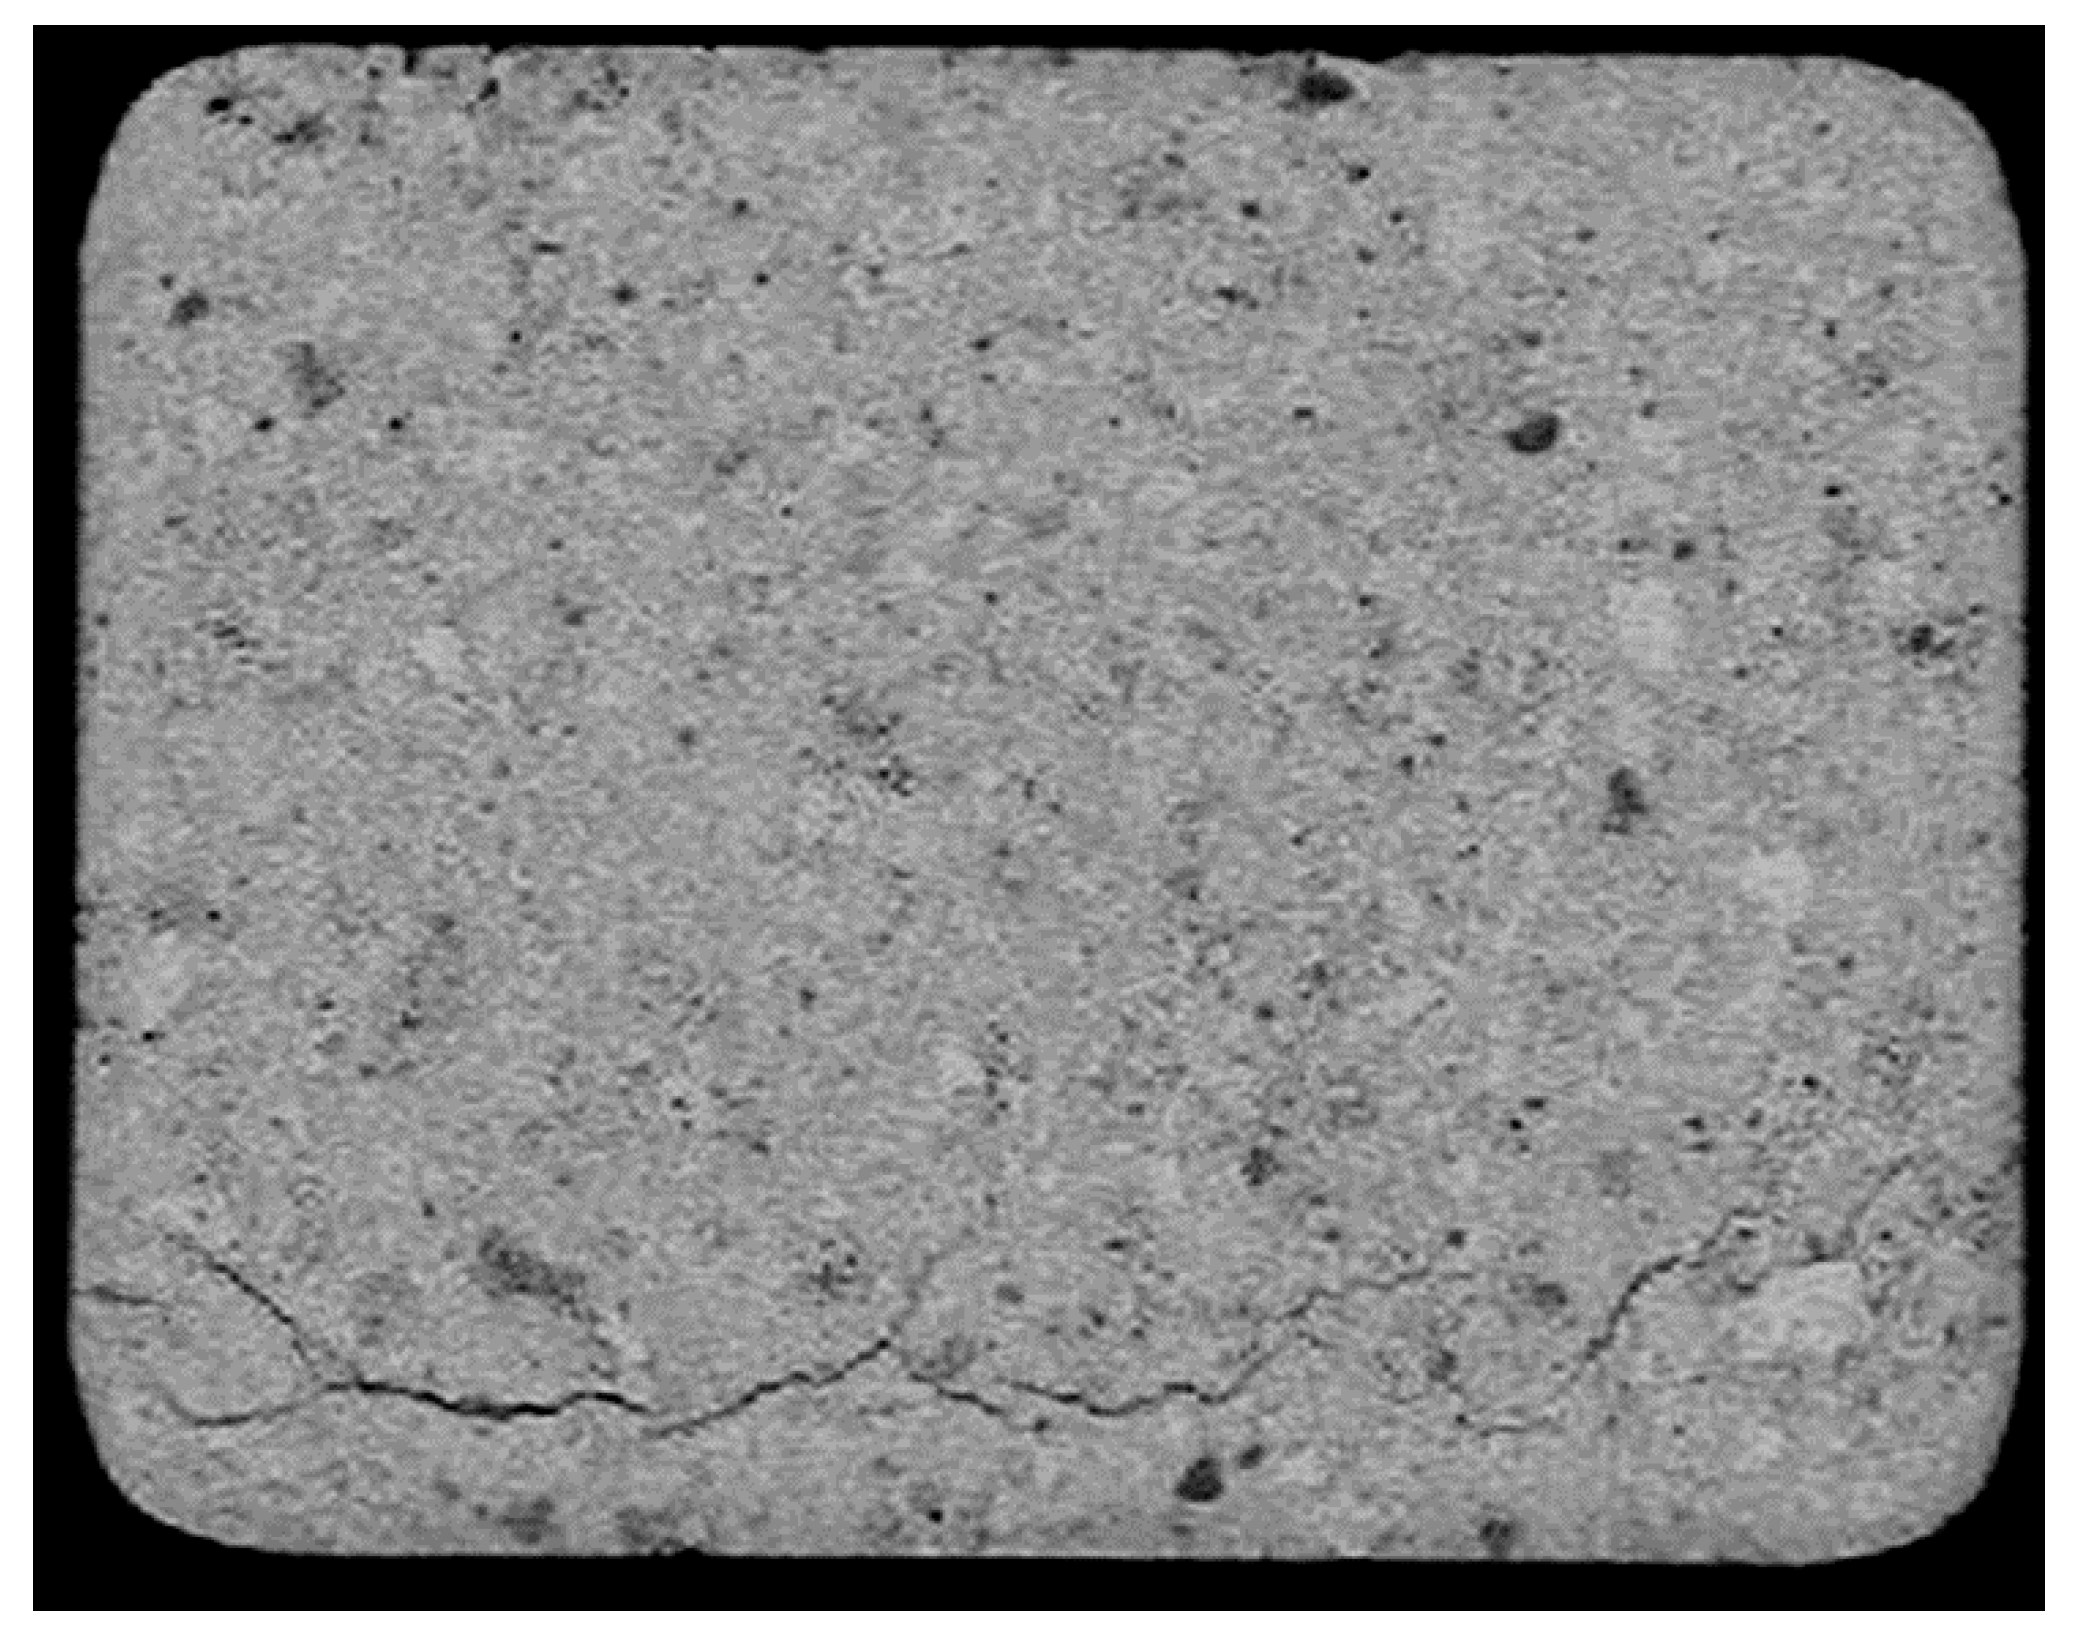
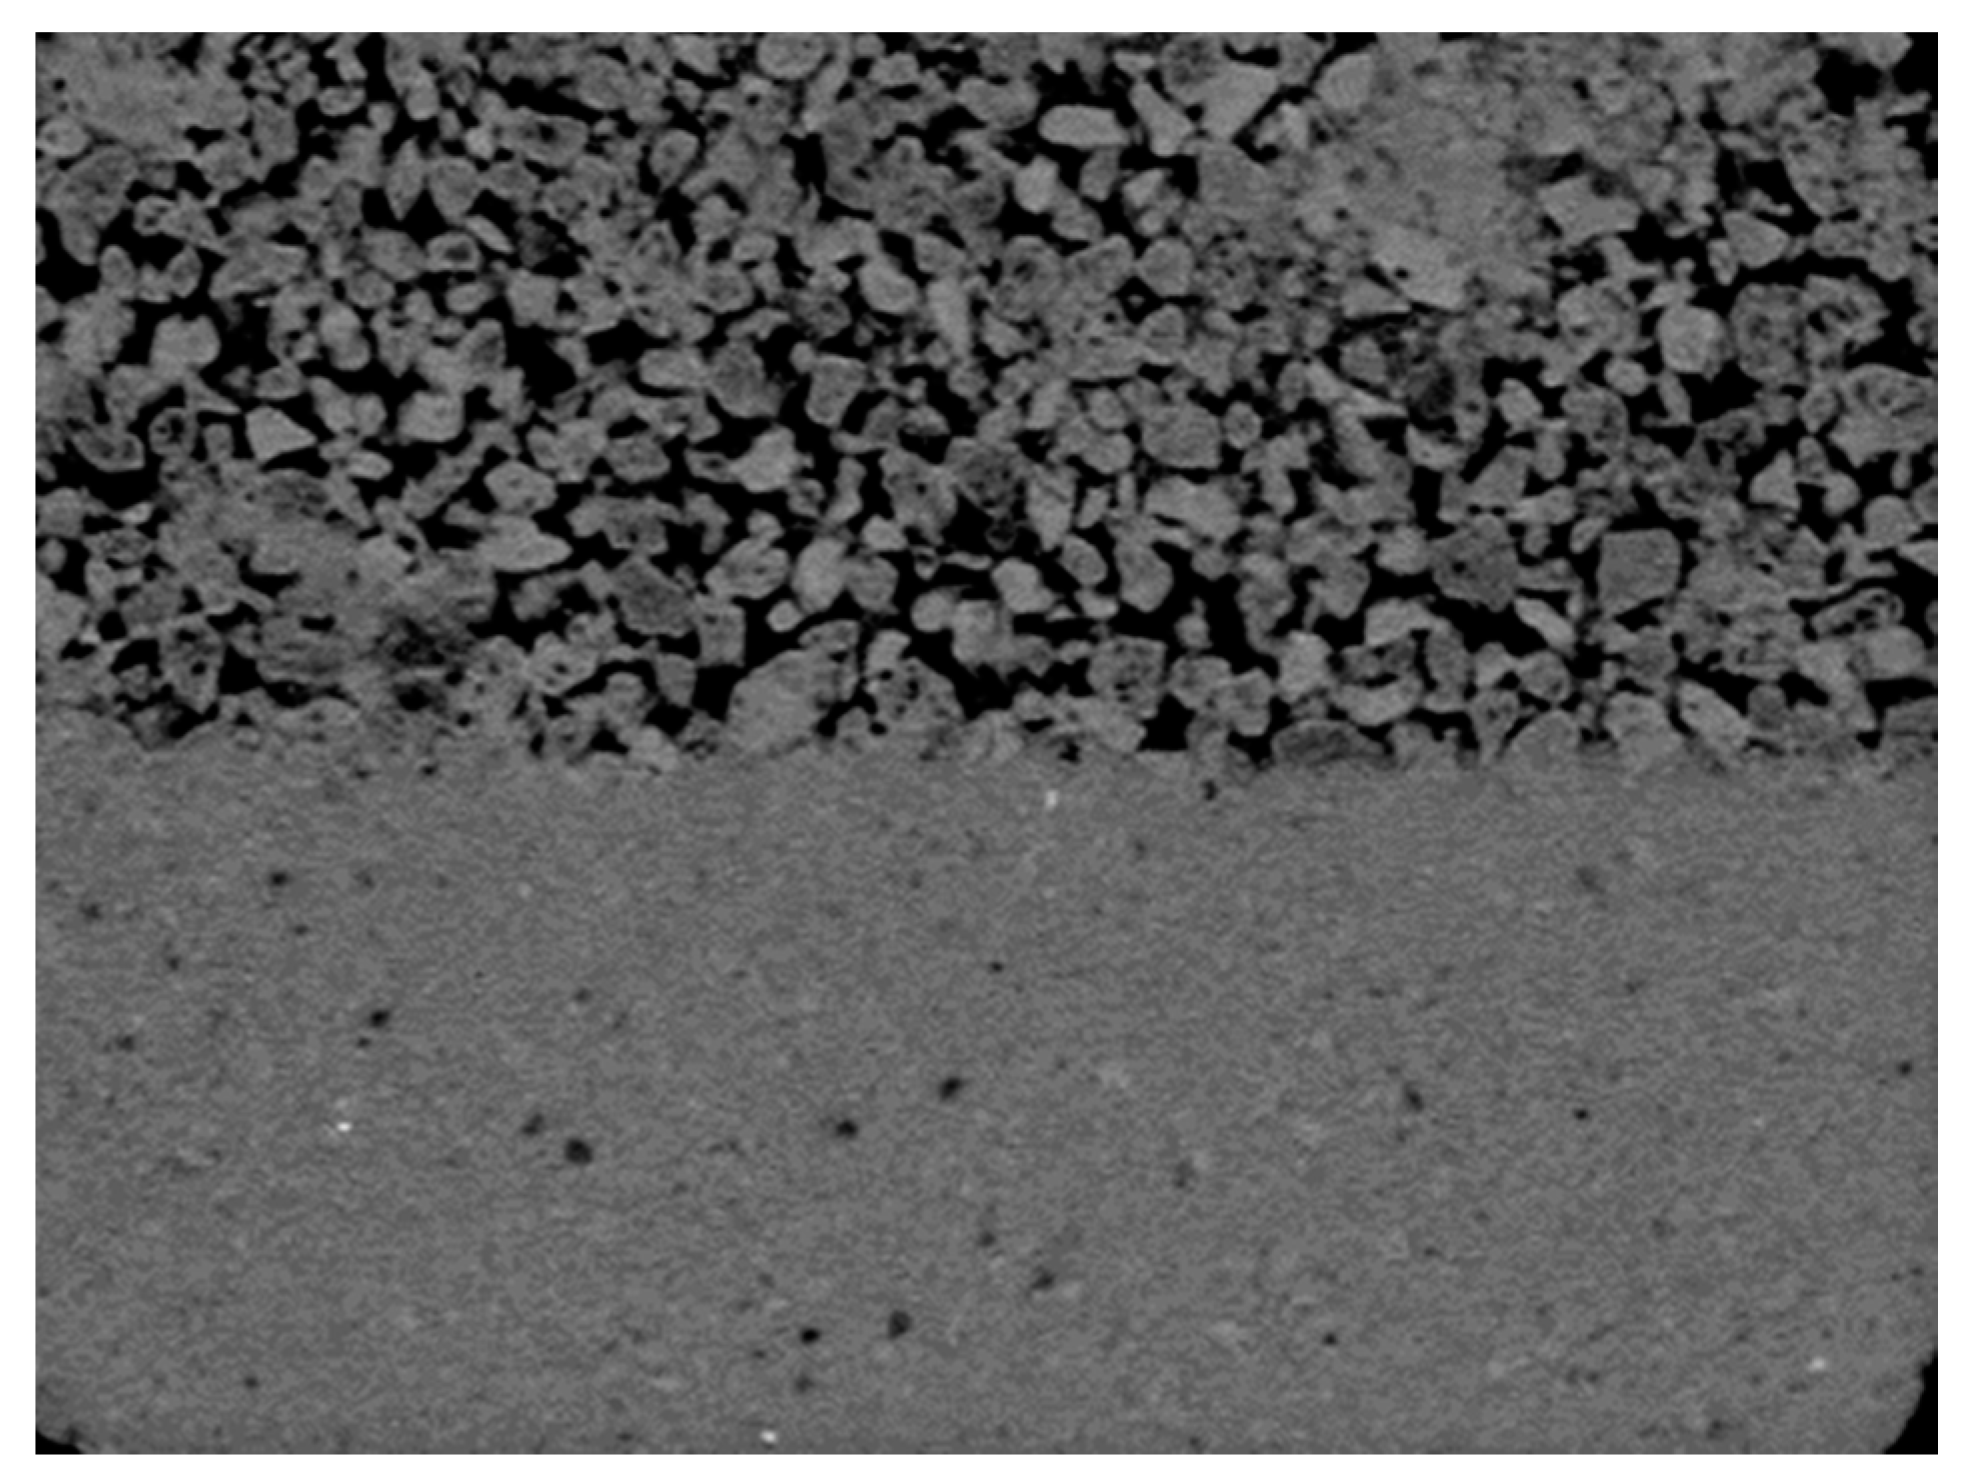
It is important to keep in mind that these contours were plotted only on the measurement points and not all the voxels. Figure 7 shows the tomography image of Anode 3 for a particular slice. Comparison of Figure 7 with Figure 6b shows that there is a significant similarity between the two pictures. The region with 4 mm particles (top section of Figure 7) has more empty spaces because of poor packing compared to the region with 2 mm particles (bottom section of Figure 7). Figure 6b shows that the region with 4 mm particles has more defects compared to the region with 2 mm particles.
Further study is necessary to set the rejection criteria for green anodes. It must be noted that the quality of the anode is controlled by forming and baking conditions, which can vary from plant to plant. The rejection criteria are usually different for different plants. The criteria can be set based on some threshold values determined for a given plant after calibration tests and the definition of acceptable anode quality for that plant.
Figure 8 shows an image obtained from the tomography analysis of Anode 1 for a particular level between the top and the bottom surfaces. It shows a crack propagating along the length of the anode. Figure 4a,b show the presence of defects in the region where this crack is located. Its presence and its location confirm the prediction made by the electrical resistivity measurement (see Figure 4a).
4. Conclusions
In this work, a non-destructive testing method for the quality control of carbon anodes is presented. This method involves measuring the electrical resistivity of the anode in two directions and analyzing its distribution. The highly resistive region of the anode indicates the presence of defects/cracks in the material. The analysis of the highly resistive regions in two directions helps locate the position of defects.
Software has been developed to analyze the tomography results. The software can locate defects in a particular layer as well as cumulative defects in a particular direction.
The electrical resistivities in green and baked laboratory anodes were measured at a number of points. The results show that there is a similarity in the distribution of electrical resistivity before and after baking. The electrical resistivity measurement method for baked anodes was validated by tomography analysis. The experimental results showed that the locations of high electrical resistivity values matched with the regions containing large numbers of defects obtained by the tomographic analysis.
Acknowledgments
The financial support of the National Science and Engineering Research Council of Canada (NSERC), the University of Quebec at Chicoutimi (UQAC) and the Foundation of the University of Quebec at Chicoutimi (FUQAC) are greatly appreciated. The authors also thank Aluminerie Alouette Inc., Sept Iles, QC, Canada for providing the raw material for the anodes.
Author Contributions
Abderrahmane Benzaoui: The postdoctoral fellow who is carrying out the experiments and the data analysis; Duygu Kocaefe: the principal researcher of the project. She is responsible of the planning and managing the project; Dipankar Bhattacharyay: developed the software for the data acquisition and analysis; Yasar Kocaefe: responsible for the conception of the equipment and development of the anode rejection criteria based on the data.
Conflicts of Interest
The authors declare no conflict of interest.
References
- Hulse, K.L. Anode Manufacture: Raw Materials, Formulation and Processing Parameters, 1st ed.; Calligraphy Sierre: Sierre, Switzerland, 2000. [Google Scholar]
- Meier, M.W. Cracking Behaviour of Anodes; R & D Carbon Ltd.: Sierre, Switzerland, 1996. [Google Scholar]
- Charette, A.; Kocaefe, Y. Le Carbone Dans L’industrie de L’aluminium; Les Presses de L’aluminium: Chicoutimi, QC, Canada, 2012. [Google Scholar]
- Carboni, M. Application of eddy currents to the inspection of fatigue-corroded railway axles. In Proceedings of the 18th World Conference on Nondestructive Testing, Dublan, South Africa, 16–20 April 2012. [Google Scholar]
- Haldemann, P.R.; Fawzi, E.P. Method and Apparatus for Non-Destructively Detecting Flaws in a Carbon Anode. U.S. Patent 5,473,248, 5 Decmber 1995. [Google Scholar]
- Audet, D.; Parent, L. System and Method to Forecast the Electrical Conductivity of Anodes for Aluminum Production Before Baking. U.S. Patent 7,576,534, 18 August 2009. [Google Scholar]
- Boubaker, M.B.; Picard, D.; Duchesne, C.; Tessier, J.; Alamdari, H.; Fafard, M. The potential of acousto-ultrasonic techniques for inspection of baked carbon anodes. Metals 2016, 6, 151. [Google Scholar] [CrossRef]
- NDT Ressources Center. Available online: https://www.nde-ed.org/index_flash.htm (accessed on 5 June 2016).
- Amrani, S.; Kocaefe, D.; Kocaefe, Y.; Morais, B.; Blaney, G. Effect of Heating Rate on the Crack Formation during Baking in Carbon Anodes Used in Aluminum Industry. In Proceedings of the Light Metals, TMS 2014, San Diego, CA, USA, 16–20 February 2014; pp. 175–1180. [Google Scholar]
- Amrani, S. Impact de la Préparation Des Anodes Crues et des Conditions de Cuisson Sur La Fissuration Dans Des Anodes Denses, Ph.D. Thesis, University of Quebec at Chicoutimi, Chicoutimi, QC, Canada, 2015. [Google Scholar]
- Yu, N.; Perrin, S.; Miya, K. Eddy current data for characterizing less volumetric stress corrosion cracking in nonmagnetic materials. Mater. Lett. 2007, 61, 827–829. [Google Scholar]
- He, Y.; Luo, F.; Pan, M.; Weng, F.; Hu, X.; Gao, J.; Liu, B. Pulsed eddy current technique for defect detection in aircraft riveted structures. NDT & E Int. 2010, 43, 176–181. [Google Scholar]
- Matsui, T.; Park, S.G.; Park, M.K.; Matsuura, S. Relationship between electrical resistivity and physical properties of rocks. In Proceedings of the GeoEng2000, An International Conference on Geotechnical & Geological Engineering, Melbourne, Australia, 19–24 November 2000. [Google Scholar]
- Schueler, R.; Joshi, S.P.; Schulte, K. Damage detection in CFRP by electrical conductivity mapping. Compos. Sci. Technol. 2001, 61, 921–930. [Google Scholar] [CrossRef]
- Karhunen, K.; Seppanen, A.; Lehikoinen, A.; Kaipio, J.P. Electrical Resistance Tomography imaging of concrete. Cem. Concr. Res. 2010, 40, 137–145. [Google Scholar]
- Lataste, J.F.; Sirieix, C.; Denys, B.; Frappa, M. Electrical resistivity measurement applied to cracking assessment on reinforced concrete structures in civil engineering. NDT & E Int. 2003, 36, 383–394. [Google Scholar]
- Seger, E.J. Method and Means for Measuring Electrode Resistance. U.S. Patent US3735253, 22 May 1973. [Google Scholar]
- Chollier-Brym, M.-J.; Laroche, D.; Alexandre, A.; Landry, M.; Simard, C.; Simard, L.; Ringuette, D. New method for representative measurement of anode electrical resistance. In Proceedings of the Light Metals, TMS 2012, Orlando, FL, USA, 11–15 March 2012; pp. 1299–1302. [Google Scholar]
- Leonard, G.; Guerard, S.; Laroche, D.; Arnaud, J.-C.; Gourmaud, S.; Gagnon, M.; Chollier-Brym, M.-J.; Perron, Y. Anode electrical measurements: Learning and industrial on-line measurement equipment development. In Proceedings of the Light Metals, TMS 2014, San Diego, CA, USA, 16–20 February 2014; pp. 1269–1274. [Google Scholar]
- Kocaefe, D.; Kocaefe, Y.; Bhattacharyay, D. Measurement of anode electrical resistivity for quality control in aluminium industry. In Proceedings of the Conference of Metallurgists (COM) 2014, Vancouver, BC, Canada, 28 September–1 October 2014. [Google Scholar]
- Kocaefe, Y.; Kocaefe, D.; Bhattacharyay, D. Quality control via electrical resistivity measurement of industrial anodes. In Proceedings of the Light Metals, TMS 2015, Orlando, FL, USA, 15–19 March 2015; pp. 1097–1102. [Google Scholar]
Figure 1.
Schematic representation of Anode 3.
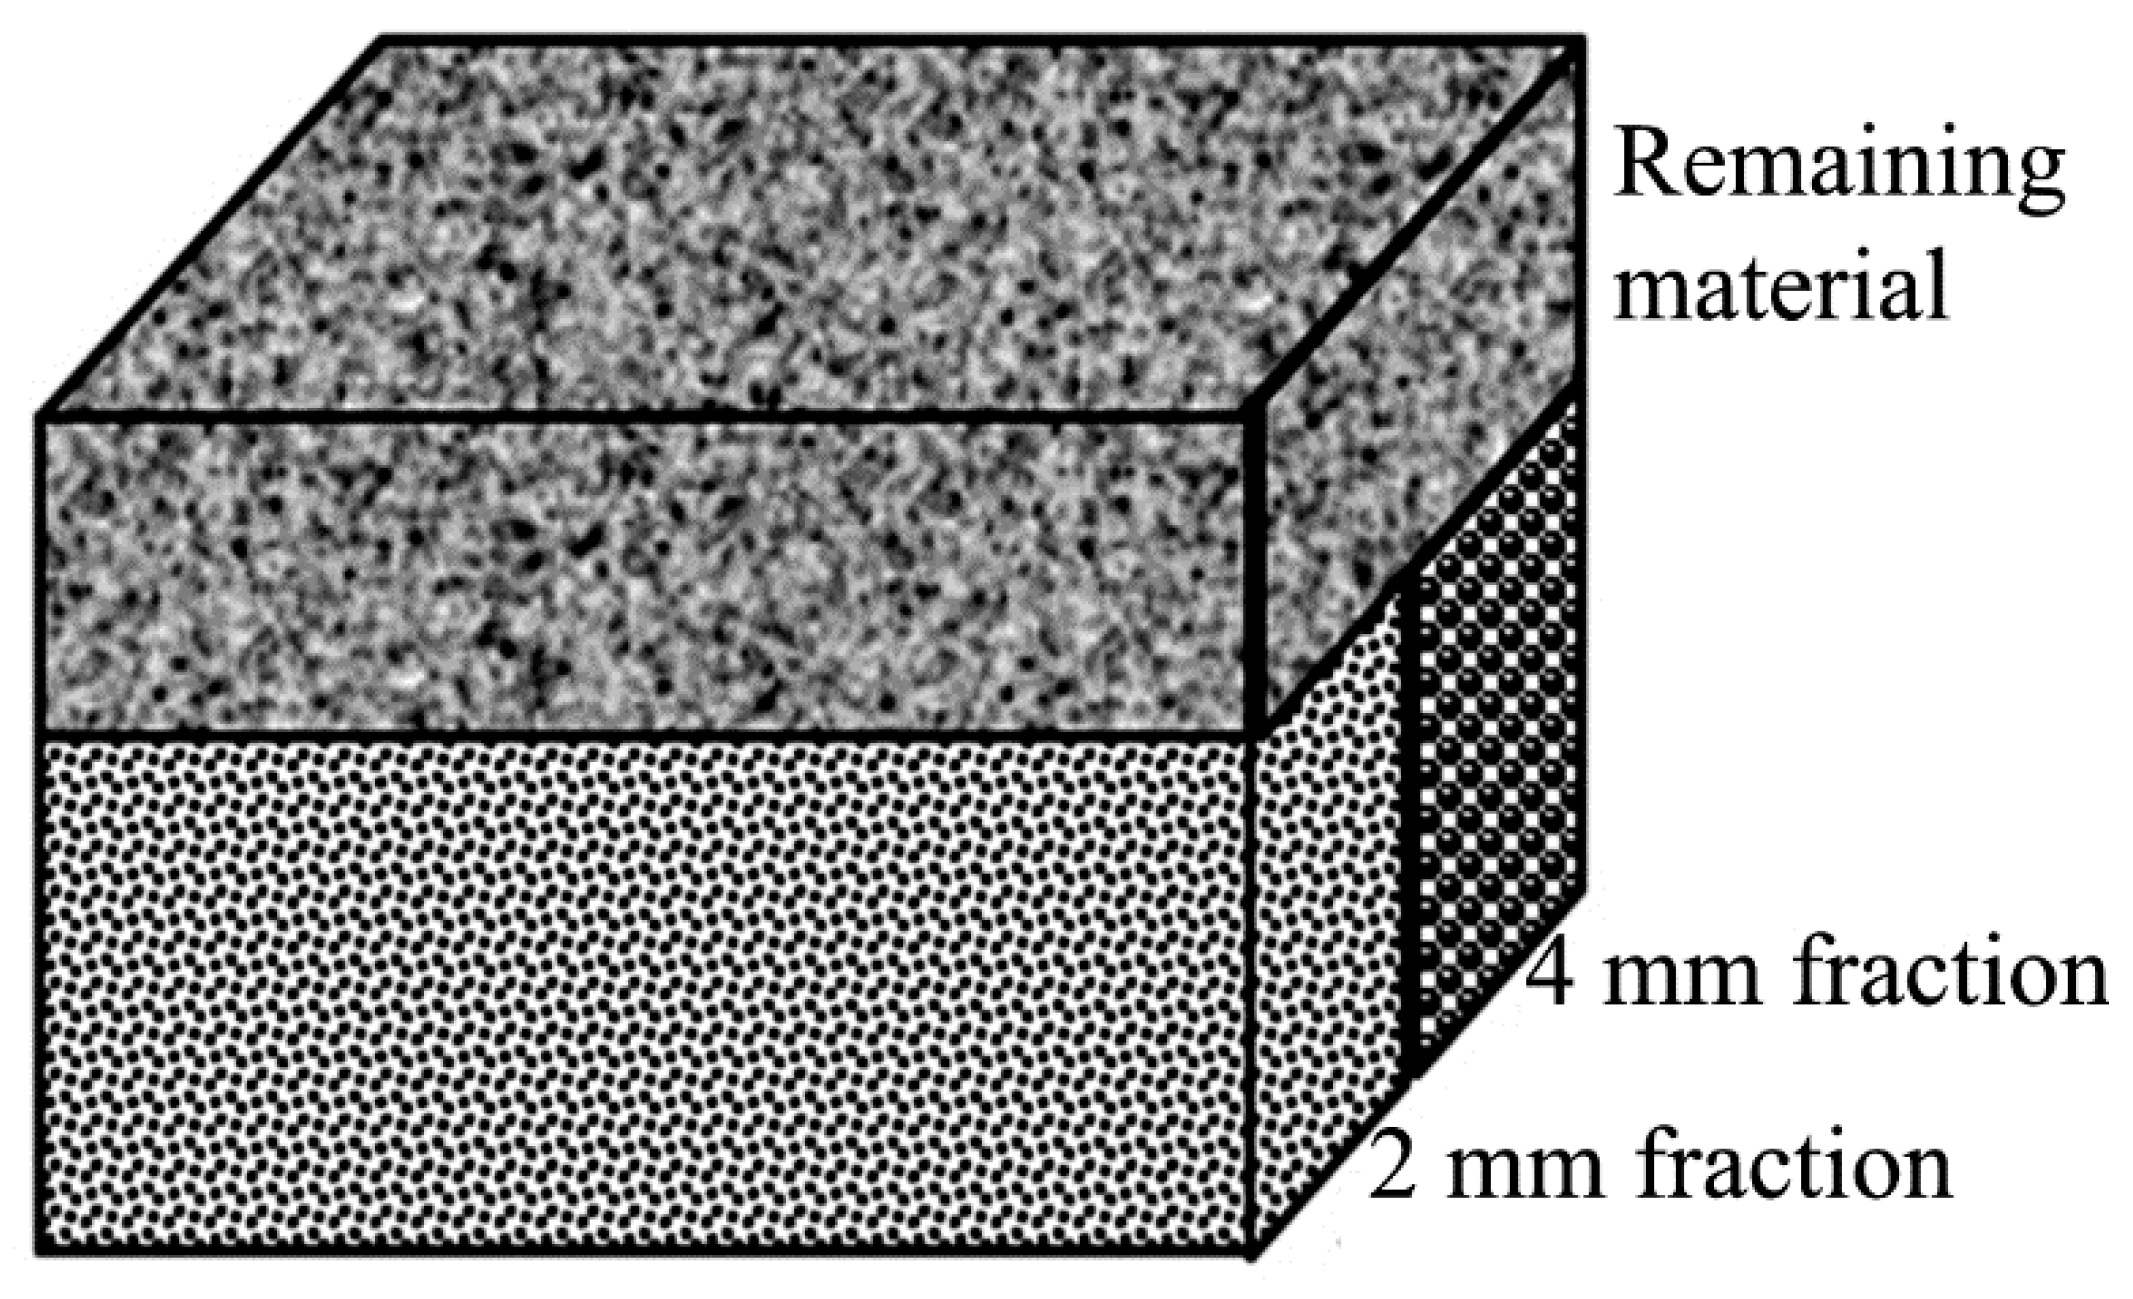
Figure 2.
The sequence of operations for the electrical resistivity measurement of the anodes with specific electrical resistivity measurement of anodes (SERMA) [21].
Figure 2.
The sequence of operations for the electrical resistivity measurement of the anodes with specific electrical resistivity measurement of anodes (SERMA) [21].

Figure 3.
Distribution of electrical resistivities measured with SERMA in horizontal and vertical directions in Anode 3: (a) before baking and (b) after baking.
Figure 3.
Distribution of electrical resistivities measured with SERMA in horizontal and vertical directions in Anode 3: (a) before baking and (b) after baking.

Figure 4.
Distributions of (a) the electrical resistivity measured with SERMA and (b) the defects by tomographic analysis between the top and bottom surfaces for Anode 1 after baking.
Figure 4.
Distributions of (a) the electrical resistivity measured with SERMA and (b) the defects by tomographic analysis between the top and bottom surfaces for Anode 1 after baking.
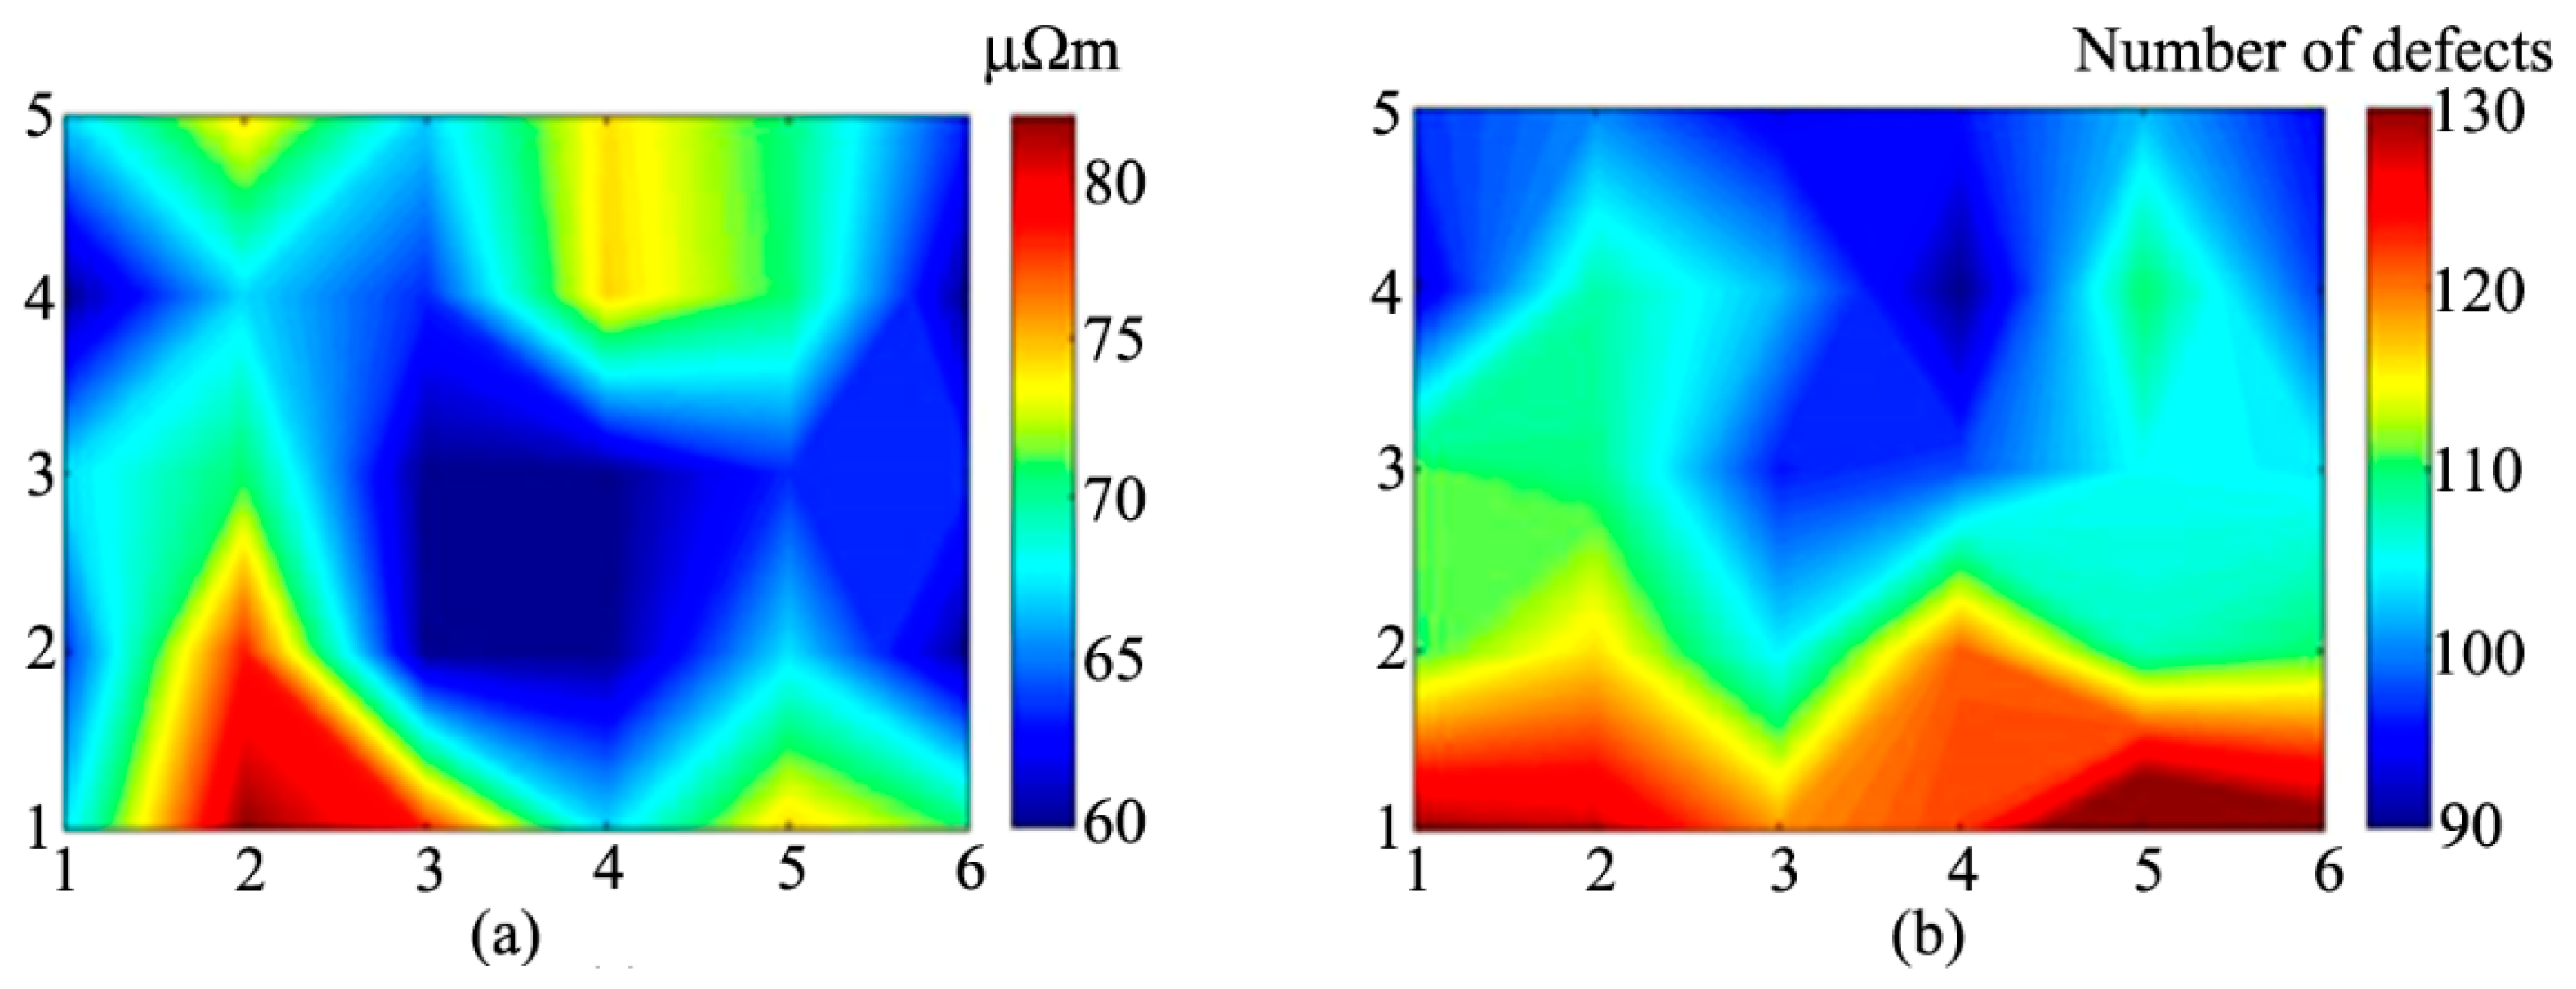
Figure 5.
Distributions of (a) the electrical resistivity measured with SERMA and (b) the defects by tomographic analysis between the top and bottom surfaces for Anode 2 after baking.
Figure 5.
Distributions of (a) the electrical resistivity measured with SERMA and (b) the defects by tomographic analysis between the top and bottom surfaces for Anode 2 after baking.
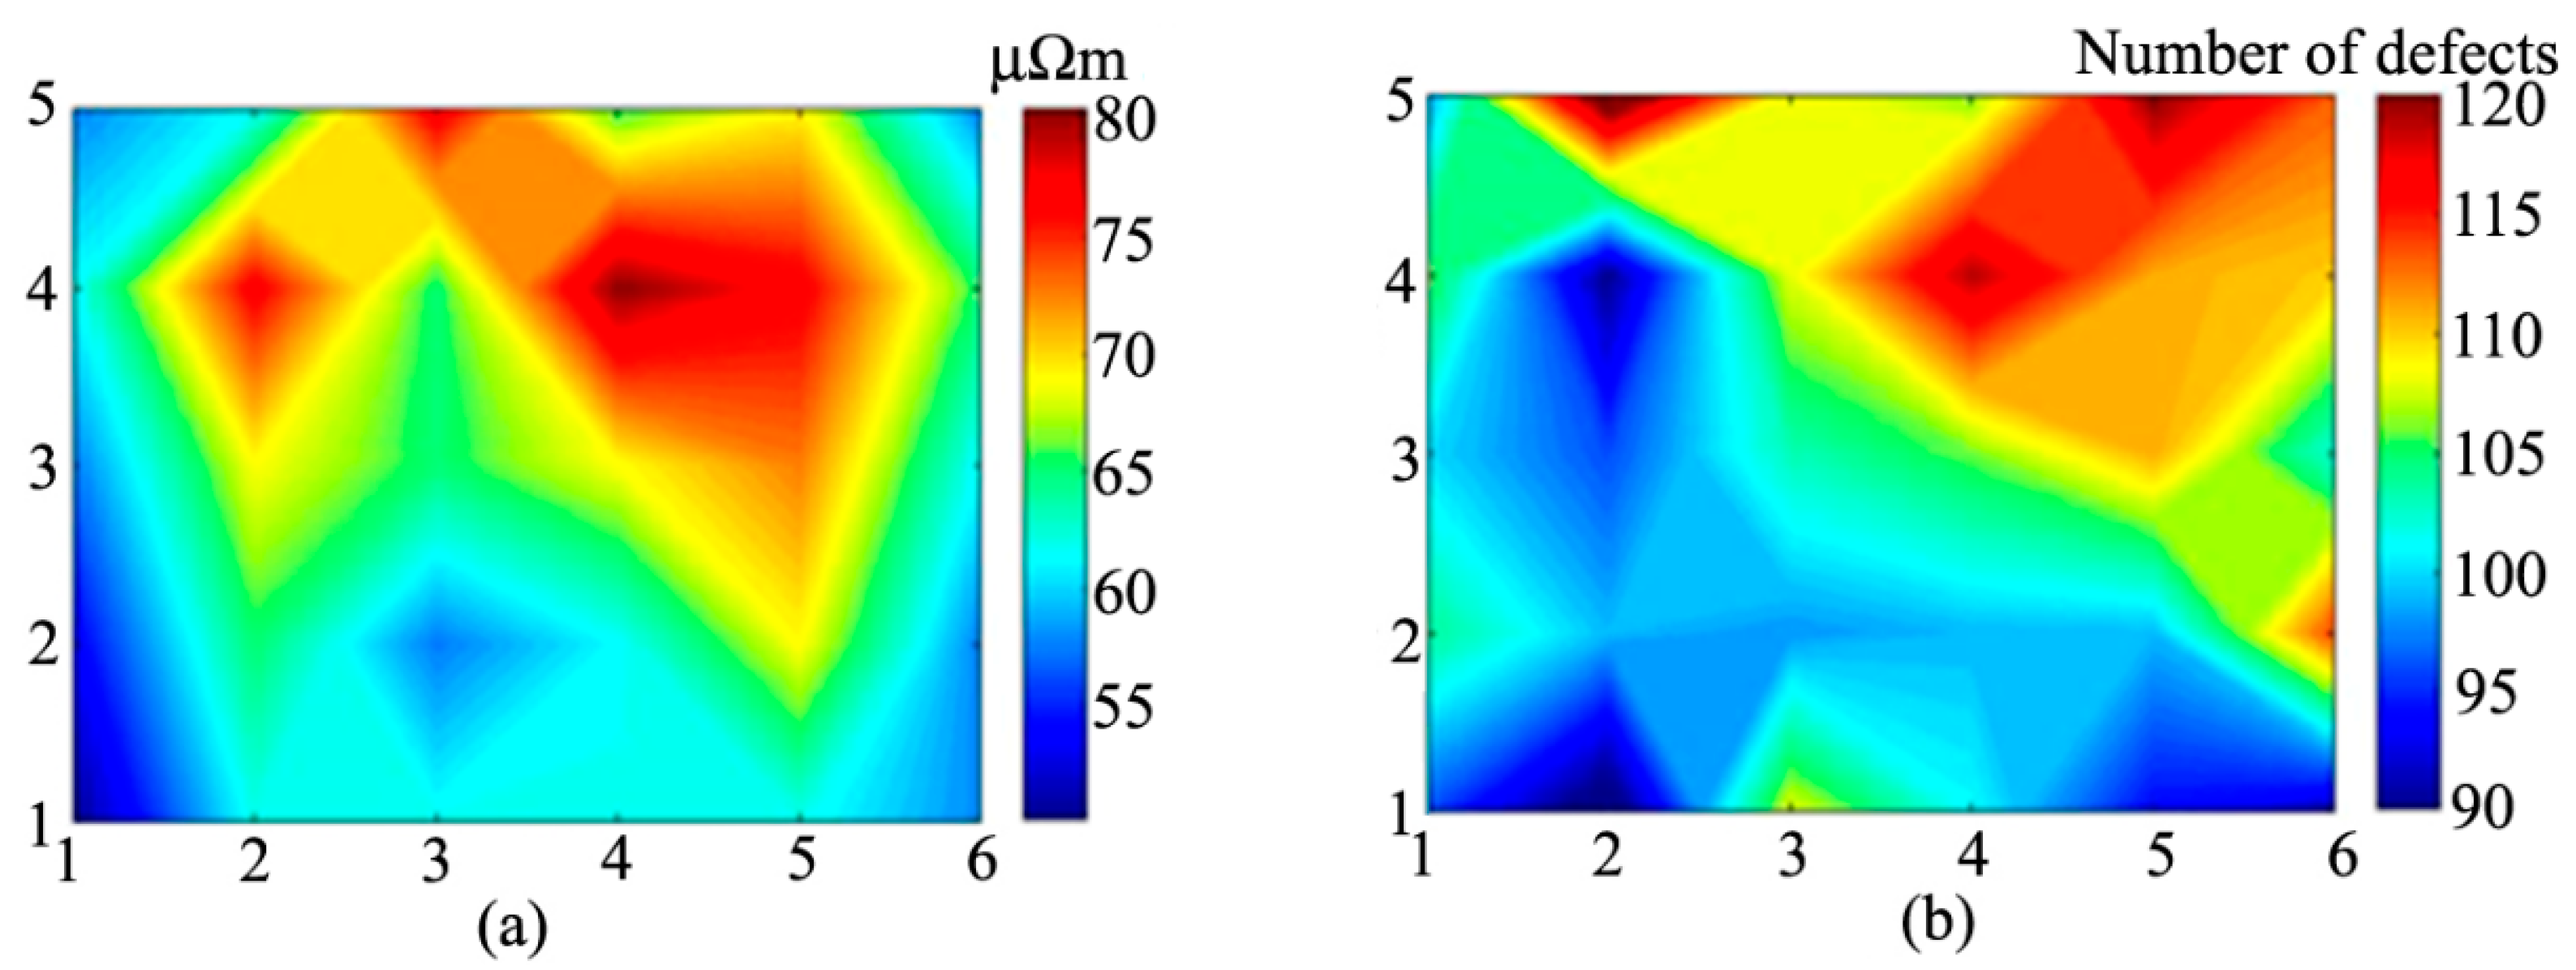
Figure 6.
Distributions of (a) the electrical resistivity measured with SERMA and (b) the defects by tomographic analysis between the top and bottom surfaces for Anode 3 after baking.
Figure 6.
Distributions of (a) the electrical resistivity measured with SERMA and (b) the defects by tomographic analysis between the top and bottom surfaces for Anode 3 after baking.

Figure 7.
Tomography image of a slice of Anode 3.

Figure 8.
Visualization of a cracked region in Anode 1 by tomography.

Table 1.
Recipe used for the three anodes.
| Anode | Material | Coarse (16 mm − 4 mm +), g | Medium (4 mm − 1 mm +), g | Fines (1 mm −), g |
|---|---|---|---|---|
| Anode 1 | Fresh coke | 0.72X | 0.72Y | 0.72Z |
| Butt | 0.25X | 0.25Y | 0.25Z | |
| Rejects | 0.03X | 0.03Y | 0.03Z | |
| Fresh coke + Butt + Rejects | X | Y | Z | |
| Anode 2 | Fresh coke | 0.72X − 0.25Y | 0.72Y + 0.25Y | 0.72Z |
| Butt | 0.25X + 0.25Y | 0.25Y − 0.25Y = 0 | 0.25Z | |
| Rejects | 0.03X | 0.03Y | 0.03Z | |
| Fresh coke + Butt + Rejects | X | Y | Z | |
| Anode 3 | Fresh coke | 0.72X | 0.72Y | 0.72Z |
| Butt | 0.25X | 0.25Y | 0.25Z | |
| Rejects | 0.03X | 0.03Y | 0.03Z | |
| Fresh coke + Butt + Rejects | X | Y | Z |
© 2017 by the authors. Licensee MDPI, Basel, Switzerland. This article is an open access article distributed under the terms and conditions of the Creative Commons Attribution (CC BY) license (http://creativecommons.org/licenses/by/4.0/).
Share and Cite
MDPI and ACS Style
Benzaoui, A.; Kocaefe, D.; Bhattacharyay, D.; Kocaefe, Y. A Non-Destructive Technique for the On-Line Quality Control of Green and Baked Anodes †. Metals 2017, 7, 128. https://doi.org/10.3390/met7040128
AMA Style
Benzaoui A, Kocaefe D, Bhattacharyay D, Kocaefe Y. A Non-Destructive Technique for the On-Line Quality Control of Green and Baked Anodes †. Metals. 2017; 7(4):128. https://doi.org/10.3390/met7040128
Chicago/Turabian StyleBenzaoui, Abderrahmane, Duygu Kocaefe, Dipankar Bhattacharyay, and Yasar Kocaefe. 2017. "A Non-Destructive Technique for the On-Line Quality Control of Green and Baked Anodes †" Metals 7, no. 4: 128. https://doi.org/10.3390/met7040128
Note that from the first issue of 2016, this journal uses article numbers instead of page numbers. See further details here.