Article

Synthesis, Characterization, and Toxicity Evaluation of Dextran-Coated Iron Oxide Nanoparticles

by
Mihaela Balas
1,
Carmen Steluta Ciobanu
2,
Carmen Burtea
3,
Miruna Silvia Stan
1,
Eugenia Bezirtzoglou
4,*,
Daniela Predoi
2,* and
Anca Dinischiotu
1,*
1
Department of Biochemistry and Molecular Biology, Faculty of Biology, University of Bucharest, 91-95 Splaiul Independentei, 050095 Bucharest, Romania
2
National Institute of Materials Physics, P.O. Box MG-7, 76900 Magurele-Bucharest, Romania
3
Department of General, Organic and Biomedical Chemistry, NMR and Molecular Imaging Laboratory, University of Mons-Hainaut, 24, Avenue du Champ de Mars, B-7000 Mons, Belgium
4
Department of Agricultural Development, Democritus University of Thrace, 67100 Xanthi, Greece
*
Authors to whom correspondence should be addressed.
Metals 2017, 7(2), 63; https://doi.org/10.3390/met7020063
Submission received: 19 November 2016 / Revised: 6 February 2017 / Accepted: 15 February 2017 / Published: 21 February 2017
(This article belongs to the Special Issue Metallic and Metal Oxide Nanoparticles: Novel Approaches)

Abstract

:
We report the synthesis of dextran-coated iron oxide magnetic nanoparticles (DIO-NPs) with spherical shape and uniform size distribution as well as their accumulation and toxic effects on Jurkat cells up to 72 h. The characterization of dextran-coated maghemite nanoparticles was done by X-ray diffraction and dynamic light scattering analyses, transmission electron microscopy imaging, attenuated total reflectance Fourier transform infrared (ATR-FTIR) spectroscopy, magnetic hysteresis, and relaxometry measurements. The quantification of DIO-NPs intracellular uptake showed a progressive accumulation of iron as a function of time and dose accompanied by additional lysosome formation and an increasing darkening exhibited by a magnetic resonance imaging (MRI) scanner. The cytotoxicity assays revealed a decrease of cell viability and a loss of membrane integrity in a time- and dose-dependent manner. Exposure to DIO-NPs determined an increase in reactive oxygen species level up to 72 h. In the first two days of exposure, the level of reduced glutathione decreased and the amount of malondyaldehyde increased, but at the end of the experiment, their concentrations returned to control values. These nanoparticles could be used as contrast agents for MRI but several parameters concerning their interaction with the cells should be taken into consideration for a safe utilization.

1. Introduction

Nanotechnology is an emerging field of interest among the scientific community. Nowadays, materials science has reached a stage of development that makes it possible to synthesize new engineered particles at a nanometric scale and to control their properties. Thus, tailoring the properties of nanoparticles for suitable biomedical, environmental, and industrial applications is one of the most studied areas of research worldwide [1,2,3]. Ideal candidates for developing nano-engineered structures with improved properties by functionalization are inorganic materials. One of the most promising inorganic materials with adjustable physical and chemical properties is represented by iron oxide nanoparticles. Magnetite (Fe3O4) and maghemite (γ-Fe2O3), the most representative iron oxide forms, are a class of materials with tremendous potential in clinical and biomedical applications both for diagnosis and therapy. These include: magnetic resonance imaging (MRI), targeted drug delivery, detoxification of biological fluids, hyperthermia, catalysis, cell separation, cell labelling, cell targeting, biosensors, diagnostic medical devices, etc. [4,5,6,7,8].
It is well known that iron is essential for all forms of life, and it is found both in plants and animals in ferritin [9] as well as in other iron containing proteins involved in many important biochemical processes such as the mitochondrial electron transporting chain and drug metabolism. Therefore, the use of iron oxide nanoparticles for clinical and biomedical applications is related not only to their unique chemical and physical properties but also to their biological properties. The use of iron as therapeutic agent has been investigated in order to solve worldwide severe nutritional problems such as iron deficiency [10,11]. Studies showed that iron absorption could be enhanced when it is present in sugar complexes [12]. Thus, complexes such as iron-polysaccharide have been used in iron-deficiency anemia treatments with promising results [13,14].
Iron oxide nanoparticles at a nanometric scale have been intensively studied due to their superparamagnetic properties and also because of their lack of toxicity at low concentrations of different types of cells [15,16,17].
In recent years, several types of saccharides such as sucrose, dextran, starch, fucan, glycogen, and cellulose have been investigated as coating agents for iron oxide nanoparticles [18,19,20,21,22]. Due to its excellent biocompatibility, dextran has often been the best choice for coating. Previous studies revealed that dextran-coated iron oxide nanoparticles showed prolonged blood residence time limiting thus their access to macrophages located in tissues [23]. Therefore, dextran-coated iron oxide nanoparticles were considered promising candidates suitable for biomedical and clinical applications.
The goal of this study was to prepare magnetic dextran-coated iron oxide nanoparticles (DIO-NPs) with spinel structure by co-precipitation method and to study their biological effects on Jurkat cells. The structure and morphology of DIO-NPs were analyzed by X-ray diffraction (XRD) measurements and transmission electron microscopy (TEM). Attenuated Total Reflectance Fourier Transform Infrared (ATR-FTIR) spectroscopy was used to investigate dextran adsorption on the surface of iron oxide nanoparticles. A vibrating sample magnetometer (VSM) was used to measure the magnetic properties of DIO-NPs using a superconducting quantum interference device (MPMS magnetometer) at room temperature. The in vitro DIO-NPs uptake was demonstrated by total intracellular iron content, lysosome quantification, and MRI analysis. In addition, we have evaluated the cell viability and membrane integrity of Jurkat cells after exposure to DIO-NPs and the oxidative stress by measuring the reactive oxygen species (ROS) production, reduced glutathione (GSH) content, and malondyaldehyde (MDA) level.

2. Materials and Methods

2.1. Materials

Ferrous chloride tetrahydrate (FeCl2·4H2O), ferric chloride hexahidrate (FeCl3·6H2O), natrium hydroxide (NaOH) and dextran (H(C6H10O5)xOH; molecular weight ~40,000), hydrochloric acid (HCl), and perchloric acid (HClO4) were purchased from Merck (Bucharest, Romania). RPMI-1640 medium, fetal bovine serum, antibiotic solution, and Lysotracker green DND-26 were procured from Life Technologies (Gent, Belgium) and the rest of reagents (paraformaldehyde, potassium ferrocyanide, gelatin, etc.) were from Sigma-Aldrich (Bornem, Belgium). Deionized water was used in the synthesis and preparation of nanoparticle suspension, and in the rinsing of clusters.

2.2. Synthesis of Dextran-Coated Iron Oxide Nanoparticles

Ferrous chloride tetrahydrate (FeCl2·4H2O) in 2 M HCl and ferric chloride hexahydratate (FeCl3·6H2O)·(Fe2+/Fe3+ = ½) were mixed at 40 °C. The mixture was dropped into dextran solution (30% w/v) and 300 mL of 2 M NaOH solution at 90 °C under vigorous stirring for about 30 min. The resulting solution was heated at 90 °C for 1 h under continuous agitation (200 r/min). In order to obtain a pH of 11, a 5 M NaOH solution was added drop by drop. After centrifugation, the precipitate was treated repeatedly with 3 M perchloric acid solution until the Fe2+/Fe3+ ratio in the solid was approximately 0.05. The amount of iron was determined using potassium dichromate (K2Cr2O7). The Fe2+ was titrated potentiometrically in agreement with previous studies [24]. After the last separation by centrifugation, the particles were dispersed into dextran (30% w/v). The final sample (DIO-NPs) was obtained by drying the resulting material at 40 °C by centrifugation of the dextran-iron oxide final solution.

2.3. Characterization

The X-ray diffraction measurements were recorded using a Bruker D8 Advance diffractometer (Kjeller, Norway), with nickel filtered Cu Kα (λ = 1.5418 Å) radiation, and a high efficiency one-dimensional detector (Lynx Eye type, Karlsruhe, Germany) operated in integration mode. The diffraction patterns were collected in the 2θ range 20°–70°, with a step of 0.02° and 34 s measuring time per step. TEM studies were carried out using a JEOL 200 CX (Jeol, Tokyo, Japan). The specimen for TEM imaging was prepared from the particle suspension in deionized water. A drop of well-dispersed supernatant was placed on a carbon-coated 200 mesh copper grid, followed by drying the sample at ambient conditions before it is attached to the sample holder on the microscope. A Perkin Elmer 1720X FTIR spectrometer (Norwalk, CT, USA) was used for all spectroscopic studies. The instrument was equipped with a horizontal ATR-FTIR accessory from Spectra-Tech (Wilmington, DE, USA). All the spectra were the results of 256 co-added scans at a resolution of 4 cm−1 and a spectral range of 4000–380 cm−1. All the FTIR analyses were conducted at room temperature around 23 °C. The magnetic properties of the samples were measured using a superconducting quantum interference device (MPMS magnetometer, San Diego, CA, USA) at room temperature.

2.4. Preparation of Water-Nanoparticle Suspension

A volume of 10 mL Milli Q water was added to 0.1 g DIO-NPs powder and ultrasonicated with a UP 200S processor (Stannsdorf, Germany) at 40 A, 0.5 cycle on ice. After sonication, the suspension was centrifuged for 10 min at 5000 rpm and the obtained supernatant was filtered through a 0.45 µm polyvinylidenedifluoride (PVDF) syringe filter (Millipore, Darmstadt, Germany).

2.5. Hydrodynamic Size and Zeta Potential

Hydrodynamic size and zeta potential of dextran-coated Fe2O3 nanoparticles suspended at a concentration of 56 µg Fe/mL in RPMI medium supplemented with 10% FBS were measured at different time points: 0, 24, 48, and 72 h using a ZetaSizer Nano ZS Malvern instrument (Malvern, UK). Size distribution of particles by volume was obtained by applying standard algorithms provided in the software (ZetaSizer ver. 7.03, Malvern, UK). Zeta potential was assessed at a constant ionic strength of 0.01 M NaCl. All measurements were performed at least four times at 25 °C using a refractive index of 3.01.

2.6. Measurement of Relaxivity (r1 and r2)

The longitudinal (R1) and transverse (R2) relaxation rates (s−1) of nanoparticles are defined as the reciprocal of the relaxation time T1 and T2, respectively (R1,2 = 1/T1,2). T1 and T2 relaxation times were determined using a Bruker Minispec mq60 MR relaxometer (Bruker, Karlsruhe, Germany) operating at 37 °C and 1.4 T (60 MHz). Relaxivity values (r1 and r2) are expressed in per second per millimole (s−1·mM−1) and are characteristic of the contrast agent efficacy. They were calculated using following formulas: r1 = (R1R0)/C and r2 = (R2R0)/C, where R0 = relaxation rate in the absence of nanoparticles and C = iron concentration (mM).

2.7. Cell Line and Treatment

Jurkat (ATCC TIB-152) is an immortalized line of T lymphocyte cells from the peripheral blood of a 14-year-old boy with T cell leukemia. These cells exhibit features of a lymphoblastic morphology, are not adherent and suitable for immunological and cancer studies. They were cultured in RPMI-1640 medium, supplemented with fetal bovine serum to a final concentration of 10%, 1% penicillin streptomycin solution, and incubated in a 5% carbon dioxide atmosphere at 37 °C. For treatment, cells were seeded at the density of 7 × 10⁵ cells/mL and cultivated overnight. Fresh medium batches containing DIO-NPs in two doses, 28 µg and 56 µg Fe/mL, respectively (corresponding to 0.5 and 1 mM), were added to Jurkat cells and incubated for 24 h, 48 h, and 72 h. Control cells (untreated with DIO-NPs) were also included.

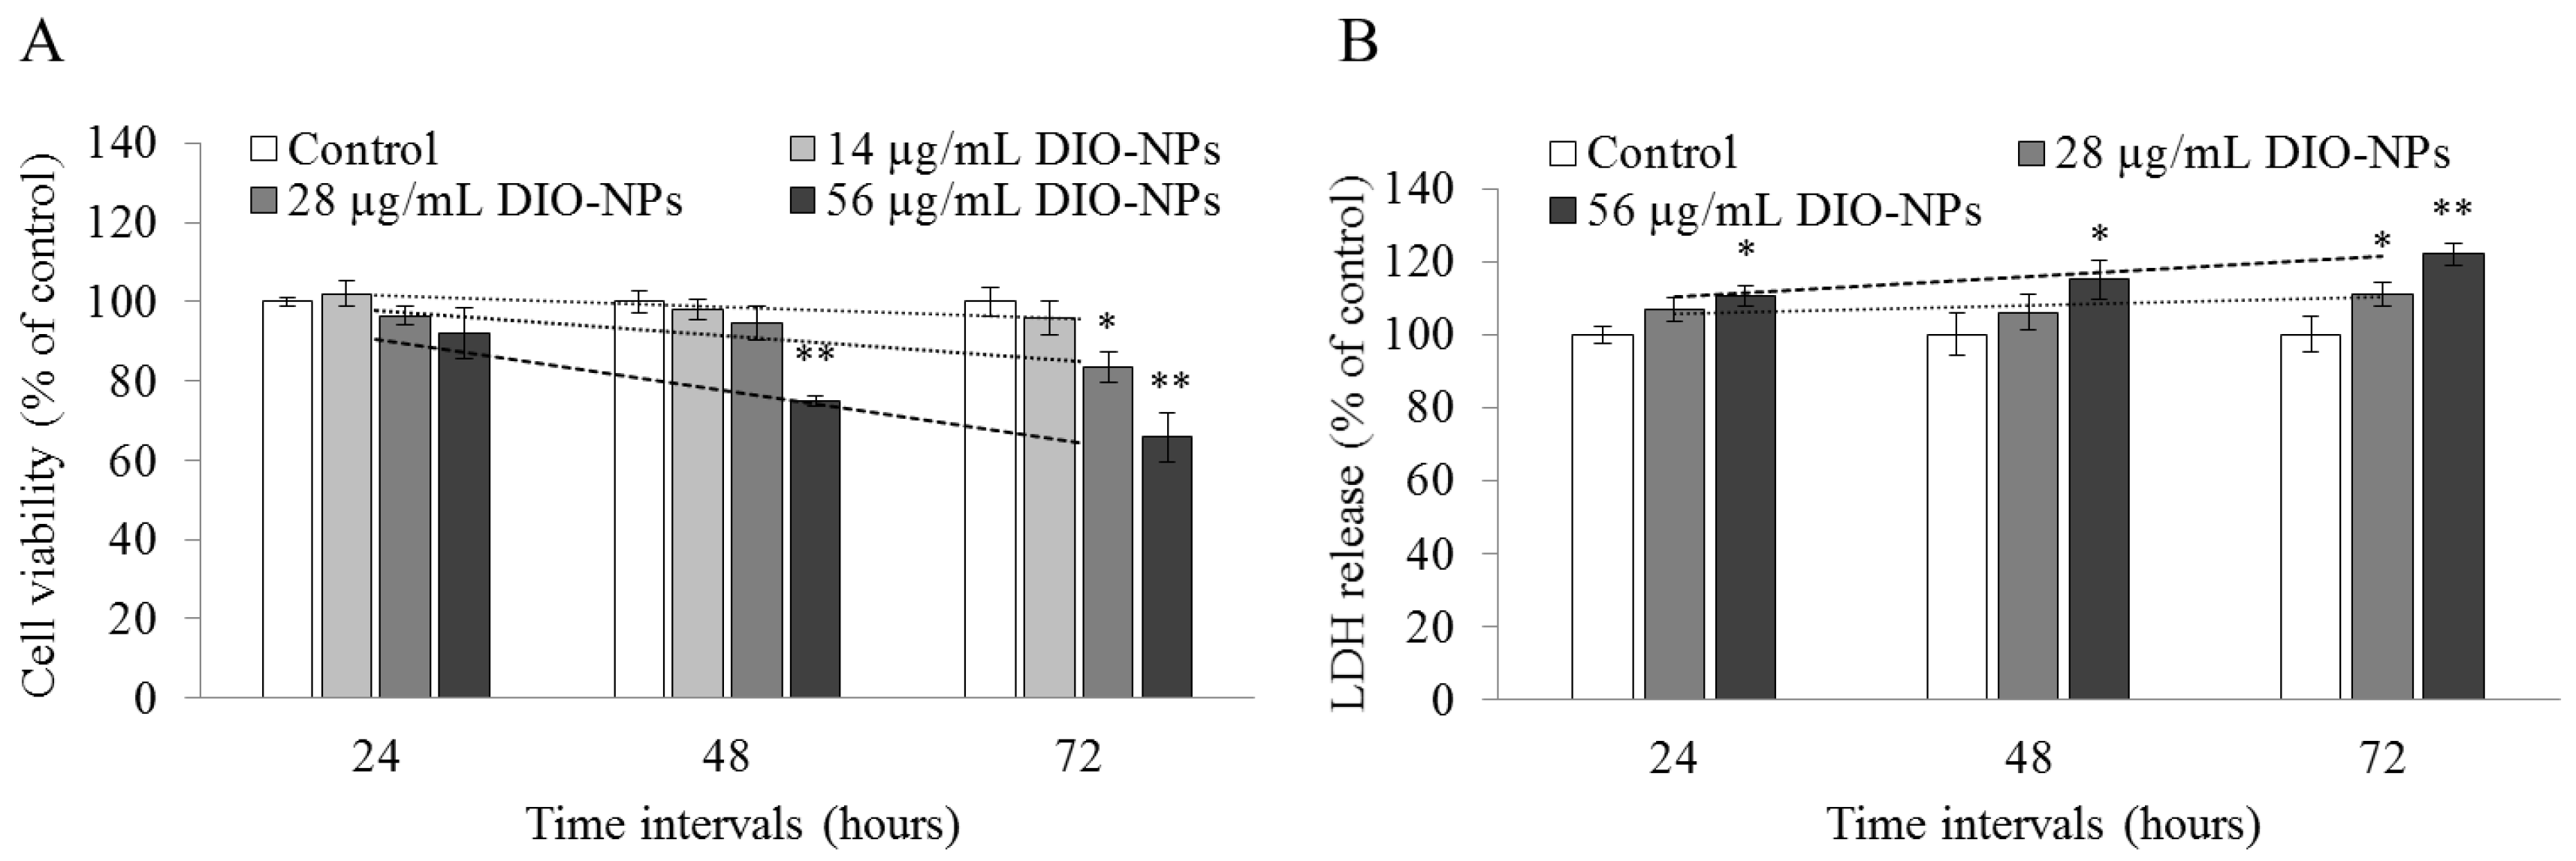
2.8. Cell Viability Assay

Cell viability was measured using MTT test. Jurkat cells were cultured at a density of 2 × 10⁵ cells/mL in a 24-well plate. After treatment with 14–56 µg/mL DIO-NPs for 24 h, 48 h, and 72 h, MTT solution (1 mg/mL in PBS) was added (200 µL/well), and the plates were incubated for 2 h at 37 °C. Purple formazan crystals were dissolved in 500 µL isopropanol per well and the reaction products were colorimetrically quantified at 595 nm using a Tecan microplate reader (TecanGENios, Grödic, Germany). Relative cell viability was calculated as a ratio of treated cells to untreated cells.

2.9. Membrane Integrity Evaluation

Lactate dehydrogenase (LDH) release into the culture medium as a result of plasma membrane damage was measured with a cytotoxicity detection kit (TOX-7, Sigma-Aldrich, Darmstadt, Germany), according to the manufacturer’s instructions. After treatment, a volume of 50 µL of culture medium was added into a 96-well plate and mixed with 100 µL of the reaction mixture. After 30 min of incubation at 25 °C, the LDH activity was determined spectrophotometrically, by measuring the oxidation of NADH at 490 nm in the presence of pyruvate.

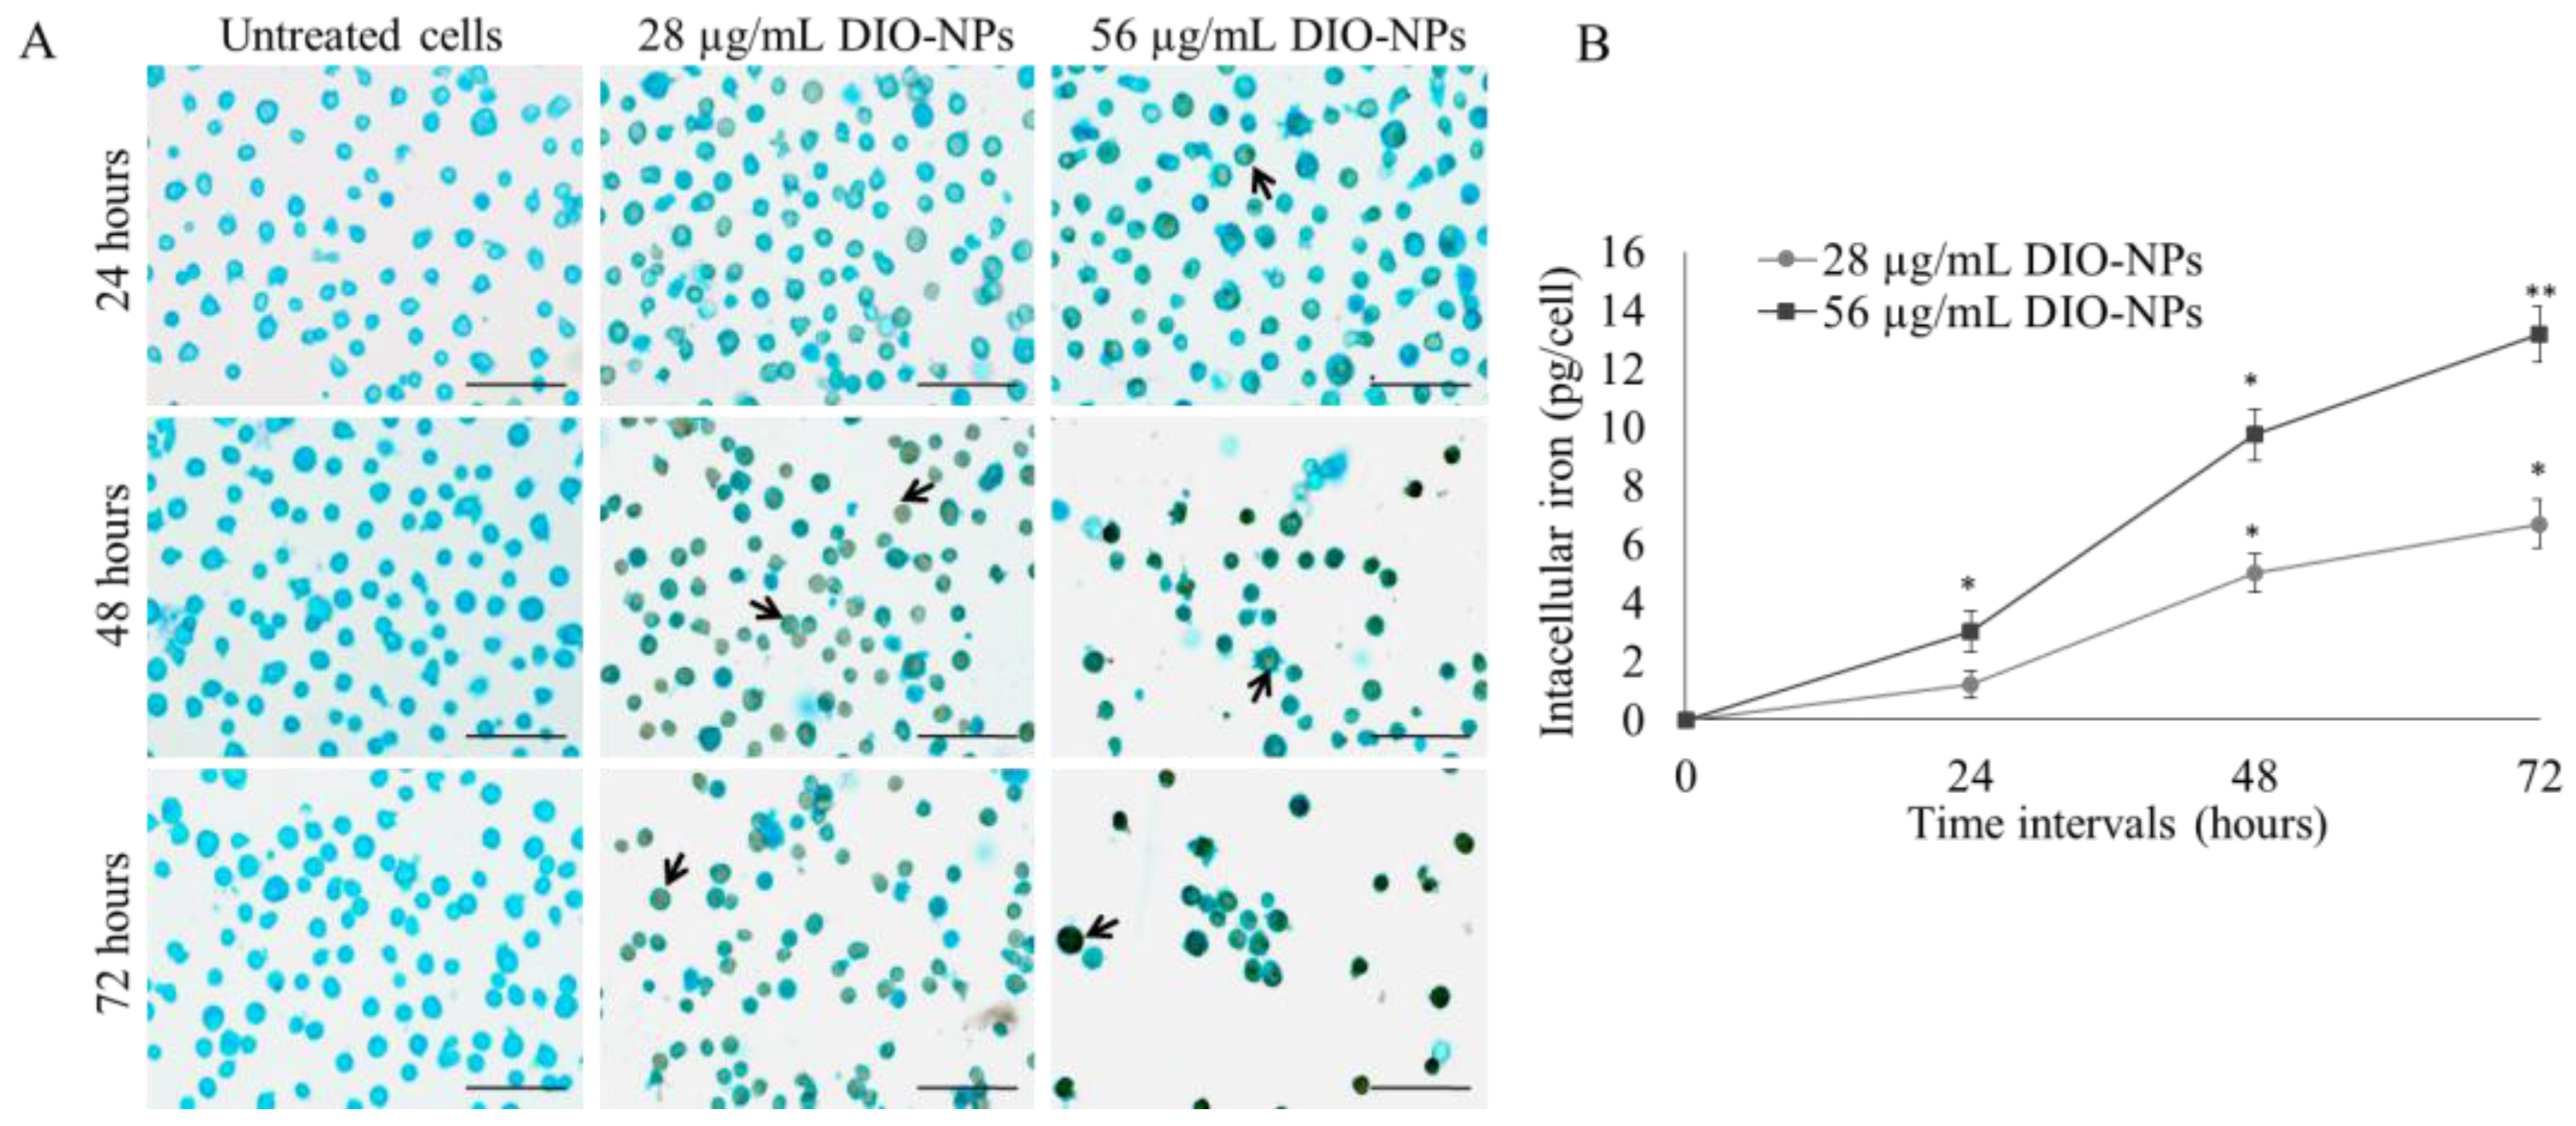
2.10. Intracellular Iron Quantification

2.10.1. DAB-Enhanced Prussian Blue Staining

DIO-NPs-treated Jurkat cells were transferred on polylysine-coated coverslips and allowed to fix with 4% paraformaldehyde for 10 min. After three washes with phosphate buffer saline (PBS), cells were incubated with Perls solution (5% HCl:5% Perls, 1:1) for 30 min. The coverslips were then washed and treated with 0.5 mg/mL diaminobenzidine (DAB) solution containing 0.033% hydrogen peroxide for another 30 min. After three washes with distillated water, cells were counterstained with LuxolFast Blue for one minute; then washed three times with alcohol 95% for 10 s, one time with butanol for 10 s and two times with toluene for 10 s. Before visualization, the coverslips were mounted with synthetic balm on microscope slides and analyzed using a DM2000 Leica microscope (Leica Microsystems, Groot Bijgaarden, Belgium) equipped with a Leica DFC 290 camera.

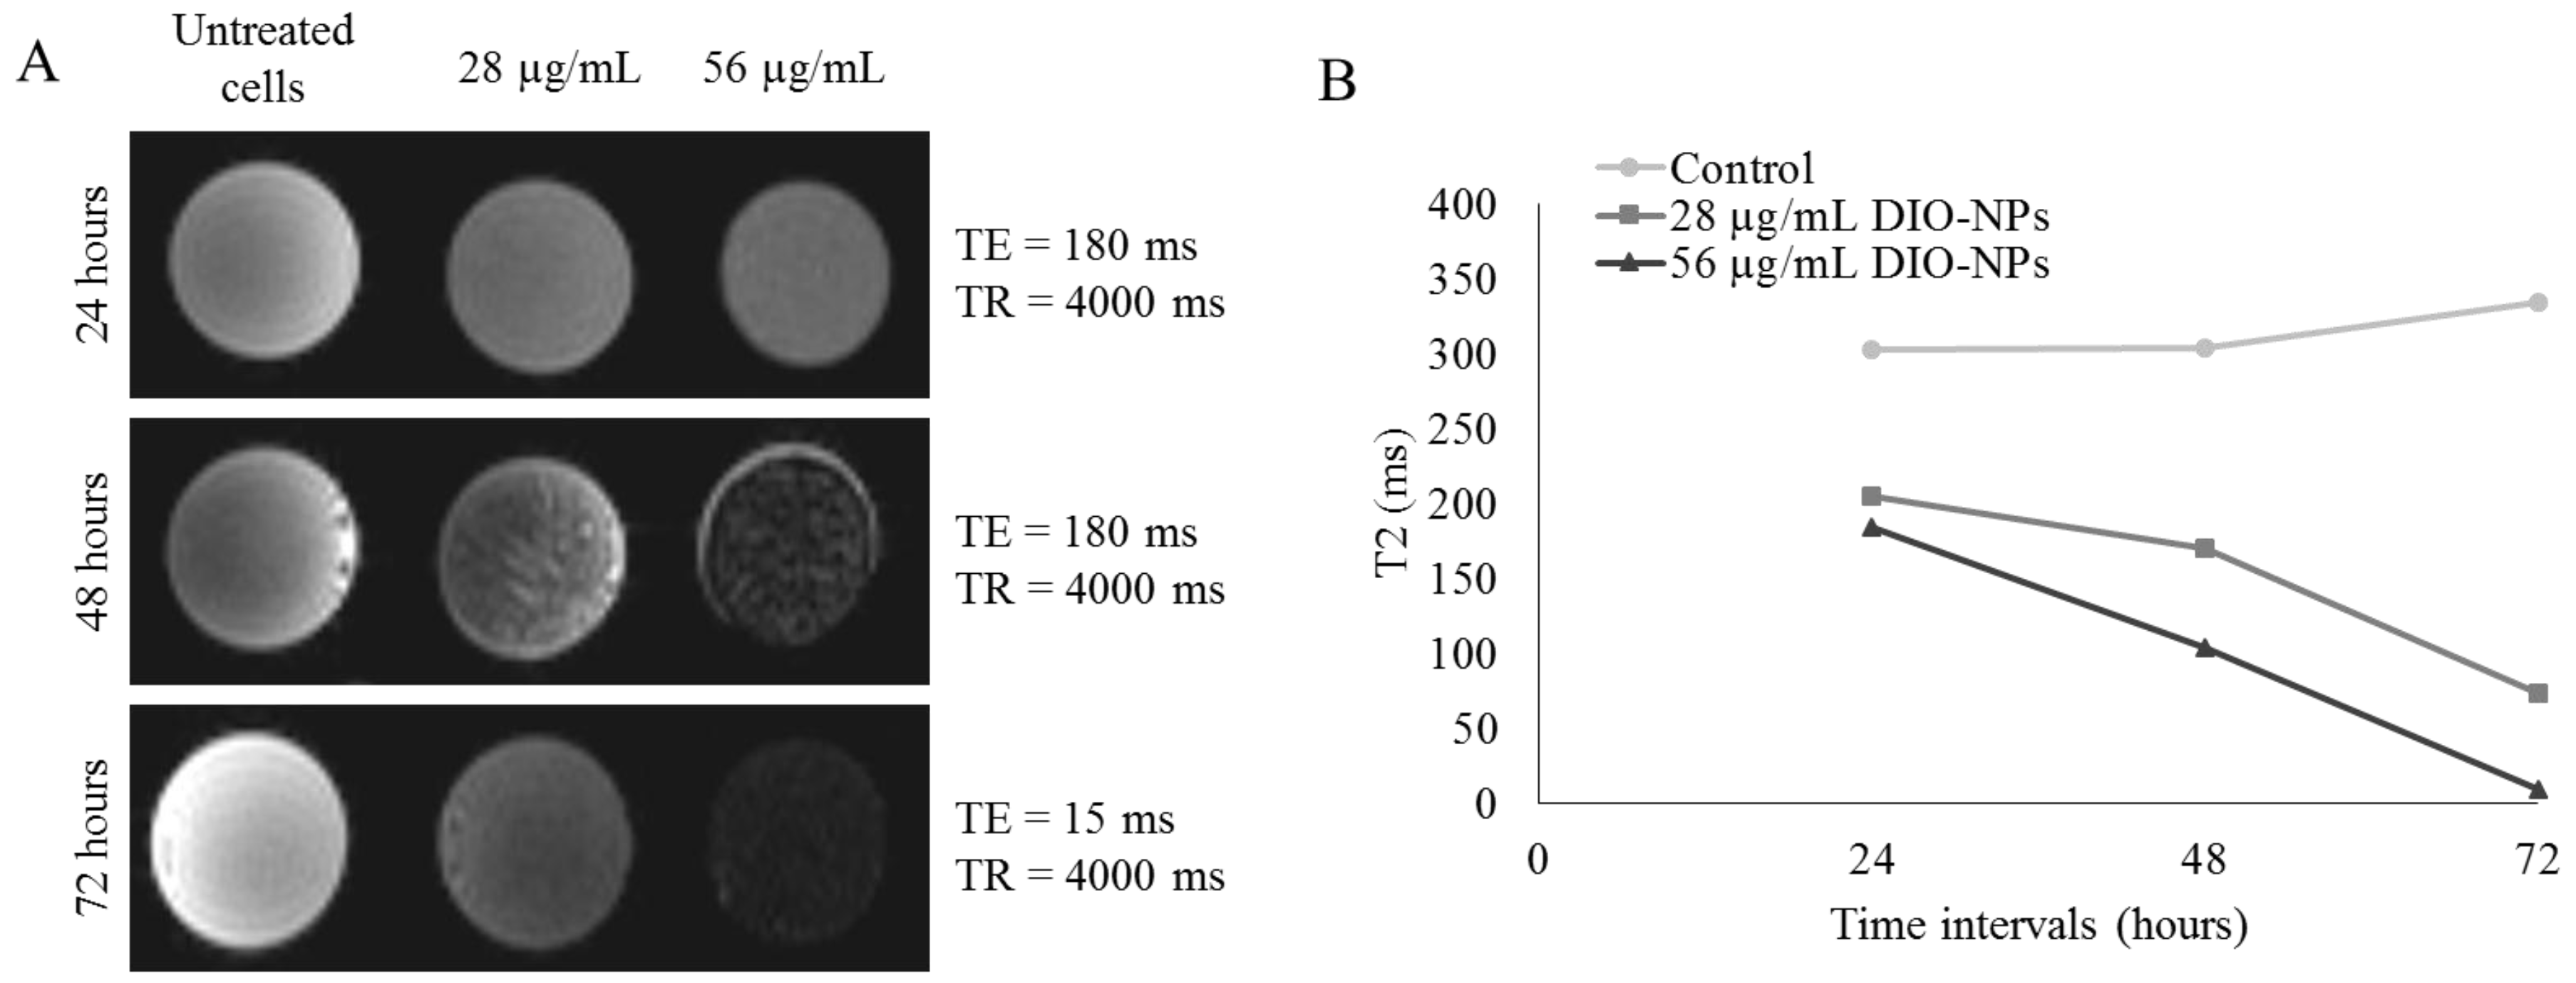
2.10.2. Relaxometry Technique

This method is based on an intrinsic property of iron oxide nanoparticles (IONPs) to increase the water proton relaxation rates (R1 or R2) by a value that is correlated to its concentration in the solution, cell suspension or tissue [25]. To quantify the iron from cellular suspension, 106 cells were mineralized in 100 µL 5 N HCl on a water bath at 80 °C for 4 h. In order to determine the longitudinal relaxation rate R1 of iron from the digested cell samples, T1 (longitudinal) relaxation time was measured at 37 °C and 1.4 T (60 MHz) on a Bruker Minispec mq60 (Karlsruhe, Germany). There is a reciprocal relation between R1,2 relaxation rates and T1,2 relaxation times: R1,2 (s) = 1/T1,2 (s−1). R1 value of mineralized DIO-NPs-free cells was subtracted from the R1 value of mineralized samples that contain NPs and the resulted values were transformed into iron concentration using a calibration curve made in the same conditions (concentrations ranging from 0.01–1 mM IONPs).

2.11. Lysosome Labeling

In order to perform this analysis, Lysotracker green DND-26, a fluorescent compound for labeling and tracking acidic organelles in live cells was used. After treatment, 106 Jurkat cells were pelleted and incubated for 30 min in 200 µL of 100 nM Lysotracker solution made in fresh culture medium at 37 °C. Then, cells were re-pelleted by centrifugation, washed with PBS and fixed on cover slips. For visualization of lysosomes, the cover slips were mounted on microscope slides and observed in green fluorescence on an Olympus IX73 inverted microscope (Tokyo, Japan) equipped with a Hamamatsu ORCA-03 camera. A solution of 2 µg/mL DAPI was also used for nuclear staining (blue fluorescence). The pictures were analyzed by ImageJ software (version 1.47q, National Institute of Health, Bethesda, MD, USA). The fluorescence intensity of labeled lysosomes was correlated with cell number from each picture and expressed as percentage of treated cells compared to the control.

2.12. MRI Analysis

In vitro MRI was performed on a 7 Tesla MRI scanner (Bruker Biospec imaging system equipped with a PharmaScan horizontal magnet, Bruker, Ettlingen, Germany). After treatment, 2 × 10⁶ cells were mixed with 100 µL of 2% gelatin and placed into NMR tubes at −20 °C to solidify. Transversal sections over the 7-mm tubes were scanned with a 4.5 cm2 field of view (FOV) and 1 mm slice thickness. The T2-weighted images were acquired with a multi-slice-multi-echo (MSME) imaging sequence using the following parameters: Echo: 7/16, TR = 4000 ms, TE = 15 ms or 180 ms, MTX = 256 × 256, NEX = 1.

2.13. Measurement of ROS Content

ROS generation in Jurkat cells was evaluated by utilizing the dye 2′,7′-dichlorodihydrofluorescein diacetate (H2DCFDA) which can be oxidized by a range of intracellular ROS to 2′,7′-dichlorofluorescein (DCF), a highly fluorescent compound [26]. Briefly, after 24, 48, and 72 h exposure to DIO-NPs (28 and 56 μg/mL), the cells were washed and incubated with 10 µM H2DCFDA (in fresh culture medium) in dark at 37 °C for 30 min. Then, the cells were washed twice, re-suspended in PBS, and DCF absorbance was spectrofluorimetrically recorded at 488/515 nm (excitation/emission). Before this biochemical analysis, cells from each sample were counted. Results were expressed as relative fluorescent units (RFU) per number of cells and represented as a ratio of treated cells to untreated cells.

2.14. Measurement of GSH Content

The intracellular GSH concentration was evaluated using the Glutathione Assay Kit (CS0260, Sigma-Aldrich, Darmstadt, Germany) according to the manufacturer’s instructions. After treatment, cell extracts were first deproteinized with 5-sulfosalicylic acid (1:1) and the supernatants were recovered. A volume of 10 µL from each sample was added in a 150 µL working mixture containing enzyme solution, 5,5′-Dithiobis(2-nitrobenzoic acid) (DTNB) and assay buffer and incubated 10 min at room temperature. After adding NADPH solution, TNB formed was measured spectrophotometrically at 405 nm. A calibration curve (3.125–50 µM) was similarly prepared using glutathione solution as standard. The results were expressed in nmoles GSH/mg of protein and represented as a ratio of treated cells to untreated cells.

2.15. Measurement of Lipid Peroxidation Level

The level of MDA, as a marker of lipid peroxidation, was assessed using the method described by Dinischiotu et al. [27]. After exposure to DIO-NPs, 200 µL of protein extract was treated with 700 µL 0.1 N HCl and incubated for 20 min at room temperature. Then, a volume of 900 µL of 0.025 M thiobarbituric acid (TBA) was added and the mixture was incubated for 65 min at 37 °C. The MDA content in cell lysates was measured at 520/549 nm (excitation/emission) using 1,1,3,3-tetramethoxypropane as a standard. The results were calculated as nmoles of MDA/mg of protein and represented as a ratio of treated cells to untreated cells.

2.16. Data Analysis

All experiments were performed at least in triplicate. The results were normalized to the controls and they were expressed as means ± standard deviation (SD). The statistical significance was evaluated using unpaired Student’s t-test and validated by confidence intervals using the Quattro Pro X3 software (Corel Corporation, Ottawa, CA, USA) (α = 0.05). A value of p < 0.05 was considered statistically significant.

3. Results

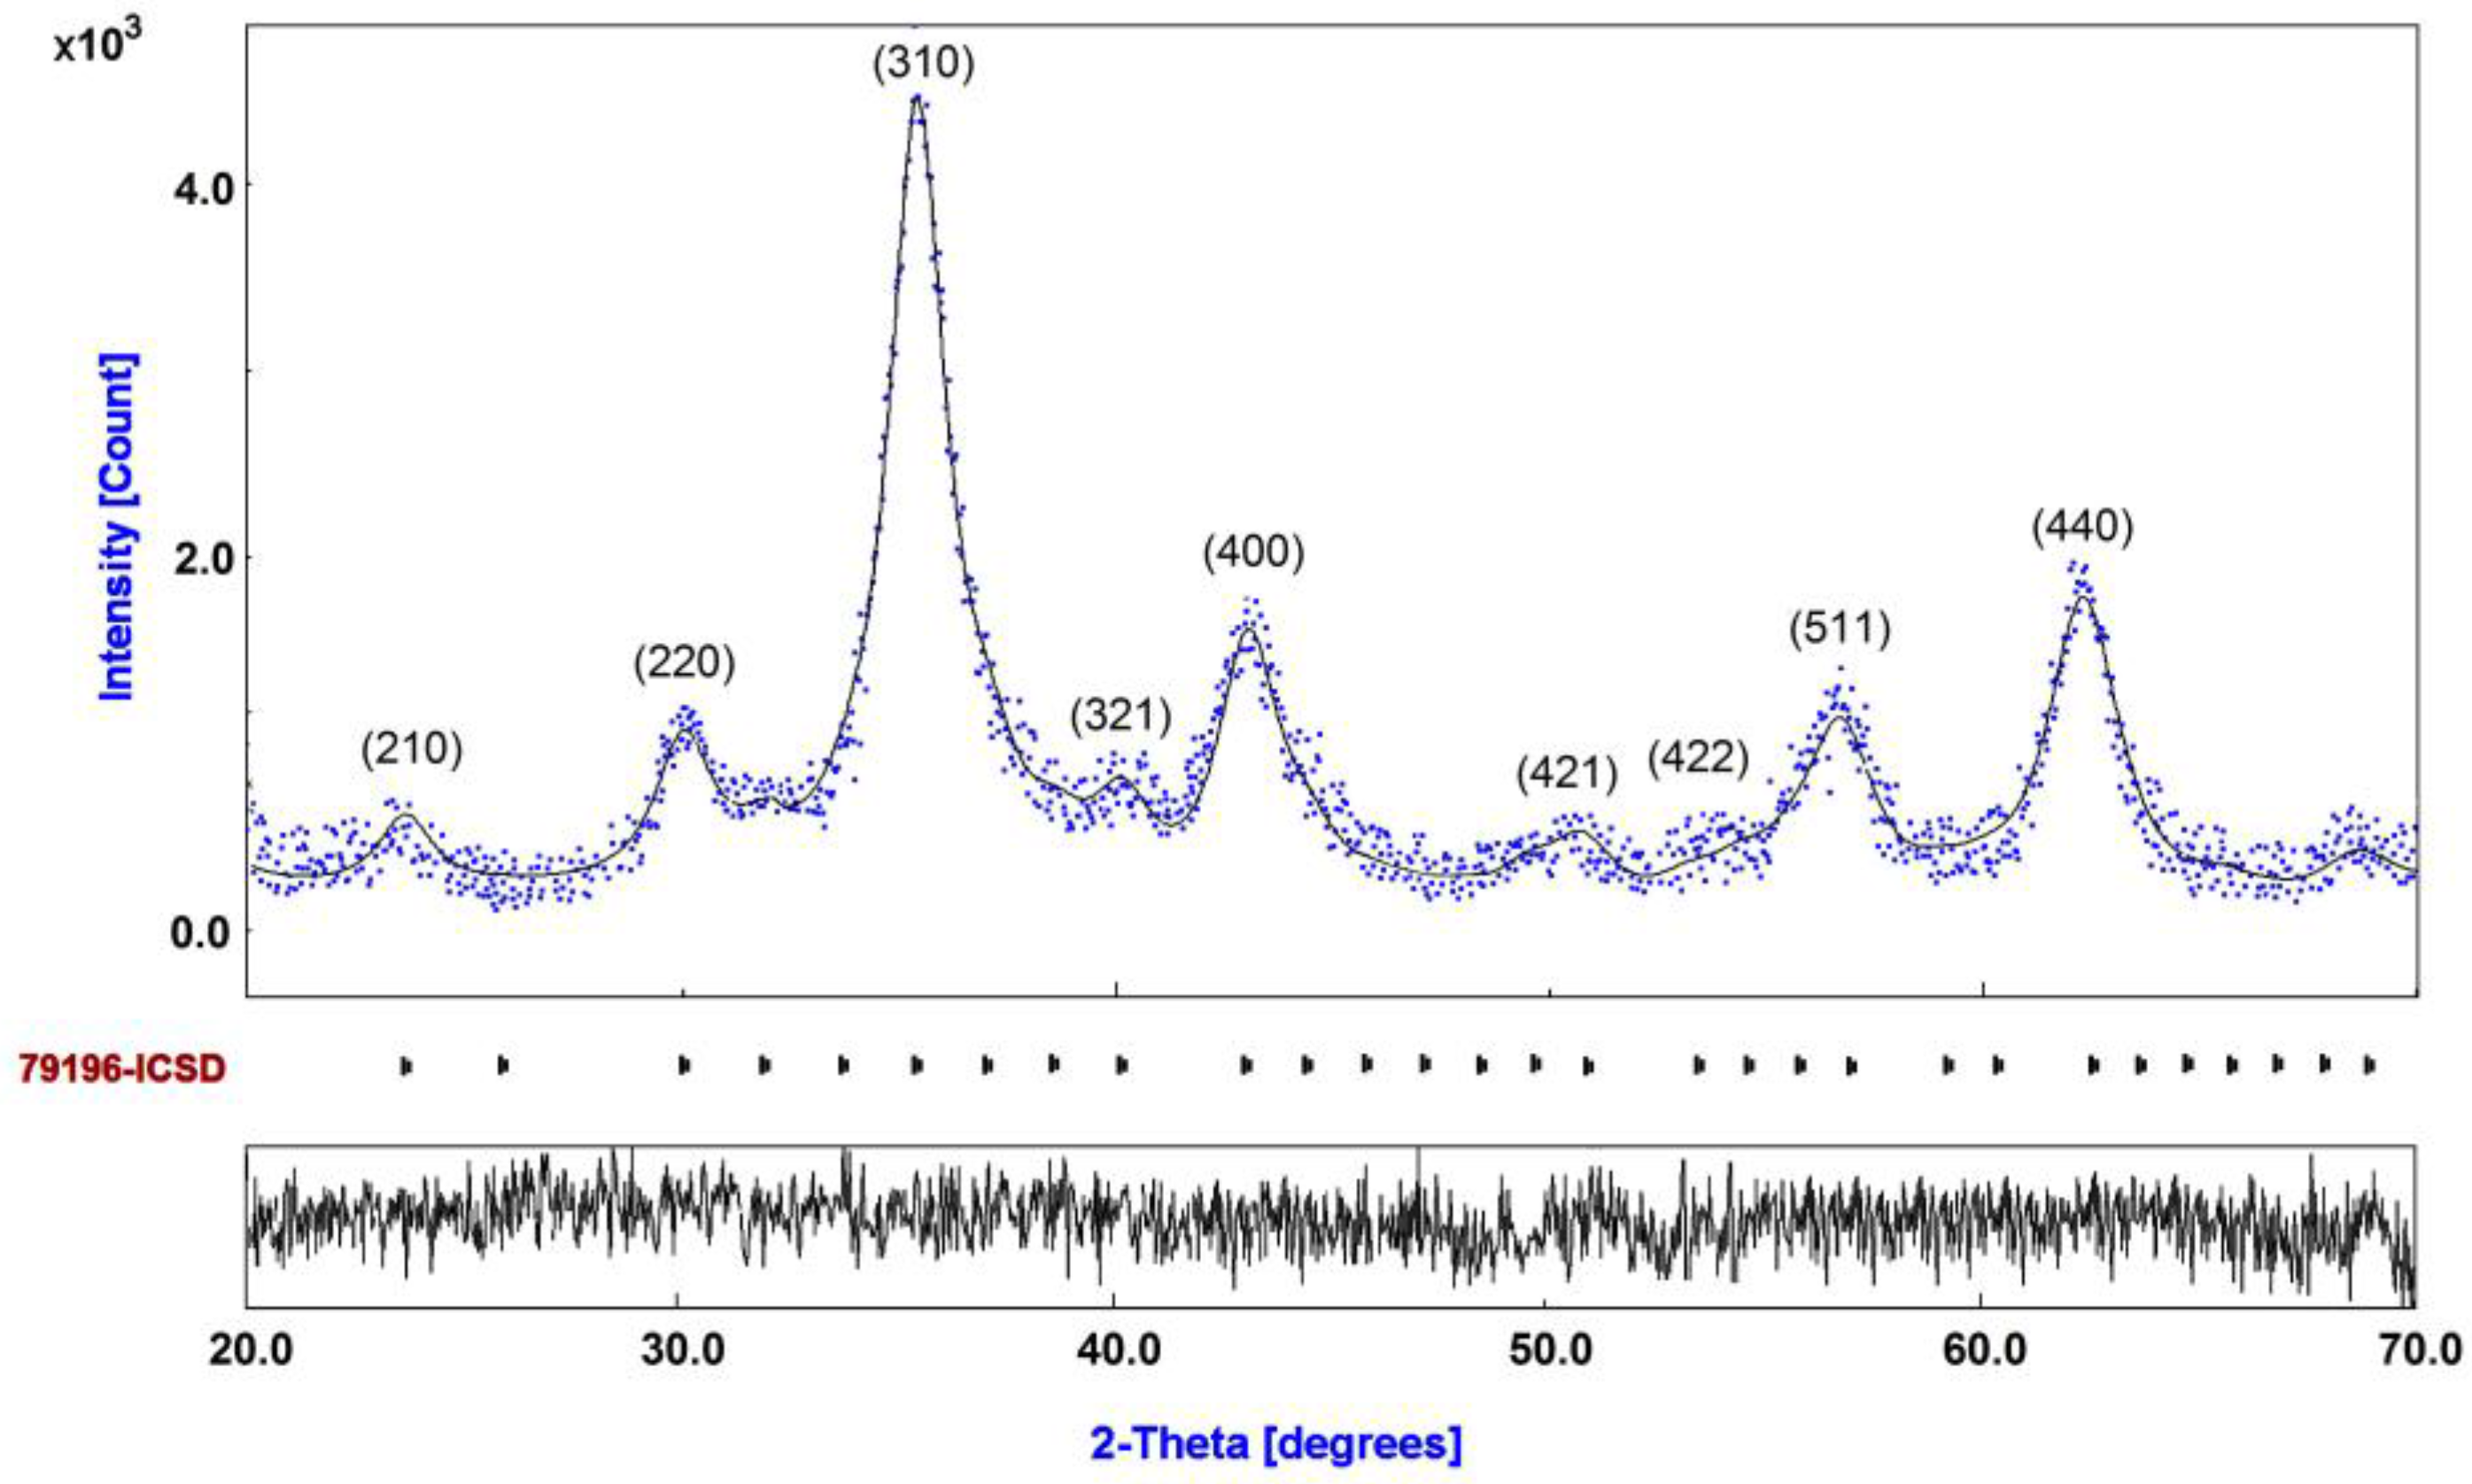
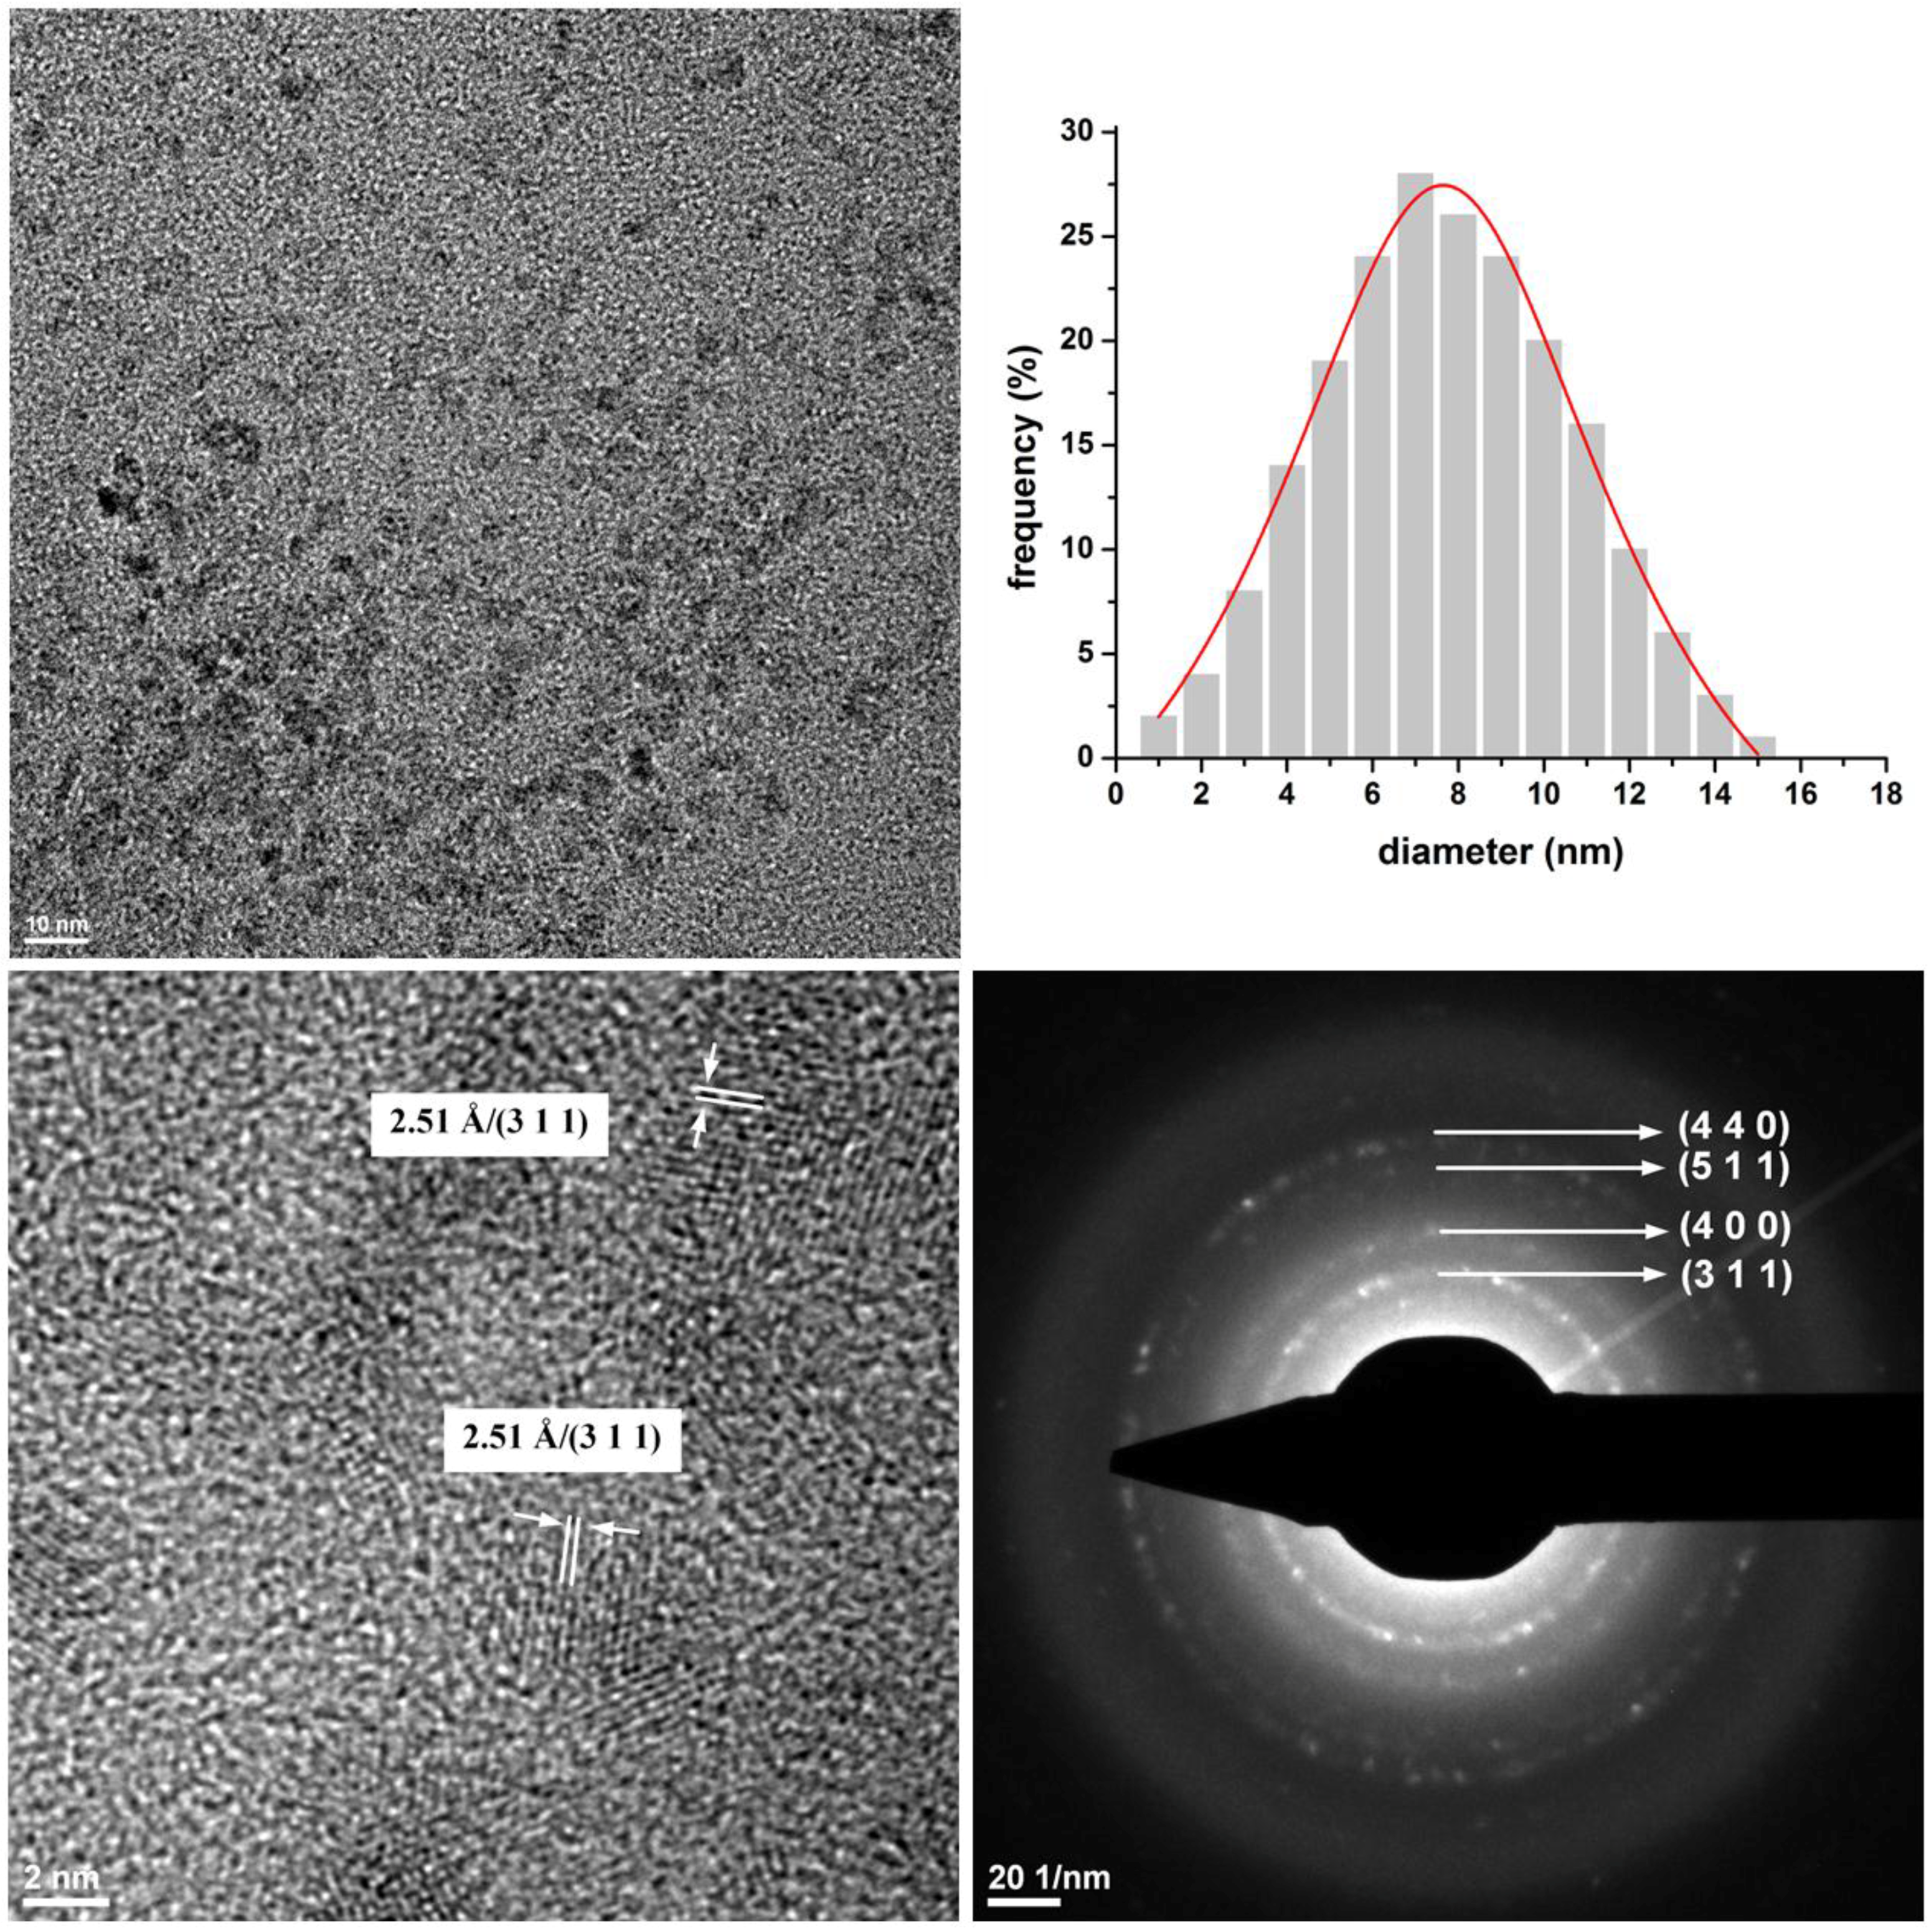
3.1. Diffraction Pattern and Size Distribution of DIO-NPs

Figure 1 displays the peaks from representative diffraction pattern of sample studied. A good fit has been obtained by the Rietveld method using MAUD (Material Analysis Using Diffraction) [28]. The XRD analysis of DIO-NPs by Rietveld refinement of X-ray diffraction patterns have clearly identified a single phase of maghemite. On the other hand, the spinel cubic structure with Fd3m space group has been confirmed. The diffraction peaks corresponding to the Miller indices value (hkl) of (210), (220), (310), (321), (400), (421), (422), (511), and (440) agree with the cubic structure of maghemite (ICSD-PDF No. 79196) with a lattice parameter of 8.349 Å. As it was mentioned in previous studies on identification and quantification of magnetite–maghemite mixture using conventional X-ray diffraction technique carried out by W. Kim et al. [29], the magnetite and maghemite phases are difficult to differentiate when they coexist because they are very close. The lattice parameter calculated from the pattern play an important role in the establishment the magnetite or maghemite phase. The lattice parameter calculated in the present study was equal to 8.349 Å. Furthermore, if we compare value obtained for the lattice parameter calculated in the present study with those found in literature it can be seen a good agreement [30,31,32]. In good agreement with previous studies [33], the slight broadening of the diffraction lines can be interpreted in terms of small sized crystallites. The calculated particle size of DIO-NPs was estimated at about 7.08 nm. In the Figure 1, the observed data are represented in blue and the calculated data by a gray line. Vertical lines represent the positions of diffraction lines of maghemite. The line below the gray plot is the difference profile. It resulted that the DIO-NPs sample is constituted of spherical nanocrystallites. The standard R-factors and chi squared (χ2) quantities are the parameters which provide information about conventional goodness of fit. Generally, R-factors quoted in Rietveld refinement programs are expected R-factor (Rexp), weighted profile R-factor (Rwp), and Bragg R-factor (RB) [34,35]. The final R factors obtained from the analysis of the DIO-NPs were given by Rwp = 0.7189 (%) and Rexp = 0.6847 (%). The resulting Bragg R-factor (RB) and χ2 were 0.574 and 1.05. Theoretical values of R factors obtained for DIO-NPs are in good agreement with the theory of Toby [36].
The average size, deduced from the XRD data refinement, has a value of 7.08 nm for DIO-NPs consistent with the mean sizes deduced from TEM observations (Figure 2). DIO-NPs have a spherical shape and size distribution was determined by measuring the mean diameter, D, of approximately 700 particles. The average grain size of the monodisperse DIO-NPs is 7.5 (±0.5) nm. The clear lattice fringe in the HR-TEM image demonstrates the effective crystalline nature of resultant nanoparticles. The interplanar distance of 2.51 was attributed to the (311) planes of maghemite, respectively. Therefore, the X-ray diffraction patterns and HR-TEM give feature characteristics of the maghemite’s structure.

3.2. The Colloidal Stability

The hydrodynamic diameter of dextran-coated Fe2O3 nanoparticles remained constant over time in the cell culture medium (Table 1), being near the primary size established by XRD measurements (Figure 1). This confirms the stability of nanoparticle structure during the 72-h cell treatment. The data are supported by the fact that there was no precipitation or aggregation noticed during these time intervals.
The colloidal stability of freshly prepared nanoparticle suspension was indicated by the zeta potential value of about −30 mV (Table 1). The presence of serum proteins in the cell culture medium clearly affected the electrostatic potential of nanoparticles, as the zeta potential increased up to −7.5 mV after 72 h. This shift in the zeta potential suggests a significant change in the surface charge of nanoparticles due to the cell culture medium composition.

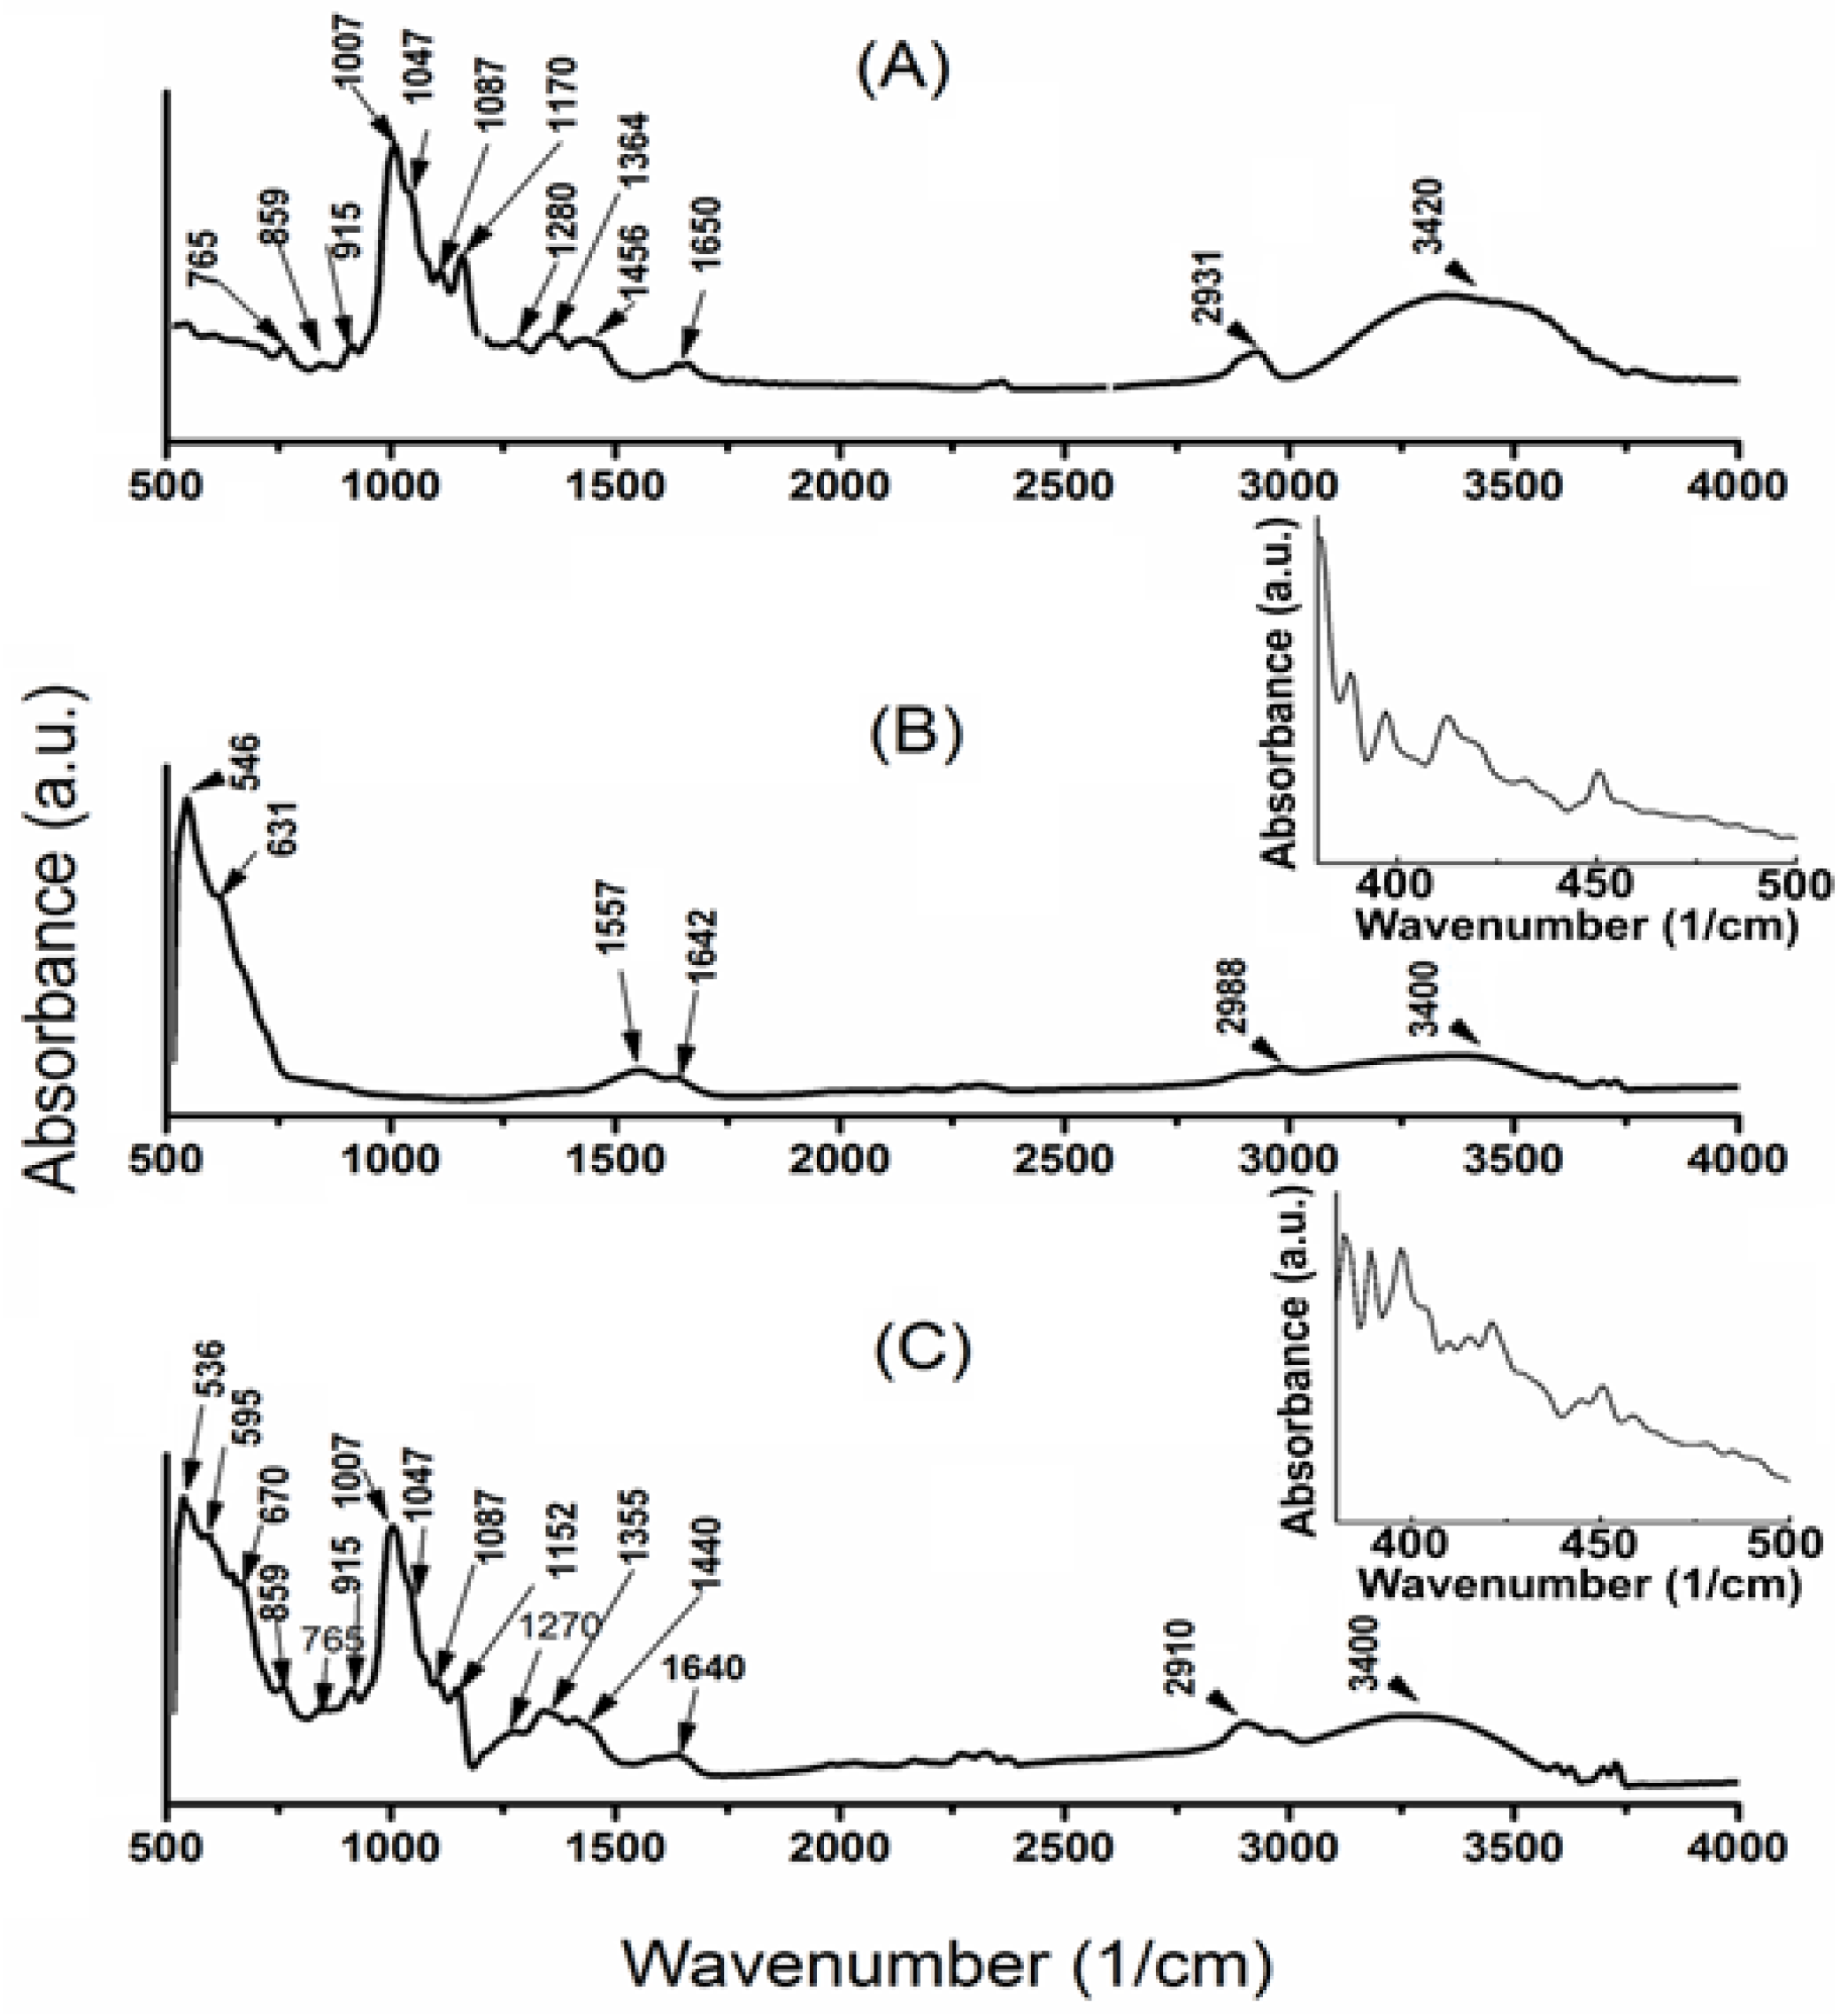
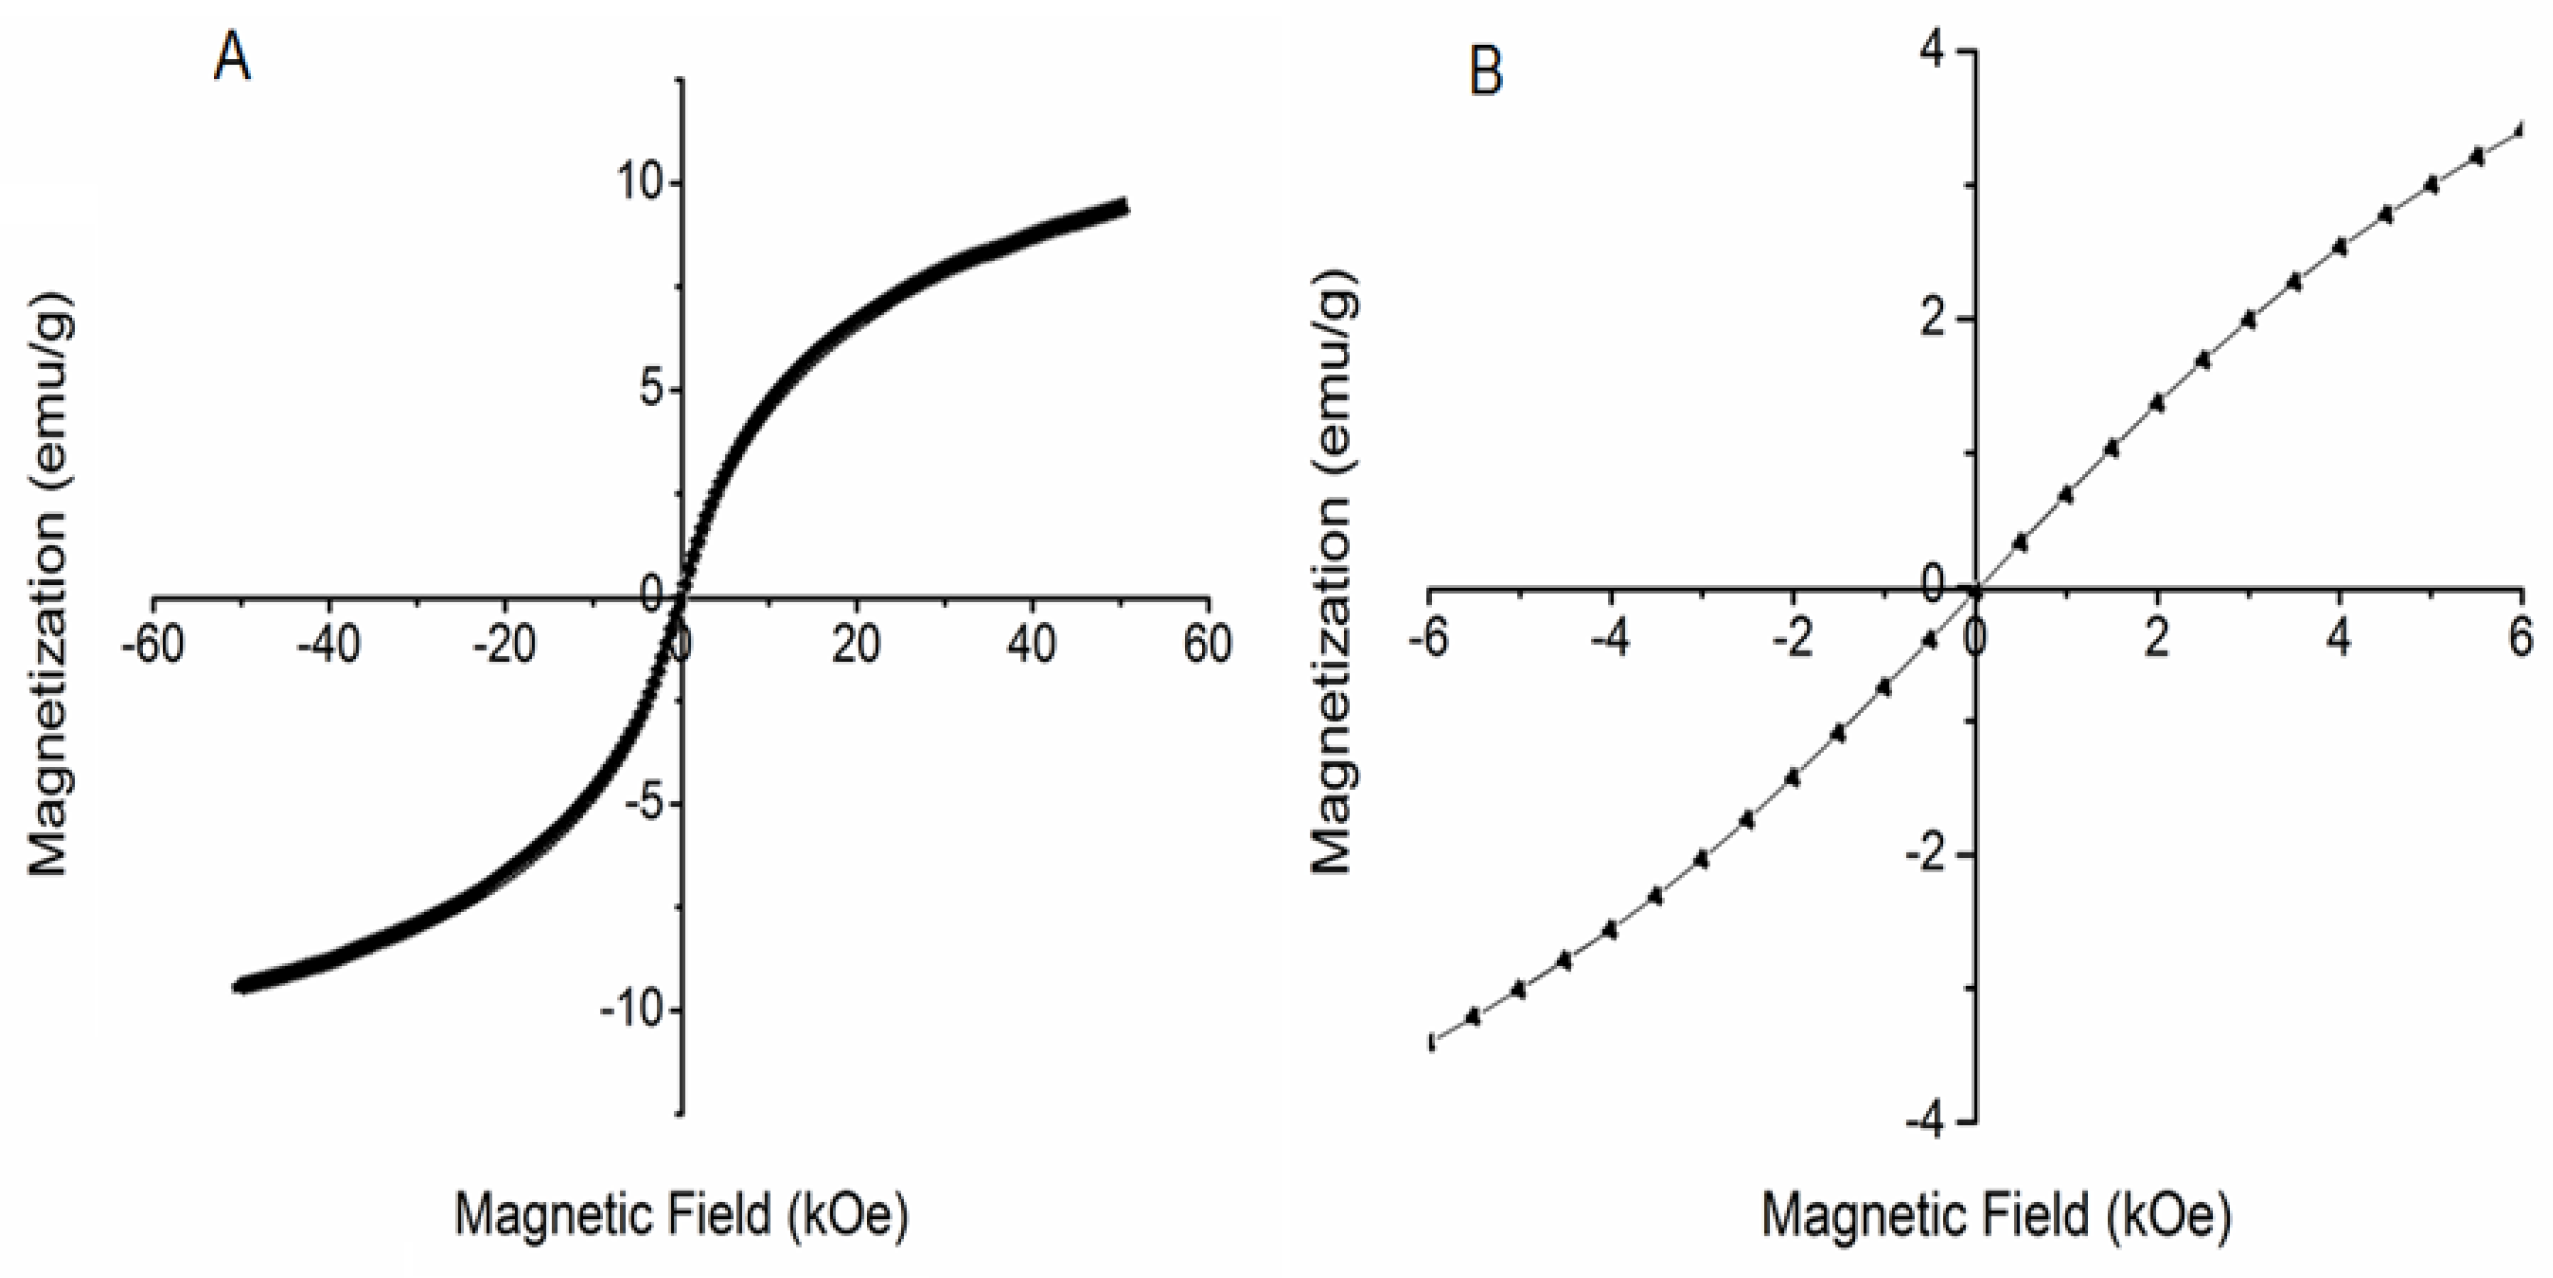
3.3. ATR–FTIR Spectra and Magnetic Behavior of DIO-NPs

In this study, the ATR–FTIR technique was used to investigate the attachment of dextran at the surface of iron oxide nanoparticles. Figure 3 shows the ATR–FTIR spectra of (A) dextran, (B) maghemite, and (C) maghemite coated with dextran.
The DIO-NPs (Figure 3C) spectrum preserves the characteristic vibrational bands of maghemite spectrum (Figure 3B) in the spectral ranges 380–4000 cm−1. The characteristic vibrational bands of maghemite spectrum in the spectral ranges 380–500 cm−1 are also presented in Figure 3B,C. Both spectra show the characteristic vibrational bands MTh-MOh (ν3 ≈ 350–400 cm−1), MOh-O (ν2 ≈ 470 cm−1) and MTh-O-MOh (ν1 ≈ 620–550 cm−1), where MTh and MOh correspond to the metal occupying tetrahedral and octahedral positions respectively [37,38]. The bands observed at 620 cm−1 and 580 cm−1 correspond to the stretching vibration ν(Fe-O) of tetrahedral iron atom [38,39]. The band around 859 cm−1 represents the C-H deformation vibrations [40]. The peaks in the spectral range of 900–1500 cm−1 were due to ν(C-C) and ν(C-O) stretching vibration with contributions from δ(C-O-H) motion [41]. The peaks assigned to ν(C-H) and ν(C-H) vibrational modes are found in the DIO-NPs spectrum at 1355, 1440, and 2910 cm−1 while in the dextran spectra these peaks are found at 1364, 1456, and 2931 cm−1. The peaks due to α-glucopyranose ring deformation modes are found at 765 cm−1 and 915 cm−1 in dextran and DIO-NPs spectra. According to recent studies [6] these results confirm the presence of dextran coating on the iron oxide particles.
The intensity of the OH vibration mode of crystal water at around 1640 cm−1 due to the adsorbed water molecules in the sample [42] is present in all the spectra from Figure 3. A broad peak at around 3340 cm−1 present in the DIO-NPs spectra corresponds to OH stretching ν(OH). According to Farmer [43] this broad peak may include some contribution from adsorbed water. In the dextran (Figure 3A) spectra, the broad peak corresponding to OH stretching ν(OH) is centered at 3420 cm−1, while in the maghemite spectra (Figure 3B) this broad peak is centered at around 3400 cm−1.
Magnetic measurements of the maghemite-coated dextran was carried out using vibrating sample magnetometer (VSM). Magnetization curves (M-H loop) for the DIO-NPs measured at room temperature are presented in Figure 4. According to previous studies [44,45] the DIO-NPs, shows negligible value of coercivity which indicates the presence of superparamagnetic phase. From hysteresis measurements, the remnant magnetization (Mr) and coercivity fields (Hc) were equal to 0 Oe at 300 K. On the other hand, the calculated magnetization value of DIO-NPs was found to be 9.84 emu/g. The obtained value for magnetization is in agreement with results previously presented by Jiang et al. [46] in their studies on preparation and characterization of poly(glycidylmethacrylate)-grafted magnetic nanoparticles. According to the studies on magnetic monodisperse Fe3O4 nanoparticles conducted by Si et al. [47] low magnetization could be due to the dextran layer on the surface and stabilization of iron particles. On the other hand, Easo and Mohanan [6] in their recent studies showed that the superparamagnetic characteristic of DIO-NPs signifies that these particles have single domains and all magnetic moments are aligned in one direction.

3.4. DIO-NPs Relaxivity

DIO-NPs relaxivity (r1, r2) represents the relationship between inverse T1 or T2 times and iron concentration and are important parameters of the contrast agent efficacy. After measuring the T1 (104.00 ± 0.26 ms) and T2 (13.97 ± 0.17 ms) times, we were able to determine the r1 and r2 relaxivity values at 60 MHz. The values obtained were: r1 = 10.47 ± 0.15 s−1·mM−1 and r2 = 79.98 ± 0.21 s−1·mM−1. The obtained results lead to a high ratio of r2/r1 = 7.63 which is required for a good T2 contrast.

3.5. DIO-NPs Cytotoxicity

The results of the MTT test indicated that DIO-NPs exposure induced a moderate decrease of Jurkat cells viability in a time and dose-dependent manner (Figure 5A). Starting with 48 h, a significant decrease of cell viability by 26% was observed for 56 µg/mL DIO-NPs treated cells compared to control. After 72 h, the activity of mitochondrial dehydrogenases decreased significantly in 28 and 56 µg/mL DIO-NPs exposed cells by 17% and 35%, respectively. A concentration of 14 µg/mL DIO-NPs did not induce cytotoxic effects in these cells.
The measurement of LDH activity in the culture medium is also used to estimate cytotoxicity. The LDH leakage is characteristic to necrotic cells and results due to the loss of membrane integrity. This enzymatic activity determination confirmed the MTT assay results (Figure 5B) being in an inversely proportional relationship. For the higher dose, the LDH activity increased significantly by 10%, 15%, and 21% after 24 h, 48 h, and 72 h respectively. For the lower dose, a significant LDH release by 11% compared to control group was noticed.

3.6. Iron Accumulation in Jurkat Cells

Figure 6 shows the level of iron uptake in treated cells. Thus, first image (Figure 6A) is a DAB-enhanced Prussian blue staining of Jurkat cells treated and untreated with DIO-NPs. Black arrows indicate brown iron deposits inside lymphoblast cells, well contrasted by the blue color of cytoplasm subsequent to Luxol Fast Blue counterstaining. Random microscopic fields with cells were photographed and a progressive accumulation of iron (dependent on time and dose) was observed. Moreover, we also noticed that a massive accumulation of iron was associated with a decrease in cell viability. To confirm the results, iron content was analyzed by a quantitative method based on relaxometry (Figure 6B). This method has shown similar results. After 24 h of exposure to 28 and 56 µg/mL DIO-NPs, intracellular iron concentration quantified by relaxometry increased to 1.20 ± 0.46 and 2.99 ± 0.71 pg/cell, respectively, compared to control. At a time interval of 48 h, the iron content increased to 5.02 ± 0.64 pg/cell for the DIO-NPs dose of 28 µg Fe/mL and to 9.74 ± 0.87 pg/cell for the double dose compared to untreated cells. For the same doses, intracellular iron concentration increased to 6.68 ± 0.83 and 13.16 ± 0.95 pg/cell respectively after 72 h exposure.

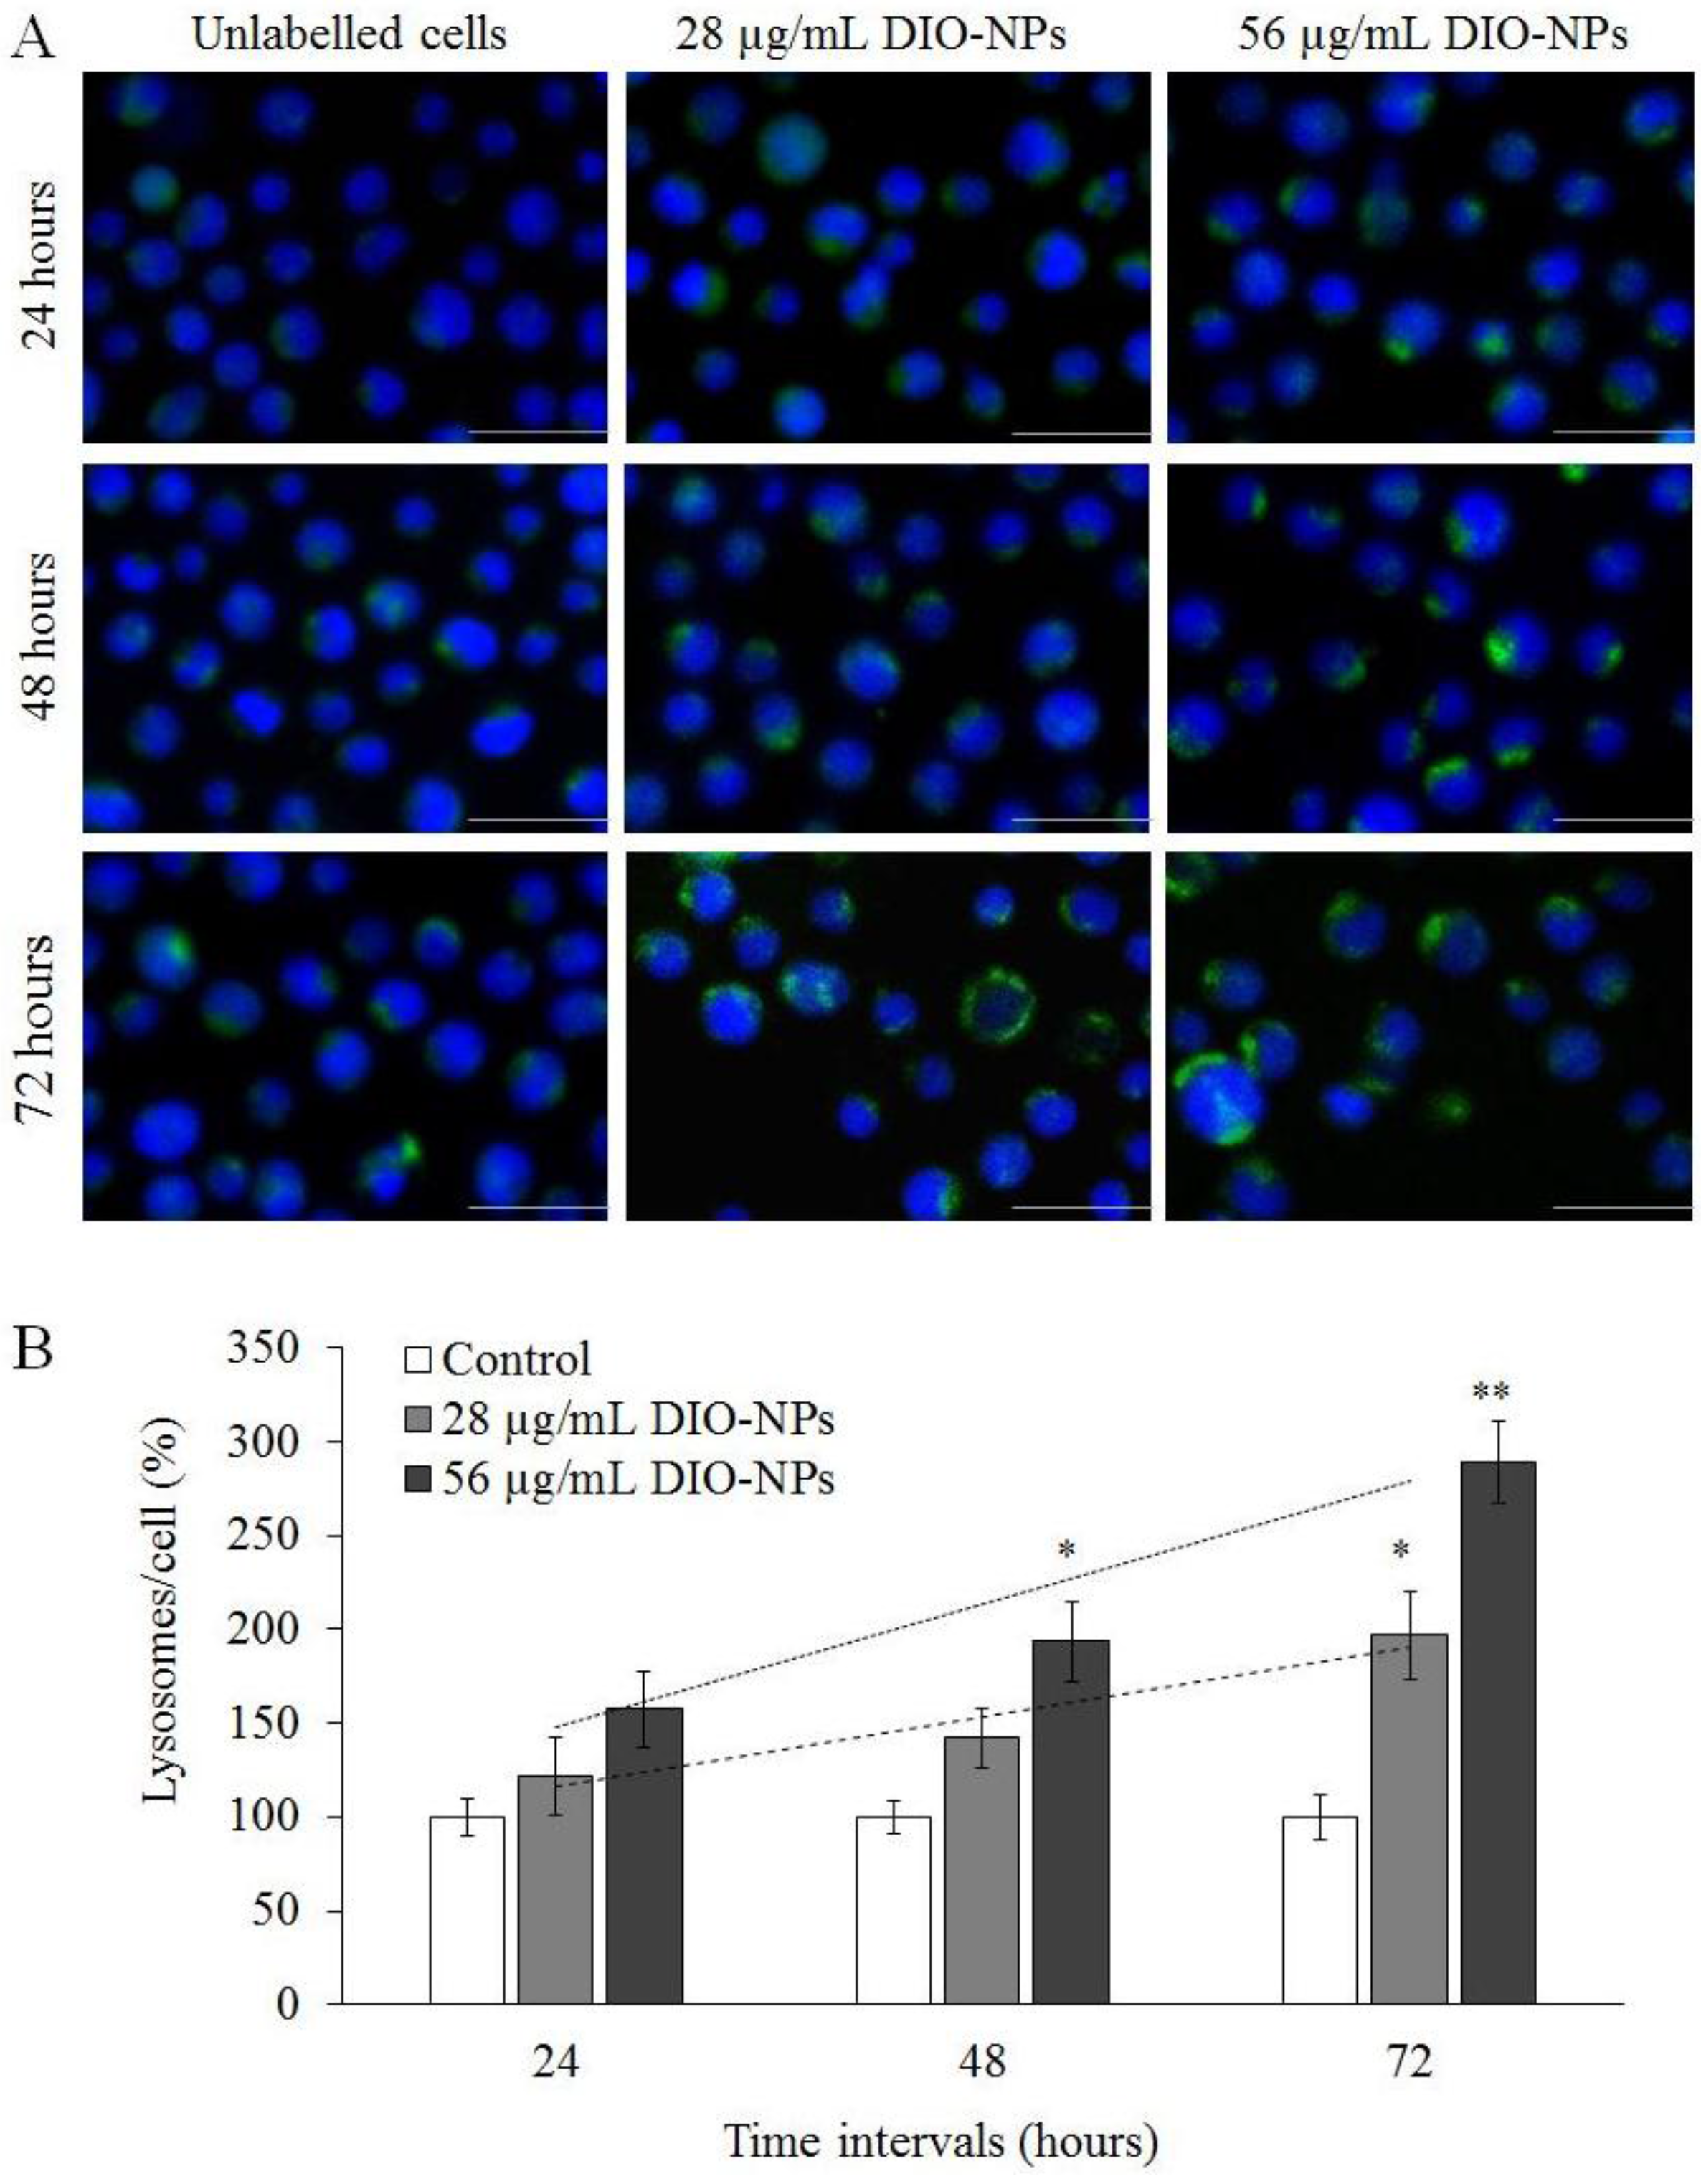
3.7. Intracellular Distribution of Lysosomes

Localization of lysosomes inside Jurkat cells was analyzed by fluorescence microscopy. Random images (Figure 7A) were taken after DIO-NPs treatment and it was observed that number of lysosomes increased in a dose and time dependent manner. The results shown in Figure 7B indicated an increase by 21% of the lysosome content after 24 h of incubation with the lower dose and by 57% for the higher one, whereas after 48 h of incubation, the lysosome content increased by 41% and 93% respectively compared to control samples. In the last analyzed time interval, additional lysosome formation was strongly induced, highlighted by an increase of fluorescence by 96% and 188% respectively, for the two doses compared to controls.

3.8. MRI and Relaxivity of NPs-Labeled Jurkat Cells

Dextran-iron oxide nanoparticles are considered negative contrast agents because they shorten the T2 and T2* relaxation times of the nuclei located in their neighborhood generating a dark signal on T2-weighted MR images [48]. The effect of nanoparticles on the MRI signal intensity of the cell samples could be visualized on T2-weighted MR images (Figure 8A). Cell samples exhibited an increasing darkening that corresponds to an increasing intracellular DIO-NP concentration inside Jurkat cells dependent on time. The images were sustained by the obtained T2 values (ms) shown on the graphic representation in Figure 8B.

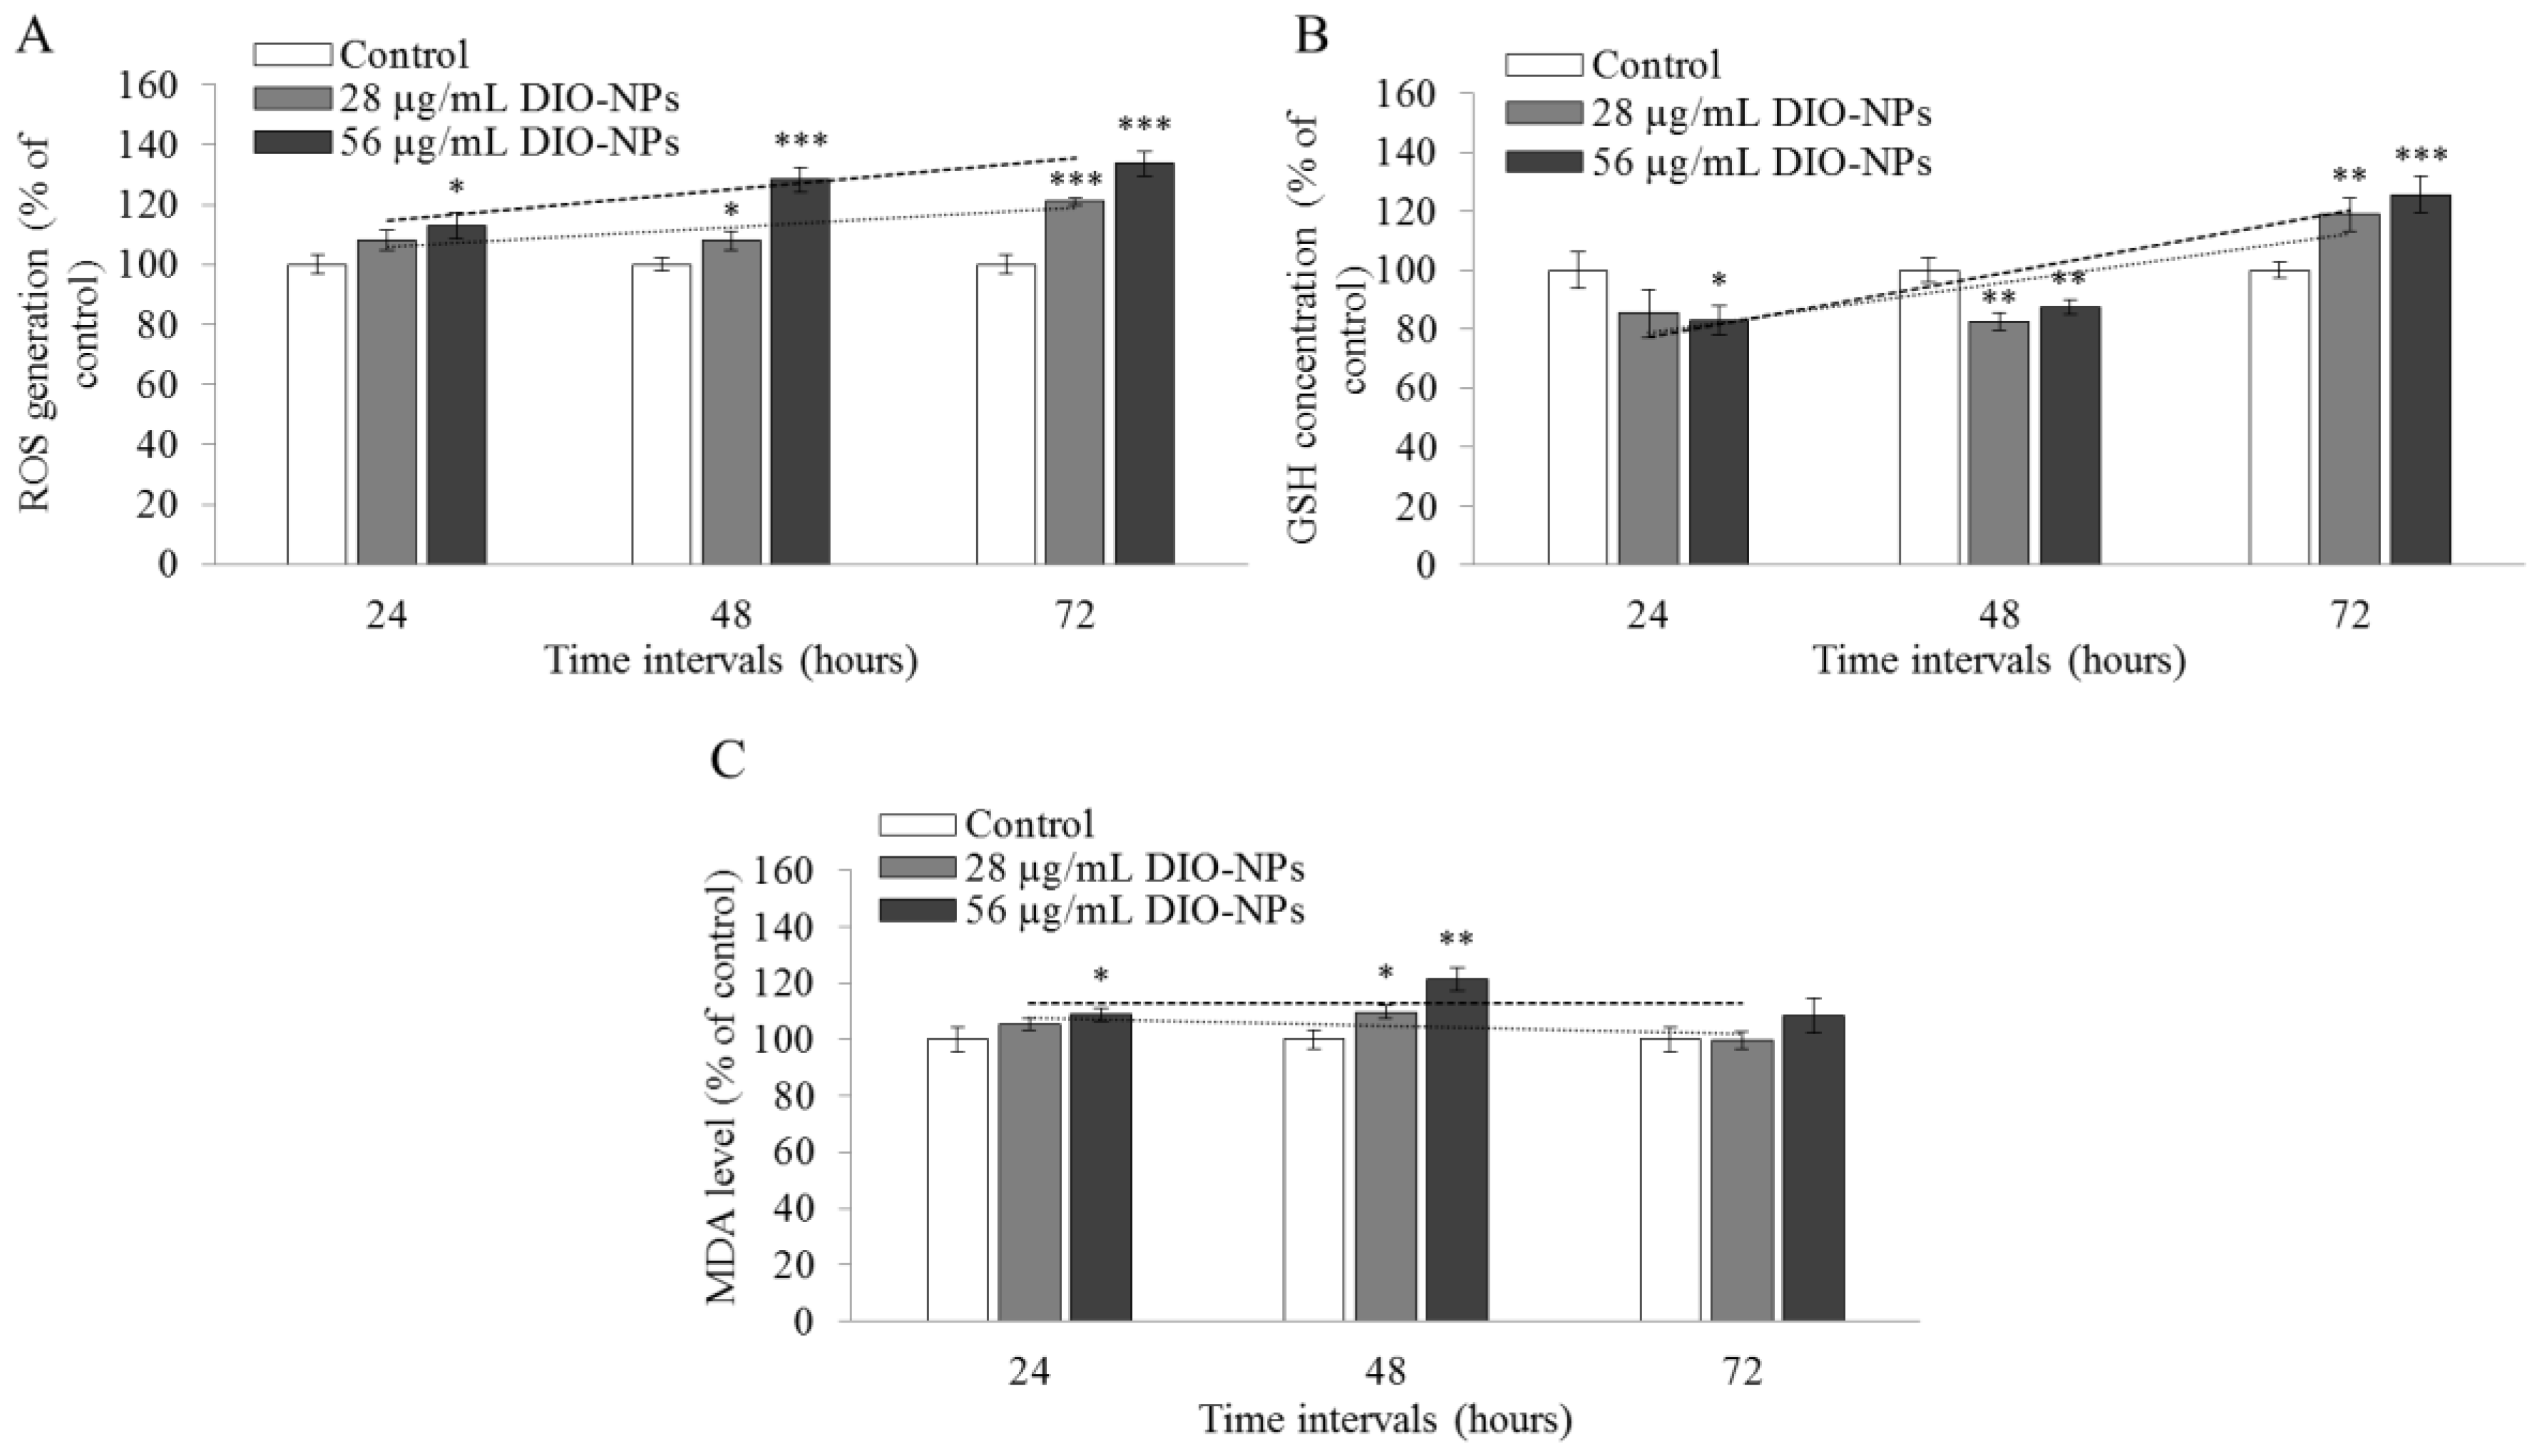
3.9. Evaluation of Oxidative Stress

In order to estimate the negative potential of DIO-NPs on Jurkat cells, a series of parameters related to oxidative stress, such as ROS production, GSH content, and lipid peroxidation were analyzed.
DIO-NP exposure of Jurkat cells increased intracellular ROS level in a time and dose-dependent manner. As shown in Figure 9A, treatment with 28 µg/mL DIO-NPs caused a significant increase of intracellular ROS level by 8% and 21% after 48 h respectively 72 h. The ROS production at higher dose was more important, its increase being by 12%, 28%, and 33% after 24 h, 48 h, and 72 h compared to controls.
In correlation with these results, we noticed a significant GSH depletion in Jurkat cells in the first two days of exposure to 56 µg/mL DIO-NPs (by 17% and 13%, respectively), followed by an increase by 25% after 72 h. In the case of lower dose, no significant change was noticed after 24 h, but starting with 48 h exposure, GSH concentration decreased by 18% and increased with 18% after 72 h compared to controls (Figure 9B).
For the first two days of exposure, the variation of MDA level was similar with that of ROS one (Figure 9C). For the lower dose, an increase of 9% compared to control was noticed only after 48 h. However, in the case of 56 µg/mL DIO-NP treatment, MDA level raised by 8% and 21% after 24 h and 48 h, respectively. After 72 h exposure, this biochemical parameter returned to the control level for the both doses.

4. Discussion

Nowadays, a wide range of nanoparticles are tested for their potential in biomedical applications, such as drug and gene delivery, imaging of cell and tissues, sensing of target molecules, etc. Regarding the biocompatibility and efficacy of nanoparticles, there are still several critical issues that must be taken into account when designing nanoparticles. An important parameter required for a successful application is the stability of the nanoparticle dispersion in biological fluids at physiological pH conditions. To fulfill this objective, nanoparticles are covered with different coatings in order to limit their agglomeration and nonspecific adsorption of proteins on the surface. Surface modifications play an important role in the direct interaction with cells and proteins present in the body fluids and culture medium [49,50]. Furthermore, depending on size, dosage, and exposure time, the nanoparticles can penetrate the biological membranes and reach the target site [51,52].
Jurkat is a human CD4 (+) T-cell leukemia cell line and is a suitable model to study the interaction and uptake of different stable agents in culture media because they have no cytotoxic or phagocytic activity and cannot remove infected cells or foreign materials.
As our data proved, despite the lack of phagocytic capacity of Jurkat cells, the DIO-NPs were captured, probably by endocytosis, starting with 24 h of exposure and were significantly accumulated until 72 h as suggested by the lysosome formation. Analyzing by TEM, Yu and his coworkers [53] have shown that dextran-iron oxide nanoparticles with a similar size as ours were up-taken into the endothelial cells and clustered in cytoplasmic vacuoles within 3 h of exposure but no nanoparticles were observed in cell nuclei. Also, compared with other types of nanoparticles analyzed by them, these nanoparticles presented the highest cellular uptake [53]. According to our data, the additional formation of lysosomes and increase in the intracellular iron concentration prove that DIO-NPs were internalized by Jurkat cells.
The study of Thorek and Tsourkas [54] with dextran-iron oxide nanoparticles of different diameters has shown that these were fully soluble at physiological conditions and efficiently internalized up to a size of 100 nm. For all dimensions, the saturating level was reached at a cellular iron concentration below 50 µg/mL.
Our study showed an efficient labeling at both doses, proven by the significant amount of iron internalized into Jurkat cells, permitting high contrast with T2 MRI.
Concentration of nanoparticles in the cell cytoplasm represents an important parameter to improve MRI resolution, which has to be enough to enhance the contrast of cells in the deep tissues. However, the dosage should be maintained within limits of biocompatibility conditions.
According to previous studies, the effect of dextran-coated NPs exposure is cell type-dependent. So, some studies revealed that these NPs (of different sizes) are safe up to a concentration of 100 μg/mL [53,55] whereas others showed that at concentrations of 50 μg/mL they created a decrease by 50% of human fibroblasts proliferation [56], generating membrane damage and cell death. Our data suggest that a concentration of 56 μg/mL DIO-NPs caused membrane damage that reduced the cell viability and increased LDH leakage in the culture media. At the same time, the lower dose was less toxic for Jurkat cells. These effects could be explained by the fact that dextran has no direct cytotoxic effect in cells, but upon internalization, the polysaccharide shell can be degraded, resulting in particles and aggregates that may influence cellular processes [48].
After treatment with DIO-NPs, intracellular ROS production increased over time at both doses, probably due to the fact that once they enter the cells, DIO-NPs mechanically interact with NADPH oxidases localized to the surface of endoplasmic reticulum and produce superoxide anion, but also with mitochondrial membranes, disturbing the electron transporting chain. After the release of maghemite core from the dextran shell, it can be degraded into Fe(III) ions that can react with superoxide generating Fe(II) [57] that catalyzes the production of ROS via Fenton reaction.
ROS can oxidize critical cellular components such as membrane lipids, proteins, and DNA. Oxidative stress was confirmed by the decrease in GSH concentration that was strongly correlated with the high level of lipid peroxidation in the first two days of exposure. After 72 h, GSH level increased and MDA one decreased to control values, suggesting the capacity of Jurkat cells to counteract oxidative stress produced by DIO-NPs.

5. Conclusions

A superparamagnetic maghemite coated with dextran nanocomposite with spherical shape and uniform size distribution was prepared by coprecipitation method. These nanoparticles presented good dispersion and minimal aggregation in culture medium. They were characterized by various techniques including XRD, DLS, TEM, ATR-FTIR spectroscopy, and magnetic hysteresis measurement. The average grain size of the monodisperse DIO-NPs was 7.5 (±0.5) nm, deduced from TEM observations, and was consistent with the average size, deduced from the XRD and DLS data refinement. The superparamagnetic behavior of dextran-coated maghemite nanoparticles at room temperature was shown. From hysteresis measurements, the remnant magnetization (Mr) and coercivity fields (Hc) were equal to 0 Oe at 300 K. DIO-NP labeling of Jurkat cells exhibited an increasing darkening on MRI images due to an intracellular uptake of DIO-NPs in a time dependent manner. These findings were accompanied by toxicological studies that showed the fact that exposure to DIO-NPs may induce cell viability decrease, membrane leakage, ROS production, GSH depletion, and lipid peroxidation events. However, the oxidative stress was counteracted after three days in the viable cells. Thus, our results suggest that these nanoparticles might have potential for biomedical applications by playing an imaging/therapy dual role in cancer theranostics.

Acknowledgments

This publication was possible due to the agreement between WBI (Wallonie-Bruxelles International), F.R.S.-FNRS (Fonds de la Recherche Scientifique-FNRS), and The Romanian Academy.

Author Contributions

C.B., E.B., D.P., and A.D. conceived and designed the experiments; M.B., C.S.C., and M.S.S. performed the experiments; M.B. and C.B. analyzed the data; M.B. wrote the paper.

Conflicts of Interest

The authors declare no conflict of interest.

References

  1. Gupta, A.K.; Gupta, M. Synthesis and surface engineering of iron oxide nanoparticles for biomedical applications. Biomaterials 2005, 26, 3995–4021. [Google Scholar] [CrossRef] [PubMed]
  2. Ciobanu, C.S.; Iconaru, S.L.; Gyorgy, E.; Radu, M.; Costache, M.; Dinischiotu, A.; le Coustumer, P.; Lafdi, K.; Predoi, D. Biomedical properties and preparation of iron oxide-dextran nanostructures by MAPLE technique. Chem. Cent. J. 2012, 6, 17. [Google Scholar] [CrossRef] [PubMed] [Green Version]
  3. Mahdavi, M.; Ahmad, M.B.; Haron, M.J.; Namvar, F.; Nadi, B.; Rahman, M.Z.; Amin, J. Synthesis, surface modification and characterisation of biocompatible magnetic iron oxide nanoparticles for biomedical applications. Molecules 2013, 18, 7533–7548. [Google Scholar] [CrossRef] [PubMed] [Green Version]
  4. Oh, J.K.; Park, J.M. Iron oxide-based superparamagnetic polymeric nanomaterials: Design, preparation, and biomedical application. Prog. Polym. Sci. 2011, 36, 168–189. [Google Scholar] [CrossRef] [Green Version]
  5. Salgueiriño-Maceira, V.; Correa-Duarte, M.A. Increasing the complexity of magnetic core/shell structured nanocomposites for biological applications. Adv. Mater. 2007, 19, 4131–4144. [Google Scholar] [CrossRef]
  6. Easo, S.L.; Mohanan, P.V. Dextran stabilized iron oxide nanoparticles: Synthesis, characterization and in vitro studies. Carbohydr. Polym. 2013, 92, 726–732. [Google Scholar] [CrossRef] [PubMed]
  7. Arbab, A.S.; Bashaw, L.A.; Miller, B.R.; Jordan, E.K.; Lewis, B.K.; Kalish, H.; Frank, J.A. Characterization of biophysical and metabolic properties of cells labeled with superparamagnetic iron oxide nanoparticles and transfection agent for cellular MR imaging. Radiology 2003, 229, 838–846. [Google Scholar] [CrossRef] [PubMed]
  8. Reimer, P.; Weissleder, R. Development and experimental application of receptor-specific MR contrast media. Radiology 1996, 36, 153–163. [Google Scholar] [CrossRef]
  9. Kilcoyne, S.H.; Gorisek, A. Magnetic properties of iron dextran. J. Magn. Magn. Mater. 1998, 177–181, 1457–1458. [Google Scholar] [CrossRef]
  10. Somsook, E.; Hinsin, D.; Buakhrong, P.; Teanchai, R.; Mophan, N.; Pohmakotr, M.; Shiowatana, J. Interactions between iron(III) and sucrose, dextran, or starch in complexes. J. Carbohydr. Polym. 2005, 61, 281–286. [Google Scholar] [CrossRef]
  11. Scrimshaw, N.S. Iron deficiency. Sci. Am. 1991, 265, 46–52. [Google Scholar] [CrossRef] [PubMed]
  12. Gyurcsik, B.; Nagy, L. Carbohydrates as ligands: Coordination equilibria and structure of the metal complexes. Coord. Chem. Rev. 2000, 203, 81–149. [Google Scholar] [CrossRef]
  13. Hudson, J.Q.; Comstock, T.J. Considerations for optimal ironuse for anemia due to chronic kidney disease. Clin. Ther. 2001, 23, 1637–1671. [Google Scholar] [CrossRef]
  14. Kane, R.C. Intravenous iron replacement with sodium ferric gluconate complex in sucrose for iron deficiency anemia in adults. Curr. Ther. Res. Clin. Exp. 2003, 64, 263–268. [Google Scholar] [CrossRef]
  15. León-Félix, L.; Chaker, J.; Parise, M.; Coaquira, J.A.H.; de Los Santos Valladares, L.; Bustamante, A.; Garg, V.K.; Oliveira, A.C.; Morais, P.C. Synthesis and characterization of uncoated and gold-coated magnetite nanoparticles. Hyperfine Interact. 2014, 224, 179–188. [Google Scholar] [CrossRef]
  16. Ramos Guivar, J.A.; Bustamante, A.; Flores, J.; Mejía Santillan, M.; Osorio, A.M.; Martínez, A.I.; de Los Santos Valladares, L.; Barnes, C.H.W. Mössbauer study of intermediate superparamagnetic relaxation of maghemite (γ-Fe2O3) nanoparticles. Hyperfine Interact. 2014, 224, 89–97. [Google Scholar] [CrossRef]
  17. De Los Santos Valladares, L.; León Félix, L.; Espinoza Suarez, S.M.; Bustamante Dominguez, A.G.; Mitrelias, T.; Holmes, S.; Moreno, N.O.; Albino Aguiar, J.; Barnes, C.H.W. Preparation and crystallization of hollow α-Fe2O3 microspheres following the gas-bubble template method. Mater. Chem. Phys. 2016, 169, 21–27. [Google Scholar] [CrossRef]
  18. Zhang, Y.; Kohler, N.; Zhang, M. Surface modification of superparamagnetic magnetite nanoparticles and their intracellular uptake. Biomaterials 2002, 23, 1553–1561. [Google Scholar] [CrossRef]
  19. Lacava, L.M.; Lacava, Z.G.; da Silva, M.F.; Silva, O.; Chaves, S.B.; Azevedo, R.B.; Pelegrini, F.; Gansau, C.; Buske, N.; Sabolovic, D.; et al. Magnetic resonance of a dextran-coated magnetic fluid intravenously administered in mice. Biophys. J. 2001, 80, 2483–2486. [Google Scholar] [CrossRef]
  20. Silva, V.A.J.; Andrade, P.L.; Bustamante, A.; de Los Santos Valladares, L.; Mejía, M.; Souza, I.A.; Cavalcanti, K.P.S.; Silva, M.P.C.; Albino Aguiar, J. Magnetic and Mössbauer studies of fucan-coated magnetite nanoparticles for application on antitumoral activity. Hyperfine Interact. 2014, 224, 227–238. [Google Scholar] [CrossRef]
  21. Silva, V.A.J.; Andrade, P.L.; Silva, M.P.C.; Bustamante, A.; de Los Santos Valladares, L.; Albino Aguiar, J. Synthesis and characterization of Fe3O4 nanoparticles coated with fucan polysaccharides. J. Magn. Magn. Mater. 2013, 343, 138–143. [Google Scholar] [CrossRef]
  22. Andrade, P.L.; Silva, V.A.J.; Maciel, J.C.; Santillan, M.M.; Moreno, N.O.; de Los Santos Valladares, L.; Bustamante, A.; Pereira, S.M.B.; Silva, M.P.C.; Albino Aguiar, J. Preparation and characterization of cobalt ferrite nanoparticles coated with fucan and oleic acid. Hyperfine Interact. 2014, 224, 217–225. [Google Scholar] [CrossRef]
  23. Bautista, M.; Bomati-Miguel, O.; del Puerto Morales, M.; Serna, C.J.; Veintemillas-Verdaguer, S. Surface characterisation of dextran coated iron oxide nanoparticles prepared by laser pyrolysis and coprecipitation. J. Magn. Magn. Mater. 2005, 293, 20–27. [Google Scholar] [CrossRef]
  24. Iconaru, S.L.; Prodan, A.M.; Motelica-Heino, M.; Sizaret, S.; Predoi, D. Synthesis and characterization of polysaccharide-maghemite composite nanoparticles and their antibacterial properties. Nanoscale Res. Lett. 2012, 7, 576–584. [Google Scholar] [CrossRef] [PubMed] [Green Version]
  25. Boutry, S.; Burtea, C.; Mahieu, I.; Murariu, O.; Laurent, S.; Vander Elst, L.; Muller, R.N. How to quantify iron in an aqueous or biological matrix: A technical note. Contrast Media Mol. Imaging 2009, 4, 299–304. [Google Scholar] [CrossRef] [PubMed]
  26. Wan, C.P.; Myung, E.; Lau, B.H.S. An automated microfluorometric assay for monitoring oxidative burst activity of phagocytes. J. Immunol. Methods 1993, 159, 131–138. [Google Scholar] [CrossRef]
  27. Dinischiotu, A.; Stanca, L.; Gradinaru, D.; Petrache, S.N.; Radu, M.; Serban, A.I. Lipid peroxidation due to in vitro and in vivo exposure of biological samples to nanoparticles. In Oxidative Stress and Nanotechnology; Armstrong, D., Bharali, D.J., Eds.; Springer: New York, NY, USA, 2013; Volume 1028, pp. 155–164. [Google Scholar]
  28. Lutterotti, L. Total pattern fitting for the combined size-strainstress-texture determination in thin film diffraction. Nucl. Instrum. Meth. B 2010, 268, 334–340. [Google Scholar] [CrossRef]
  29. Kim, W.; Suh, C.-Y.; Cho, S.-W.; Roh, K.-M.; Kwon, H.; Song, K.; Shon, I.-J. A new method for the identification and quantification of magnetite-maghemite mixture using conventional X-ray diffraction technique. Talanta 2012, 94, 348–352. [Google Scholar] [CrossRef] [PubMed]
  30. Dutta, P.; Manivannan, A.; Seehra, M.S. Magnetic properties of nearly defect-free maghemite nanocrystals. Phys. Rev. B 2004, 70, 174428. [Google Scholar] [CrossRef]
  31. Ramos Guivar, J.A.; Sanches, E.A.; Bruns, F.; Sadrollahi, E.; Morales, M.A.; López, E.O.; Litterst, F.J. Vacancy ordered γ-Fe2O3 nanoparticles functionalized with nanohydroxyapatite: XRD, FTIR, TEM, XPS and Mössbauer studies. Appl. Surf. Sci. 2016, 389, 721–734. [Google Scholar] [CrossRef]
  32. Jorgensen, J.E.; Mosegaard, L.; Thomsen, L.E.; Jensen, T.R.; Hanson, J.C. Formation of γ-Fe2O3 nanoparticles and vacancy ordering: An in situ X-ray powder diffraction study. J. Solid State Chem. 2007, 180, 180–185. [Google Scholar] [CrossRef]
  33. Musić, S.; Orehovec, Z.; Popović, S.; Czakó-Nagy, I. Structural properties of precipitates formed by hydrolisis of Fe3+ ions in Fe2(SO4)3 solutions. J. Mater. Sci. 1994, 29, 1991–1998. [Google Scholar] [CrossRef]
  34. Izumi, F.; Yamamoto, A.; Khasanova, N.R.; Kumazawa, S.; Hu, W.Z.; Kamiyama, T. Novel techniques of neutron powder diffraction and their applications to superconducting oxides. Physica C 2000, 335, 239–244. [Google Scholar] [CrossRef]
  35. David, W.I.F. Powder Diffraction: Least-Squares and Beyond. J. Res. Natl. Inst. Stand. Technol. 2004, 109, 107–123. [Google Scholar] [CrossRef] [PubMed]
  36. Toby, B.H. R factors in Rietveld analysis: How good is good enough? Powder Diffr. 2006, 21, 67–70. [Google Scholar] [CrossRef]
  37. Barrado, E.; Prieto, F.; Medina, J.; López, F.A. Characterisation of solid residues obtained on removal of Cr from waste water. J. Alloys Compd. 2002, 335, 203–209. [Google Scholar] [CrossRef]
  38. De Vidales, J.L.M.; López-Delgado, A.; Vila, E.; López, F.A. The effect of the starting solution on the physico-chemical properties of zinc ferrite synthesized at low temperature. J. Alloys Compd. 1999, 287, 276–283. [Google Scholar] [CrossRef]
  39. Predoi, D. A study on iron oxide nanoparticles coated with dextrin obtained by coprecipitation. Dig. J. Nanomater. Biostruct. 2007, 2, 169–173. [Google Scholar]
  40. Karnchanatat, A.; Puthong, S.; Sihanonth, P.; Piapukiew, J.; Sangvanich, P. Antioxidation and antiproliferation properties of polysaccharide-protein complex extracted from Phaeogyroporusportentosus (Berk. & Broome) McNabb. Afr. J. Microbiol. Res. 2013, 7, 1668–1680. [Google Scholar]
  41. Hradil, J.; Pisarev, A.; Babič, M.; Horák, D. Dextran-modified iron oxide nanoparticles. China Part. 2007, 5, 162–168. [Google Scholar] [CrossRef]
  42. Hair, M.L. Hydroxyl groups on silica surface. J. Non-Cryst. Solids 1975, 19, 299–309. [Google Scholar] [CrossRef]
  43. Farmer, V.C. The Infrared Spectra of Minerals; Mineralogical Society of Great Britain and Ireland: Twickenham, UK, 1974; pp. 305–330. [Google Scholar]
  44. Shafi, K.V.P.M.; Gedanken, A.; Prozorov, R.; Balogh, J. Sonochemical preparation and size-dependent properties of nanostructured CoFe2O4 particles. Chem. Mater. 1998, 10, 3445–3450. [Google Scholar] [CrossRef]
  45. Vijayakumar, R.; Koltypin, Y.; Felner, I.; Gedanken, A. Sonochemical synthesis and characterization of pure nanometersized Fe3O4 particles. Mater. Sci. Eng. A 2000, 286, 101–105. [Google Scholar] [CrossRef]
  46. Jiang, L.; Zhou, X.; Wei, G.; Lu, X.; Wei, W.; Qiu, J. Preparation and characterization of poly(glycidylmethacrylate)-grafted magnetic nanoparticles: Effects of the precursor concentration on polyol synthesis of Fe3O4 and [PMDETA]0/[CuBr2]0 ratios on SI-AGET ATRP. Appl. Surf. Sci. 2015, 357, 1619–1624. [Google Scholar] [CrossRef]
  47. Si, S.; Li, C.; Wang, X.; Yu, D.; Peng, Q.; Li, Y. Magnetic monodisperse Fe3O4 nanoparticles. Cryst. Growth Des. 2005, 5, 391–393. [Google Scholar] [CrossRef]
  48. Laurent, S.; Forge, D.; Port, M.; Roch, A.; Robic, C.; Vander Elst, L.; Muller, R.N. Magnetic iron oxide nanoparticles: Synthesis, stabilization, vectorization, physico-chemical characterizations and biological applications. Chem. Rev. 2008, 108, 2064–2110. [Google Scholar] [CrossRef] [PubMed]
  49. Verma, A.; Stellacci, F. Effect of surface properties on nanoparticle–cell interactions. Small 2010, 6, 12–21. [Google Scholar] [CrossRef] [PubMed]
  50. Rahman, M.; Laurent, S.; Tawil, N.; Yahia, L.; Mahmoudi, L. Protein-Nanoparticles Interactions. The Bio-Nano Interface; Springer: Berlin/Heidelberg, Germany, 2013; p. 15. [Google Scholar]
  51. Chen, C.-C.V.; Ku, M.-C.; Jayaseema, D.M.; Lai, J.-S.; Hueng, D.-Y.; Chang, C. Simple SPION incubation as an efficient intracellular labeling method for tracking neural progenitor cells using MRI. PLoS ONE 2013, 8, e56125. [Google Scholar] [CrossRef] [PubMed]
  52. Shang, L.; Nienhaus, K.; Nienhaus, G.U. Engineered nanoparticles interacting with cells: Size matters. J. Nanobiotechnol. 2014, 12, 1477–3155. [Google Scholar] [CrossRef] [PubMed]
  53. Yu, M.; Huang, S.; Yu, K.J.; Clyne, A.M. Dextran and polymer polyethylene glycol (PEG) coating reduce both 5 and 30 nm iron oxide nanoparticle cytotoxicity in 2D and 3D cell culture. Int. J. Mol. Sci. 2012, 13, 5554–5570. [Google Scholar] [CrossRef] [PubMed]
  54. Thorek, D.L.; Tsourkas, A. Size, charge and concentration dependent uptake of iron oxide particles by non-phagocytic cells. Biomaterials 2008, 29, 3583–3590. [Google Scholar] [CrossRef] [PubMed]
  55. Griffiths, S.M.; Singh, N.; Jenkins, G.; Williams, A.; Orbaek, A.; Barron, C. Dextran coated ultrafine superparamagnetic iron oxide nanoparticles: Compatibility with common fluorometric and colorimetric dyes. Anal. Chem. 2011, 83, 3778–3785. [Google Scholar] [CrossRef] [PubMed]
  56. Berry, C.C.; Wells, S.; Charles, S.; Curtis, A.S. Dextran and albumin derivatised iron oxide nanoparticles: Influence on fibroblasts in vitro. Biomaterials 2003, 24, 4551–4557. [Google Scholar] [CrossRef]
  57. Dixon, S.J.; Stockwell, B.R. The role of iron and reactive oxygen species in cell death. Nat. Chem. Biol. 2014, 10, 9–17. [Google Scholar] [CrossRef] [PubMed]
Figure 1. Observed and calculated diffraction pattern of γ-Fe2O3 coated with dextran. Experimental (blue), calculated (solid line gray), and difference plot (lower line).
Metals 07 00063 g001
Figure 2. Large-area TEM (top left), size distributions (top right), HR-TEM images (bottom left) and selected area electron diffraction (SAED) (bottom right) of γ-Fe2O3 coated with dextran.
Metals 07 00063 g002
Figure 3. ATR-FTIR spectra of (A) dextran (B) maghemite and (C) maghemite coated with dextran.
Metals 07 00063 g003
Figure 4. M-H curves of DIO-NPs at room temperature in full scale (A) and in extended scale (B).
Metals 07 00063 g004
Figure 5. Effects of different concentrations of DIO-NPs on Jurkat cell viability (A) and membrane integrity (B) after 24 h, 48 h, and 72 h. Values were calculated as percentage of treated cells compared to the control and expressed as means ± SD (n = 3/experimental group). * p < 0.05 vs. control; ** p < 0.01 vs. control.
Metals 07 00063 g005
Figure 6. Quantification of intracellular iron content. (A) DAB-enhanced Prussian blue staining of Jurkat cells after 24 h, 48 h, and 72 h of exposure to 28 and 56 µg/mLDIO-NPs. Intracellular iron is highlighted by a brown color (black arrows), and cytoplasmin a blue color (LuxolFast Blue staining). Scale bar = 50 µm. (B) Iron content quantified by relaxometry. The values are expressed as means ± SD (n = 3/experimental group). * p < 0.05 vs. control; ** p < 0.01 vs. control.
Metals 07 00063 g006
Figure 7. Localization and quantification of lysosomes in Jurkat cells treated with 28 and 56 µg/mL DIO-NPs after 24 h, 48 h, and 72 h. (A) Lysosomes (green color) were labeled with Lysotracker green DND-26 and nuclear DNA content with DAPI (blue color). Scale bar = 40 µm. (B) Quantification of lysosomal fluorescence intensity using ImageJ software. Lysosomal area over total number of cells from the selected field of view was calculated as the percentage of treated cells compared to the control and expressed as means ± SD (n = 3/experimental group). * p < 0.05 vs. control; ** p < 0.01 vs. control.
Metals 07 00063 g007
Figure 8. In vitro MRI of Jurkat cells treated with 28 and 56 µg/mL DIO-NPs after 24 h, 48 h, and 72 h. (A) Images acquired at 7 Tesla using a Bruker PharmaScan MRI instrument of gelatin phantoms containing human lymphoblasts labeled with DIO-NPs. (B) Graphic representation of T2 values (ms).
Metals 07 00063 g008
Figure 9. Effects of 28 and 56 µg/mL DIO-NPs exposure on ROS production (A), GSH content (B) and MDA level (C) in Jurkat cells. Values were calculated as percentage of treated cells compared to the control and expressed as means ± SD (n = 3/experimental group). * p < 0.05 vs. control; ** p < 0.01 vs. control; *** p < 0.001 vs. control.
Metals 07 00063 g009
Table 1. The hydrodynamic size and zeta potential of dextran-coated Fe2O3 nanoparticles measured at various time points. The results were expressed as mean values ± SD (n = 4).
TimeHydrodynamic Diameter (nm)Zeta Potential (mV)
0 h7.50 ± 0.50−30.37 ± 1.52
24 h8.18 ± 0.38−11.47 ± 1.24
48 h8.52 ± 1.10−9.92 ± 0.59
72 h7.73 ± 0.47−7.51 ± 1.01

