Article

In Situ Observations of Blistering of a Metal Irradiated with 2-MeV Protons

1
Advanced Medical Instrumentation Unit, Okinawa Institute of Science and Technology Graduate University, 1919-1 Tancha, Onna-son, Okinawa 904-0495, Japan
2
Budker Institute of Nuclear Physics, 11 Lavrentiev ave., 630090 Novosibirsk, Russia
3
Faculty of Physics, Novosibirsk State University, 2 Pirogov str., 630090 Novosibirsk, Russia
4
Nikolaev Institute of Inorganic Chemistry, 3 Lavrentiev ave., 630090 Novosibirsk, Russia
*
Author to whom correspondence should be addressed.
Metals 2017, 7(12), 558; https://doi.org/10.3390/met7120558
Submission received: 24 October 2017 / Revised: 30 November 2017 / Accepted: 1 December 2017 / Published: 12 December 2017
(This article belongs to the Special Issue Radiation Effects in Metals)

Abstract

:
A vacuum-insulated tandem accelerator was used to observe in situ blistering during 2-MeV proton irradiation of metallic samples to a fluence of up to 6.7 × 1020 cm−2. Samples consisting of copper of different purity, tantalum and tantalum-copper compounds were placed on the proton beam path and forced to cool. The surface state of the samples was observed using a charge-coupled device camera with a remote microscope. Thermistors, a pyrometer and an infrared camera were applied to measure the temperature of the samples during irradiation. After irradiation, the samples were analyzed on an X-ray diffractometer, laser and electron microscopes. The present study describes the experiment, presents the results obtained and notes their relevance and significance in the development of a lithium target for an accelerator-based neutron source, for use in boron neutron capture therapy of cancer.

1. Introduction

To enable the development of a promising cancer therapy, boron neutron capture therapy [1,2], an accelerator-based epithermal neutron source was designed and made at the Budker Institute of Nuclear Physics [3,4]. Neutrons are generated as a result of a 7Li(p,n)7Be threshold reaction by directing a proton beam, with an energy of 2 MeV and a current of up to 5 mA obtained in a tandem accelerator with vacuum insulation, to a lithium target with a diameter of 10 cm. The target is made of a thin lithium layer deposited on an efficiently-cooled substrate (in this study, copper) [5,6]. The thickness of the neutron-generating lithium layer is chosen so that the proton energy coming out from the layer is slightly below 1.882 MeV (the 7Li(p,n)7Be reaction threshold). Then, protons are decelerated and absorbed into a construction material that must satisfy the following requirements: firstly, this material must either have a high thermal conductivity, or be thin enough for the lithium temperature to not exceed the melting point of 182 °C, to prevent the propagation of radioactive beryllium-7 nuclei that are formed and lithium vapor. From this standpoint, copper is the best material. Secondly, the proton deceleration in this material should not cause a noticeable increase in undesired X-ray and gamma-radiation. As a result of the studies performed [7], the best materials are found to be molybdenum and tantalum. Thirdly, this material must be sufficiently resistant to radiation blistering [8,9]; defined as the deformation of the surface layer in the form of numerous blisters (uplifting and peeling off of a thin layer of the material), which leads to a decrease in thermal conductivity.
Experimental data on the critical dose of blistering have been extremely scarce and are absent for a proton energy of about 2 MeV. The blistering phenomenon is considered [8,9] to be characteristic of metals that poorly dissolve hydrogen (Al, Mo, Fe, Cu, Ag, W, Pt and Au). For metals that dissolve hydrogen well (alkali, alkaline-earth, Ti, Ta, Nb, V, Ni and Pd), blistering is not observed. The value of the critical dose of hydrogen blistering of 1018 cm−2 (reported in [8,9]) limits the application of copper as a substrate for the target. This is because, at a proton current of 10 mA and a target diameter of 10 cm, the critical dose is accumulated in 20 min, which is less than the planned therapy time (1 h). The value of the dose of hydrogen blistering is 10 times larger—1019 cm−2 measured at the lower proton energy—180 keV (the copper temperature was 87 °C) [10]. The authors calculated the value of fluence at which blisters appeared in Cu under 2 MeV proton irradiation based on the value at 180 keV and the fluence dependence on the energy as E0.4 given in [9] to be 2 × 1019 cm−2 ([2], p. 81). We experimentally obtained a similar value of 1.7 × 1019 cm−2 ([2], p. 82) after neutron generation for the purpose of biological studies [11]. In conclusion, we say that there is no proper agreement of the threshold fluence for blistering in the literature.
The aim of this study was to investigate the blistering, under 2-MeV proton irradiation, of samples made of copper, tantalum and copper-tantalum alloys.

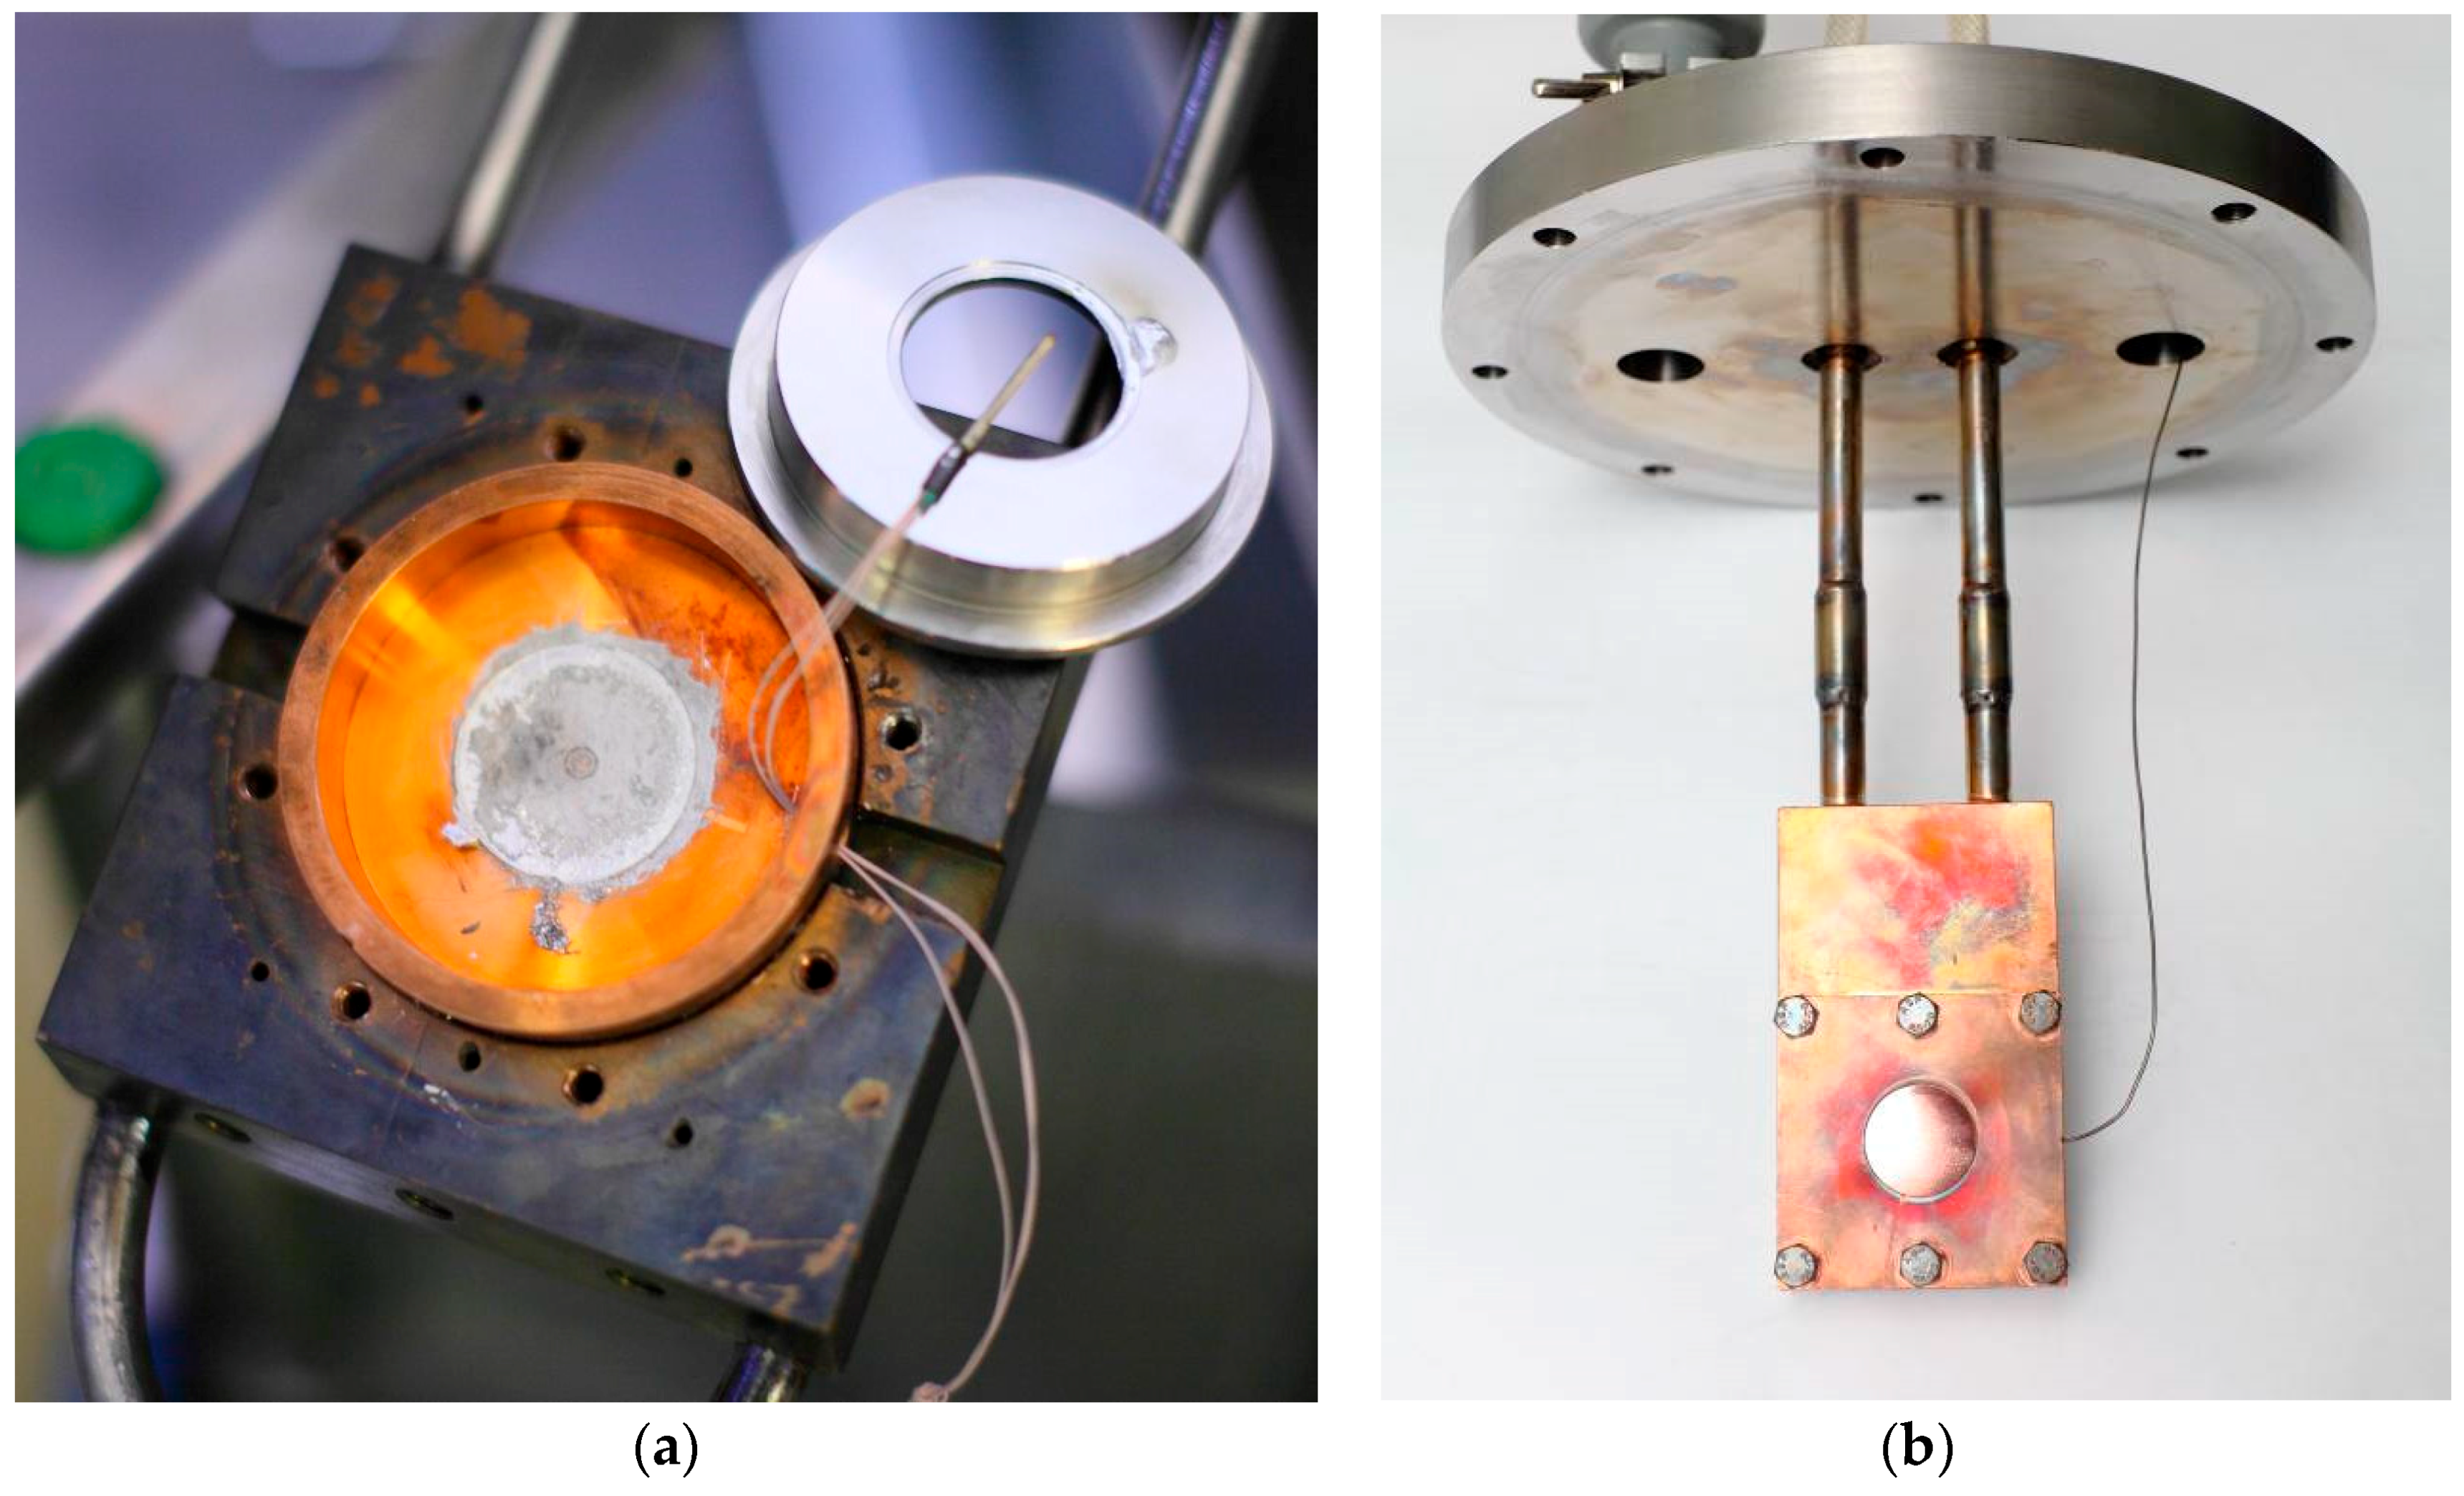
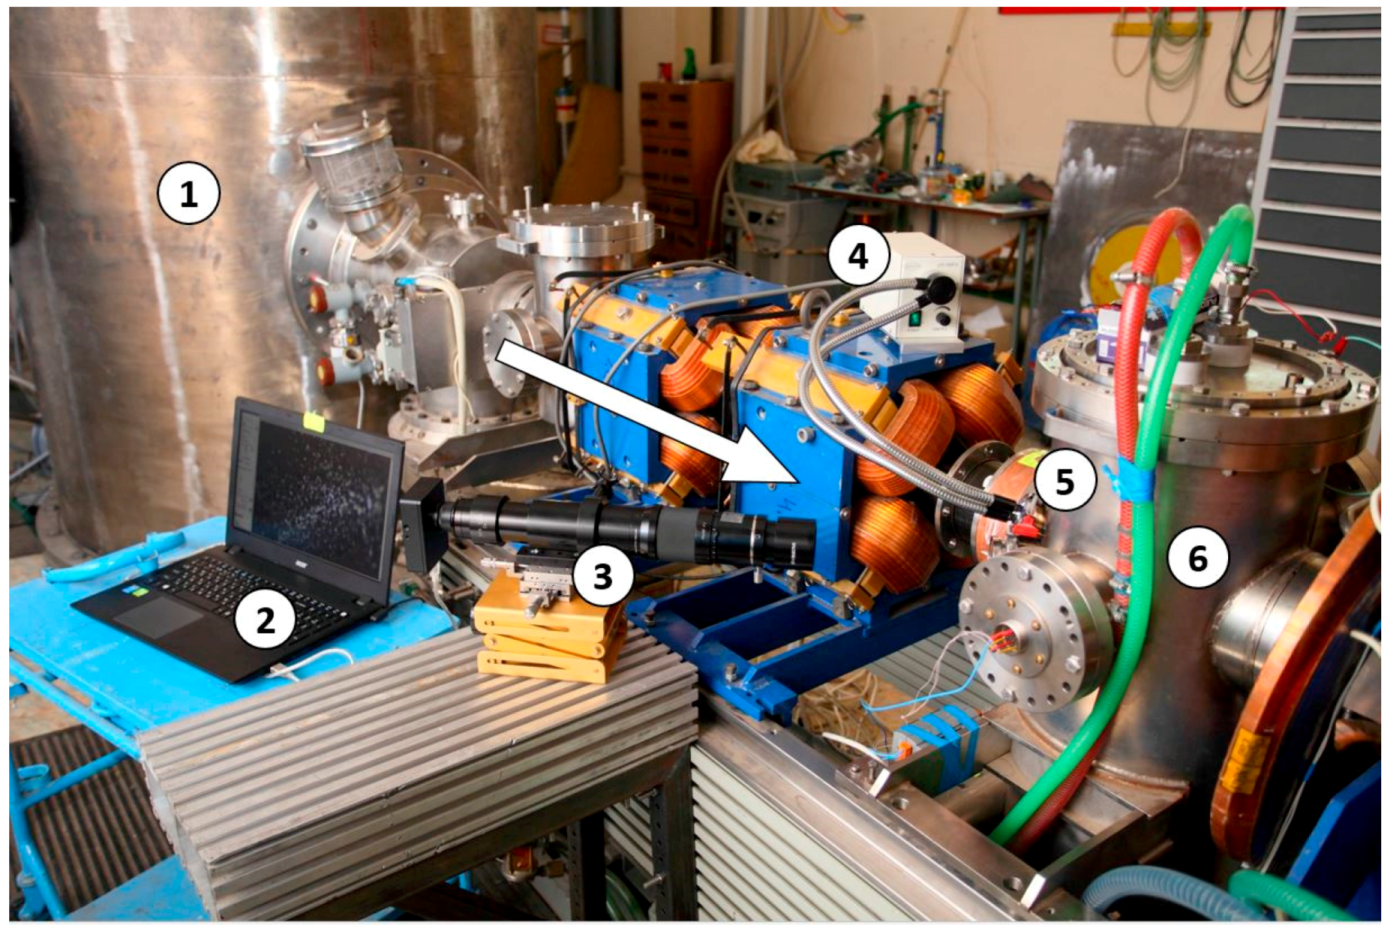
2. Experimental Apparatus

The studies were carried out on a tandem accelerator with vacuum insulation [3] that generates a proton beam with an energy of 2 MeV, a current up to 5 mA, and a transverse dimension of about 1 cm [12]. Figure 1 shows an image of the experimental apparatus. A disc-shaped sample with a diameter of 30 mm and a thickness of 3 mm was placed on the axis in the diagnostic vacuum chamber of the proton beam path (⑥ in Figure 1). Via a gallium-indium alloy, the sample was tightly pressed to the heat-removing surface. In the first series of experiments, a graphite target cooling unit was used as the heat-removing surface (Figure 2a). This unit was designed and applied in experiments on detecting nitrogen-containing compounds by gamma-resonance absorption [13]. In the second series of experiments, we used a new heat-removing surface in the form of a copper plate with closely spaced holes to allow coolant flow, inside which threaded rods were inserted to swirl the water flow (Figure 2b). This construction substantially improved the cooling at a proton current of about 0.5 mA and helped maintain the surface temperature of metallic samples within the operating conditions of the target during neutron generation: below the lithium melting point of 182 °C.
The sample temperature was measured to an accuracy of 1 °C with a Pt100 (ChEPT-1) thermistor (Termiko Co., Zelenograd, Russia) inserted inside a hole (diameter of 1.5 mm) drilled in to the center of the disc-shaped sample at a depth of 1.5 mm from the surface. Thermistors were preliminarily calibrated and 3-wire connected, taking into account the error caused by wire resistance. The sample surface temperature was measured with an Optris CT Laser 3ML SF (Optris GmbH, Berlin, Germany) pyrometer through a fused quartz window. In the second series of experiments, the sample surface temperature was additionally measured with a FLIR T650SC infrared camera (FLIR Systems Inc., Wilsonville, OR, USA) (thermal imager) through a barium fluoride window. The pyrometer and the infrared camera were calibrated in the range of 100 to 250 °C by heating the samples with hot air fed into the cooling channels instead of water, and by measuring the temperature with a thermistor inserted into the sample. Note that the pyrometer measured the temperature at a spot with a diameter of 19 mm (contrast ratio 60:1, 90% energy, ranging from 50 to 400 °C). Since the spot size exceeded the proton beam size, the temperature measured by pyrometer was below the maximal one. Measured values from the pyrometer on copper samples are further underestimated by ~40 °C due to the fact that the polished copper emission coefficient, ε, is lower than 0.1 and calibrating the pyrometer at the required value of the coefficient is technically impossible (due to the construction of the pyrometer).
The current of the proton beam incident on the sample was measured with an ohmic divider when 100 V positive voltage was applied to the sample and 300 V negative voltage was applied to a suppressor ring at a distance of 50 mm in front of the sample. A cooled copper diaphragm with a hole diameter of 26 mm was placed in front of the diagnostic chamber. Temperature measurements taken from four Pt100 (ChEPT-1) thermistors, inserted into the diaphragm and uniformly spaced in azimuth, enabled the control of proton beam propagation along the apparatus axis.
Continuous real-time monitoring of the sample surface was performed through a fused quartz window (⑤ in Figure 1) by means of a Charge-Coupled Device camera (CCD camera, Mightex CCD CXE-C013-U; Mightex Systems, Toronto, ON, Canada) with a remote Infinity K2 microscope (DistaMaxTM, Infinity Photo-optical Co., Boulder, CO, USA) (③ in Figure 1) installed at an angle of 42° to the normal to the sample surface. The distance between the surface of the microscope front lens and the sample was 330 mm. The microscope was calibrated with a 100 μm thick crosshair; the resolution was 260 lines/mm. Through an additional fused quartz window, the samples were enlightened by a LFP-10WP-R halogen lamp (Shibuya Optical Co., Ltd., Shibuya, Japan) with a power of 10 W (④ in Figure 1). A computer (② in Figure 1) was installed near the CCD camera to collect data from the camera, save images in the local base, and display the real-time state of the target.
After irradiation, the samples were analyzed on a SHIMADZU XRD-7000 diffractometer (Shimadzu Co., Kyoto, Japan), a KEYENCE VK-X200 laser scanning 3D microscope (Keyence Co., Pasadena, CA, USA), a Jeol JCM-5700 electron microscope (Jeol, Tokyo, Japan), and a FIB-SEM Helios G3 UC focused ion beam electron microscope (FEI, Hillsboro, OR, USA).

3. Experimental Results

3.1. Series I

Four samples were studied. Three of them were prepared from copper of different purity: M0 copper (State Standard GOST 859-2014, Russia), 99.996% fine-grained copper (OFC-1 JIS H3150 C1011, SH Copper Products Co., Ltd., Tsuchiura-shi, Japan), and 99.99996% coarse-grained copper (High Purity Copper, Mitsubishi Materials Co., Tokyo, Japan). The grain size is 0.2 mm for the fine-grained copper, and 30 mm for the coarse-grained copper. The fourth sample was prepared of tantalum. The samples were polished to a mirrored, optical quality surface by diamond polishing. The copper samples were irradiated by a proton beam with an energy of 2 MeV and a current of 0.6 mA for 3 h; their temperature was 263 ± 15 °C. The tantalum sample was irradiated by a proton beam with a current of 0.45 mA for 4 h; its temperature was 600 °C. In all cases, we aimed to obtain the same integral of the current; it was 1.81 ± 0.03 mA·h.
The beam cross-section was determined by three procedures. First, a titanium sample was irradiated by a proton beam without thermal contact between the sample and the heat-removing surface. After some time, a hole with a diameter of 11 mm appeared in the sample. In the second procedure, the process was repeated, but with good thermal contact between the titanium sample and the heat-removing surface. Neither a hole nor titanium sputtering was observed. Since the proton interaction with titanium results in the formation of radioactive vanadium isotopes with a half-life of 33 min, 16 h and 330 days, the region under the beam became radioactive. The size of the radioactive region was determined by measuring the activity of the sample with a NaI gamma-spectrometer 4KSAA with detector BDEG4-43-04A (Parsek Co., Dubna, Russia) through successively increasing the collimating hole from 8 to 20 mm, with a step of 2 mm. In this procedure, the beam cross-section was 12 mm. The third procedure was implemented in the second series of experiments and is described in detail below: the beam profile was determined from the spread of the blistering region boundary with irradiation time. The proton beam size at the half-height was 8.9 mm horizontally and 12.4 mm vertically with an accuracy of 5%. The beam effective area, defined as a ratio between the current and the maximum current density, amounted to 75 ± 7 mm2. Taking the beam area to be 75 mm2, we determined that a 1 mA·h integral of the current corresponds to a particle fluence of (3 ± 0.3) × 1019 cm−2. Thus, we estimate that in the first series of experiments the samples were irradiated to a fluence of 5.4 × 1019 cm−2.
Under the proton beam the M0 GOST 859-2014 copper and 99.996% fine-grained copper samples behaved similarly: the first blisters appeared at a fluence of about 1.5 × 1019 cm−2 and at a fluence of 5.4 × 1019 cm−2 the entire surface of the sample was densely covered with blisters. Figure 3 presents the images demonstrating the blistering dynamics. Figure 4 presents the images of the irradiated surface taken using a laser microscope. The blisters have sizes ranging from 50 to 150 μm and are lifted by about 10 μm. For some blisters the largest elevation is observed at the periphery (Figure 4d) whereas for others it is in the center (Figure 4f).
The 99.99996% coarse-grained copper sample behaved quite differently: Figure 5 presents the images of the sample surface at different irradiation fluences. It is evident that bubble-shaped blisters do not form on the surface; the surface cracks under irradiation. The cracks arise at a fluence of 3 × 1019 cm−2. The cracks are distinctly seen in the laser microscope images (Figure 6).
No evidence of blistering was observed on the tantalum sample up to the accumulated fluence of 5.4 × 1019 cm−2 (Figure 7).
We also irradiated a sample in which 100 μm thick tantalum foil was diffusionally attached to a copper disc. However, the foil peeled off the copper disc almost immediately after the onset of a 150 μA proton beam irradiation of the sample. The irradiation caused the foil to heat above 2000 °C, and crack (irradiation was continued for 6 min). Figure 8 shows images of the sample after irradiation.

3.2. Series II

Nine samples were studied in the Series II experiments. Four copper samples were studied (Samples 1 to 4). In the next four samples (Samples 5 to 8), ~100 μm thick tantalum foil was welded to copper using different techniques (explosion, diffusion and soldering). Sample 9 contained a ~100 μm thick upper layer made of tantalum and copper powders in a 1:1 volume ratio. To cool the samples a new cooling surface was used (Figure 2b) which provided better heat removal as compared to the surface used in the first series of experiments. In the second series of experiments, the quality of the images taken by the CCD camera with a remote microscope was improved in several ways: firstly, by tuning the camera (decreasing the diaphragm hole, increasing the exposure to 7 s, and decreasing the light sensitivity of the matrix); secondly, by moving the halogen lamp enlightening the samples from the additional window to the observation window; and thirdly, by suppressing vibrations of the table on which the camera was fixed. Furthermore, in the second series of experiments, the temperature field of the sample surface was measured with a FLIR T650SC infrared camera.

3.2.1. Sample 1

The sample of 99.996% fine-grained copper (OFC-1 JIS H3150 C1011, SH Copper Products Co., Ltd., Tsuchiura-shi, Japan) was proton irradiated to a fluence of 5.6 × 1019 cm−2. The proton beam current was 524 ± 28 μA; the sample surface temperature measured by the pyrometer was 82 ± 16 °C; the maximum temperature measured by the infrared camera was 152 °C. Blistering dynamics are illustrated in Figure 9. Immediately after the onset of irradiation a surface relief formed due to metal heating in the vacuum (see Figure 9b). Blisters started to arise on the sample surface at a fluence of 0.45 × 1019 cm−2 (Figure 9c) and as the fluence increased their number increased (Figure 9d–f).
To determine the characteristic size of blisters the darkening areas of the image (Figure 9f) were enclosed in rectangles. The result is shown in Figure 10a. Figure 10b presents a size distribution histogram of the side of the rectangle: the blister size corresponds to the length of the side of the rectangle. The blister size was 40 ± 20 μm.

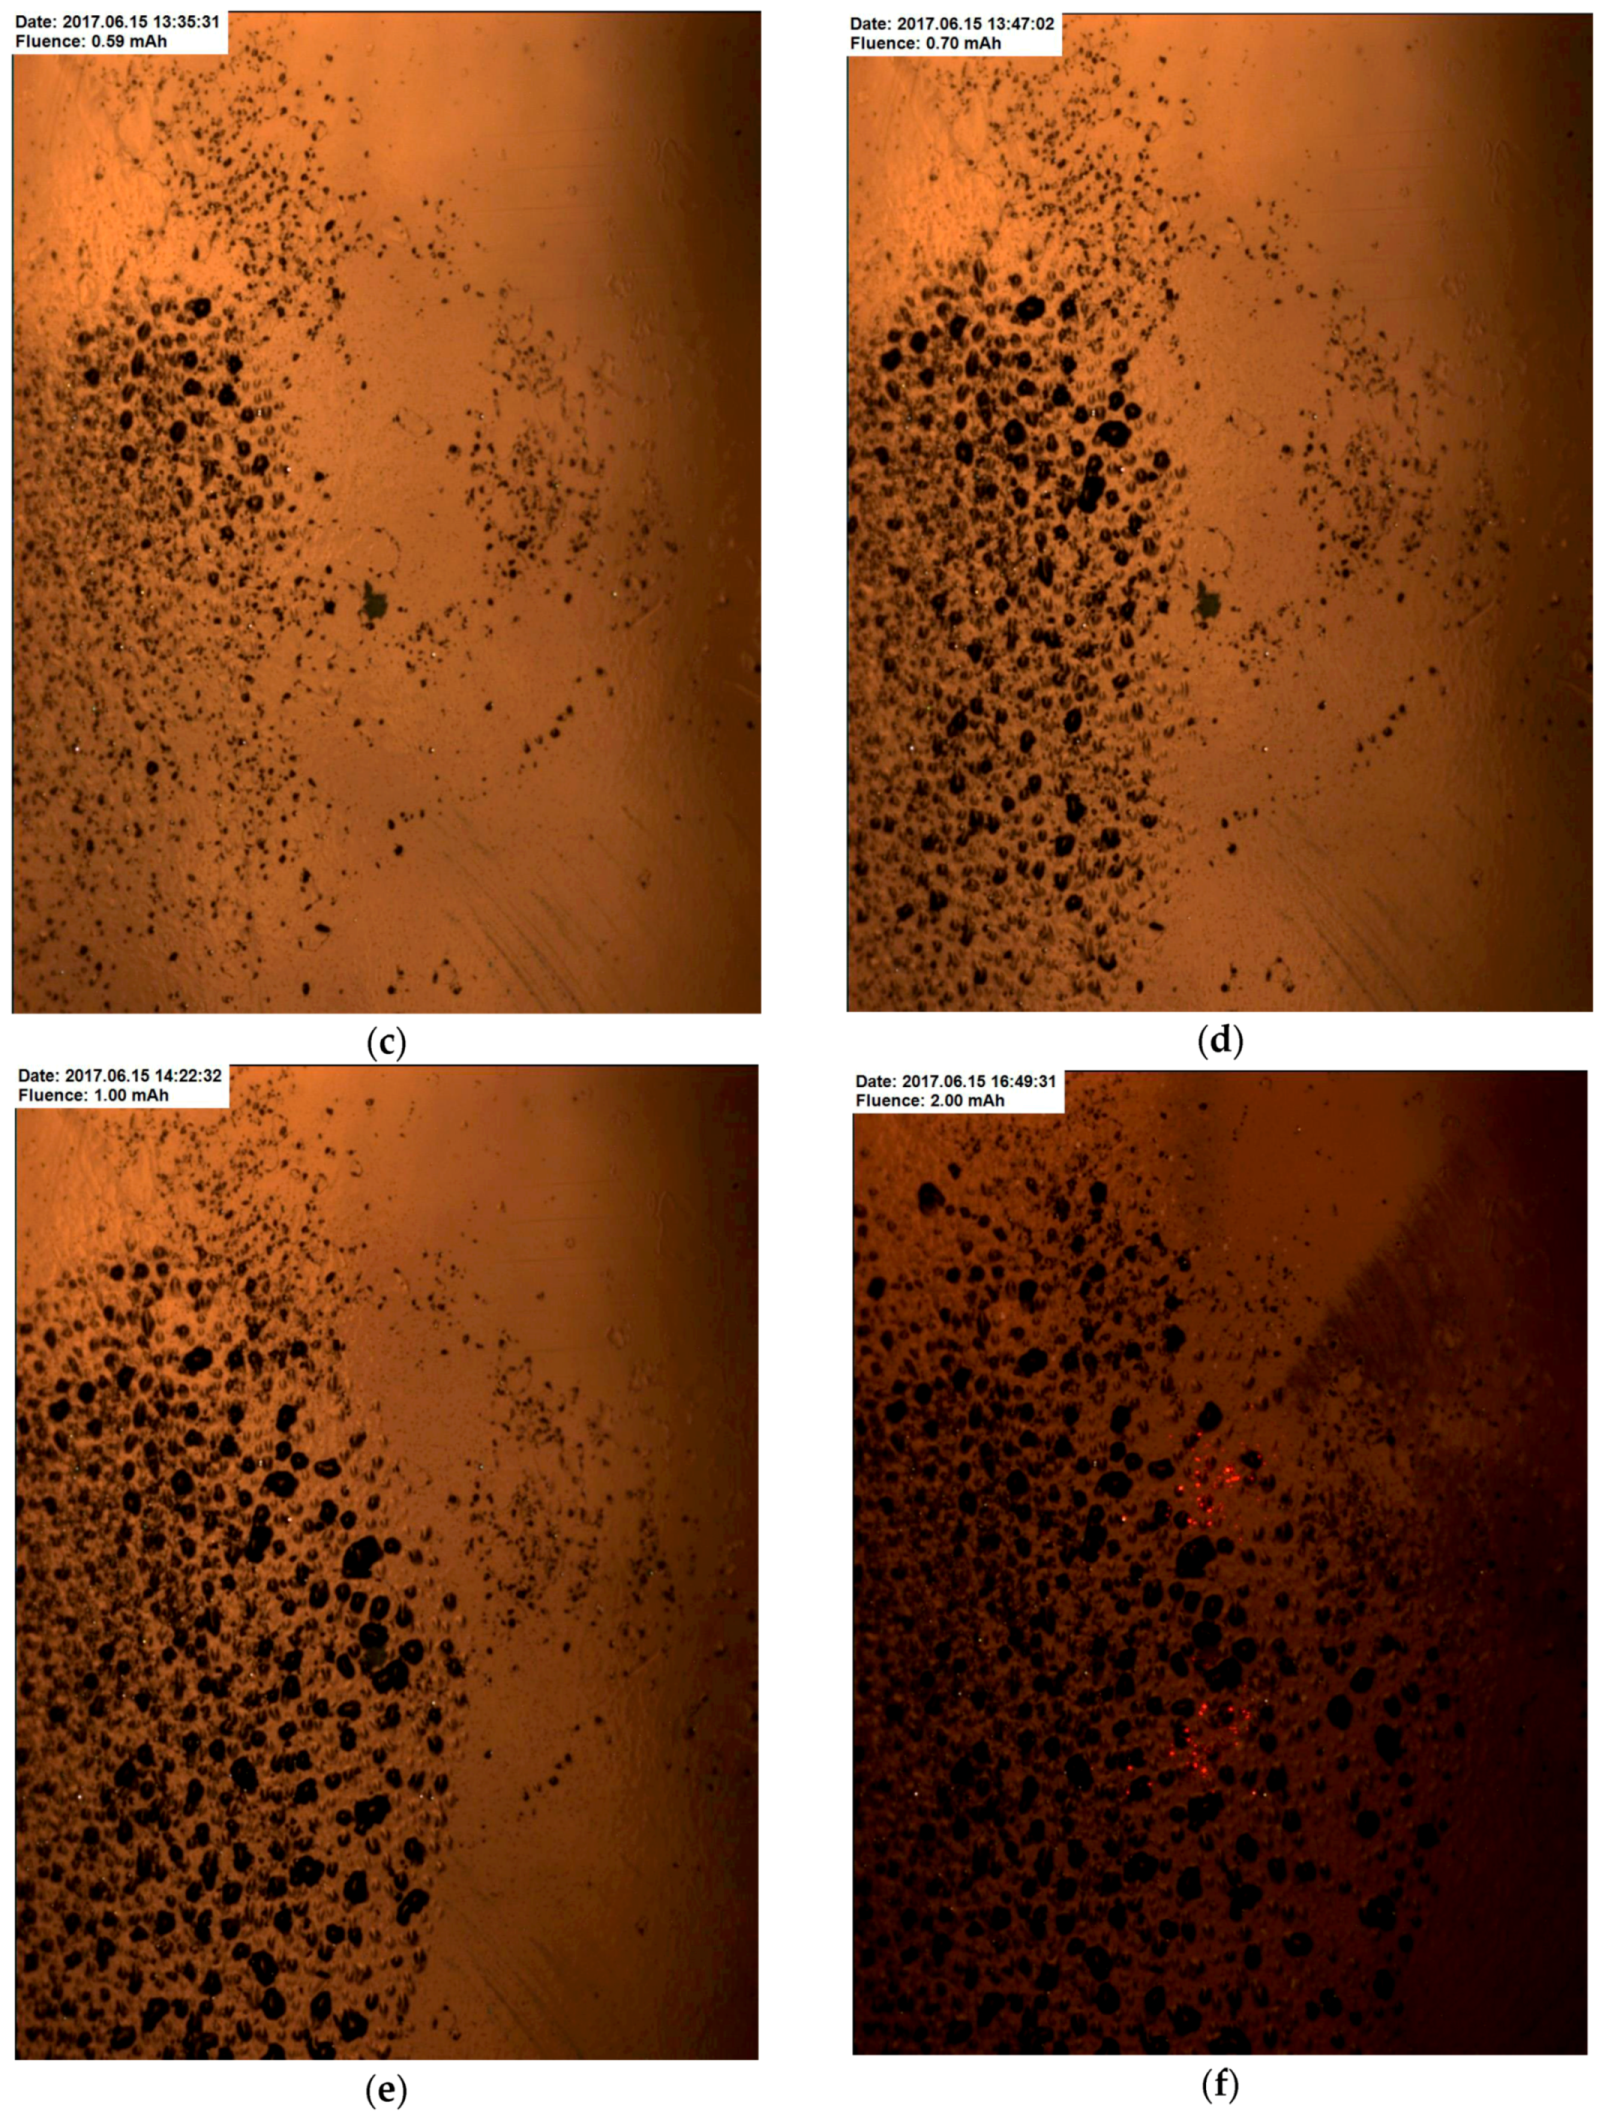
3.2.2. Samples 2 and 3

Samples of 99.99996% coarse-grained copper (Mitsubishi Materials Co., Tokyo, Japan) were proton irradiated to a fluence of 5.6 × 1019 cm−2. The proton beam current was 526 ± 31 μA; the sample surface temperature measured by the pyrometer was 83 ± 8 °C; the maximum temperature measured by the infrared camera was 161 °C.
Figure 11 presents images of the surface of Sample 2, which demonstrate blistering dynamics. The object seen in the right side of the images is a mark that was scratched at the center of the sample surface for positioning. It is seen that at the very beginning of irradiation, the surface relief formed bands typical of metal heating in the vacuum (Figure 11b), and then small blisters appeared (Figure 11c). At a fluence of 1.5 × 1019 cm−2 large blisters started to arise from the left lower corner (Figure 11d) which, after some time, filled the entire visible area. The propagation of blisters from left to right is caused by the fact that, in this case, the center of the proton beam was in the left corner.
During irradiation CCD camera images were saved every 30 s. In this particular experiment the sample was irradiated for 4 h 38 min and 457 images were saved. Figure 12 depicts the dependence of a change in the image brightness relative to the brightness of the first image B on the integral of the current Φ. Here the B value is defined as:
B j = i = 1 N | B 1 , i B j , i | 255 N ,
where Bj,i is the brightness of the i-th pixel (ranging from 0 for a black pixel to 255 for white one) in the j-th image (here j varies from 1 to 457), N is the number of pixels in the image or in the processed region (here N = 1,447,680). It is seen that immediately after the onset of irradiation the images darkened, which was caused by the appearance of bands due to sample heating, then the images slightly enlightened, and then, at an integral of the current of 0.5 mA·h (fluence 1.5 × 1019 cm−2), they again darkened due to the appearance of blisters.
Thus, from Figure 11 and Figure 12 the conclusion may be drawn that blisters arise on the surface of 99.99996% coarse-grained copper (Mitsubishi Materials Co., Tokyo, Japan) at a proton fluence of 1.5 × 1019 cm−2. This value is 3.3 times larger than the fluence at which blisters appear on the surface of Sample 1, the 99.996% fine-grained copper (OFC-1 JIS H3150 C1011, SH Copper Products Co., Ltd., Tsuchiura-shi, Japan).
The blister size of Sample 2 was found using the same procedure that was implemented on Sample 1 (as seen in Figure 10). Figure 13b presents the blister size distribution histogram. The size was 170 ± 50 μm.
Figure 14 shows images of a part of the sample surface, taken on the FIB-SEM Helios G3 UC focused ion beam electron microscope. From Figure 14a it is seen that the surface is covered with blisters with a characteristic size of 100 μm. One of these blisters was cut by the ion beam (see Figure 14b). In the images it is seen that at a depth of 10 to 20 μm inside the metal, a cavity formed. Since the 2-MeV proton path is at a depth of 19 μm in copper [14], we can confidently state that the cavity formed in the metal at the point where the protons stopped. Substantially smaller blisters are also present on the surface. One of these blisters, with a size of 8 μm, is depicted in Figure 14c. This blister was also cut by the ion beam and its image is shown in Figure 14d.
We observed that the metal thickness above the cavity was only 2 μm. The formation of these, and similar, blisters is likely to be associated with irradiation by the accompanying flux of positive argon ions with an energy of 1 MeV. This flux was formed within the gas stripping target that was placed inside a high-voltage terminal, through the interaction of the hydrogen ion beam on argon gas, rather than the 2-MeV proton beam irradiation [15,16]. Although the positive argon ion flux is small, due to both a lower energy and a larger mass, the penetration depth of argon ions is appreciably smaller, and blisters form at a significantly lower fluence. In Figure 11e, small blisters, which appeared before the larger blisters that were produced by proton irradiation, can be clearly seen on the surface.
An X-ray diffraction study of the irradiated surface of copper samples was carried out on a SHIMADZU XRD-7000 diffractometer (CuKα radiation, Ni filter, Bragg-Brentano scheme) at room temperature. LaB6 (SRM-660a) and Si (SRM-640c) were used as the external standard. The measured diffraction patterns were indexed using data on the copper face-centered cubic (fcc) structure [17]: areference = 3.6149 Å. The full-profile refinement was performed using the Powder Cell for Windows program [18]. The fcc cell parameters were calculated based on the position of the 2θ220 reflection in which the CuKα1,2 doublet was sufficiently well resolved, and in the calculations of interplanar distances d220, it was possible to use the wavelength λCuKα1 = 1.5406 Å. The half-widths of (220) (the Miller indices) reflections from the diffraction patterns of the studied samples were used to estimate coherent scattering region (CSR) according to the Selyakov-Scherrer formula. The broadening of the (220) reflection was evaluated relative to the similar reflection of the non-irradiated sample. The analysis shows that this sample is a polycrystalline copper phase with the prevailing orientation (texture) of crystallites along [220]. This is evidenced by underestimated I/I0 values of the (111) and (200) reflections (I is the intensity of the most intense diffraction reflex, I/I0 is the relative intensity of the remaining reflections). A comparison of the diffraction patterns of the samples reveals that proton irradiation causes an increase in the (200) line half-width from 0.10° to 0.22° (2θ), which indicates a decrease in CSR on the sample surface from 360 to 160 nm.
The X-ray diffraction analysis shows that samples 2 and 3 differ in the prevailing orientation of crystallites: along [200] in Sample 2 and along [111] in 3. The [111] orientation corresponds to the crystallographic plane most densely filled with copper atoms. Therefore, it seemed interesting to examine the possible effect of the crystallite orientation on blistering.
The blistering dynamics of Sample 3 are illustrated in Figure 15. In this experiment, to observe a larger sample surface, the remote microscope magnification was decreased two times by removing the CF-2 objective. Moreover, the CCD camera was turned at 90° relative to the optical axis. The blistering threshold was 1.5 × 1019 cm−2, which was the same as in the irradiation of Sample 2. Consequently, the crystallite orientation does not affect the blistering threshold.
It should be noted that when the surface was covered with blisters, further irradiation did not modify it. Thus, the region covered with blisters and subjected to the maximum density proton beam (Figure 15c) did not practically change with four times increase in the fluence from 1.5 × 1019 cm−2 to 6 × 1019 cm−2. This can be explained as follows: proton absorption in copper at a depth of 19 μm forms a region with an increased hydrogen concentration. Next, the agglomeration of captured hydrogen atoms occurs, which leads to the formation of gas bubbles inside the metal. When the critical gas pressure is reached, the surface layer deforms: blisters arise in the form of flakes (Figure 14a) or bubbles (Figure 14c) with an empty cavity under them (Figure 14b,d). Since further irradiation does not result in surface modification, the hydrogen that flows into this cavity leaves it through holes or cracks that formed when a flake or a bubble rose to the surface.
The blister size was found using the procedure that was implemented on the previous samples (Figure 10 and Figure 13). The result of image processing is presented in Figure 16a. Figure 16b shows the blister size distribution histogram. The blister size was 170 ± 50 μm.
Thus, since most of the irradiated surface was in the image area, the propagation dynamics of the boundary of the region covered with blisters enabled the recovery of the proton beam cross-section. Figure 17 illustrates the result of processing the images: ellipses mark the boundaries of the region covered with blisters at different proton fluences. It can be seen that the proton beam is not symmetric: it is stretched vertically and the maximum current density is shifted upwards. The beam covers an area with a diameter of 16 mm. The proton beam size at the half-height is 8.9 mm horizontally and 12.4 mm vertically (5% accuracy). The effective beam area, defined as the ratio between the current and the maximum current density, is 75 ± 7 mm2.

3.2.3. Sample 4

The 99.99996% fine-grained copper sample (Mitsubishi Materials Co., Tokyo, Japan) was proton irradiated to a fluence of 6 × 1019 cm−2. The proton beam current was 536 ± 34 μA. Figure 18 presents images of the surface of Sample 4, which demonstrate blistering dynamics. Figure 19 presents images of the sample surface after irradiation.
Thus, from Figure 18 and Figure 20 the conclusion may be drawn that blisters arise on the surface of 99.99996% fine-grained copper (Mitsubishi Materials Co., Tokyo, Japan) at a proton fluence of 3 × 1019 cm−2. This value is almost seven times larger than the fluence at which blisters appear on the surface of Sample 1, 99.996% fine-grained copper (OFC-1 JIS H3150 C1011, SH Copper Products Co., Ltd., Tsuchiura-shi, Japan), and two times larger than the fluence at which blisters arise on the surface of Sample 2, 99.99996% coarse-grained copper (Mitsubishi Materials Co., Tokyo, Japan).
Figure 21 depicts the blister size distribution histogram of Sample 4. The size was 155 ± 45 μm.

3.2.4. Samples 5 and 6

Samples 5 and 6 are copper discs with explosion-welded tantalum foil. The samples were prepared as follows: copper and tantalum slabs were explosion-welded with each other, rolled to a six times decrease in size, cut to the desired dimensions, polished, and then annealed at 500 °C for 5 h. The tantalum layer is homogeneous; its thickness is 160 ± 5 μm.
Proton irradiation was performed from the tantalum side. Sample 5 was irradiated to a fluence of 6 × 1019 cm−2 and no visible surface modifications were detected (Figure 22). The proton beam current was 437 ± 96 μA; the sample surface temperature measured by the pyrometer was 125 ± 20 °C (137 ± 9 °C at a current of 505 ± 16 μA).
Sample 6 was irradiated at fluence that was 10 times larger (6.7 × 1020 cm−2). Figure 23 illustrates the dependence of the sample temperature (measured by the pyrometer) on the accumulated fluence. A series of measurements was required because there was only one vacuum chamber through which the temperature was measured: either by the pyrometer or the thermovision camera. This graph also shows the time behavior of the proton beam current. The stability of the current in the series was two percent. It can be seen that the sample surface temperature increases with the accumulated fluence. Thus, at the beginning of irradiation, at a fluence of about 2 mA·h the temperature was 167 ± 2 °C at a current of 502 ± 9 μA, and at the end, at the accumulated fluence of 19 to 20 mA·h it was 260 ± 3 °C at a current of 512 ± 8 μA.
Apparently, the temperature rise measured by the pyrometer is due not only to the elevating temperature of the sample surface but also due to a change in the relative emissivity. To eliminate the factor of a changing blackness coefficient the sample was calibrated both before and after irradiation using a thermocouple and by heating the sample with hot air through the cooling channels. The performed calibration allowed us to state that, with an increase in the accumulated proton fluence, the sample surface temperature increased from 167 to 208 °C rather than to 260 °C.
Thus, during proton irradiation of tantalum, an increase in the sample surface temperature was measured, from 167 °C at the beginning to 208 °C at the end, at a proton current of 500 μA.
Visible surface modification started to be observed at a fluence of 3.6 × 1020 cm−2 (clearly seen in Figure 23). However, as shown by the electron microscope measurements, the modification is not related to the appearance of blisters themselves. Blisters in the form of bubbles or flakes were not detected up to a fluence of 6.7 × 1020 cm−2. The surface subjected to irradiation can be described as a relief with a characteristic cell size of about 1 μm (Figure 24).
Both Samples 5 and 6 as well as the non-irradiated sample were analyzed on an X-ray diffractometer by the procedure described above. The fcc parameters of the tantalum cell were calculated based on the position of the 2θ321 reflection on which the CuKα1,2 doublet was sufficiently well resolved, and in the calculations of interplanar distances d220, the wavelength λCuKα1 = 1.5406 Å could be used. Full width at half maximum (FWHM) values from the diffraction patterns of the studied samples were applied to estimate the CSR. The broadening of (321) reflections was estimated relative to the Si reference. Powder X-ray diffraction characteristics of the samples are summarized in Table 1.
In the non-irradiated sample, the fcc cell parameter of 3.307(2) Å coincides, within the error, with the reference value for tantalum. The broadening of diffraction reflections relative to the reference may indicate micro-strain associated with the preparation of the disc surface. Samples 5 and 6 have a preferred orientation of crystallites (texture) along the [200] direction. For Sample 5, the a parameter is larger than the reference value by 0.005 Å. Perhaps the appearance of the texture is associated with the preparation of samples. The diffraction reflections are also noticeably broadened in this sample, which may be indicative of some decrease in CSR sizes. The a = 3.328(2) Å parameter of Sample 6 is larger than the reference one by 0.022 Å. If we consider only hydrogen incorporation into the tantalum lattice, then tentative estimates can be made based on the literature data: in previous studies ([17] (No. 89-4073); [19]) a TaH0.1 phase with parameter a = 3.327 Å was described, which coincides with our value within the measurement error. Consequently, in Sample 6, hydrogen is incorporated into the tantalum crystal structure. It is possible to assume that there is one hydrogen atom per ten tantalum atoms.

3.2.5. Samples 7, 8 and 9

Sample 7 was prepared by soldering a 50 μm thick tantalum foil to the copper disc with a silver-palladium solder. Sample 8 was prepared by diffusion welding (500 °C, 5 h) of a copper disc with a 50 μm thick tantalum foil onto which a 200 nm thick copper layer was predeposited. Sample 9 was prepared by plasma arc deposition of a 100 μm thick layer of copper-tantalum alloy in a 1:1 volume ratio on to a copper disc. All compounds were found to be resistant to heating: exfoliation or destruction of the tantalum layer was not observed for any sample. It is revealed that at the same heating power the samples had different surface temperatures (Table 2). Sample 5 (explosion) had the lowest temperature, followed by Sample 9 (alloy). Sample 8 (diffusion welding) had a higher temperature than Sample 9, and Sample 7 (soldering) had the highest temperature. These differences are explained by different thermal contacts of the surfaces and different thicknesses of the tantalum foil. To explore sample behavior under long-term irradiation, the sample with the lowest surface temperature (obtained by explosion) was selected. Results of the study of Sample 6 are given above (Figure 24).

4. Generalizations and Discussion

The main results of the study are summarized in Table 3.
We summarize the key results of the performed studies on 2-MeV proton irradiation of different samples as follows:
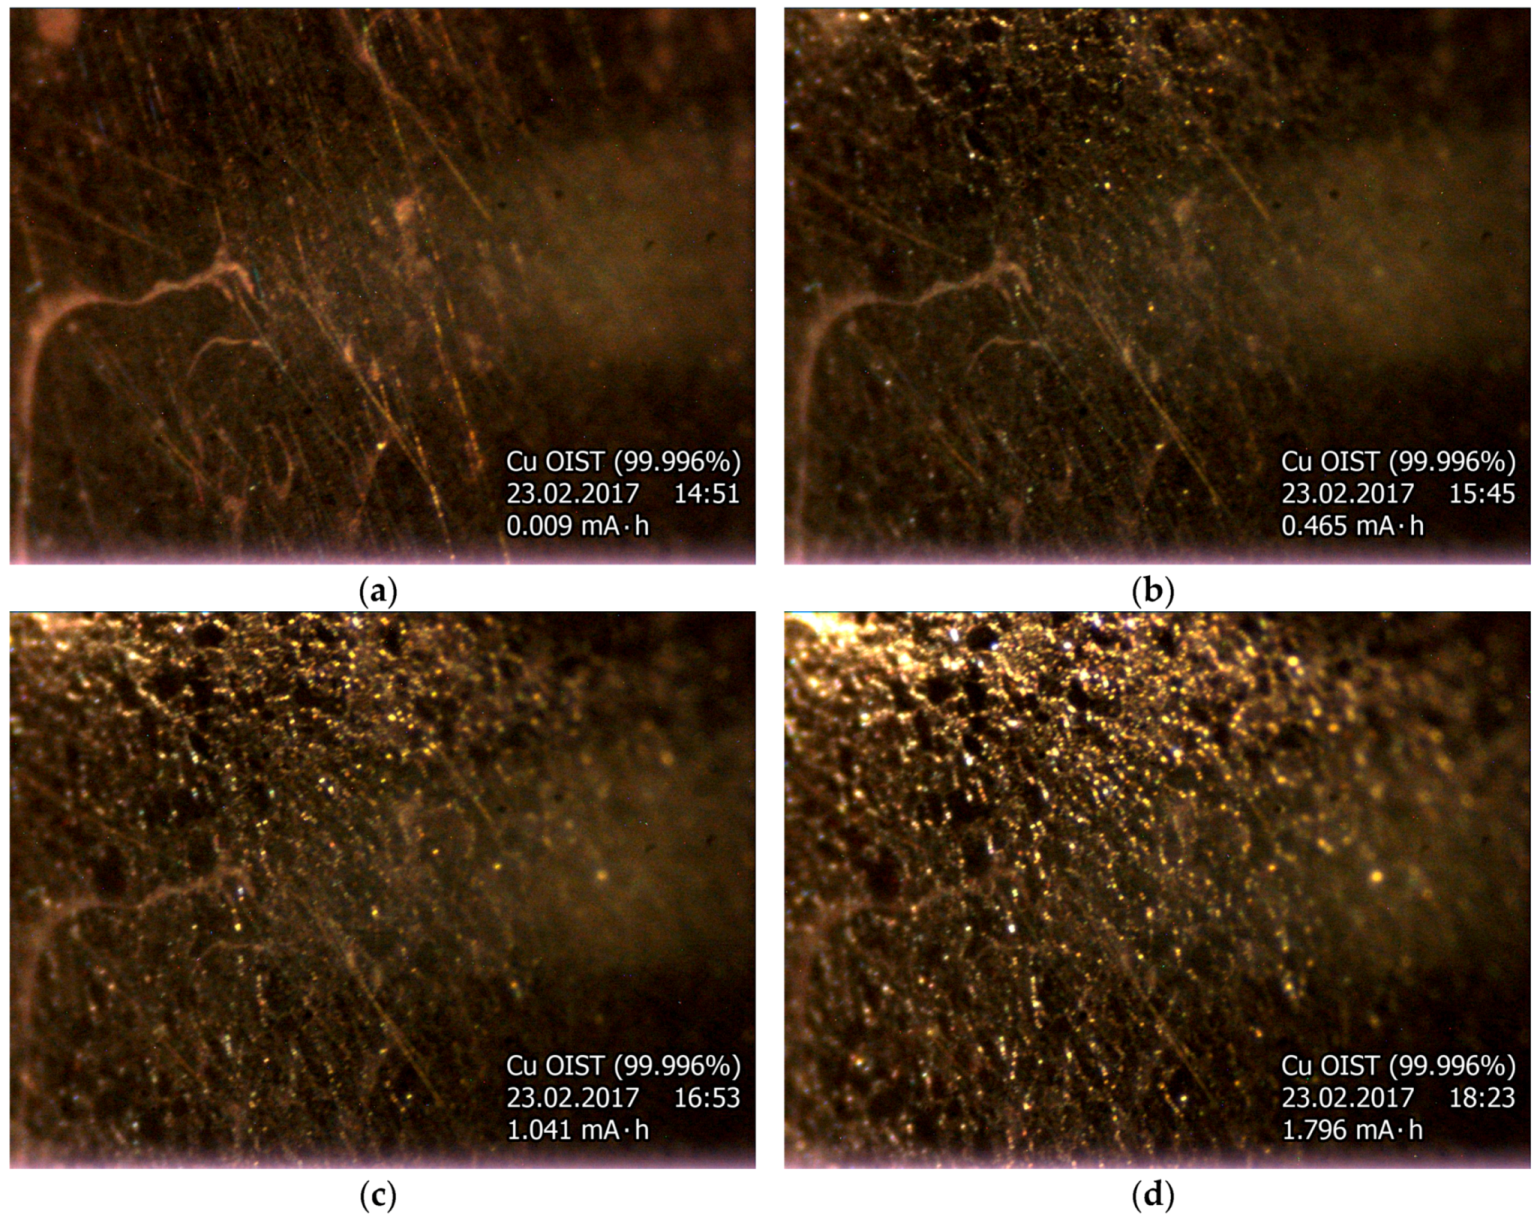
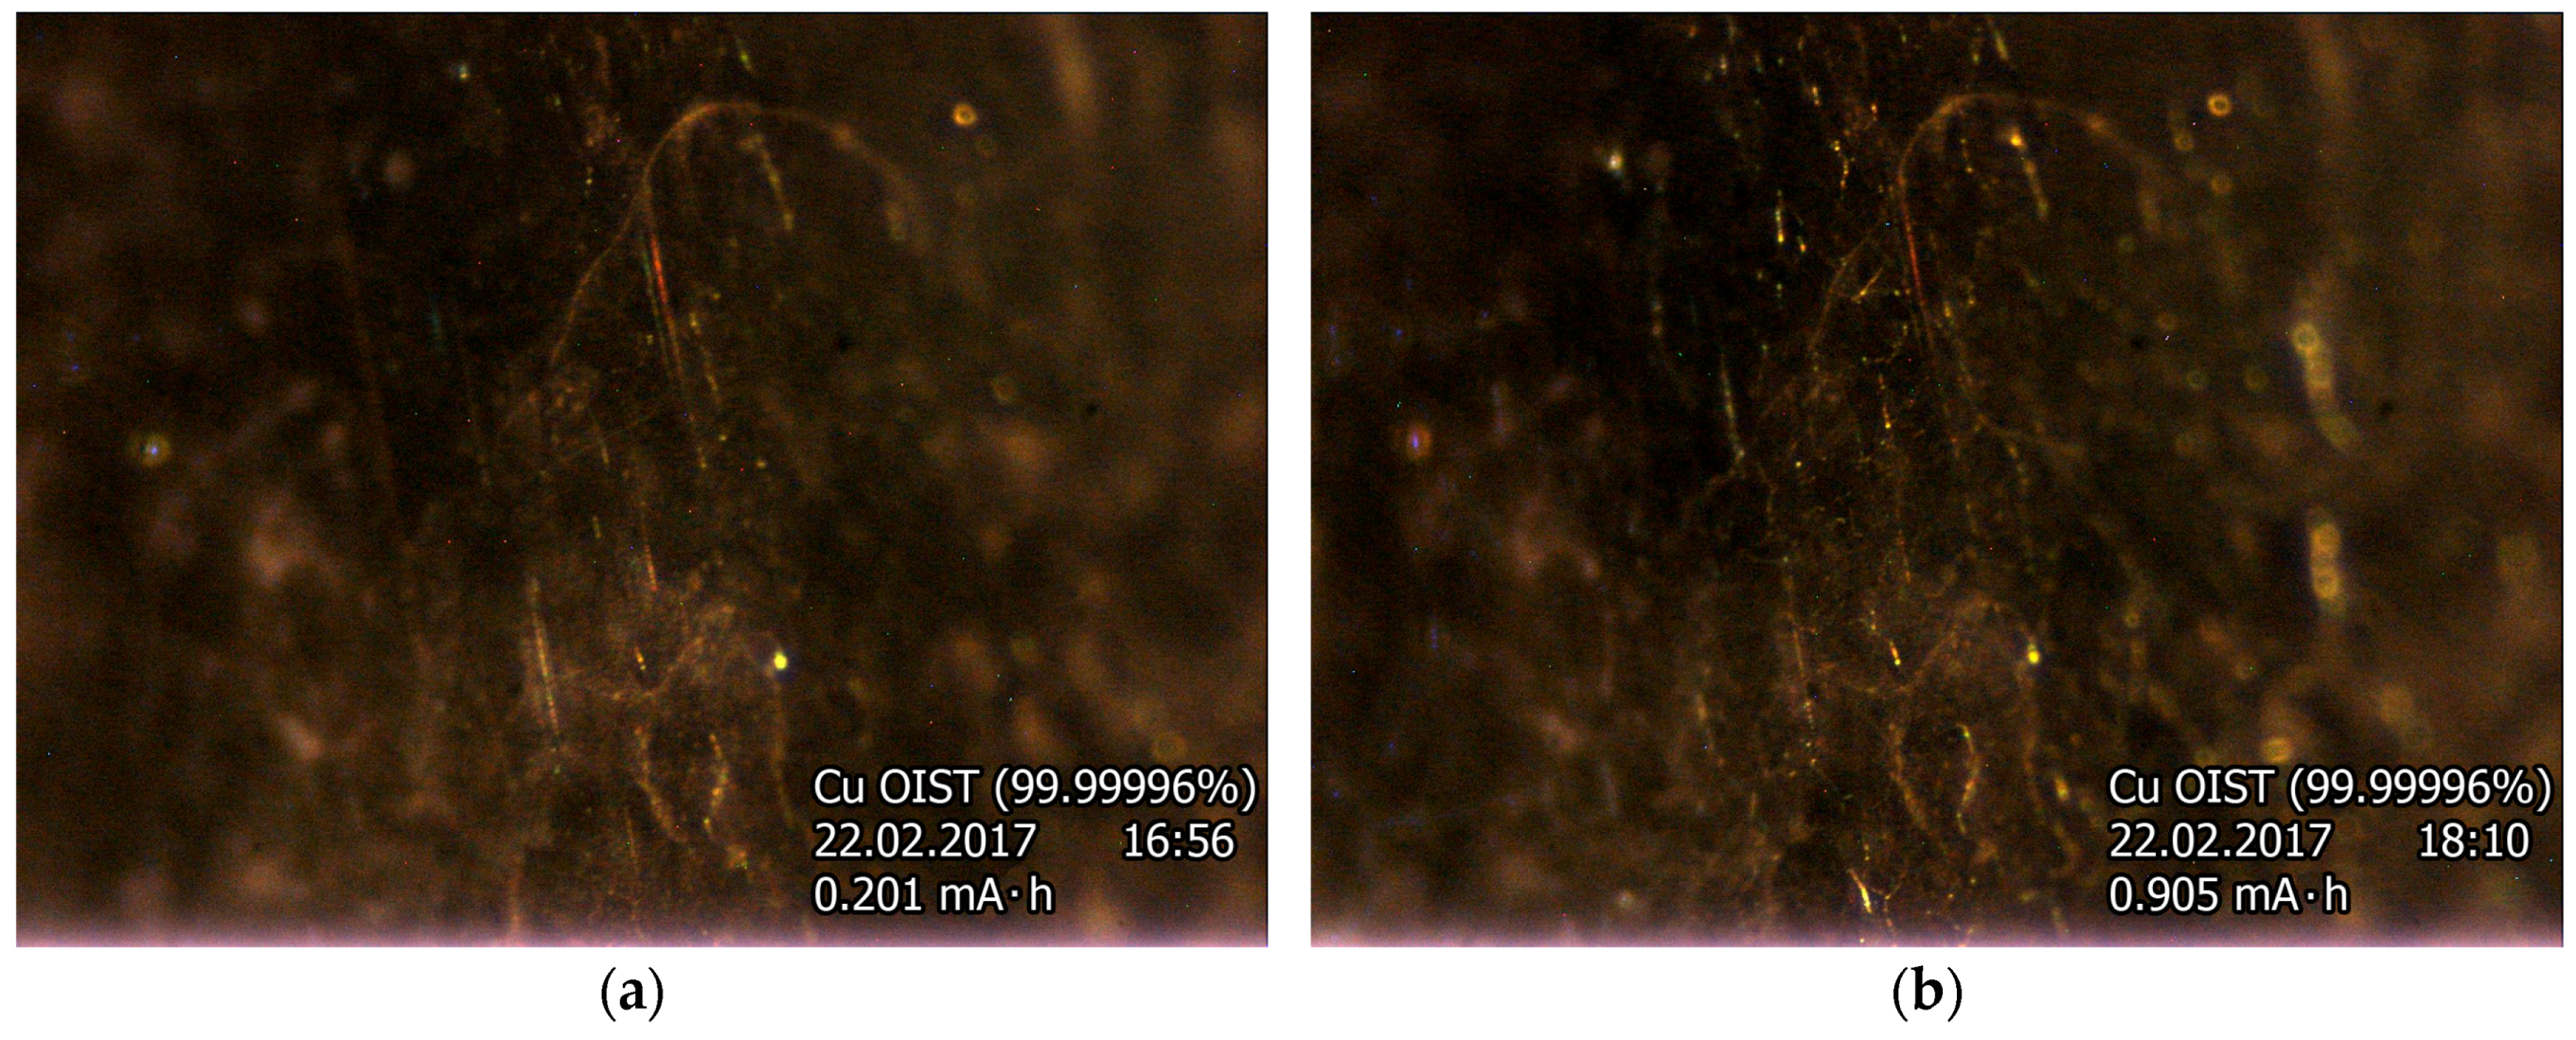
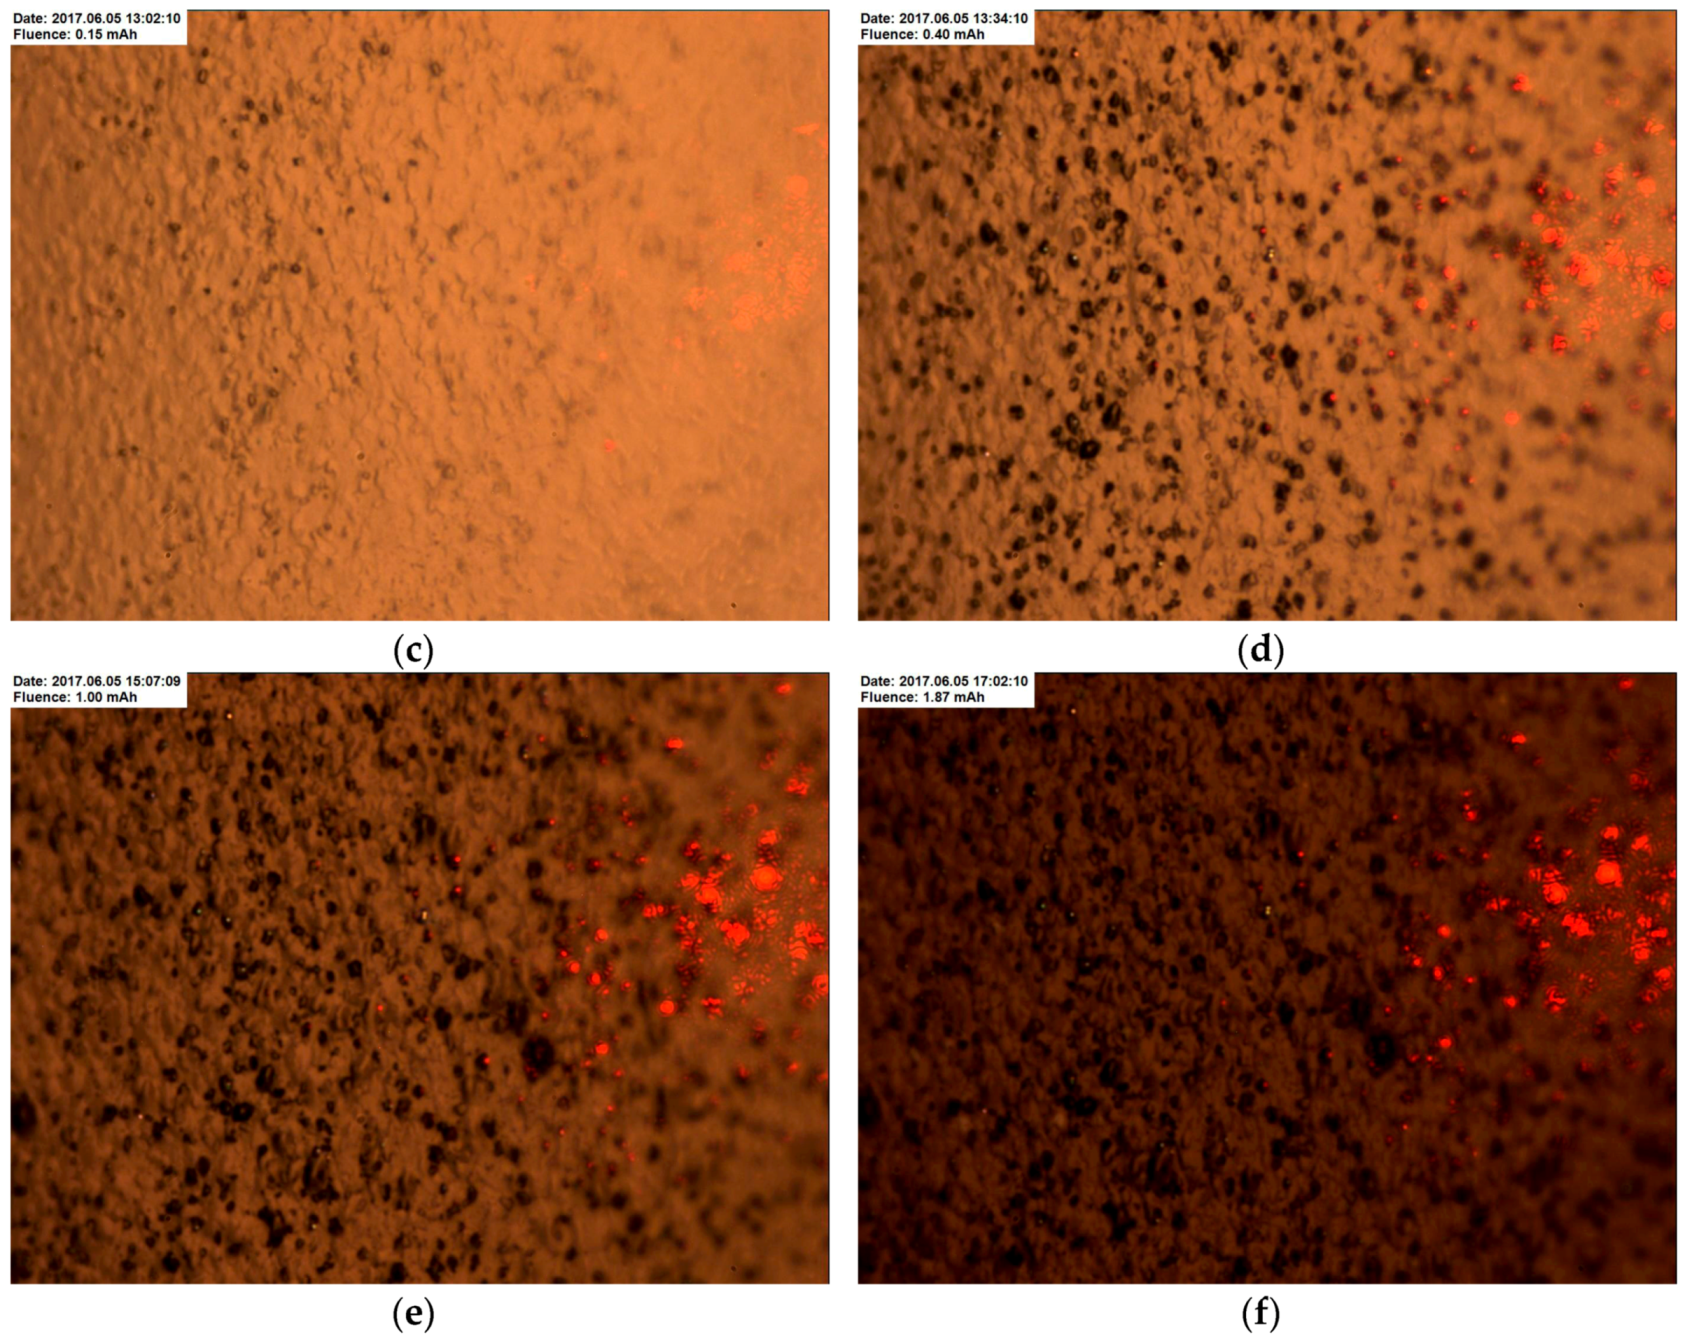
  • The blistering threshold of the copper surface depends on the copper purity. The purer the copper, the higher the threshold is. The maximum threshold is 3 × 1019 cm−2; the minimum value is seven times lower.
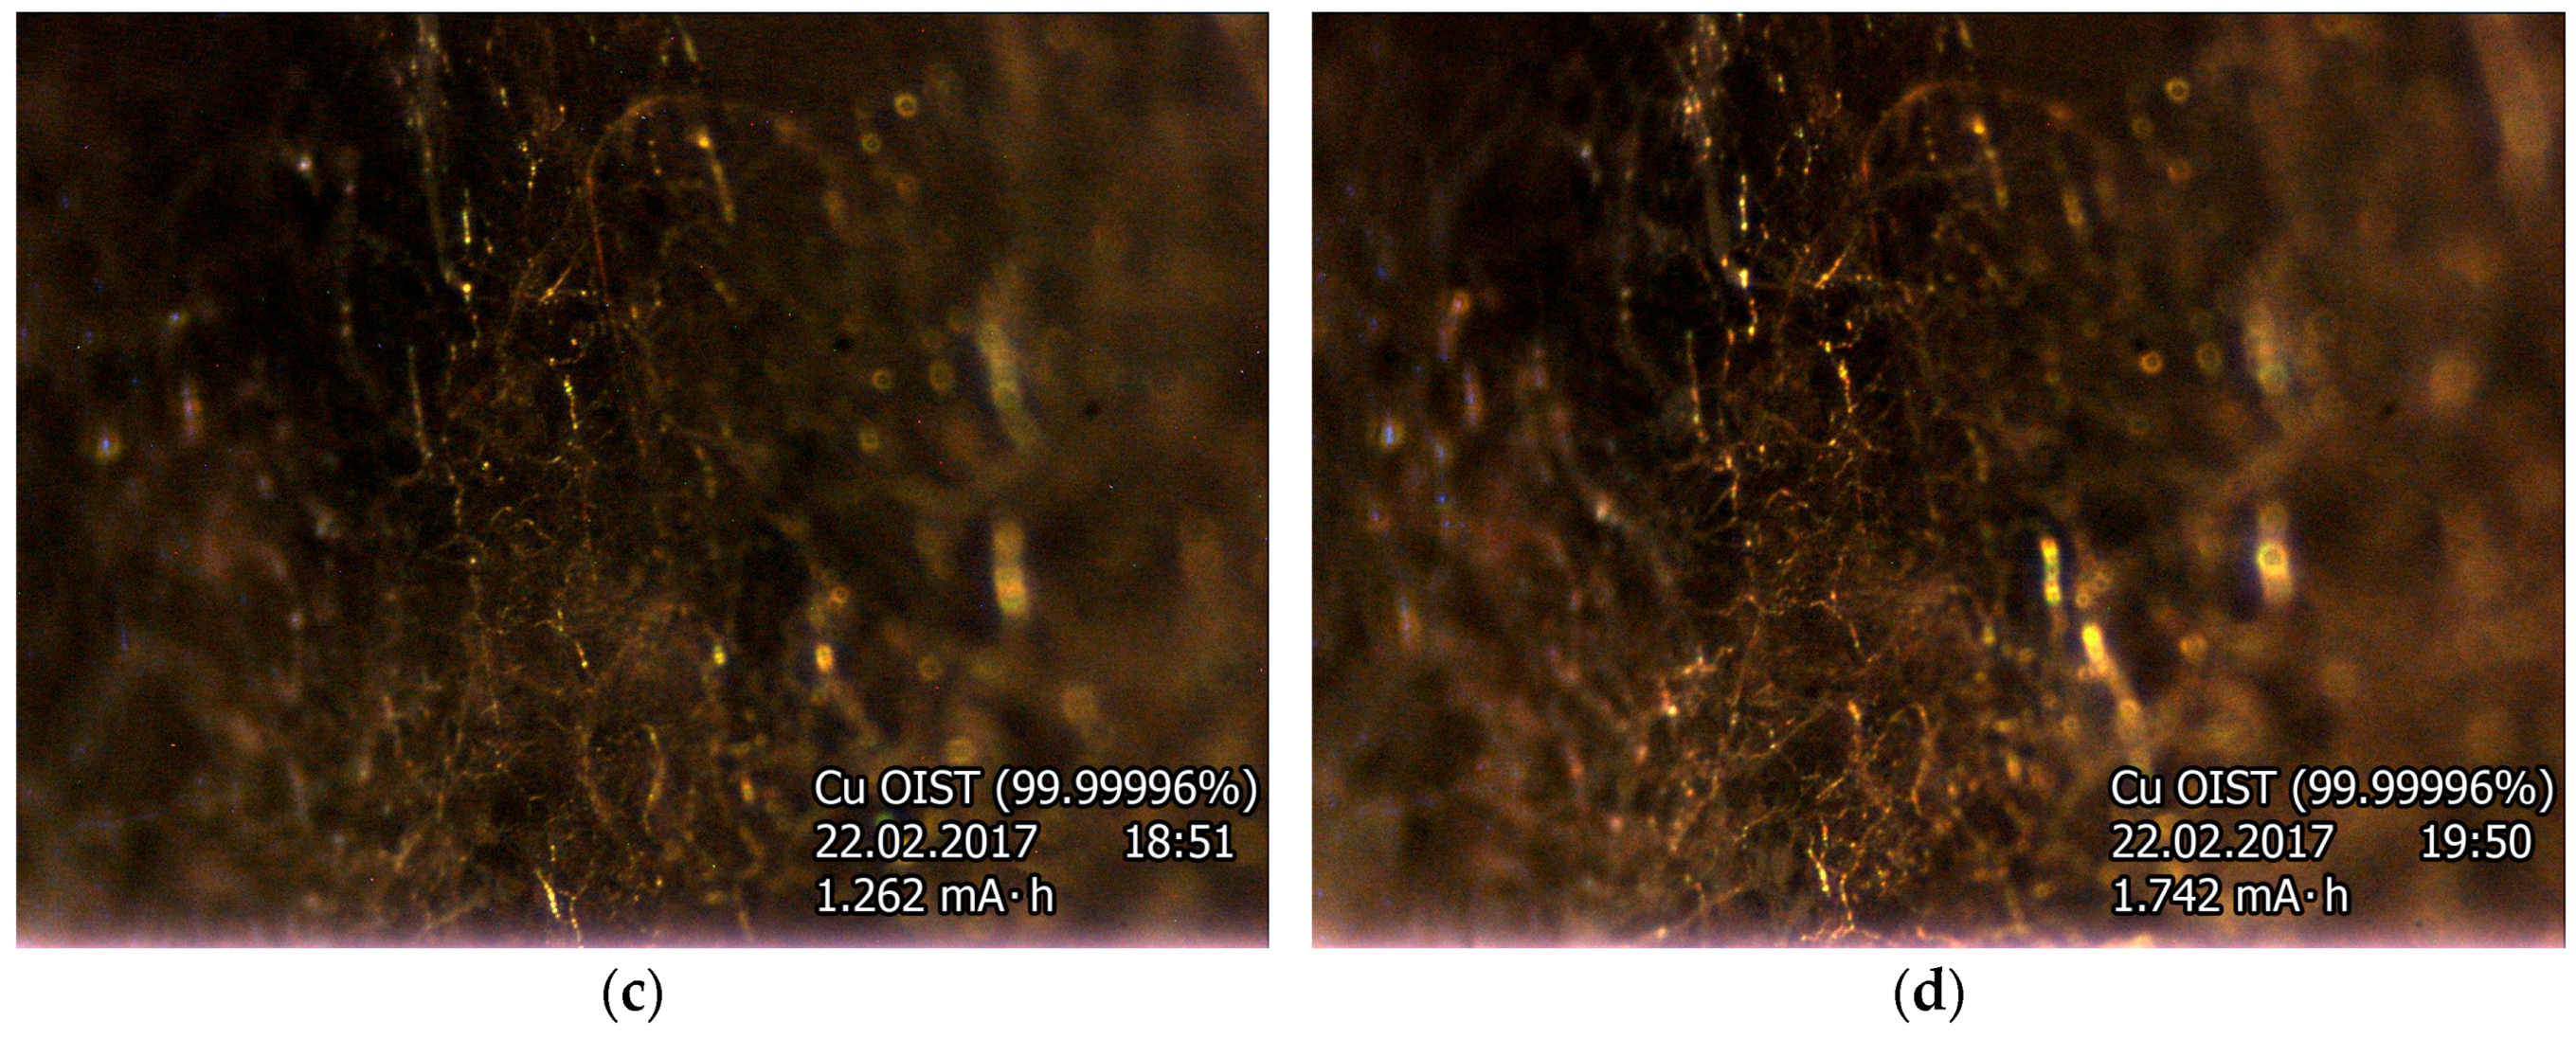
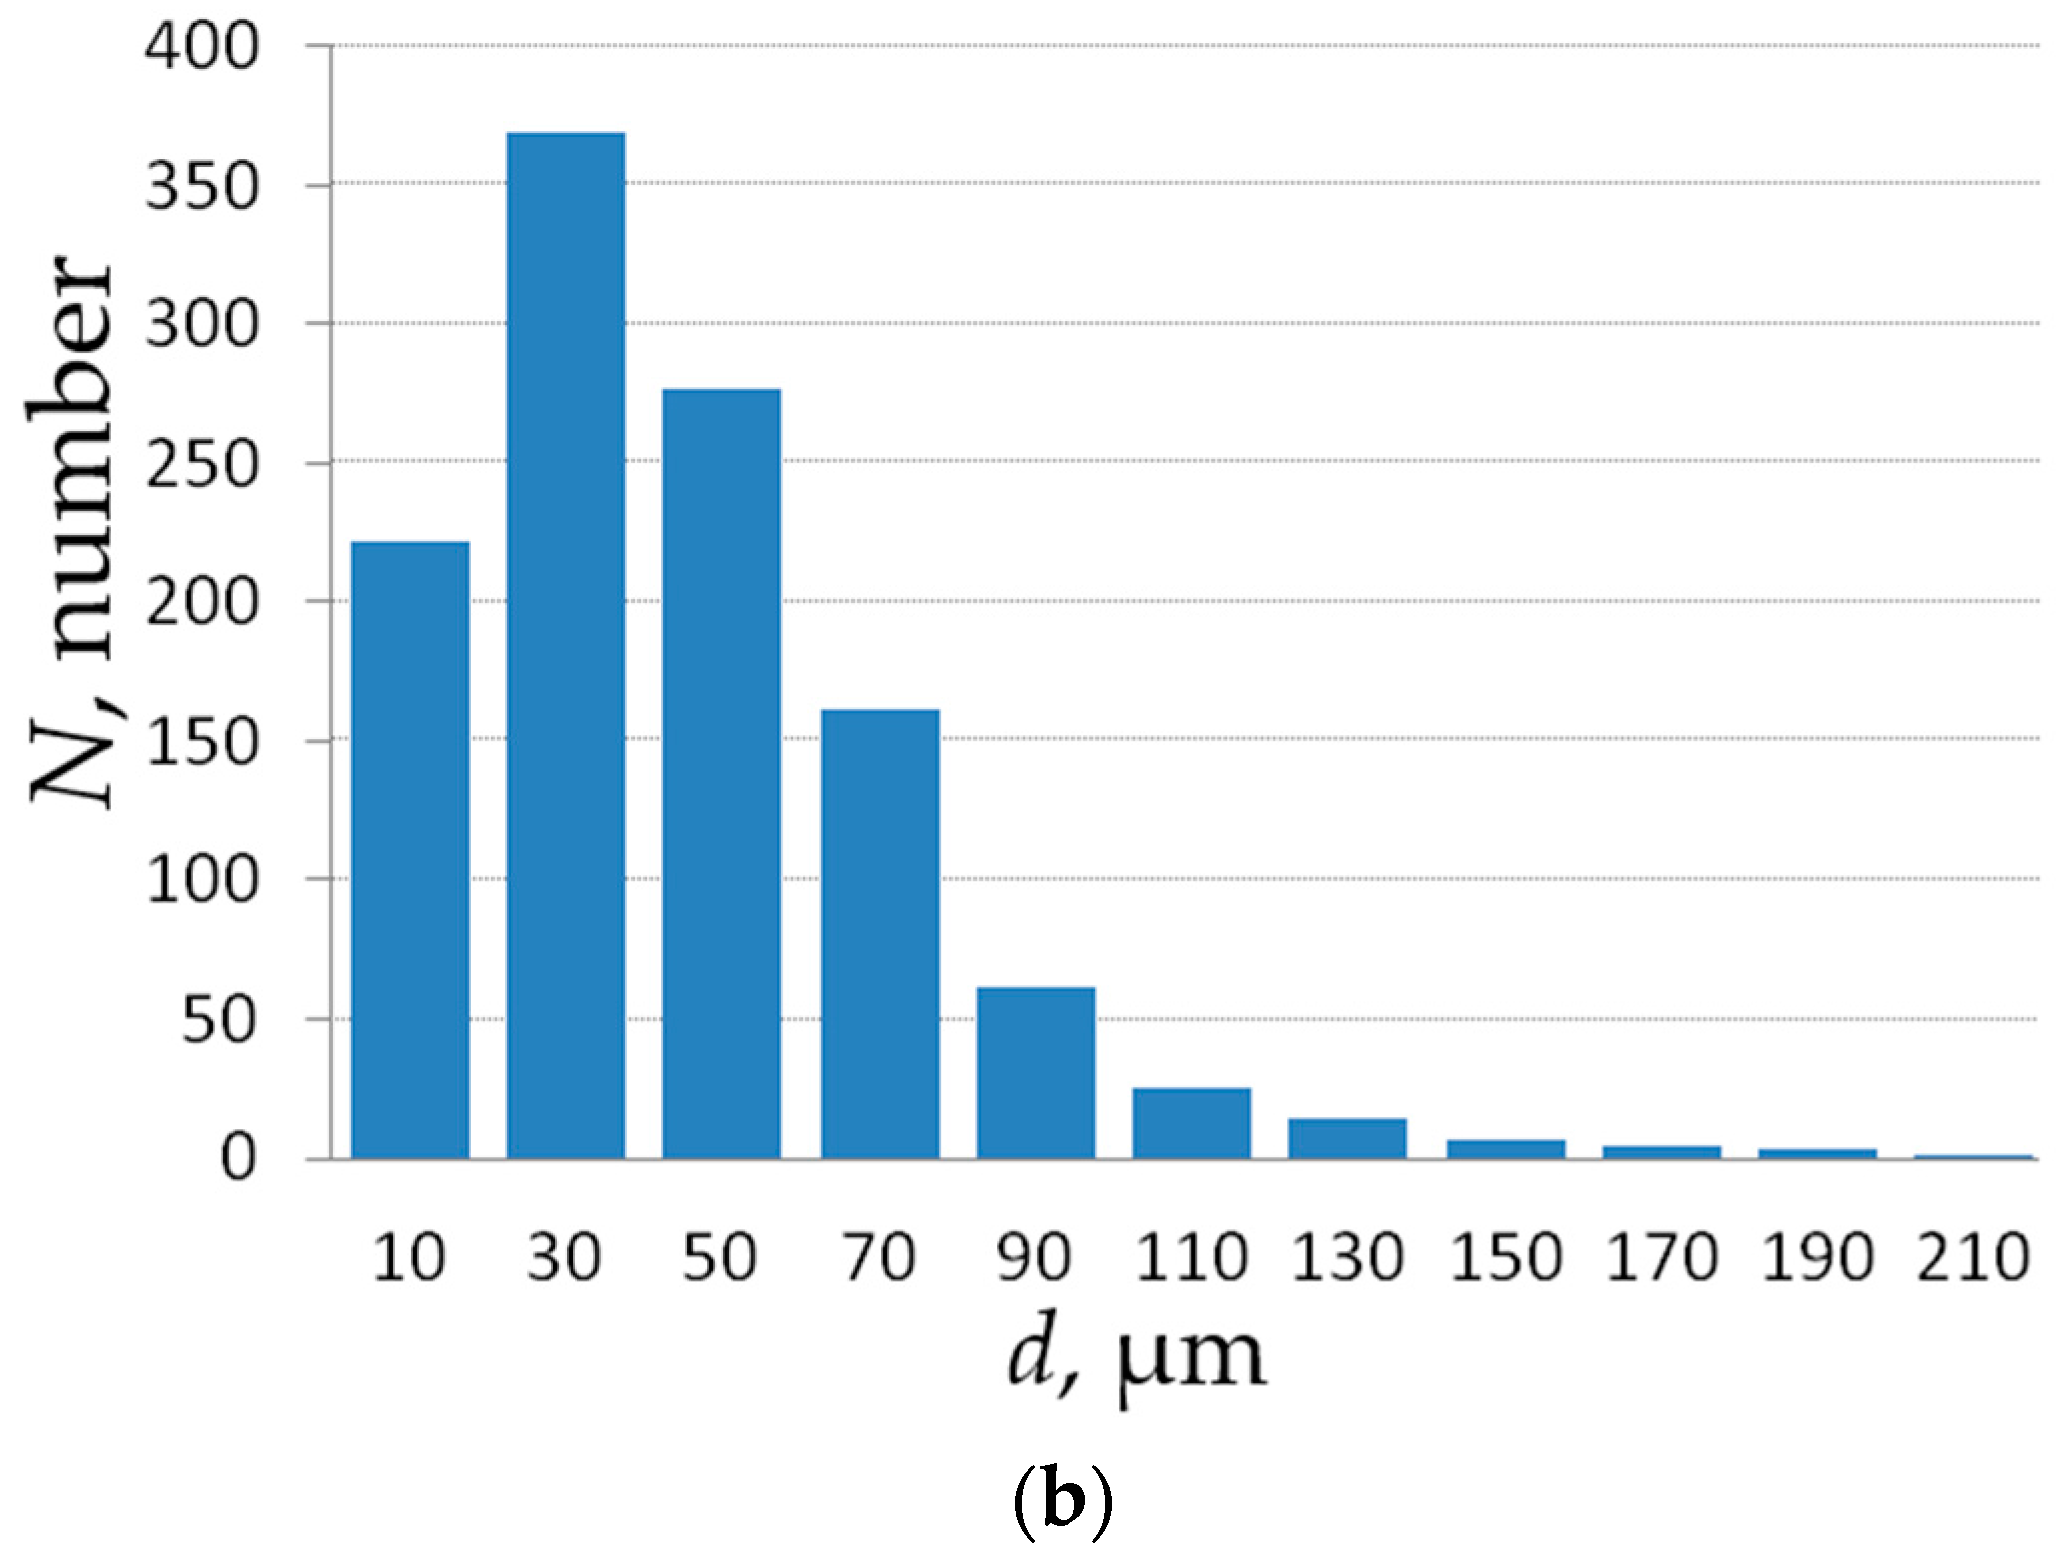
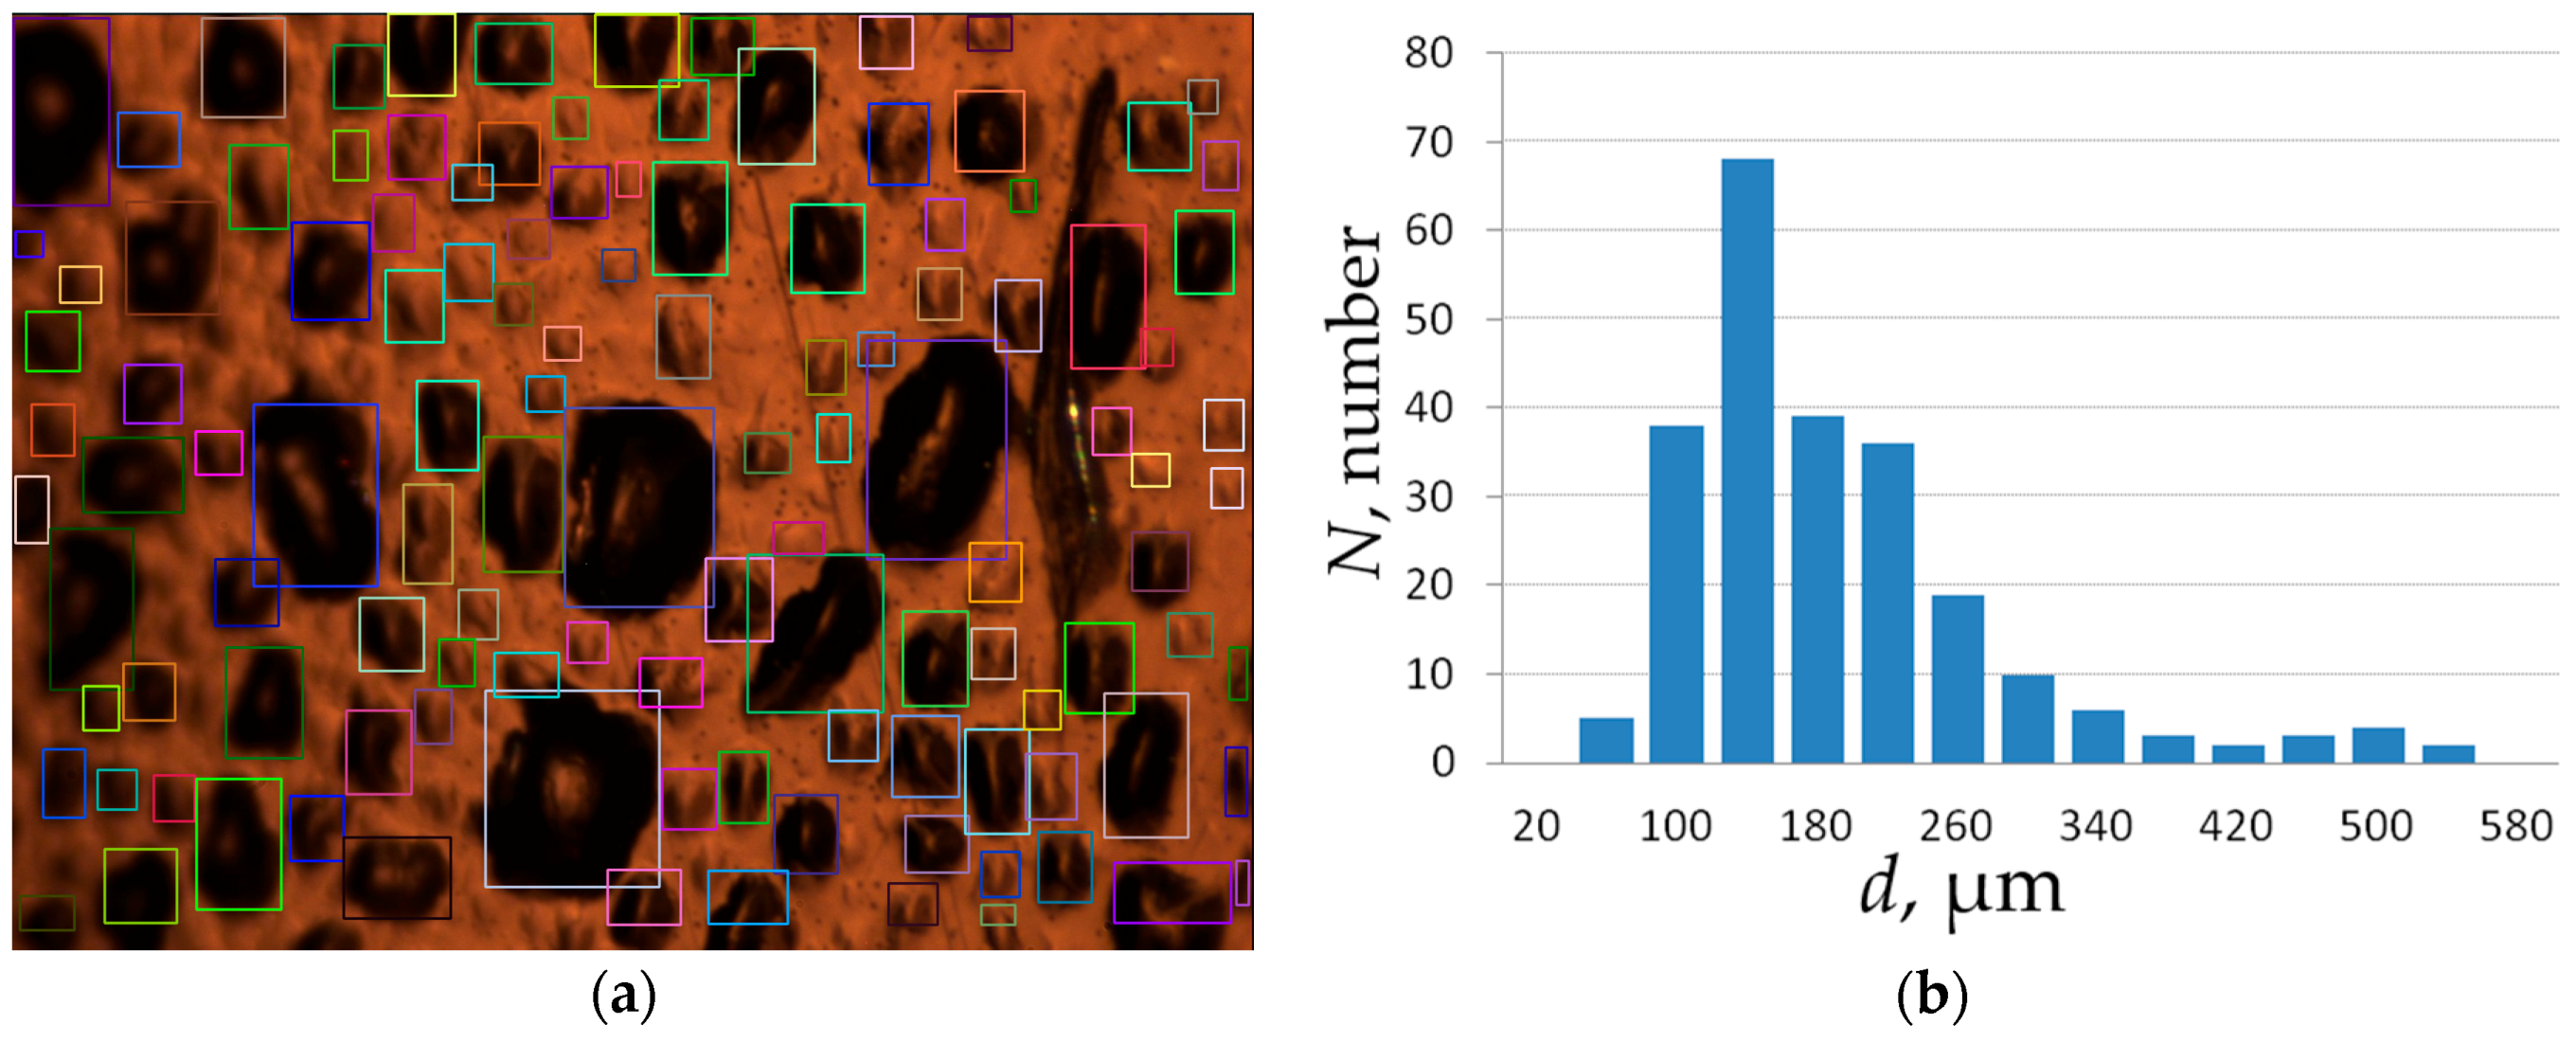
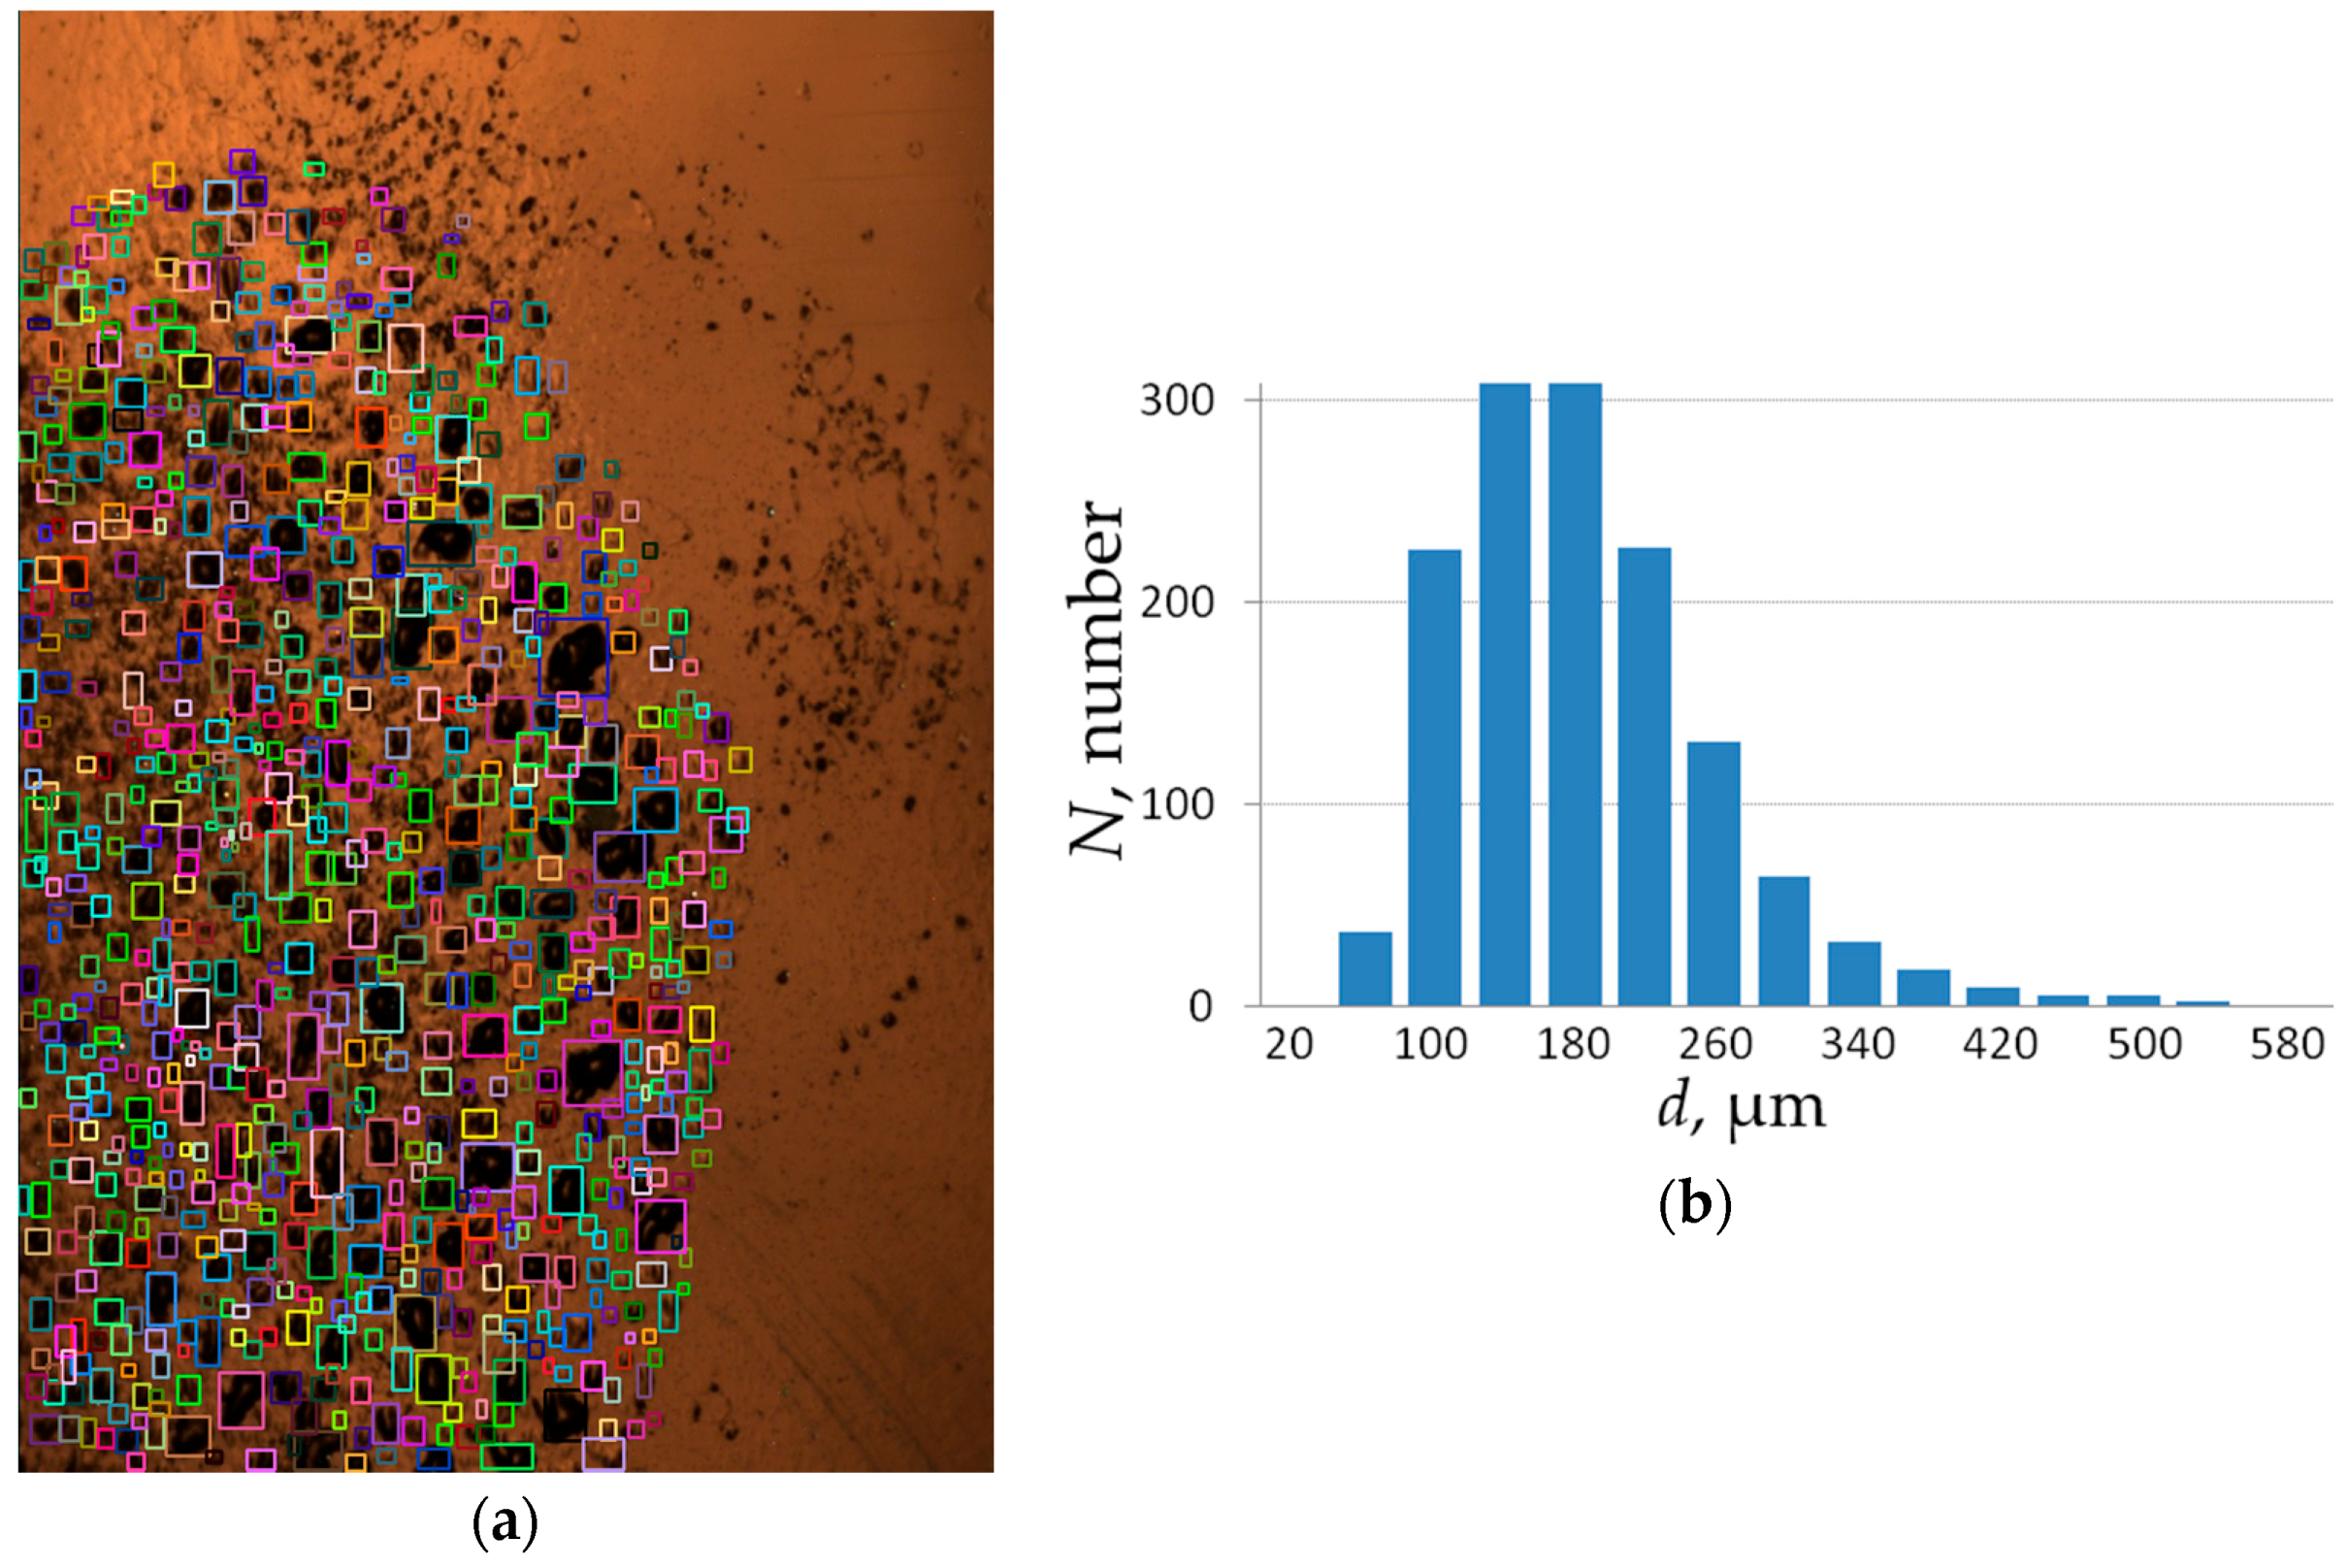
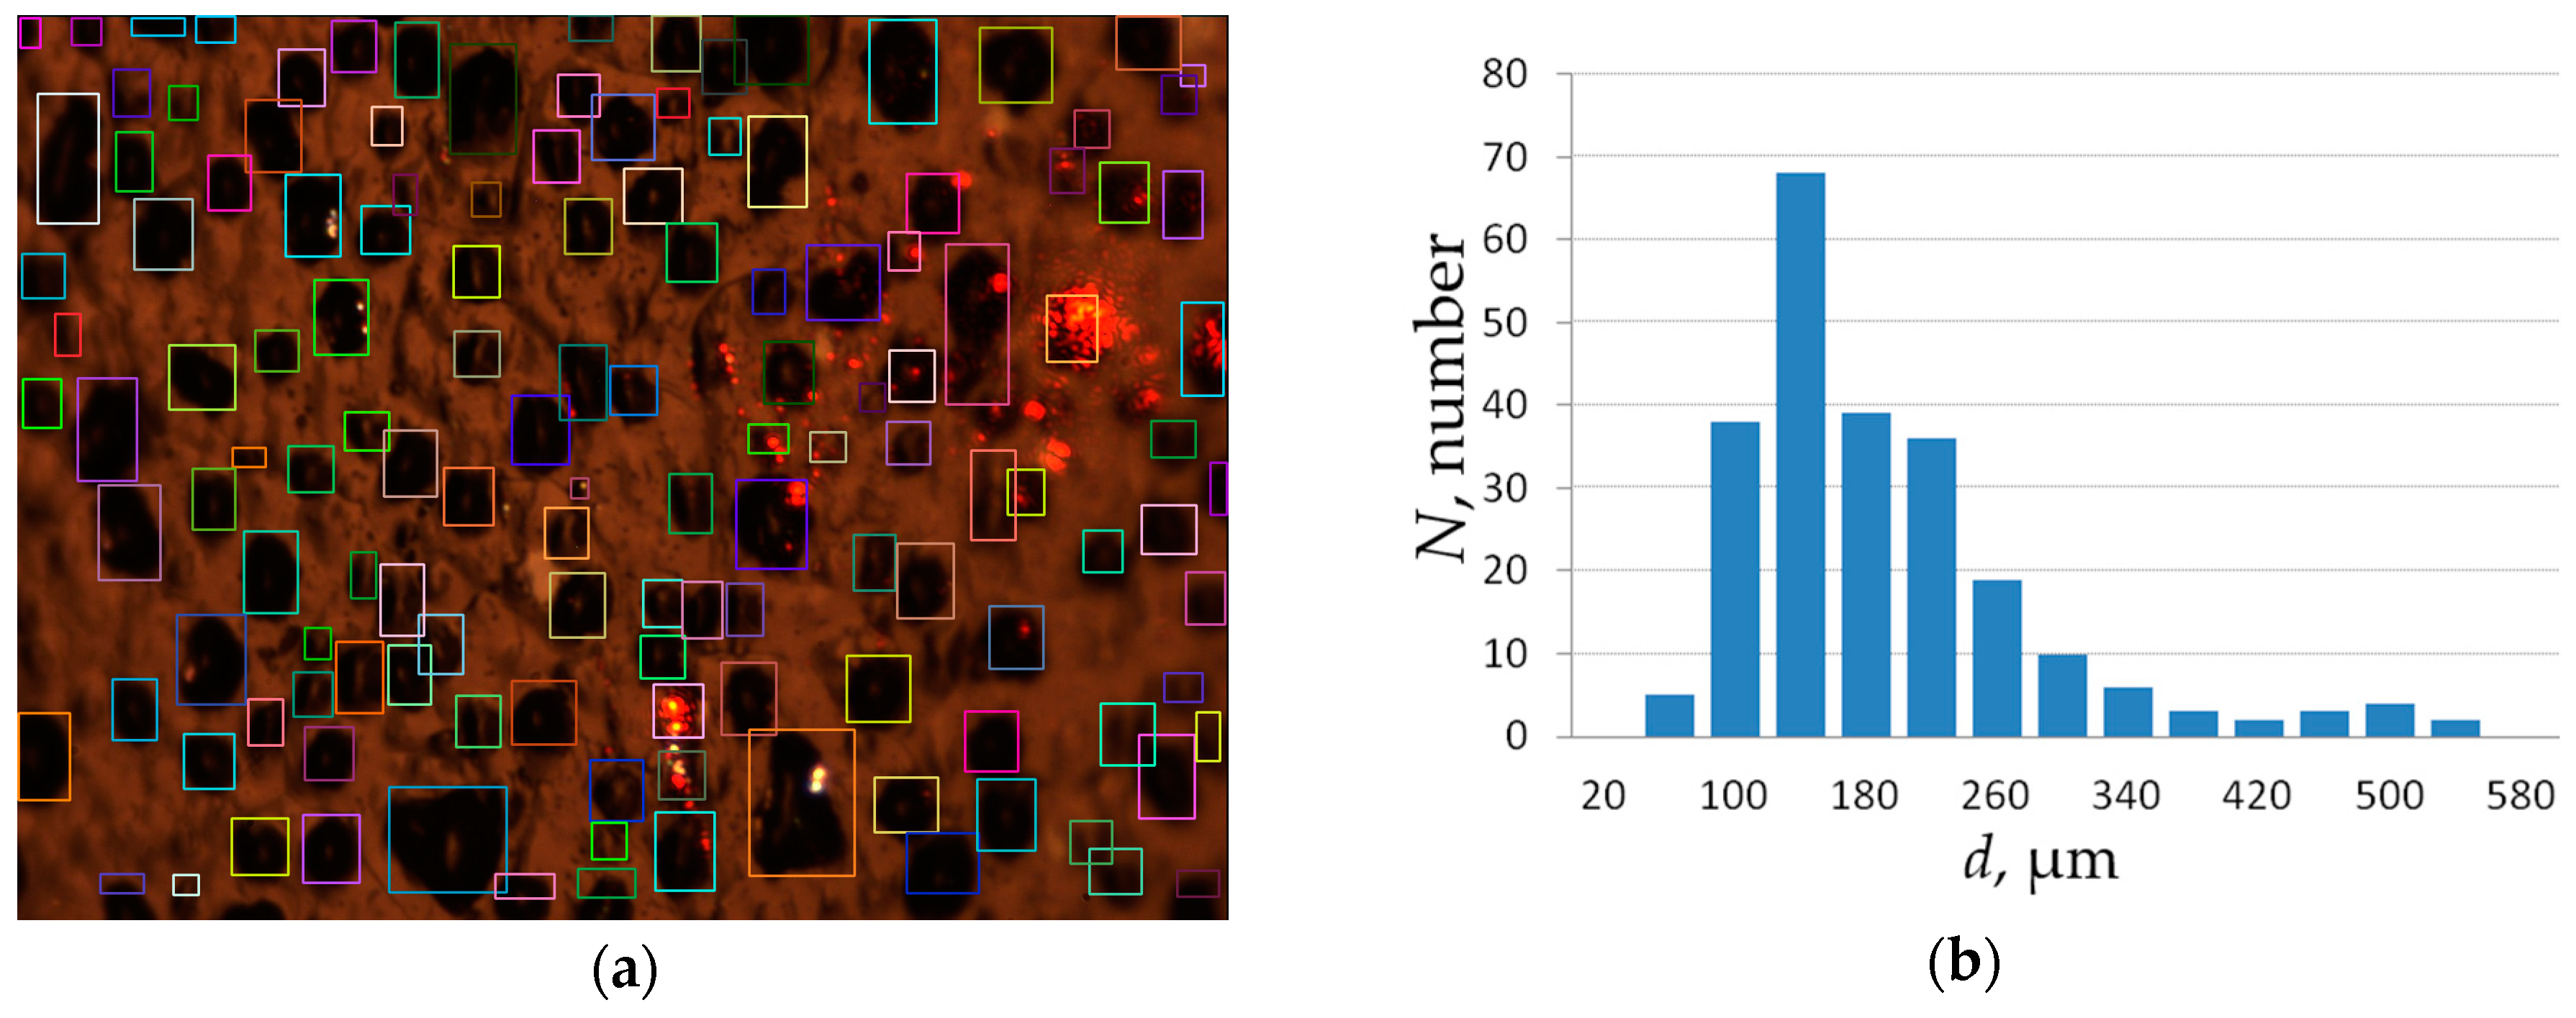
  • The size of the blisters on the copper surface depends on the copper purity. The purer the copper, the larger the blisters are. Blister size ranges from 40 ± 20 to 160 ± 50 μm.
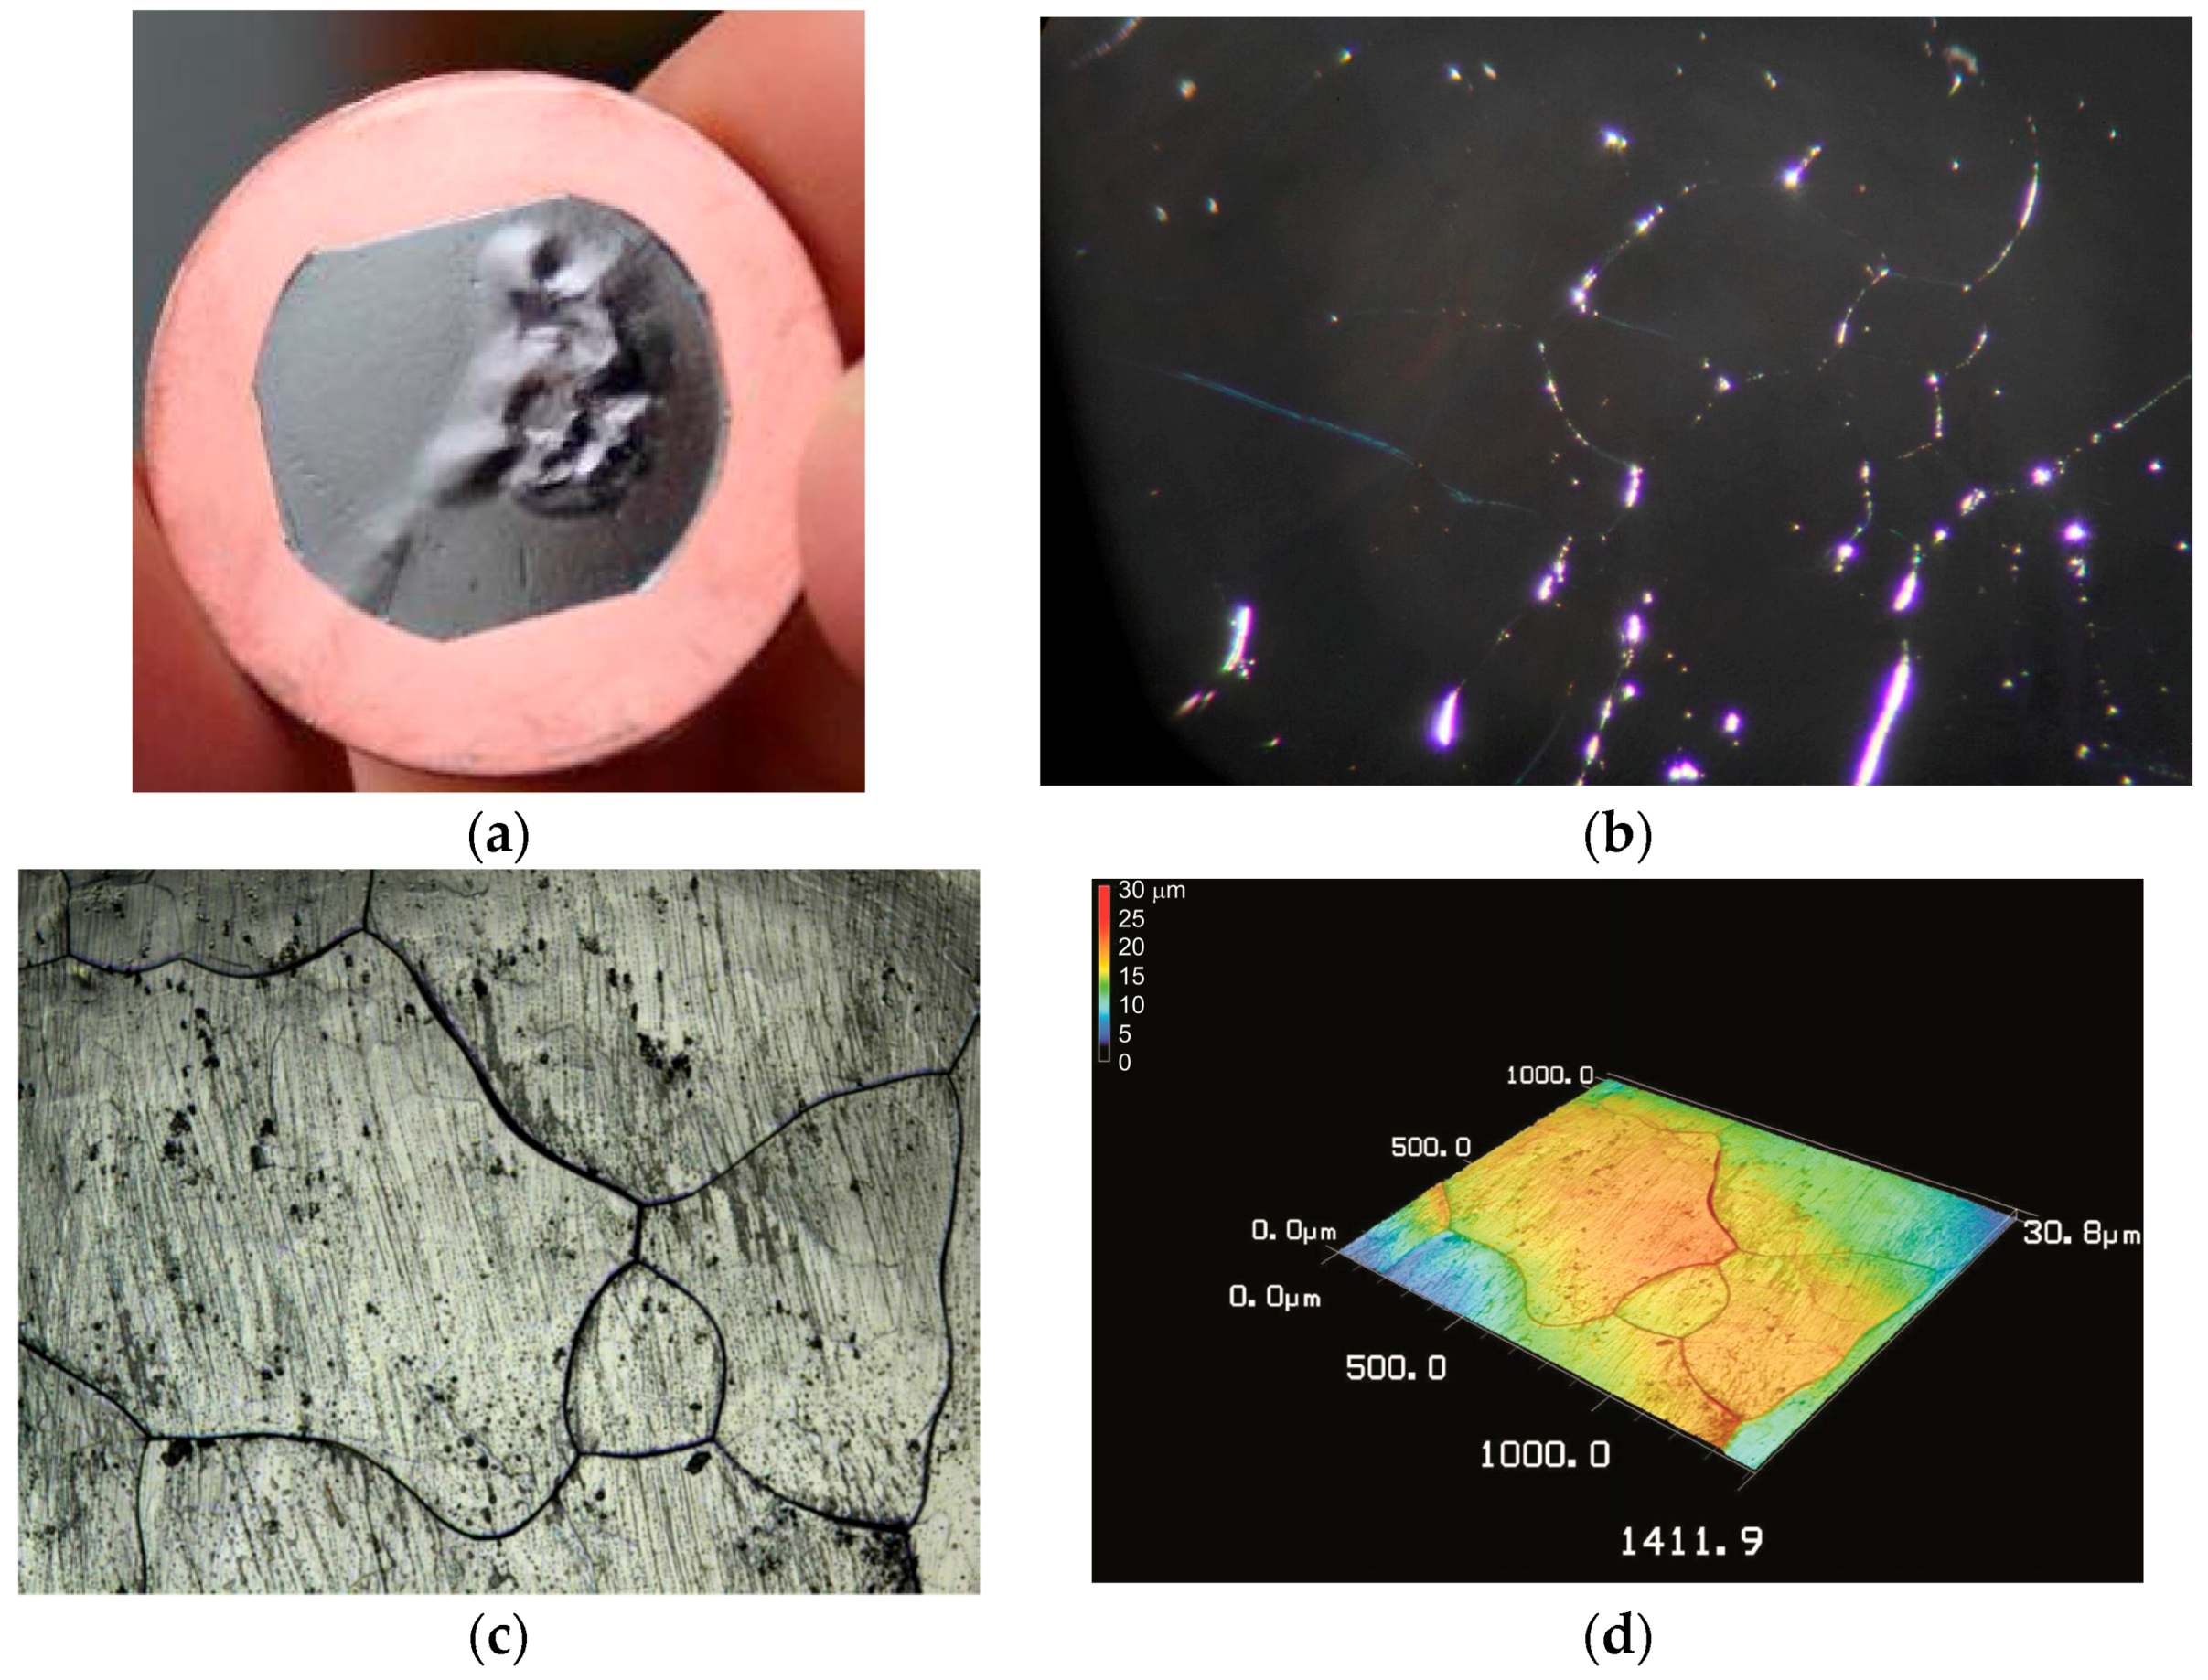
  • No dependence of the blistering threshold on the copper crystallite orientation was found.
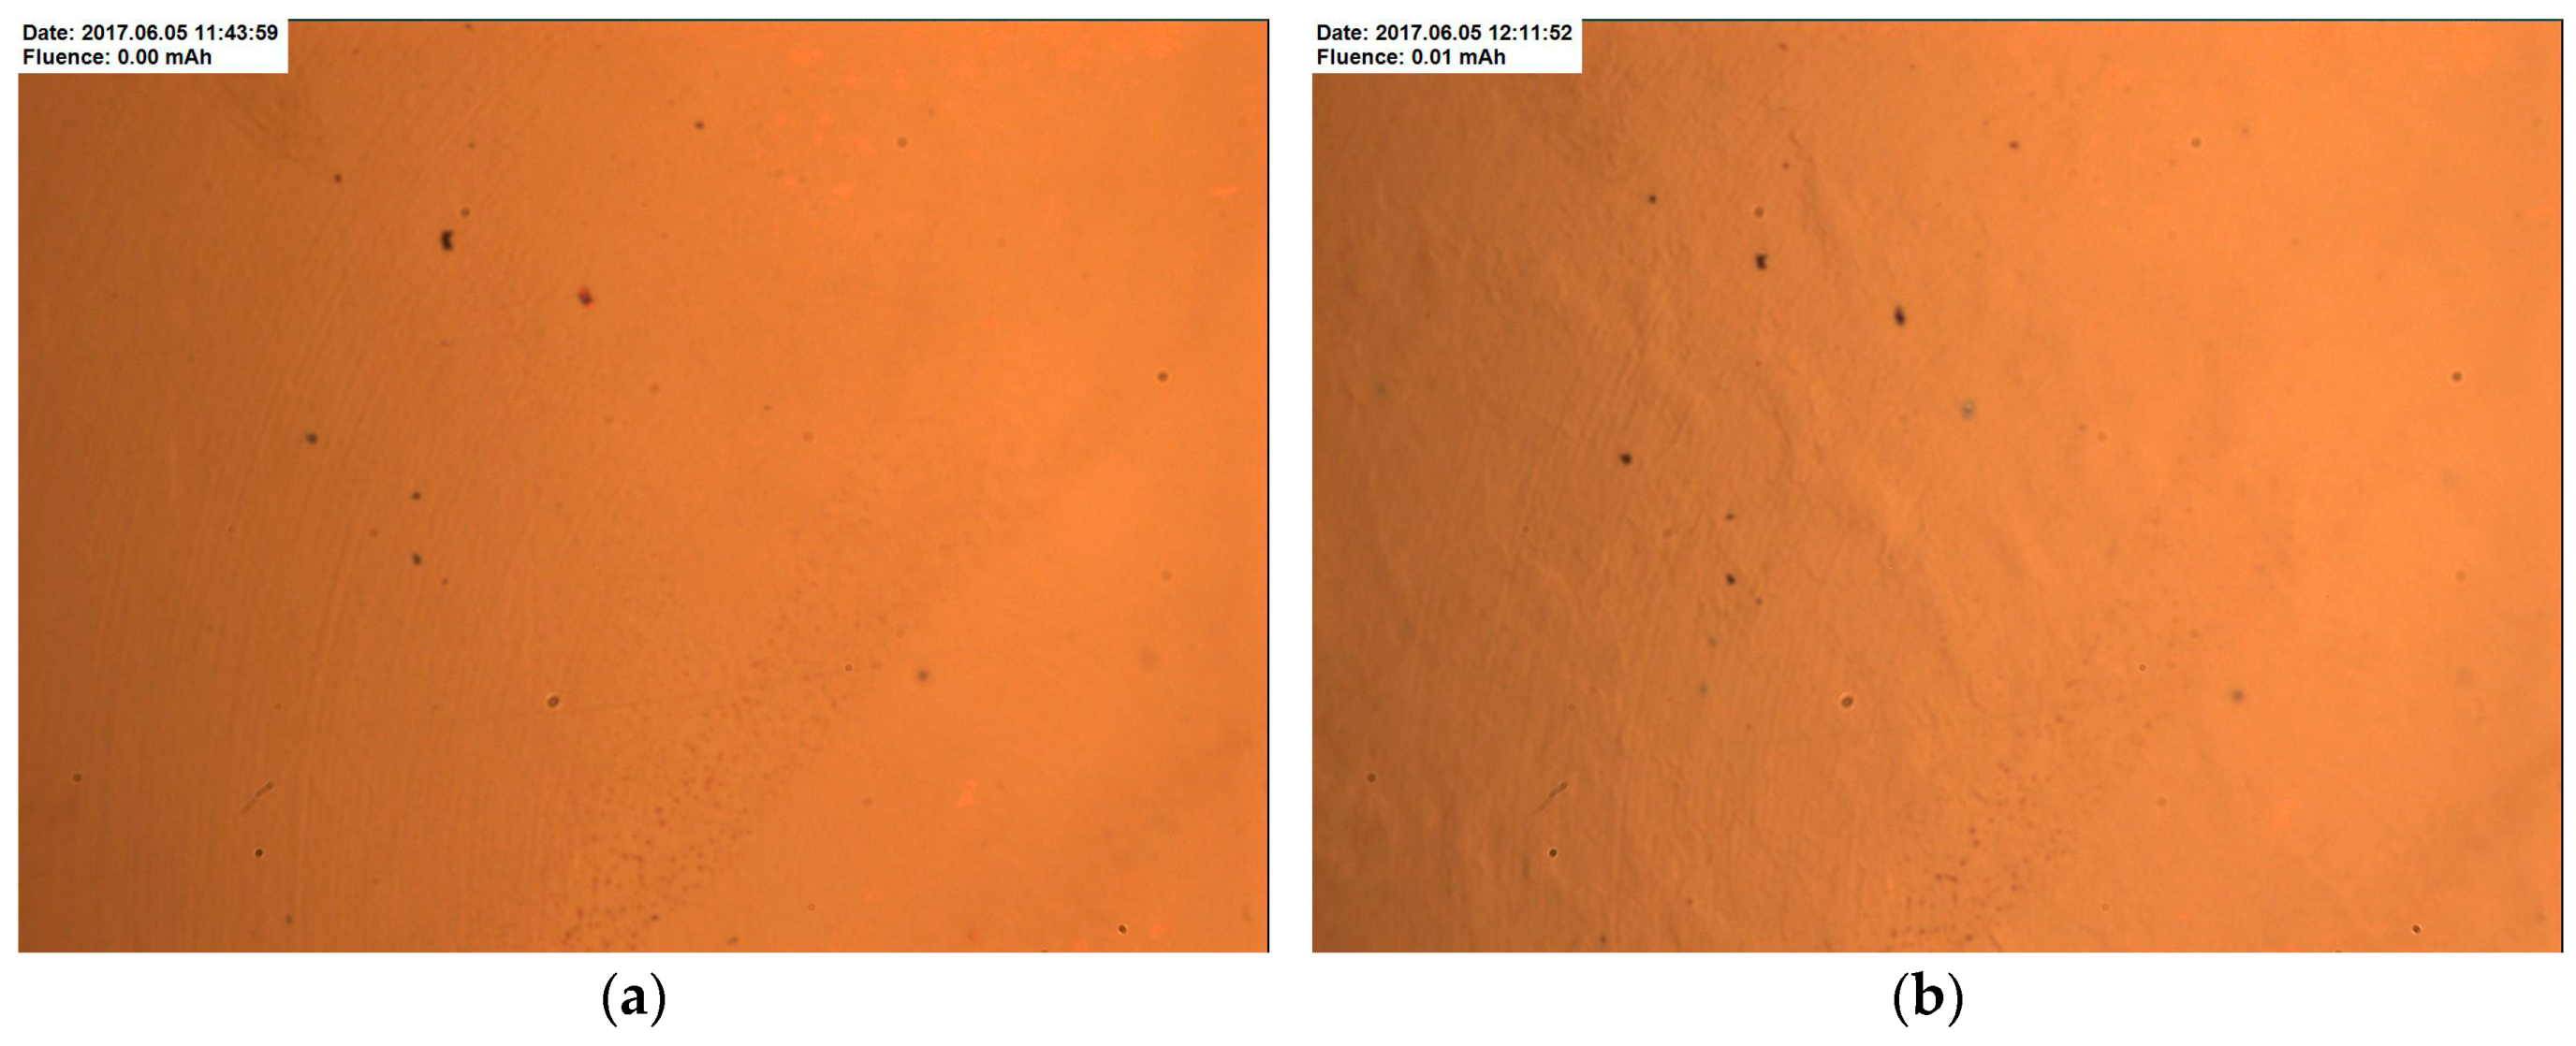
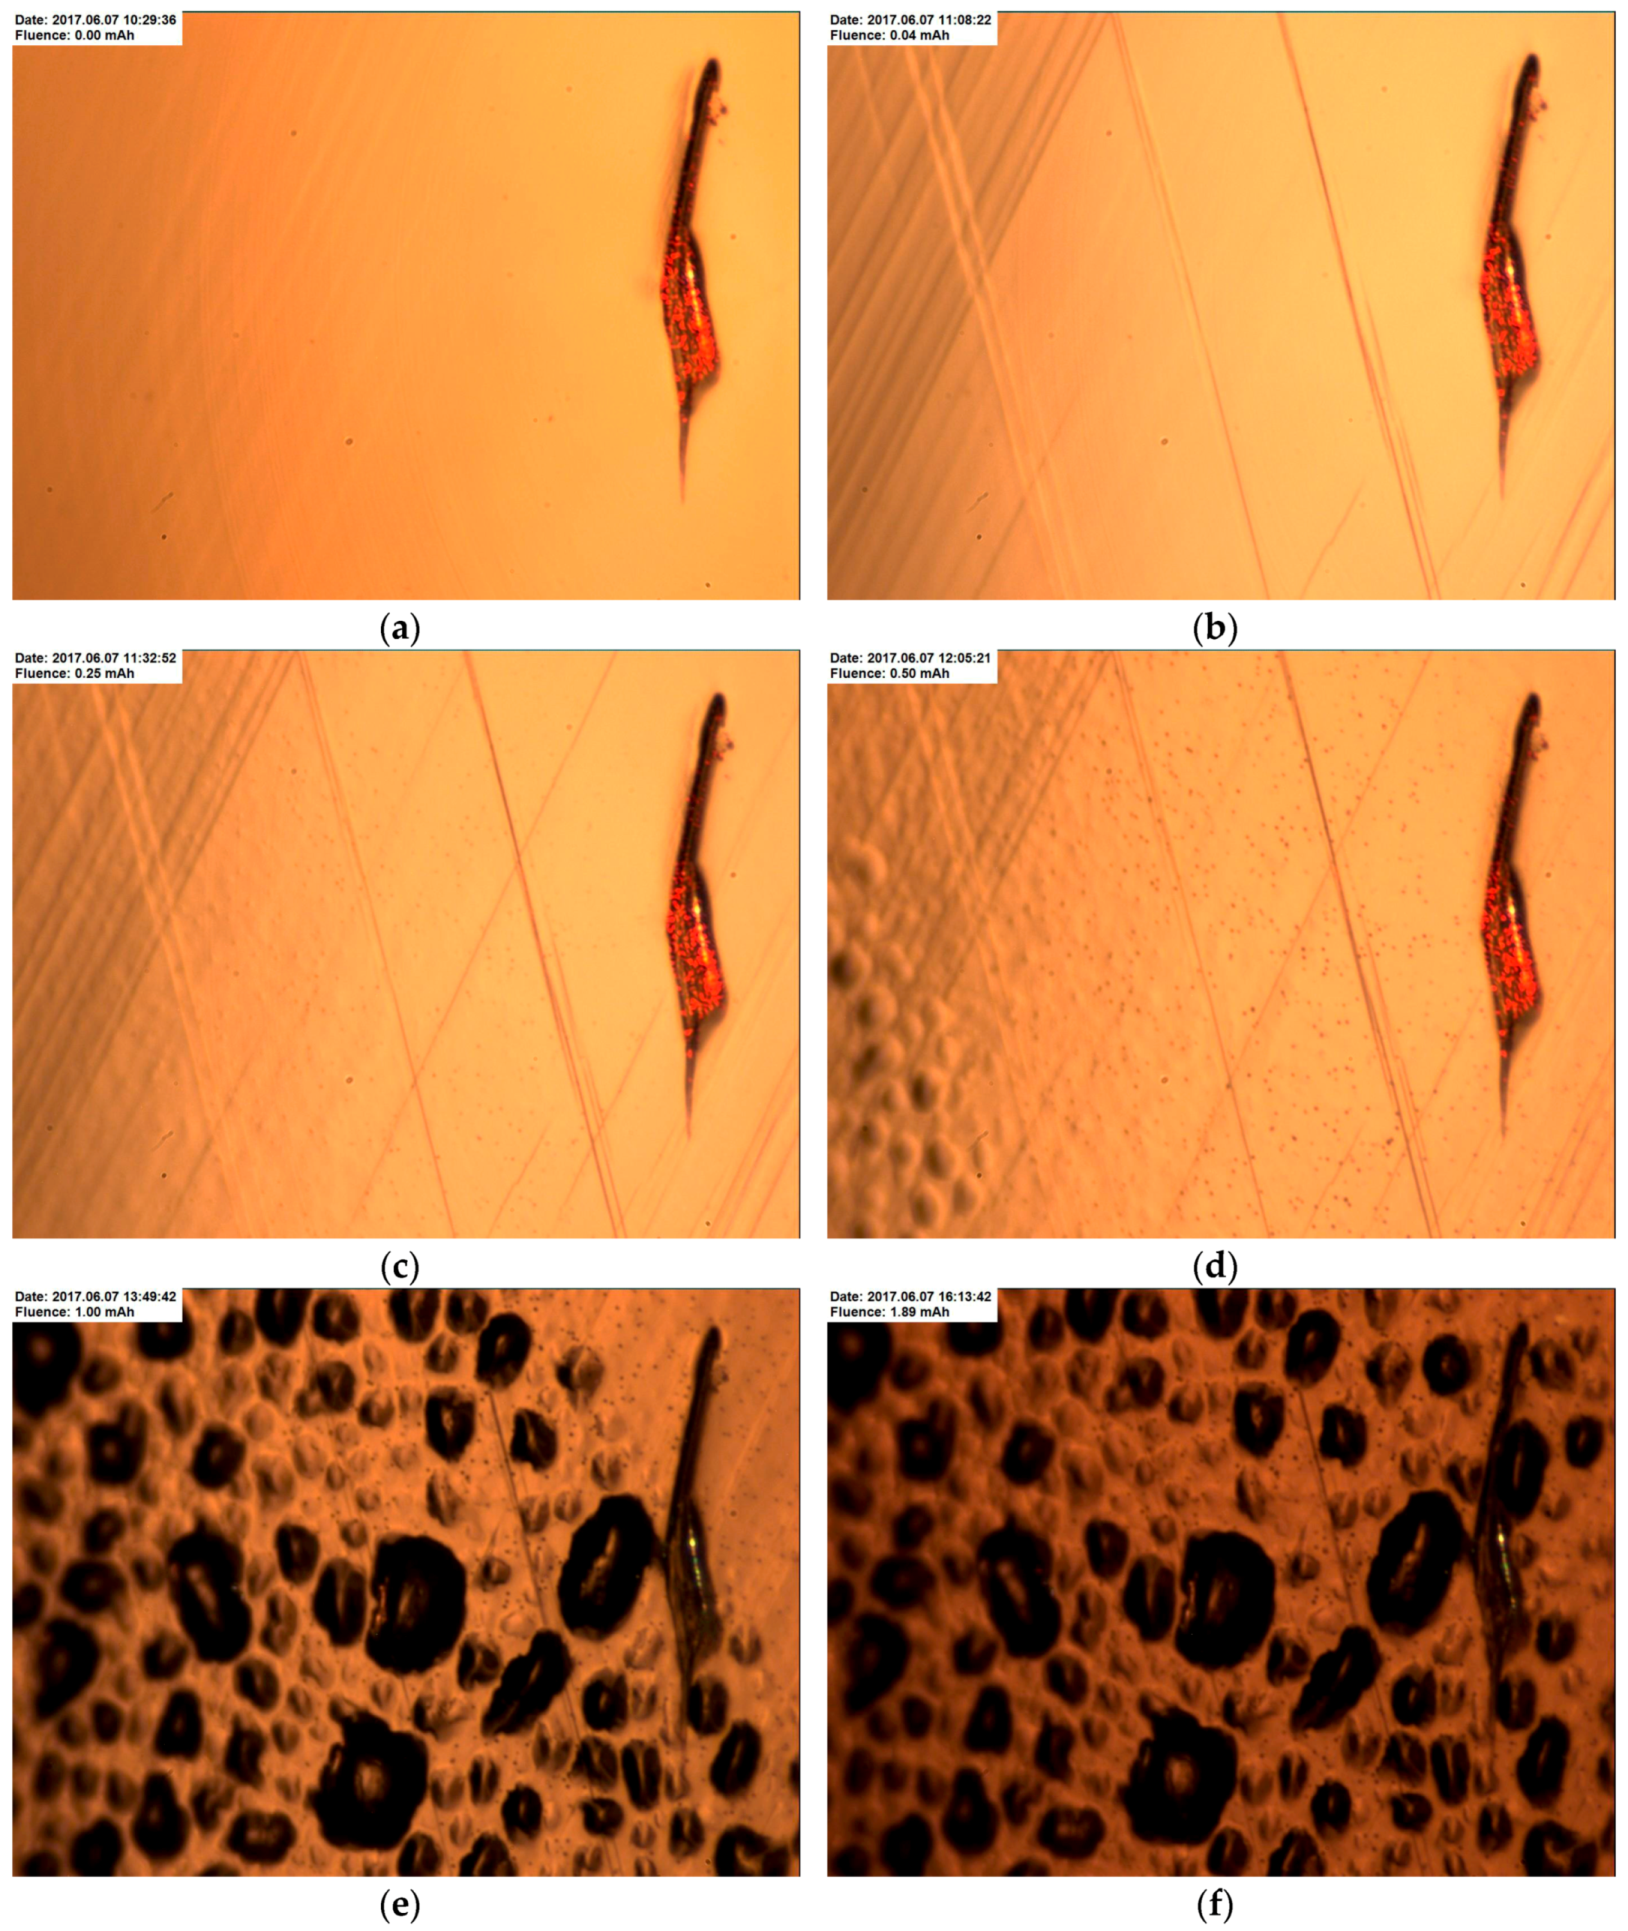
  • Once blisters appear on the copper surface, further irradiation does not cause any more surface modification, which can be due to the formation of holes and cracks when blisters emerge.
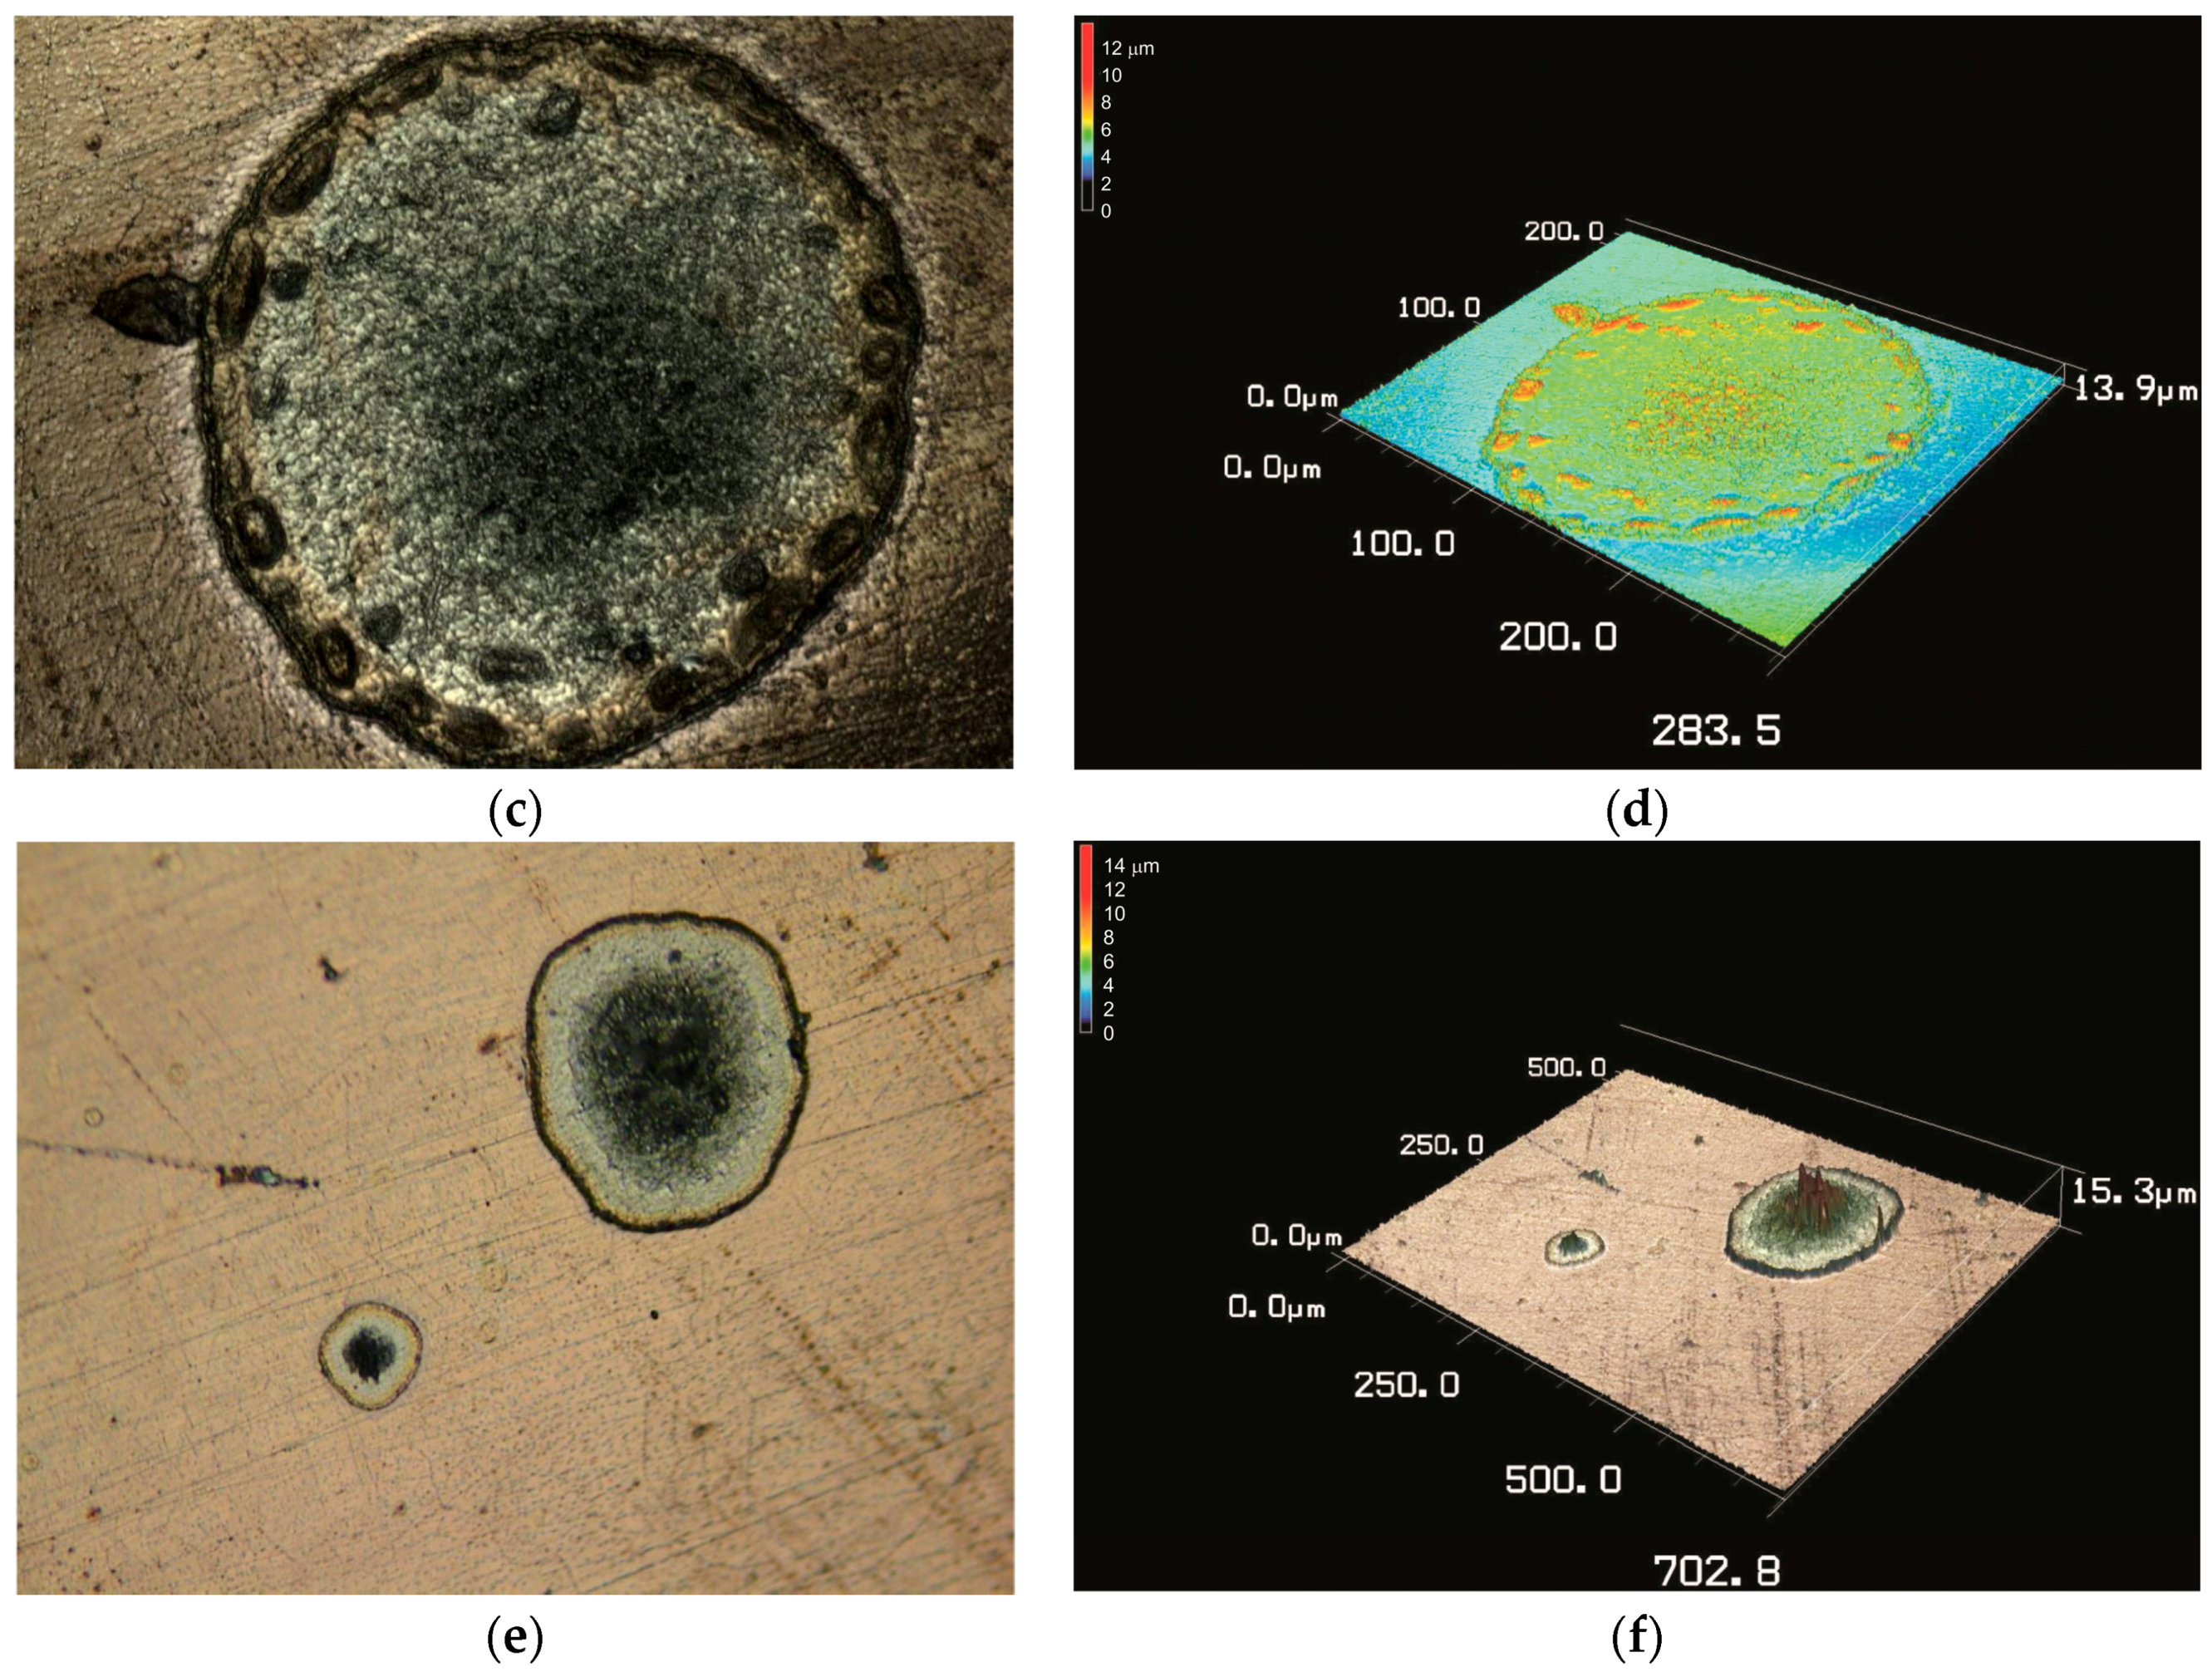
  • The attachment of a thin tantalum foil to copper by explosion or diffusion welding as well as soldering is resistant to a heat load of up to 1 kW/cm2.
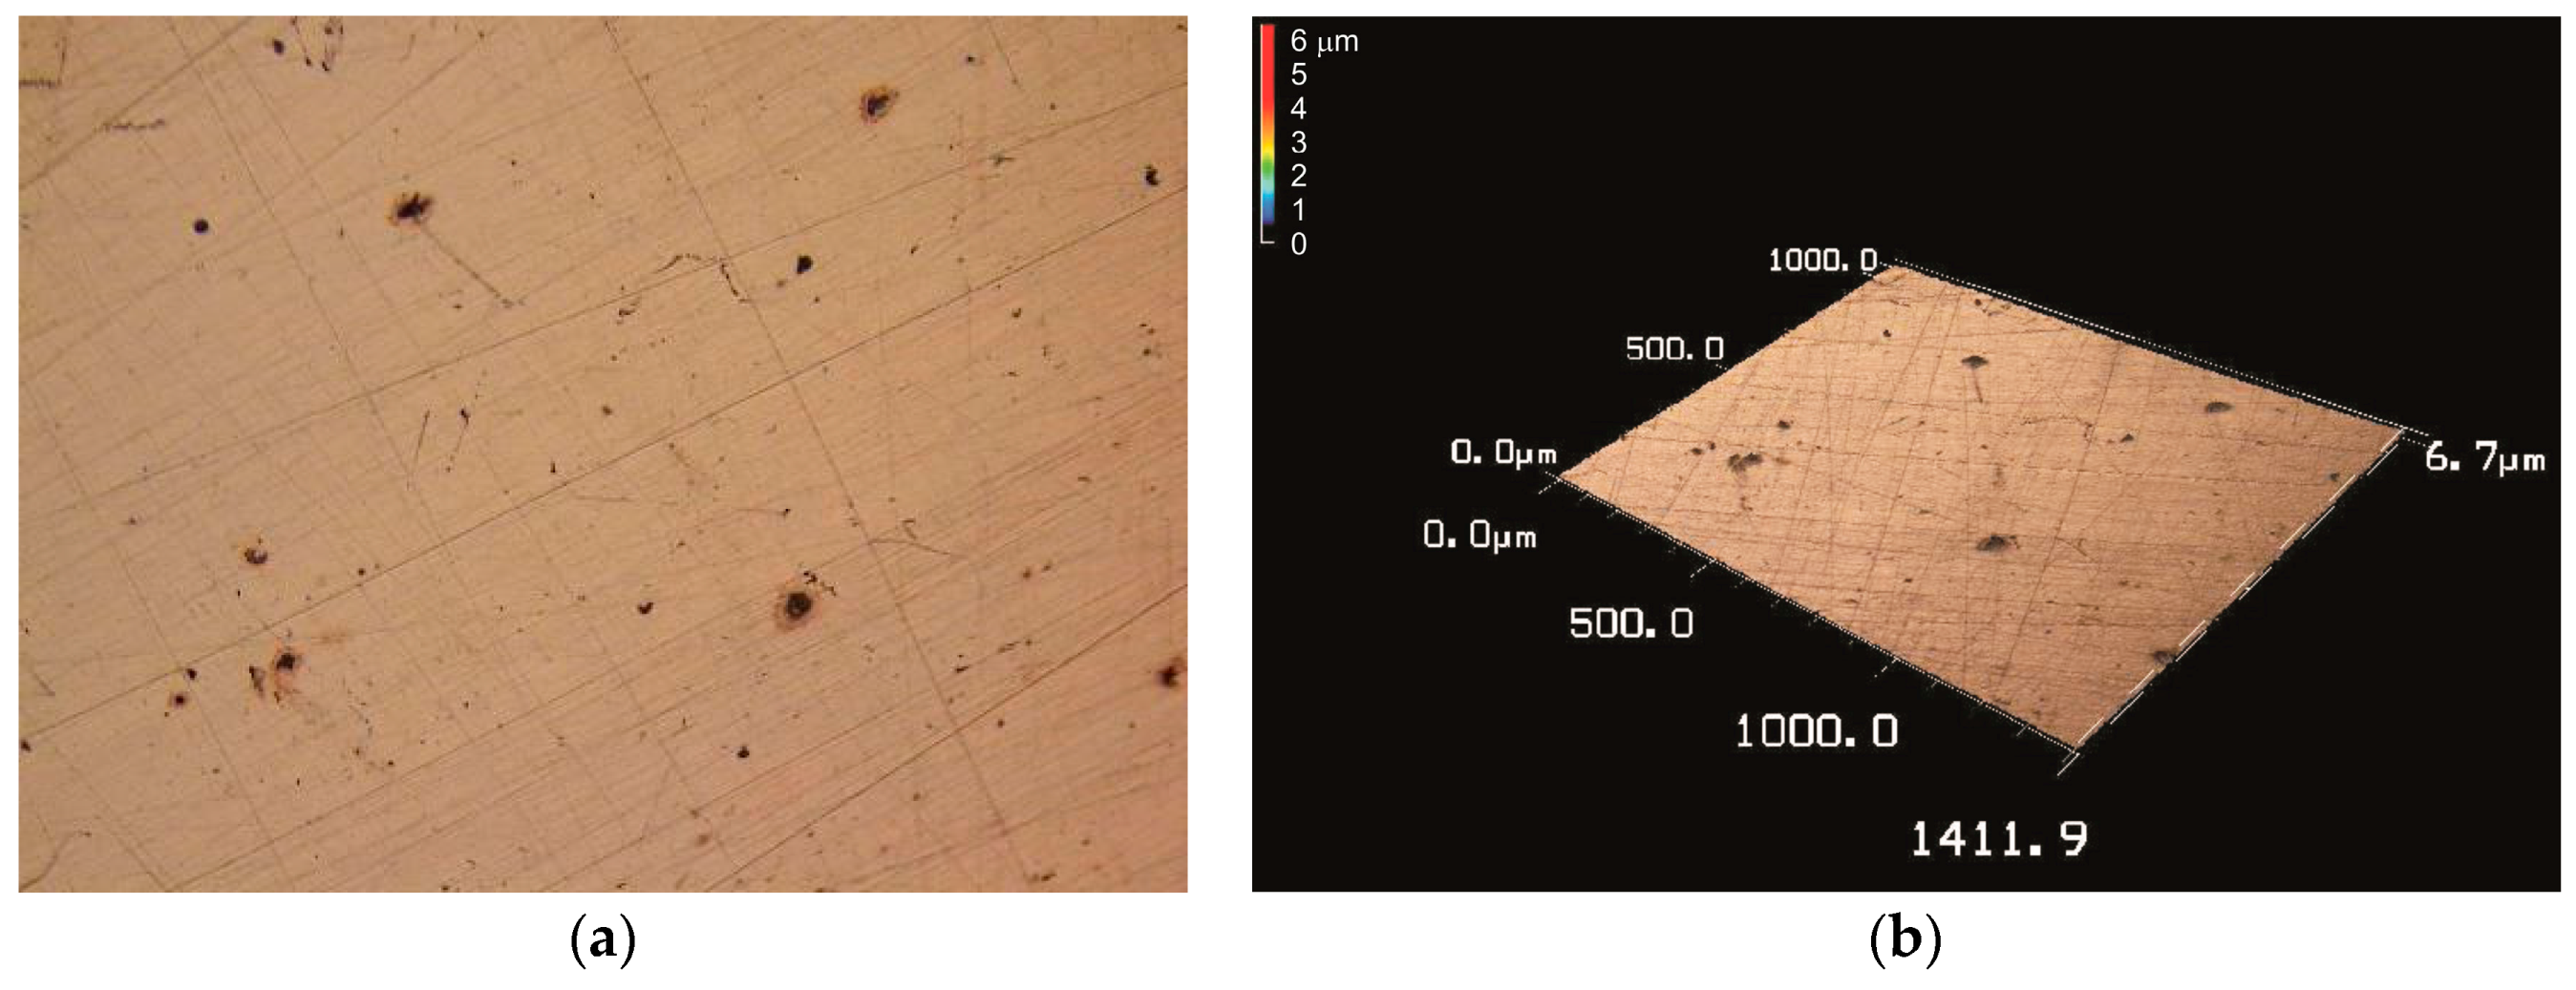
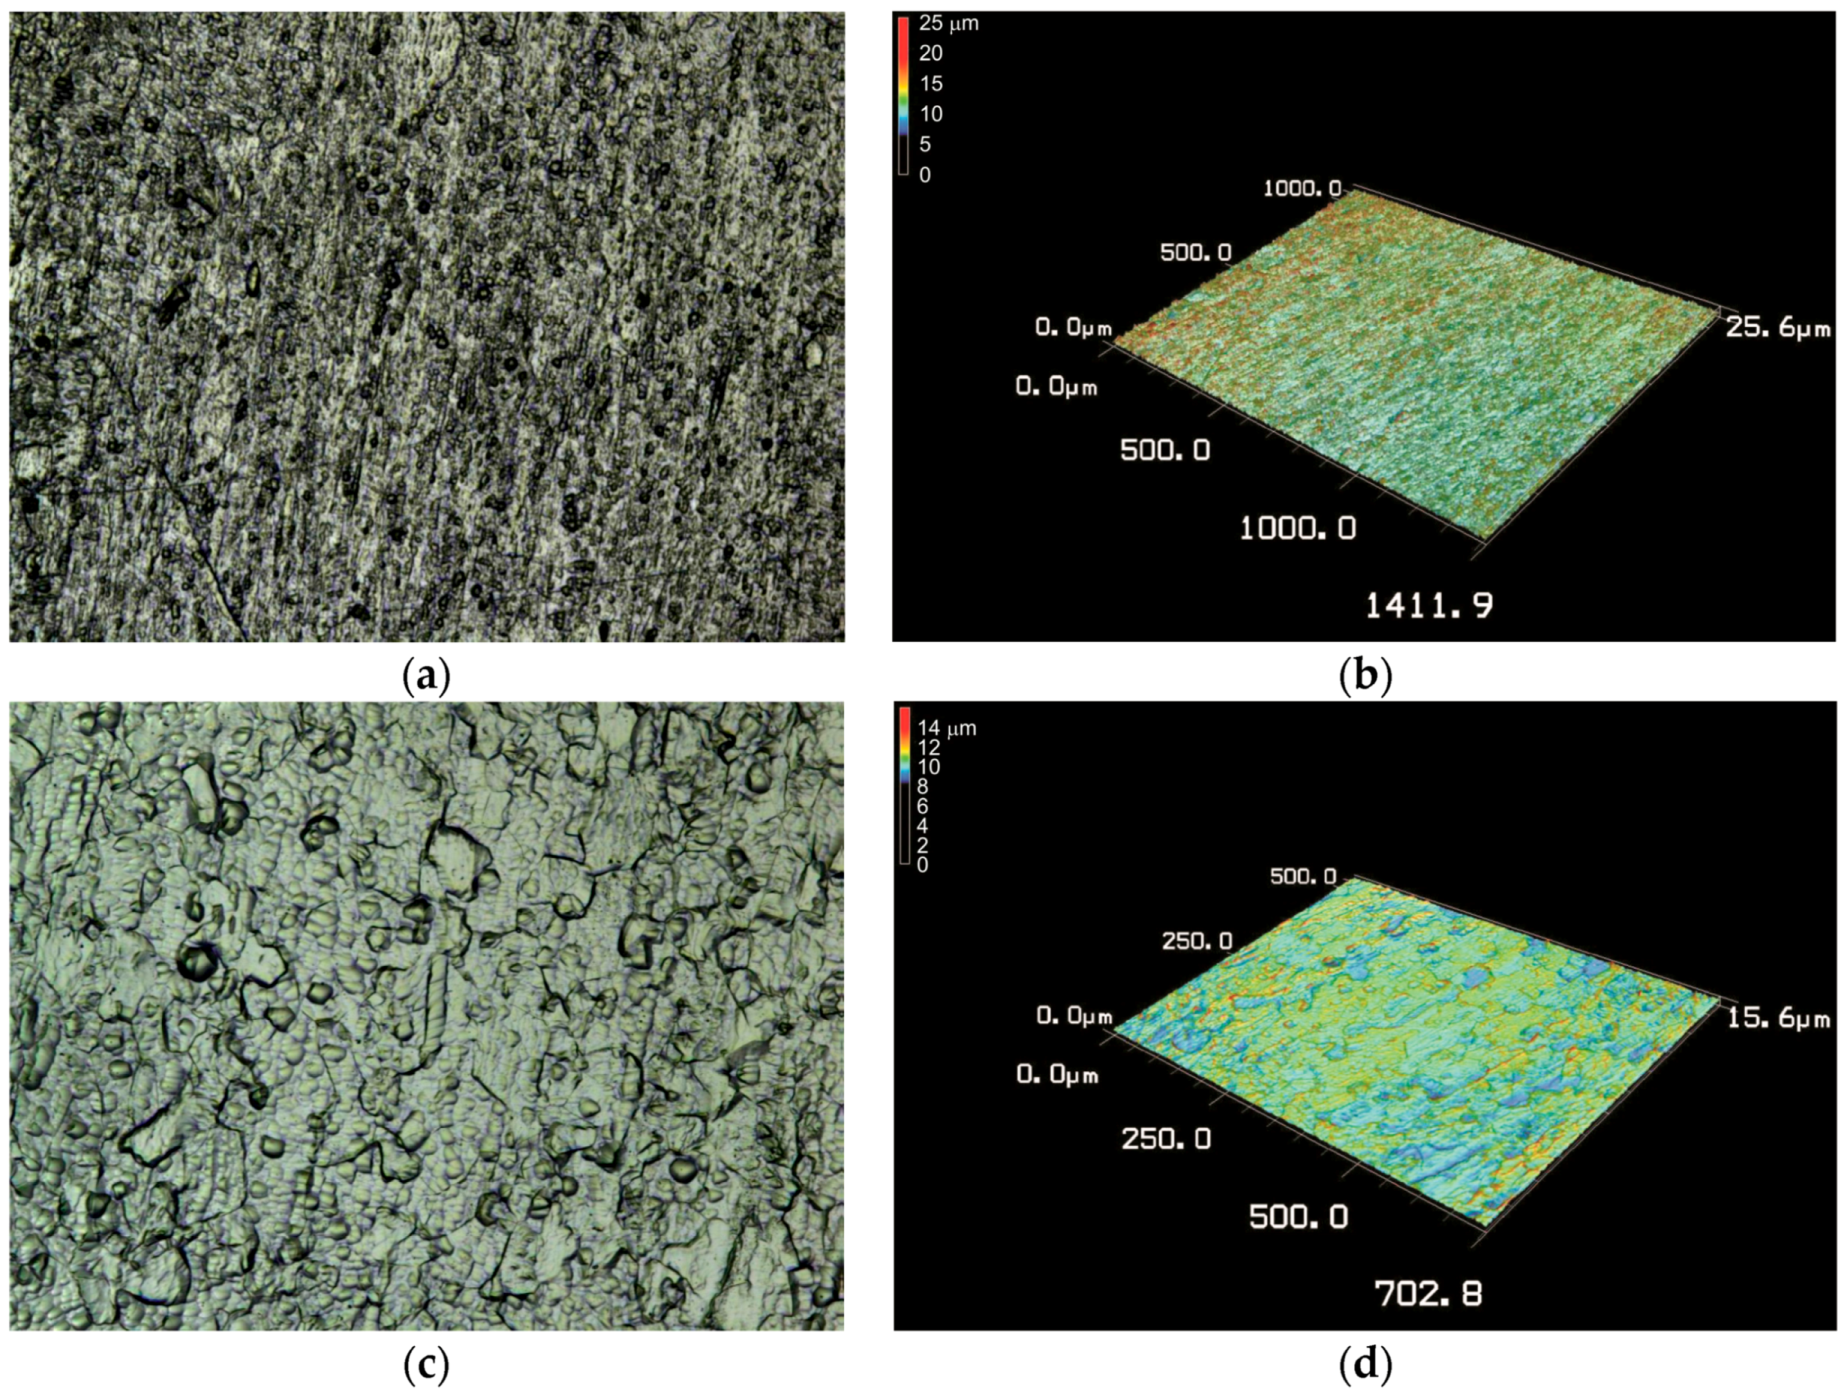
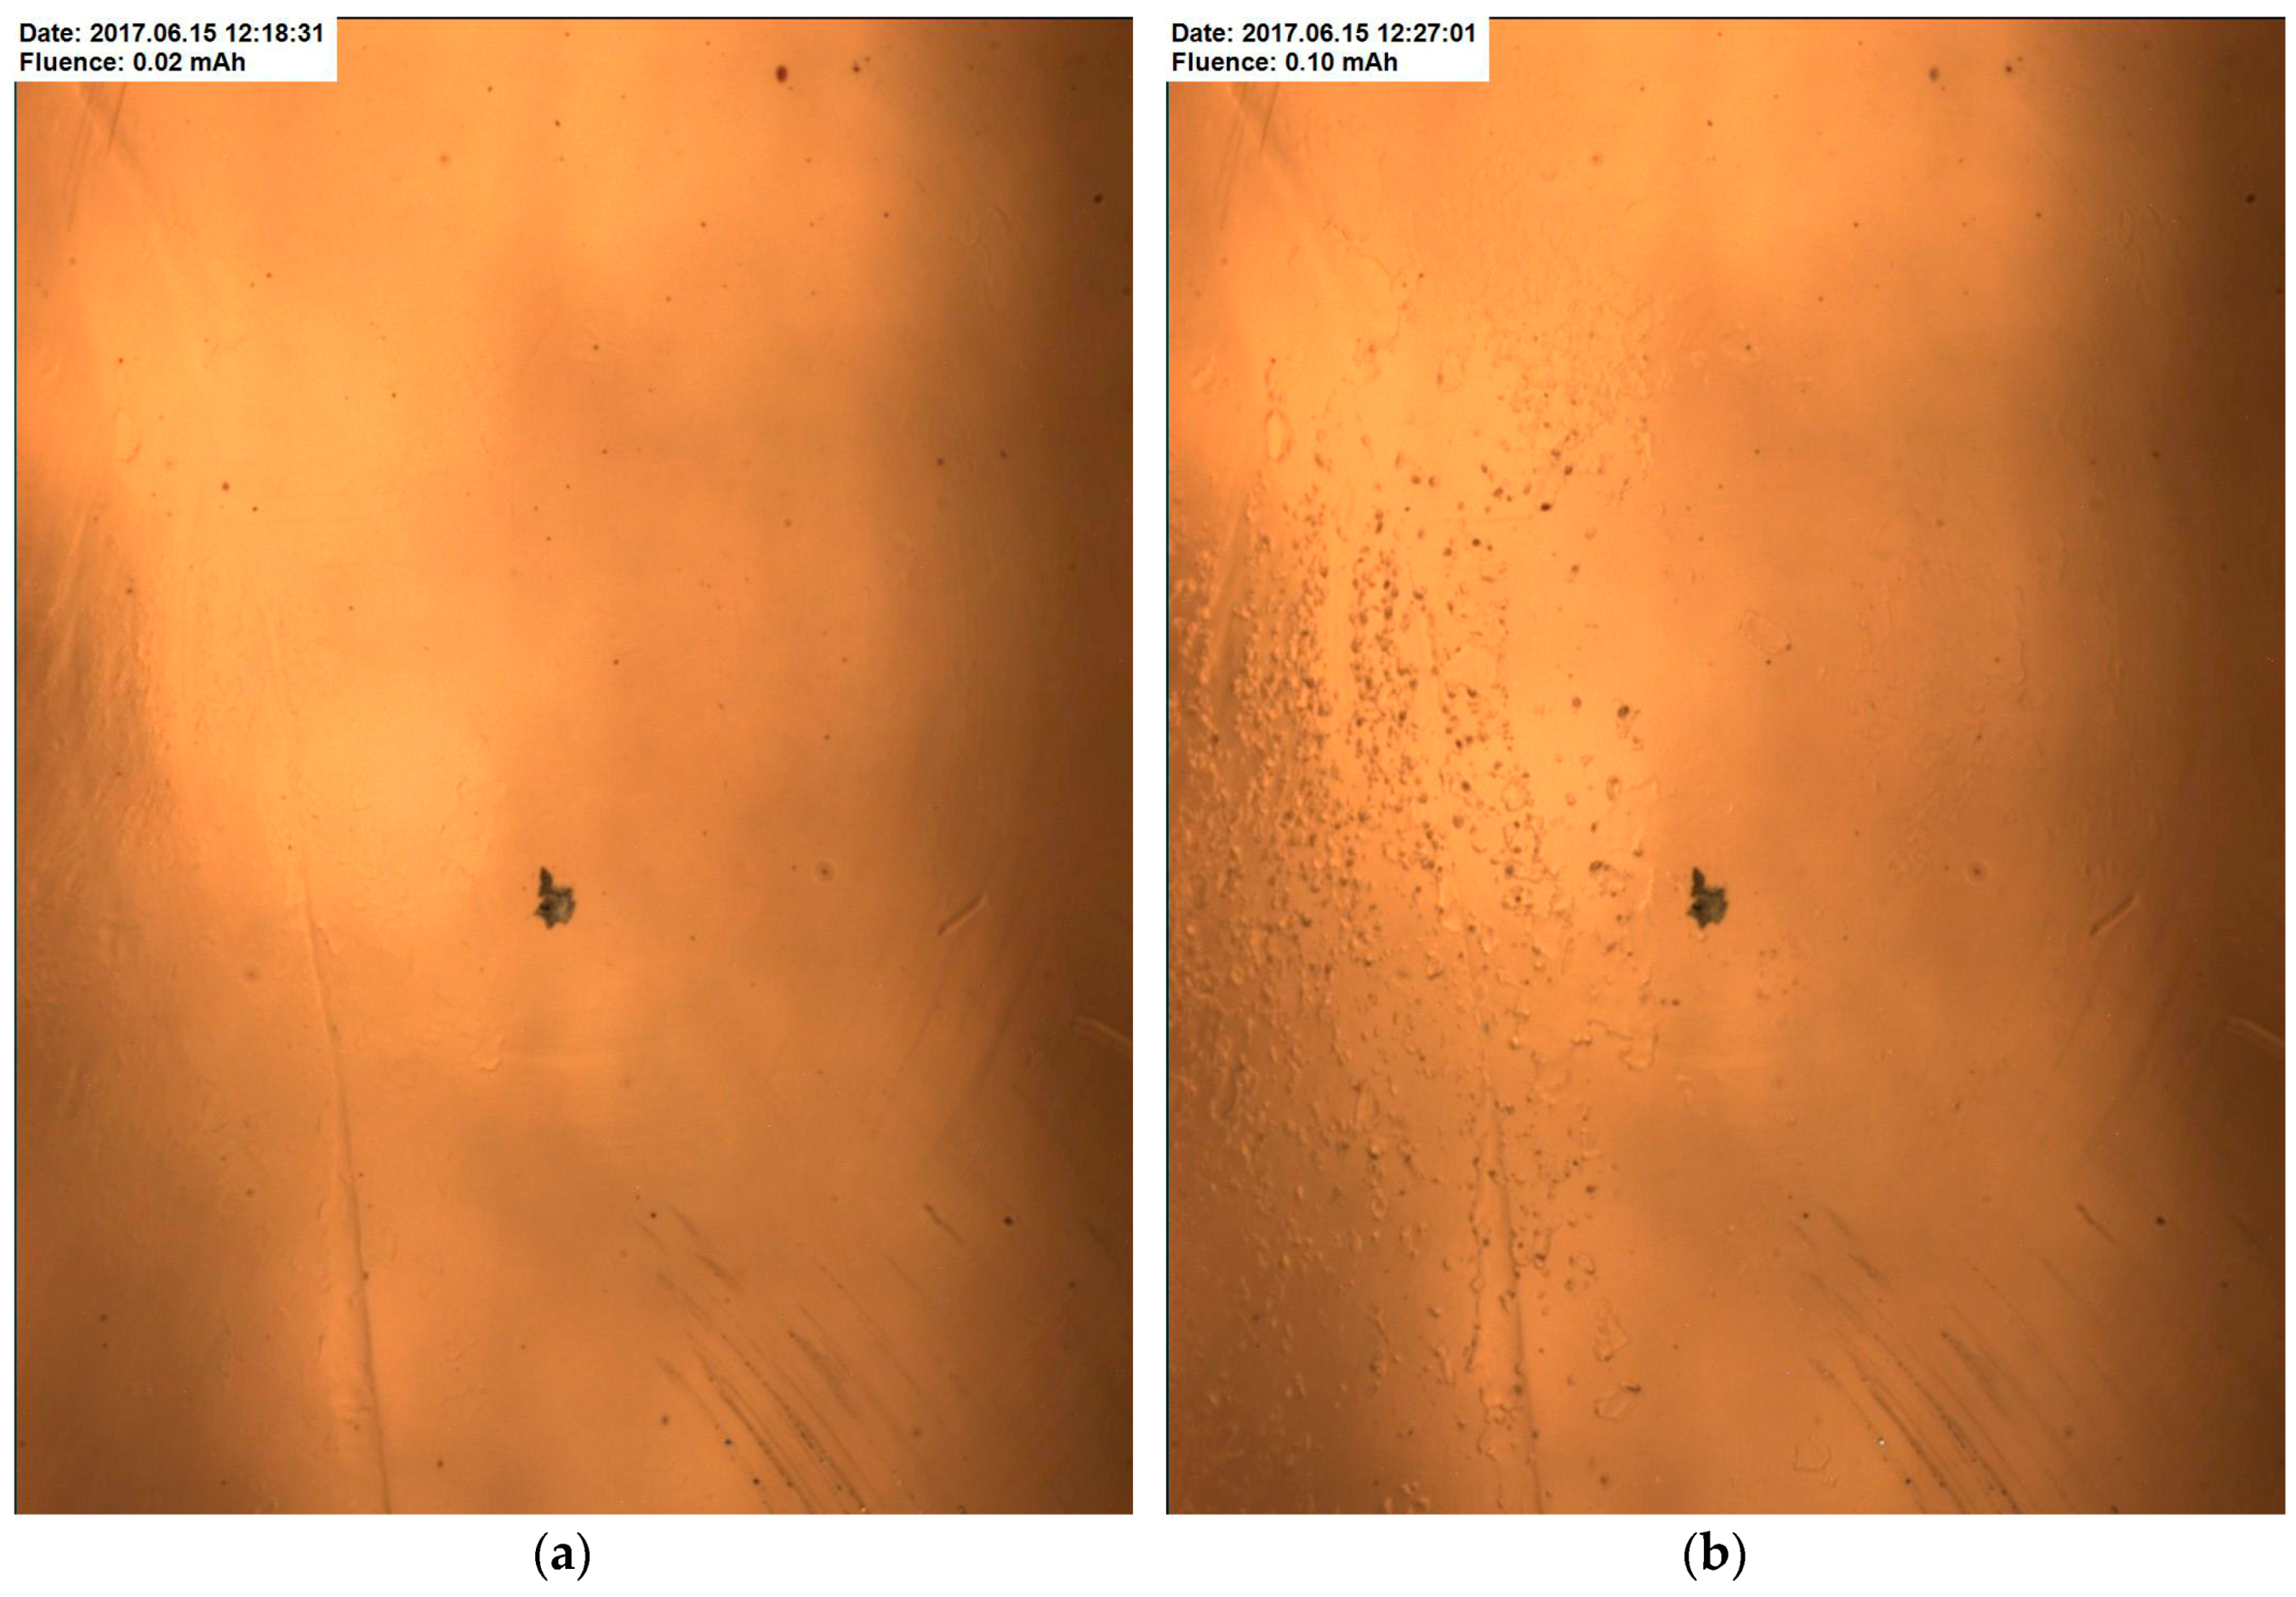
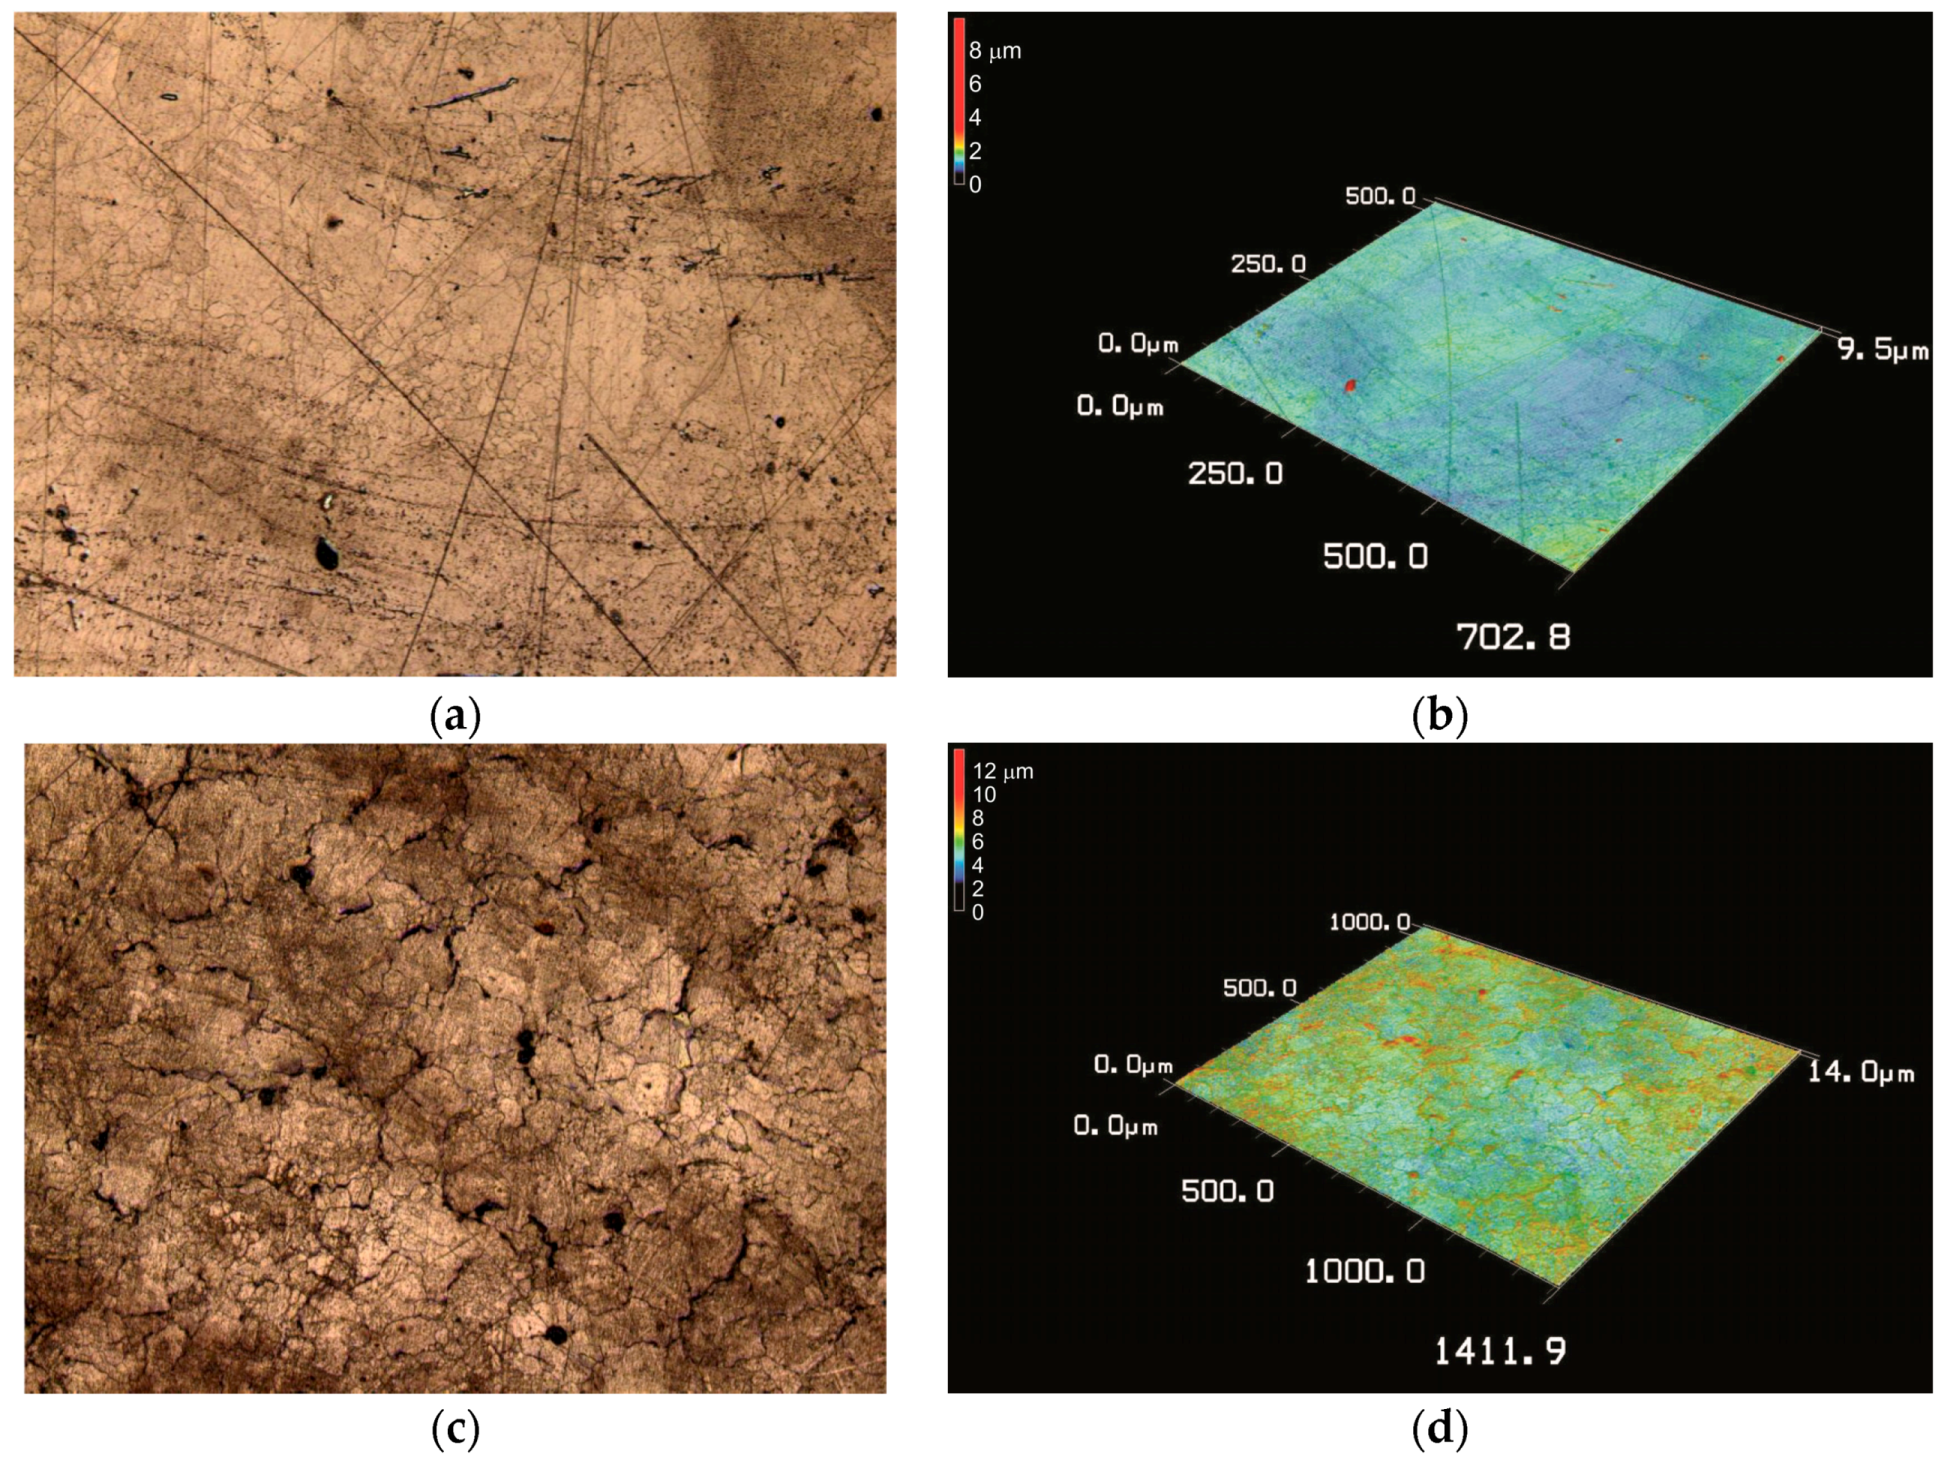
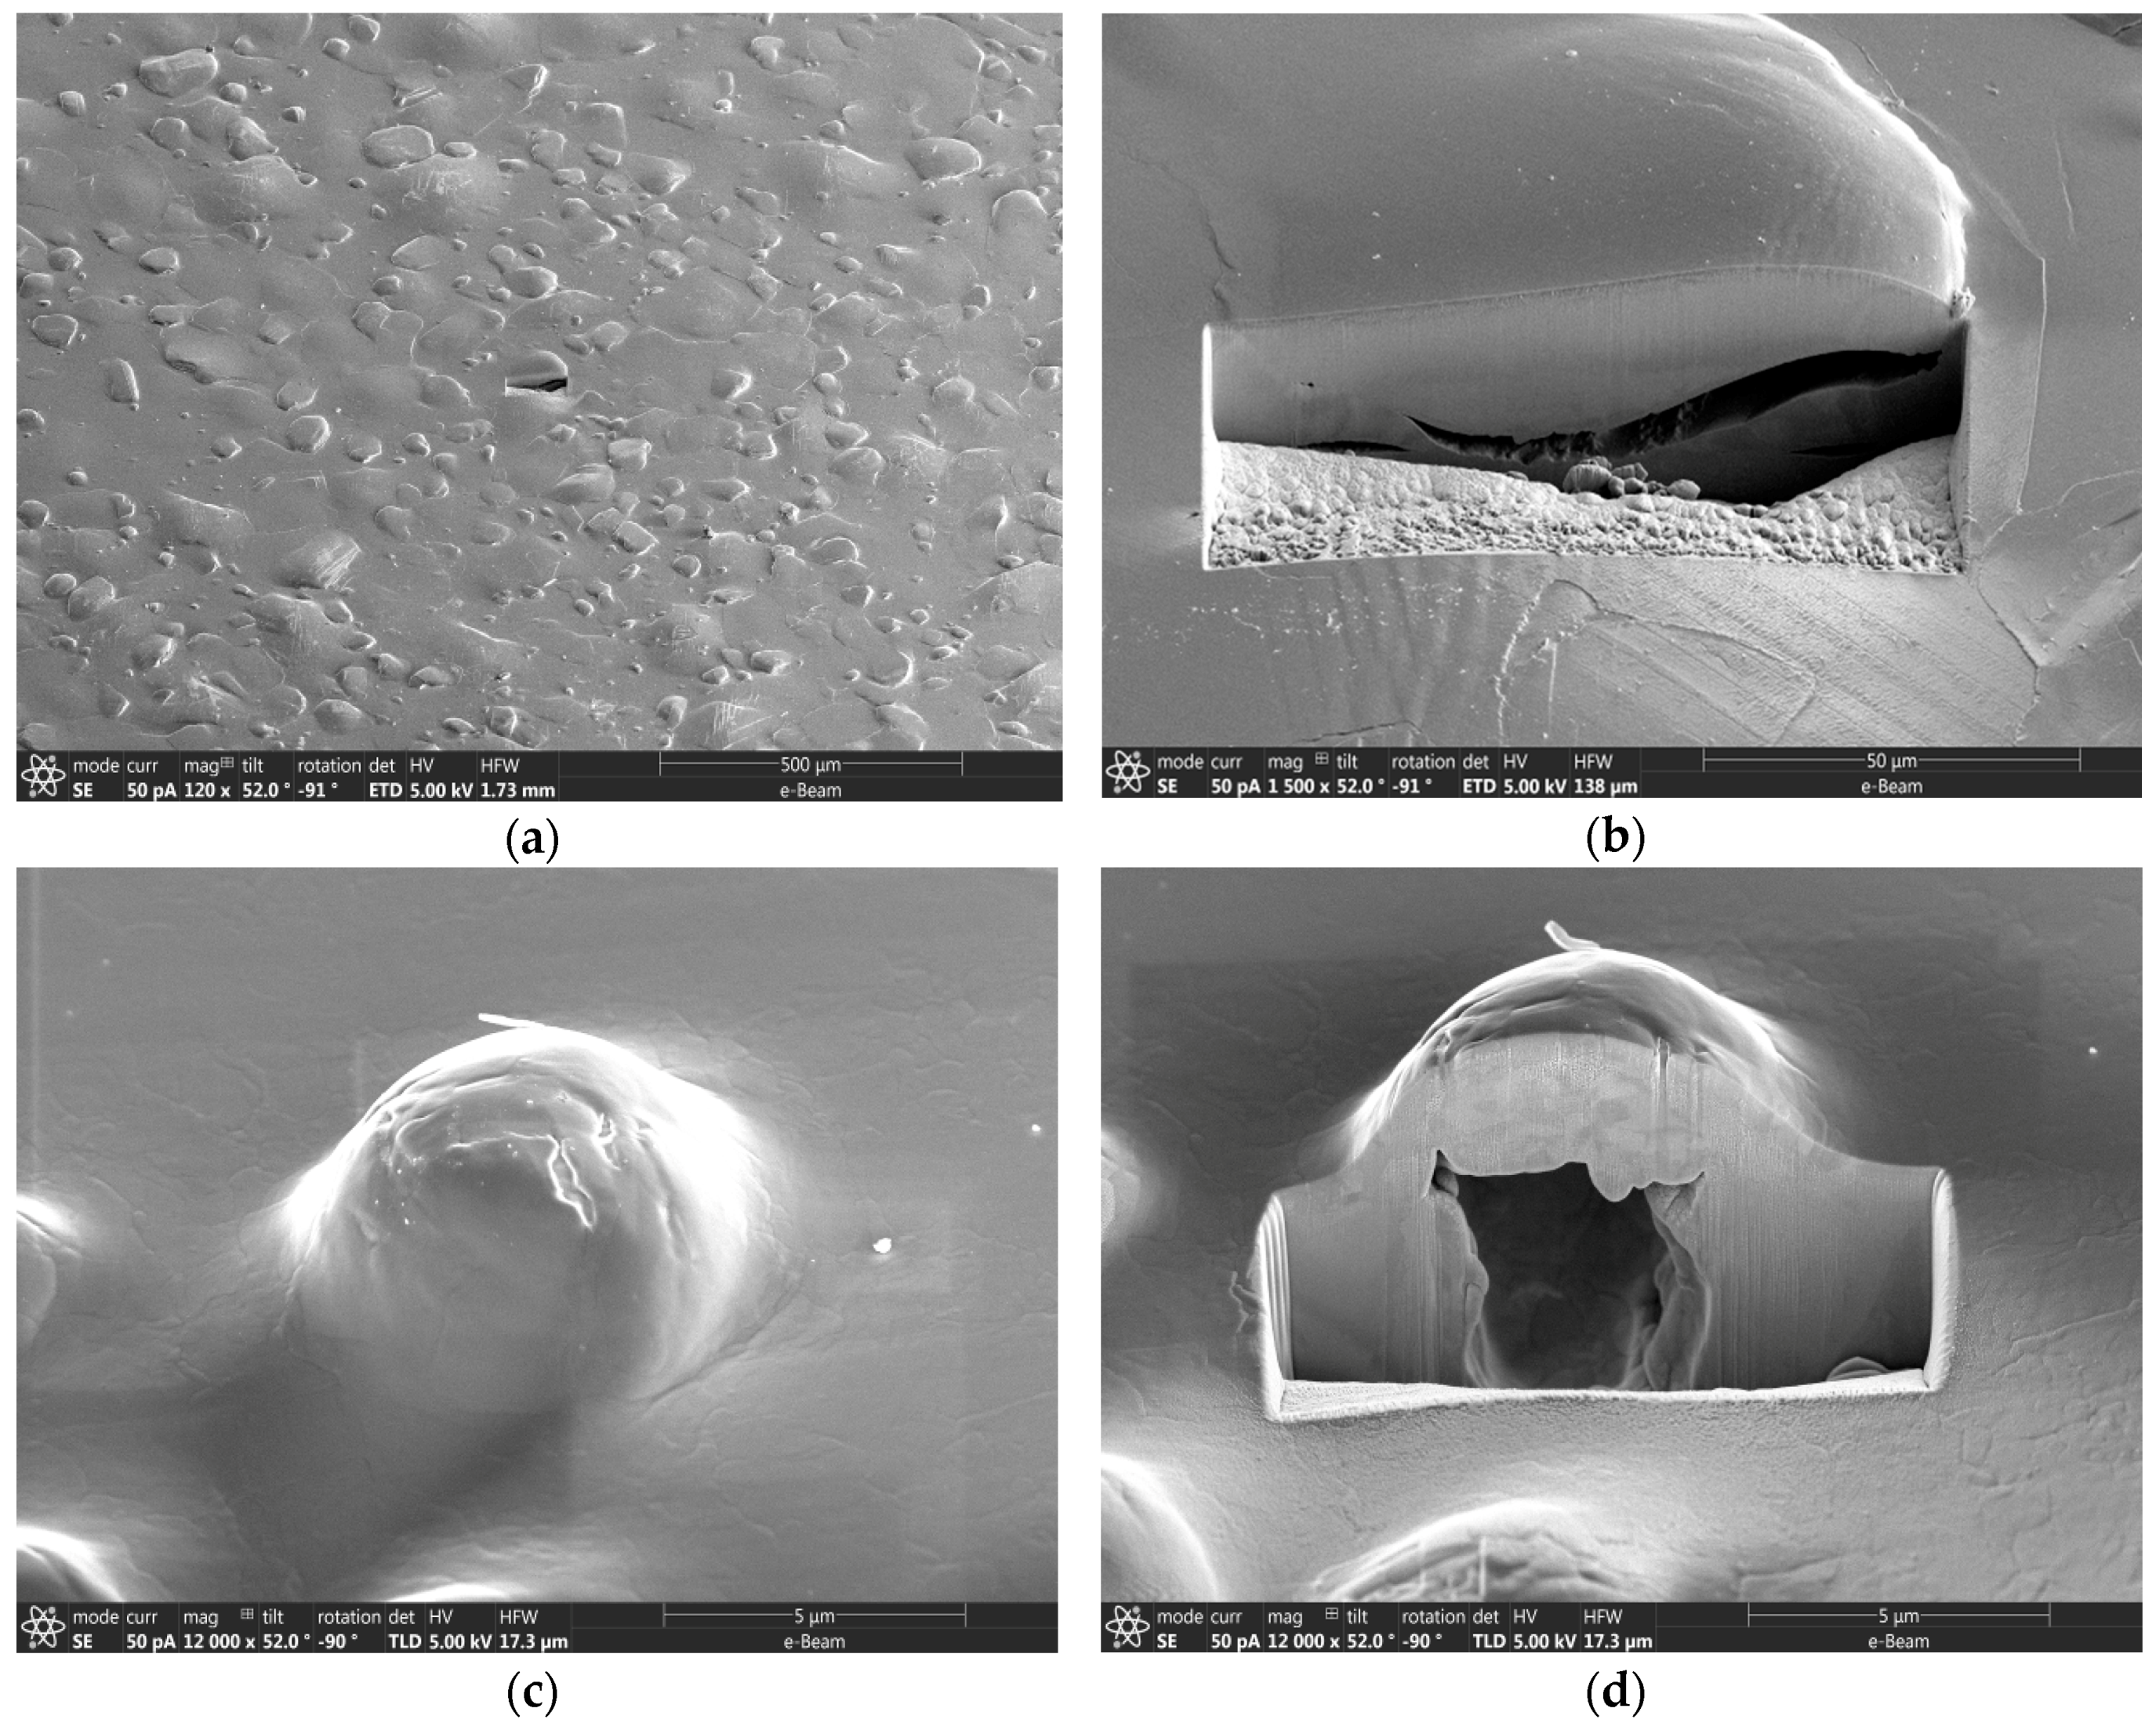
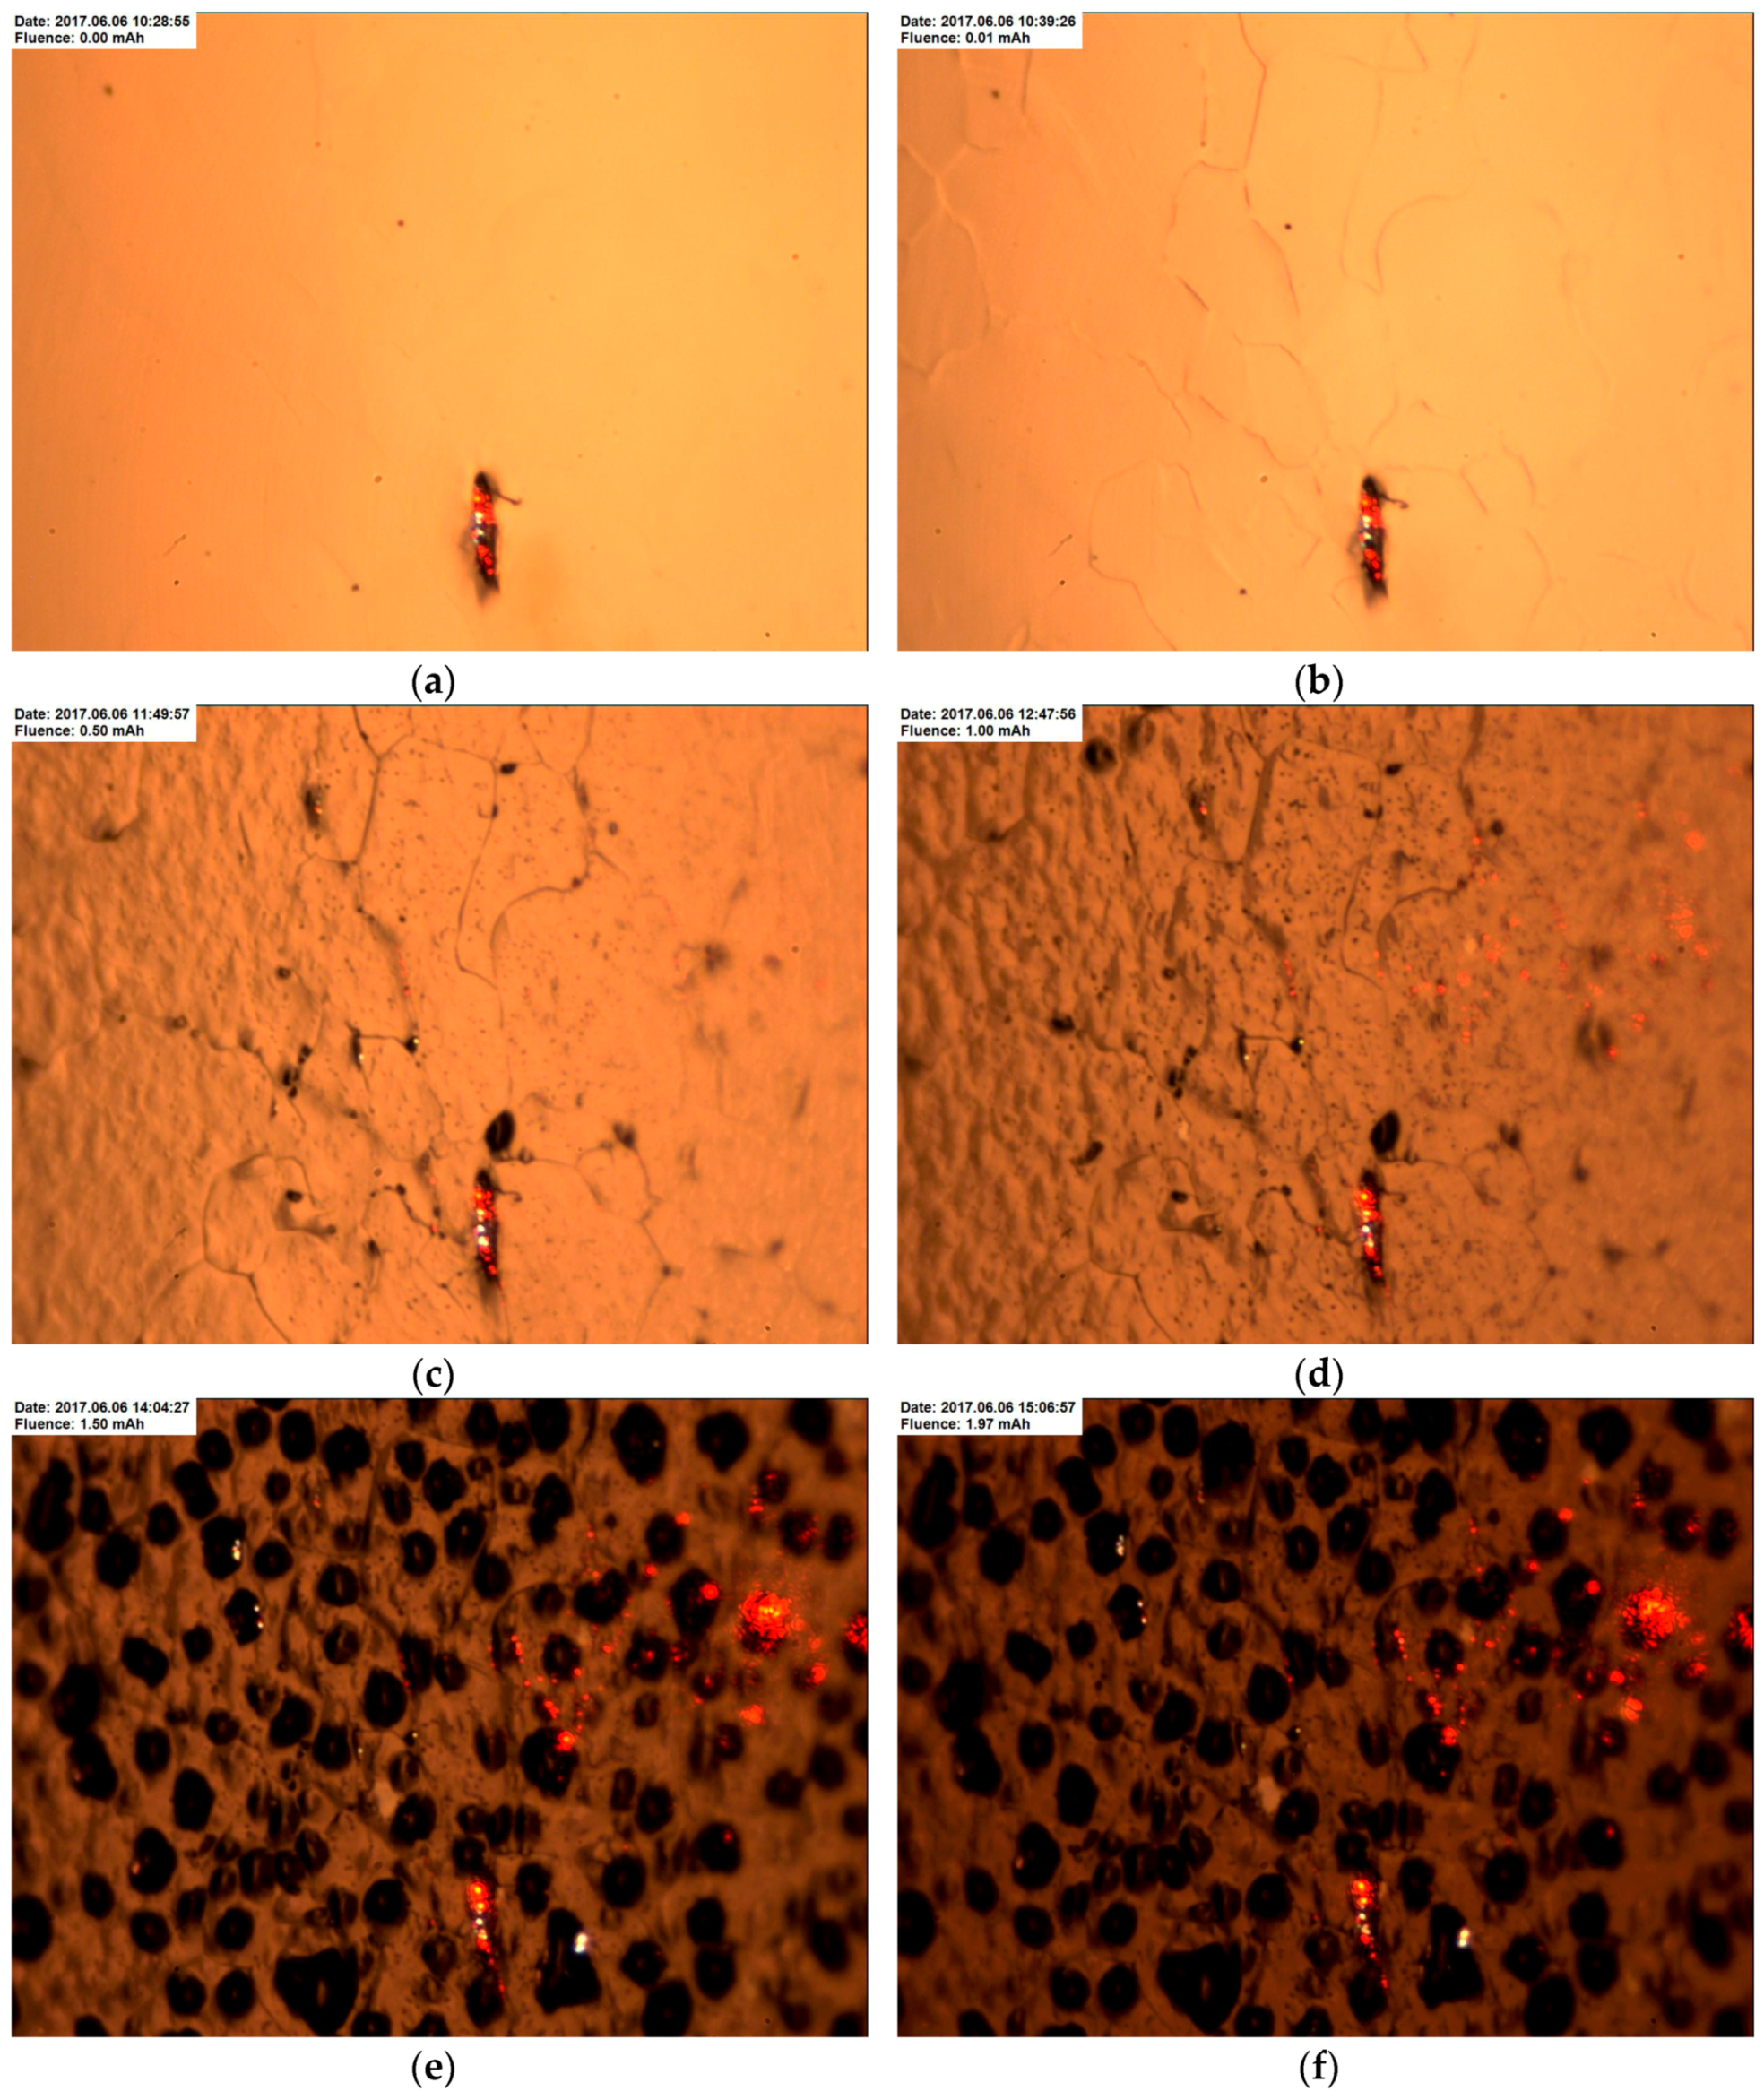
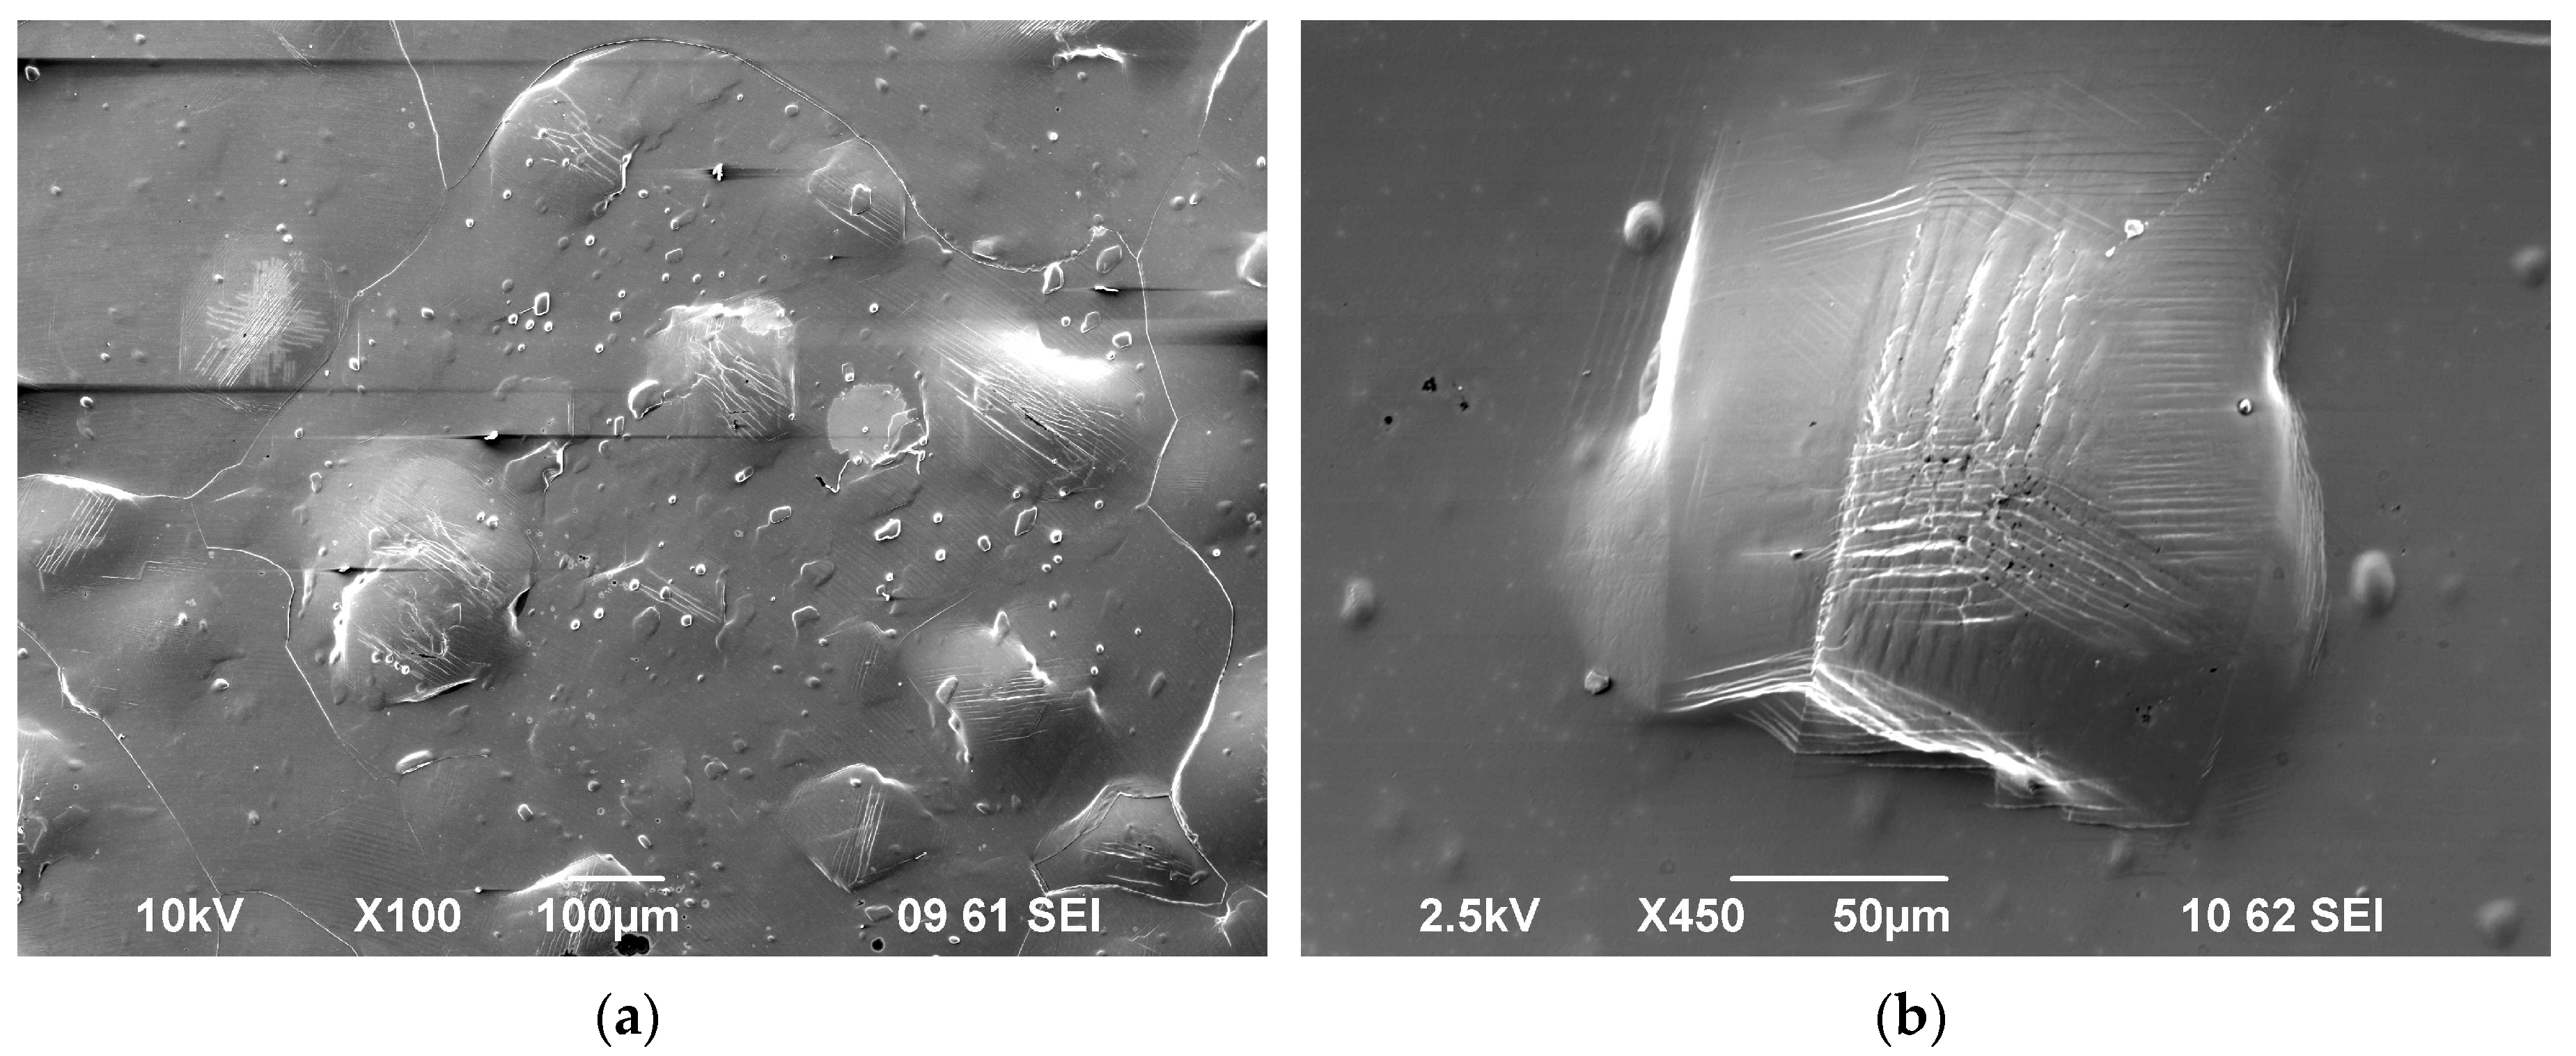
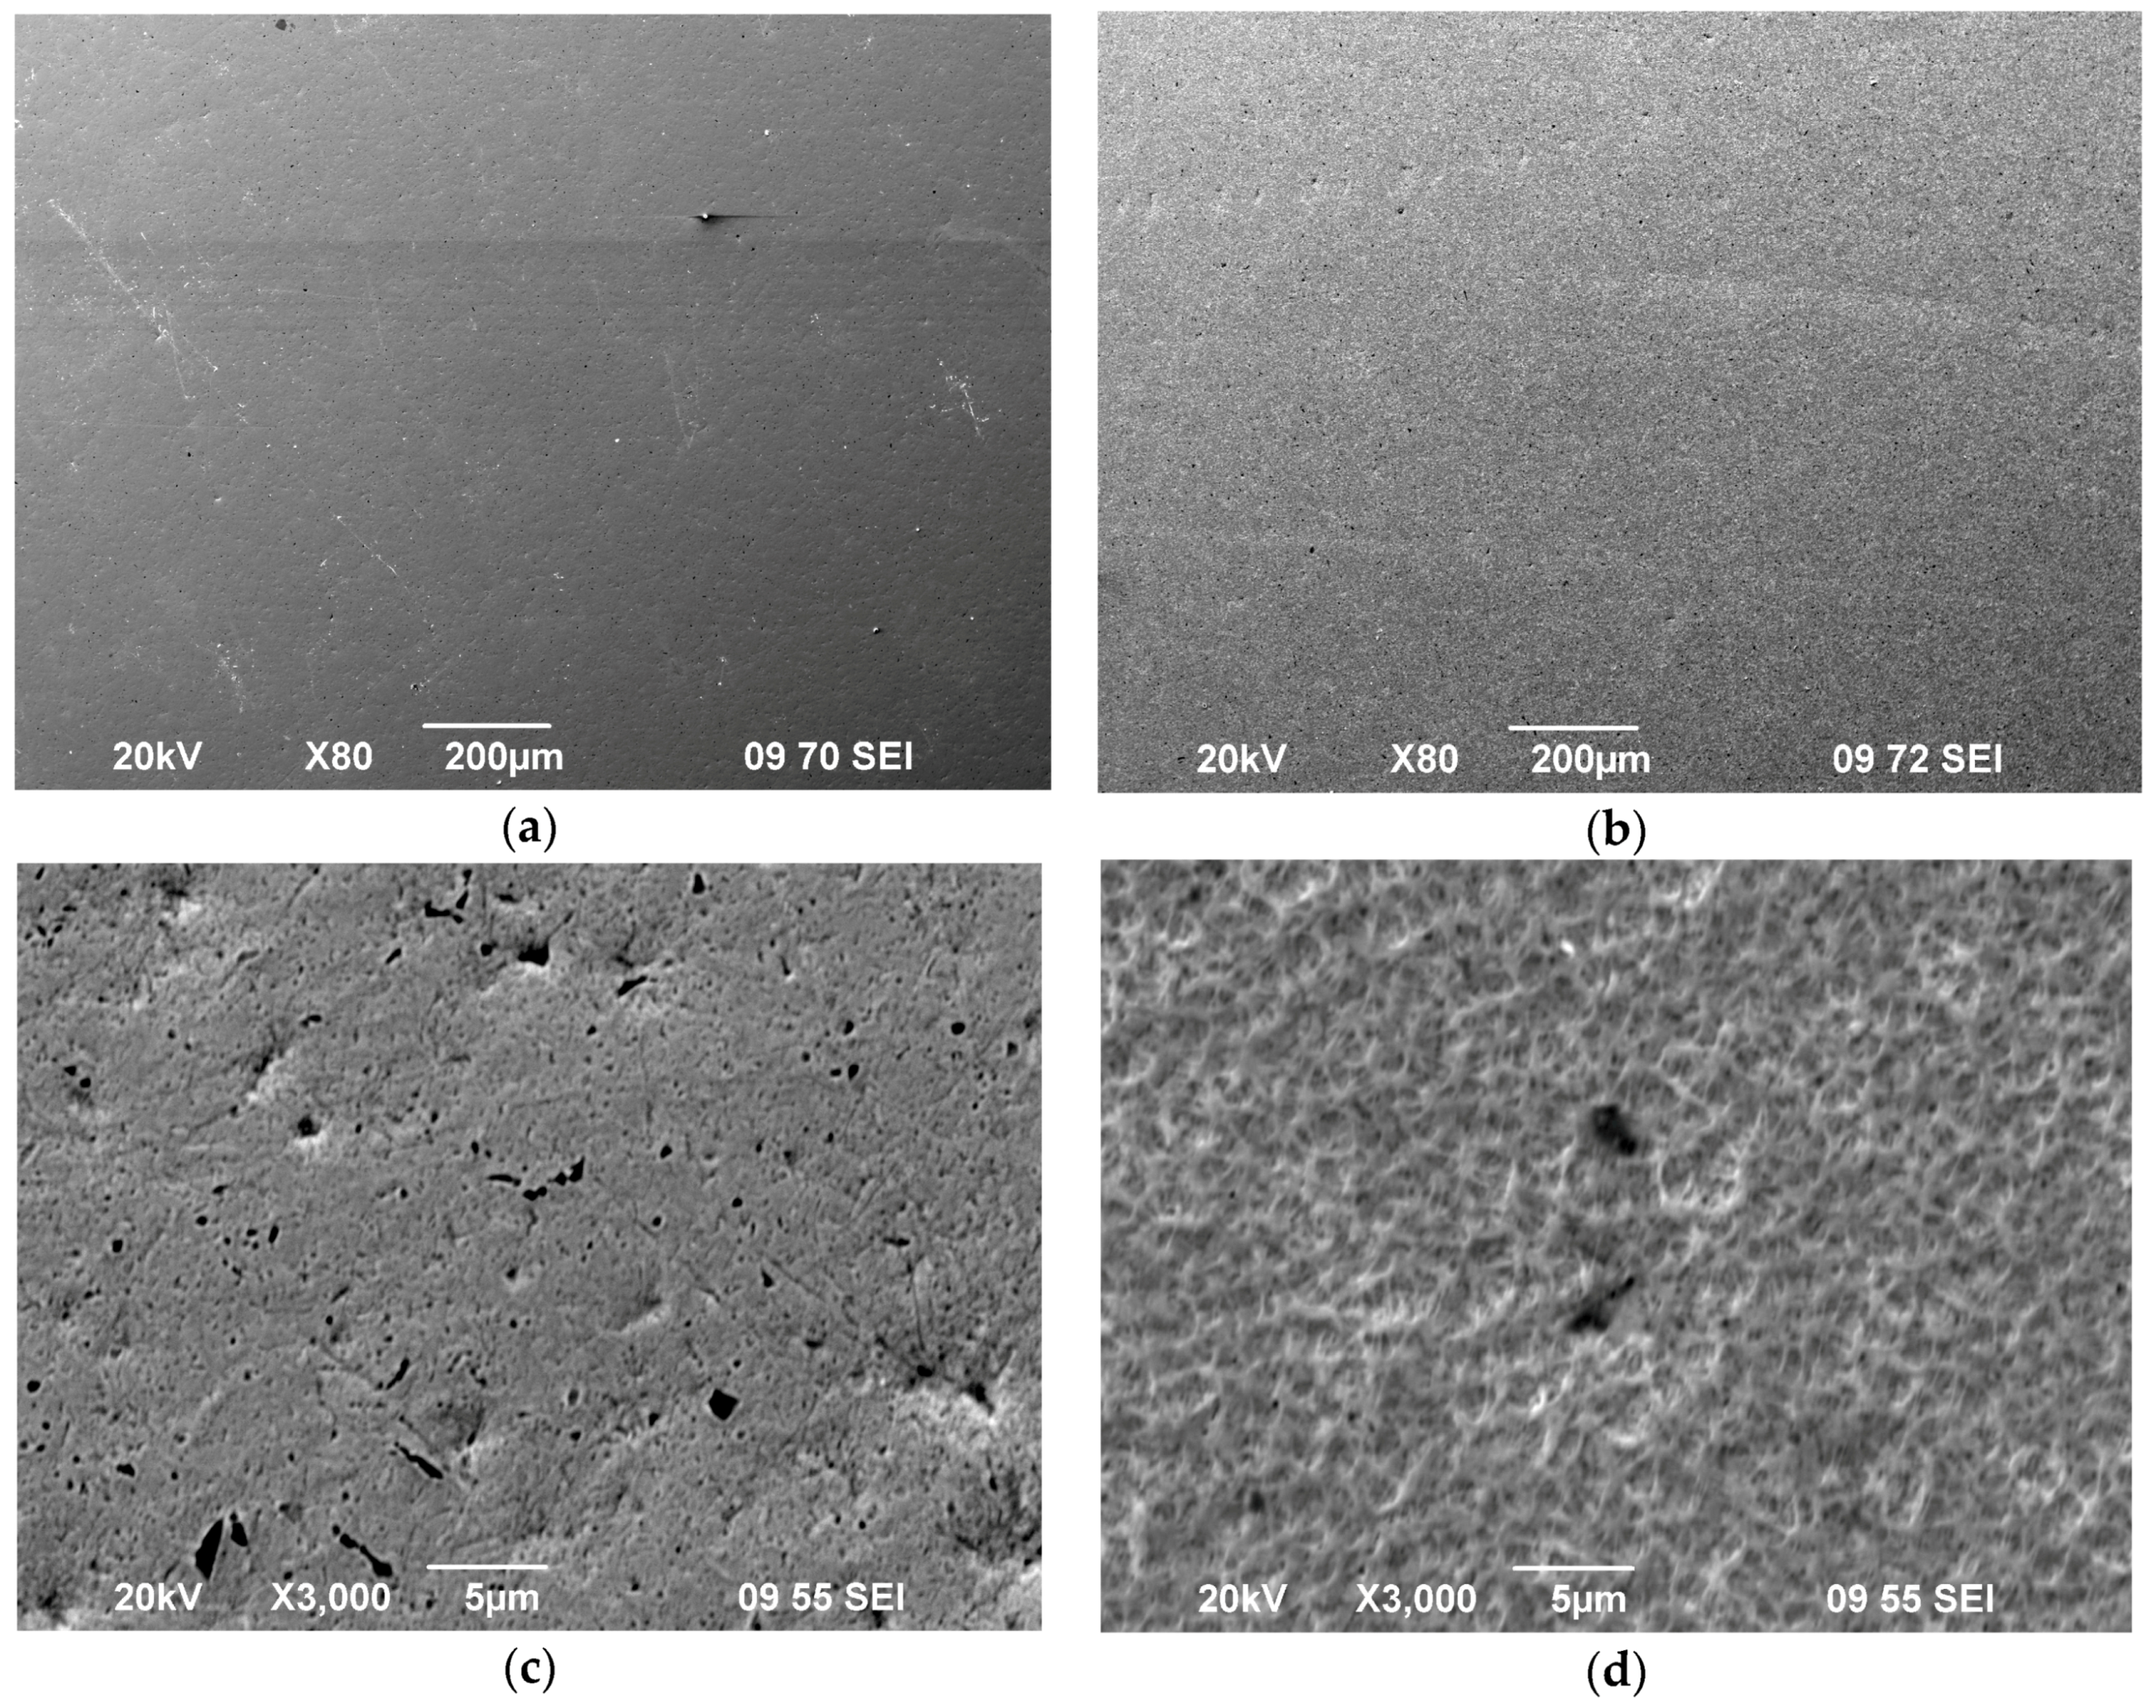
  • Tantalum is much more resistant to the formation of blisters than copper. The threshold of blisters in the form of bubbles or flakes on the tantalum surface exceeds 6.7 × 1020 cm−2. At a fluence of 3.6 × 1020 cm−2 the surface is modified in the form of a relief with a characteristic cell size of 1 μm.
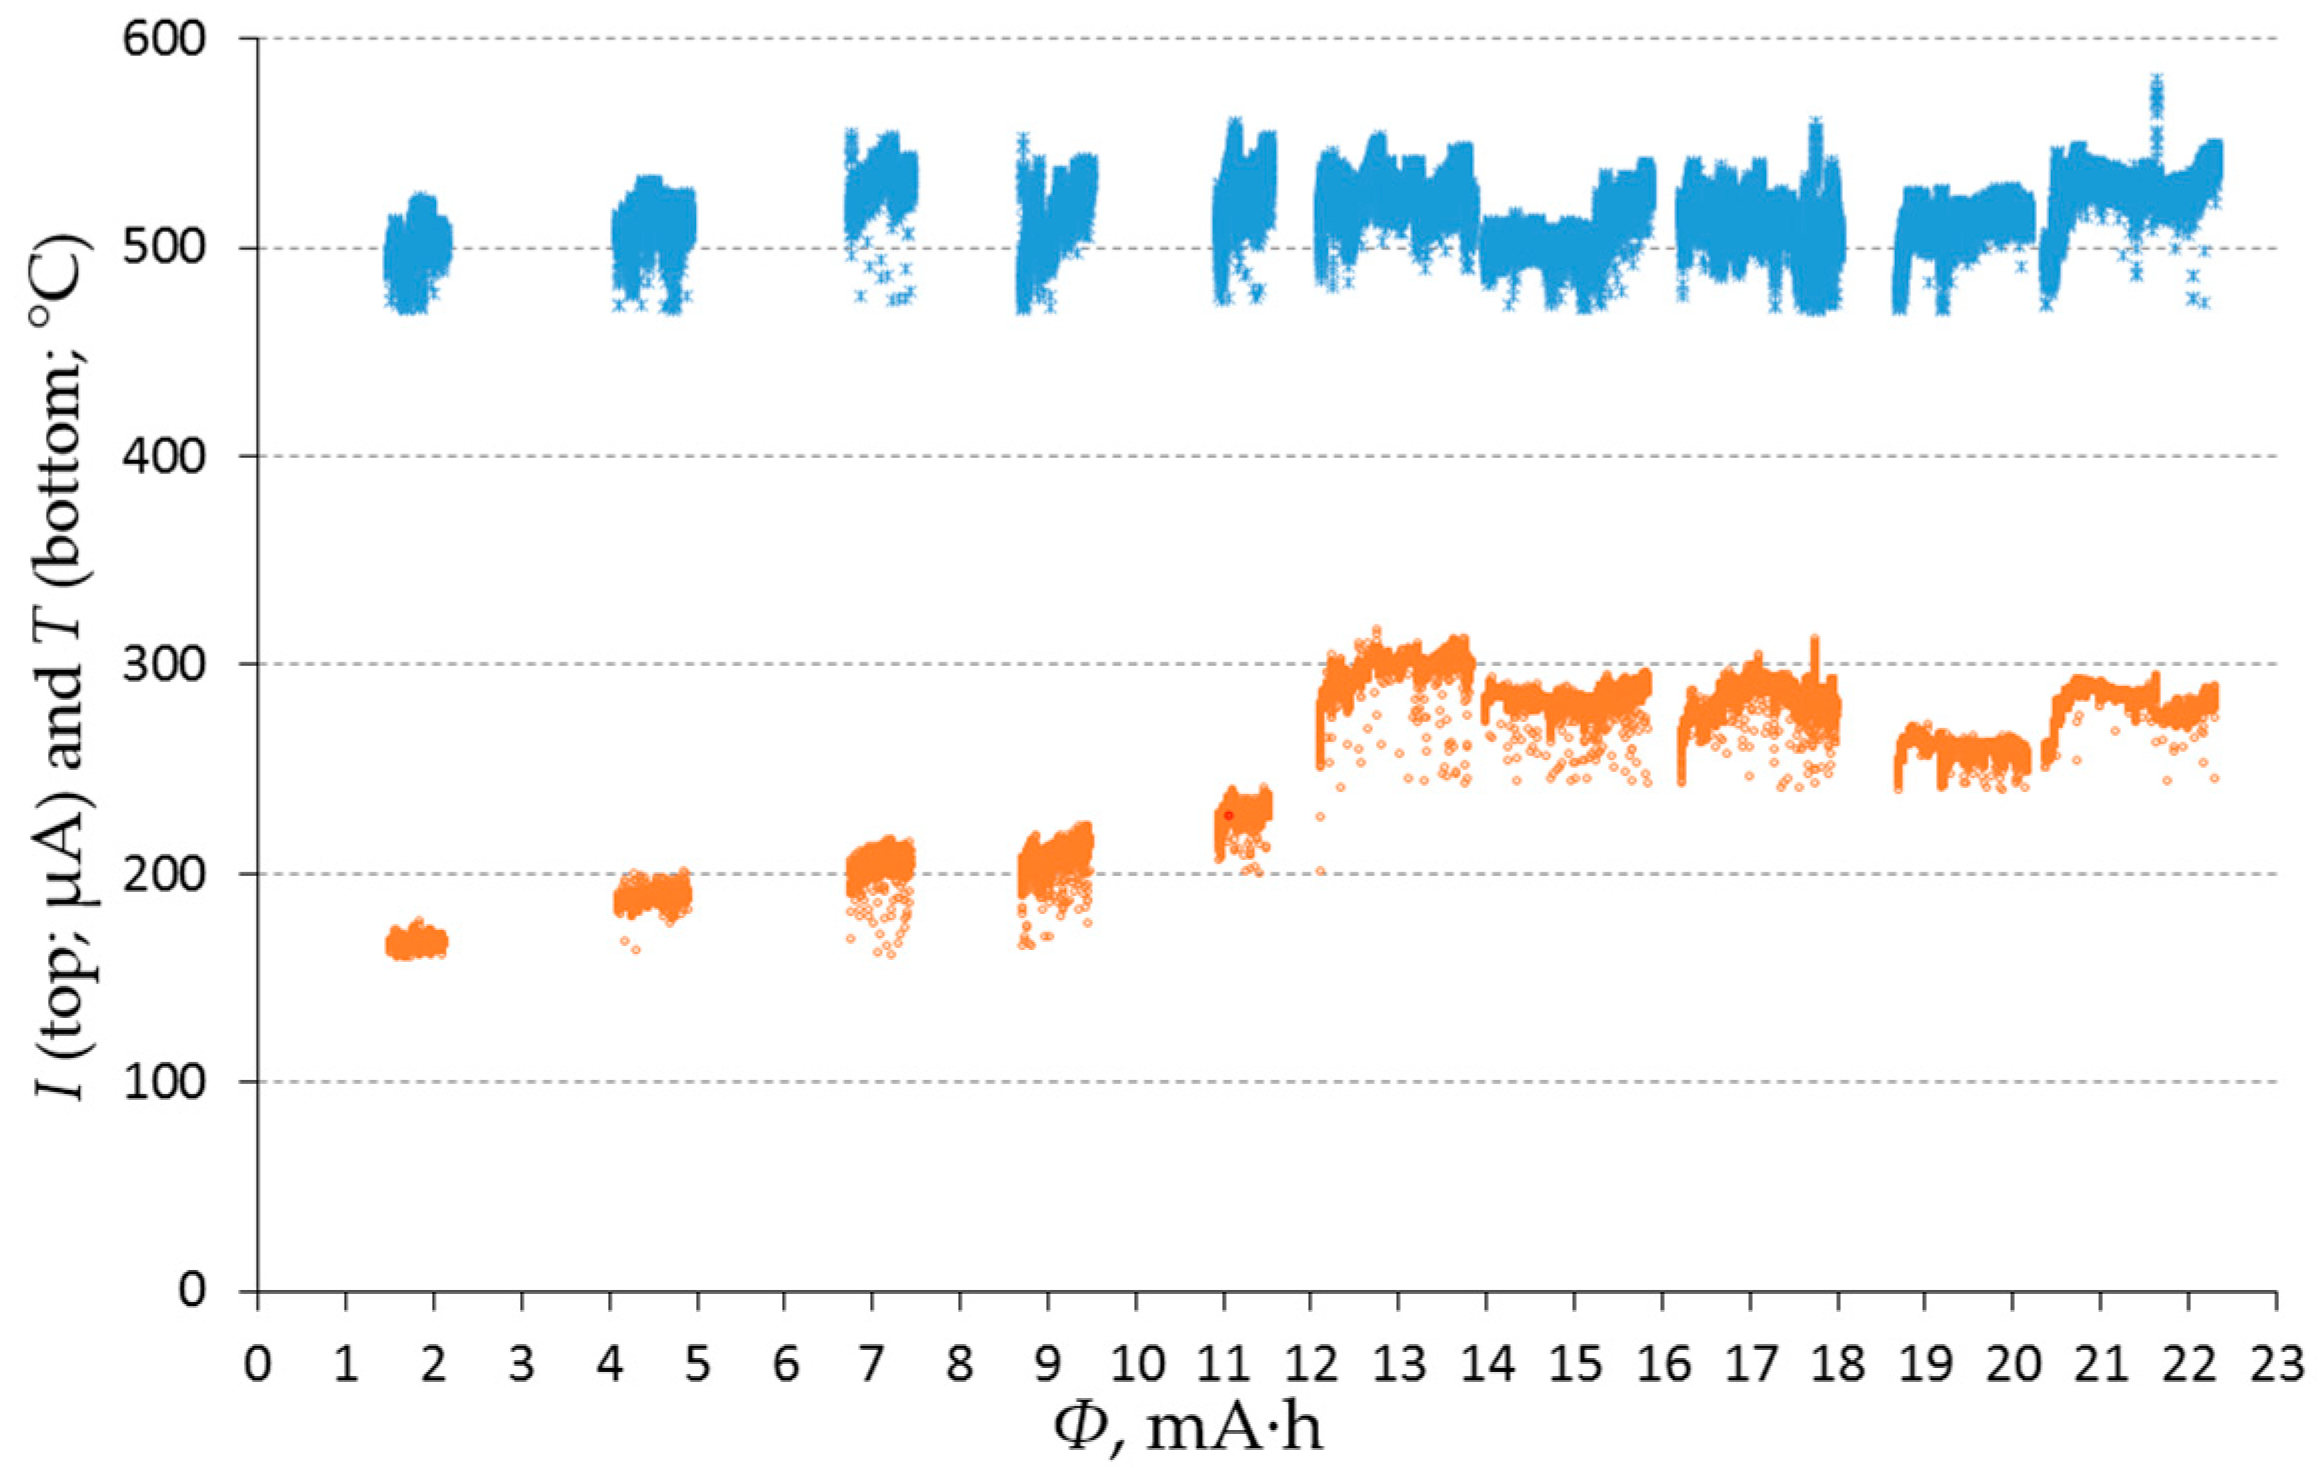
  • During tantalum irradiation, an increase in the sample surface temperature was detected. This could be due to a decrease in the thermal conductivity because of the appearance of cavities and hydrogen incorporation into the tantalum crystal structure.
In relation to the problem of developing a lithium neutron-producing target for the accelerator-based epithermal neutron source—for boron-neutron capture therapy of malignant tumors—the presented results mean the following:
  • Ultra-pure copper can be used to prepare a substrate for the target in the therapy of several patients (approximately 20).
  • It is not obvious that after the appearance of blisters on the surface of the copper substrate the target cannot continue to be used to generate neutrons. This is because accumulated hydrogen can escape through holes and cracks formed when blisters emerge. Furthermore, a decrease in the thermal conductivity caused by blisters will not be critical for lithium melting.
  • The application of a thin tantalum layer deposited on the heat-removing copper substrate increases the target resistance to blistering by no less than ten times as compared to the most stable copper substrate.
  • Proton absorption in the tantalum layer of the target decreases the thermal conductivity due to the formation of cavities and hydrogen incorporation into the tantalum crystal structure, and consequently, leads to a significant increase in the lithium temperature, which can be critical even without surface modification by blisters.
A side result of the performed studies was the measurement of the proton beam profile with a high degree of detail, through determining the boundaries of the region covered with blisters at different irradiation times.

5. Conclusions

With the use of a CCD-camera and a remote microscope, the in situ observation of blistering of samples prepared from copper and tantalum was performed during their irradiation with a 2-MeV proton beam with a cross-section of 1 cm to a fluence of 6 × 1019 cm−2 (and in one case, a fluence that was 10 times larger). The sample temperature during irradiation was measured by a thermistor, pyrometer and an infrared camera. The surface of the irradiated samples was investigated by means of an X-ray diffractometer, laser and electron microscopes.
It is found that among all copper samples studied, ultra-pure (99.99996%) fine grained copper (Mitsubishi Materials Co., Tokyo, Japan) is most resistant to blistering. At a sample temperature of 150 °C, the blistering threshold is 3 × 1019 cm−2. If this copper is used for preparing a neutron-producing target 10 cm in diameter for boron-neutron capture therapy of malignant tumors, then at a proton current of 10 mA, the target is resistant to blistering for 10 h. Since the planned therapy time is half an hour, the target can be applied in the therapy of several patients (approximately 20).
Ultra-pure (99.99996%) coarse grained copper (Mitsubishi Materials Co., Tokyo, Japan) is two-times less resistant to blistering in comparison with ultra-pure (99.99996%) fine copper. At a sample temperature of 150 °C, the blistering threshold is 1.5 × 1019 cm−2. Since there were samples with different orientations of crystallites among the coarse copper samples studied, it is revealed that the crystallite orientation did not affect blistering.
M0 (State Standard GOST 859-2014, Russia) and OFC-1 JIS H3150 C1011 99.996% fine copper (SH Copper Products Co., Ltd., Tsuchiura-shi, Japan) are seven-times less resistant to blistering in comparison with ultra-pure (99.99996%) fine copper. At a sample temperature of 150 °C, the blistering threshold is 0.45 × 1019 cm−2.
The samples prepared by four different techniques of depositing tantalum on copper (explosion and diffusion welding, soldering and plasma arc deposition of tantalum and copper powders) are mechanically resistant to both stationary and pulsed thermal loads up to 1 kW/cm2.
Tantalum is much more resistant to blistering than copper. The blistering threshold at 160 to 200 °C exceeds 6.7 × 1020 cm−2. At a proton fluence of 3.6 × 1020 cm−2, tantalum surface modification is observed in the form a relief (grid) with a cell size of about 1 μm.
It is established that during tantalum irradiation, the sample surface temperature increases, which may be due to a decrease in the thermal conductivity because of the formation of cavities inside tantalum and hydrogen incorporation into the tantalum crystal structure.
These findings have implications on the development of a lithium neutron-producing target for the accelerator-based epithermal neutron source for the purpose of boron-neutron capture therapy of malignant tumors: ultra-pure copper can be used to prepare a substrate for the target in the therapy of several patients (approximately 20). It is not obvious that after the appearance of blisters on the surface of the copper substrate, the target cannot continue to be used to generate neutrons. This is because accumulated hydrogen can escape through holes and cracks formed when blisters emerge. Furthermore, a decrease in the thermal conductivity caused by blisters will not be critical for lithium melting. The deposition of a thin tantalum layer on copper is found to increase the target resistance to blistering by at least a factor of ten. At the same time, proton absorption in the tantalum layer of the target decreases the thermal conductivity due to the formation of cavities and hydrogen incorporation into the tantalum crystal structure and, consequently, leads to a significant increase in the lithium temperature, which can be critical even without surface modification by blisters.

Acknowledgments

This study was carried out with a grant from the Russian Science Foundation (Project No. 14-32-00006-P) with the support of the Budker Institute of Nuclear Physics and Novosibirsk State University. This study is endorsed by the joint collaboration agreement between Okinawa Institute of Science and Technology and Budker Institute of Nuclear Physics.

Author Contributions

Alexander Badtrudinov analyzed samples on the laser and FIB-SEM Helios G3 UC electron microscope. Timophey Bykov analyzed the images from the CCD camera. Sergey Gromilov analyzed the samples on the X-ray diffractometer. Yasuo Higashi contributed the CCD camera with a remote Infinity K2 microscope and performed the experiments. Dmitrii Kasatov provided the placement of the samples in the apparatus and wrote the paper. Iaroslav Kolesnikov analyzed the pyrometer data. Alexey Koshkarev provided the continuous data transmission. Alexandr Makarov enabled the observation of the sample surface by the CCD camera with the remote microscope, Takuya Miyazawa prepared the samples. Ivan Shchudlo provided the proton beam generation. Evgeniia Sokolova analyzed the data thermistors and the infrared camera. Hirotaka Sugawara conceived and designed the experiments. Sergey Taskaev performed the experiments and wrote the paper.

Conflicts of Interest

The authors declare no conflict of interest.

References

  1. Sauerwein, W.; Wittig, A.; Moss, R.; Nakagawa, Y. Neutron Capture Therapy: Principles and Applications; Springer: Berlin/Heidelberg, Germany, 2012; p. 553. ISBN 978-3-642-31334-9. [Google Scholar]
  2. Taskaev, S.; Kanygin, V. Boron Neutron Capture Therapy; Publishing House of Siberian Branch of Russian Academy of Sciences: Novosibirsk, Russia, 2016; p. 216. ISBN 978-5-7692-1500-1. [Google Scholar]
  3. Taskaev, S. Accelerator based epithermal neutron source. Phys. Part. Nucl. 2015, 46, 956–990. [Google Scholar] [CrossRef]
  4. Bayanov, B.; Belov, V.; Bender, E.; Bokhovko, M.; Dimov, G.; Kononov, V.; Kononov, O.; Kuksanov, N.; Palchikov, V.; Pivovarov, V.; et al. Accelerator based neutron source for the neutron-capture and fast neutron therapy at hospital. Nucl. Instrum. Methods Phys. Res. Sect. 1998, 413, 397–426. [Google Scholar] [CrossRef]
  5. Bayanov, B.; Belov, V.; Kindyuk, V.; Oparin, E.; Taskaev, S. Lithium neutron producing target for BINP accelerator-based neutron source. Appl. Radiat. Isot. 2004, 61, 817–821. [Google Scholar] [CrossRef] [PubMed]
  6. Bayanov, B.; Belov, V.; Taskaev, S. Neutron producing target for accelerator based neutron capture therapy. J. Phys. Conf. Ser. 2006, 41, 460–465. [Google Scholar] [CrossRef]
  7. Kasatov, D.; Makarov, A.; Taskaev, S.; Shchudlo, I. Radiation accompanying the absorption of 2-MeV protons in various materials. Phys. At. Nucl. 2015, 78, 905–911. [Google Scholar] [CrossRef]
  8. Behrisch, R. Sputtering by Particle Bombardment II; Springer: New York, NY, USA, 1984; ISBN 978-3662311691. [Google Scholar]
  9. Guseva, M.; Martynenko, Y.V. Radiation blistering. Sov. Phys. Uspekhi 1981, 24, 996–1007. [Google Scholar] [CrossRef]
  10. Astrelin, V.; Burdakov, A.; Bykov, P.; Ivanov, I.; Ivanov, A.; Jongen, Y.; Konstantinov, S.; Kudryavtsev, A.; Kuklin, K.; Mekler, K.; et al. Blistering of the selected materials irradiated by intense 200 keV proton beam. J. Nucl. Mater. 2010, 396, 43–48. [Google Scholar] [CrossRef]
  11. Volkova, O.; Mechetina, L.; Taranin, A.; Zaboronok, A.; Nakai, K.; Lezhnin, S.; Frolov, S.; Kasatov, D.; Makarov, A.; Sorokin, I.; et al. Impact of neutron radiation on the viability of tumor cells cultured in the presence of boron-10 isotope. Vestnik Rentgen. Radiol. 2016, 97, 283–288. [Google Scholar] [CrossRef]
  12. Ivanov, A.; Kasatov, D.; Koshkarev, A.; Makarov, A.; Ostreinov, Y.M.; Sorokin, I.; Taskaev, S.; Shchudlo, I. Obtaining a proton beam with 5-mA current in a tandem accelerator with vacuum insulation. Tech. Phys. Lett. 2016, 42, 608–611. [Google Scholar] [CrossRef]
  13. Burdakov, A.V.; Kuznetsov, A.S.; Bayanov, B.F.; Astrelin, V.T.; Mekler, K.I.; Sulyaev, Y.S. Graphite targets for experiments on GRA detection of nitrogen containing materials. Prikl. Fiz. Appl. Phys. 2016, 3, 69–74. [Google Scholar]
  14. Andersen, H.; Ziegler, J. Hydrogen Stopping Powers and Ranges in All Elements (The Stopping and Ranges of Ions in Matter); Pergamon Press Inc.: Oxford, UK, 1977; Volume 3, ISBN 978-0080216058. [Google Scholar]
  15. Kasatov, D.; Makarov, A.; Taskaev, S.; Shchudlo, I. Recording of current accompanying an ion beam in a tandem accelerator with vacuum insulation. Tech. Phys. Lett. 2015, 41, 139–141. [Google Scholar] [CrossRef]
  16. Ivanov, A.; Kasatov, D.; Koshkarev, A.; Makarov, A.; Ostreinov, Y.; Shchudlo, I.; Sorokin, I.; Taskaev, S. Suppression of an unwanted flow of charged particles in a tandem accelerator with vacuum insulation. J. Instrum. 2016, 11, 04018. [Google Scholar] [CrossRef]
  17. ICDD. Powder Diffraction File, PDF-2/Release 2016; International Centre for Diffraction Data: Newtown Square, PA, USA, 2016. [Google Scholar]
  18. Kraus, W.; Nolze, G. POWDER CELL—A program for the representation and manipulation of crystal structures and calculation of the resulting X-ray powder patterns. J. Appl. Crystallogr. 1996, 29, 301–303. [Google Scholar] [CrossRef]
  19. Waite, T.R.; Wallace, W.E.; Craig, R.S. Structures and phase relationships in the Tantalum-Hydrogen system between −145 and 70 °C. J. Chem. Phys. 1956, 24, 634–635. [Google Scholar] [CrossRef]
Figure 1. Experimental apparatus: ①, tandem accelerator with vacuum insulation; ②, computer; ③, remote microscope with a charge-coupled device camera; ④, booster-light; ⑤, fused quartz window; and ⑥, diagnostic vacuum chamber. The arrow schematically shows the direction of 2-MeV proton beam propagation.
Metals 07 00558 g001
Figure 2. Images of the heat-removing surface used in the first (a) and second (b) series of experiments.
Metals 07 00558 g002
Figure 3. Images of the surface of 99.996% fine copper irradiation by a 2-MeV proton beam with varying integrals of the current: (a) 0.009; (b) 0.465; (c) 1.041; (d) 1.796 mA·h. The frame size is 9 mm horizontally and 4 mm vertically.
Metals 07 00558 g003
Figure 4. Laser microscope image of the M0 copper surface and the results of their processing: (a,b), non-irradiated; (cf), irradiated. The frame size is (a,b), 1411.9 × 1000 μm2; (c,d), 283.5 × 200 μm2; (e,f), 702.8 × 500 μm2; the height is (b) 6.7 μm; (d) 13.9 μm; (f) 15.3 μm.
Metals 07 00558 g004aMetals 07 00558 g004b
Figure 5. Images of the surface of 99.99996% coarse copper irradiation by a 2-MeV proton beam with varying integrals of the current: (a) 0.201; (b) 0.905; (c) 1.262; (d) 1.742 mA·h. The frame size is 9 mm horizontally and 4 mm vertically.
Metals 07 00558 g005aMetals 07 00558 g005b
Figure 6. Laser microscope images of the surface of 99.99996% coarse-grained copper and the results of their processing: (a,b), non-irradiated; (c,d), irradiated. The frame size is (a,b), 702.8 × 500 μm2; (c,d), 1411.9 × 1000 μm2; the height is (b) 9.5 μm, (d) 14 μm.
Metals 07 00558 g006
Figure 7. Laser microscope images of the tantalum surface and the results of their processing: (a,b), non-irradiated; (c,d), irradiated. The frame size is (a,b), 1411.9 × 1000 μm2; (c,d), 702.8 × 500 μm2; the height is (b) 25.6 μm; (d) 15.6 μm.
Metals 07 00558 g007
Figure 8. Images of the sample after irradiation taken by the (a) camera; (b) a camera through the optical; (c) laser and (d) the results of laser microscope signal processing. The frame size is (c,d) 1411.9 × 1000 μm2; the height is (d) 30.8 μm.
Metals 07 00558 g008
Figure 9. Images of the surface of 99.996% fine copper during irradiation by a 2-MeV proton beam with varying integrals of the current: (a) 0, (b) 0.01, (c) 0.15, (d) 0.40, (e) 1.00, (f) 1.87 mA·h. The frame size is 9 mm horizontally and 4 mm vertically.
Metals 07 00558 g009aMetals 07 00558 g009b
Figure 10. Result of image processing (a) and the size distribution histogram (b) of blisters on the surface of 99.996% fine-grained copper. The frame size is 9 mm horizontally and 4 mm vertically (a).
Metals 07 00558 g010aMetals 07 00558 g010b
Figure 11. Images of the surface of 99.99996% coarse copper (Sample 2) during irradiation by a 2-MeV proton beam with varying integrals of the current: (a) 0, (b) 0.04, (c) 0.25, (d) 0.50, (e) 1.00, (f) 1.89 mA·h. The frame size is 9 mm horizontally and 4 mm vertically.
Metals 07 00558 g011
Figure 12. Change in the image brightness B vs. the accumulated integral of the proton current Φ.
Metals 07 00558 g012
Figure 13. Result of image processing (a) and the size distribution histogram (b) of blisters on the surface of 99.99996% coarse-grained copper (Sample 2). The frame size is 9 mm horizontally and 4 mm vertically (a).
Metals 07 00558 g013
Figure 14. Images of the surface of 99.99996% coarse copper, which were taken on a FIB-SEM Helios G3 UC focused ion beam electron microscope. In (a,b,d), a blister specially cut by an ion beam is seen; (c) showed the blister before it was cut.
Metals 07 00558 g014
Figure 15. Images of the surface of 99.99996% coarse-grained copper (Sample 3) during irradiation by a 2-MeV proton beam with varying integrals of the current: (a) 0.02, (b) 0.10, (c) 0.59, (d) 0.70, (e) 1.00, (f) 2.00 mA·h. The frame size is 12 × 12 mm2.
Metals 07 00558 g015aMetals 07 00558 g015b
Figure 16. Result of image processing (a) and size distribution histogram (b) of blisters on the surface of 99.99996% coarse-grained copper (Sample 3). The frame size is 12 × 12 mm2 (a).
Metals 07 00558 g016
Figure 17. Boundaries of the region covered with blisters depending on the proton fluence (in 1019 cm−2). Grid step is 1 mm.
Metals 07 00558 g017
Figure 18. Images of the surface of 99.99996% fine-grained copper (Sample 4) during irradiation by a 2-MeV proton beam with varying integrals of the current: (a) 0.00, (b) 0.01, (c) 0.50, (d) 1.00, (e) 1.50, (f) 1.97 mA·h. The frame size is 9 mm horizontally and 4 mm vertically.
Metals 07 00558 g018
Figure 19. Images of the surface of 99.99996% fine-grained copper after proton beam irradiation taken on a Jeol JCM-5700 electron microscope: (a) 100×; (b) 450×.
Metals 07 00558 g019
Figure 20. Changes in the image brightness B vs. the accumulated integral of the proton current Φ.
Metals 07 00558 g020
Figure 21. Result of image processing (a) and size distribution histogram (b) of blisters on the surface of 99.99996% fine-grained copper (Sample 4). The frame size of (a) is 9 mm horizontally and 4 mm vertically.
Metals 07 00558 g021
Figure 22. Images of the surface of Sample 5 during irradiation by a 2-MeV proton beam with varying integrals of the current: (a) 0.54, (b) 1.74 mA·h. The frame size is 9 mm horizontally and 4 mm vertically.
Metals 07 00558 g022
Figure 23. Dependence of the proton beam current I (top; μA) and pyrometer values T (bottom; °C) on the accumulated integral of the current.
Metals 07 00558 g023
Figure 24. Images of the surface of Sample 6 taken on a Jeol JCM-5700 electron microscope before (a,c) and after irradiation to a fluence of 6.7 × 1020 cm−2 (b,d).
Metals 07 00558 g024
Table 1. Sample powder X-ray diffraction characteristics.
Sample2θ321, °d321, Åa, ÅΔ, ÅFWHM 2, 2θ, °CSR 3, nmState
Tantalum reference121.3510.88353.3058---Polycrystal
Non-irradiated121.2880.88383.307(2 1)0.0010.54640Polycrystal
5121.0500.88483.311(2)0.0050.64733Texture [200]
6120.0000.88953.328(2)0.02230.64833Texture [200]
1—Error definition; 2— Full width at half maximum; 3—Coherent scattering region.
Table 2. Temperature of samples of tantalum foil welded to copper.
Sample No.TechnologyCurrent, μAPyrometer Temperature, °CMaximum Temperature (Infrared Camera), °C
5Explosion welding505 ± 16137 ± 9-
7Soldering500 ± 16247360
8Diffusion welding505 ± 20155280
9Arc deposition (1:1)505 ± 15143 ± 9250
Table 3. Sample characteristics.
No.MaterialT, °CBlistering Threshold, 1019 cm−2Blistering Size, μmFeatures
ThermistorPyrometerInfrared Camera
N/NCu, M0263 ± 15--1.5--
N/NCu, 99.996%263 ± 15--1.5--
1130 ± 1582 ± 16-0.4540 ± 20-
N/NCu, 99.99996%, coarse-grained263 ± 15--3-cracks
2130 ± 1583 ± 8-1.5160 ± 50-
3---1.5170 ± 50-
4Cu, 99.99996%, fine-grained130 ± 1584 ± 12-3155 ± 45-
N/NTa600-->5.6--
5Ta-Cu 1-137 ± 9240>5.6--
6-160–210->67-Relief at a fluence of 3.6 × 1020 cm−2
7Ta-Cu 2-247360>5.6--
8Ta-Cu 3-155280>5.6--
9Ta + Cu 4-143 ± 9250>5.6--
1—Ta-Cu (explosion welding); 2—Ta-Cu (soldering); 3—Ta-Cu (diffusion welding); 4—Ta + Cu (arc deposition 1:1).

