Ultrasonic Pulse-Echo Signal Analysis for Damage Evaluation of Metallic Slit-Plate Hysteretic Dampers
by
 and
and
Chihab Abarkane
1, 
David Galé-Lamuela
2,
Amadeo Benavent-Climent
2,
Elisabet Suárez
1,* and
Antolino Gallego
1 1
Department of Applied Physics, School of Building Engineering, University of Granada, 18071 Granada, Spain
2
Department of Mechanical Engineering, Polytechnic University of Madrid, 28006 Madrid, Spain
*
Author to whom correspondence should be addressed.
Metals 2017, 7(12), 526; https://doi.org/10.3390/met7120526
Submission received: 9 November 2017
/
Revised: 20 November 2017
/
Accepted: 23 November 2017
/
Published: 26 November 2017
Abstract
:This paper proposes a pulse-echo Ultrasonic Testing (UT) methodology to quantify the damage of hysteretic dampers subjected to cyclic loadings. Energy dissipation is known as an innovative strategy for the protection of buildings against earthquakes. It consists of installing special devices called dampers in the construction, which are entrusted to dissipate most of the energy input by the earthquake, thus keeping the main structure basically undamaged. In particular, the hysteretic dampers dissipate the input energy through plastic deformations in their metallic parts. Several moderate ground motions would not exhaust the capacity of the dampers, but they cause damage—plastic deformations in the device. Therefore, continuous or periodic inspections of the damper are required in order to decide upon its eventual replacement. In this particular work, several hysteretic dampers made of stainless steel were subjected to different patterns of low-frequency cyclic loads that caused diverse levels of damage. Each damper underwent pulse-echo UT before and after the cyclic loading. Spectral energy of the echo signals was properly calculated at each damage level in order to define a reliable damage index. The new index has been compared with a well-established mechanical damage index, ID, previously proposed by the authors. A successful correlation was observed, making the pulse-echo UT technique promising for this particular application.
1. Introduction
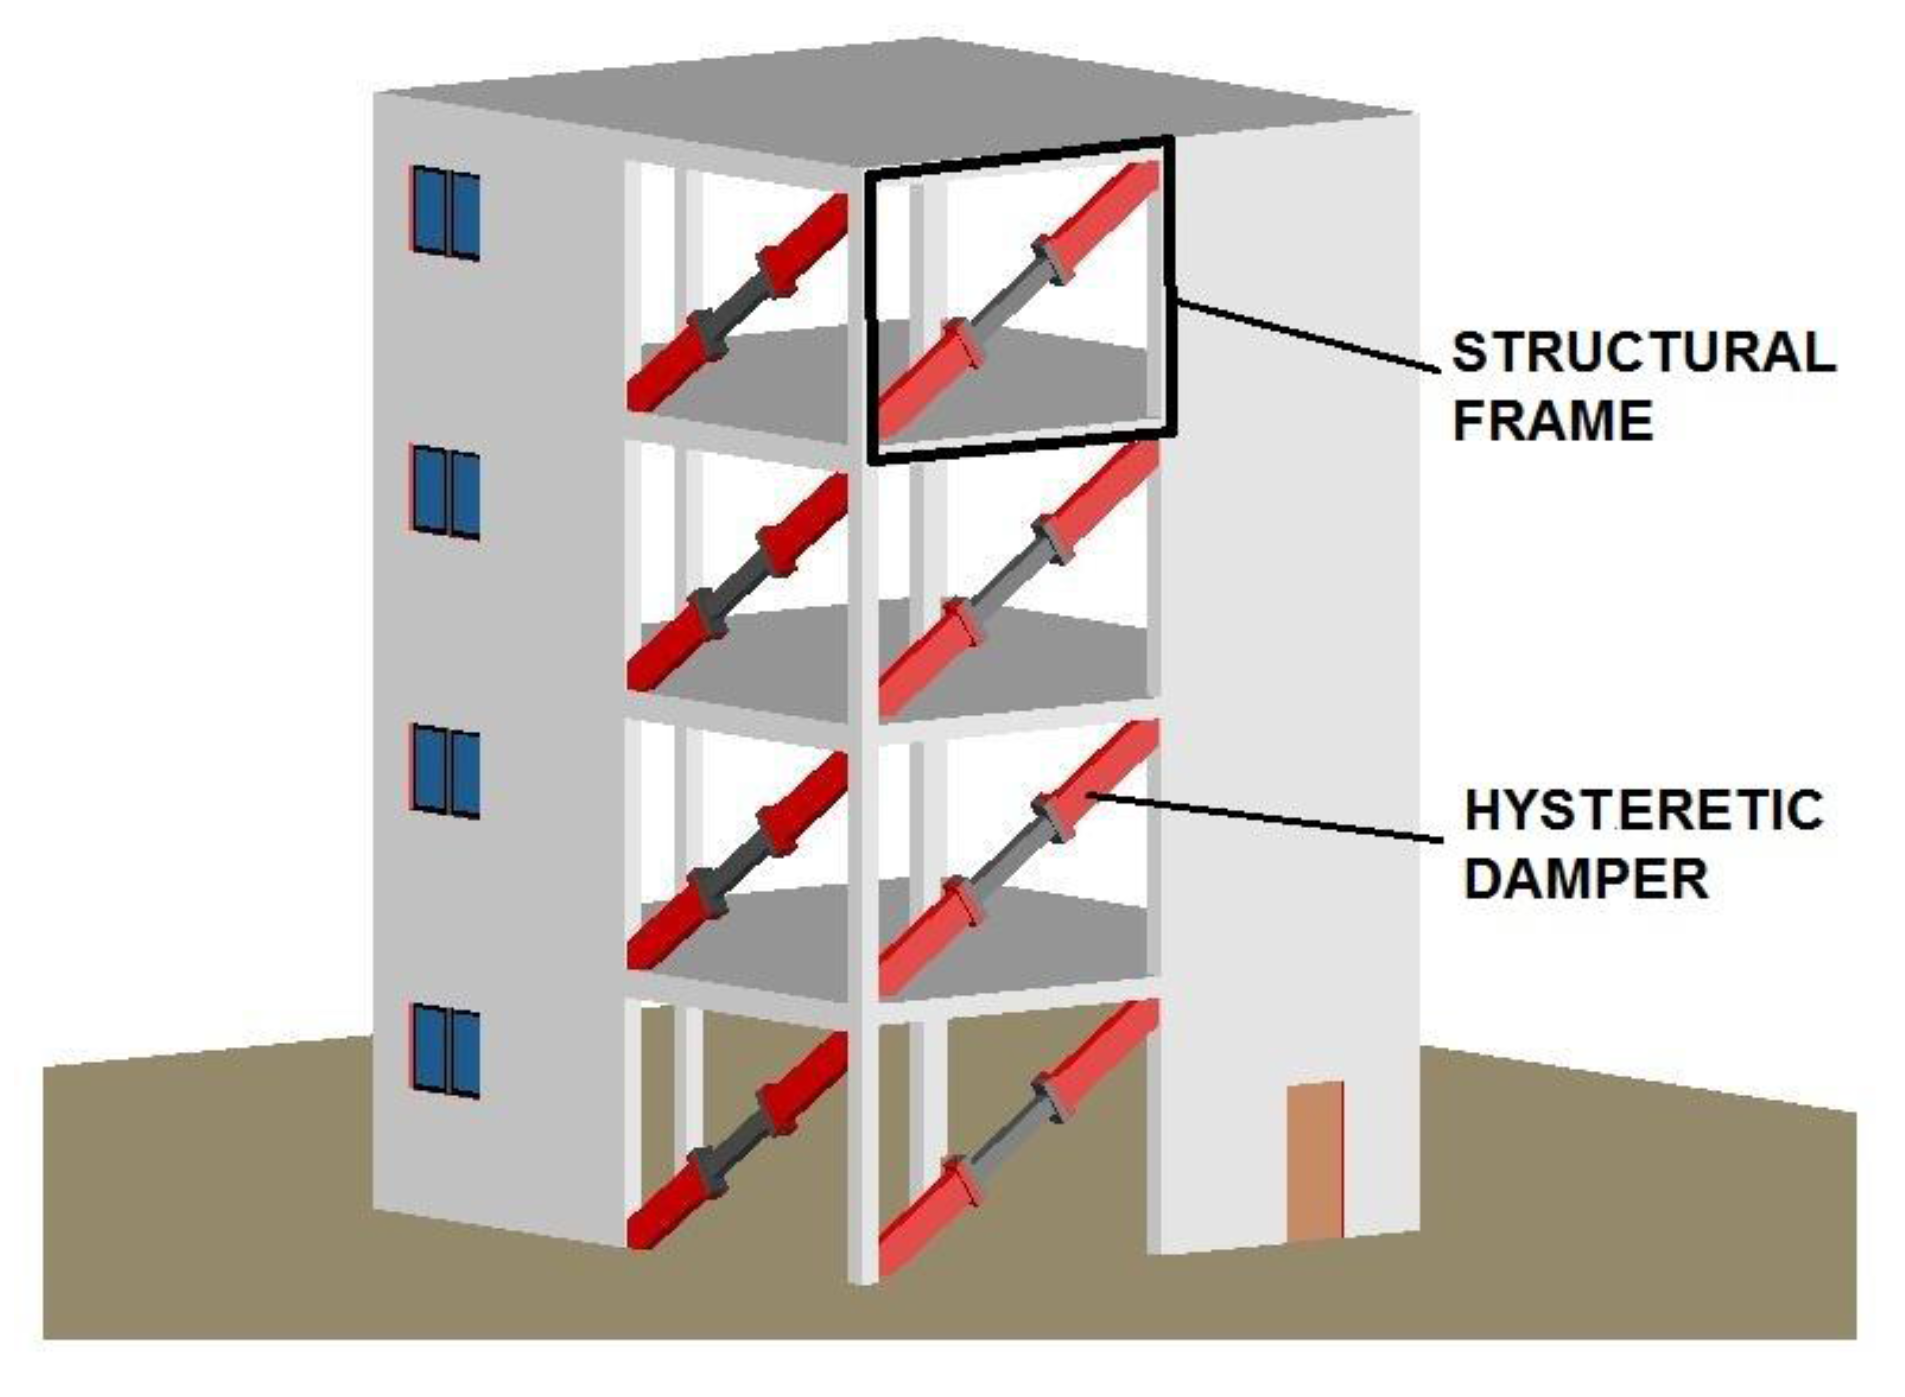
The energy dissipation strategy for the passive protection of buildings and infrastructures against earthquakes has been growing during recent decades. It consists of installing special devices called dampers designed to dissipate most of the energy input by the earthquake. Figure 1 provides a general scheme of the installation of dampers in a building with a frame structure.
The effectiveness of energy dissipation systems for improving the response of buildings, while increasing their robustness and resilience, is now widely recognized. In particular, the so-called hysteretic dampers or metallic dampers are based on the plastic deformation of metals (commonly steel) as the source of the energy dissipation. Hysteretic dampers do not necessarily need to be replaced after minor/moderate ground motions or even after a large earthquake. However, deciding whether or not the dampers need to be replaced is essential, and calls for reliably and non-destructive evaluating the level of damage and determining the remaining energy dissipation capacity (life) of the damper after an earthquake. This evaluation cannot be based on simple visual inspection because it is a cumulative process, not visible until the element is on the brink of failure. Past research has proven that the level of damage and the failure of steel elements subjected to plastic deformations caused by arbitrarily applied cyclic loading can be reliably estimated by decomposing the force-displacement curves endured by the element into the so-called skeleton part and Bauschinger part [1]. This decomposition is the basis of a phenomenological mechanical damage index called ID that has been extensively validated with static and dynamic tests. Yet measuring the force and the displacement of dampers during an earthquake entails installing expensive instrumentation (load cells or strain gages and displacement transducers) that would offset one of the main advantages of hysteretic dampers—low cost.
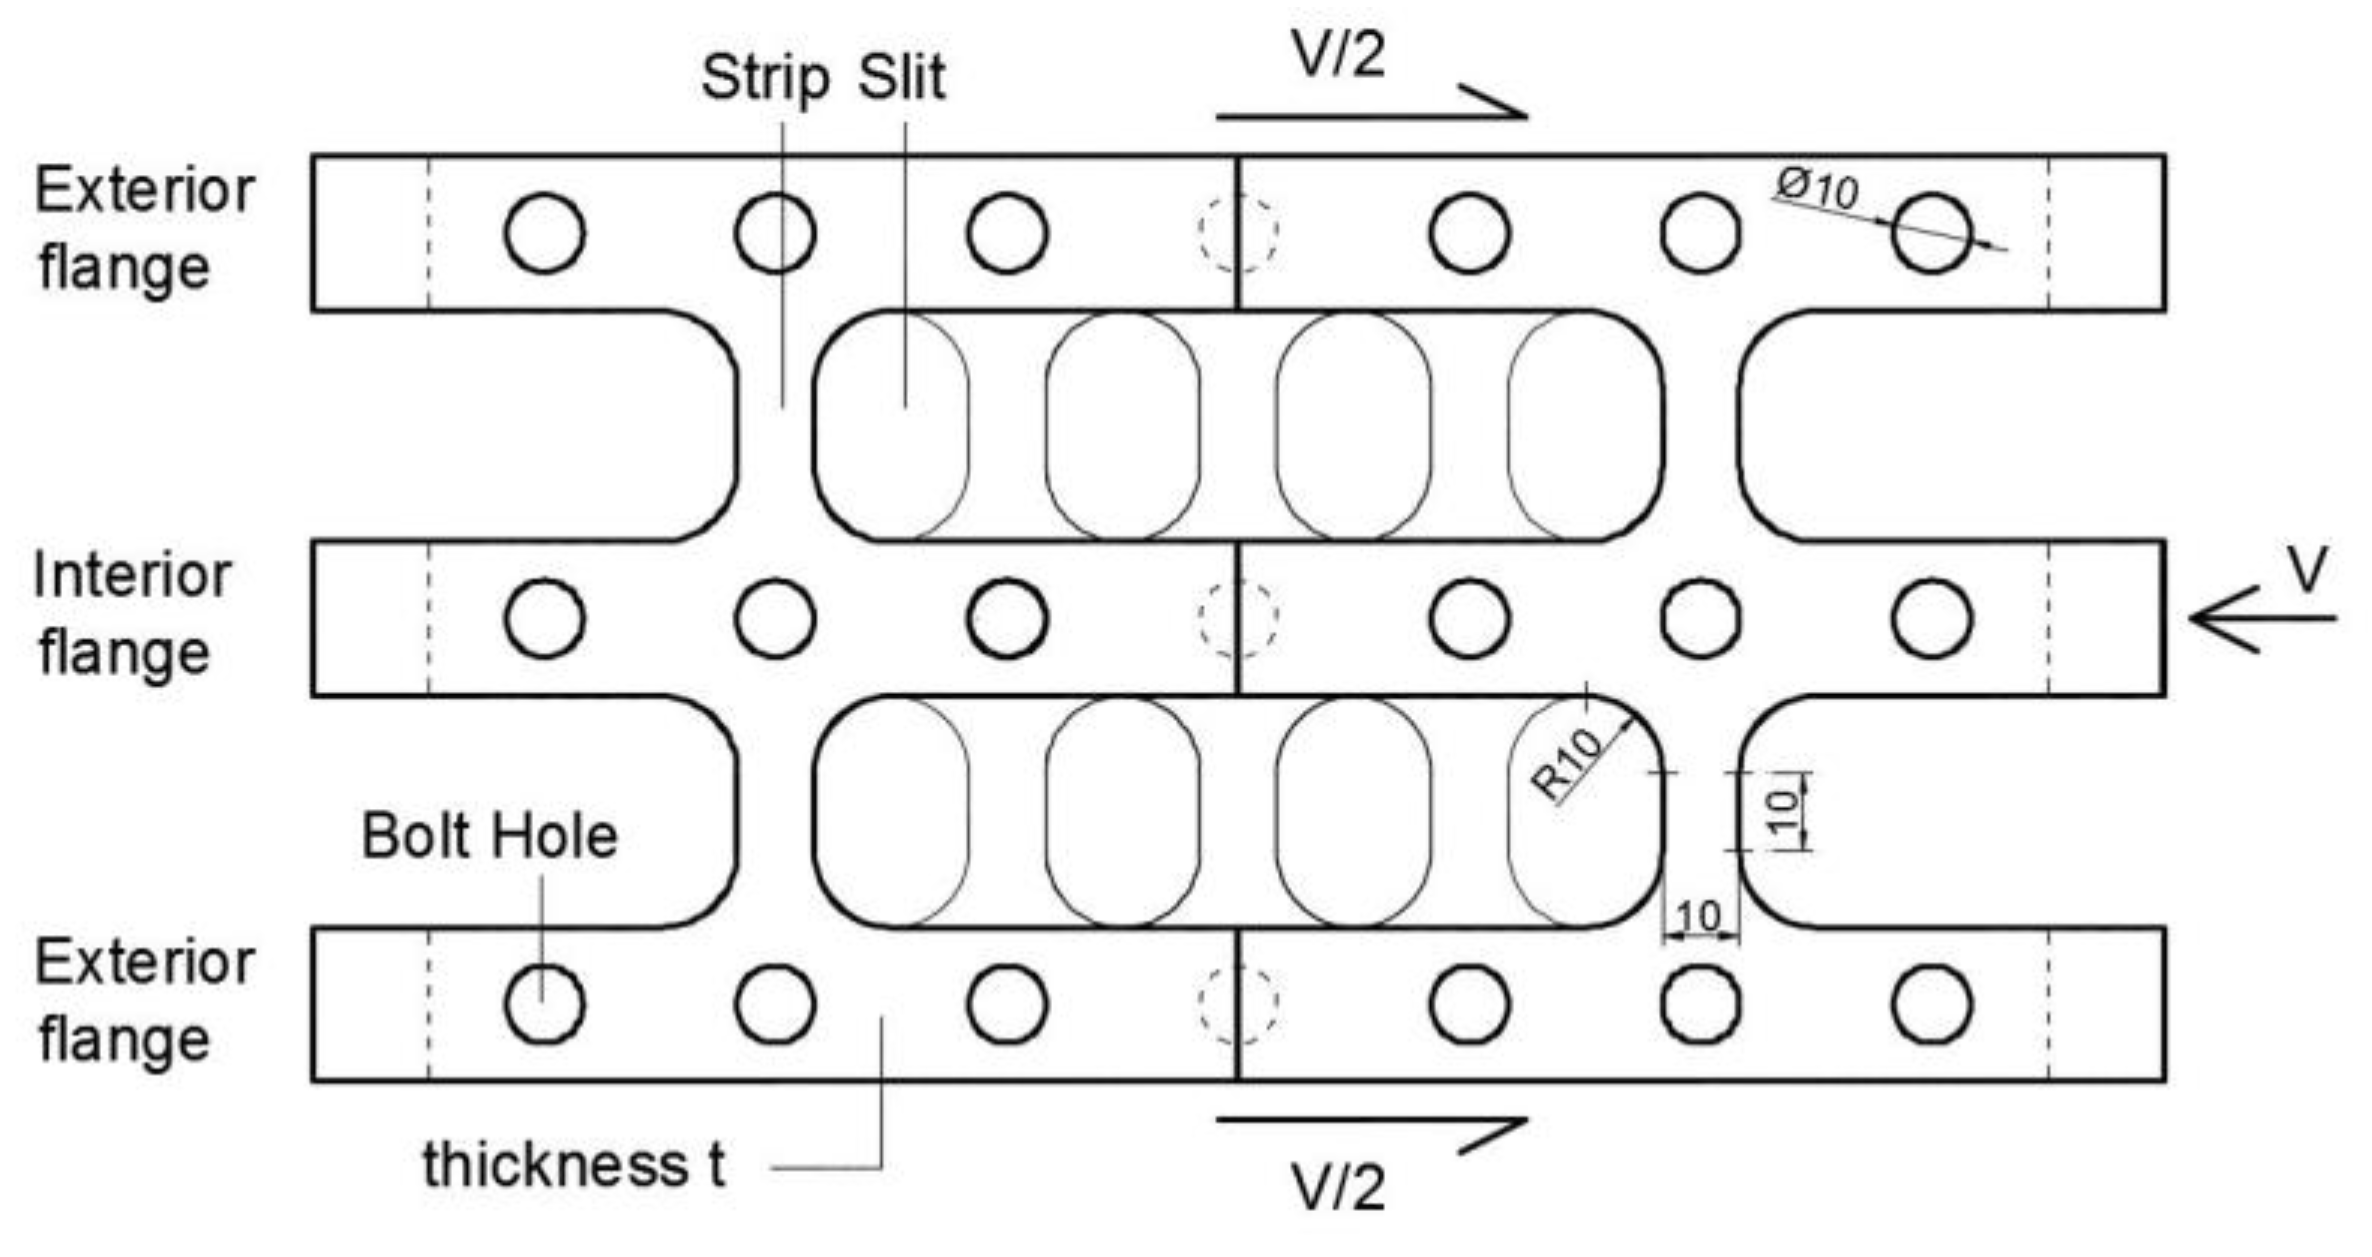
This paper focuses on a particular type of hysteretic damper developed by the authors that uses stainless steel plates with slits, as shown in Figure 2. The strips of steel between slits behave like small columns whose ends undergo plastic flexural and shear deformations when the steel plate with slits is subjected to the shear force V seen in Figure 2. This damper will be referred to as the “slit damper” hereafter.
An alternative to the visual inspection of dampers to evaluate damage is the use of sophisticated Non Destructive Testing (NDT) methods. Vibration tests have been widely used in the literature [2] to perform modal analysis and to relate the damage to relative variations of modal damping and natural frequencies. In the past, the authors investigated a NDT method consisting of vibration tests [3,4,5,6,7,8] conducted with piezoceramic sensors attached to the hysteretic damper. In this context, the present paper investigates the application of pulse-echo Ultrasonic Tests (UT) as an alternative to the vibration method, to quantitatively assess the level of damage in a “slit plate” damper. Some previous investigations regarding the damage of steel components have involved the Ultrasonic Testing [9,10]. However, no other work has applied the ultrasonic testing for the inspection of seismic dampers with a validation by means of a reliable mechanical index.
Based on the elastic waves obtained by means of the pulse-echo UT inspection along the entire thickness of the plate, a new damage index referred to as UT index hereafter, is proposed. The UT index is based on quantitative evaluation of changes in the energy of the transmitted-wave spectrum induced by the presence of damage in the strips of the plates. The new UT index is compared with the mechanical ID index developed in previous investigations, demonstrating a very good correlation at all the considered levels of damage. To calculate the ID index, it is necessary to know the load-displacement relationship experienced by the damper during the cyclic loading, and this requires expensive instrumentation. In contrast, the new UT index can be reliably used to evaluate the level of damage on “slit plate” dampers with no need to know the load-displacement relationship endured by the damper.
2. Description of the Hysteretic Dampers
Figure 2 shows the “slit plate” hysteretic damper investigated and its typical geometry. It is built from a steel plate by cutting a number of slits that leave a number of strips between them. The slit plate is fixed to the main structure in such a way that when the building is subjected to seismic loadings, the two exterior flanges of the slit plate are forced to move together in the same direction, but in the opposite sense from the interior flange. The exterior and interior flanges are fixed to the structure of the building in such a way that each strip between slits can be described as a small “column” with both ends clamped. When the plate is subjected to the forces V/2, V/2 and V, these “columns” undergo in-plane flexural and shear deformations. Plastic deformations take place at both ends of each strip, where the bending moment attains maximum values. One way to materialize this type of hysteretic damper is to use the walls of a steel tube as the slit plate, as in the brace-type hysteretic damper developed by the authors in reference [11].
3. Test Specimens, Experimental Setup and Loading Patterns
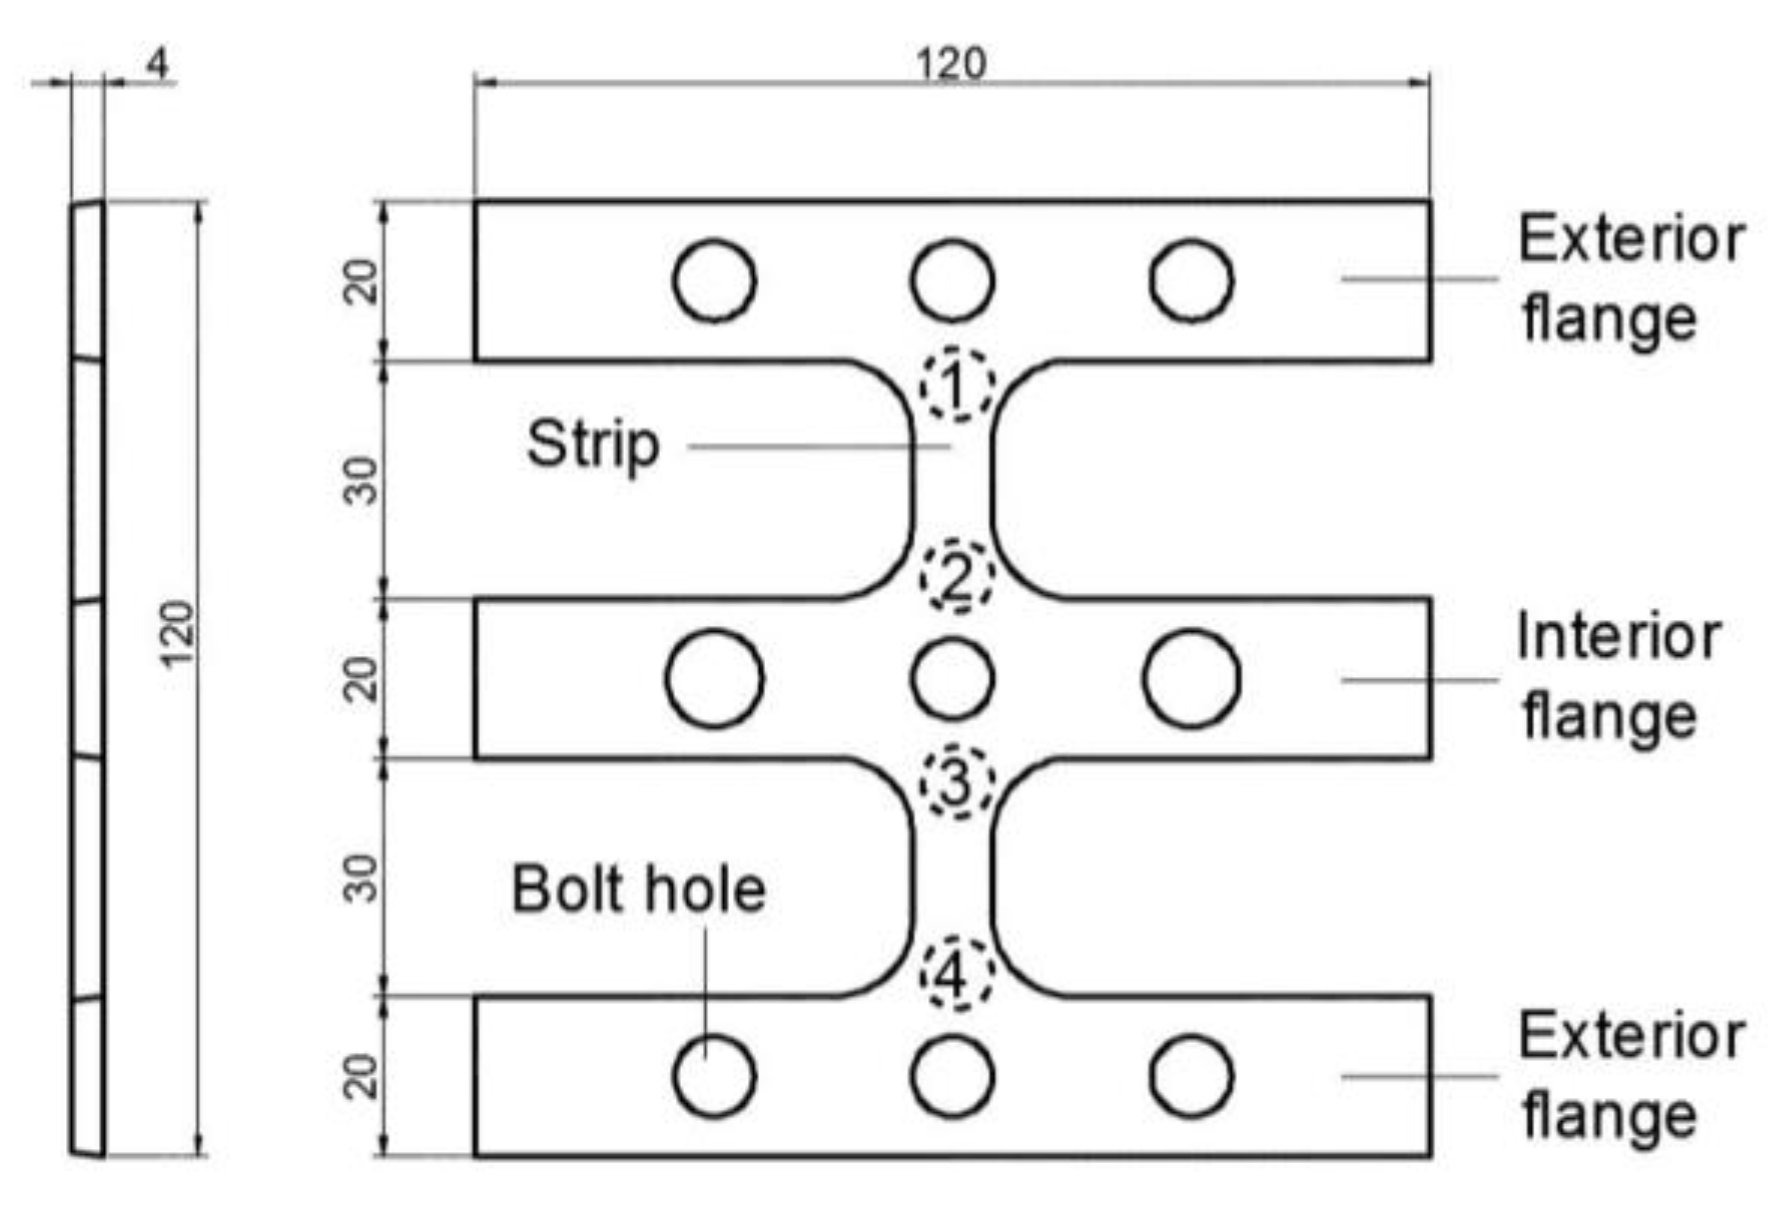
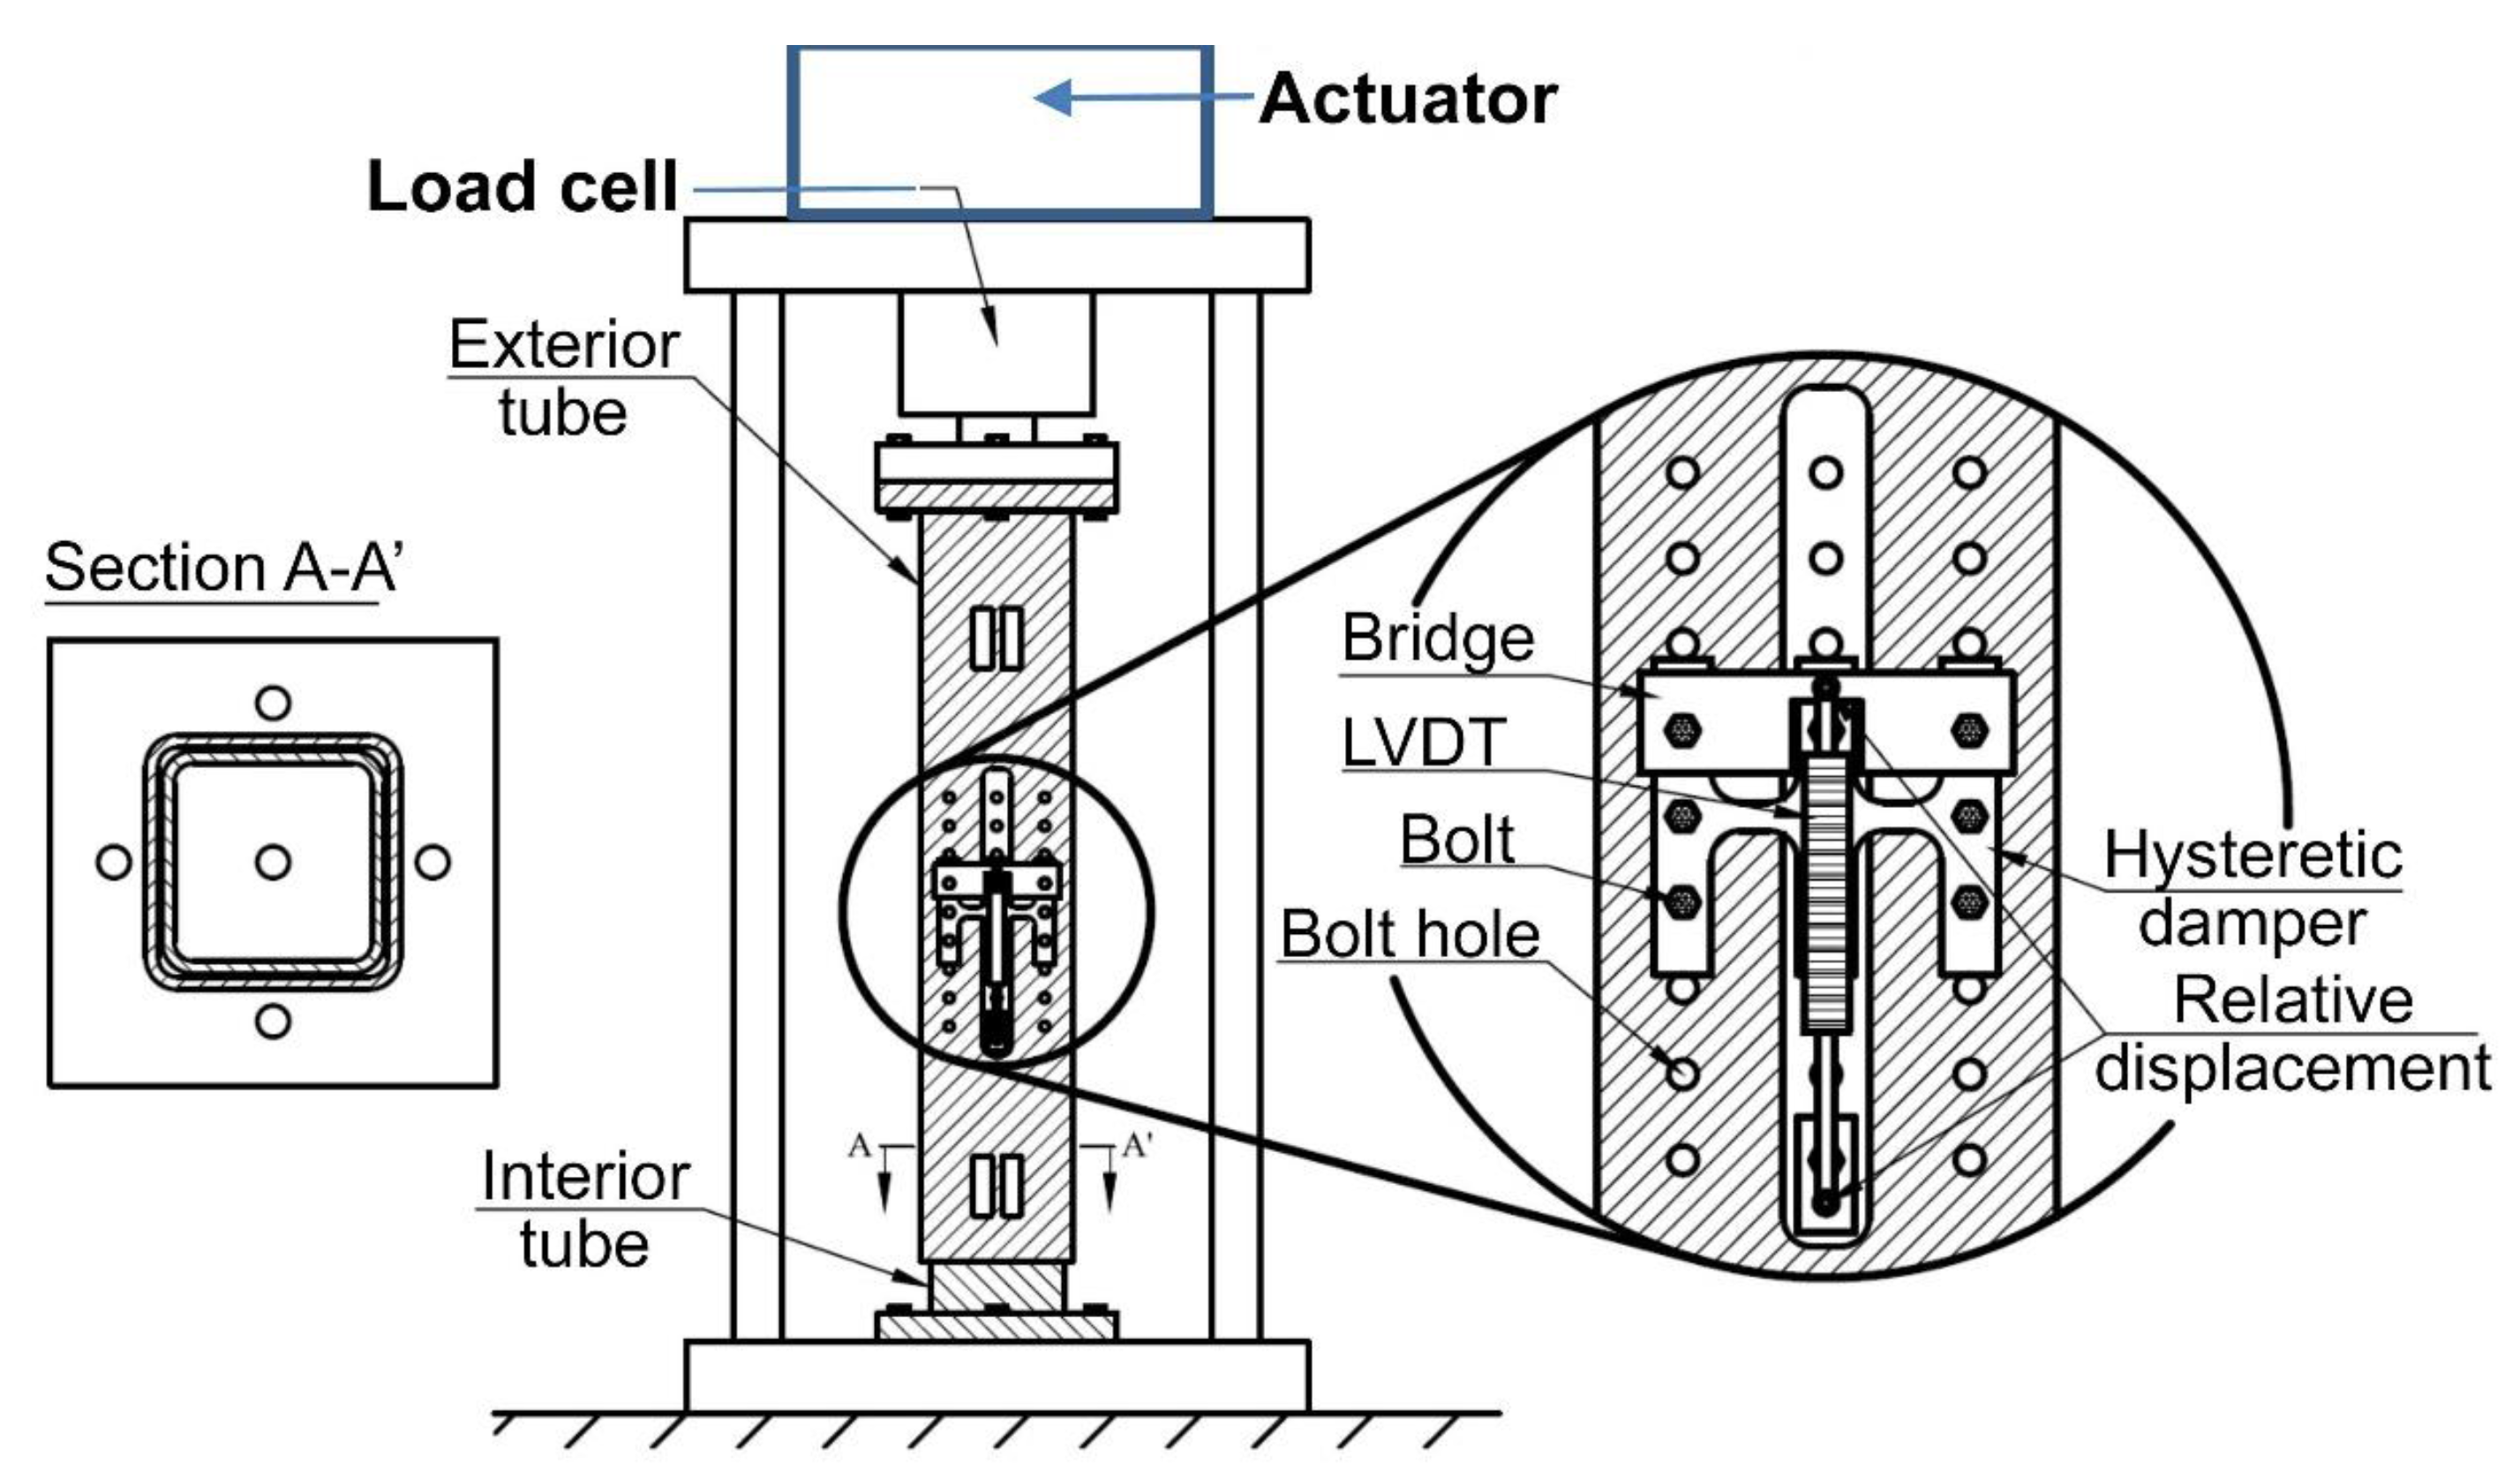
In order to investigate the process of damage in the slit damper, ten test specimens designed and manufactured in University of Granada (Granada, Spain), called as Dissipative Component (DC), similar to that shown in Figure 3, consisting of two strips, were tested. They will be referred to here as DC1 through DC10. The slit plates were made of hot-rolled stainless steel, grade 304-AISI. The holes in the exterior and central flanges served to fix them through bolts to the testing apparatus shown in Figure 4. The apparatus consists of two hollow structural rectangular sections, one inside the other, forming a tube-in-tube configuration. The central flange of the slit plate was fixed with bolts to the interior tube through a longitudinal slit cut in the exterior tube. The exterior flanges of the slit plate were also fixed with bolts to the exterior tube. Thick end plates were welded to the tubes and clamped solidly by bolts to the loading head and to the base of a displacement-controlled universal testing machine SAXEWAY T1000, from the company MOOG Inc. (East Aurora, New York, NY, USA), with a maximum load capacity of 1000 kN. The exterior tube was clamped to the head, and the interior tube to the base of the testing machine.
Forced vertical displacements were applied quasi-statically by the loading head. A load cell installed in the servopulser measured the applied force and two displacement transducers measured the relative displacements of the ends of the strips in the direction of the applied load. The test specimens were subjected to displacement-controlled cyclic tests that induced different levels of damage in the strips.
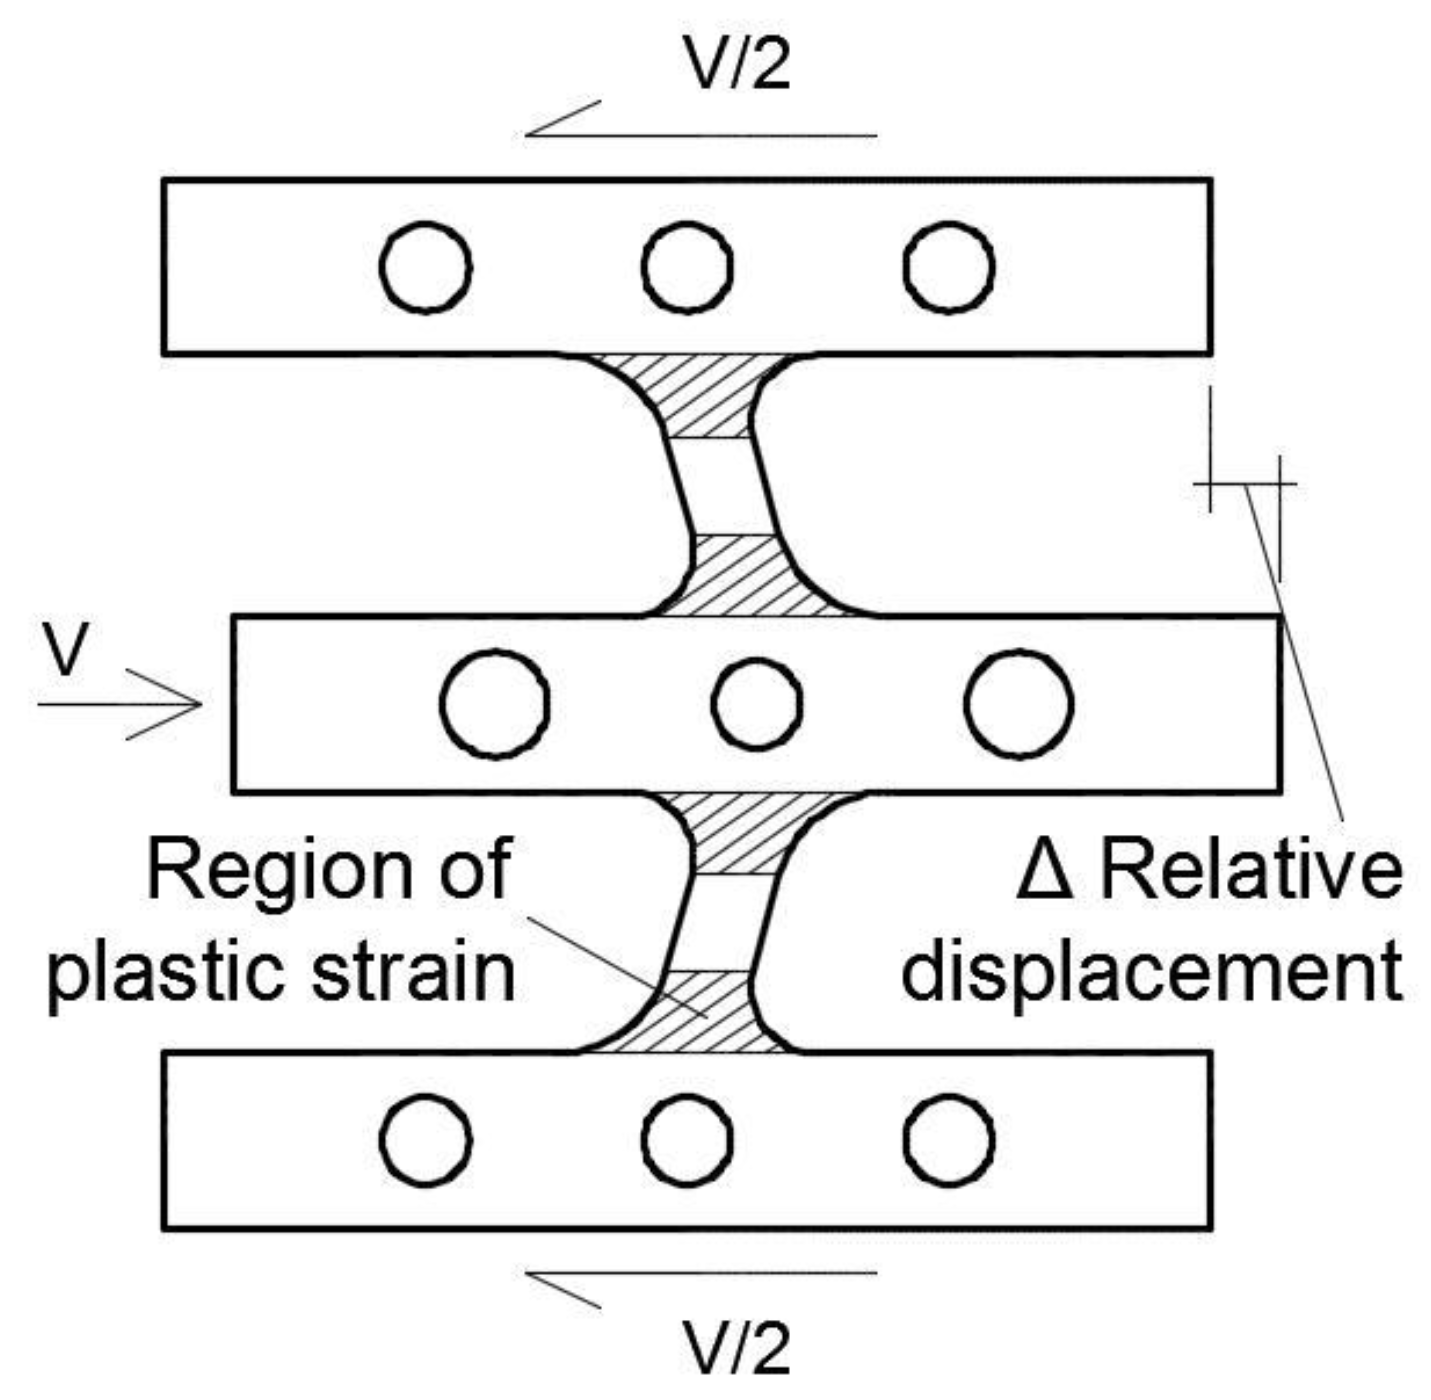
Figure 5 shows the typical deformation pattern of a test specimen. The shaded area indicates the approximate region where plastic deformations take place, and where the seismic energy is released.
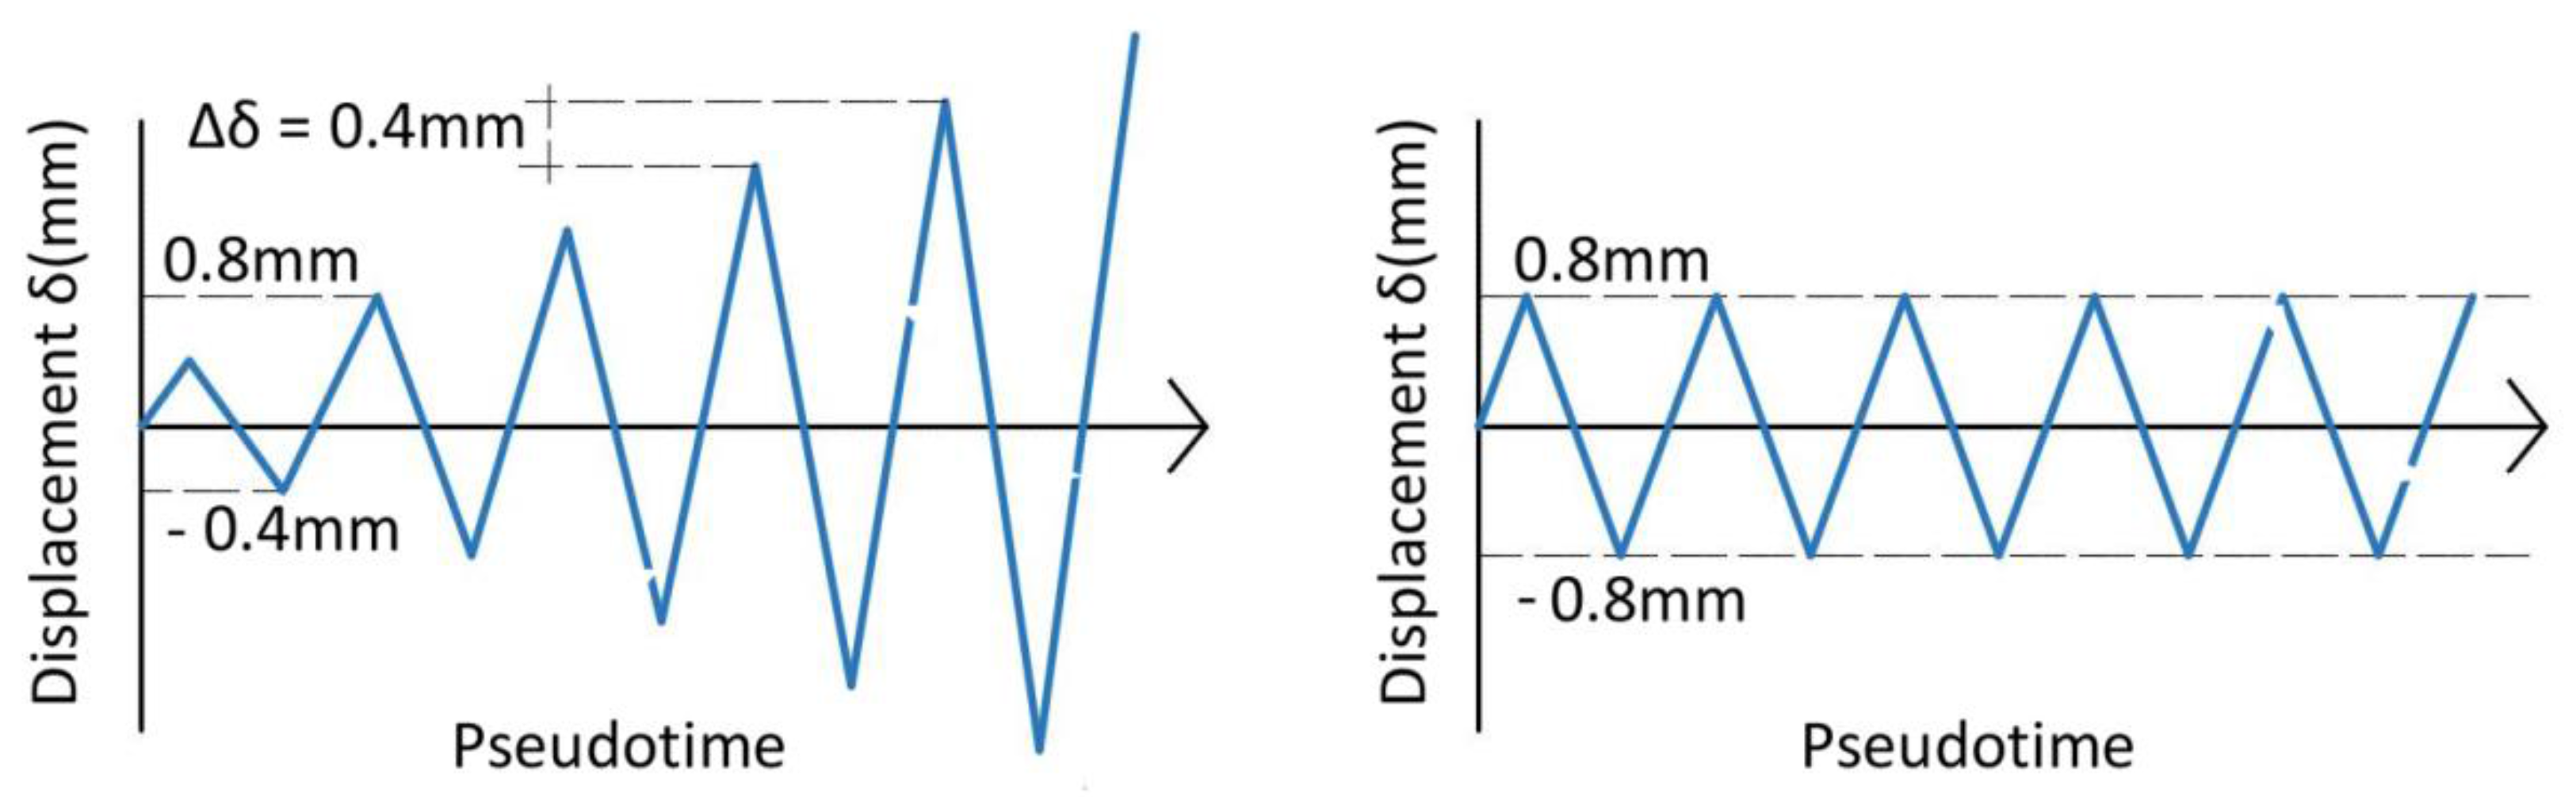
Two different patterns of loading were used: cycles of increasing amplitude and cycles of constant amplitude, as shown in Figure 6. Specimens DC1 to DC5 were subjected to cycles of increasing amplitude, 0.4 mm in each cycle. Each of the specimens DC1 to DC5 was subjected to a different number of cycles in order to induce a different level of damage Di, as indicated in Table 1. Thus, test specimen DC1 was subjected to two cycles and reached the damage level referred to as D1; test specimen DC2 was subjected to six cycles and reached the level of damage D2, and so on.
Test specimens DC6 to DC10 were subjected to cycles of constant amplitude equal to 0.8 mm. Each specimen was subjected to a different number of cycles, ranging from 30 to 150, in order to induce a different level of damage (Di), as shown in Table 2.
4. Pulse-Echo Ultrasonic Test
First, pulse-echo UT was performed with an undamaged specimen (i.e., not subjected to cyclic loading) in order to arrive at the baseline damage level referred to as D0 hereafter. Next, the specimens were subjected to cyclic loading and UT was performed after applying the cyclic loads to characterize each damage level Di. Measurements obtained in both situations, D0 and Di, were compared to each other for each Di.
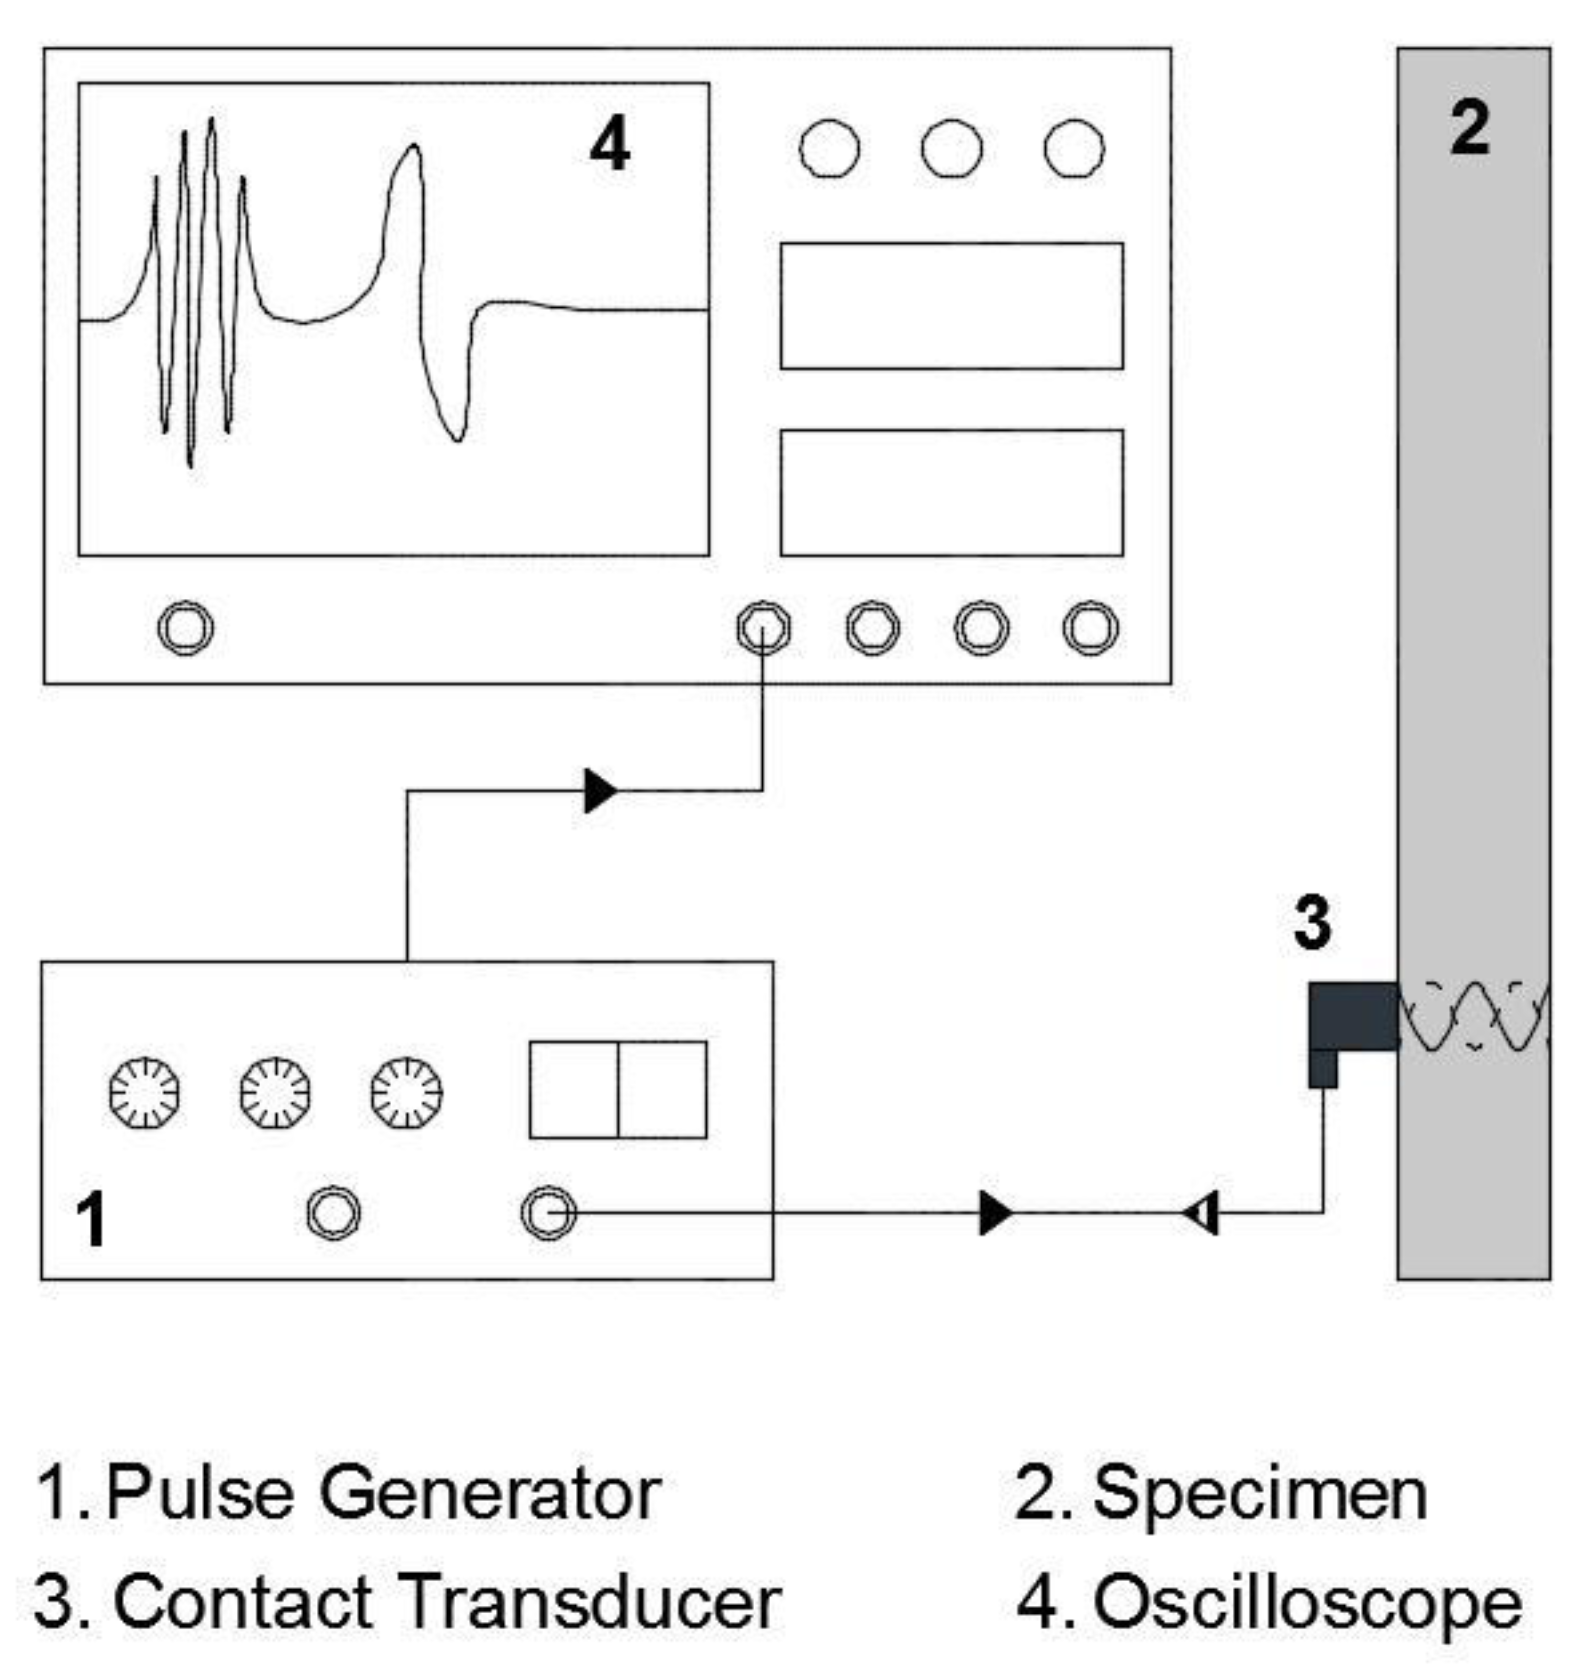
In pulse-echo ultrasonic test, an incident ultrasound wave emitted from a transducer on the surface of the specimen and its echo, i.e., a reflection from another surface, is detected by the same transducer at a later time, after the wave has passed through the specimen and returned, as shown in Figure 7 [12,13]. Pulse-echo is especially effective when only one side of the material is accessible. A V1091 Olympus 5 MHz transducer and silicone grease for acoustic coupling was used in all cases.
A pulse of 3 V peak and 0.4 μs of duration generated by the pulse generator 5072PR from OLYMPUS was used as the input signal. It was amplified by 40 dB. A frequency of 10 kHz was used for input pulse repetition, which means a pulse every 100 μs, and a sampling frequency of 250 MHz. Both echo and input signals were registered by an oscilloscope Tektronix DPO4034B for ulterior analysis. Figure 7 shows the UT experimental setup.
For each specimen, UT was performed at the 4 points (see Figure 3), at which plastic deformation is expected according to Figure 5. Similarly, three trials were carried out at each point.
After pulse-echo UT experiments, echo signals were suitably preprocessed in order to isolate the first part of the waves, which is supposed to be free of reflections and less affected by distortions produced by other secondary propagation effects. Basically, preprocessing entailed three steps:
- Input signal detection. A threshold of 700 mV was established for picking the arrival time of the wave, designated as t0.
- Echo signal detection. The arrival of the echo signal was calculated as t = d/v; where time t is measured with respect to t0, d is the distance traveled by the wave along the thickness (twice) and v is the P-wave velocity in stainless steel extracted from literature. These values were respectively stated as 8 mm and 5.74 mm/μs. Thus, the output signal arrival time is 1.4 μs, which is in good agreement with experimental observations (Figure 8).
- Windowing of echo signal. A window from 1.5 μs to 1.7 μs was applied to the echo signal. Only this portion, called the main wave (MW) and shown in Figure 8 left, was used for the calculation of the damage index. Beyond 1.7 μs, the signal distorts due to the influence of attenuation, scattering, diffraction, reflections, etc.
Figure 9 shows an example of main waves extracted from UT measurements on specimens DC6–DC10, corresponding to D1 to D5, respectively, and the undamaged state D0. It is clearly observed that amplitude of the echo decreases as damage level increases.
5. Proposed Damage Index
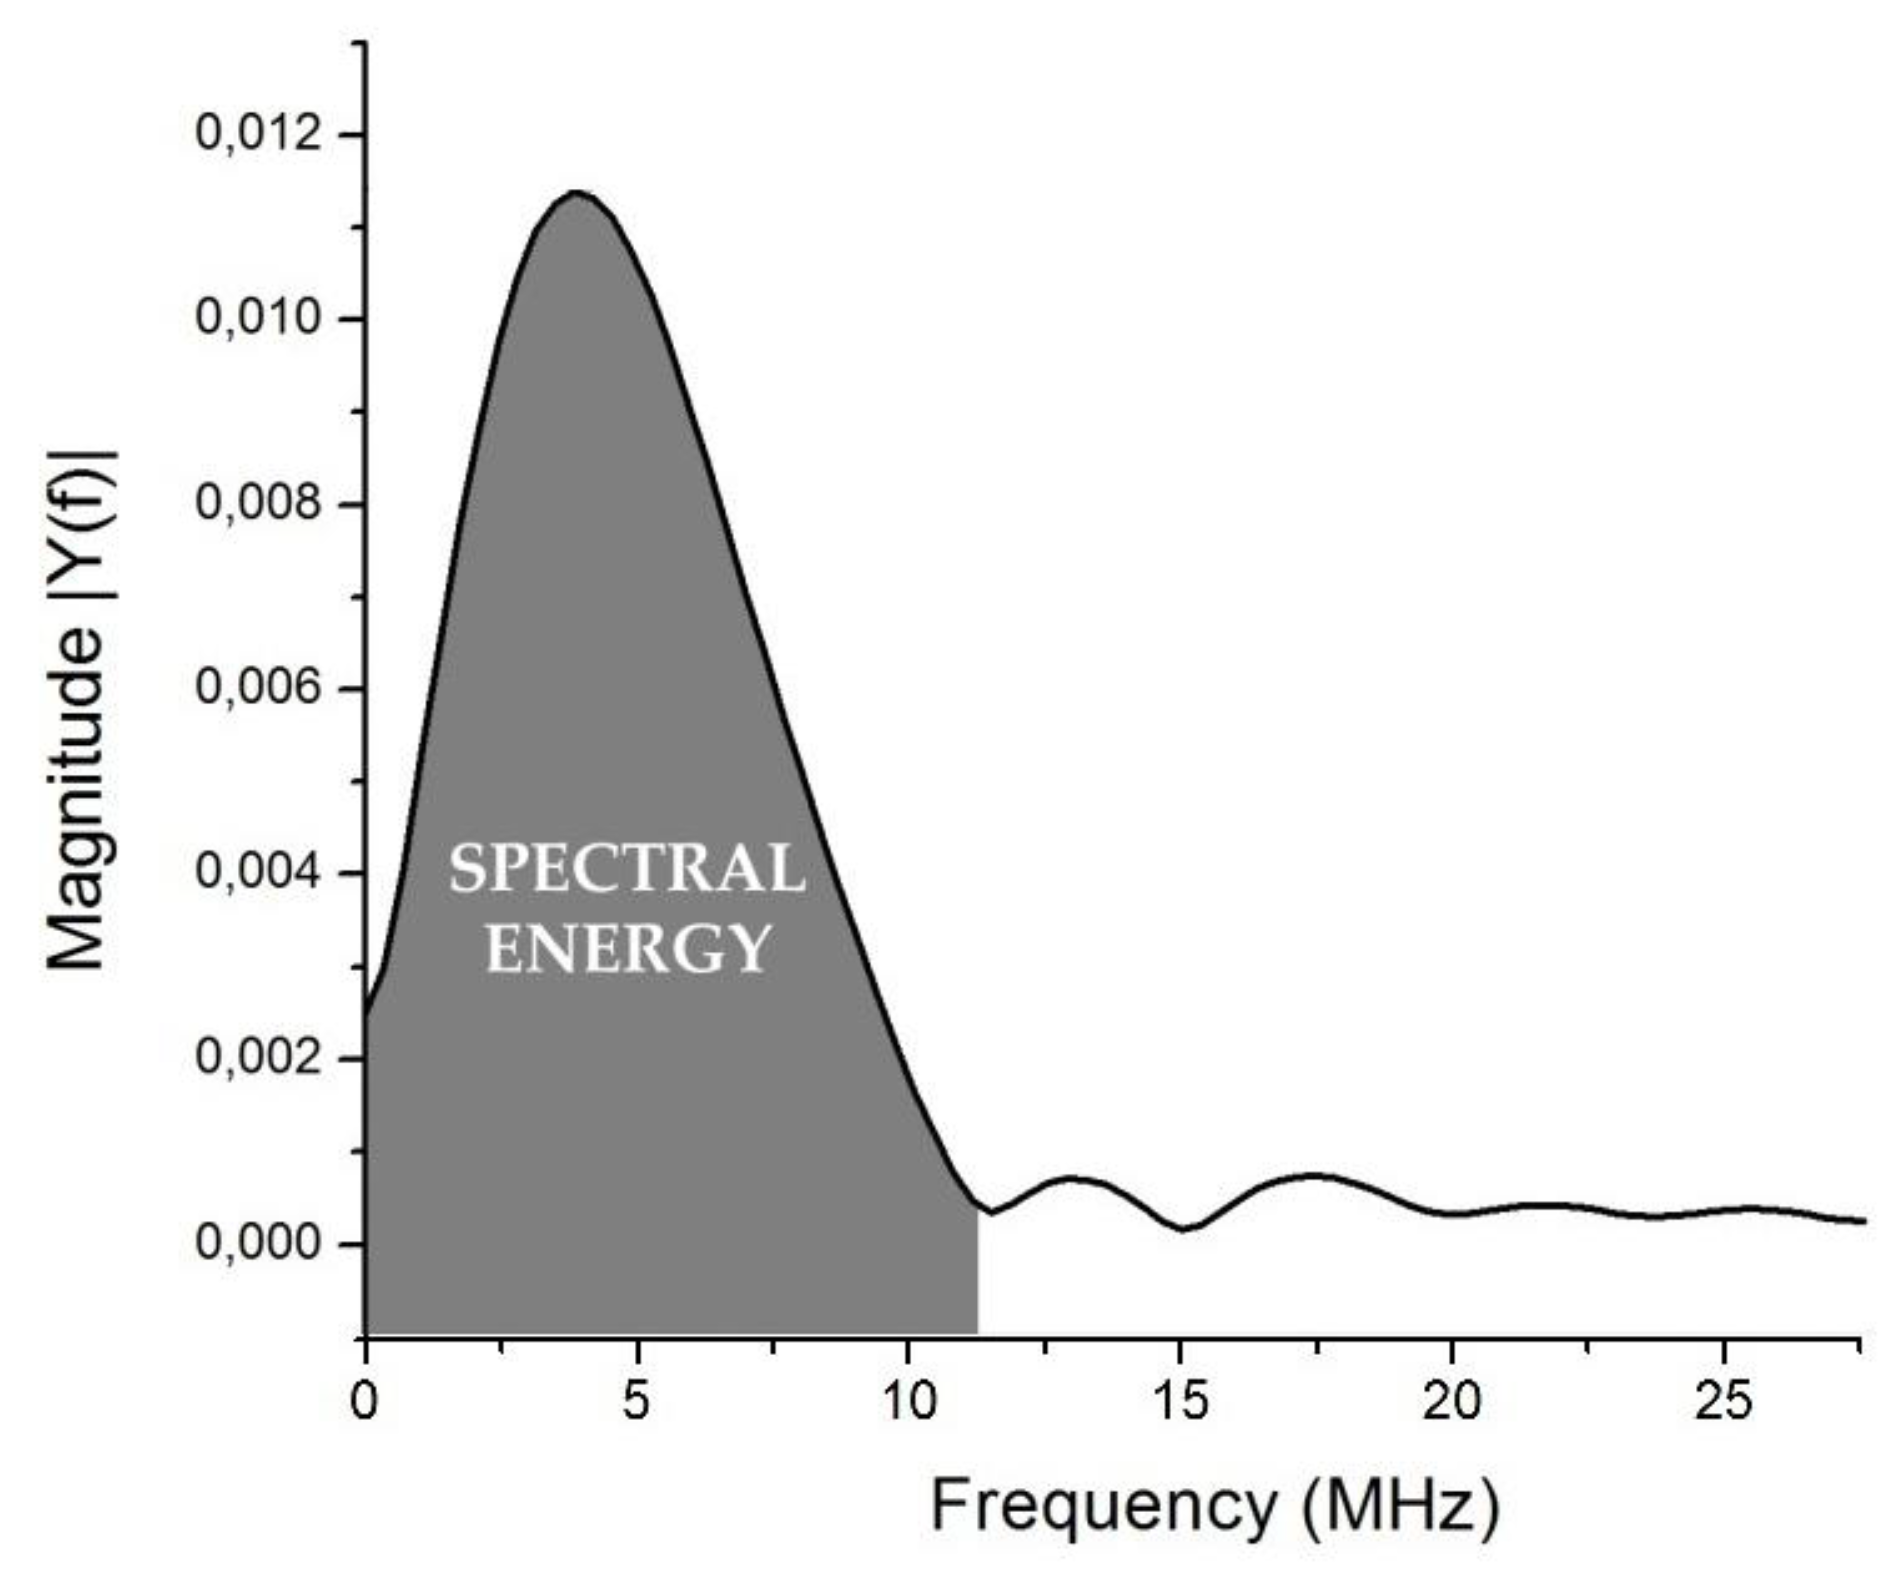
The MW extracted from the echo signals was carefully processed in order to calculate a proposed UT damage index. Firstly, the Fast Fourier Transform (FFT) was applied to the MW in order to obtain its frequency spectrum [14,15]. In the case of MW signals, spectrums show a central frequency around 5 MHz, and a spectral energy between 0 and 12 MHz named Es, as Figure 10 schematized.
Once the parameter Es is extracted as:
where f is the frequency and |Y(f)| is the magnitude of FFT of the echo signal, its respective value is averaged for all 4 points and 3 trials at each point. According to Figure 10, fmax was selected as 12 MHz.
Using the parameter Es, a UT damage index called ΔE is proposed, as follows:
where Es,0 is the respective value for the undamaged specimens, and Es,i the value for the inspected ones.
6. Mechanical Damage Index ID
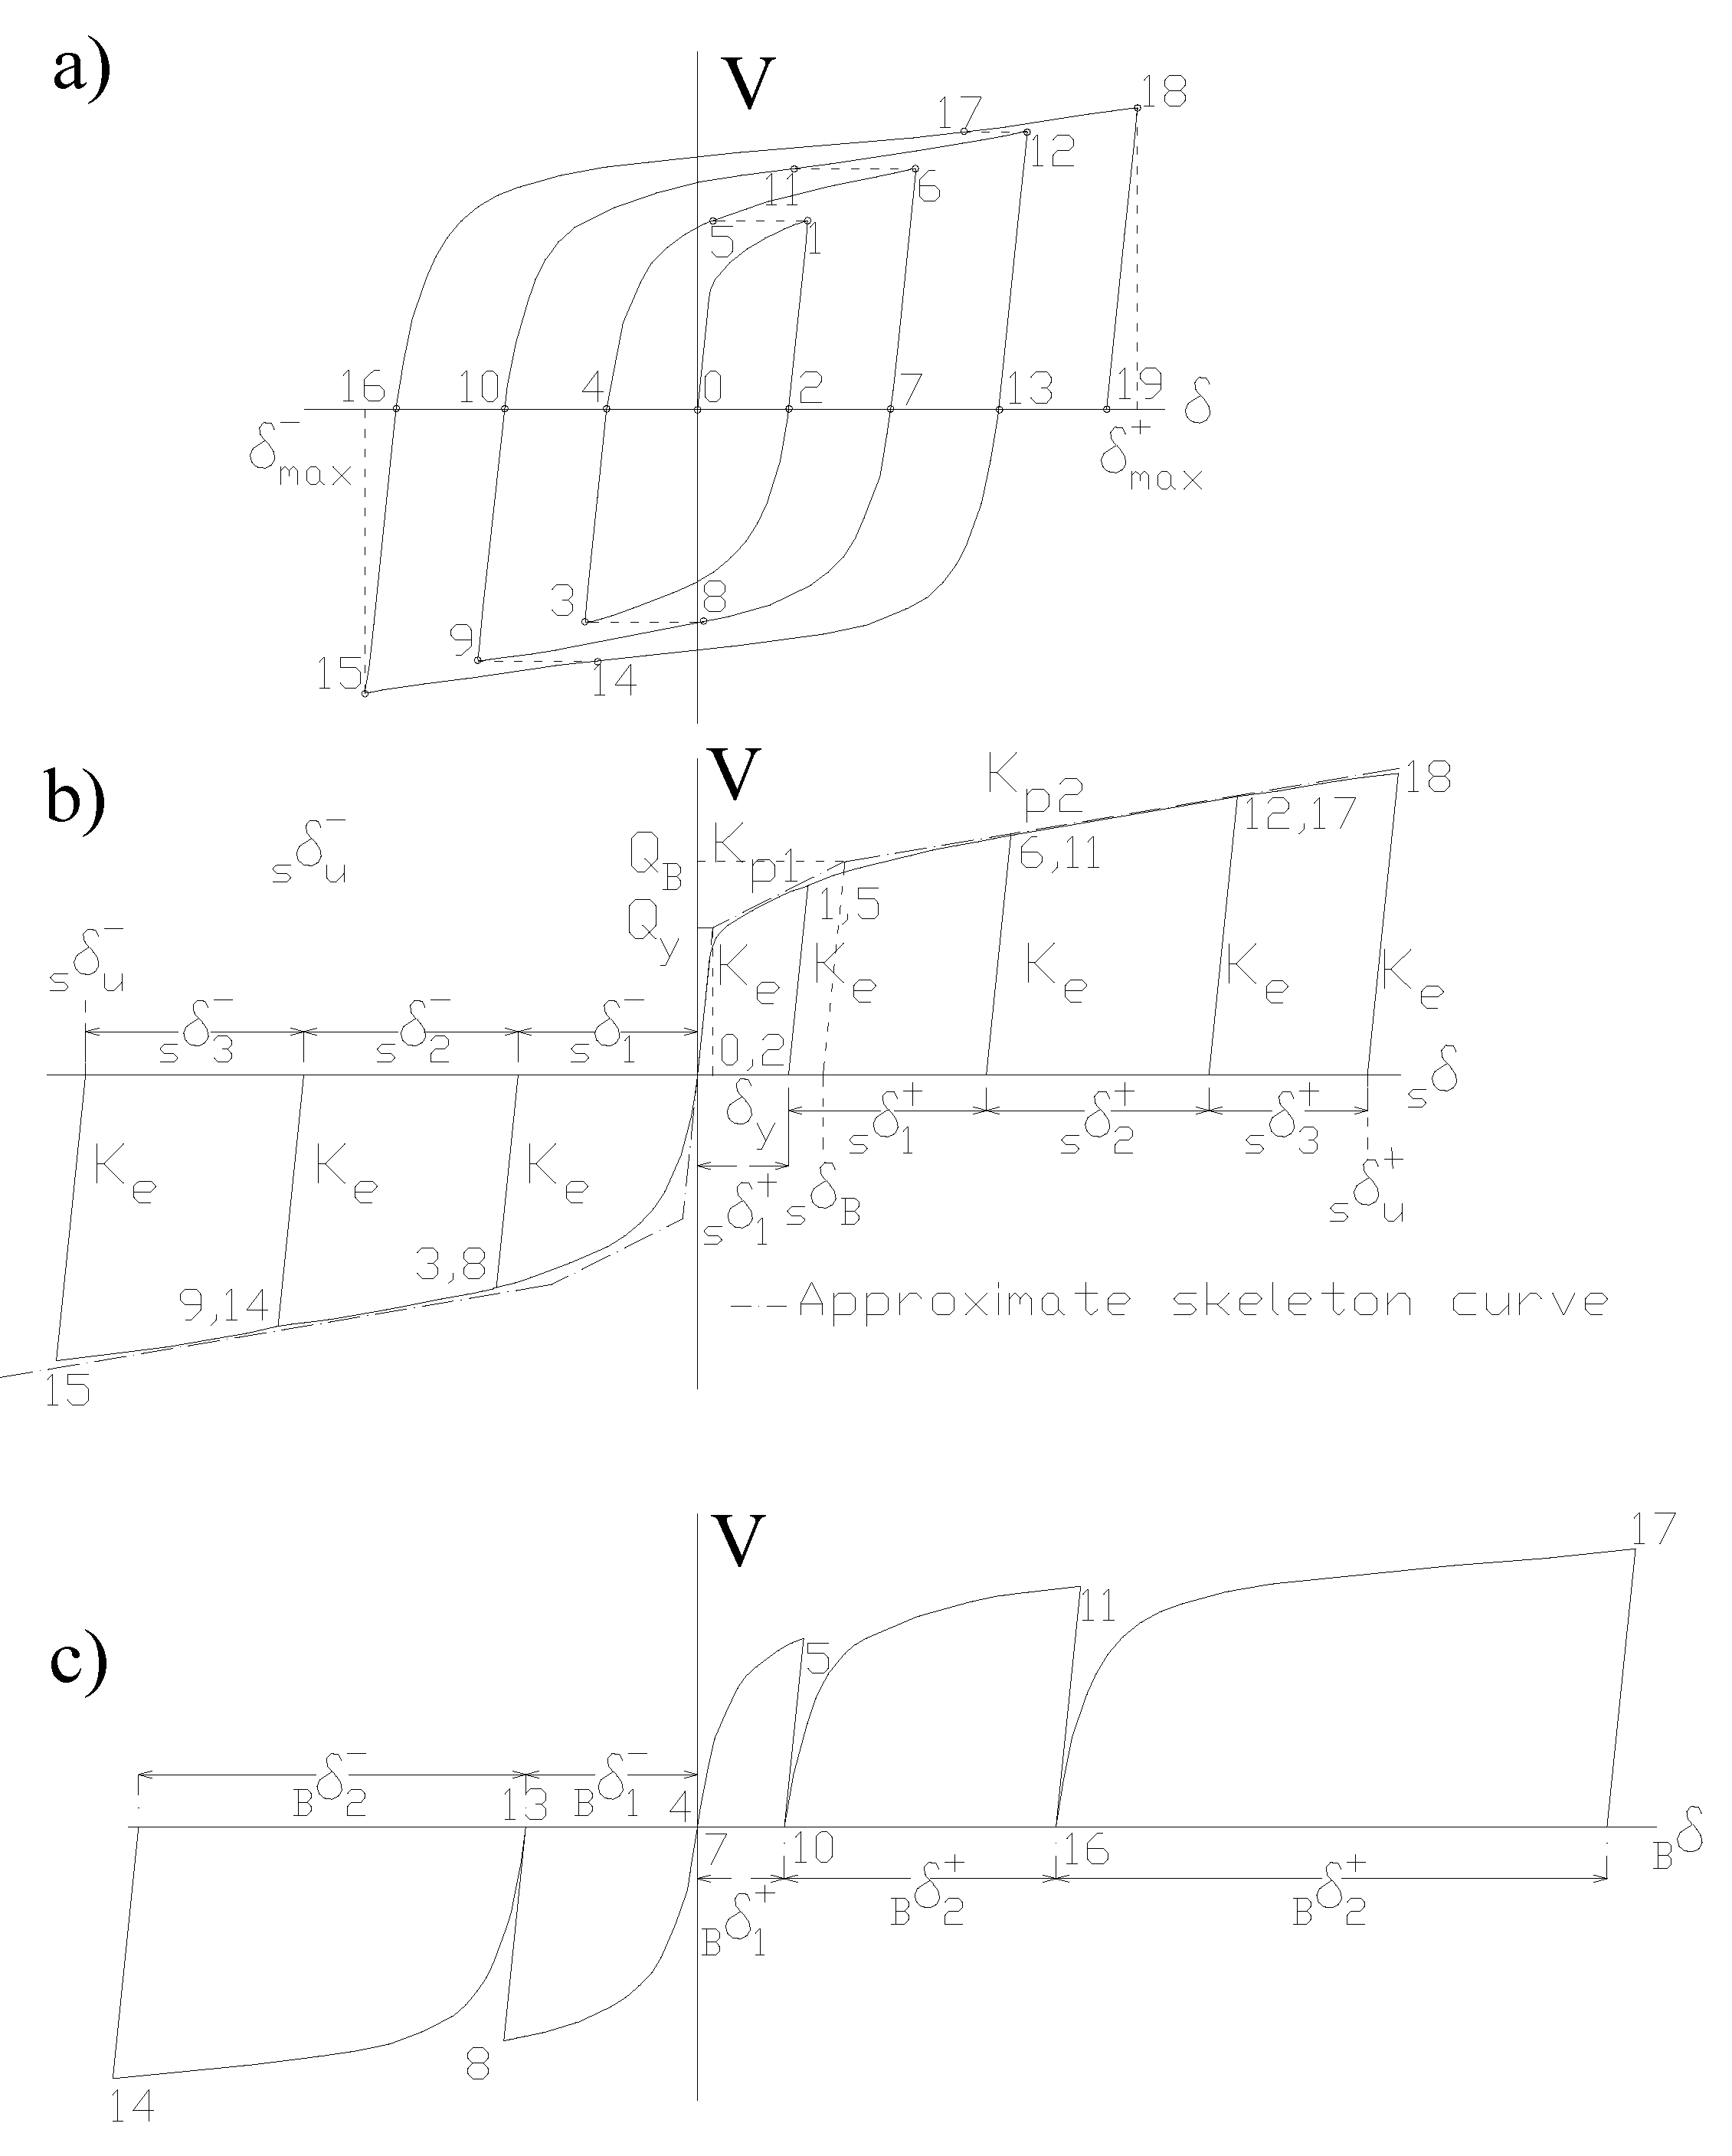
Figure 11a shows the typical load-displacement, V-δ, relationship obtained from the cyclic tests of the hysteretic damper. Here, V is the shear force applied to the damper and δ is the relative displacement between the exterior and central flanges of the damper (Figure 4) caused by the force V and measured in the same direction. The V-δ curve exhibited by the test specimen up to a given level of damage Di defined by point i of coordinates (Vi-δi) can be decomposed into the so-called skeleton part and the Bauschinger part [1].
The skeleton part (Figure 11b) is formed by sequentially connecting the segments 0-1, 5-6, 11-12, 17-18 in the positive domain, and 2-3, 8-9, 14-15 in the negative domain. These segments are the paths that exceed the load level attained by the preceding cycle in the same domain of loading. Segments 1-2, 6-7, 12-13, 18-19, 3-4, 9-10 and 15-16 are the unloading paths. For each domain of loading, the area enveloped by the skeleton curve up to a given point (Vi,δi) will be called and . Segments 4-5, 10-11 and 16-17 in the positive domain, and 7-8, 13-14 in the negative domain of loading —which begin at V = 0 and terminate at the maximum load level previously attained in preceding cycles in the same loading domain—are the so-called Bauschinger part (Figure 11c). For each domain of loading, the sum of the areas enveloped by the Bauschinger part up to a given point (Vi,δi) will be referred to as and . The sum in the positive domain, and in the negative domain, constitute the total plastic strain energy dissipated by the damper in each domain of loading. These energies are expressed next in non-dimensional form by the ratios , , , defined as follows:
The mechanical damage in an hysteretic damper subjected to arbitrarily applied cyclic loading up to a point (Vi,δi) can be accurately predicted using the following index proposed in past research [1]:
where
In Equation (5), and represent the ultimate energy dissipation capacity of the damper. This capacity depends on , , , and on two empirical parameters a and b. Parameters a and b depend on the material properties of the steel and on the geometry of the damper. A detailed explanation of these parameters and their value for the type of hysteretic damper investigated can be found in reference [1]. The value IDi = 0 indicates no damage, while IDi = 1 means failure.
Failure of the damper is assumed to occur when the strength starts to decrease steadily under increasing forced displacements. The ultimate energy dissipation capacity of the damper is defined as the total energy dissipated by the damper until failure. After the point of failure, the damper is still able to physically absorb energy.
7. Results
7.1. Evaluation of the Mechanical Index of Damage ID
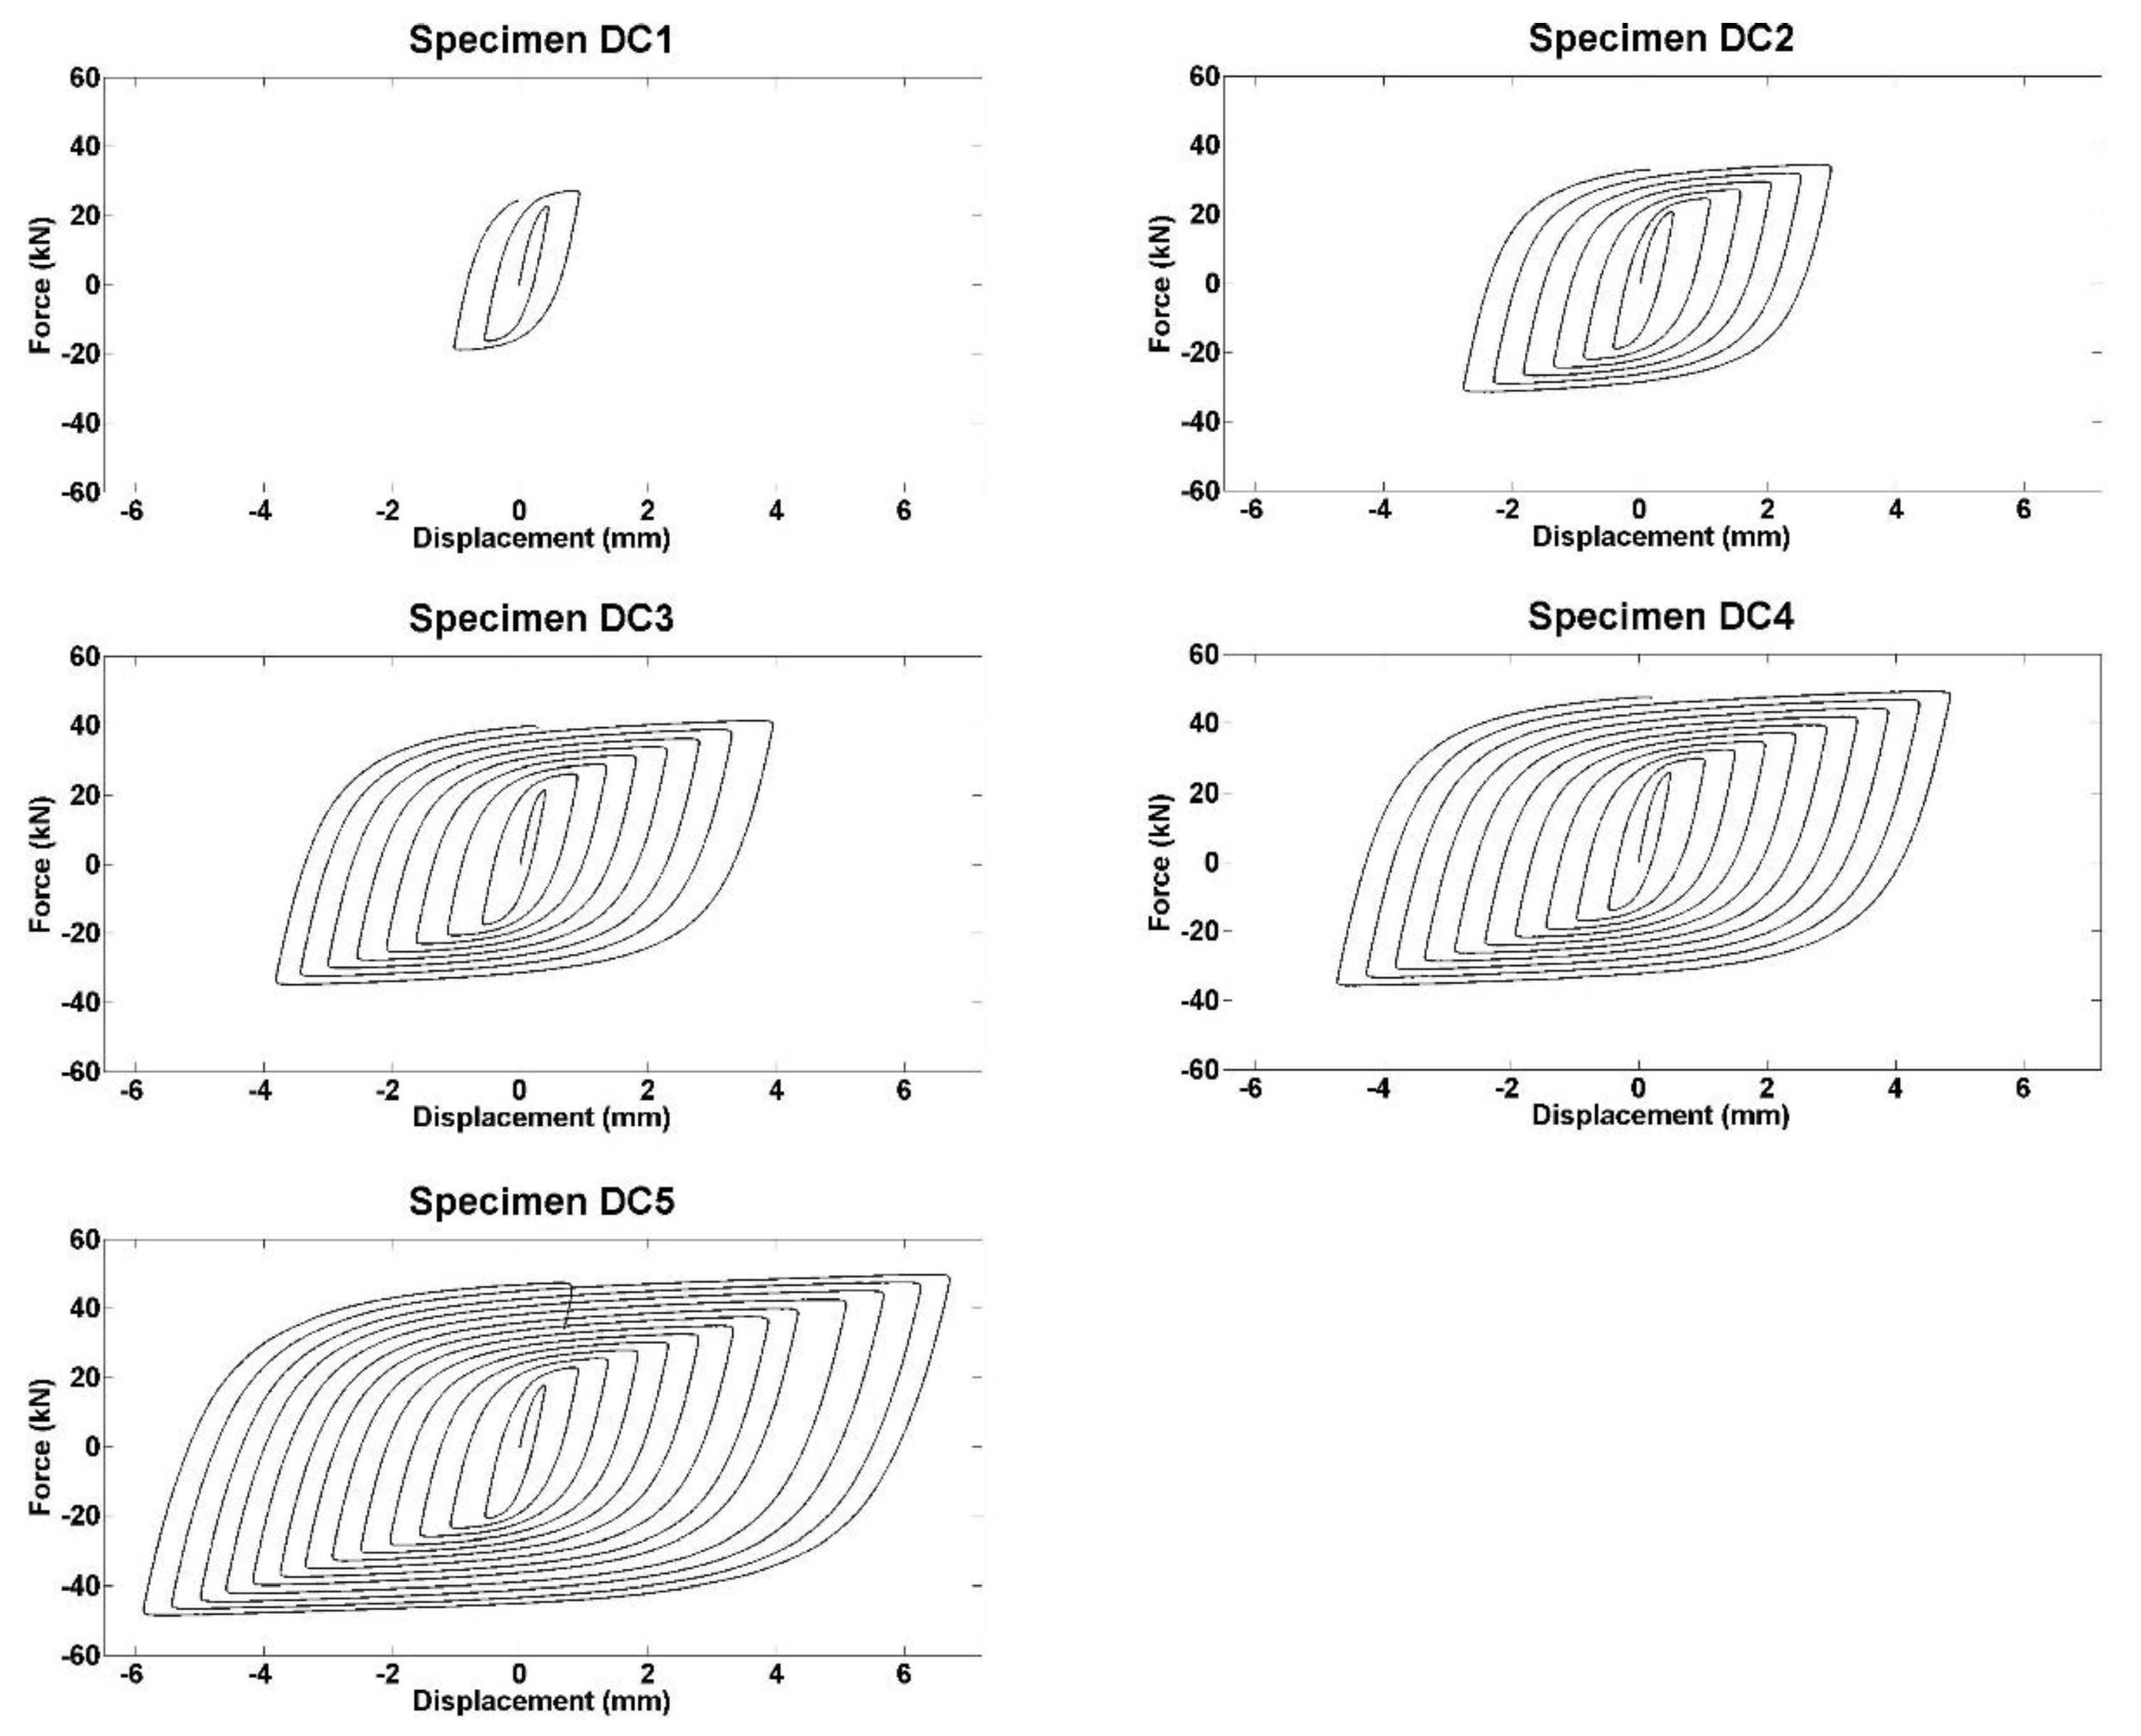
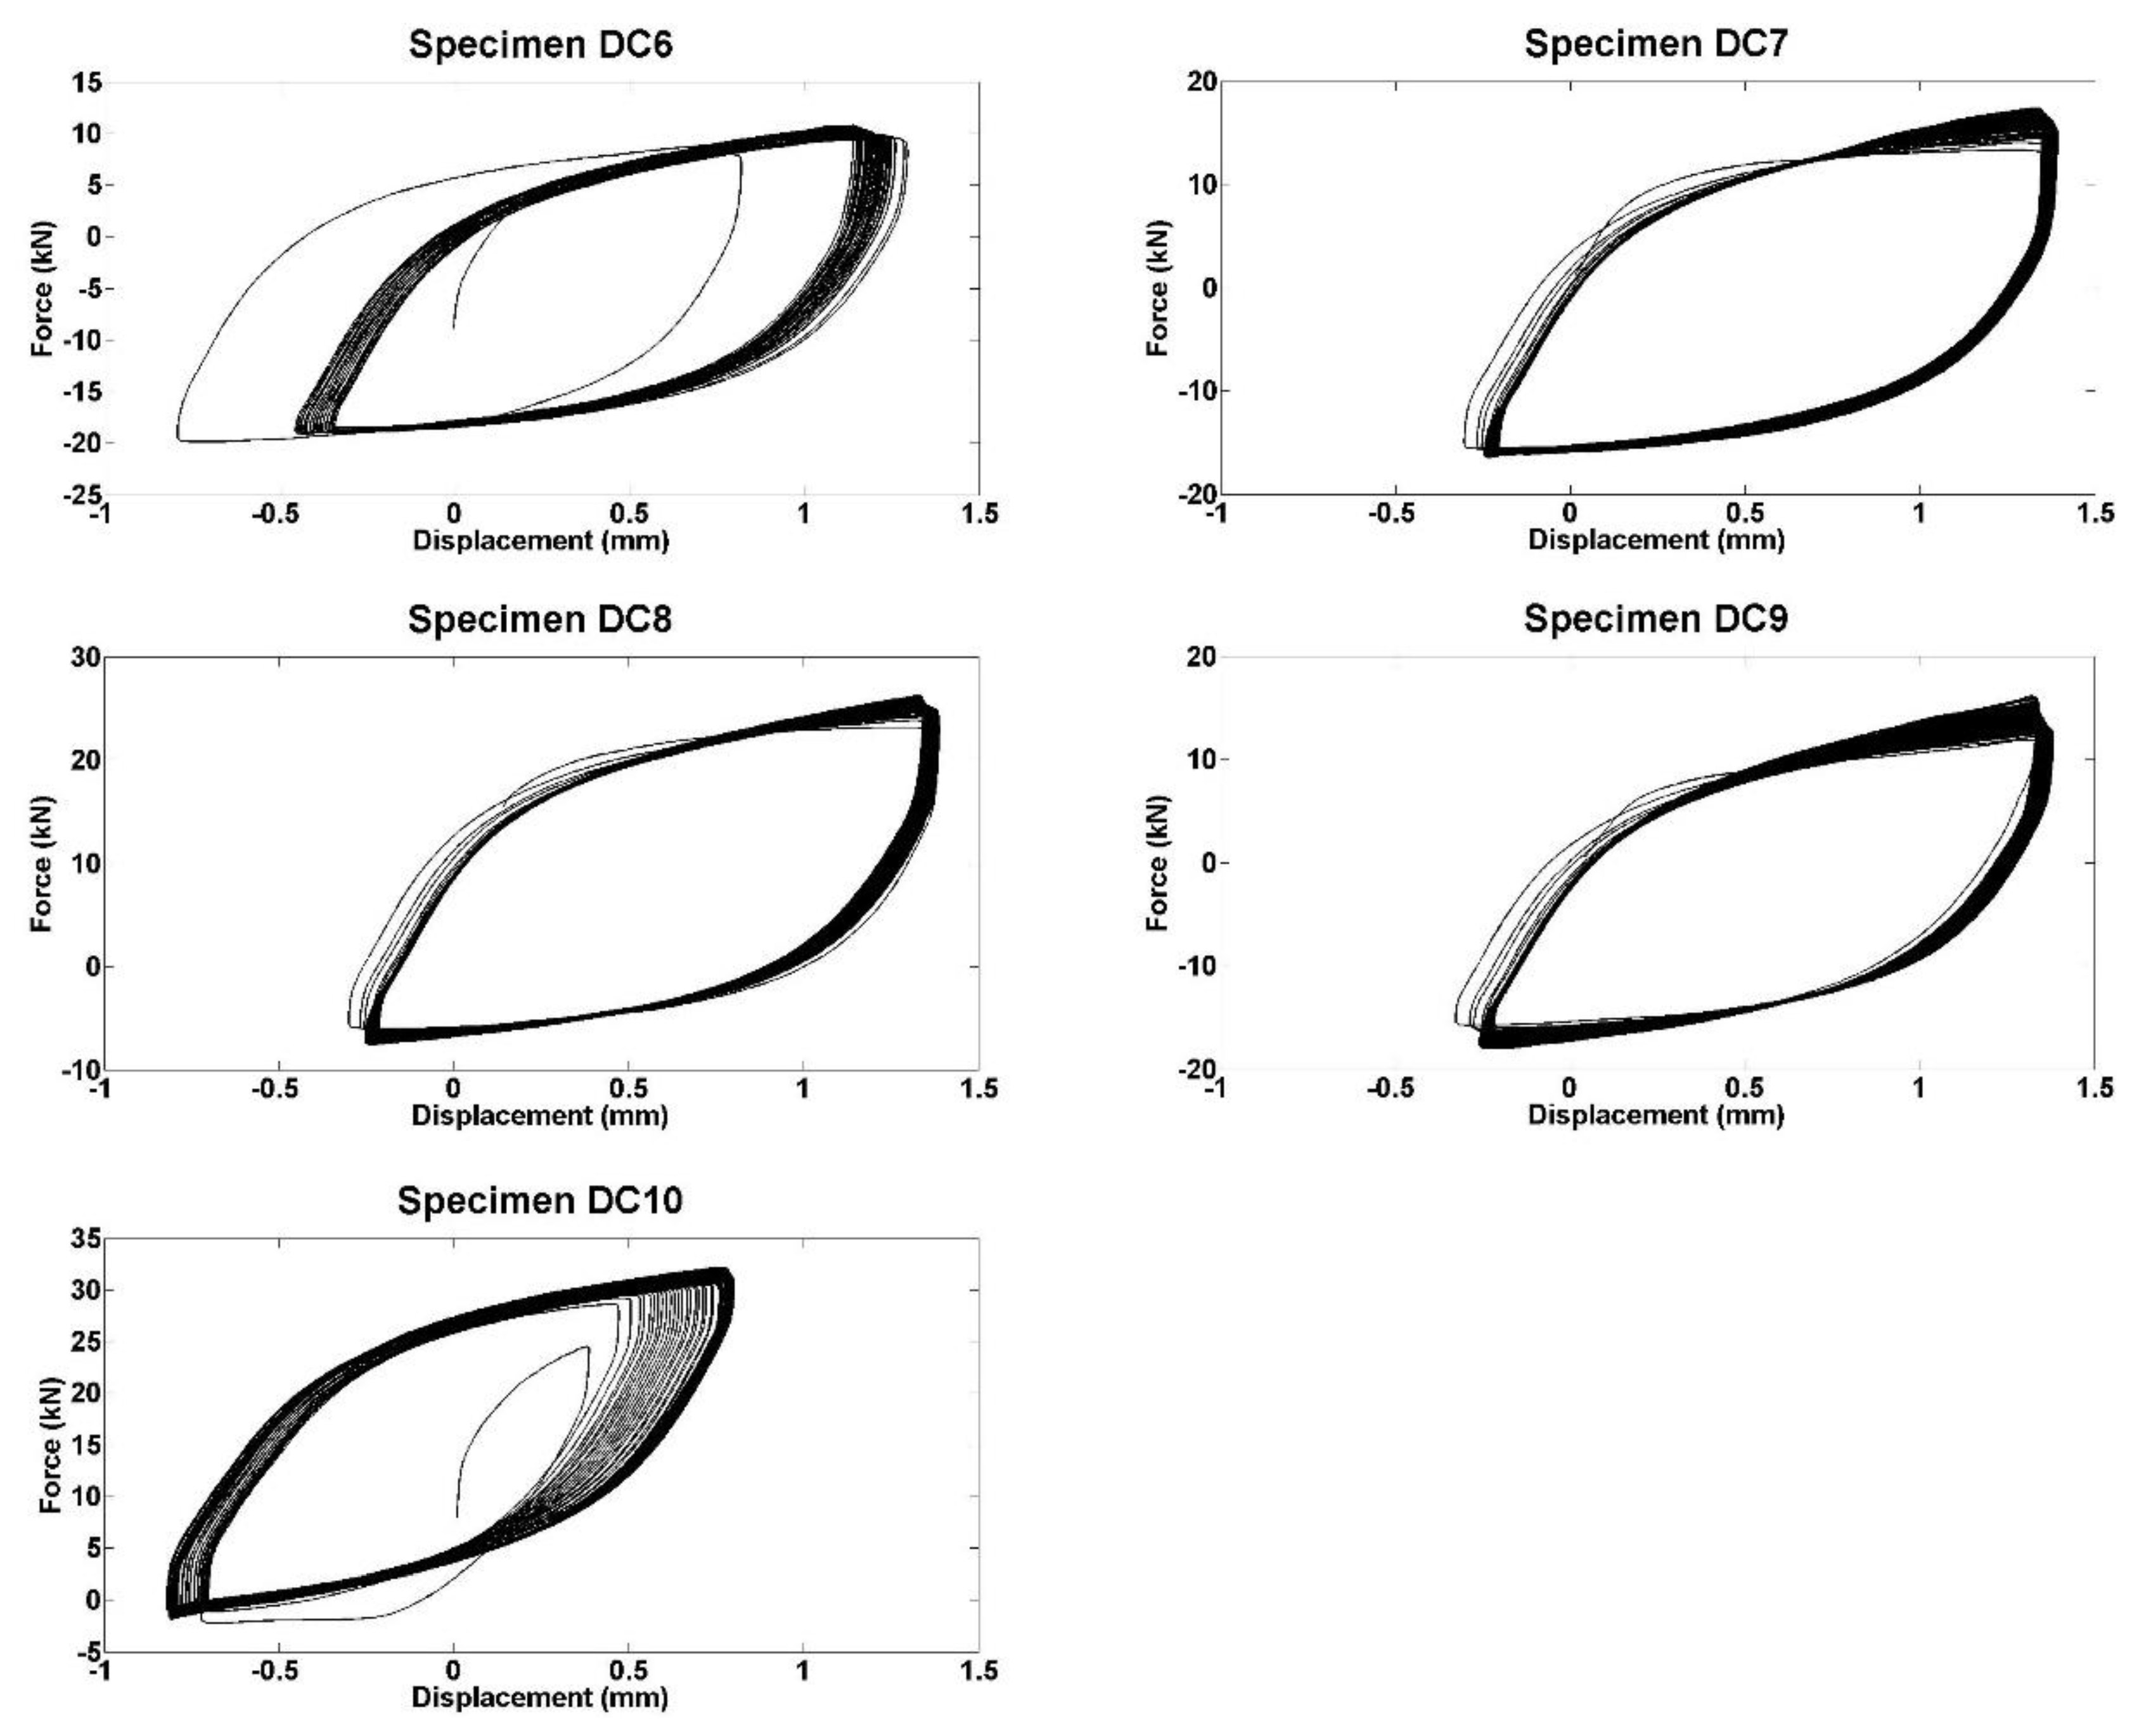
Figure 12 and Figure 13 show the force-displacement curves, V-δ, obtained from the cyclic tests carried out in this work. The V-δ curves of the specimens subjected to cyclic loads of incremental amplitude (specimens DC1 to DC5) are shown in Figure 12, the only difference being the number of V-δ loops. They have in common the fact that the maximum force opposed by the specimen increased in each consecutive cycle, due to the strain hardening of the material. Figure 13 shows the V-δ curves for the specimens subjected to cyclic loads of constant amplitude (specimens DC6 to DC10). Similarly, the maximum force attained by the specimen increased in each consecutive cycle. Table 3 summarizes the mechanical index of damage ID obtained as explained in the previous section.
7.2. Results and Interpretation of UT Inspection
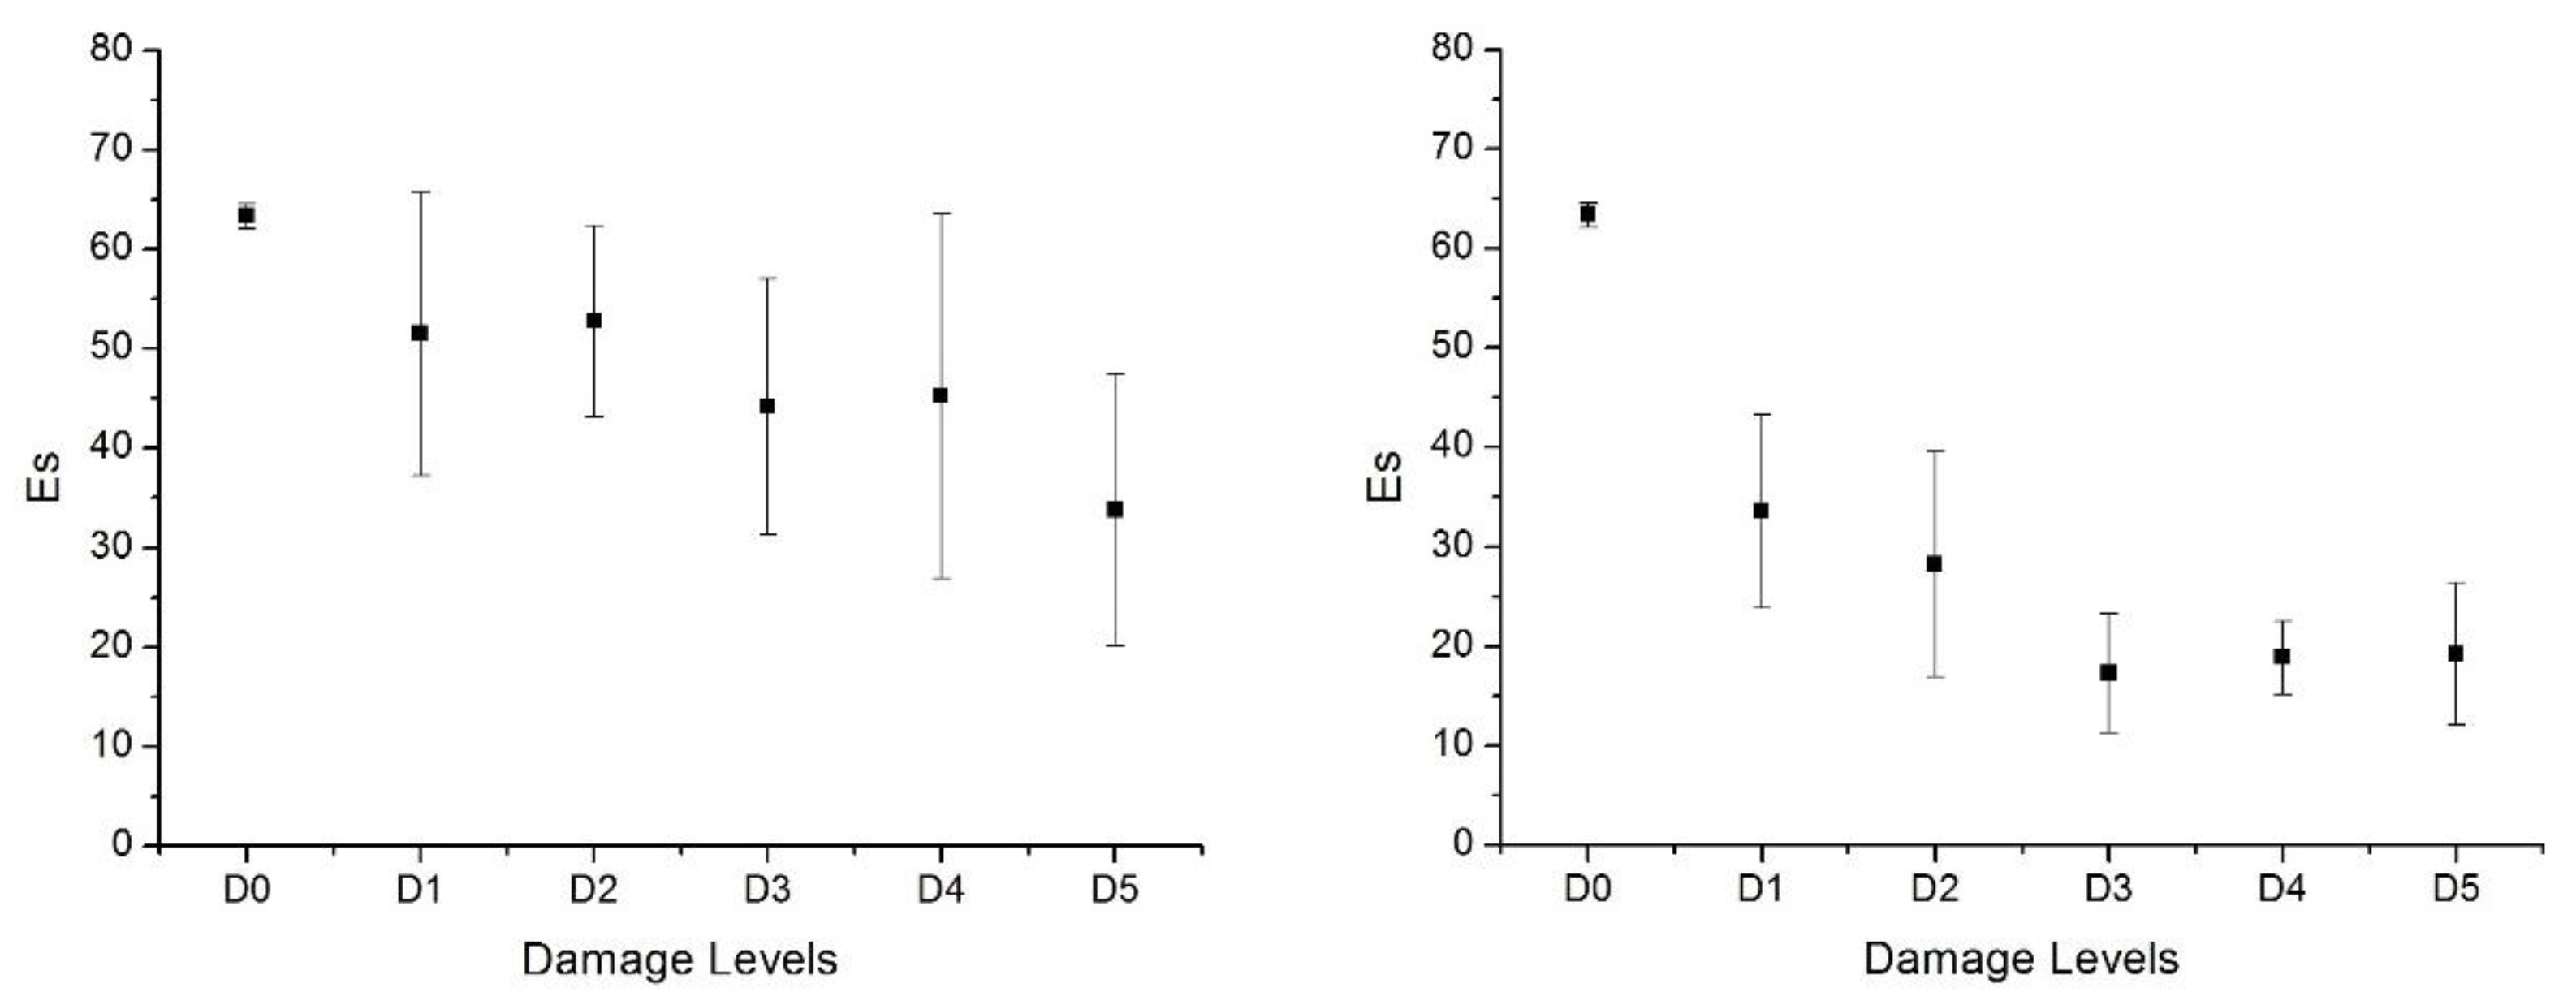
The mean and standard deviation of the parameter Es measured at the four points shown in Figure 3 were calculated for each test specimen. The results are shown in Figure 14 for both loading patterns. In this figure, the abscissa represents the level of damage induced in each test specimen. The values of Es for the undamaged case (D0) are also plotted.
It can be seen that the mean value of Es decreases as the damage level increases, which confirms its sensitivity to the presence of damage caused by plastic deformations in the steel strips of the slit plate, which is in a good agreement with previous investigations about amplitude attenuation of ultrasonic waves [16,17]. It is also observed that the variability over the four measurement points is large for some specimens. This can be due to minor variations in the position of the sensors, or to the fact that although the stress and strain levels at the four points are nominally the same, spurious inaccuracies in the test setup could cause the actual level of plastic deformations to not be homogeneously distributed throughout the specimen.
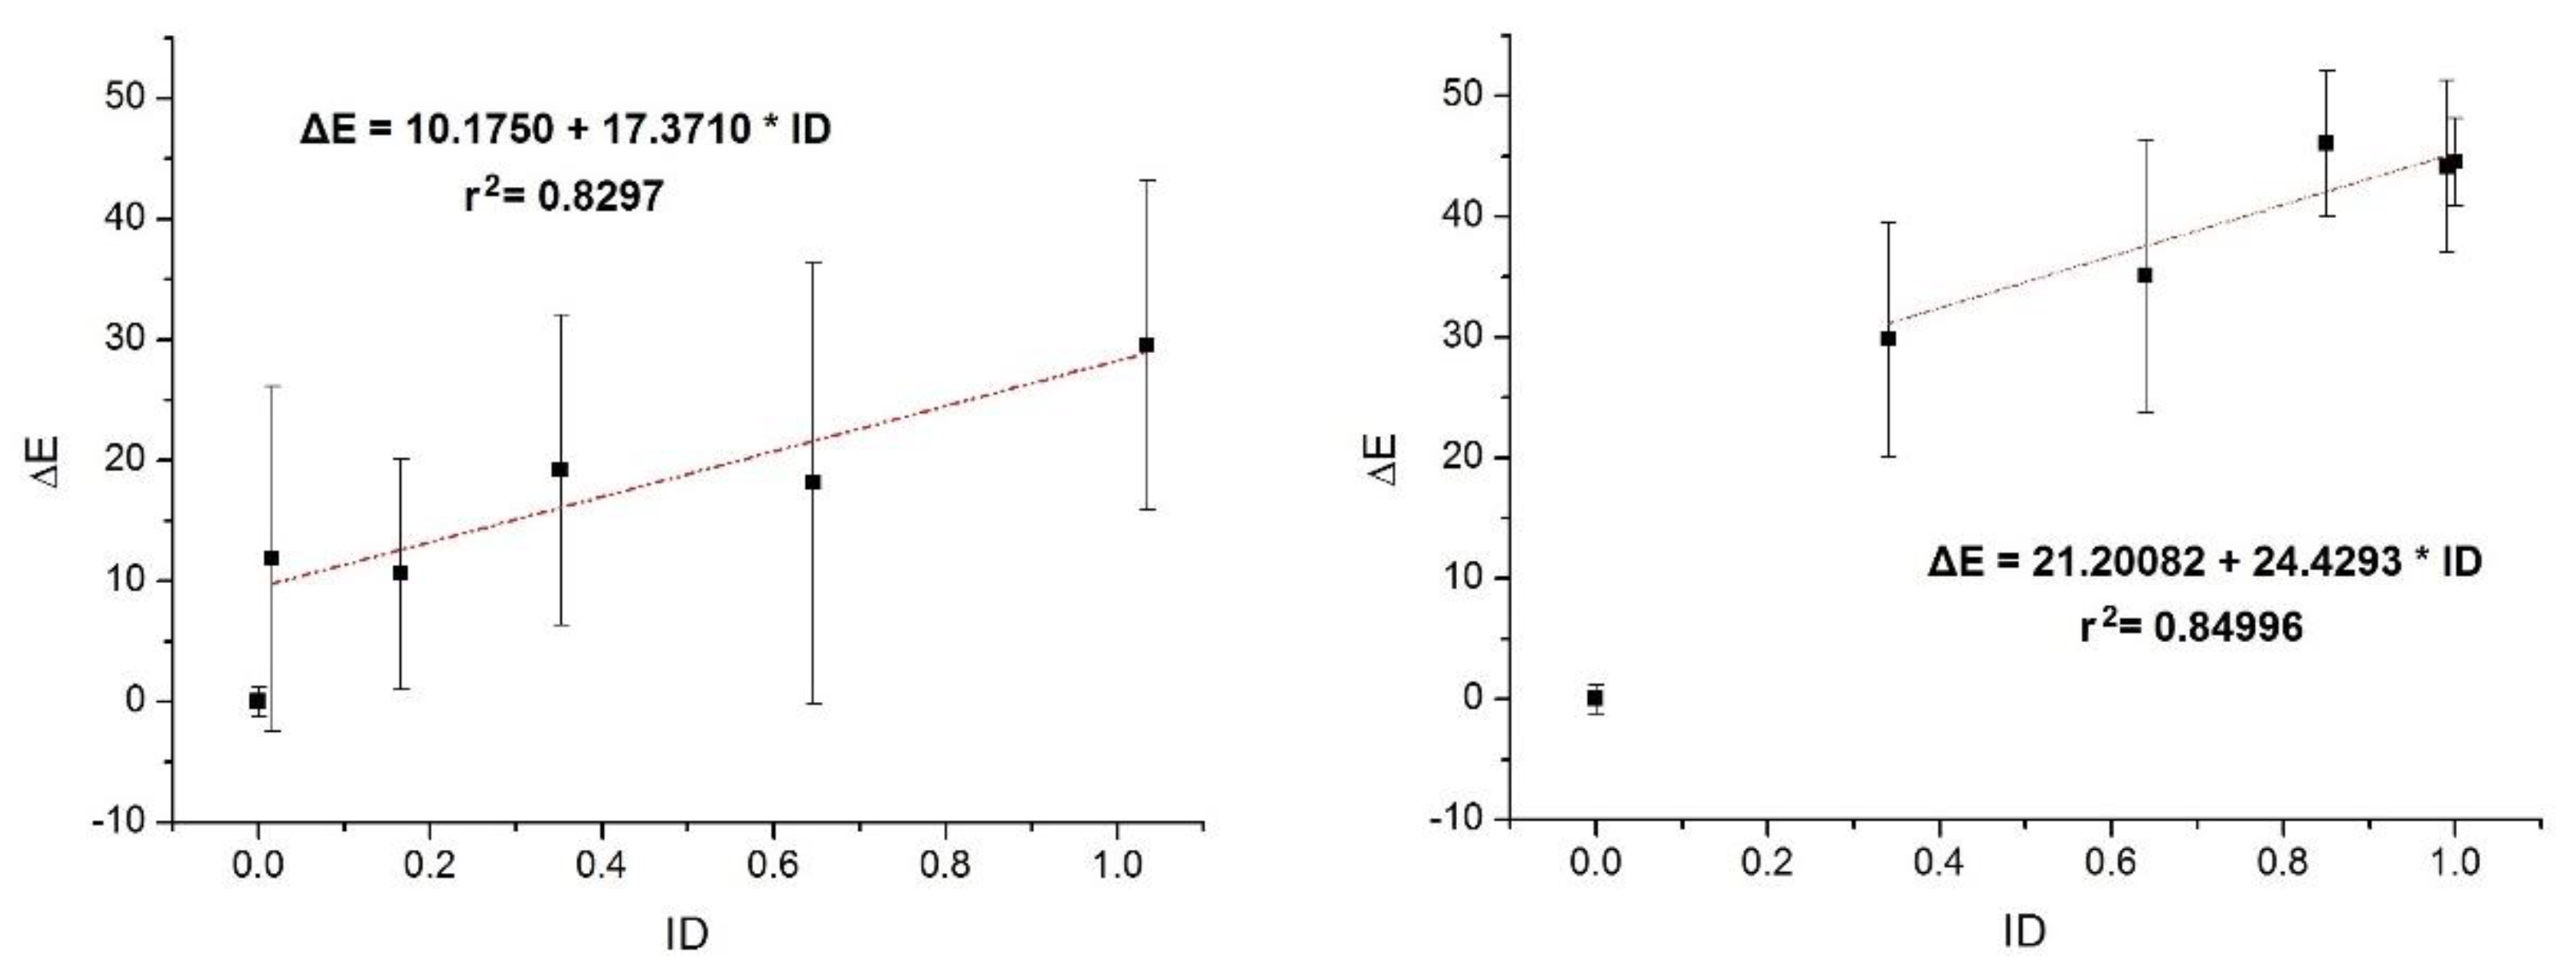
Figure 15 shows the UT damage index ΔE proposed in this paper and defined in Equation (2). The mean values of the four measuring points are represented with the square symbol versus the mechanical damage index ID for the specimens subjected to both loading patterns (DC1–DC5 and DC6–DC10).
It is observed that for UT magnitudes, a good correlation is found between the UT damage index and the mechanical damage index. Two parts can be observed, however:
(i) A first part for low values of ID, where UT indexes are very sensitive and increase rapidly with damage
(ii) A second part where the relation between UT indexes and ID damage index is approximately linear. The equation of the line ID-ΔE that best fits the experimental results is given in Figure 15. Correlation coefficients between UT indexes and ID are close to one in both cases. More precisely: 0.8297 for specimens subjected to cycles of incremental amplitude; while for case of constant amplitude pattern, the value is 0.84996.
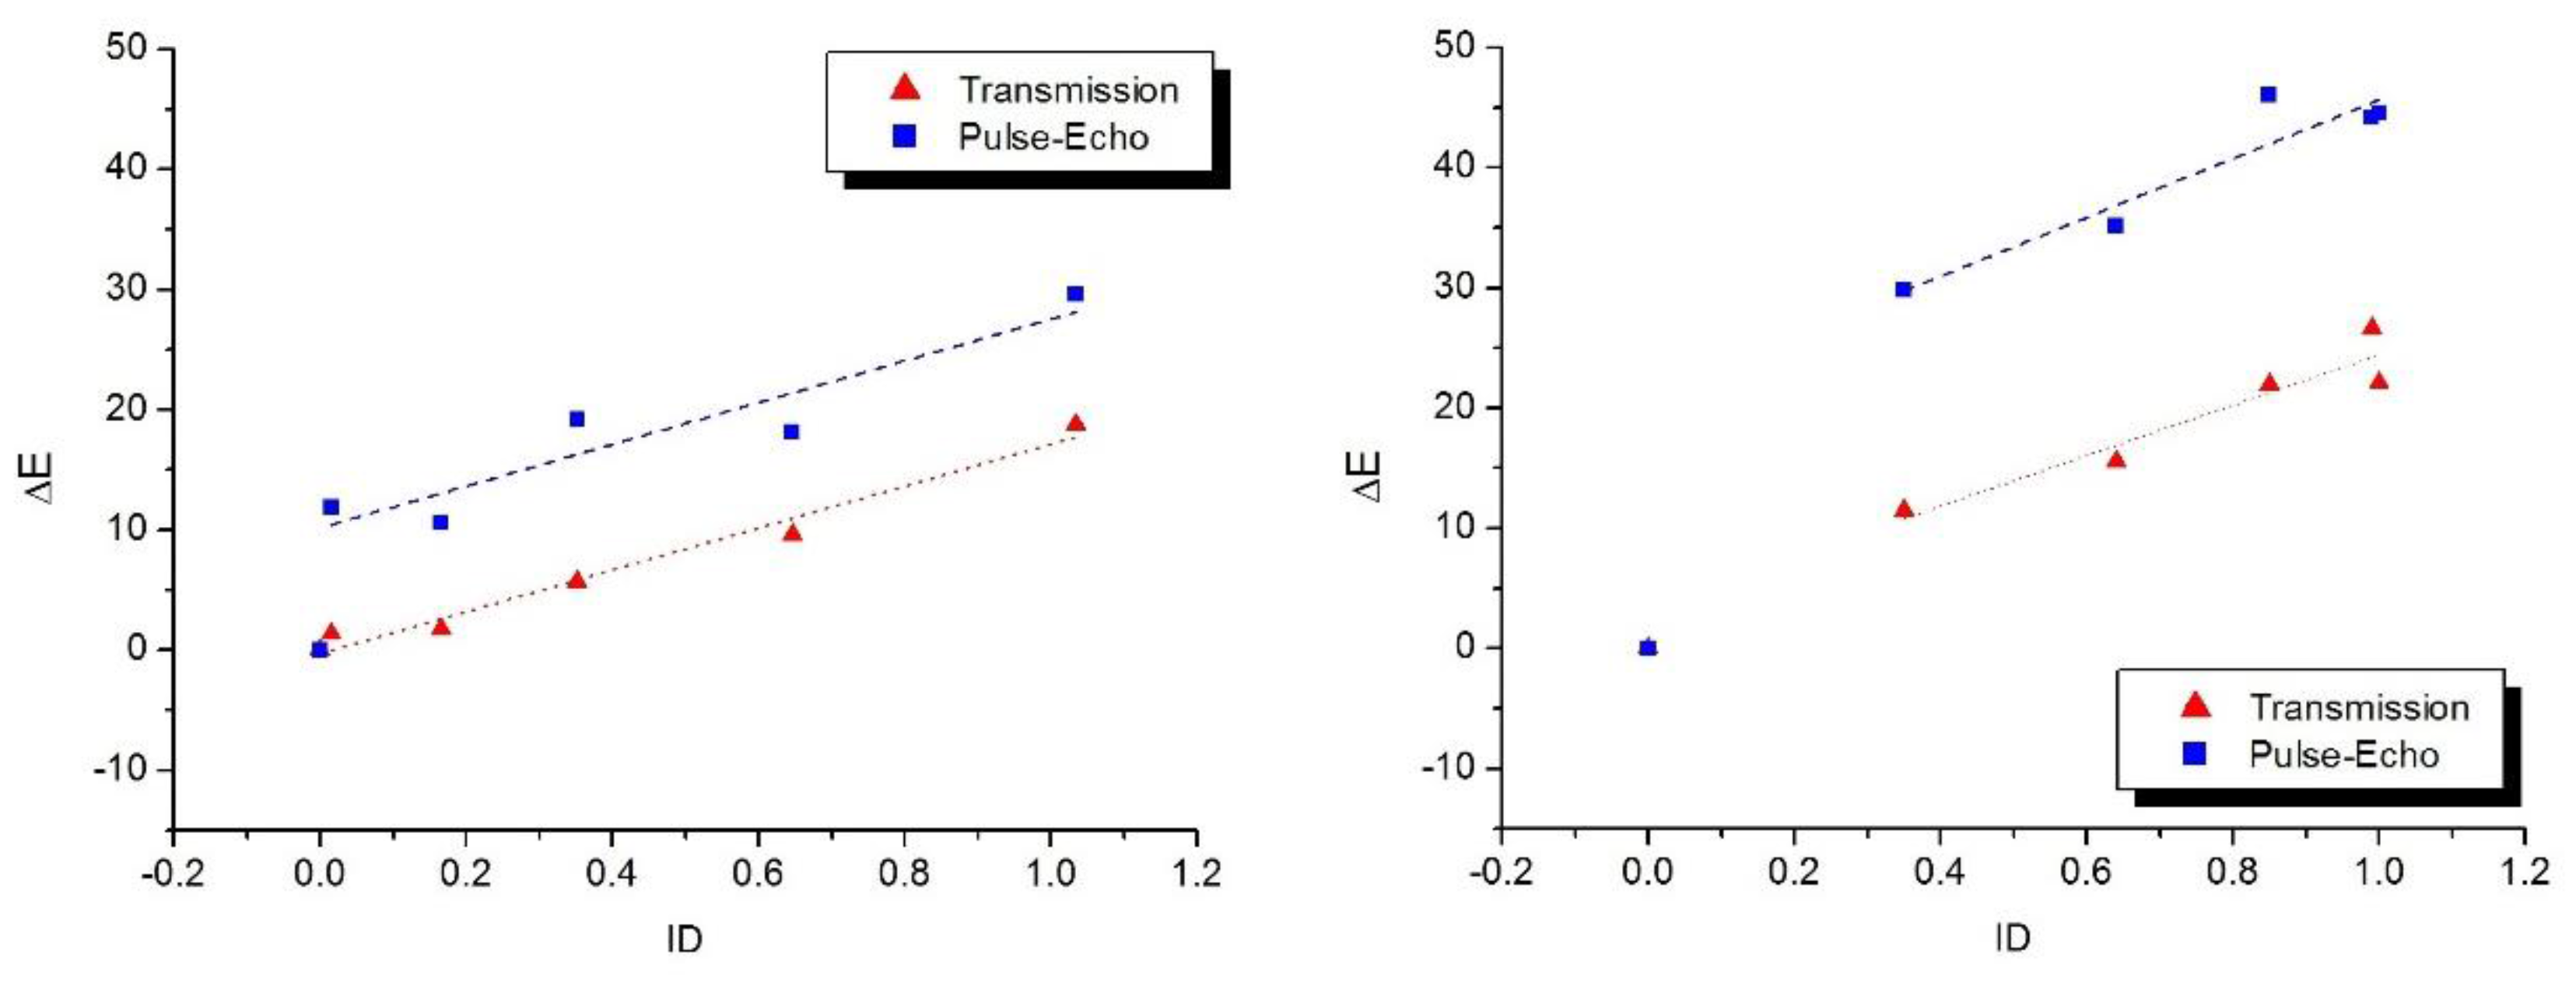
Specimens were also inspected using the classical UT transmission method (i.e., using two transducers, one as emitter and another as receiver), at the same measuring points, in order to compare both UT methodologies. Figure 16 shows ΔE values obtained through transmission and pulse-echo methods, and their correlation with the index ID.
It is worth noting that the linear fitting of the (ID-ΔE) points shows a similar trend for transmission and pulse-echo methods, i.e., the ΔE value increases at the same rate as level of damage increases. It is also observed that ΔE values for pulse-echo method are higher, according to significant attenuation effects taking place in this method mainly because the elastic wave cross the thickness of specimen twice.
8. Conclusions
The work validates the use of the ultrasonic pulse-echo technique for the quantitative damage evaluation in metallic hysteretic energy dampers used as seismic protection of buildings and infrastructures. In particular, a new damage index based on the variation of the spectral energy of the main portion of the echo signal recorded with a single piezoelectric transducer has been proposed. Two load histories applied to a special type of stainless steel dampers designed by the authors have been compared. The new index has been validated by comparison with a traditional mechanical index (ID) based on the load and displacement record. Basically, the most important conclusions of the work are as follows: (1) The proposed damage index is highly correlated linearly with the ID index from small damage levels; (2) The correlation equation depends on the load history applied; (3) The results using the pulse-echo technique (using a single transducer) are similar to those obtained by the transmission method (using two transducers).
The proposed pulse-echo UT methodology has been validated with dampers subjected to quasi-static loads and under simple histories of imposed deformations (i.e., cycles of constant amplitude and cycles of incremental amplitude). However, real earthquakes subject the dampers to dynamic loadings and to complex and arbitrarily changing histories of deformation. These are two limitations of the present study, which will be addressed by the authors in future experimental works. This methodology will be validated in more realistic seismic loading scenarios, with the dampers installed on models of large-scale structures tested on the 3 × 3 m2 shaking table of the University of Granada.
Acknowledgments
This research was supported by the regional government of Andalucía, Consejería de Innovación, Ciencia y Tecnología, Project TEP-02429.
Author Contributions
Amadeo Benavent-Climent conceived and designed the hysteretic dampers and the loading patterns; Amadeo Benavent-Climent, David Galé-Lamuela and Chihab Abarkane performed the cyclic experiments; David Galé-Lamuela calculated the mechanical damage index; Chihab Abarkane carried out the ultrasonic tests on the dissipative components; Chihab Abarkane, Antolino Gallego and Elisabet Suárez carried out the calculations and data analysis; all authors contributed to write the paper.
Conflicts of Interest
The authors declare that they have no conflict of interest.
References
- Benavent-Climent, A. An energy-based damage model for seismic response of steel structures. Earthq. Eng. Struct. Dyn. 2007, 36, 1049–1064. [Google Scholar] [CrossRef]
- Kouris, L.A.S.; Penna, A.; Magenes, G. Seismic damage diagnosis of a masonry building using short-term damping measurements. J. Sound Vib. 2017, 394, 366–391. [Google Scholar] [CrossRef]
- Romo, L. Diagnóstico de Daño en Disipadores de Energía Histeréticos Tipo Wpd Para el Control Pasivo en Estructuras Sismorresistentes Mediante Análisis de Vibraciones en el Dominio de la Frecuencia. Ph.D. Thesis, Universidad de Granada, Granada, Spain, May 2012. [Google Scholar]
- Benavent-Climent, A.; Gallego, A.; Romo-Melo, L.; Morillas, L. Health monitoring of web plastifying dampers subjected to cyclic loading through vibration tests. Struct. Health Monit. 2014, 13, 33–49. [Google Scholar] [CrossRef]
- Romo, L.; Benavent-Climent, A.; Morillas, L.; Escolano, D.; Gallego, A. Health monitoring of a new hysteretic damper subjected to earthquakes on a shaking table. Earthq. Struct. 2015, 8, 485–509. [Google Scholar] [CrossRef]
- Gallego, A.; Benavent-Climent, A.; Romo-Melo, L. Piezoelectric sensing and non-parametric statistical signal processing for health monitoring of hysteretic dampers used in seismic-resistant structures. Mech. Syst. Signal Proc. 2015, 60, 90–105. [Google Scholar] [CrossRef] [Green Version]
- Suarez, E.; Roldán, A.; Gallego, A.; Benavent-Climent, A. Entropy analysis for damage quantification of hysteretic dampers used as seismic protection of buildings. Appl. Sci. 2017, 7, 628. [Google Scholar] [CrossRef]
- Suarez, E.; Benavent-Climent, A.; Molina-Conde, R.; Gallego, A. Wavelet energy ratio index for health monitoring of hysteretic dampers. Struct. Control Health Monit. 2017. [Google Scholar] [CrossRef]
- Kurashkin, K.V.; Mishakin, V.V. Ultrasonic estimation of residual stresses. Inorg. Mater. 2013, 4, 54–58. [Google Scholar] [CrossRef]
- Ma, S.; Yuan, K.; Zhang, H.; Wei, X. Evaluation of fracture damage of SUS306 structural steel using ultrasonic testing. J. Shanghai Univ. 2009, 13, 279. [Google Scholar] [CrossRef]
- Benavent-Climent, A. A brace-type seismic damper based on yielding the walls of hollow structural sections. Eng. Struct. 2010, 32, 1113–1122. [Google Scholar] [CrossRef]
- Lempriere, B.M. Ultrasound and Elastic Waves: Frequently Asked Questions; Academic Press: Cambridge, UK, 2002. [Google Scholar]
- Krautkrämer, J.; Krautkrämer, H. Ultrasonic Testing of Materials, 3rd ed.; Springer: New York, NY, USA, 1983. [Google Scholar]
- Jones, N.; Watson, J.D. Digital Signal Processing: Principles, Devices and Applications; IEE Control Engineering Series; Institution of Engineering and Technology: London, UK, 1990; Volume 42, 424p. [Google Scholar]
- Young, I. Signal Processing, Theories and Applications; European Association for Signal Processing: The Hague, The Netherlands, 1986. [Google Scholar]
- De Araujo Freitas, V.L.; De Albuquerque, V.H.C.; De Macedo, S.E. Nondestructive characterization of microstructures and determination of elastic properties in plain carbon steel using ultrasonic measurements. Mater. Sci. Eng. A 2010, 527, 4431–4437. [Google Scholar] [CrossRef]
- Augereau, F.; Portal, A. Detection of small stress relaxation in tightened metallic structures by ultrasounds. Phys. Procedia 2015, 70, 471–475. [Google Scholar] [CrossRef]
Figure 1.
Basic configuration of a building structure with dampers.

Figure 2.
Hysteretic damper (steel plate with slits).

Figure 3.
Dissipative Component (DC) of dampers: parts of test specimens, nominal dimensions in mm and measurement points (1–4).
Figure 3.
Dissipative Component (DC) of dampers: parts of test specimens, nominal dimensions in mm and measurement points (1–4).

Figure 4.
Experimental setup used during the cycling tests.

Figure 5.
Relative displacement between external and central flanges.

Figure 6.
Load patterns applied to specimens DC1 to DC5 (left) and DC6 to DC10 (right).

Figure 7.
Experimental setup of the experiment used during UT.

Figure 8.
UT signals versus time, corresponding to 1st test on point 1 of undamaged specimen (D0). (Left) Pulse and echo of full signal, (Right) Main Wave (MW).
Figure 8.
UT signals versus time, corresponding to 1st test on point 1 of undamaged specimen (D0). (Left) Pulse and echo of full signal, (Right) Main Wave (MW).
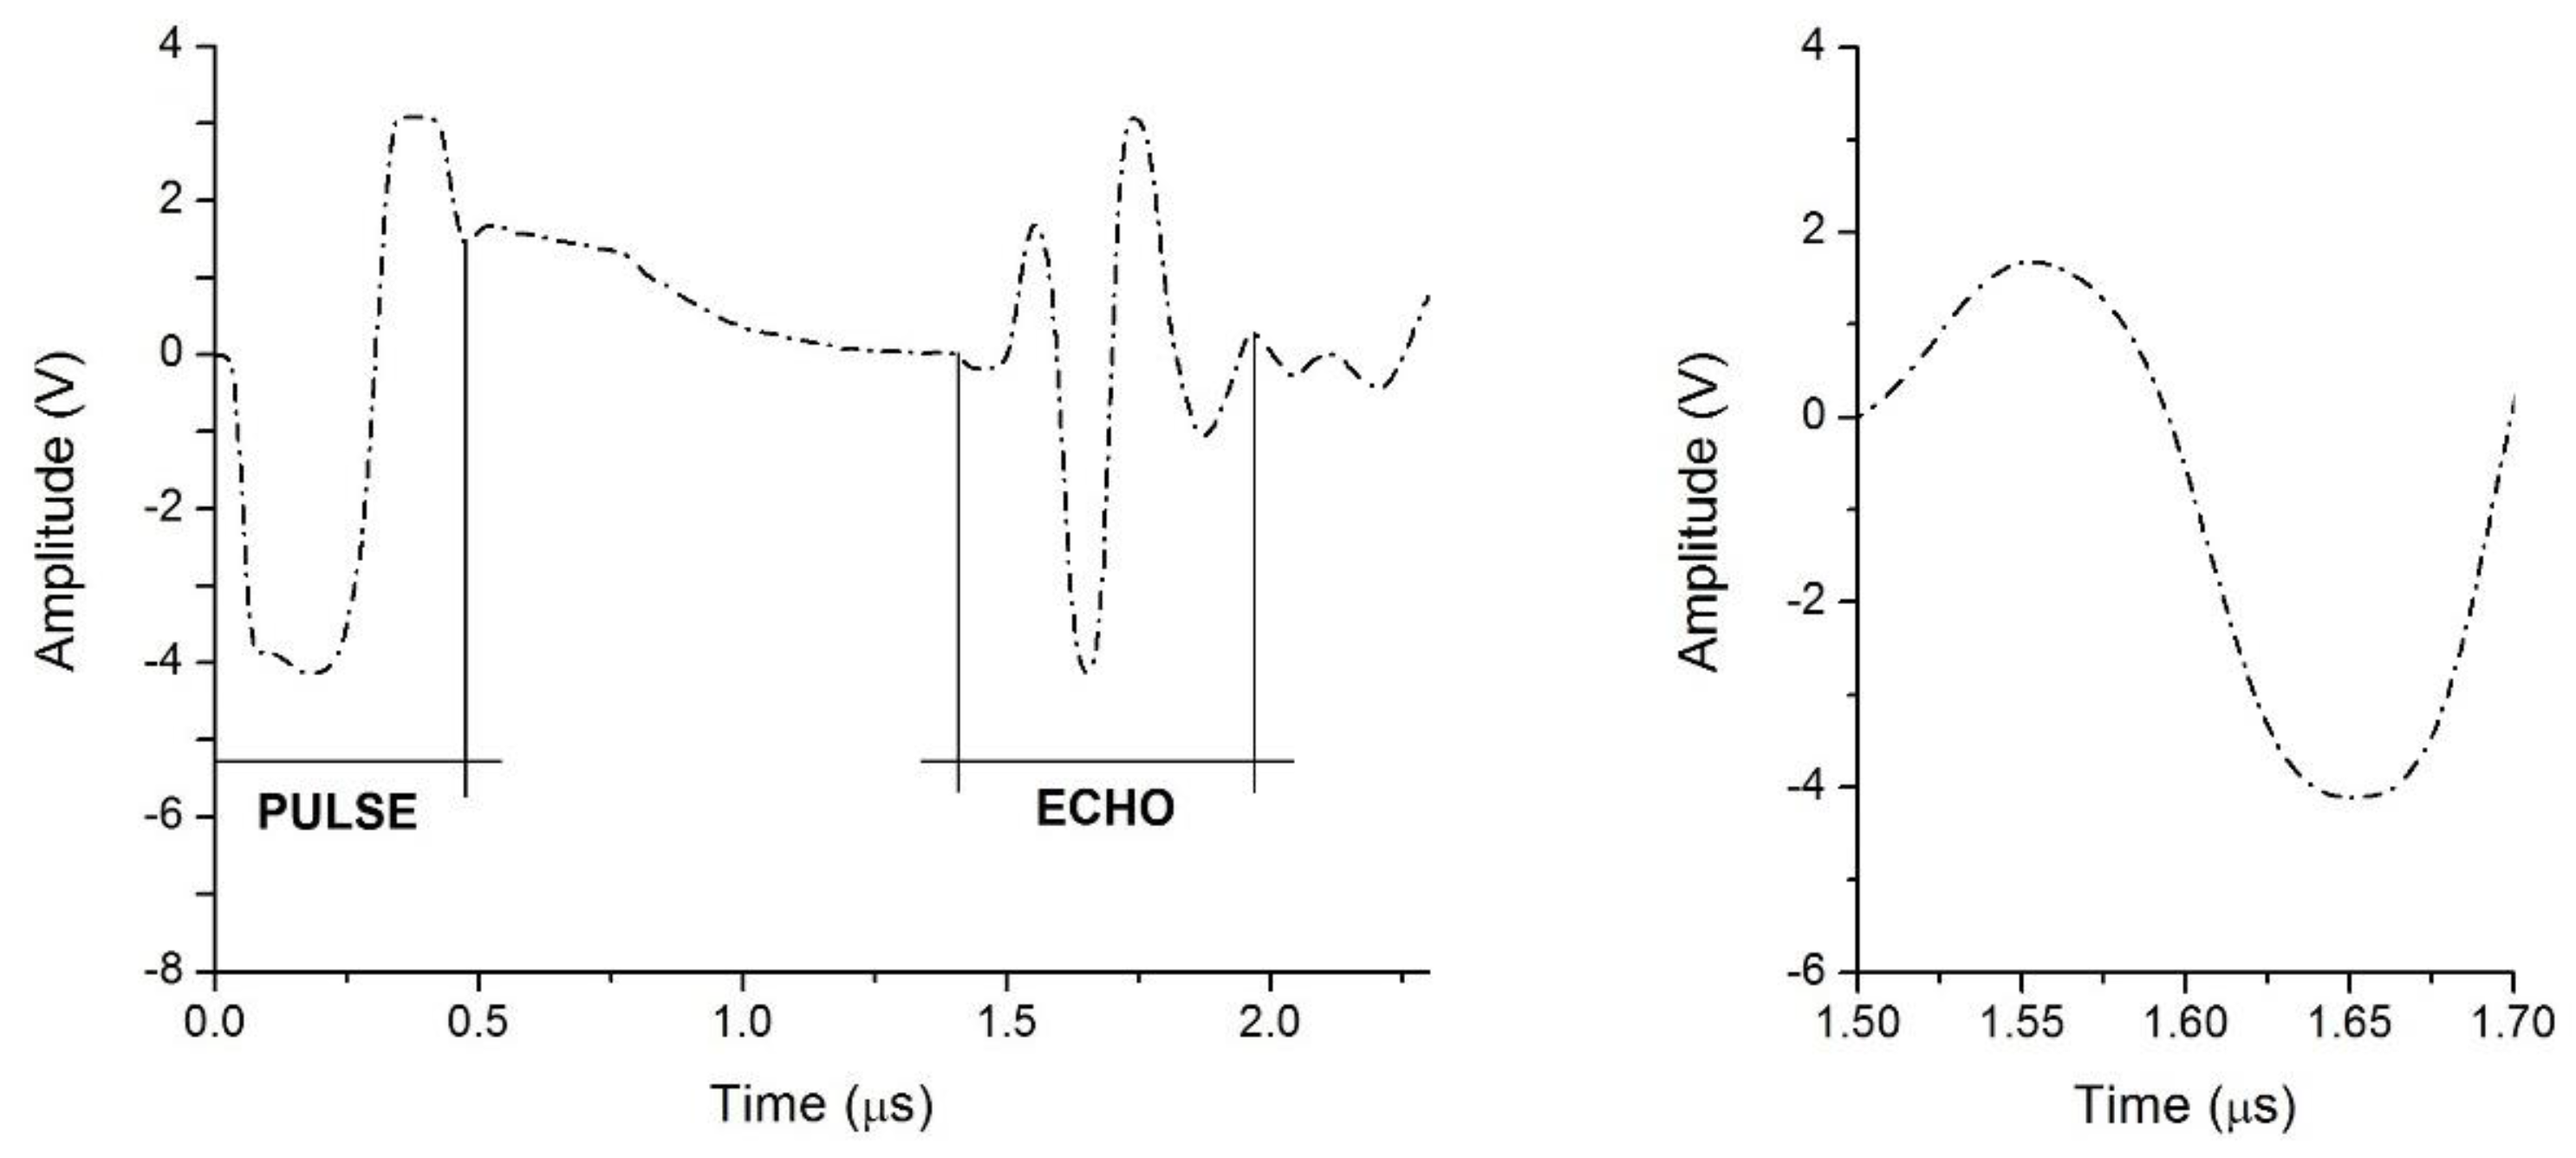
Figure 9.
Main Waves extracted from 2nd trial on point 2 of undamaged state D0 and damaged states D1–D5. Second loading pattern.
Figure 9.
Main Waves extracted from 2nd trial on point 2 of undamaged state D0 and damaged states D1–D5. Second loading pattern.
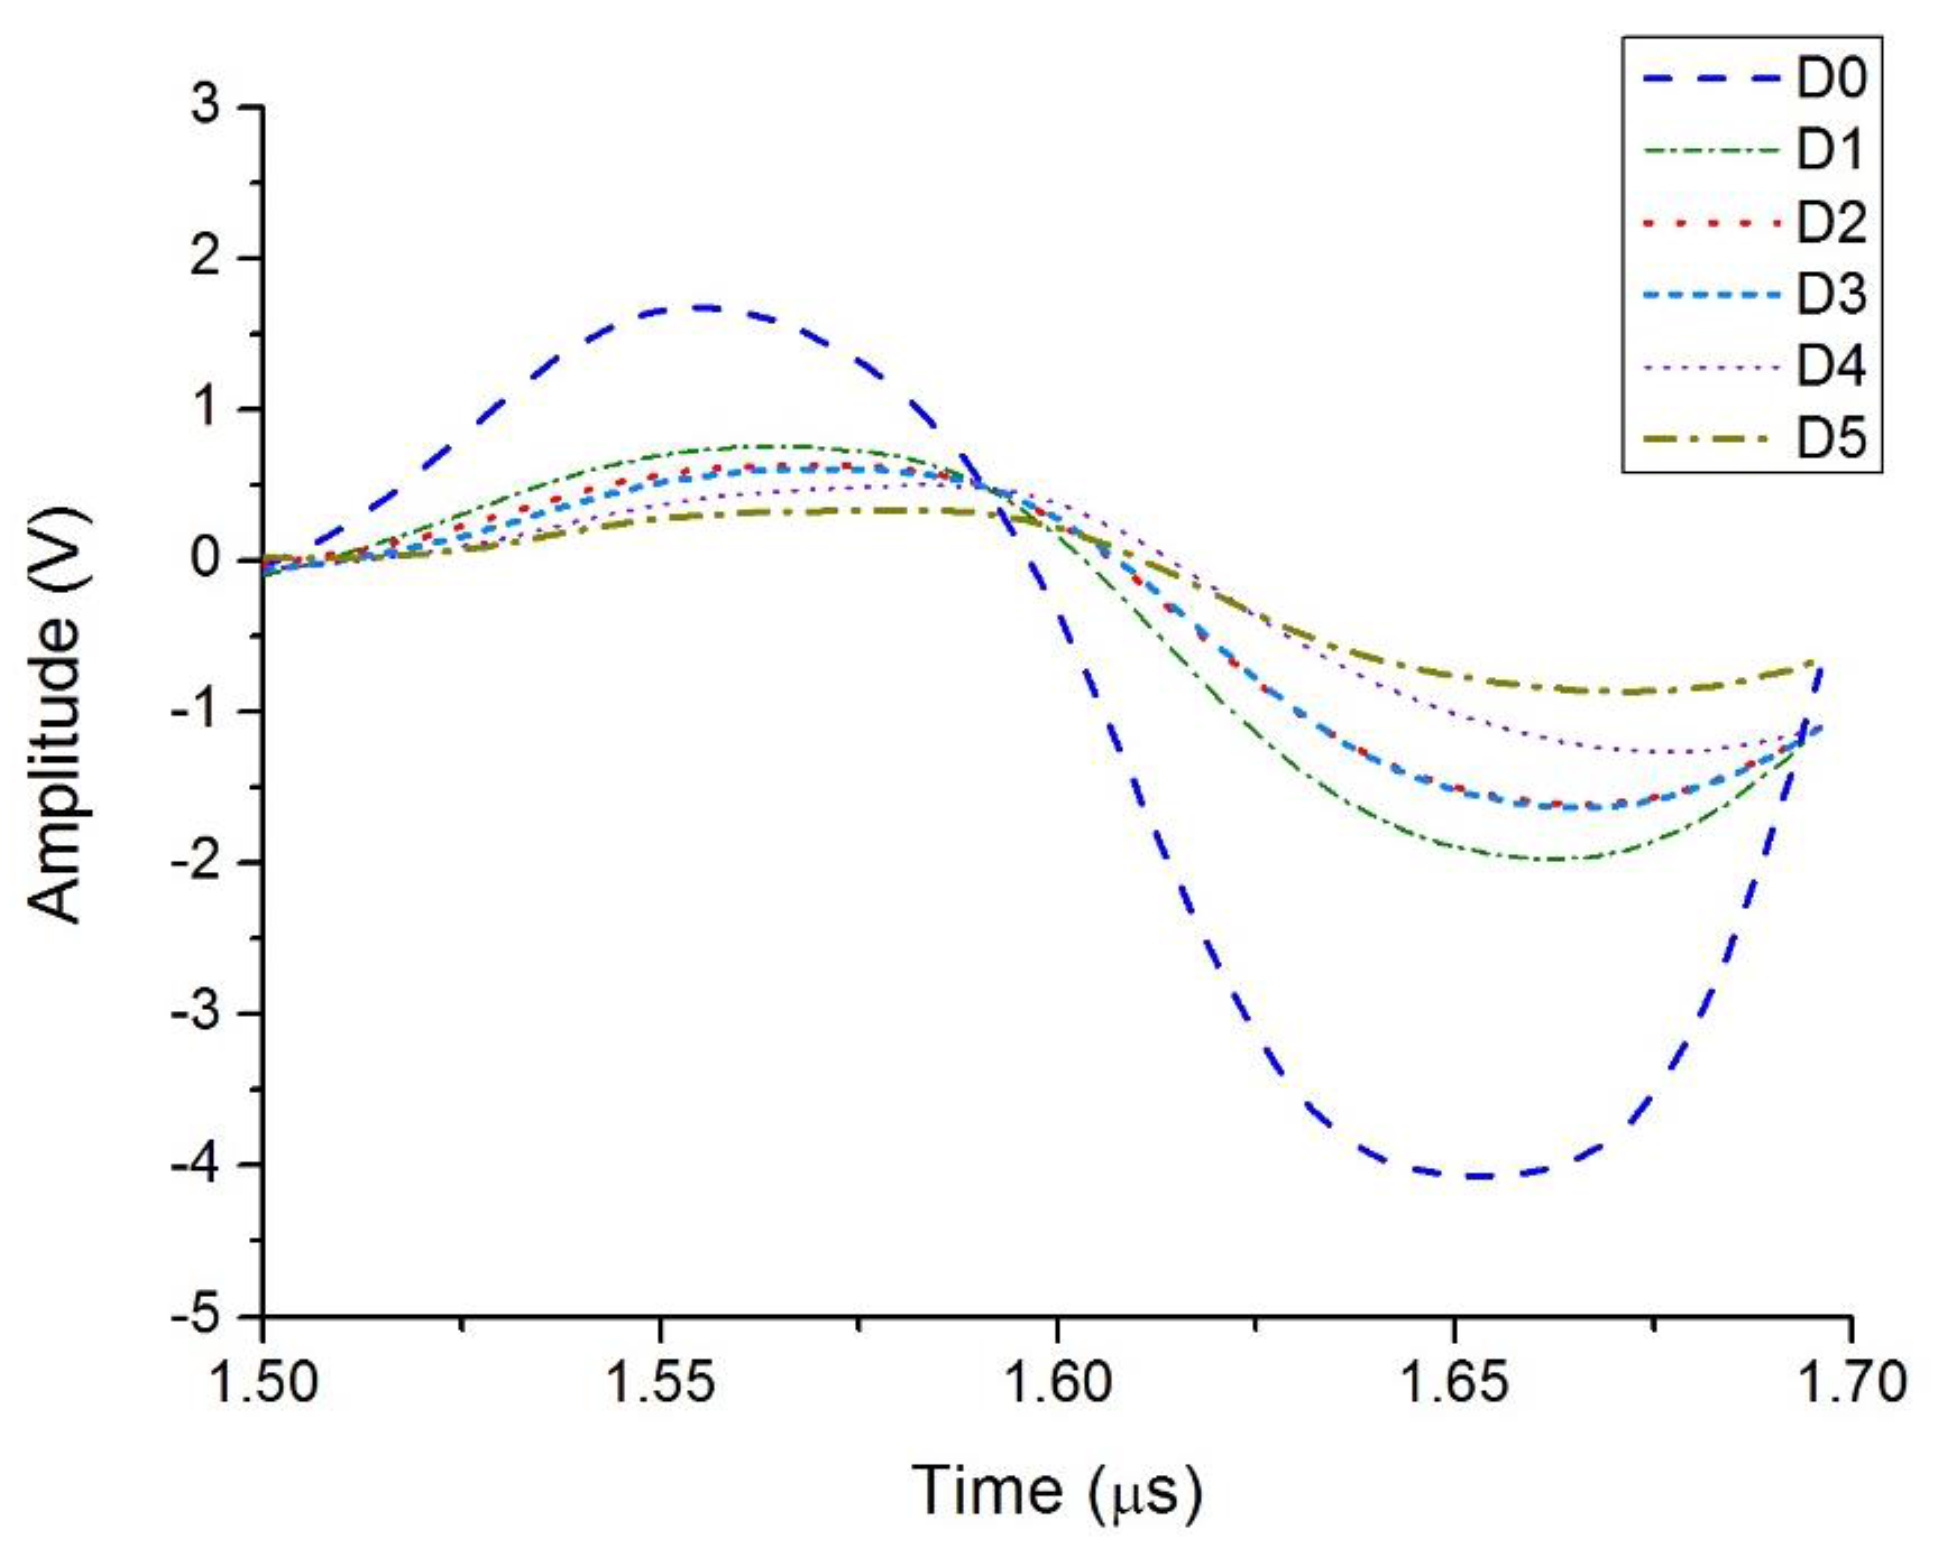
Figure 10.
Spectrum of the MW, with schematic definitions of spectral energy Es.

Figure 11.
Decomposition of a typical V-δ curve: (a) initial V-δ curve; (b) skeleton part; (c) Bauschinger part.
Figure 11.
Decomposition of a typical V-δ curve: (a) initial V-δ curve; (b) skeleton part; (c) Bauschinger part.

Figure 12.
Typical hysteresis curves obtained from the tests of specimens DC1 to DC5.

Figure 13.
Typical hysteresis curves obtained from the tests of specimens DC6 to DC10.

Figure 14.
Mean and standard deviation of parameter Es. (Left) specimens subjected to incremental cyclic loading (DC1–DC5); (Right) specimens subjected to constant cyclic loading (DC6–DC10).
Figure 14.
Mean and standard deviation of parameter Es. (Left) specimens subjected to incremental cyclic loading (DC1–DC5); (Right) specimens subjected to constant cyclic loading (DC6–DC10).

Figure 15.
Comparison of ID and ΔE indices. (Left) specimens DC1–DC5; (Right) specimens DC6–DC10.

Figure 16.
ΔE values corresponding to Transmission and Pulse-Echo methods. (Left) specimens DC1–DC5, (Right) specimens DC6–DC10.
Figure 16.
ΔE values corresponding to Transmission and Pulse-Echo methods. (Left) specimens DC1–DC5, (Right) specimens DC6–DC10.

Table 1.
Number of cycles and maximum displacement reached by specimens DC1 to DC5.
| Number of Cycles | 1 | 2 | 3 | 4 | 5 | 6 | 7 | 8 | 9 | 10 | 11 | 12 | 13 |
|---|---|---|---|---|---|---|---|---|---|---|---|---|---|
| Maximum displacement (mm) | 0.4 | 0.8 | 1.2 | 1.6 | 2 | 2.4 | 2.8 | 3.2 | 3.6 | 4 | 4.4 | 4.8 | 5.2 |
| DC1 (D1) | X | X | |||||||||||
| DC2 (D2) | X | X | X | X | X | X | |||||||
| DC3 (D3) | X | X | X | X | X | X | X | X | |||||
| DC4 (D4) | X | X | X | X | X | X | X | X | X | X | |||
| DC5 (D5) | X | X | X | X | X | X | X | X | X | X | X | X | X |
Table 2.
Number of cycles and maximum displacement reached by specimens DC6 to DC10.
| Number of Cycles | 30 | 60 | 90 | 120 | 150 |
|---|---|---|---|---|---|
| Maximum displacement (mm) | 0.8 | 0.8 | 0.8 | 0.8 | 0.8 |
| DC6 (D1) | X | ||||
| DC7 (D2) | X | X | |||
| DC8 (D3) | X | X | X | ||
| DC9 (D4) | X | X | X | X | |
| DC10 (D5) | X | X | X | X | X |
Table 3.
Mechanical index of damage ID.
| Specimen | DC1 | DC2 | DC3 | DC4 | DC5 | DC6 | DC7 | DC8 | DC9 | DC10 |
| Damage Level | D1 | D2 | D3 | D4 | D5 | D1 | D2 | D3 | D4 | D5 |
| ID Index | 0.016 | 0.166 | 0.352 | 0.646 | 1.034 | 0.34 | 0.64 | 0.85 | 0.99 | 1.00 |
© 2017 by the authors. Licensee MDPI, Basel, Switzerland. This article is an open access article distributed under the terms and conditions of the Creative Commons Attribution (CC BY) license (http://creativecommons.org/licenses/by/4.0/).
Share and Cite
MDPI and ACS Style
Abarkane, C.; Galé-Lamuela, D.; Benavent-Climent, A.; Suárez, E.; Gallego, A. Ultrasonic Pulse-Echo Signal Analysis for Damage Evaluation of Metallic Slit-Plate Hysteretic Dampers. Metals 2017, 7, 526. https://doi.org/10.3390/met7120526
AMA Style
Abarkane C, Galé-Lamuela D, Benavent-Climent A, Suárez E, Gallego A. Ultrasonic Pulse-Echo Signal Analysis for Damage Evaluation of Metallic Slit-Plate Hysteretic Dampers. Metals. 2017; 7(12):526. https://doi.org/10.3390/met7120526
Chicago/Turabian StyleAbarkane, Chihab, David Galé-Lamuela, Amadeo Benavent-Climent, Elisabet Suárez, and Antolino Gallego. 2017. "Ultrasonic Pulse-Echo Signal Analysis for Damage Evaluation of Metallic Slit-Plate Hysteretic Dampers" Metals 7, no. 12: 526. https://doi.org/10.3390/met7120526
Note that from the first issue of 2016, this journal uses article numbers instead of page numbers. See further details here.