In Situ Characterization of Inconel 718 Post-Dynamic Recrystallization within a Scanning Electron Microscope


1
MINES ParisTech, PSL-Research University, CEMEF-Centre de Mise en Forme des matériaux, CNRS UMR 7635, CS 10207 rue Claude Daunesse, 06904 Sophia Antipolis CEDEX, France
2
Thermomechanical Metallurgy Laboratory-PX Group Chair, Ecole Polytechnique Fédérale de Lausanne (EPFL), Rue de la Maladière 71B-CP 526, CH-2002 Neuchatel, Switzerland
*
Author to whom correspondence should be addressed.
Metals 2017, 7(11), 476; https://doi.org/10.3390/met7110476
Submission received: 22 September 2017
/
Revised: 29 October 2017
/
Accepted: 2 November 2017
/
Published: 4 November 2017
(This article belongs to the Special Issue Dynamic Recrystallization Behavior of Metallic Materials)
Abstract
:Microstructure evolution within the post-dynamic regime following hot deformation was investigated in Inconel 718 samples with different dynamically recrystallized volume fractions and under conditions such that no δ-phase particles were present. In situ annealing treatments carried out to mimic post-dynamic conditions inside the Scanning Electron Microscope (SEM) chamber suggest the occurrence of both metadynamic and static recrystallization mechanisms. Static recrystallization was observed in addition to metadynamic recrystallization, only when the initial dynamically recrystallized volume fraction was very small. The initial volume fraction of dynamically recrystallized grains appears to be decisive for subsequent microstructural evolution mechanisms and kinetics. In addition, the formation of annealing twins is observed along with the growth of recrystallized grains, but then the twin density decreases as the material enters the capillarity-driven grain growth regime.

1. Introduction
Inconel 718 is the most widely used nickel-based superalloy to make aerojet engine disks subjected to severe mechanical stresses at high temperatures. Controlling the microstructure, and notably the grain size, obtained after hot-forging is a key point in the optimization of mechanical properties, which are ruled by tight specifications for aeronautical applications. Dynamic and post-dynamic recrystallization is among the most important phenomena impacting the microstructure of hot-forged components. The influence of the thermomechanical forging conditions on dynamic recrystallization (DRX) kinetics and on the DRX grain size is relatively well established [1,2,3,4,5,6,7,8], and can even be predicted using either physical or empirical models [9,10,11,12,13,14,15]. However, previous studies have shown that post-dynamic evolutions may also considerably impact the final microstructure [12,15,16,17,18]. The post-dynamic regime encompasses everything that occurs right after deformation stops, while the material is still at high temperature. The possibly involved mechanisms are static recrystallization, metadynamic recrystallization and grain growth [19,20]. Metadynamic recrystallization proceeds by the evolution of nuclei formed dynamically [21], whereas static recrystallization involves nucleation during the post-dynamic period of time. Static recrystallization usually suffers an incubation time that is interpreted as the time required for the formation of nuclei; metadynamic recrystallization does not need such an incubation time. To make the definitions complete, grain growth should be understood here as the process that comes after recrystallization, when the stored energy has been completely consumed and the only driving force left for grain boundary migration originates from capillarity.
Microstructure evolution within the post-dynamic regime can be extremely fast, especially when prior deformation is performed at high strain rates [12,15,17]; microstructure can be fully regenerated within only a few to a few tens of seconds. Higher strain rates, higher temperature and/or higher levels of prior strain have been reported as accelerating factors for post-dynamic microstructure evolution [18,22].
Under industrial forging conditions, microstructure evolution during cooling after hot deformation is almost unavoidable because of the thermal inertia and slow cooling of the large forged pieces. Accounting for those post-dynamic changes is necessary to fully optimize the processing routes. A better understanding of the involved mechanisms and kinetics is therefore needed.
Because of the short characteristic times, special attention must be given to the quenching delay when performing lab experiments to assess post-dynamic kinetics; that delay must be very well controlled and reproducible. Alternatively, two-pass hot-deformation experiments can be done, in view of analyzing the softening fraction associated with the interpass time [18], but then microstructure itself cannot be analyzed, only softening kinetics can be assessed.
In this work, a series of in situ annealing treatments within a Scanning Electron Microscope (SEM) is performed on partially dynamically recrystallized samples which were quenched after hot-deformation, in order to provide a direct observation of the active mechanisms. To the best knowledge of the authors, such experimental data are reported here for the first time. The aim is to identify the key parameters controlling the grain size and recrystallized fraction evolution after hot deformation. The objective of this paper is not to correlate the post-dynamic evolution to the hot-deformation thermomechanical conditions but, instead, to explain the post-dynamic evolution with regards to the hot-deformed microstructural state. Special attention will thus be given to the impact of the initial dynamically recrystallized fraction. In addition, because there is an increasing interest given to the grain boundary networks in nickel-based superalloys [23,24,25,26,27,28,29,30,31] (in the perspective of grain boundary engineering [32]), the evolution of annealing twins along with post-dynamic recrystallization will also be described.
2. Materials and Methods
Hot torsion tests followed by fast annealing treatments at the deformation temperature were performed to study the post-dynamic microstructural behavior of Inconel 718. Torsion test samples were machined out from a 150 mm diameter billet having the composition given in Table 1. The gauge length was 15 mm and the diameter 6 mm.
Before hot-torsion testing, samples were first annealed at 1050 °C for 60 min in order to dissolve the hardening phases, γ″-Ni3Nb and γ′-Ni3(Al,Ti), and the δ-Ni3Nb precipitates into the FCC matrix, as described in [15]. After this thermal treatment, microstructure consisted of equiaxed grains with an average size (equivalent circle diameter) of 85 μm. Few carbide and carbonitride particles were still present in the material but since they were too few to have any significant influence on the overall microstructure evolution, they will be ignored in this work and the material will be considered as single phased.
The torsion test samples were then deformed at 1020 °C and a nominal strain rate of 0.1 s−1. The samples were heated to the deformation temperature using a lamp furnace mounted on the torsion test machine, and held a few minutes for the sake of temperature homogenization before deformation started. The applied deformation temperature is slightly below the δ-solvus temperature (1025 °C), but the δ-Ni3Nb phase did not re-precipitate during the hot-deformation sequence as the total time spent at 1020 °C was not long enough. Deformation was interrupted at three different strain levels (0.25, 0.55 and 2.0 for samples A, B and C, respectively), and immediately followed by water quenching. The experimental quenching delay was 2 to 3 seconds; this may have to be taken into account when interpreting microstructures.
A thin lamella has been cut (with a diamond saw) from each of the three cylindrical torsion test samples, as shown on Figure 1, in order to prepare the samples needed for the in situ thermal treatments. Those were performed with a homemade in situ annealing stage mounted onto a FEI XL30 SEM (Hillsboro, OR, USA) equipped with an Electron Back Scattering Diffraction (EBSD) system. This equipment is described in detail in [33]. The main advantages of this heating stage are the possibility of achieving quite high heating and cooling rates (100 °C·s−1) to avoid microstructure evolution during transients, the possibility of reaching high temperature compared to commercially-available devices, with no temperature overshoot, so that performing a well-controlled heat treatment of a few seconds at more than 1000 °C is feasible. Here the samples will be annealed at the same temperature used for hot-torsion, 1020 °C. Of course, another advantage of this experimental setup is that it offers the possibility of observing the evolution of the microstructure in a given region of interest, by acquiring EBSD maps after each annealing step.
Thin lamellae (2 mm × 3–4 mm × 300 µm) were thus prepared for in situ annealing experiments. Their small size allows them to keep a low thermal inertia, and to limit temperature gradients. Preparation was done such as to reach a suitable surface quality for EBSD analyses, and with a special care brought to avoid introducing additional work-hardening due to cutting and polishing. To achieve the surface quality required for EBSD measurements, a final mechanical-chemical polishing was performed on one side using a colloidal silica suspension.
The lamellae were then welded onto tantalum ribbons, which will be heated by the Joule effect during the in situ experiments. Regions of interest of 450 μm × 500 μm wide were analyzed by EBSD, which appeared to be a good compromise between the statistical relevance of the observed area and the spatial resolution that could be achieved within a reasonable acquisition time of about half an hour per map.
Recrystallized volume fractions and recrystallized grain sizes were measured from EBSD maps. The present experiments have been designed so that the discrimination of dynamically recrystallized (DRX) grains can be made easily and unambiguously based on a simple grain size criterion (large initial grain size and hot-deformation conditions leading to fine recrystallized grain size). It is worth mentioning that such a simple criterion may become ineffective when the recrystallized fraction approaches 100%, the remnant deformed grains becoming smaller and smaller, or when recrystallized grains grow post-dynamically. On the other hand, post-dynamic recrystallization leads to low intragranular misorientation levels associated with low stored energy levels and low dislocation densities compared to the deformed matrix or to the DRX grains. The OIM™ Data Analysis software (version 7, EDAX, Mahwah, NJ, USA) package enables to calculate different parameters directly related to intragranular misorientations: the Grain Orientation Spread (GOS) that is a grain property or the Kernel Average Misorientation (KAM) that is a pixel property. Both the KAM and GOS values are sensitive to the density of geometrically necessary dislocations, increasing with the dislocation content and thus with the local stored energy level.
3. Results
3.1. As-quenched Samples
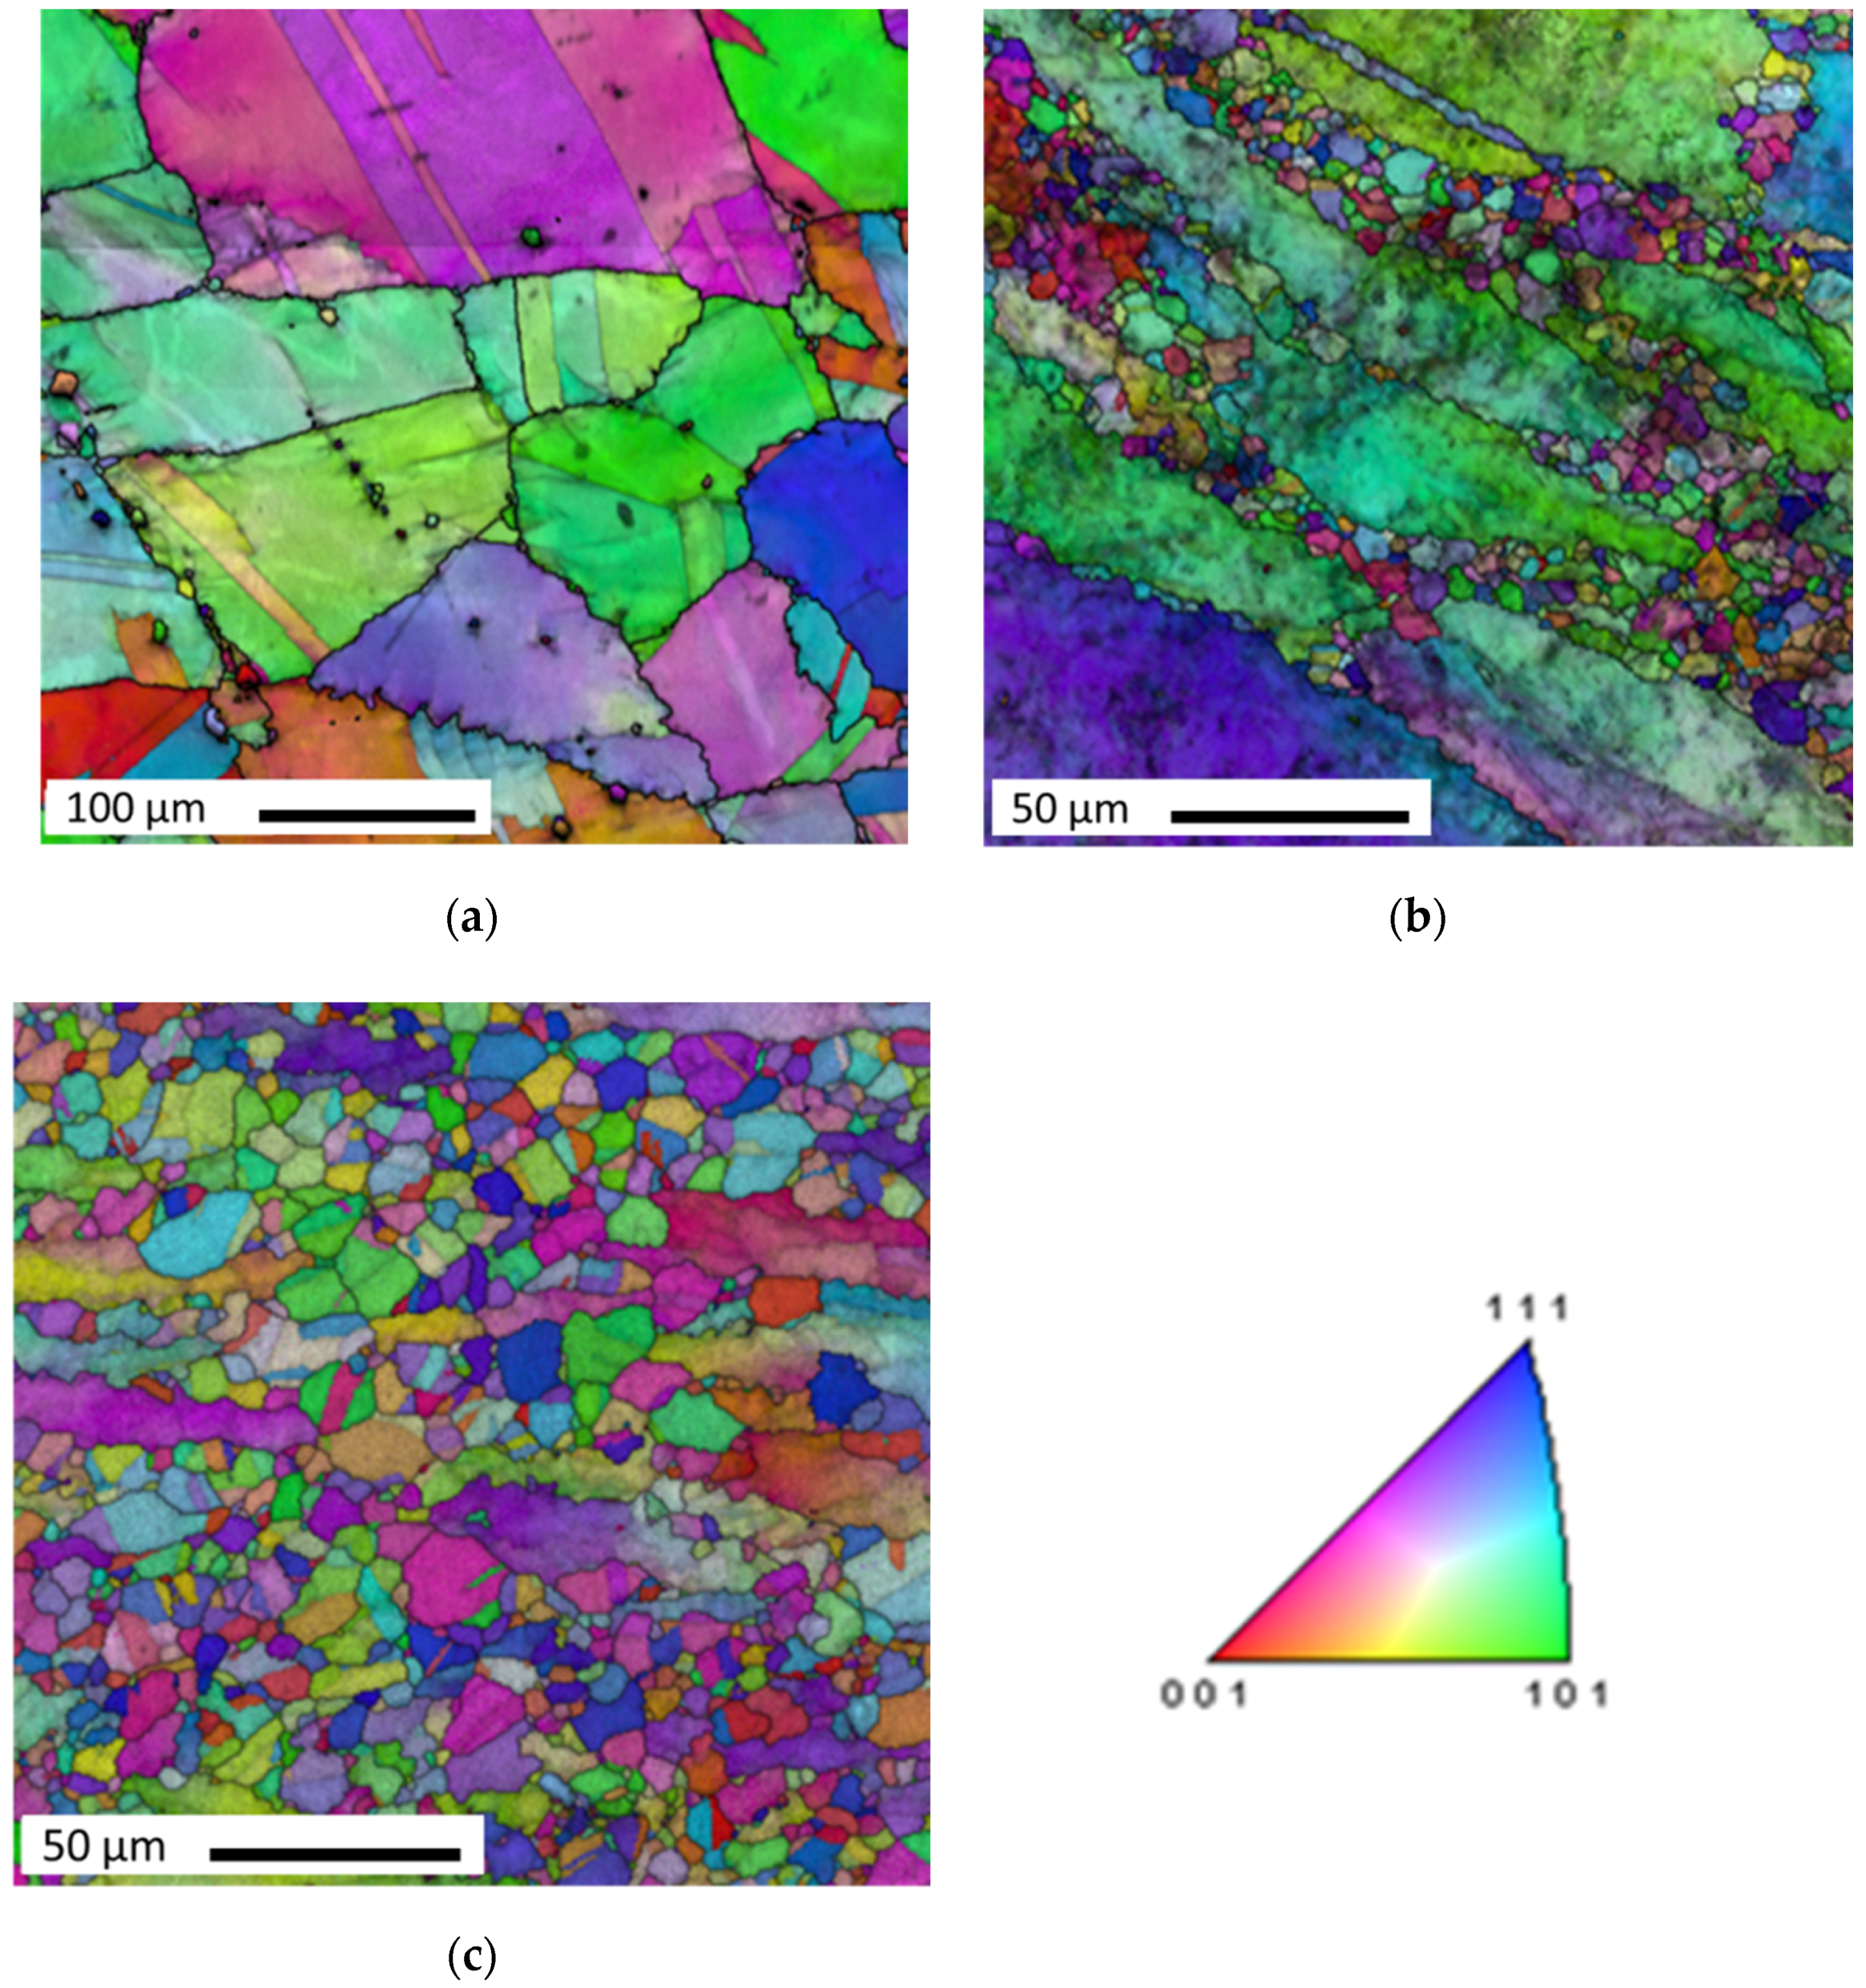
The quenched microstructures obtained after isothermal hot-torsion at 1020 °C and 0.1 s−1 depend on the applied strain level (Figure 2). For all three studied samples, the as-quenched microstructure was partially recrystallized. Microstructure of sample A (0.25 strain) corresponds to the early stages of dynamic recrystallization, the recrystallized volume fraction is about 2% and the other 98 vol % are made of deformed grains with intragranular orientation gradients indicative for the presence of dislocations and thus of stored energy. Only few small dynamically recrystallized grains (and possibly nuclei) can be found along the former grain boundaries (Figure 2a). Some of the grain boundaries of the initial grains exhibit serrations; which is believed to help in the nucleation process [6,15].
Sample B (0.55 strain) has a significantly higher volume fraction of recrystallized grains, around 26%, with the typical necklace topology of small recrystallized grains around large deformed grains. Sample C (2.0 strain) has the highest recrystallized volume fraction, around 65%. The unrecrystallized grains still can be easily separated from the equiaxed recrystallized grains, as they are elongated and have higher orientation gradients.
3.2. Post-dynamic Evolution Starting from a Very Low Dynamic Recrystallization (DRX) Volume Fraction (Sample A, 0.25 Strain, DRX 2%)
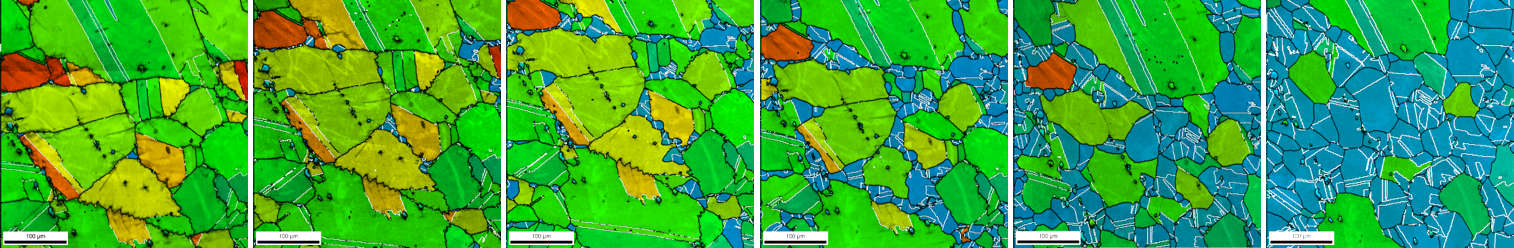
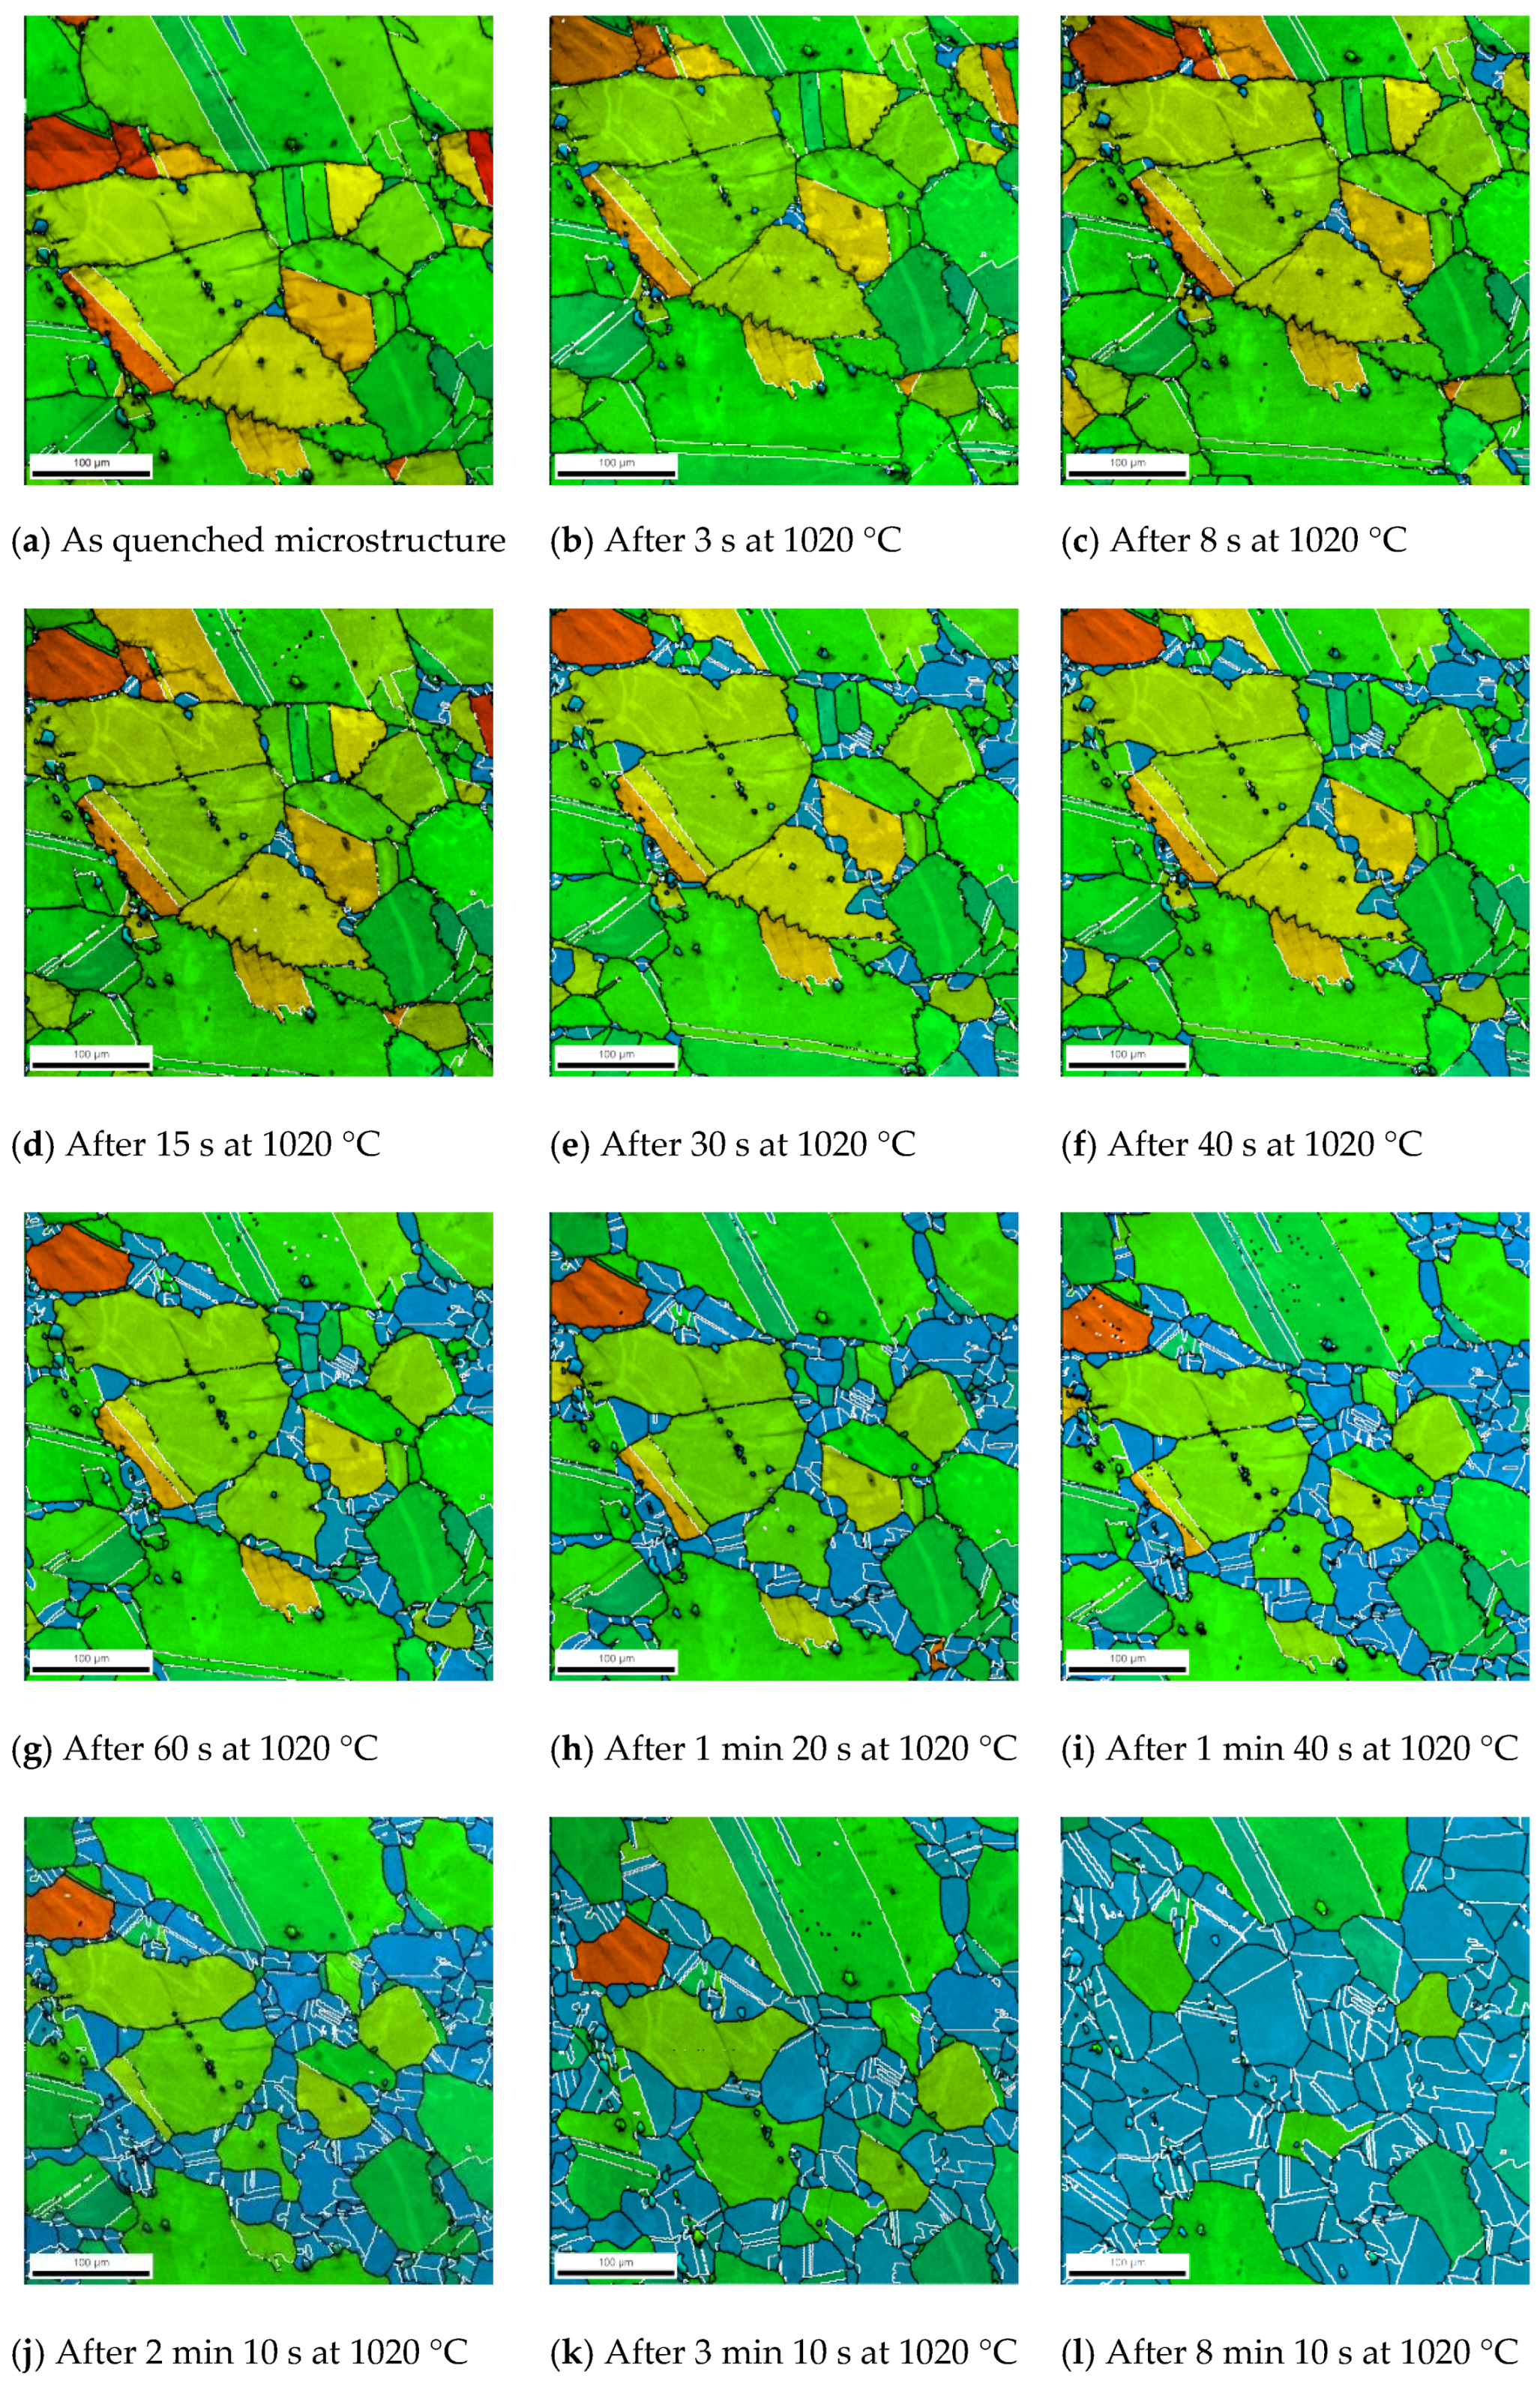
The microstructure of sample A was obtained after deformation at 1020 °C and 0.1 s−1 up to a strain level of ε = 0.25. The initial fraction of recrystallized grains is about 2%. Figure 3 shows how microstructure evolves with increasing annealing time at 1020 °C. Successive holdings at that temperature were actually performed using the in situ annealing stage to obtain this sequence. Figure 4 shows some of the states of Figure 3 but within a different color-coding.
During the first heat-treatments (cumulated holding time below 30 s), the microstructure evolution is limited to the growth of few pre-existing nuclei/grains (white ellipses in Figure 4). During the next annealing steps, new recrystallized grains appear (red ellipses in Figure 4). Both types of recrystallized grains have low internal misorientations (blue in the GOS and KAM color-codes of Figure 3 and Figure 4), indicative for low dislocation densities. All new grains appear preferentially at grain boundaries, where the local dislocation density is initially higher (high KAM value). The second population of recrystallized grains (red ellipses in Figure 4) appears after a certain incubation time (more than 30 s). The existence of such an incubation time suggests that they arise from a static recrystallization mechanism, contrary to the ones that immediately grow and would correspond to metadynamic recrystallization. Thus, in sample A, characterized by a very low initial DRX volume fraction, both static and metadynamic recrystallization mechanisms seem to happen within the post-dynamic regime.
3.3. Post-dynamic Evolution Starting from Higher DRX Volume Fractions (Sample B, Strain 0.55, DRX 26%, and Sample C, Strain 2.0, DRX 65%)
The microstructures of samples B and C were obtained after deformation at 1020 °C and 0.1 s−1 up to strain levels of ε = 0.55 and ε = 2.0, respectively. The volume fractions of dynamically recrystallized grains are respectively 26% and 65%. Figure 5 and Figure 6 show microstructure evolution of samples B and C with increasing the cumulated annealing time at 1020 °C. In contrast with sample A (Figure 3 and Figure 4), the appearance of new grains in the analyzed section was not observed. The microstructure evolution is most likely to be only due to the growth of preexisting nuclei and recrystallized grains at the expense of the deformed matrix, which is typical of metadynamic recrystallization.
Post-dynamic recrystallization completes in samples B and C much faster than in sample A. Sample C is almost fully recrystallized after annealing for only 12 seconds whereas sample A is still not fully recrystallized after more than 8 min at 1020 °C. After recrystallization completion, microstructures enter the grain growth regime, controlled by the capillarity forces associated with the grain boundary curvature. Within this last stage, kinetics is mostly controlled by the grain size.
4. Discussion
4.1. Validation of the Ability of the Sequential Annealing Procedure to Mimic Post-Dynamic Evolutions
In industrial pieces, post-dynamic evolutions happen during cooling after hot-deformation. In the present experiments, isothermal annealing is performed, at the deformation temperature. It would thus be hazardous to directly use the kinetics identified from these experiments to predict the microstructure obtained in a massive piece forged under the same thermomechanical conditions. The results presented here should better be considered as landmarks, providing orders of magnitude of the characteristic times for post-dynamic recrystallization.
In addition, the samples were quenched and reheated several times, at the end of the hot-torsion test and in between each in situ annealing step. The quenching delay after deformation is 2 to 3 s, which might not be negligible with regards to the very fast kinetics of post-dynamic evolutions. Furthermore, microstructure could also possibly evolve during heating and cooling of each annealing step, even though the rates are as high as 100°C·s−1. In order to evaluate possible artifacts coming from the applied procedure, the recrystallization kinetics and grain size evolutions in sample B were compared to those of other samples, hereafter referred to as sample series D. Samples D were submitted to same hot torsion test as sample B (up to 0.55 strain at 1020 °C and 0.1 s−1) but were maintained for 30, 60 or 300 s at the deformation temperature inside the torsion machine before being water quenched.
Recrystallization kinetics and grain size evolutions of samples B and D are compared in Figure 7. Grain size evolution is consistent for the two series of data (Figure 7a). The recrystallized grain size after annealing for 30 s at 1020 °C is 16.8 µm in sample B and 18.0 µm for sample D. On the other hand, recrystallization kinetics is 3 to 4 times faster for the in situ annealing treatments applied onto sample B compared to samples D (Figure 7b). Reaching a recrystallized volume fraction of 30% takes 9 s in sample B, but 30 s in sample D. Even if the end-of-deformation quenching delay of 2–3 s is added to the cumulated annealing time of sample B, post-dynamic recrystallization still remains faster in the in situ annealing experiments. A possible reason for this discrepancy is related to the statistical representativeness of the analyzed areas in both samples, and especially in sample B. Within the in situ sequential annealing procedure the analyzed surface is limited, because of the large number of EBSD maps to be acquired in each annealing series. In sample D, the analyzed area was larger, but still could remain below the size at which recrystallization phenomena can be considered as homogeneous. Recrystallization proceeds faster where the initial microstructure has stored more energy. The stored energy field is heterogeneous at different scales, for various reasons due to (i) strain localization near grain boundaries associated with plastic incompatibilities between neighboring grains; (ii) crystal plasticity anisotropy (at the grain-to-grain level); and (iii) crystallographic texture heterogeneities possibly inherited from former thermomechanical processing steps and likely to operate at quite large scales (typically up to hundreds of micrometers).
The analyzed area of sample B (Figure 5) encompasses one large deformed grain that takes a long time to recrystallize and might be responsible for the apparently slower recrystallization kinetics. Because of the difficulty to ascertain the statistical relevance of recrystallization kinetics, only obvious changes in kinetics will be discussed in this paper, and the difference between samples B and D will not be considered as significant. The grain size evolution which is very similar is on the contrary a strong argument that post-dynamic recrystallization indeed proceeds similarly (at the local scale) in both samples.
4.2. Post-dynamic Recrystallization Mechanisms and Kinetics
For sample A, the EBSD map of the initial microstructure (after hot-torsion at 1020 °C and 0.1 s−1 and before in situ annealing at 1020 °C) shows very limited number and volume fraction of recrystallized nuclei/grains. The initial grains have stored dislocations while being deformed up to 0.25 and stored energy has reached a level high enough to trigger nucleation only at a few locations in the microstructure, near grain boundaries. When deformation stops, those ones keep growing, by metadynamic recrystallization. After about 30 s, additional recrystallized grains appear, likely to be originated from a static nucleation process. The critical dislocation density needed to onset static recrystallization is indeed lower than that of dynamic recrystallization [9]. Static nucleation can thus happen at other locations in the microstructure, but still along grain boundaries where the dislocation content is higher compared to the core of the grains. Dislocations rearrange to form dislocation-free embryos that progressively evolve into recrystallized grains. This process takes time, which is usually described as an incubation time for static recrystallization. For longer annealing times, all recrystallized grains grow at the expense of the deformed matrix. Within these last stages, new grains continue to appear but they could also be grains that have nucleated earlier below the surface and emerge later on. Because of this possible 2D artifact, it is difficult to draw any definite conclusion on the character of static nucleation, whether it is continuous (occurring progressively in areas with lower and lower dislocation content) or site-saturated (occurring only where the dislocation content was initially above a critical value).
In samples with a higher DRX volume fraction (B and C), metadynamic recrystallization (MDRX) is obvious as the DRX grains immediately start growing, but no sign of static nucleation could be detected in the EBSD map series. It is very likely that MDRX is fast enough to consume the deformed matrix before static nucleation can occur.
Recrystallization kinetics and grain size evolutions during post-deformation annealing of samples A, B and C are represented in Figure 8. Post-dynamic recrystallization kinetics appears to be faster with increasing the volume fraction of dynamically recrystallized grains present in the initial microstructure. The increase in recrystallization grain size as function of annealing time in sample A is quite fast at the beginning (mean slope of the curve close to those of samples B and C) (Figure 7a), and slows down after static recrystallization started producing new small grains. For samples B and C, the growth kinetics of the recrystallized grains are very close to each other. Since those grains develop mainly driven by the consumption of the energy stored in the deformed matrix, the close kinetics suggest that the non-recrystallized parts of the B and C initial microstructures have similar levels of stored energy. This is consistent with the deformation conditions, which were the same for both samples. For those ones also, the increase in grain size progressively becomes slower and slower. This is related to the fact that the recrystallization front migrates towards the core of the initial grains where the stored energy is lower and to the fact that recrystallized grains impinge on each other. The interfaces between recrystallized and non-recrystallized grains migrate fast, driven by the stored energy difference. The interfaces between recrystallized grains migrate much slower because the driving force arises only from their curvature and no longer from stored energy gradients; they do not contribute much to the microstructure evolution. Moreover, it seems that the grain size in samples A, B and C is converging to the same steady-state value for long holding times but this would need additional experiments with longer annealing times to be confirmed.
On the other hand, the recrystallized fraction evolution is more sensitive to the microstructure inherited from hot-deformation (Figure 7b). Post-dynamic recrystallization kinetics in samples B and C (by MDRX) are too close to each other to allow for any definite conclusion on the possible impact of the initial DRX volume fraction, but sample B kinetics seems to be slower than that of sample C. If confirmed this would mean that MDRX proceeds faster if the initial DRX volume fraction is higher, in other words if the number of DRX nuclei/grains per unit area is higher. This sounds logical since metadynamic recrystallization is nothing else but the growth of those pre-existing grains and nuclei. The post-dynamic recrystallization kinetics in sample A is much slower, which is consistent with a much lower density of DRX nuclei/grains that cannot be compensated by the formation of additional statically recrystallized grains.
4.3. Post-dynamic Evolution of Twin Boundaries
It is obvious from Figure 3 that recrystallized grains have a higher twin boundary density than the deformed initial grains. The twin density dΣ3 was measured at each annealing stage, as:
where LΣ3 is the length of all twin boundaries (coherent and incoherent) and A is the analyzed area.
dΣ3 = LΣ3/A
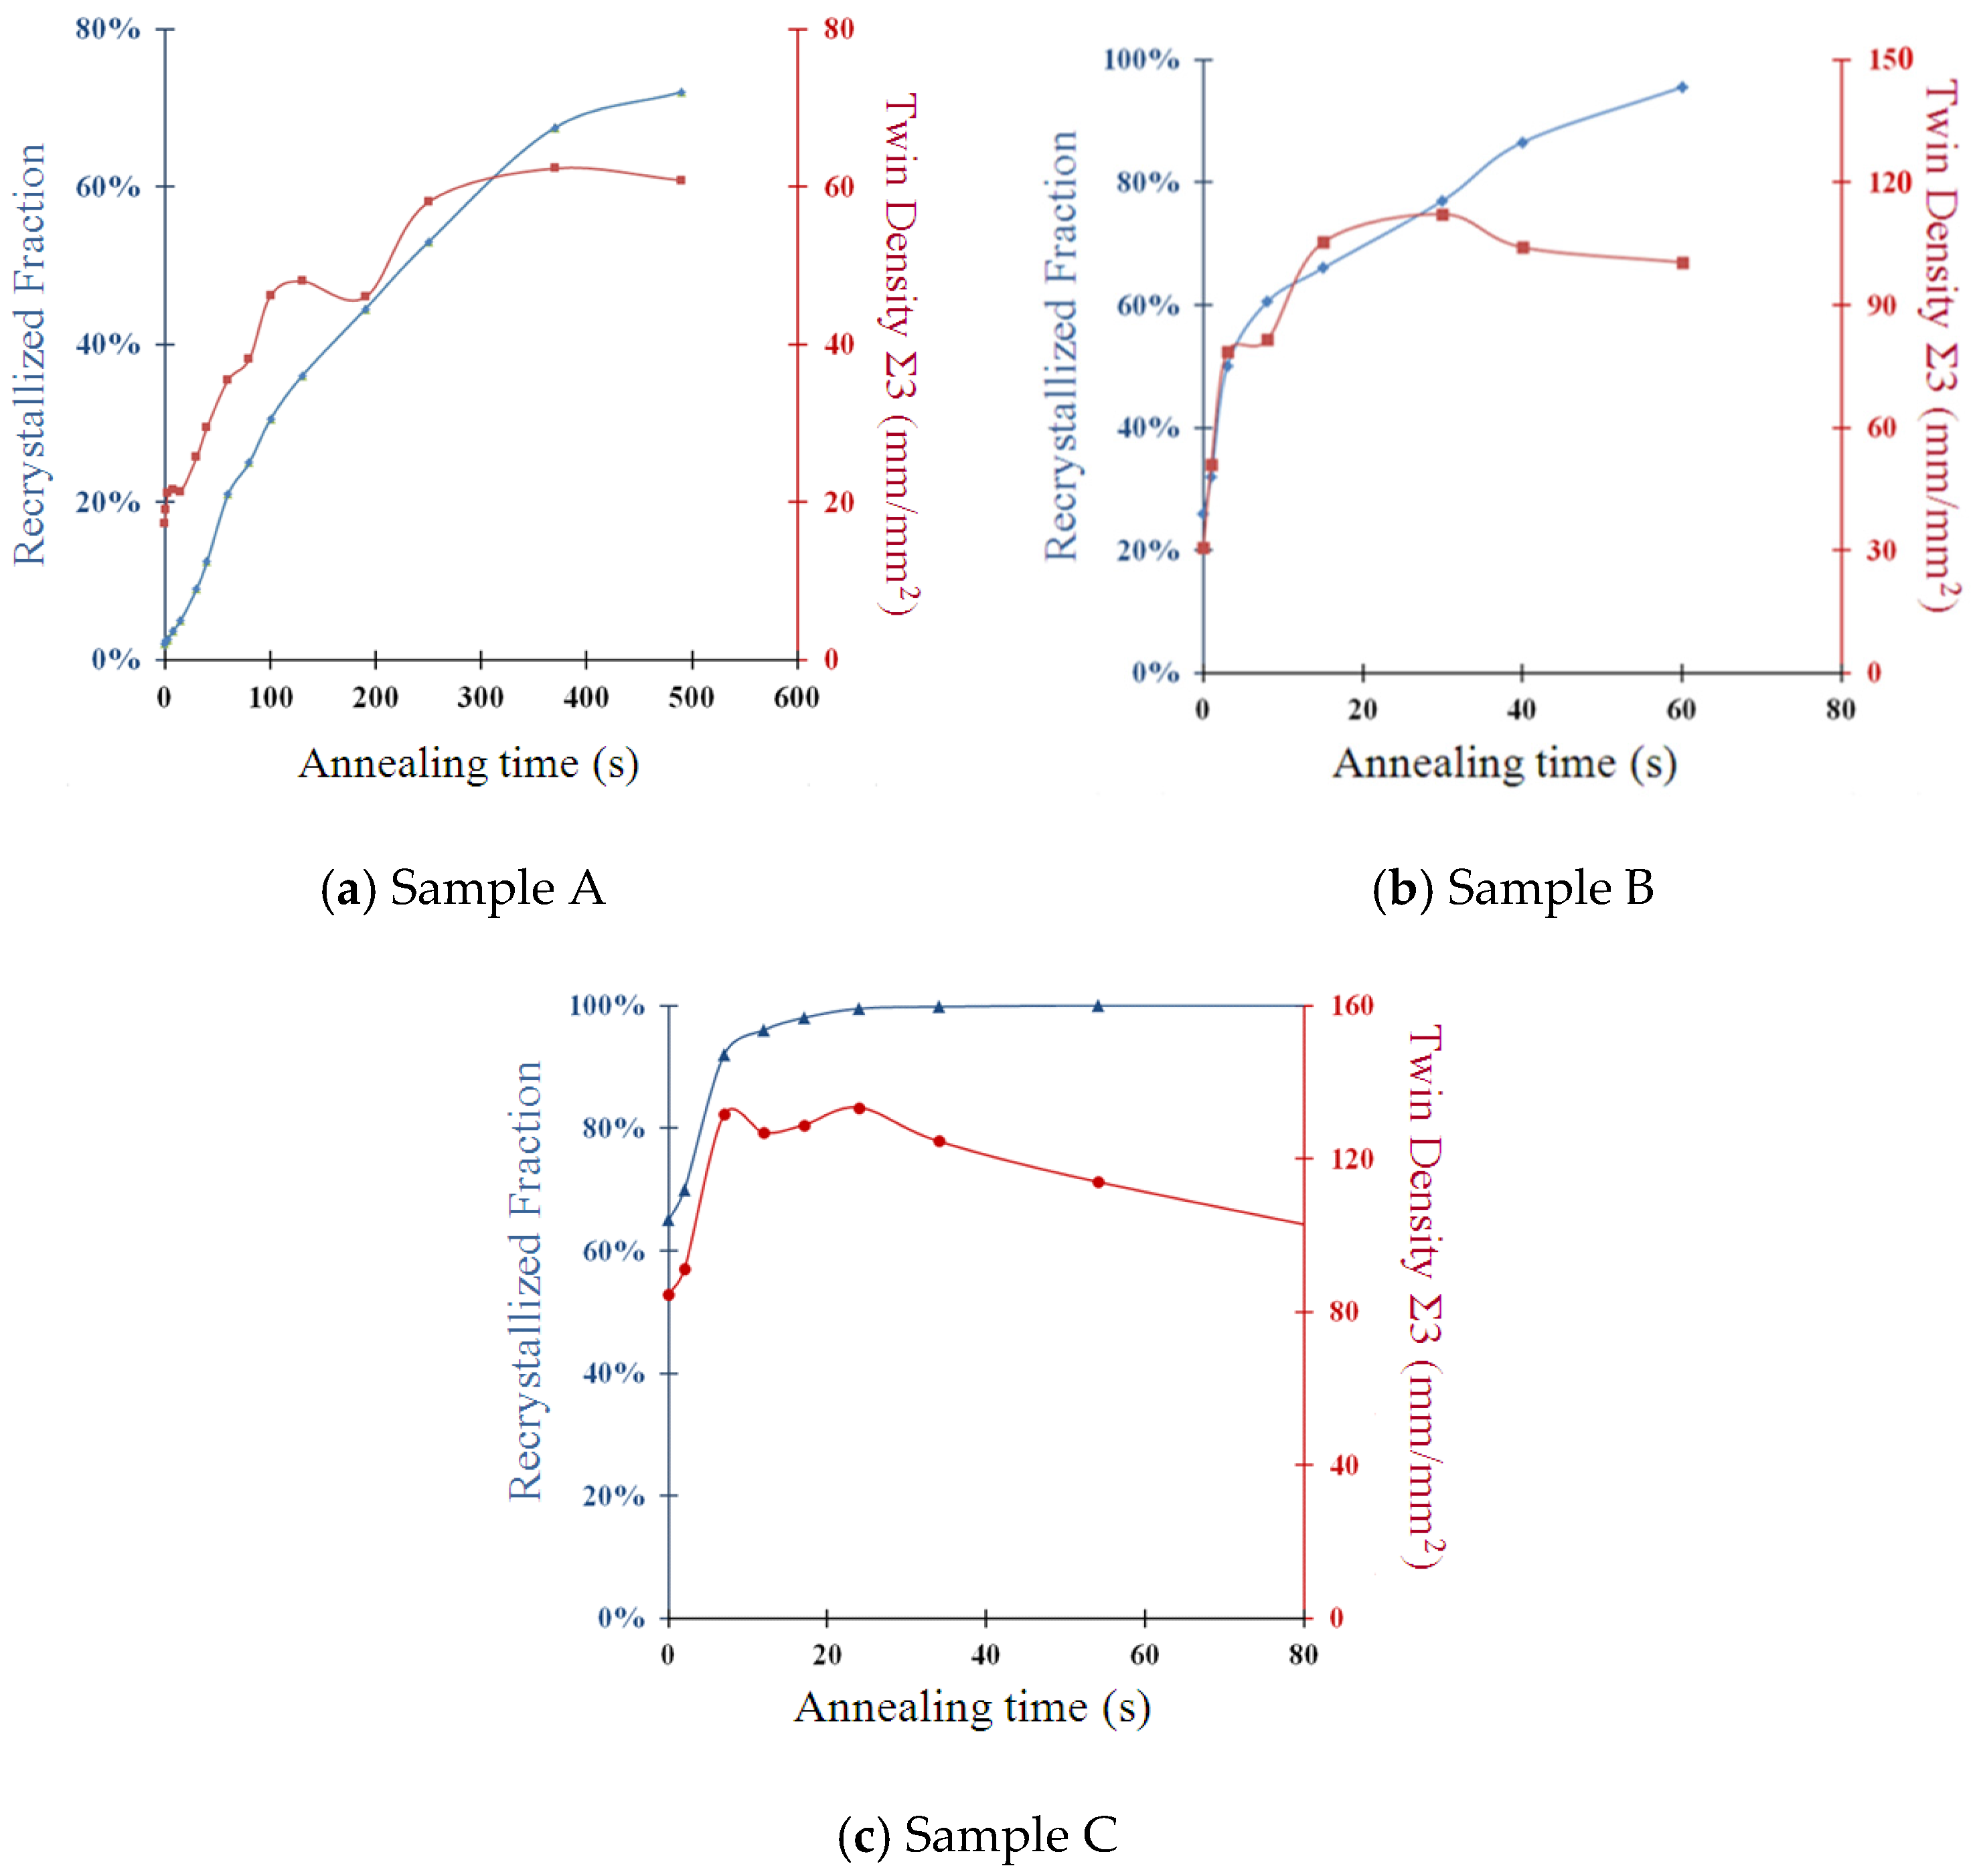
Twin boundary quantification results are shown in Figure 9. Up to some extent, a correlation can be established between the increase of recrystallized volume fraction and the increase in twin density. In all three samples, the twin boundary density is increasing steadily as the recrystallized volume fraction increases from to 60% to 80%. Furthermore, the increase in twin density slows down and then the trend inverses, the twin boundary density starts decreasing. The decrease is particularly pronounced in sample C after full recrystallization, i.e., after the microstructure entered the grain growth regime.
Twin formation has been reported by Jin et al [34] as being consistent with the growth accident model [35,36,37] and as occurring mainly along with the migration of a recrystallization front. It is worth mentioning that twin formation may also play a role in the Inconel 718 recrystallization nucleation process and/or in the growth of the recrystallized grains as it may help in forming mobile high misorientation angle boundaries [15]. On the contrary, twin boundary density decreases within the grain growth regime, as big grains consume small ones and their twins without producing new ones [34,38]. Indeed, only few twin formation events occur during capillarity-driven grain boundary motion. In pure Nickel grain growth experiments, it was directly observed using 3D orientation X-ray diffraction microscopy that twin formation occurs very rarely, at triple junctions only, and only when the resulting boundary misorientation changes lead to a decrease in the overall grain boundary energy [39]. Those previous works lead to the conclusion that grain boundary migration in the recrystallization regime leads to an increase in twin density, while in the grain growth regime, it reduces the twin density. The stagnation and subsequent decrease in the twin density observed in Figure 9 can be interpreted as a competition between zones already fully recrystallized, where the twin boundary density decreases, and zones where recrystallization still proceeds, with a local increase of twin density. These results are thus consistent with the current understanding of annealing twin formation mechanisms.
5. Conclusions
Post-dynamic microstructure evolution was investigated in partially recrystallized samples of Inconel 718 after dissolution of δ-phase particles and hot torsion at 1020 °C and 0.1 s−1. An annealing stage mounted in a SEM was used to provide a direct observation of the microstructure evolution in a region of interest. Although the in situ characterization may lead to artifacts due to the limited grain statistics and its 2D nature, a number of conclusions can be drawn, as summarized below.
Two phenomena were observed: static recrystallization and metadynamic recrystallization, depending on the initial dynamically recrystallized fraction.
Static recrystallization occurred only in the sample with the lowest initial DRX volume fraction (2%). It is characterized by an incubation time after which new recrystallized grains appear. It intervenes in addition to the metadynamic growth of pre-existing DRX grains/nuclei.
In microstructures with a higher initial DRX volume fraction (26% and 65%) only metadynamic recrystallization was observed. It is characterized by very fast kinetics starting immediately after deformation stops. Fast metadynamic recrystallization is likely to consume all available stored energy before static recrystallization could occur.
Metadynamic recrystallization has very short characteristic times; within the present thermomechanical settings (1020 °C and 0.1 s−1) typically one minute at the deformation temperature was enough to achieve full regeneration of the deformed microstructure. This has two practical consequences: (i) paying attention to quenching delays in lab experiments aiming at determining dynamic evolution kinetics is crucial; and (ii) metadynamic recrystallization is very likely to control the grain size in industrial forged components which cool down slowly because of their significant thermal inertia.
Post-dynamic recrystallization increases the twin boundary content, consistently with the current knowledge of annealing twin formation mechanisms. After the initial increase, the twin density can then start decreasing if the material enters the capillarity-driven grain growth regime.
Acknowledgments
This work has been supported by LISI Aerospace, Forges de Bologne. The authors are very grateful the MSR technical staff members at CEMEF for their support in performing experiments and notably to Mrs Suzanne Jacomet for her precious help in running the in situ annealing stage. RL is also thankful to PX Group for the EPFL lab funding since 2014.
Author Contributions
This paper reports part of the Ph.D. work of Meriem Zouari prepared under the supervision of Nathalie Bozzolo and Roland E. Logé. Meriem Zouari designed and performed the experiments; Nathalie Bozzolo and Roland E. Logé helped her in analyzing the data; Nathalie Bozzolo wrote the paper in its present form.
Conflicts of Interest
The authors declare no conflict of interest. The founding sponsors had no role in the design of the study; in the collection, analyses, or interpretation of data; in the writing of the manuscript, and in the decision to publish the results.
References
- Luton, M.J.; Sellars, C.M. Dynamic recrystallization in nickel and nickel-iron alloys during high temperature deformation. Acta Metall. 1969, 17, 1033–1043. [Google Scholar] [CrossRef]
- Zhou, L.X.; Baker, T.N. Effects of dynamic and metadynamic recrystallization on microstructures of wrought IN-718 due to hot deformation. Mater. Sci. Eng. A 1995, 196, 89–95. [Google Scholar] [CrossRef]
- Guest, R.P.; Tin, S. The dynamic and metadynamic recrystallization of IN718. In Proceedings of the 6th International Symposium on Superalloys 718, 625, 706 and Derivatives, Pittsburgh, PA, USA, 17–20 May 2005. [Google Scholar]
- Wang, Y.; Shao, W.Z.; Zhen, L.; Yang, L.; Zhang, X.M. Flow behavior and microstructures of superalloy 718 during high temperature deformation. Mater. Sci. Eng. A 2008, 497, 479–486. [Google Scholar] [CrossRef]
- De Jaeger, J.; Solas, D.; Baudin, T.; Fandeur, O.; Schmitt, J.H.; Rey, C. Inconel 718 recrystallization in the delta supersolvus domain. Adv. Mater. Res. 2011, 409, 751–756. [Google Scholar] [CrossRef]
- Wang, Y.Z.; Shao, W.; Zhen, L.; Zhang, B.Y. Hot deformation behavior of delta-processed superalloy 718. Mater. Sci. Eng. A 2011, 528, 3218–3227. [Google Scholar] [CrossRef]
- Zhang, H.; Zhang, K.; Zhou, H.; Lu, Z.; Zhao, C.; Yang, X. Effect of strain rate on microstructure evolution of a nickel-based superalloy during hot deformation. Mater. Design 2015, 80, 51–62. [Google Scholar] [CrossRef]
- Azarbarmas, M.; Aghaie-Khafri, M.; Cabrera, J.M.; Calvo, J. Dynamic recrystallization mechanisms and twining evolution during hot deformation of Inconel 718. Mater. Sci. Eng. A 2016, 678, 137–152. [Google Scholar] [CrossRef]
- Roberts, W.; Ahlblom, B. A nucleation criterion for dynamic recrystallization during hot working. Acta Metall. 1978, 26, 801–813. [Google Scholar] [CrossRef]
- Brand, A.J.; Karhausen, K.; Kopp, R. Microstructural simulation of nickel base alloy Inconel 718 in production of turbine discs. Mater. Sc. Technol. 1996, 12, 963–969. [Google Scholar] [CrossRef]
- Huang, D.; Wu, W.T.; Lambert, D.; Semiatin, S.L. Computer simulation of microstructure evolution during hot forging of Waspaloy and nickel alloy 718. In Proceedings of the Fifth International Symposium on Superalloys 718, 625, 706, and Derivatives, Pittsburgh, PA, USA, 17–20 June 2001. [Google Scholar]
- Na, Y.S.; Yeom, J.T.; Park, N.K.; Lee, J.Y. Simulation of microstructures for Alloy 718 blade forging using 3D FEM simulator. J. Mater. Proc. Technol. 2003, 141, 337–342. [Google Scholar] [CrossRef]
- Guest, R.P.; Tin, S. Modelling Microstructural Transformations of Nickel Base Superalloy IN 718 during Hot Deformation. In Proceedings of the 6th International Symposium on Superalloys 718, 625, 706 and Derivatives, Pittsburgh, PA, USA, 17–20 May 2005. [Google Scholar]
- Furrer, D.; Goetz, R.; Shen, G. Modeling and simulation of Alloy 718 microstructure and mechanical properties. In Proceedings of the 7th international symposium on Superalloy 718 & Derivatives, Pittsburgh, PA, USA, 10–13 October 2010. [Google Scholar]
- Zouari, M.; Bozzolo, N.; Logé, R.E. Mean field modeling of dynamic and post-dynamic recrystallization during hot deformation of Inconel 718 in the absence of δ-phase particles. Mater. Sci. Eng. A 2016, 655, 408–424. [Google Scholar] [CrossRef]
- Medeiros, S.C.; Prasad, Y.V.R.K.; Frazier, W.G.; Srinivasan, R. Microstructural modeling of metadynamic recrystallization in hot working of IN 718 superalloy. Mater. Sci. Eng. A 2000, 293, 198–207. [Google Scholar] [CrossRef]
- Zouari, M.; Logé, R.E.; Beltran, O.; Rousselle, S.; Bozzolo, N. Multipass forging of Inconel 718 in the delta-Supersolvus domain: Assessing and modeling microstructure evolution. In Proceedings of the 2nd European Symposium on Superalloys and their Applications, Giens, France, 10–16 May 2014. [Google Scholar]
- He, D.G.; Lin, Y.C.; Chen, M.S.; Li, L. Kinetics equations and microstructural evolution during metadynamic recrystallization in a nickel-based superalloy with δ phase. J. Alloys Compd. 2017, 690, 971–978. [Google Scholar] [CrossRef]
- Humphreys, F.J.; Hatherly, M. Recrystallization and Related Annealing Phenomena; Elsevier: Amsterdam, The Netherlands, 2004. [Google Scholar]
- Sakai, T.; Belyakov, A.; Kaibyshev, R.; Miura, H.; Jonas, J.J. Dynamic and post-dynamic recrystallization under hot, cold and severe plastic deformation conditions. Prog. Mater. Sci. 2014, 60, 130–207. [Google Scholar] [CrossRef]
- Djaic, R.A.P.; Jonas, J.J. Static recrystallization of austenite between intervals of hot working. J. Iron Steel Inst. 1972, 210, 256–261. [Google Scholar]
- Tang, X.; Wang, B.; Ji, H.; Fu, X.; Xiao, W. Behaviour and modeling of microstructure evolution during metadynamic recrystallization in a Ni-based superalloy. Mater. Sci. Eng. A 2016, 675, 192–203. [Google Scholar] [CrossRef]
- Lehockey, E.M.; Palumbo, G.; Lin, P. Improving the weldability and service performance of nickel-and iron-based superalloys by grain boundary engineering. Metall. Mater. Trans. A 1998, 29, 3069–3079. [Google Scholar] [CrossRef]
- Krupp, U.; Kane, W.M.; Liu, X.; Dueber, O.; Laird, C.; McMahon, C.J. The effect of grain-boundary-engineering-type processing on oxygen-induced cracking of IN718. Mater. Sci. Eng. A 2003, 349, 213–217. [Google Scholar] [CrossRef]
- Krupp, U.; Wagenhuber, P.G.; Kane, W.M.; McMahon, C.J. Improving resistance to dynamic embrittlement and intergranular oxidation of nickel based superalloys by grain boundary engineering type processing. Mater. Sc. Technol. 2005, 21, 1247–1254. [Google Scholar] [CrossRef]
- Tan, L.; Sridharan, K.; Allen, T.R. Effect of thermomechanical processing on grain boundary character distribution of a Ni-based superalloy. J. Nucl. Mater. 2007, 371, 171–175. [Google Scholar] [CrossRef]
- Gabb, T.P.; Telesman, J.; Garg, A.; Lin, P.; Provenzano, V.; Heard, R.; Miller, H.M. Grain Boundary Engineering the Mechanical Properties of Allvac 718 Plus Superalloy. In Proceedings of the 7th international symposium on Superalloy 718 & Derivatives, Pittsburgh, PA, USA, 10–13 October 2010. [Google Scholar]
- Souaï, N.; Bozzolo, N.; Nazé, L.; Chastel, Y.; Logé, R.E. About the possibility of grain boundary engineering via hot-working in a nickel-base superalloy. Script. Mater. 2010, 62, 851–854. [Google Scholar] [CrossRef]
- Bozzolo, N.; Souaï, N.; Logé, R.E. Evolution of microstructure and twin density during thermomechanical processing in a γ-γ’ nickel-based superalloy. Acta Mater. 2012, 60, 5056–5066. [Google Scholar] [CrossRef] [Green Version]
- Li, B.; Tin, S. The role of deformation temperature and strain on grain boundary engineering of Inconel 600. Mater. Sci. Eng. A 2014, 603, 104–113. [Google Scholar] [CrossRef]
- Detrois, M.; Rotella, J.; Goetz, R.L.; Helmink, R.C.; Tin, S. Grain boundary engineering of powder processed Ni-base superalloy RR1000: Influence of the deformation parameters. Mater. Sci. Eng. A 2015, 627, 95–105. [Google Scholar] [CrossRef]
- Watanabe, T. Grain boundary engineering: Historical perspective and future prospects. J. Mater. Sci. 2011, 46, 4095–4115. [Google Scholar] [CrossRef]
- Bozzolo, N.; Jacomet, S.; Logé, R.E. Fast in-situ annealing stage coupled with EBSD: A suitable tool to observe quick recrystallization mechanisms. Mater. Charact. 2012, 70, 28–32. [Google Scholar] [CrossRef] [Green Version]
- Jin, Y.; Lin, B.; Bernacki, M.; Rohrer, G.S.; Rollett, A.D.; Bozzolo, N. Annealing twin development during recrystallization and grain growth in pure nickel. Mater. Sci. Eng. A 2014, 597, 295–303. [Google Scholar] [CrossRef] [Green Version]
- Carpenter, H.; Tamura, S. The formation of twinned metallic crystals. Proc. R. Soc. London 1926, 113, 161–182. [Google Scholar] [CrossRef]
- Fullman, R.L.; Fisher, J.C. Formation of annealing twins during grain growth. J. Appl. Phys. 1951, 22, 1350–1355. [Google Scholar] [CrossRef]
- Gleiter, H. The formation of annealing twins. Acta Metall. 1969, 17, 1421–1428. [Google Scholar] [CrossRef]
- Jin, Y.; Bernacki, M.; Agnoli, A.; Lin, B.; Rohrer, G.S.; Rollett, A.D.; Bozzolo, N. Evolution of the annealing twin density during δ-supersolvus grain growth in the nickel-based superalloy Incone 718. Metals 2015, 6, 5–18. [Google Scholar] [CrossRef] [Green Version]
- Lin, B.; Jin, Y.; Hefferan, C.M.; Li, S.F.; Lind, J.; Suter, R.M.; Bernacki, M.; Bozzolo, N.; Rollett, A.D.; Rohrer, G.S. Observation of annealing twin nucleation at triple lines in nickel during grain growth. Acta Mater. 2015, 99, 63–68. [Google Scholar] [CrossRef]
Figure 1.
Schematic of the lamella sampling inside the gauge length of a torsion test sample. After cutting, the thickness is in the range of a millimeter; the thickness is then decreased to 300 µm by mechanical polishing.
Figure 1.
Schematic of the lamella sampling inside the gauge length of a torsion test sample. After cutting, the thickness is in the range of a millimeter; the thickness is then decreased to 300 µm by mechanical polishing.
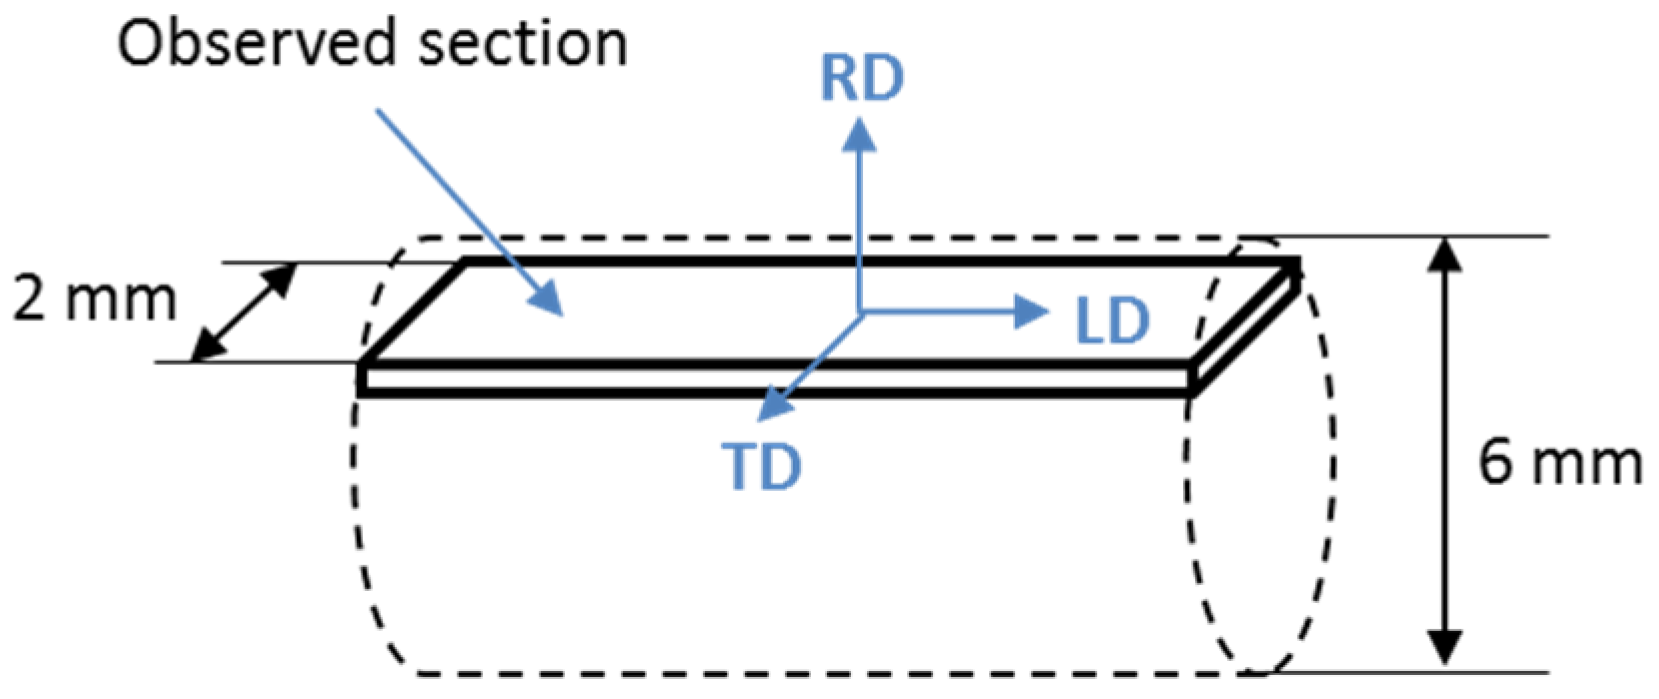
Figure 2.
As-quenched microstructure of samples A, B and C. EBSD orientation maps color-coded according to the crystal direction lying parallel to the longitudinal direction (vertical), as defined in the standard triangle. (a) Sample A (dynamic recrystallization (DRX) volume fraction: 2%); (b) Sample B (DRX volume fraction: 26%); (c) Sample C (DRX volume fraction: 65%).
Figure 3.
Microstructure evolution of sample A (initial DRX volume fraction = 2%) after successive post-dynamic annealing steps at 1020 °C (cumulated holding times are indicated below each micrograph). Intragranular misorientation GOS maps superimposed with the Pattern Quality map. Scale bar: 100 µm. Grain boundaries (>15°) in black and twin boundaries (60° <111>) in white. GOS color-coding from 0 to 9°: ![Metals 07 00476 i001]() .
.
 .
.
Figure 3.
Microstructure evolution of sample A (initial DRX volume fraction = 2%) after successive post-dynamic annealing steps at 1020 °C (cumulated holding times are indicated below each micrograph). Intragranular misorientation GOS maps superimposed with the Pattern Quality map. Scale bar: 100 µm. Grain boundaries (>15°) in black and twin boundaries (60° <111>) in white. GOS color-coding from 0 to 9°: ![Metals 07 00476 i001]() .
.
.
Figure 4.
Same data as in Figure 3.b-f-g, but with a color coding related to the Kernel Average Misorientation (KAM) value instead of the GOS in Figure 3. Grain boundaries (>15°) black. KAM color-coding from 0 to 5°: ![Metals 07 00476 i002]() .
.
 .
.
Figure 5.
Microstructure evolution of sample B (initial DRX volume fraction = 26%) after successive post-dynamic annealing steps at 1020 °C (cumulated holding times are indicated below each micrograph). Intragranular misorientation GOS maps superimposed with the Pattern Quality map. Scale bar: 90 or 100µm. Grain boundaries (>15°) in black and twin boundaries (60° <111>) in white. GOS color-coding from 0 to 6.5°: ![Metals 07 00476 i003]() .
.
.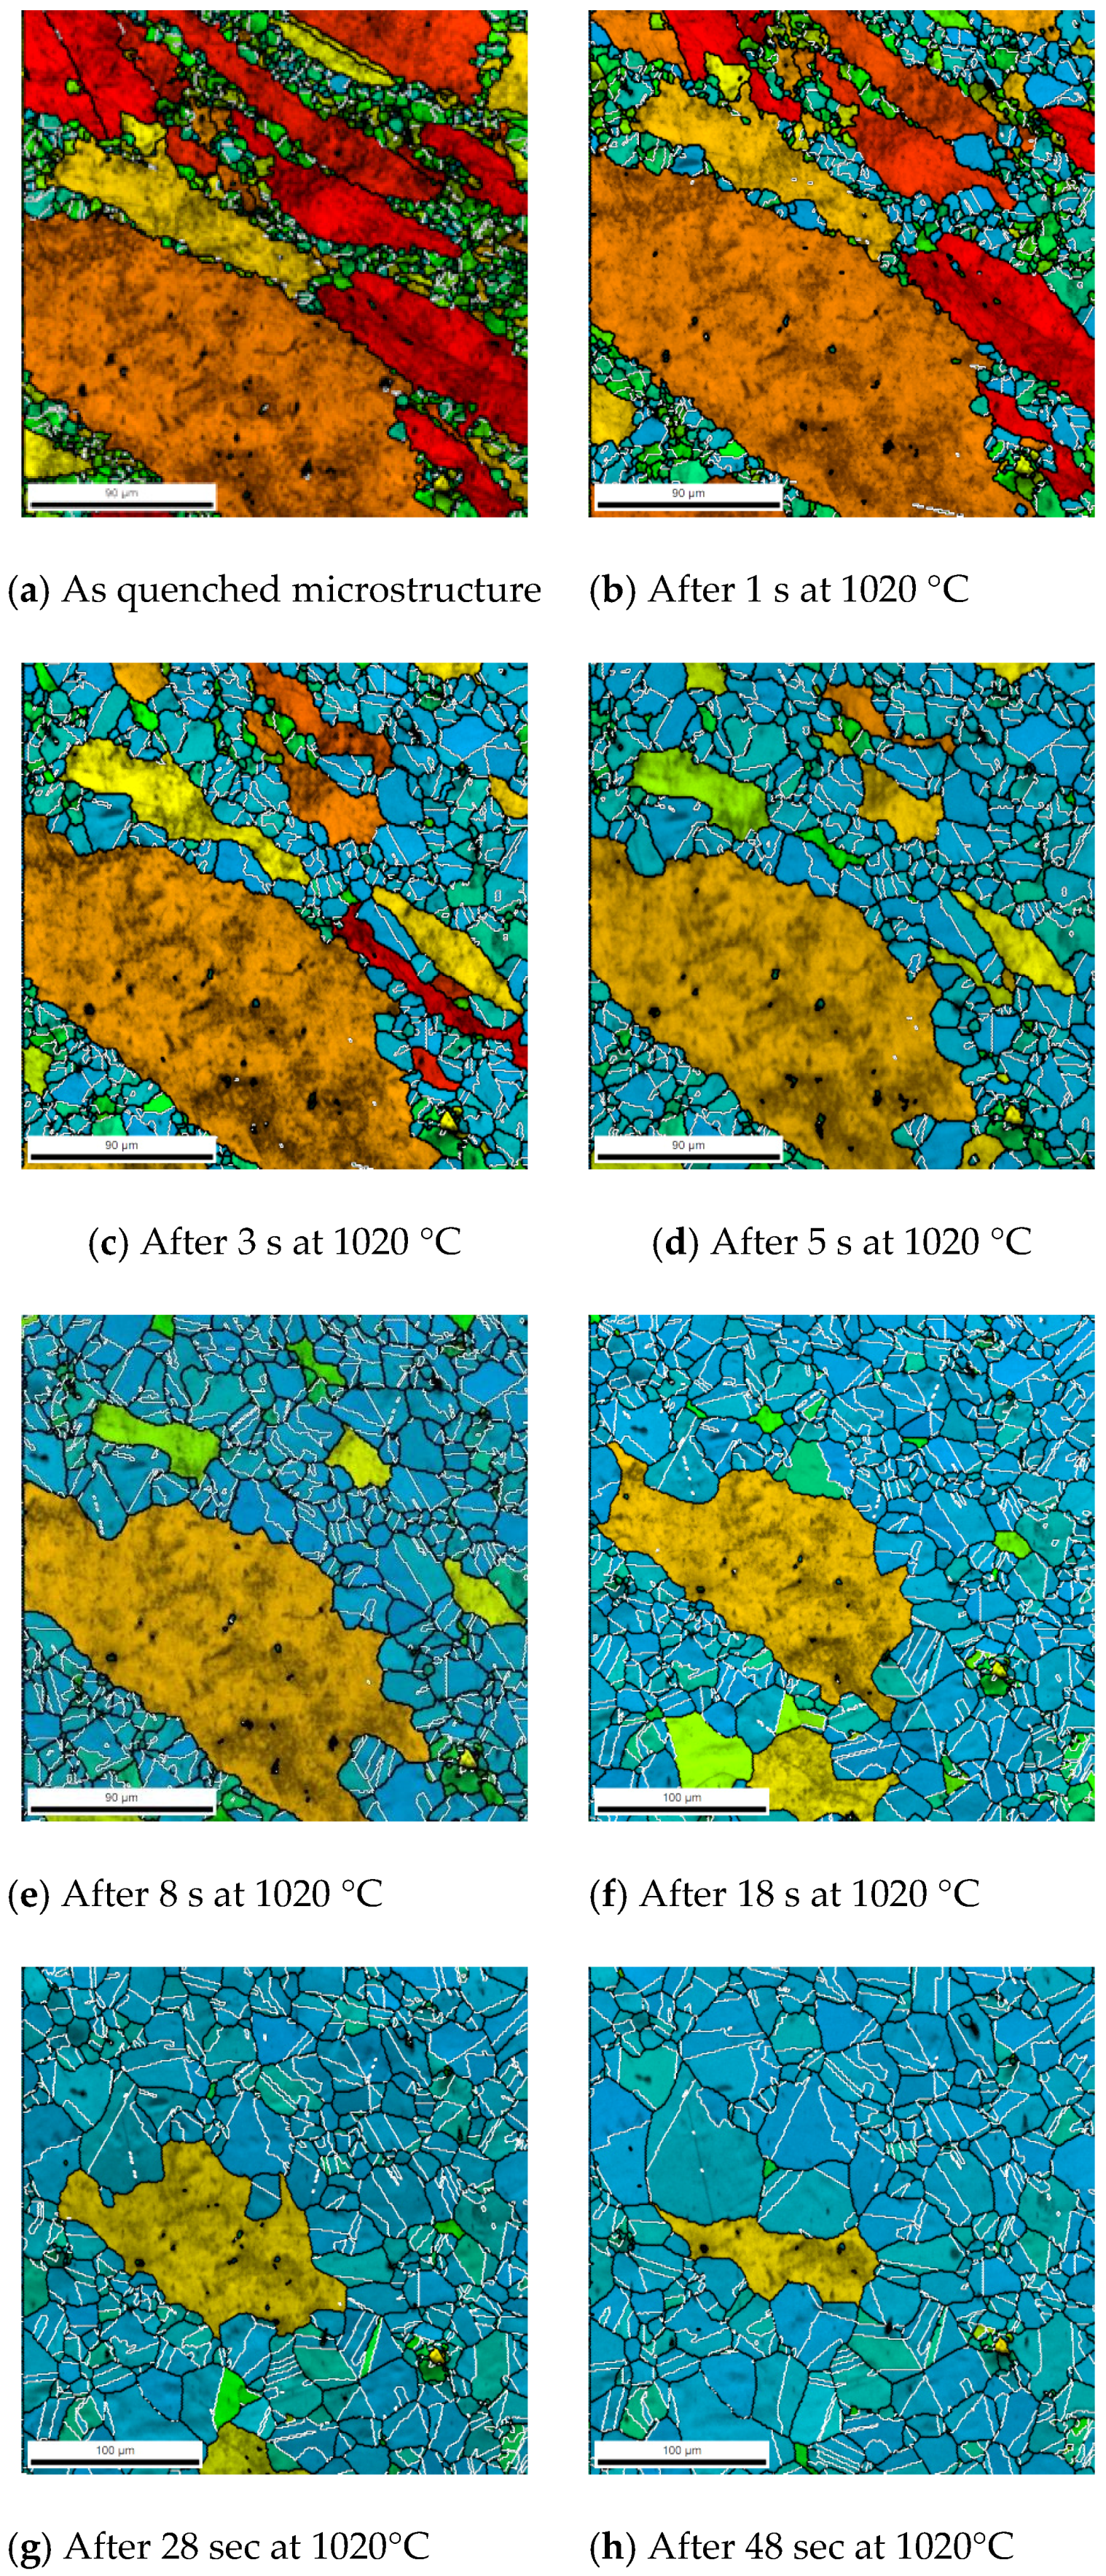
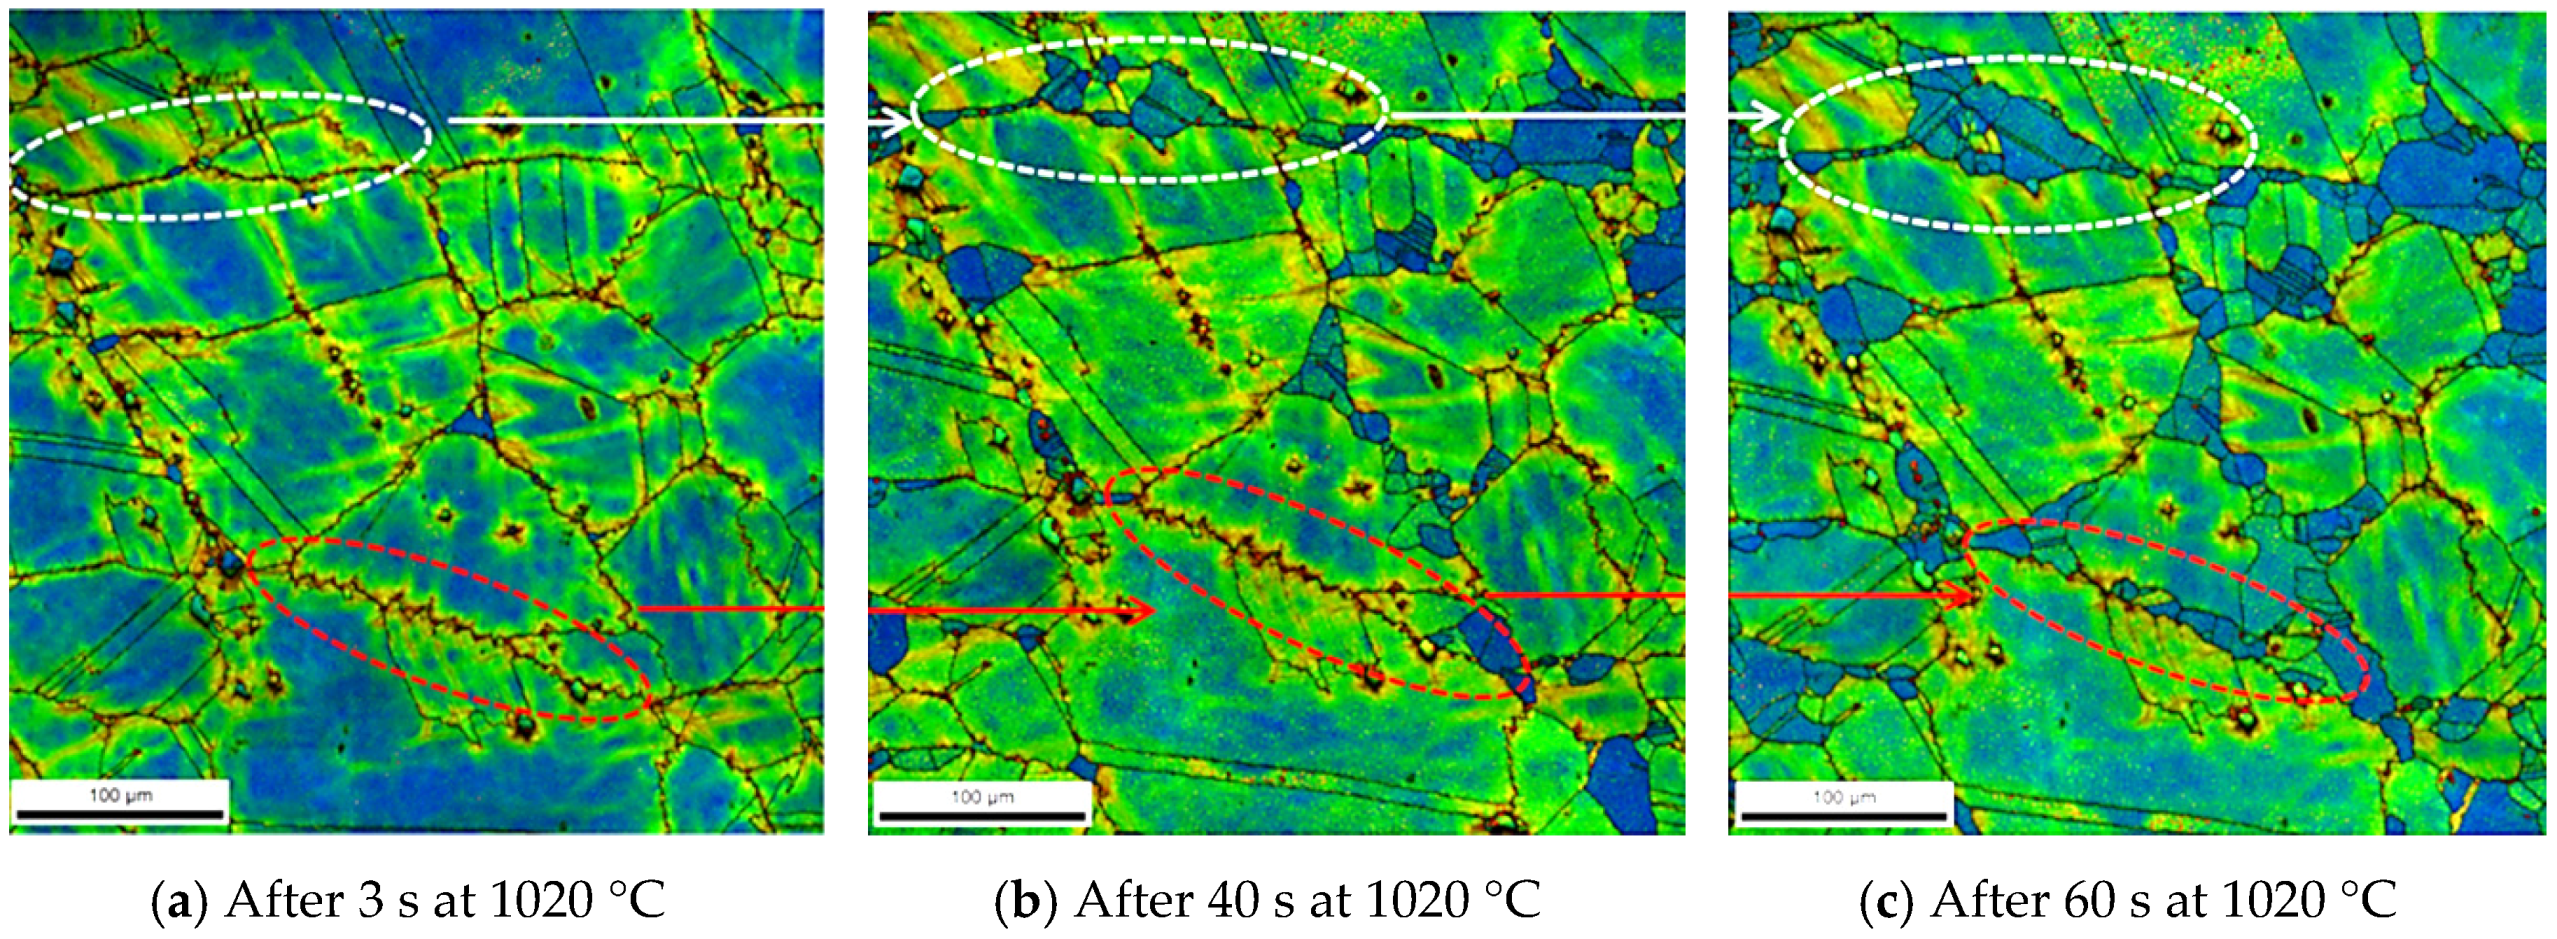
Figure 6.
Microstructure evolution of sample C (initial DRX volume fraction = 65%) after successive post-dynamic annealing steps at 1020 °C (cumulated holding times are indicated below each micrograph). Intragranular misorientation GOS maps superimposed with the Pattern Quality map. Scale bar: 90 µm. Grain boundaries (>15°) in black and twin boundaries (60° <111>) in white. GOS color-coding from 0 to 10.5°: ![Metals 07 00476 i004]() .
.
 .
.
Figure 6.
Microstructure evolution of sample C (initial DRX volume fraction = 65%) after successive post-dynamic annealing steps at 1020 °C (cumulated holding times are indicated below each micrograph). Intragranular misorientation GOS maps superimposed with the Pattern Quality map. Scale bar: 90 µm. Grain boundaries (>15°) in black and twin boundaries (60° <111>) in white. GOS color-coding from 0 to 10.5°: ![Metals 07 00476 i004]() .
.
.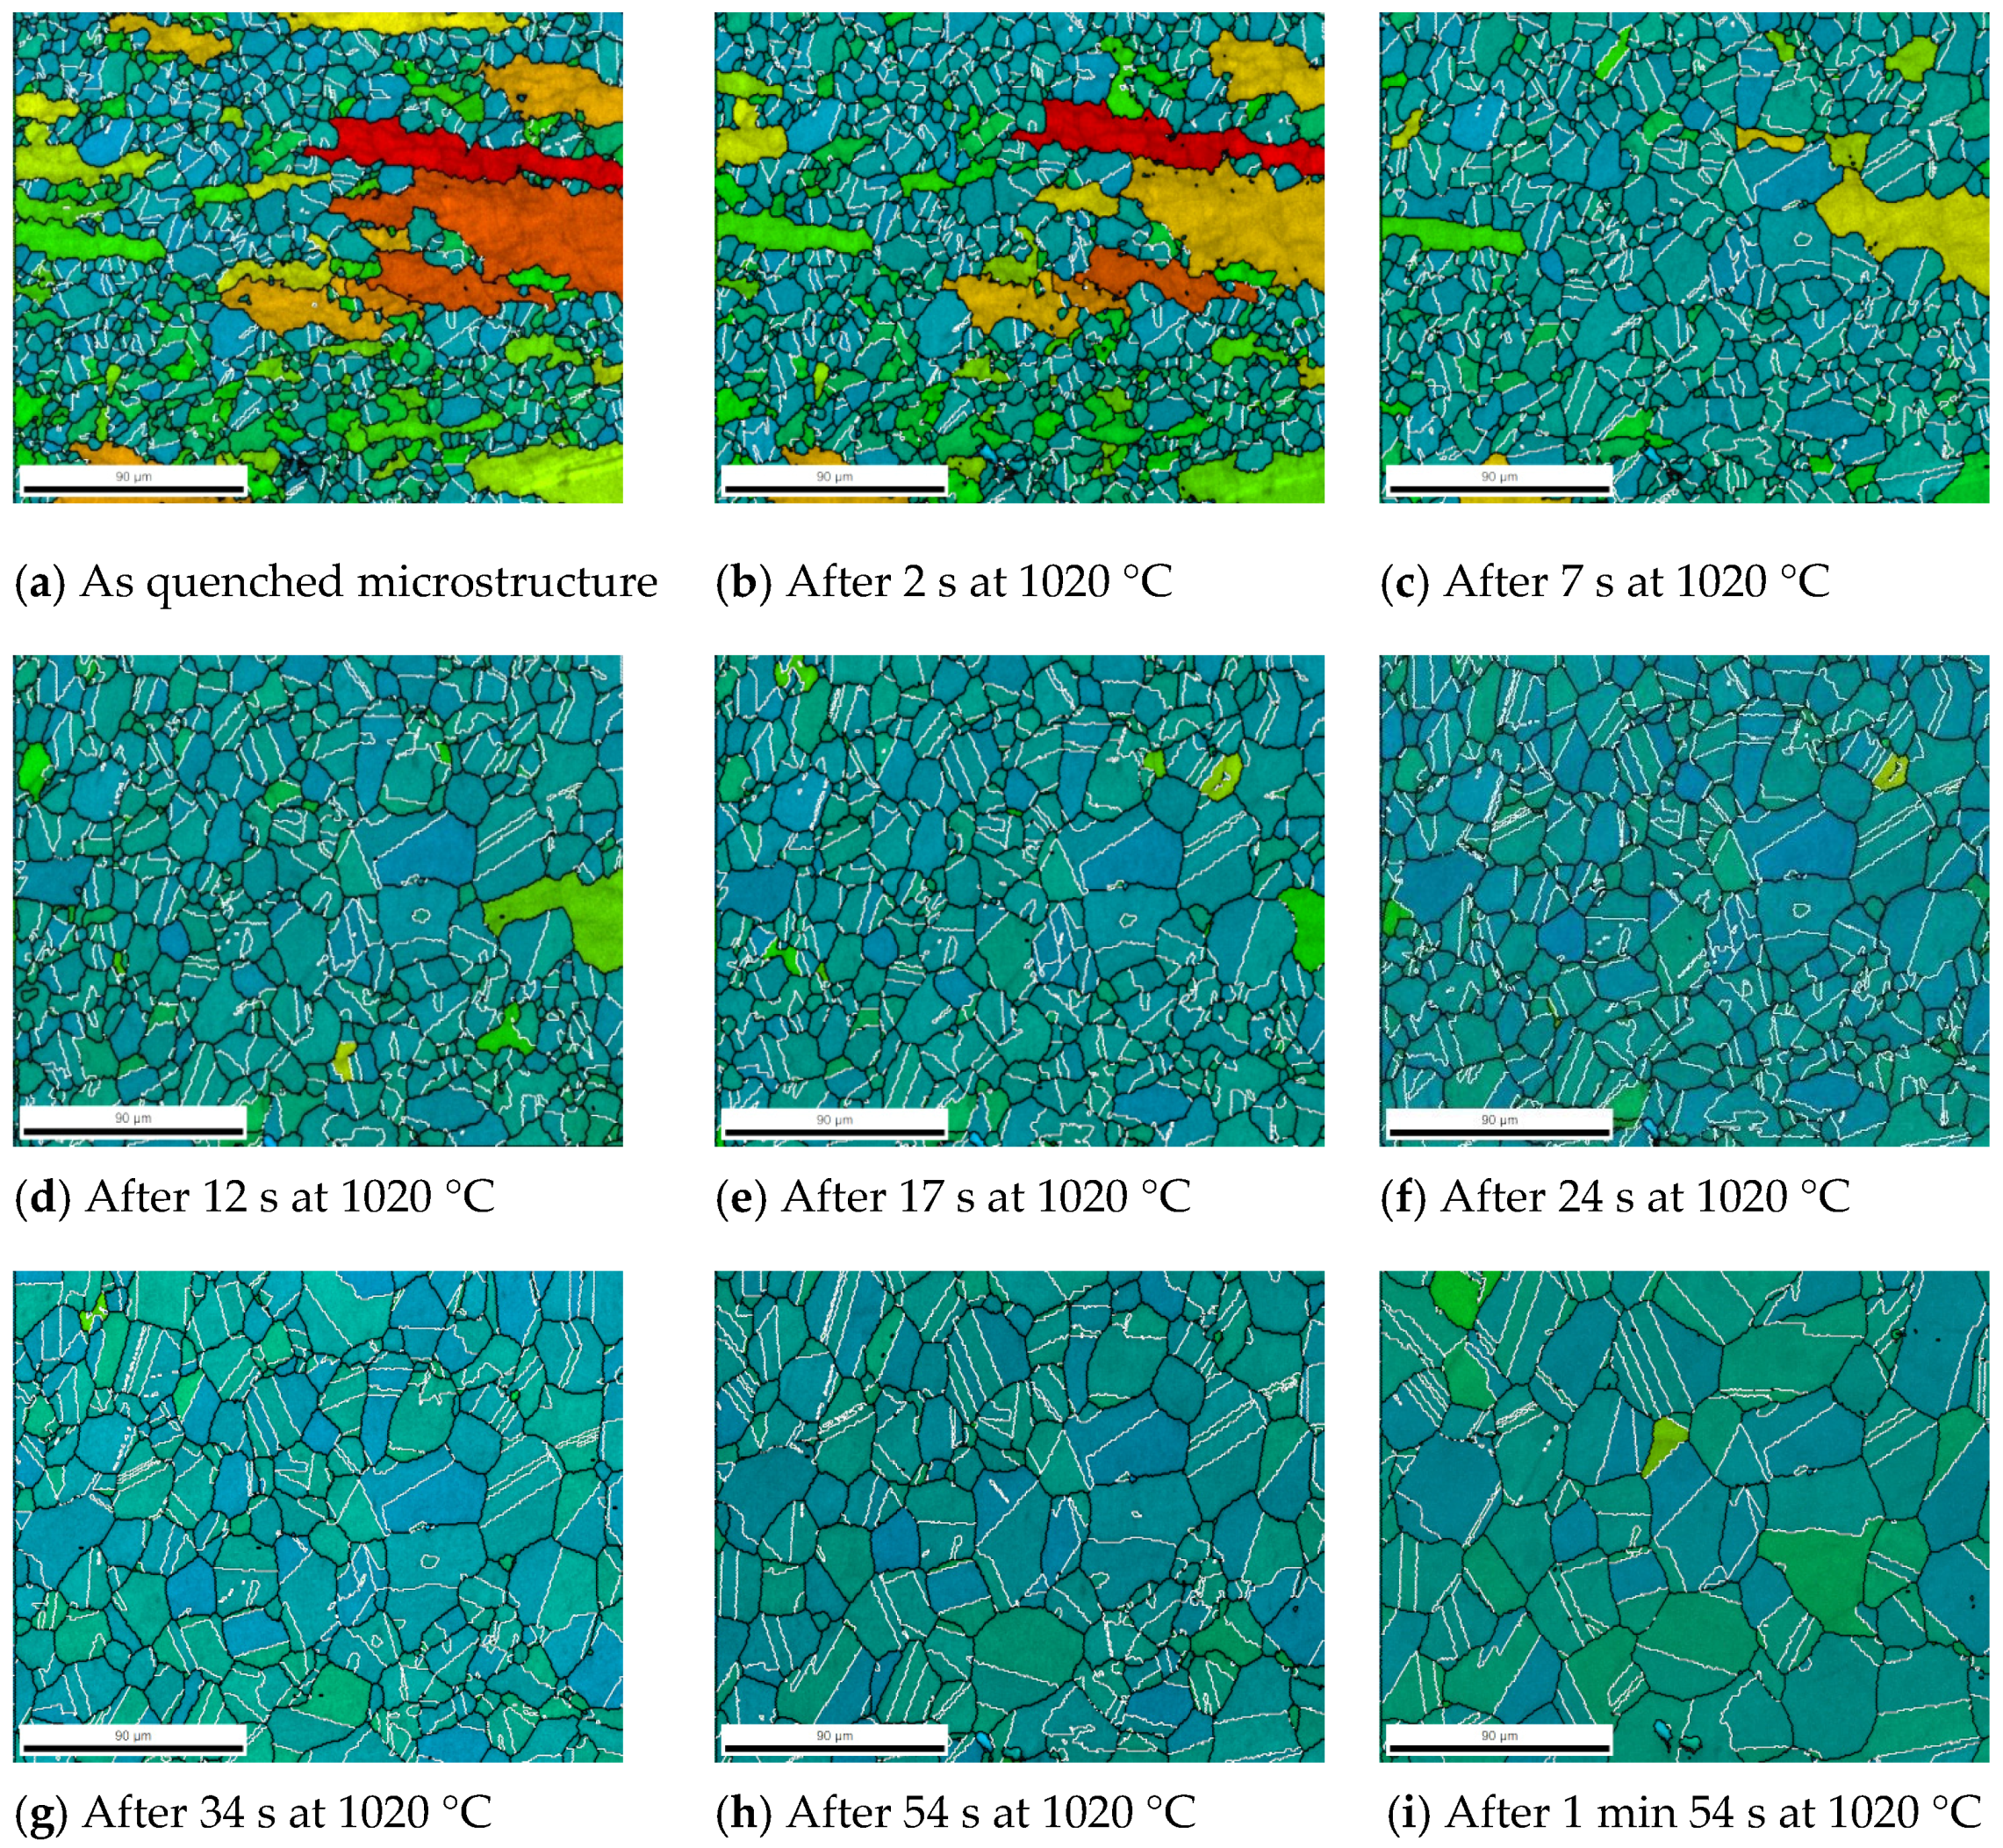
Figure 7.
Post-dynamic recrystallization kinetics obtained with in situ annealing procedure applied onto sample B or with holding time applied onto samples D before water quenching at the end of deformation. Same deformation conditions for both data series: up to 0.55 strain at 1020 °C and 0.1 s−1. (a) Average recrystallized grain size; (b) Recrystallized volume fraction.
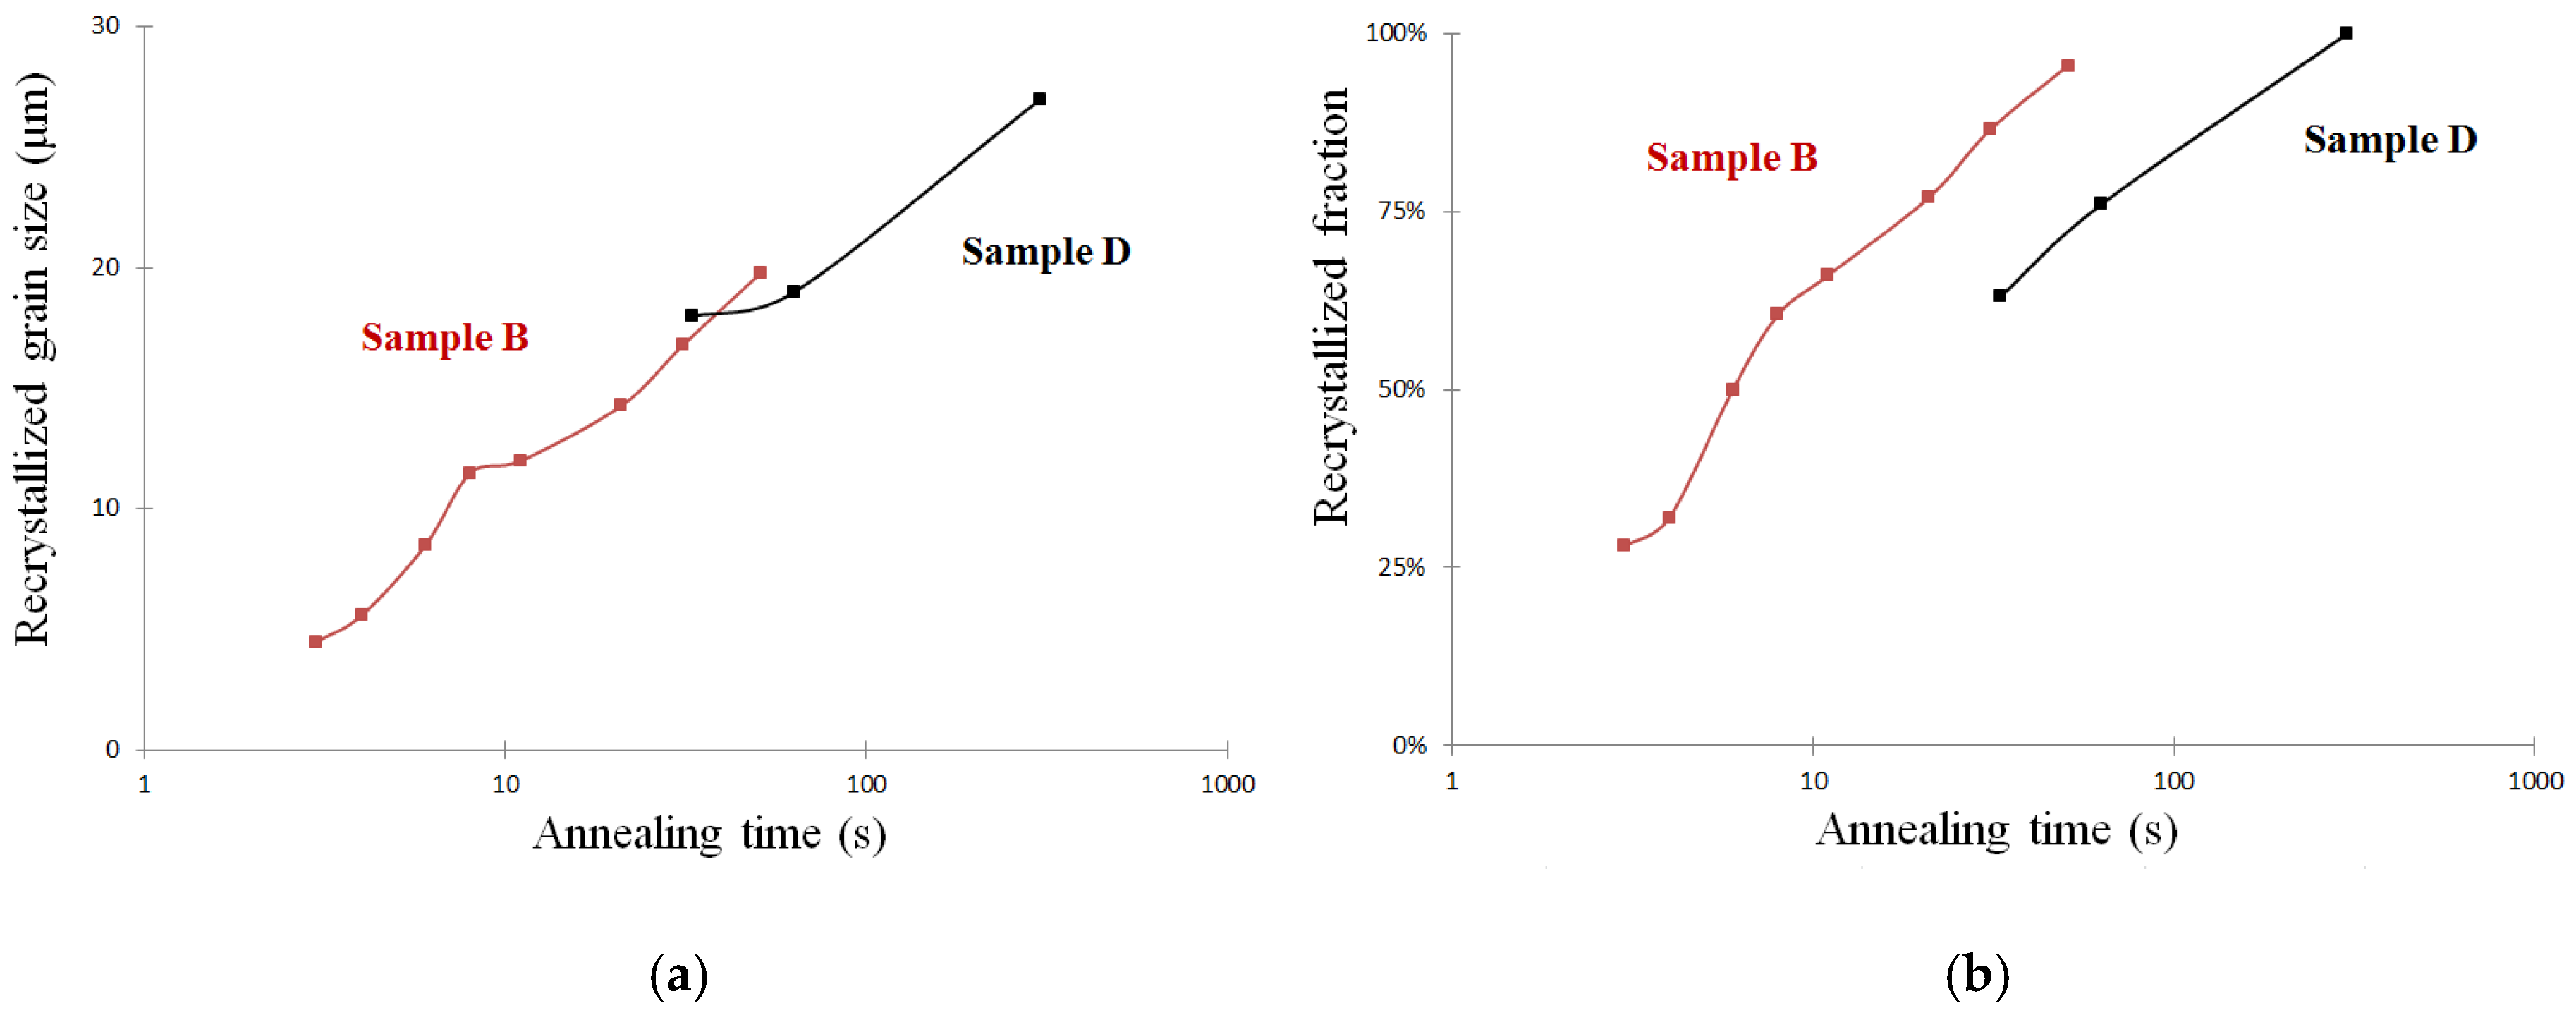
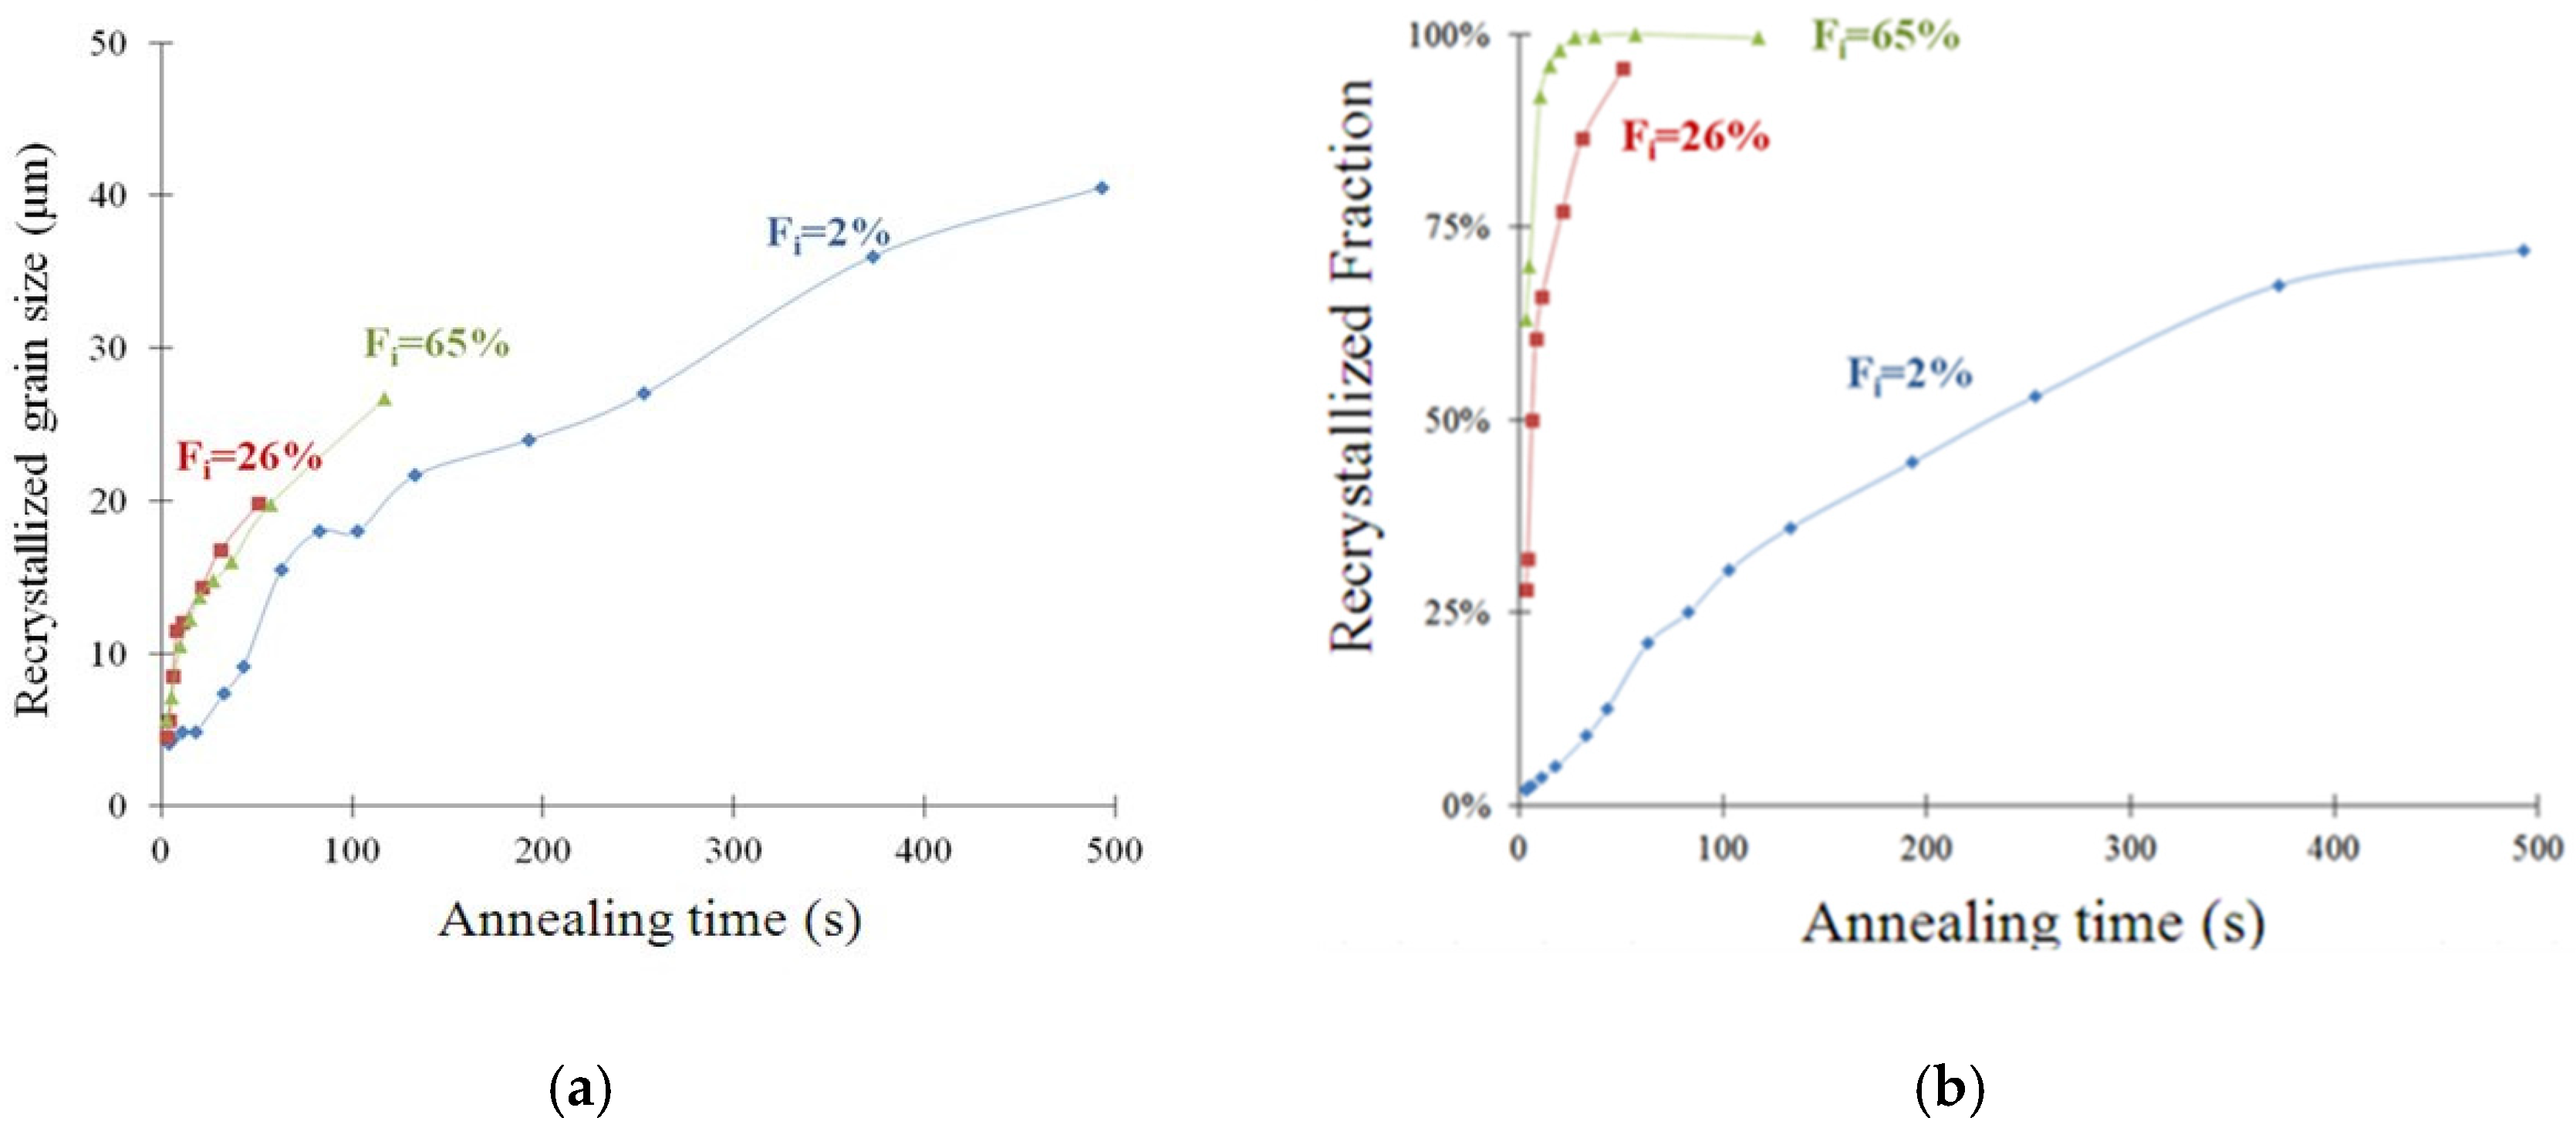
Figure 8.
Post-dynamic recrystallization kinetics in samples A, B and C, with an initial DRX volume fraction (noted Fi on the curves) of 2%, 26% and 65%, respectively. (a) Average recrystallized grain size; (b) Recrystallized volume fraction.
Figure 8.
Post-dynamic recrystallization kinetics in samples A, B and C, with an initial DRX volume fraction (noted Fi on the curves) of 2%, 26% and 65%, respectively. (a) Average recrystallized grain size; (b) Recrystallized volume fraction.

Figure 9.
Recrystallized volume fraction and annealing twin density evolution during post-deformation annealing at 1020 °C in samples A, B and C.
Figure 9.
Recrystallized volume fraction and annealing twin density evolution during post-deformation annealing at 1020 °C in samples A, B and C.


Table 1.
Composition (wt %) of the Inconel 718 samples used in this study.
| Ni | Fe | Cr | Nb | Mo | Ti,Al,Co | Other |
|---|---|---|---|---|---|---|
| 54.0% | 17.8% | 18.0% | 5.3% | 3.0% | 1.49% | <0.5% |
© 2017 by the authors. Licensee MDPI, Basel, Switzerland. This article is an open access article distributed under the terms and conditions of the Creative Commons Attribution (CC BY) license (http://creativecommons.org/licenses/by/4.0/).
Share and Cite
MDPI and ACS Style
Zouari, M.; Logé, R.E.; Bozzolo, N. In Situ Characterization of Inconel 718 Post-Dynamic Recrystallization within a Scanning Electron Microscope. Metals 2017, 7, 476. https://doi.org/10.3390/met7110476
AMA Style
Zouari M, Logé RE, Bozzolo N. In Situ Characterization of Inconel 718 Post-Dynamic Recrystallization within a Scanning Electron Microscope. Metals. 2017; 7(11):476. https://doi.org/10.3390/met7110476
Chicago/Turabian StyleZouari, Meriem, Roland E. Logé, and Nathalie Bozzolo. 2017. "In Situ Characterization of Inconel 718 Post-Dynamic Recrystallization within a Scanning Electron Microscope" Metals 7, no. 11: 476. https://doi.org/10.3390/met7110476
Note that from the first issue of 2016, this journal uses article numbers instead of page numbers. See further details here.