Effects of Porosity, Heat Input and Post-Weld Heat Treatment on the Microstructure and Mechanical Properties of TIG Welded Joints of AA6082-T6


Abstract
:
1. Introduction
2. Materials and Methods
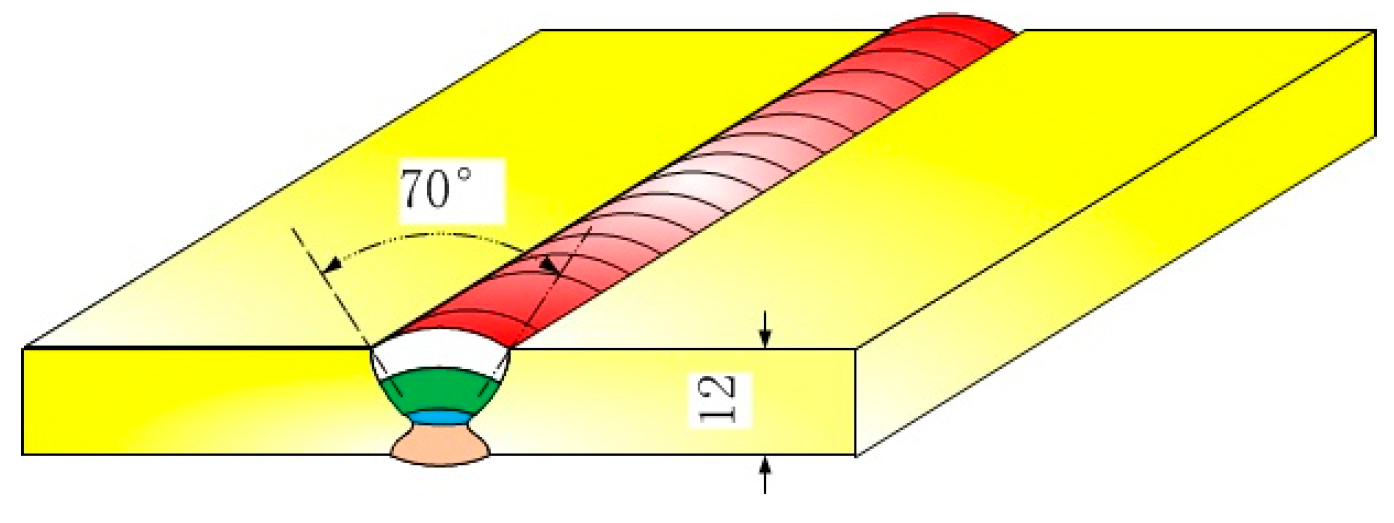
2.1. Materials and Welding Process
2.2. PWHT (Post-Weld Heat Treatment) and Performance Tests
3. Results and Discussion
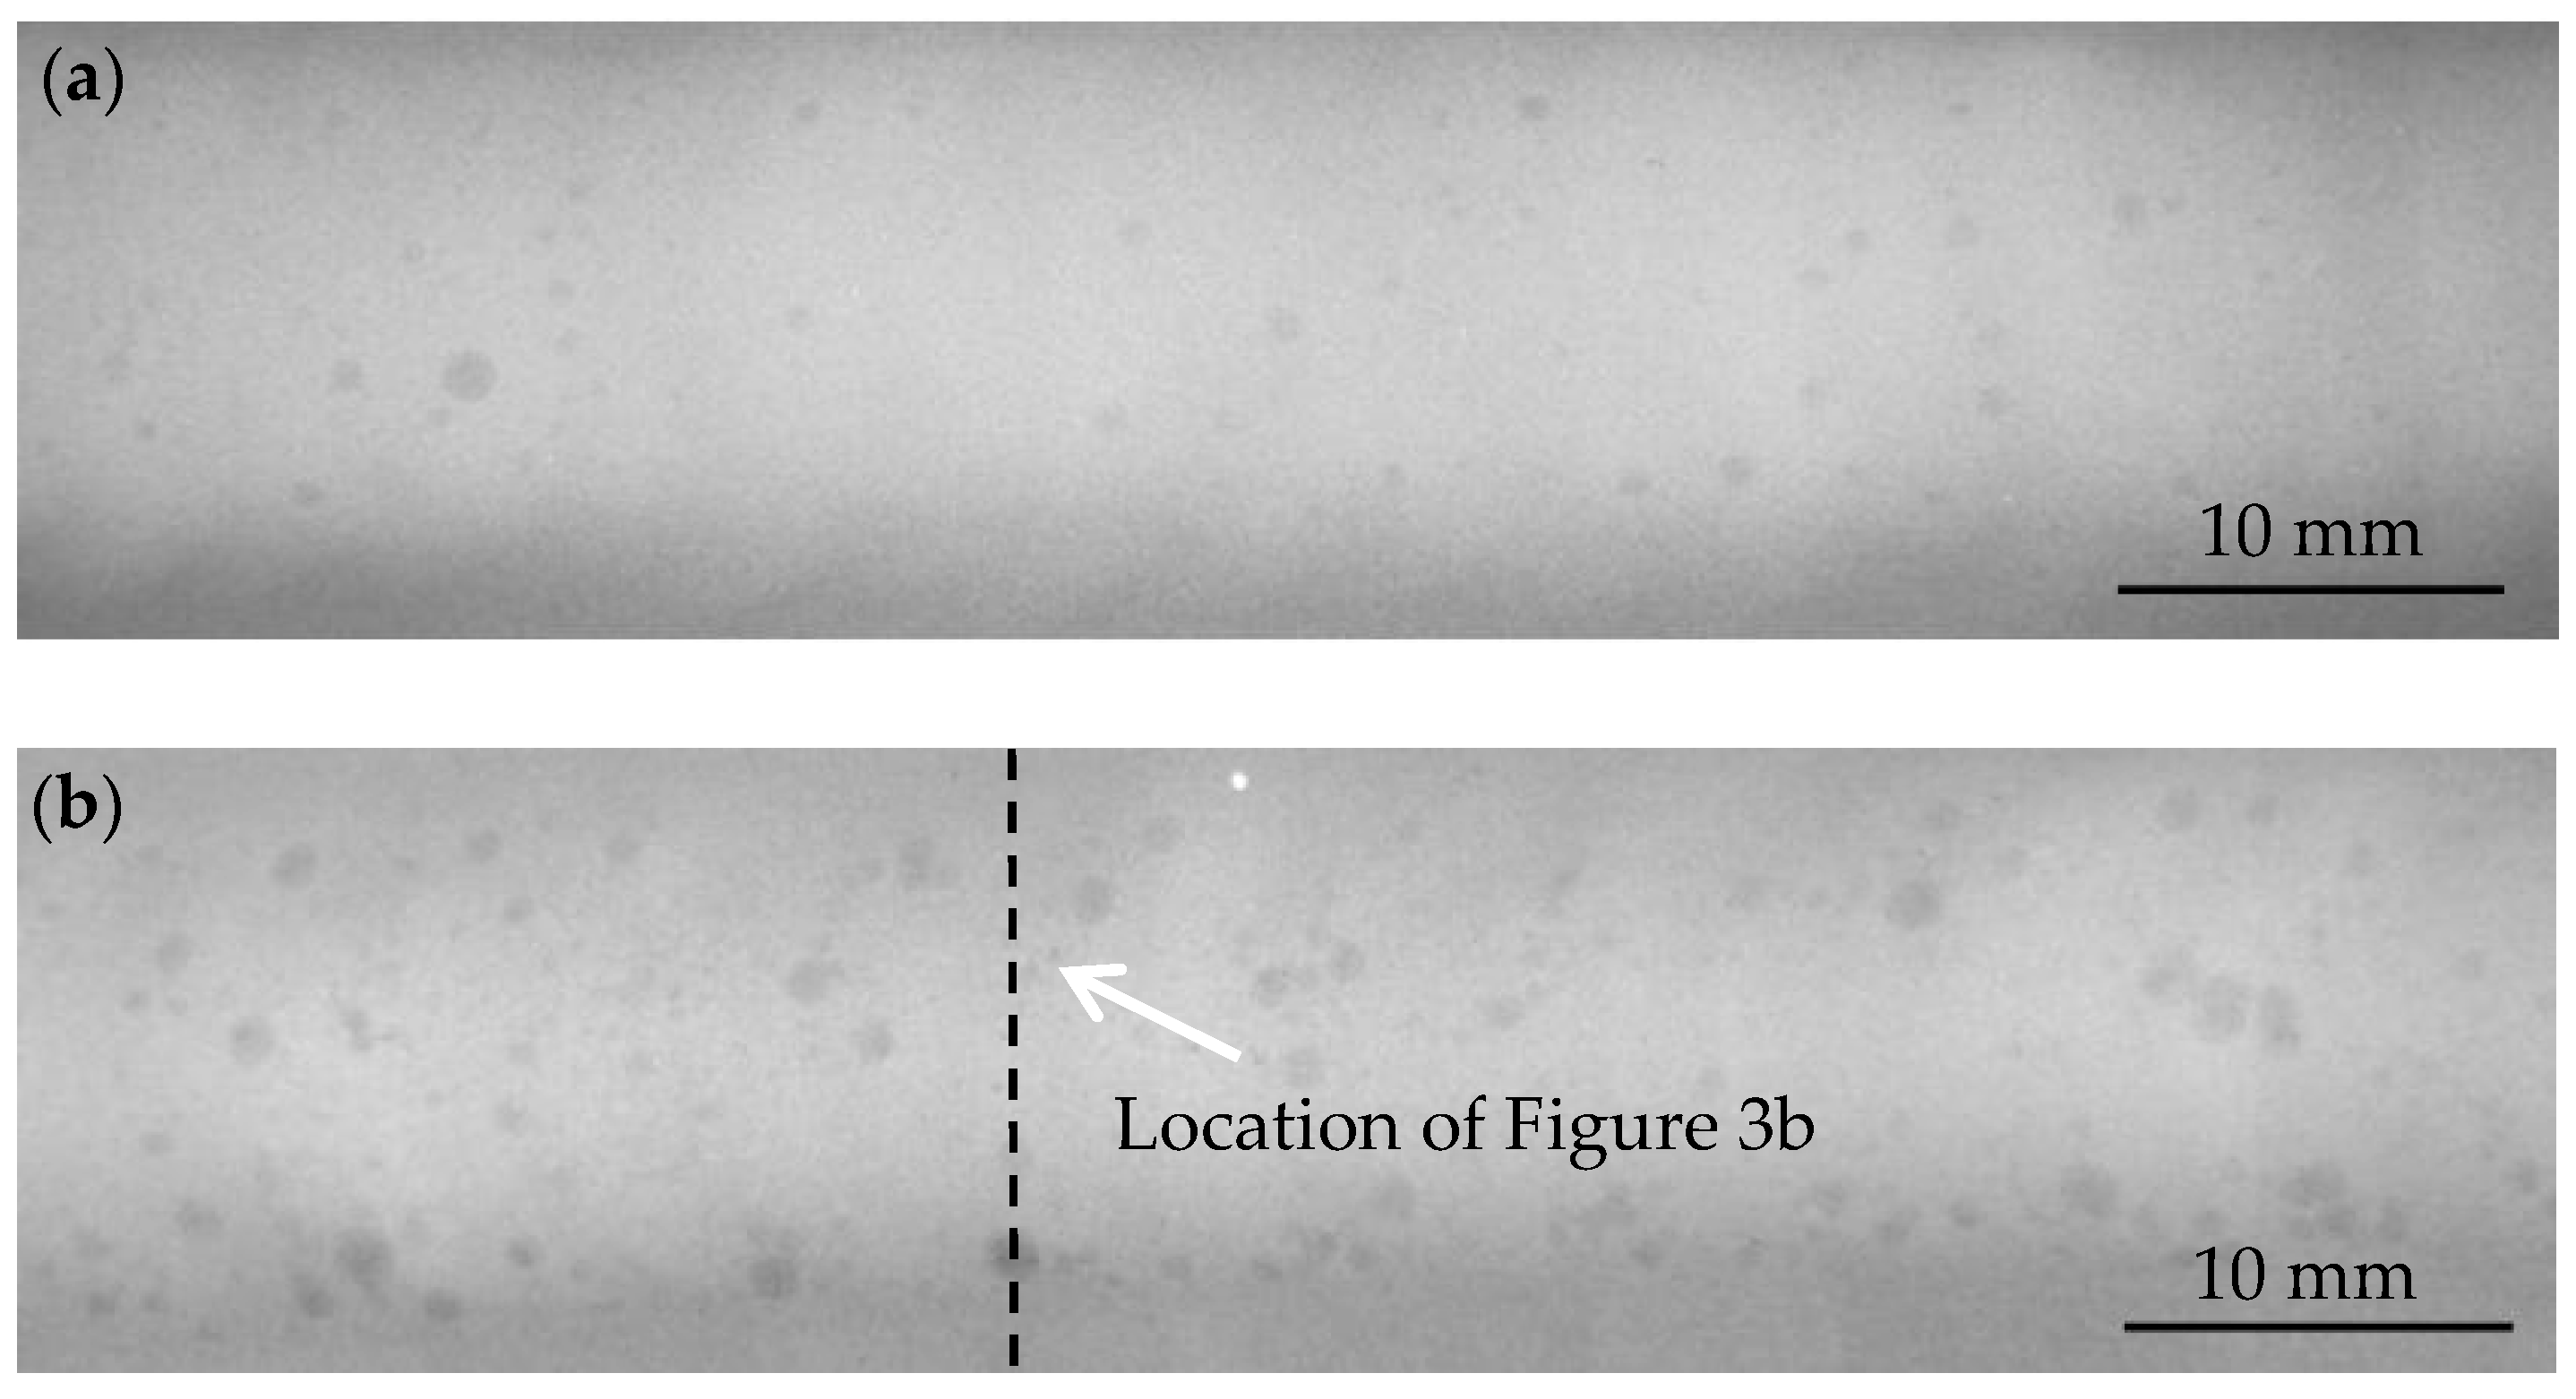
3.1. Results of Nondestructive Testing (NDT) and Calculation of Total Heat Input (TQ)
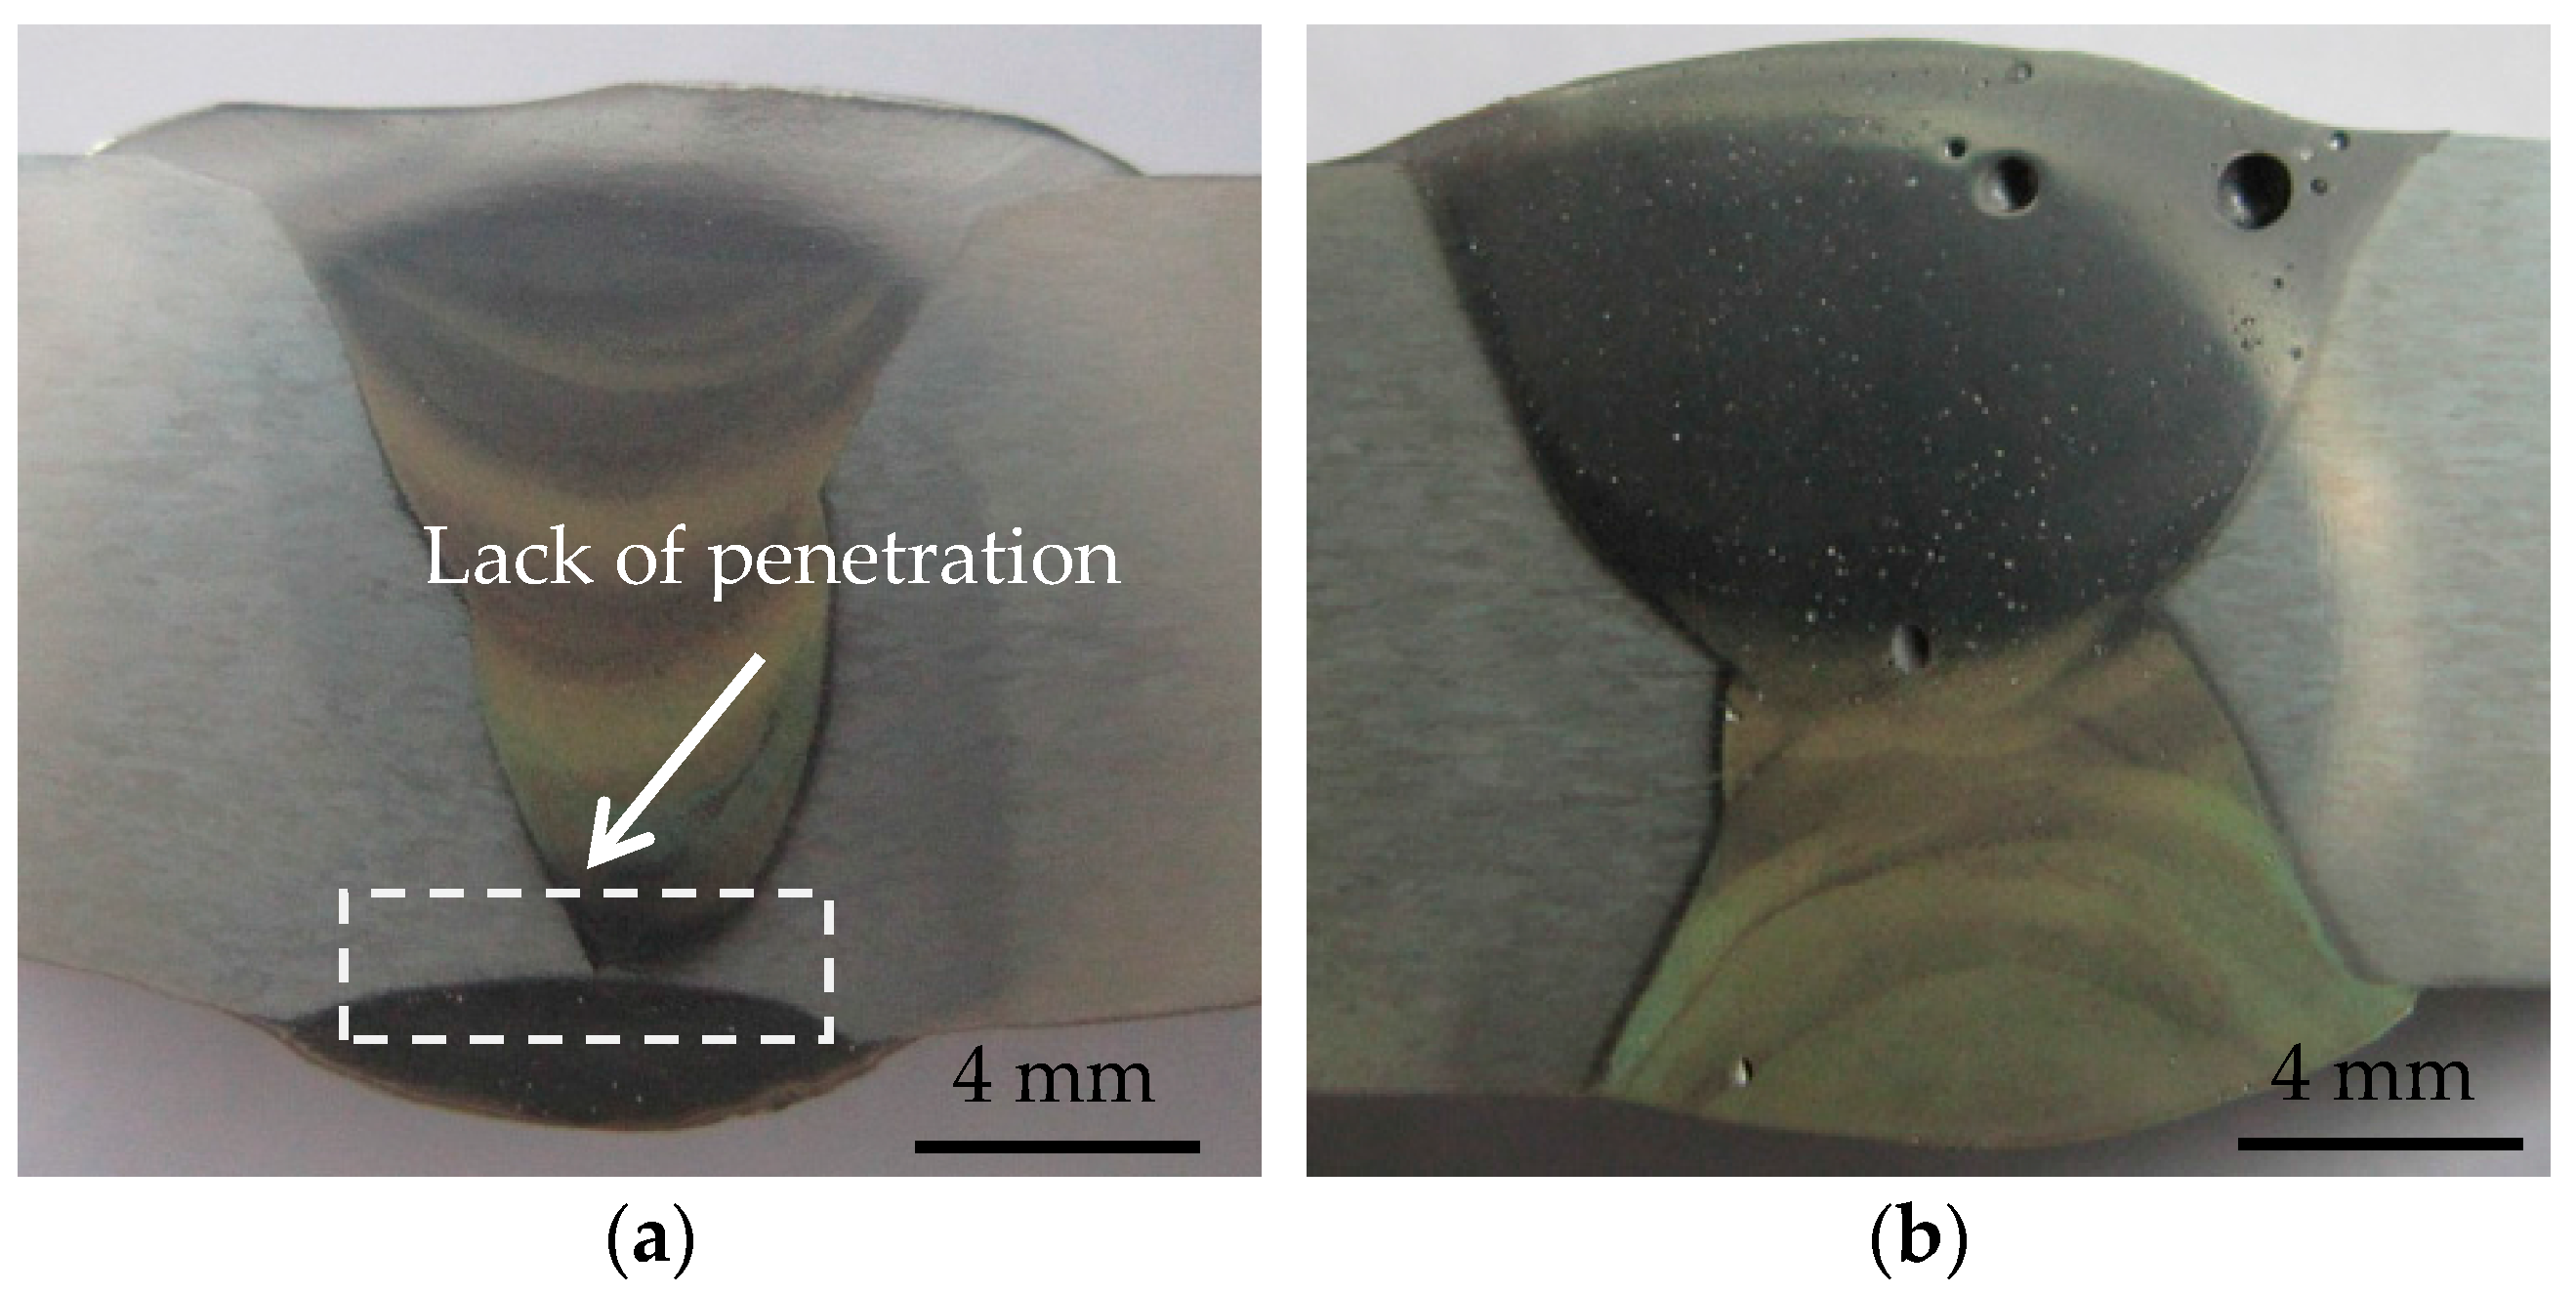
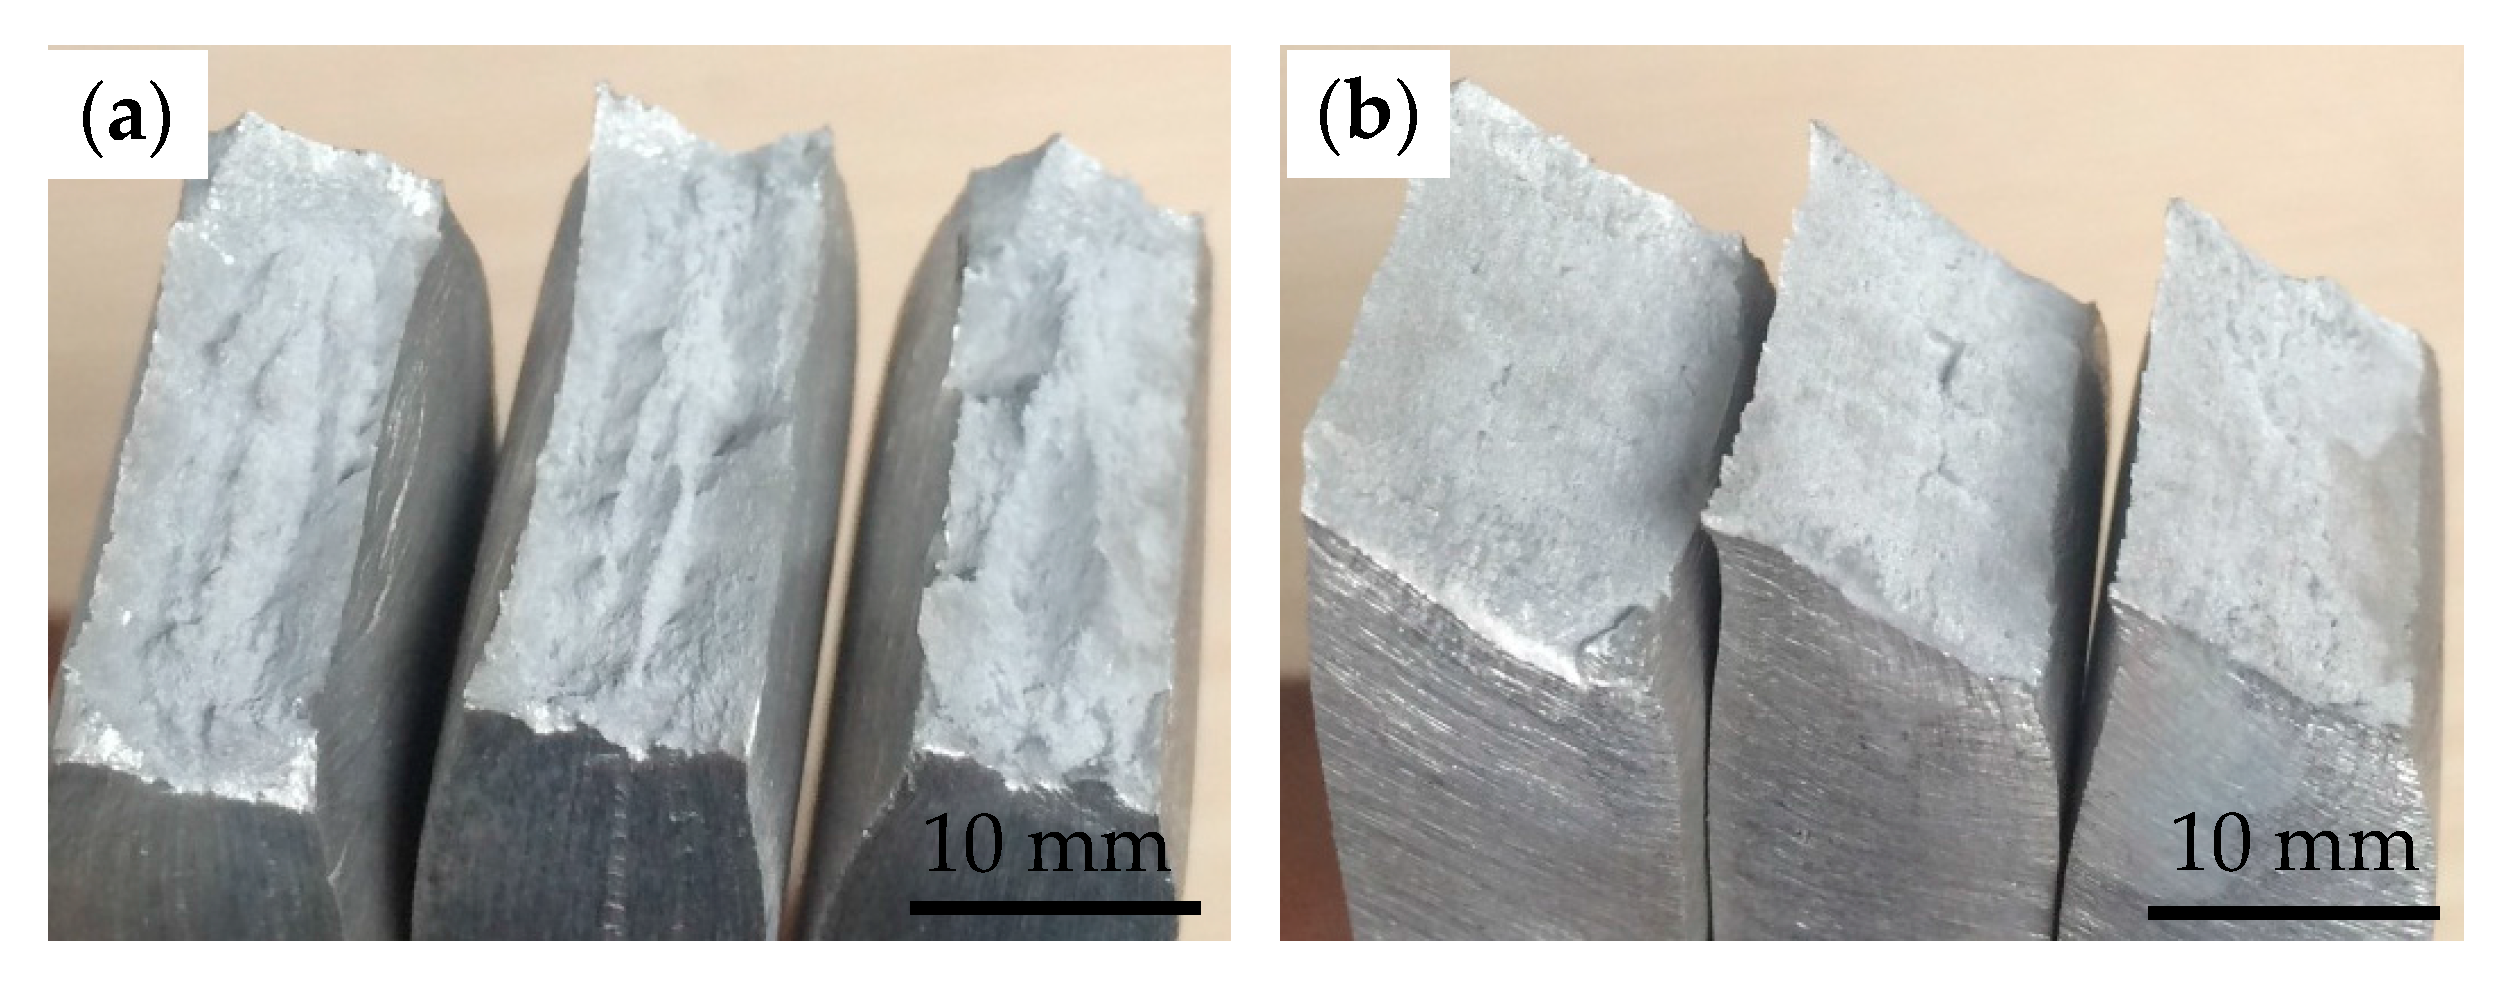
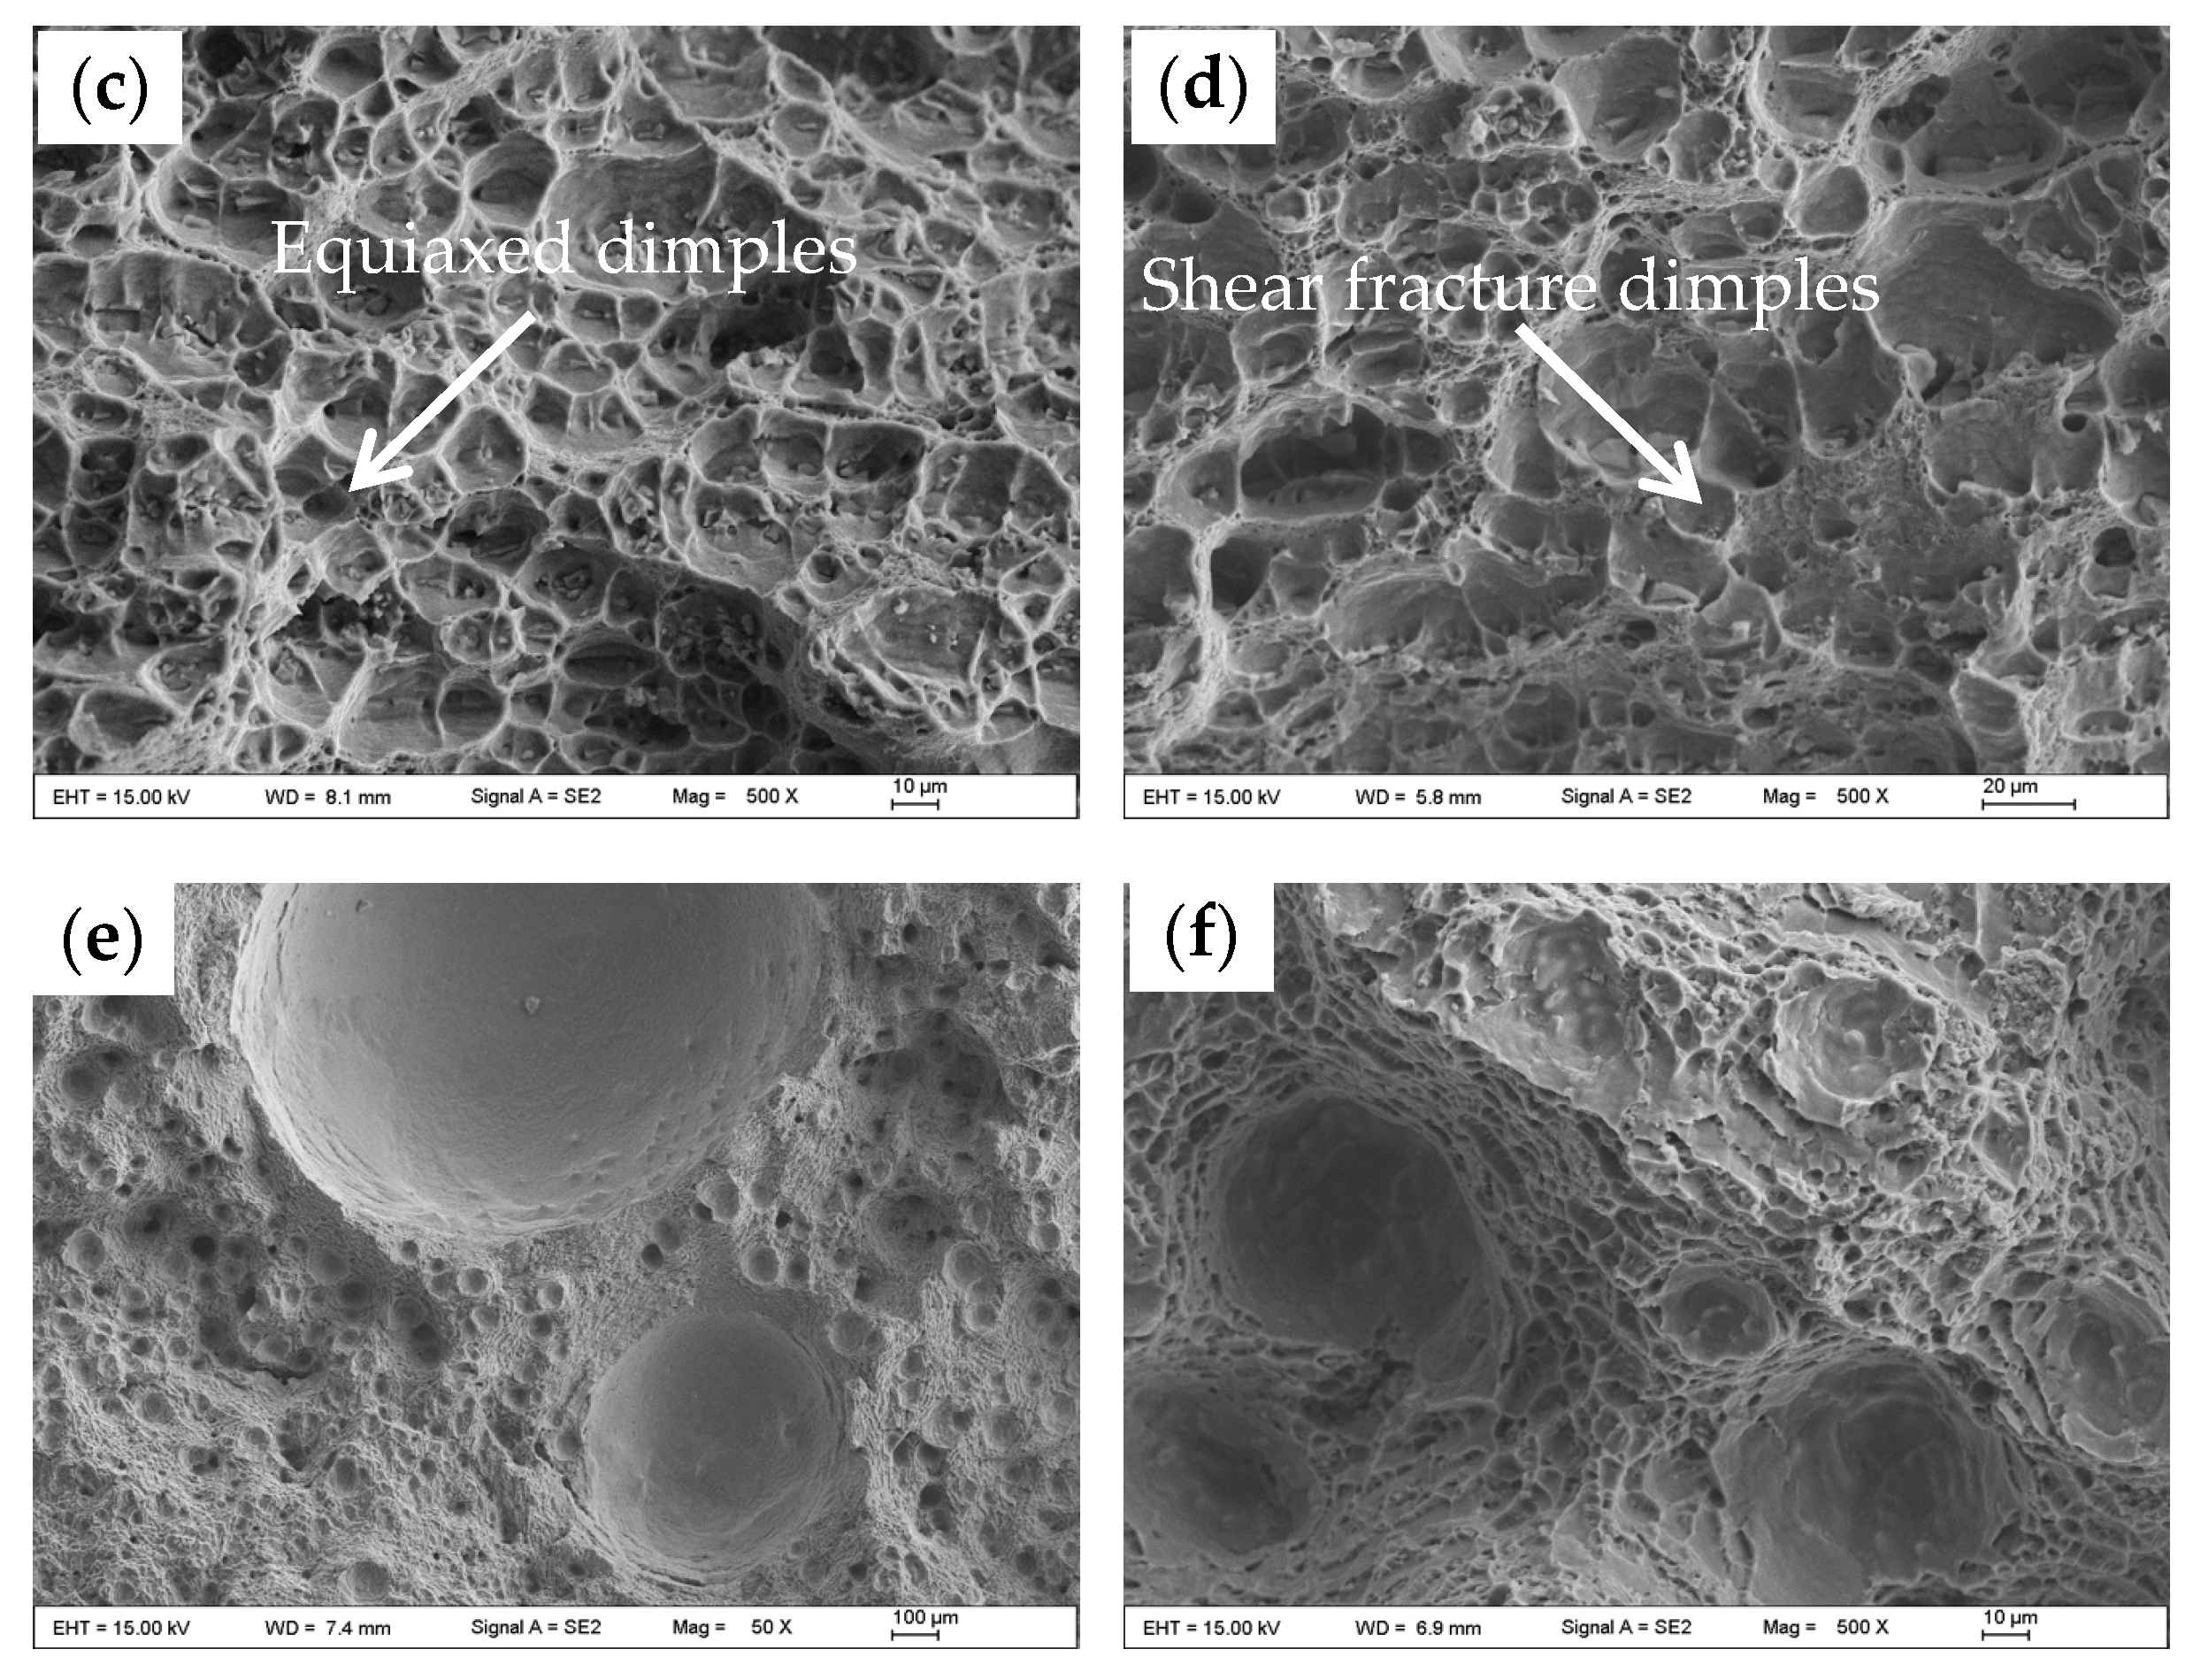
3.2. Effects of Heat Input on the Tensile Strength and Fracture Morphology of TIG (Tungsten Inert Gas) Welded Joint with Porosity Defects
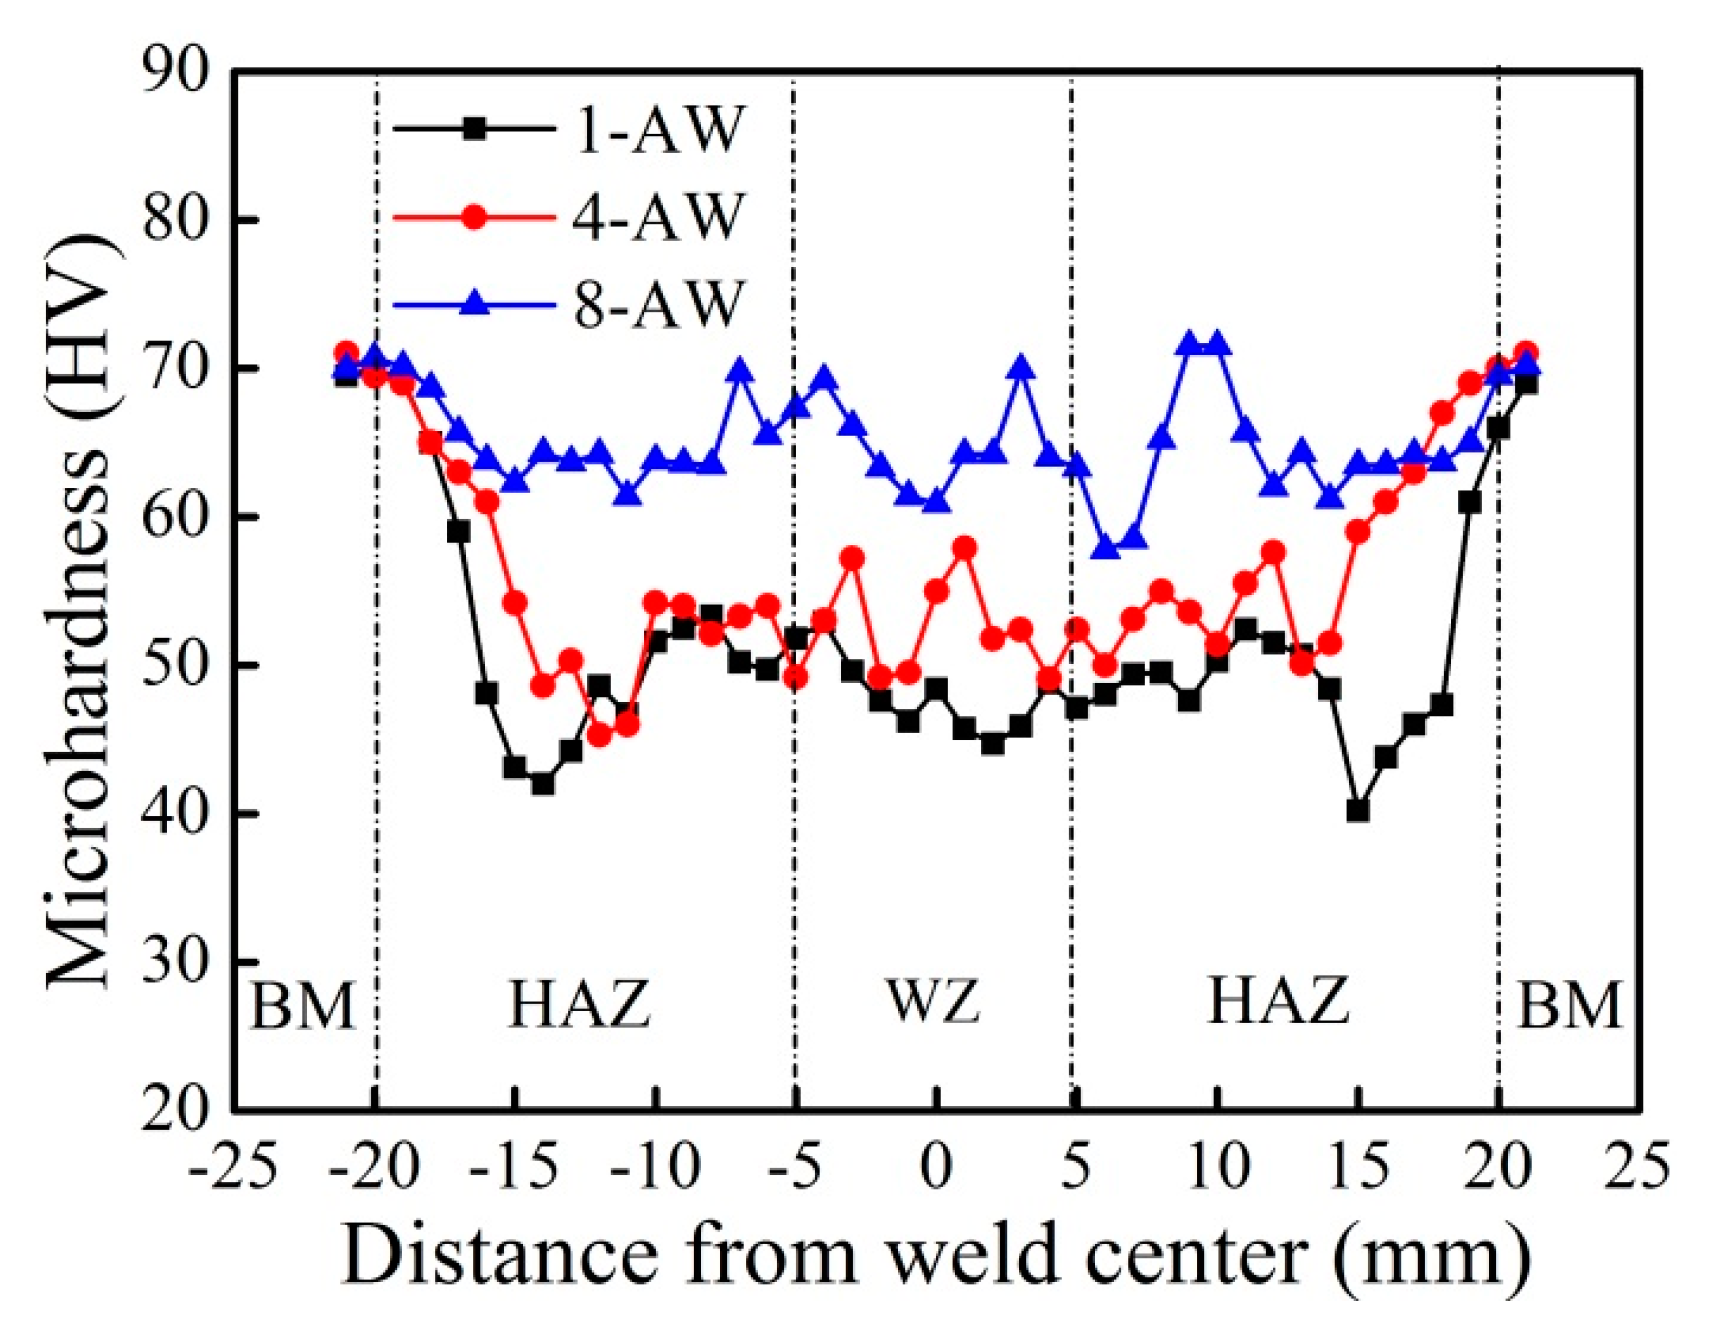
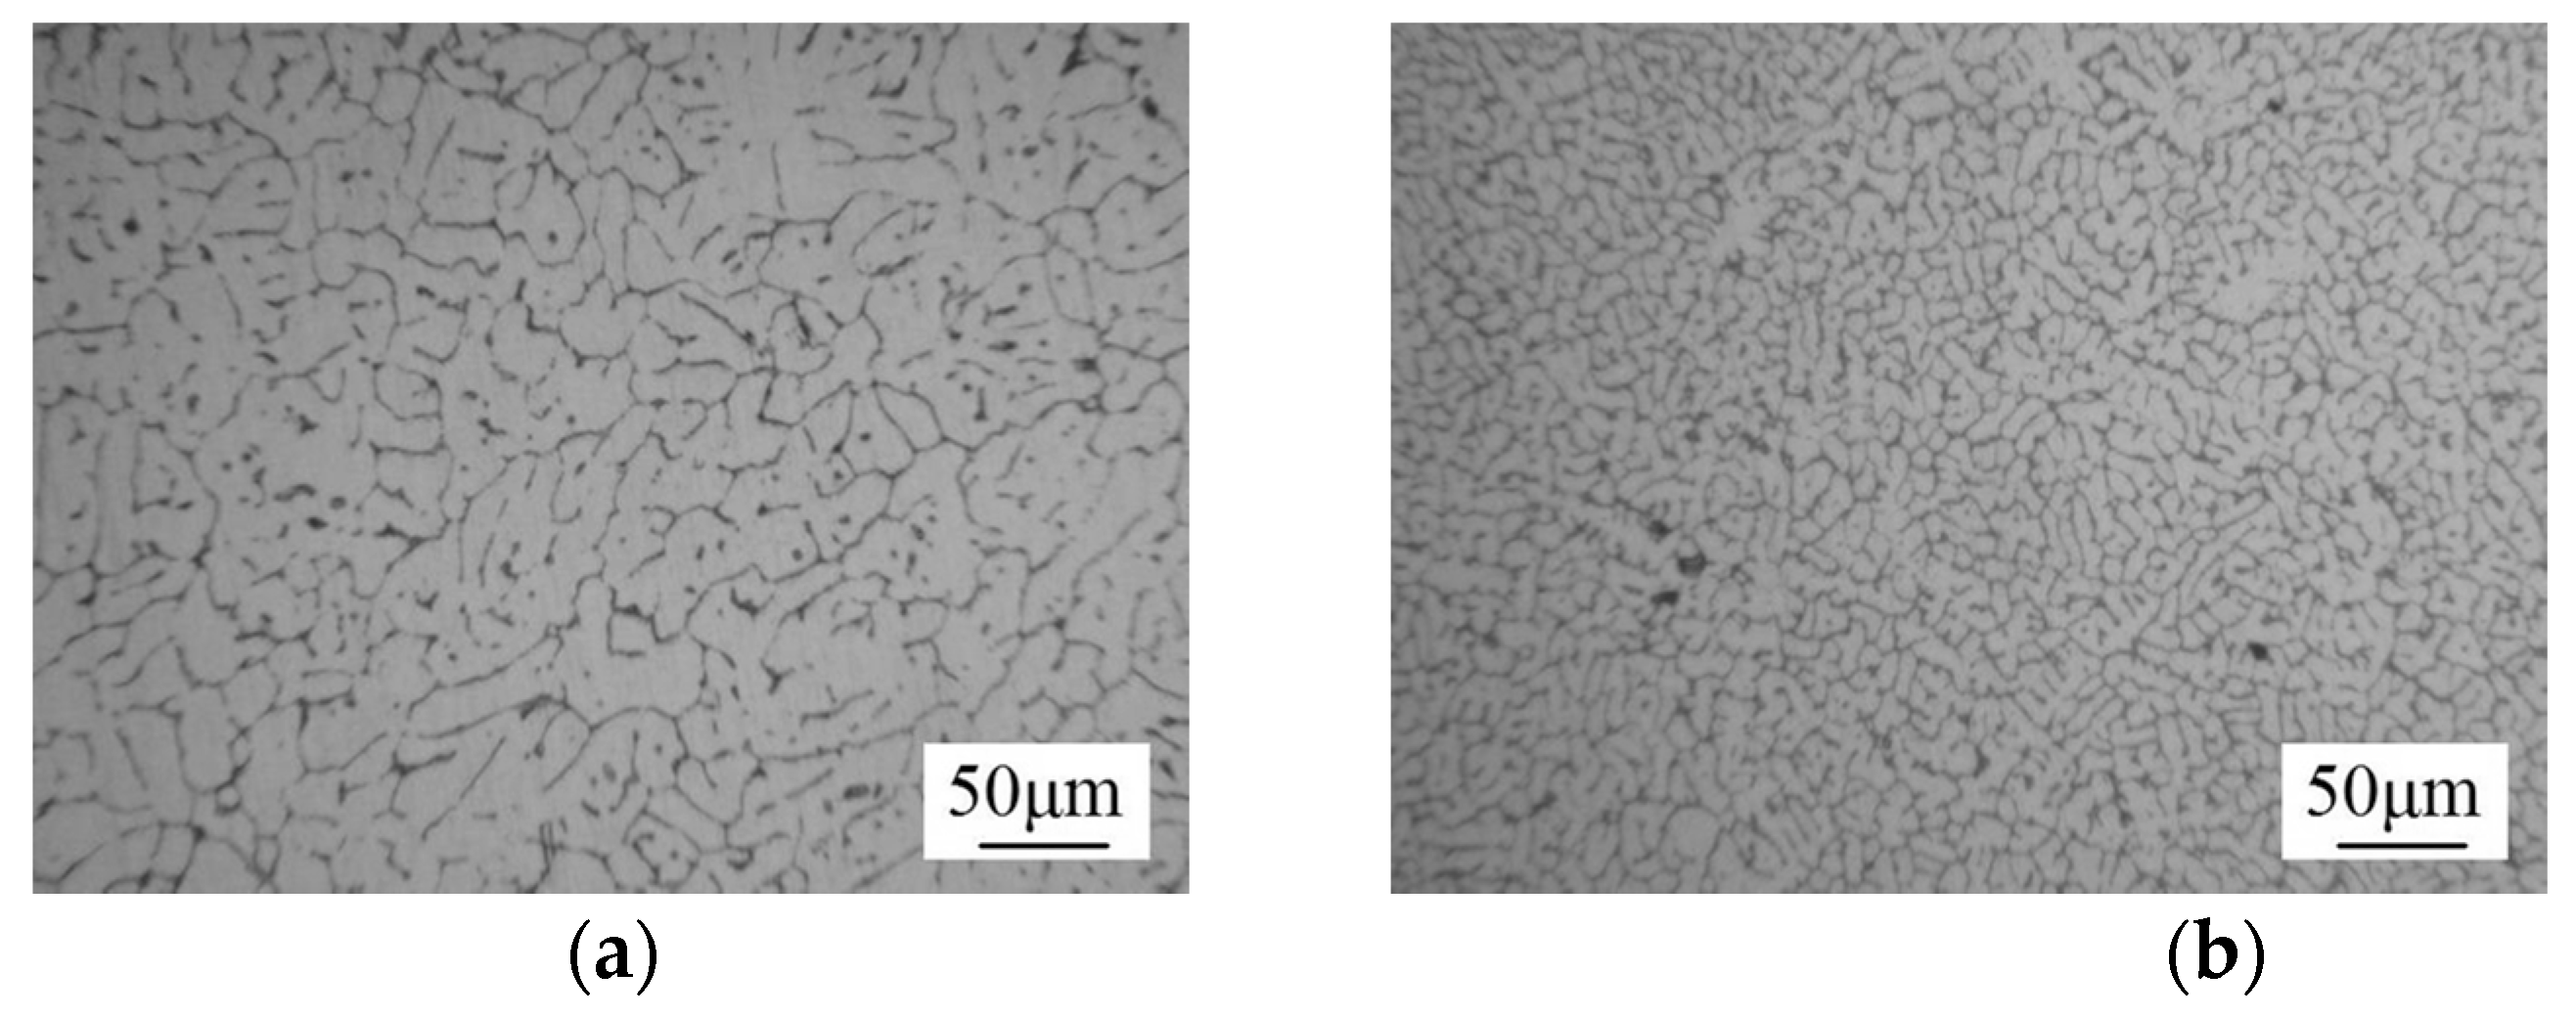
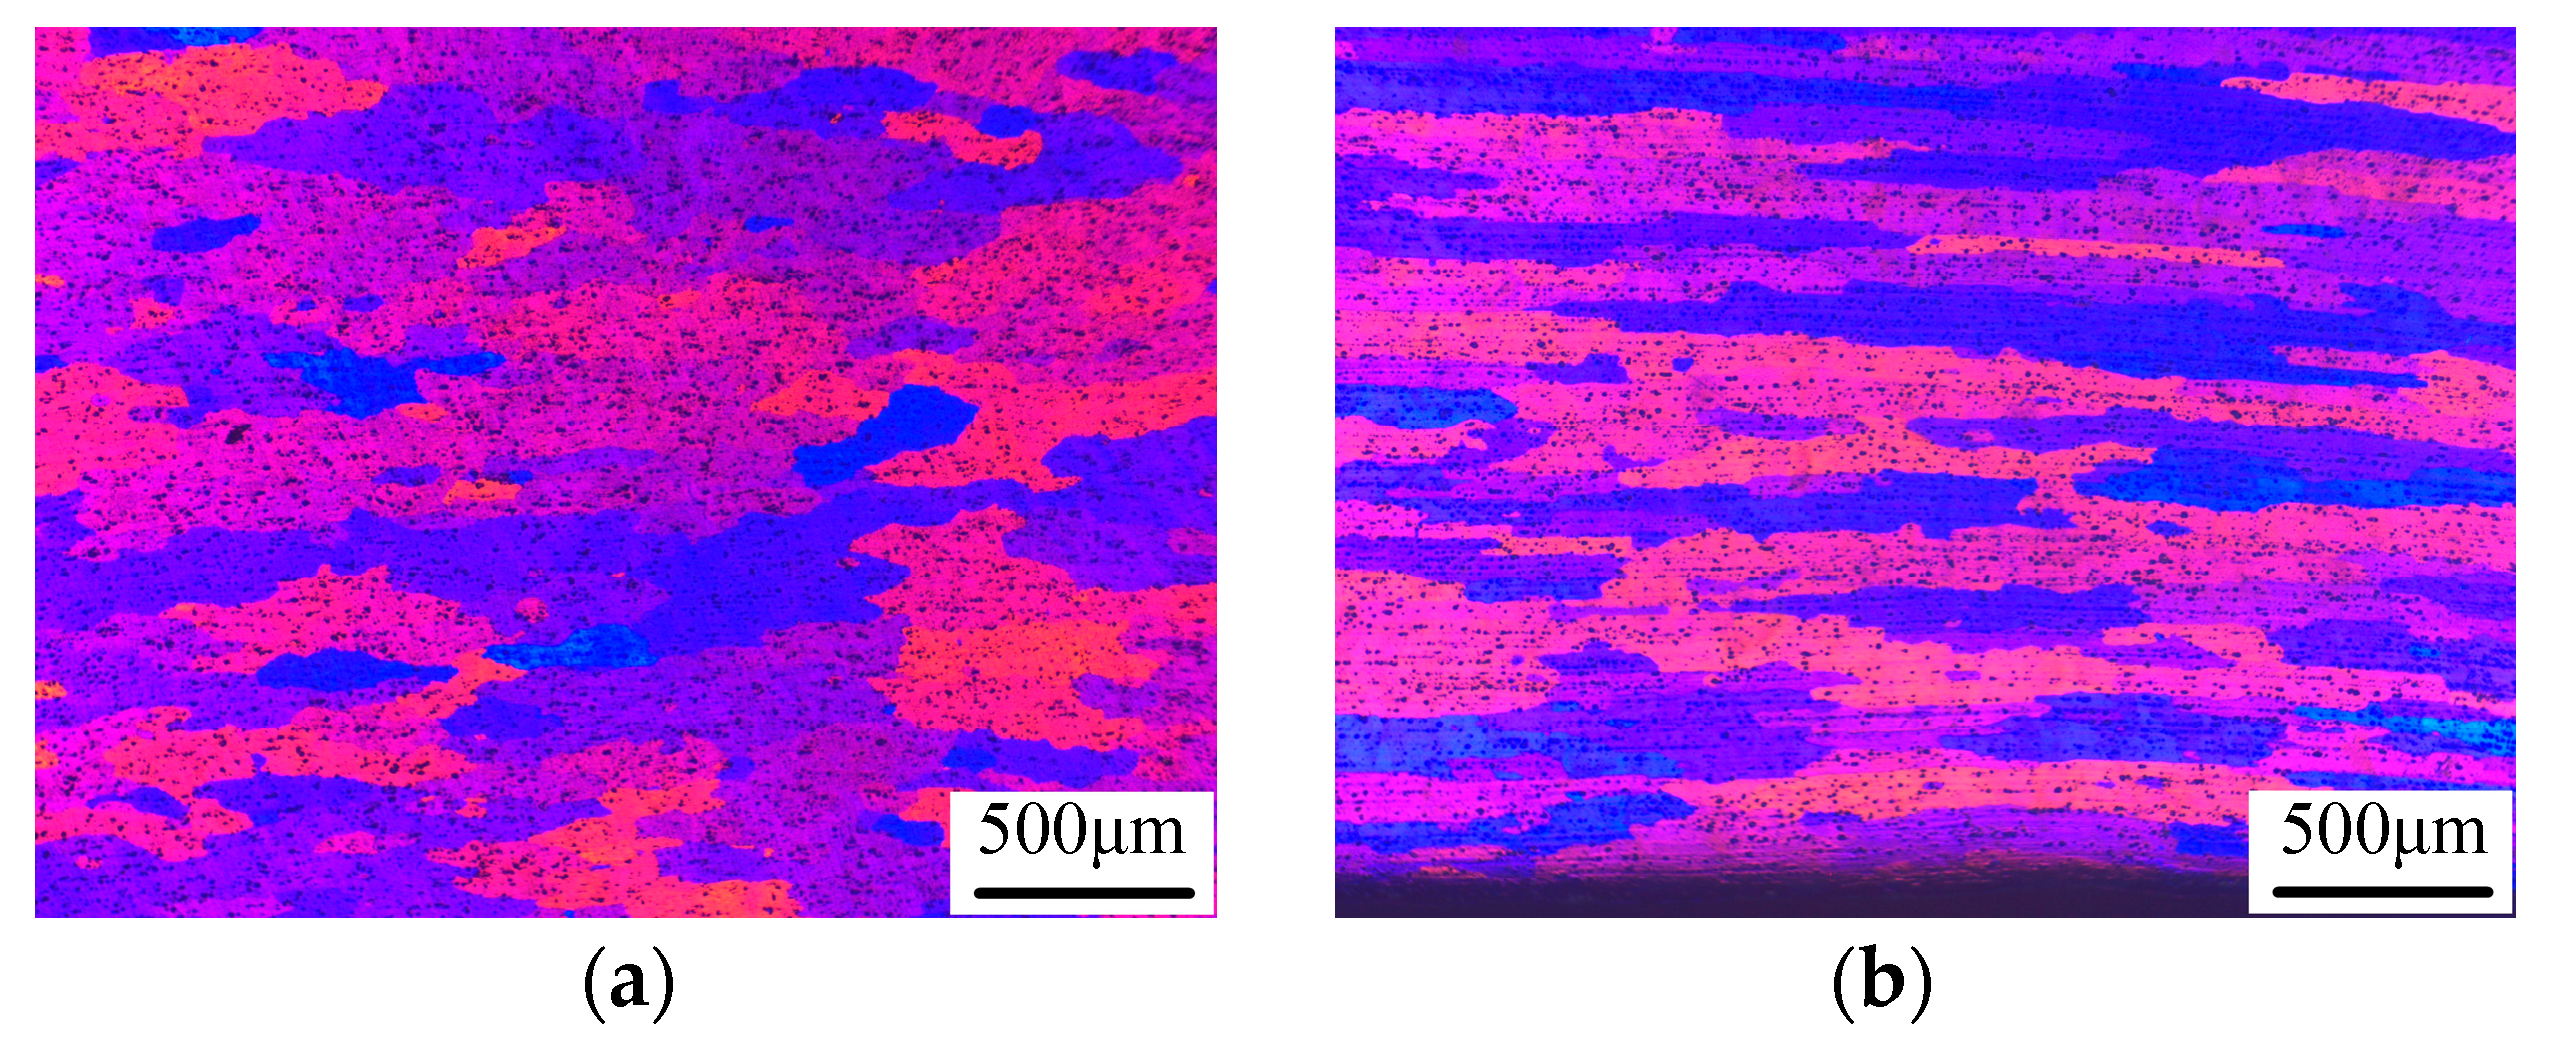
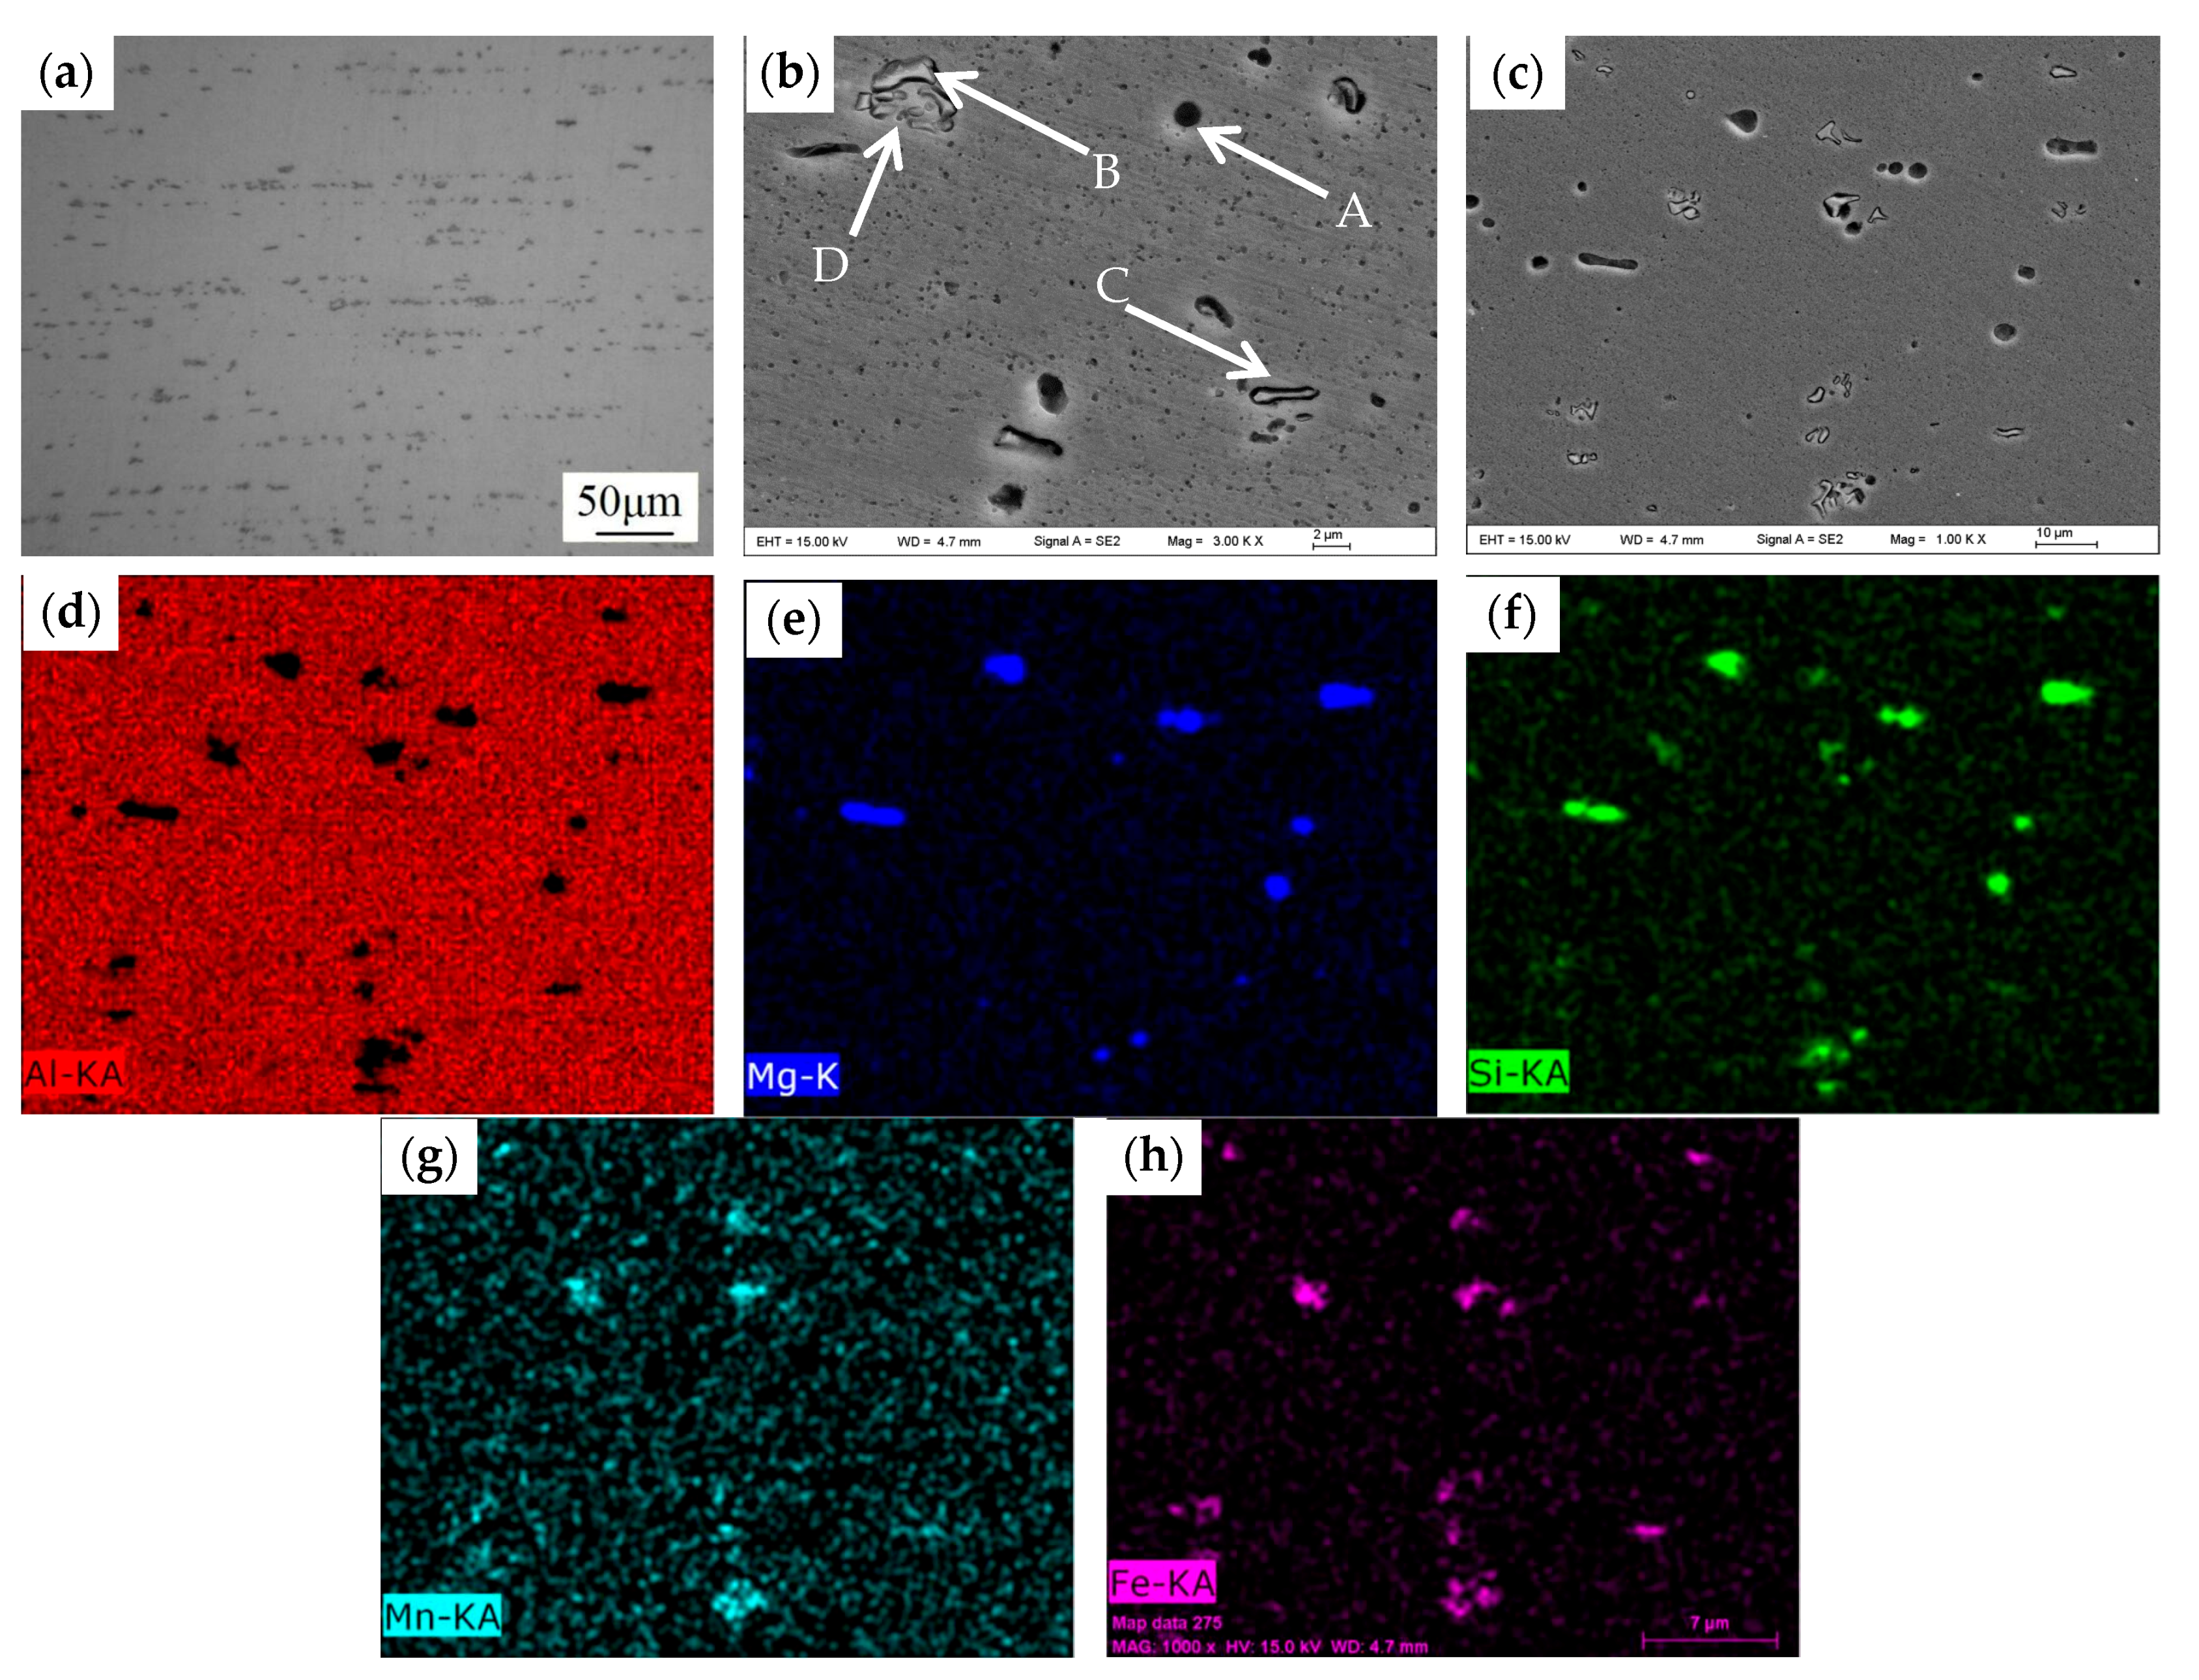
3.3. Effect of Heat Input on the Microhardness and Microstructure of TIG Welded Joints
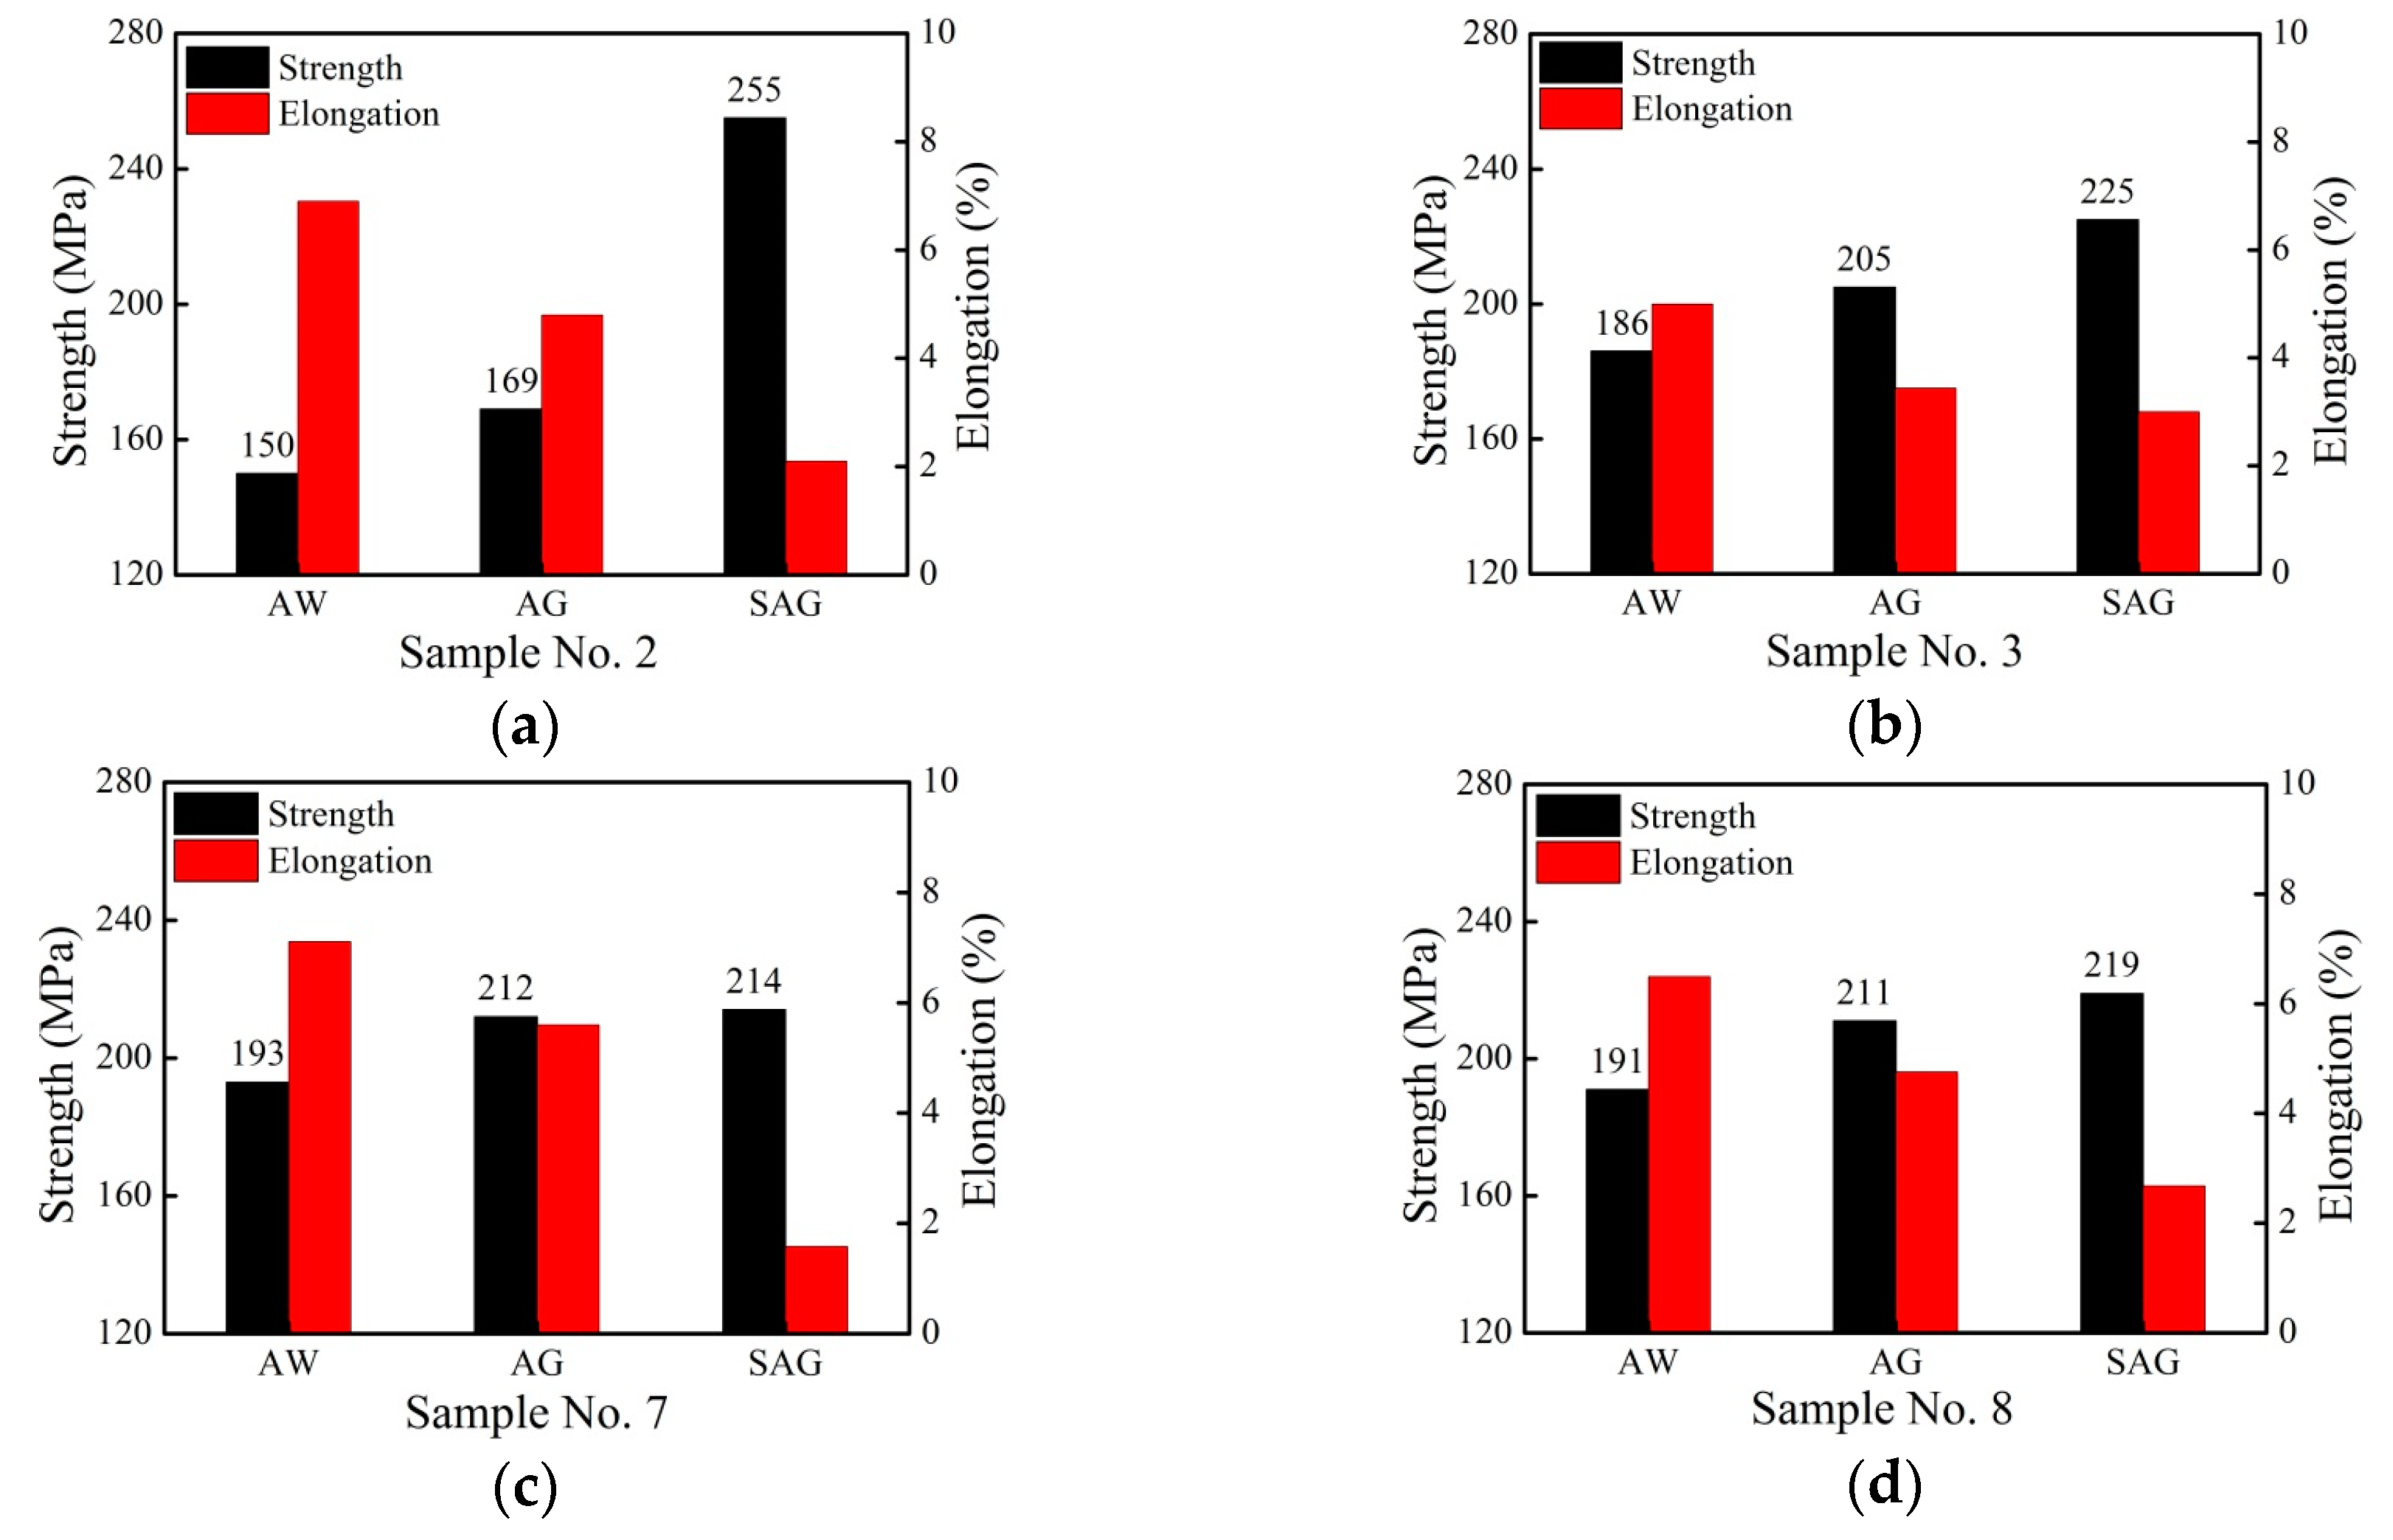
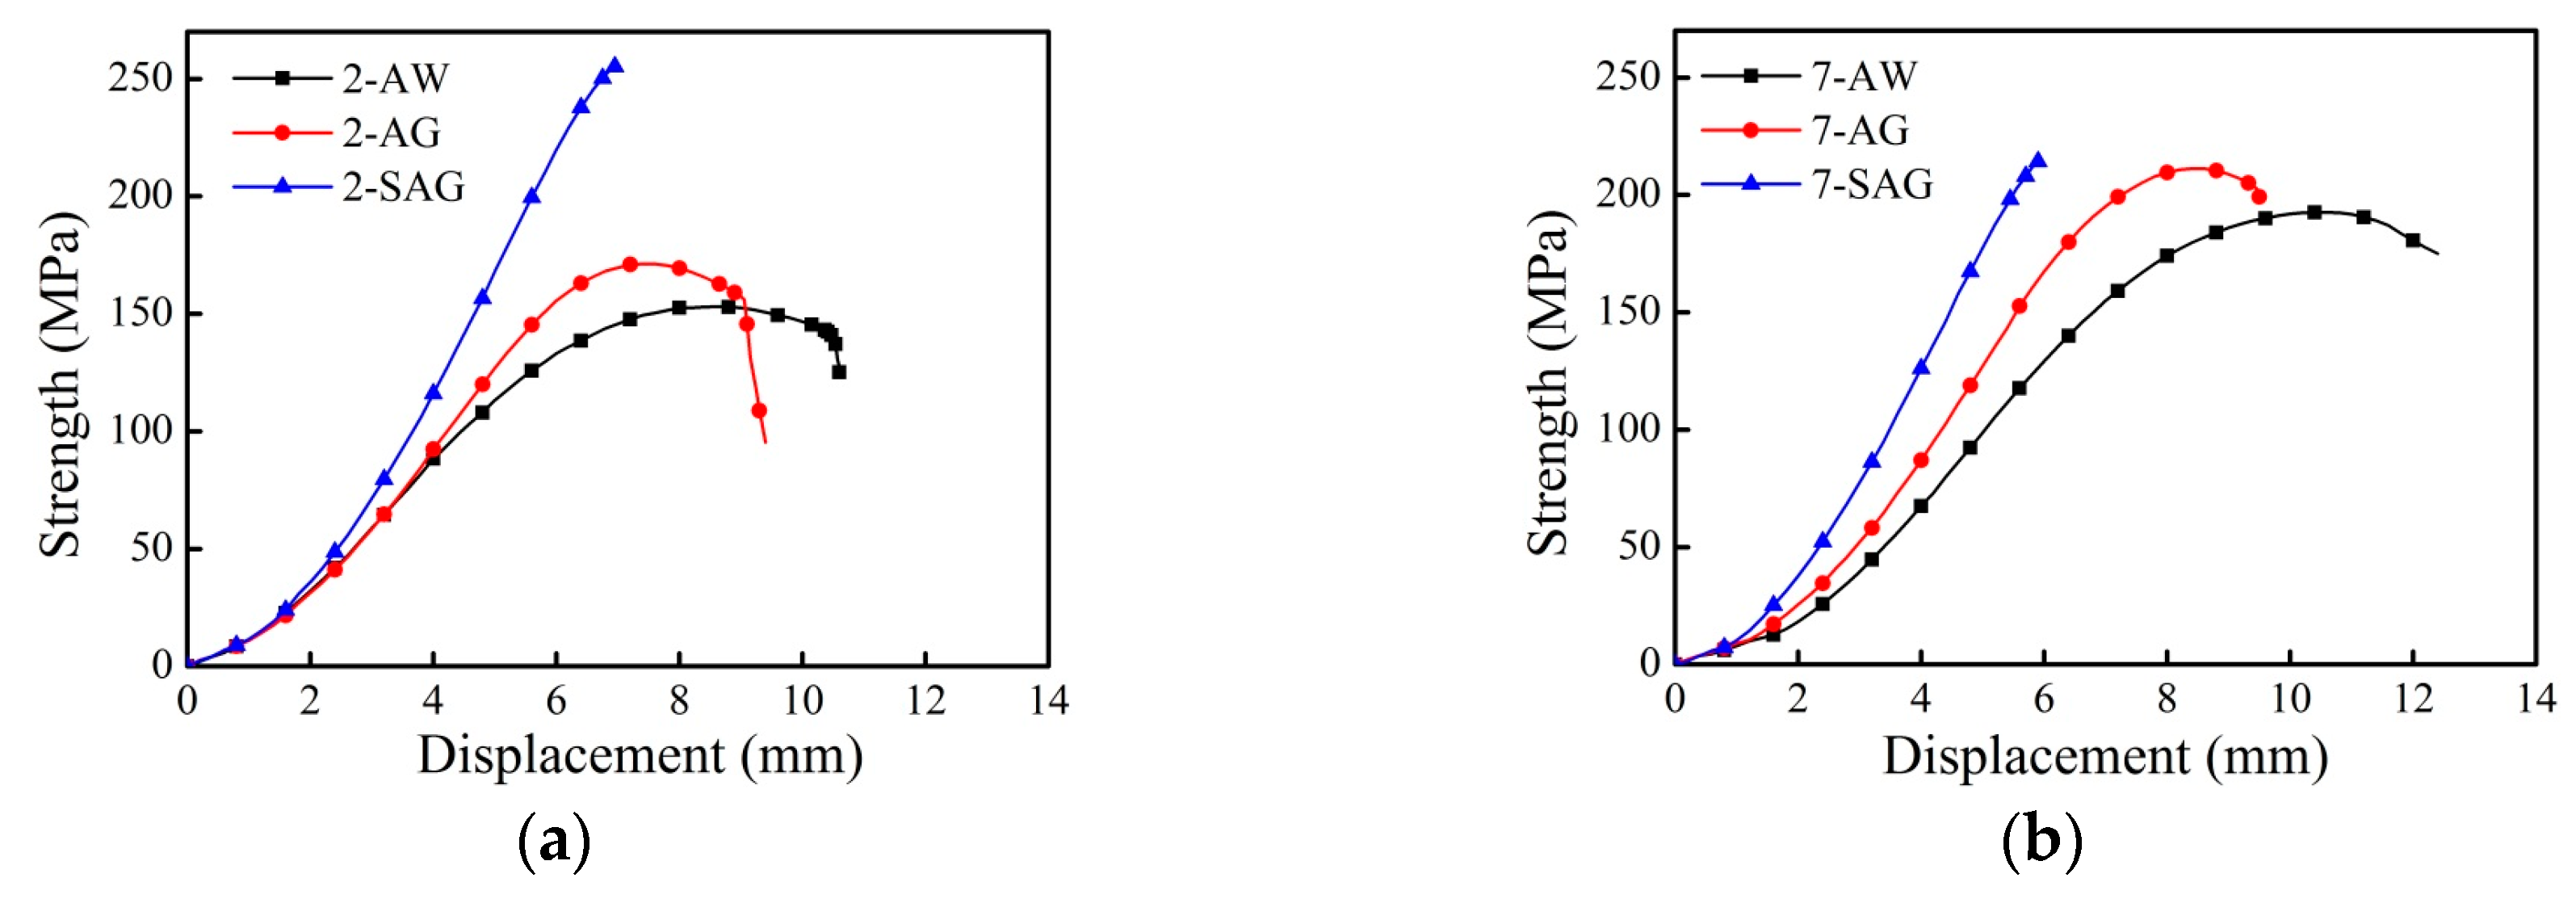
3.4. Effect of PWHT on the Tensile Strength and Fracture Morphology of the TIG Welded Joints with Porosity Defects
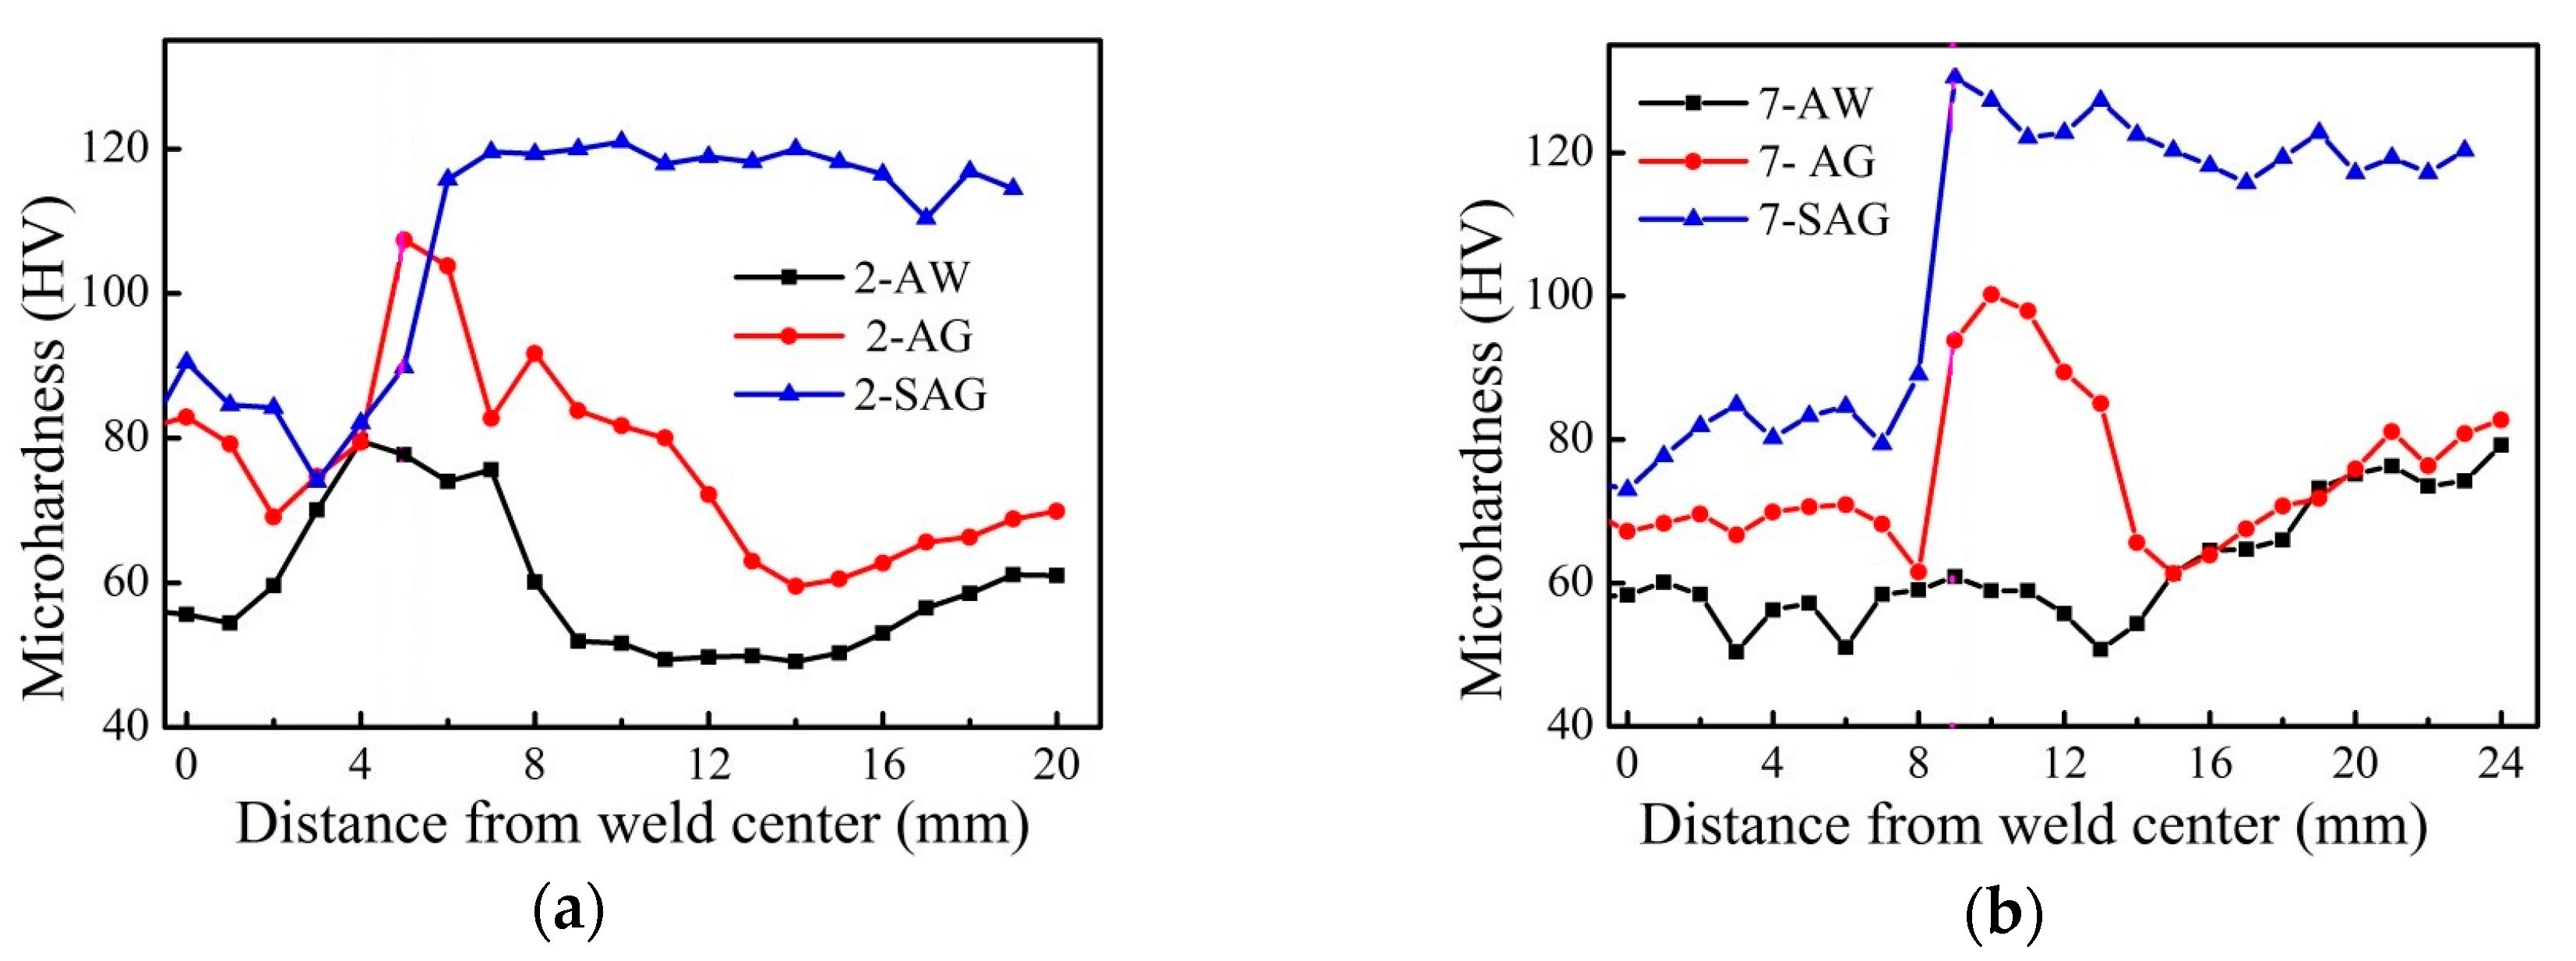
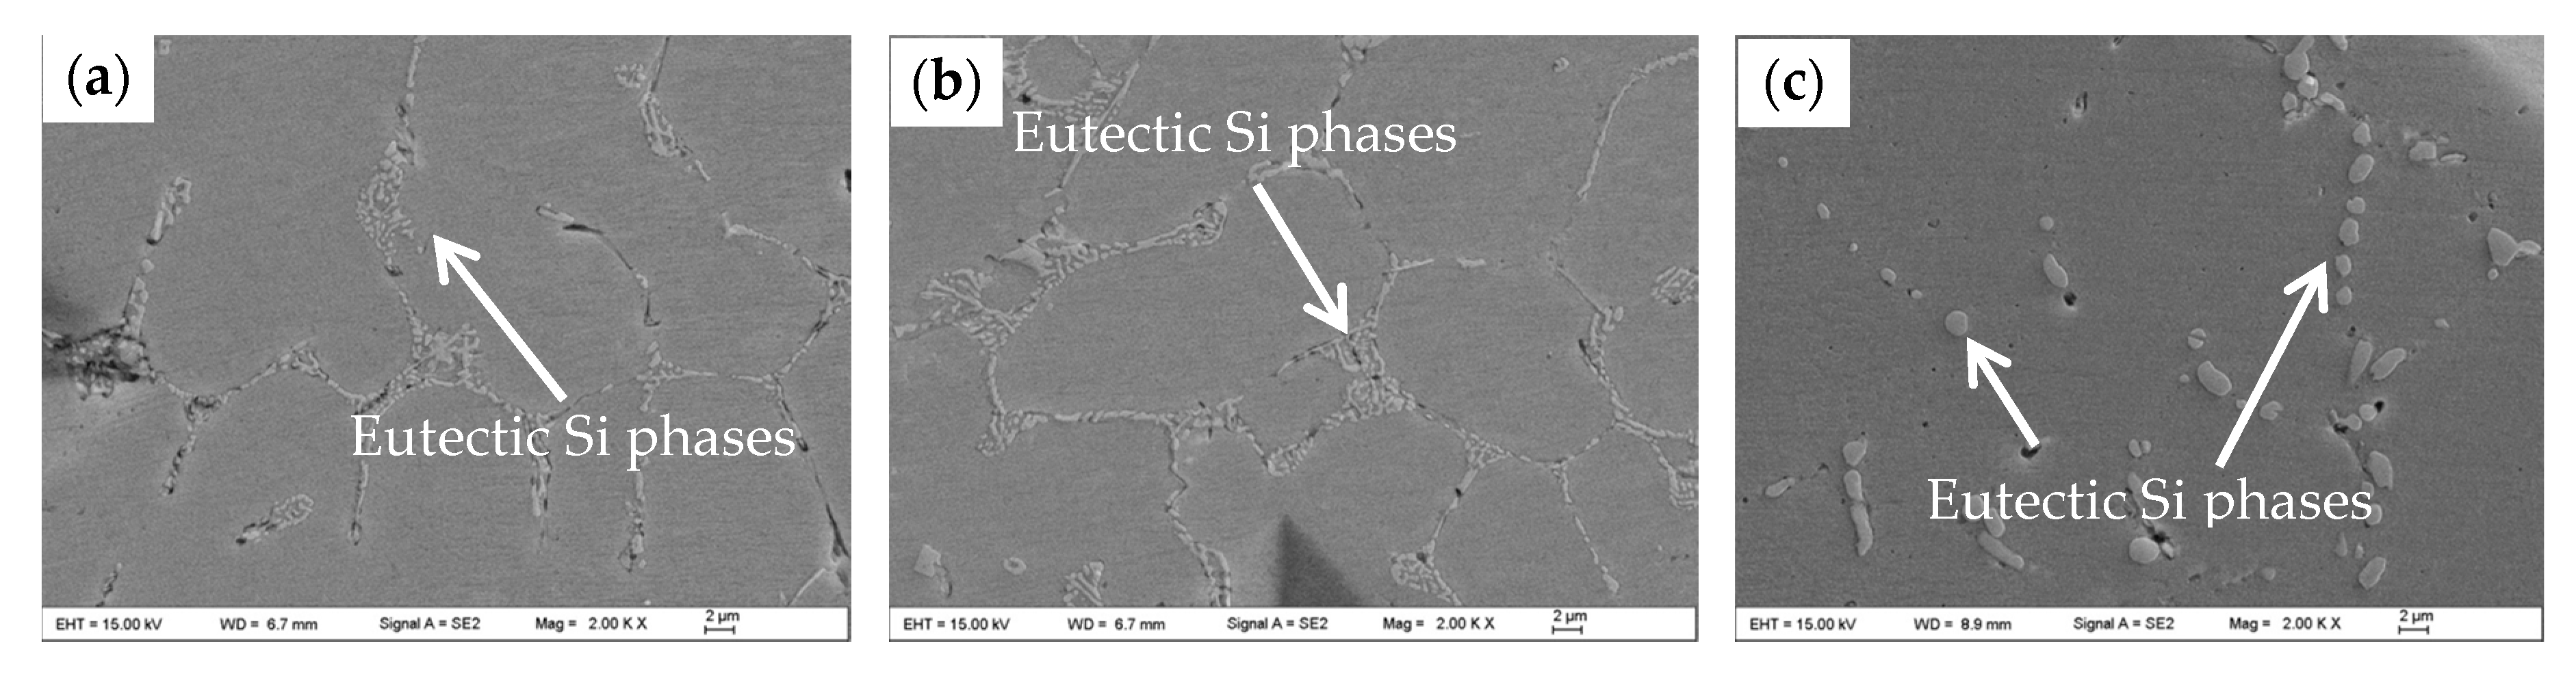
3.5. Effect of PWHT on the Microhardness and Microstructure of TIG Welded Joints with Porosity Defects
4. Conclusions
- (1)
- For a TIG welded joint of 6082-T6 with porosities in the WZ and overaging in the HAZ at the same time, the tensile fracture location was uncertain. Fracture was more likely to occur in HAZ (high heat input), and possibly occurred in WZ (low heat input; many large porosities or high weld percent porosity).
- (2)
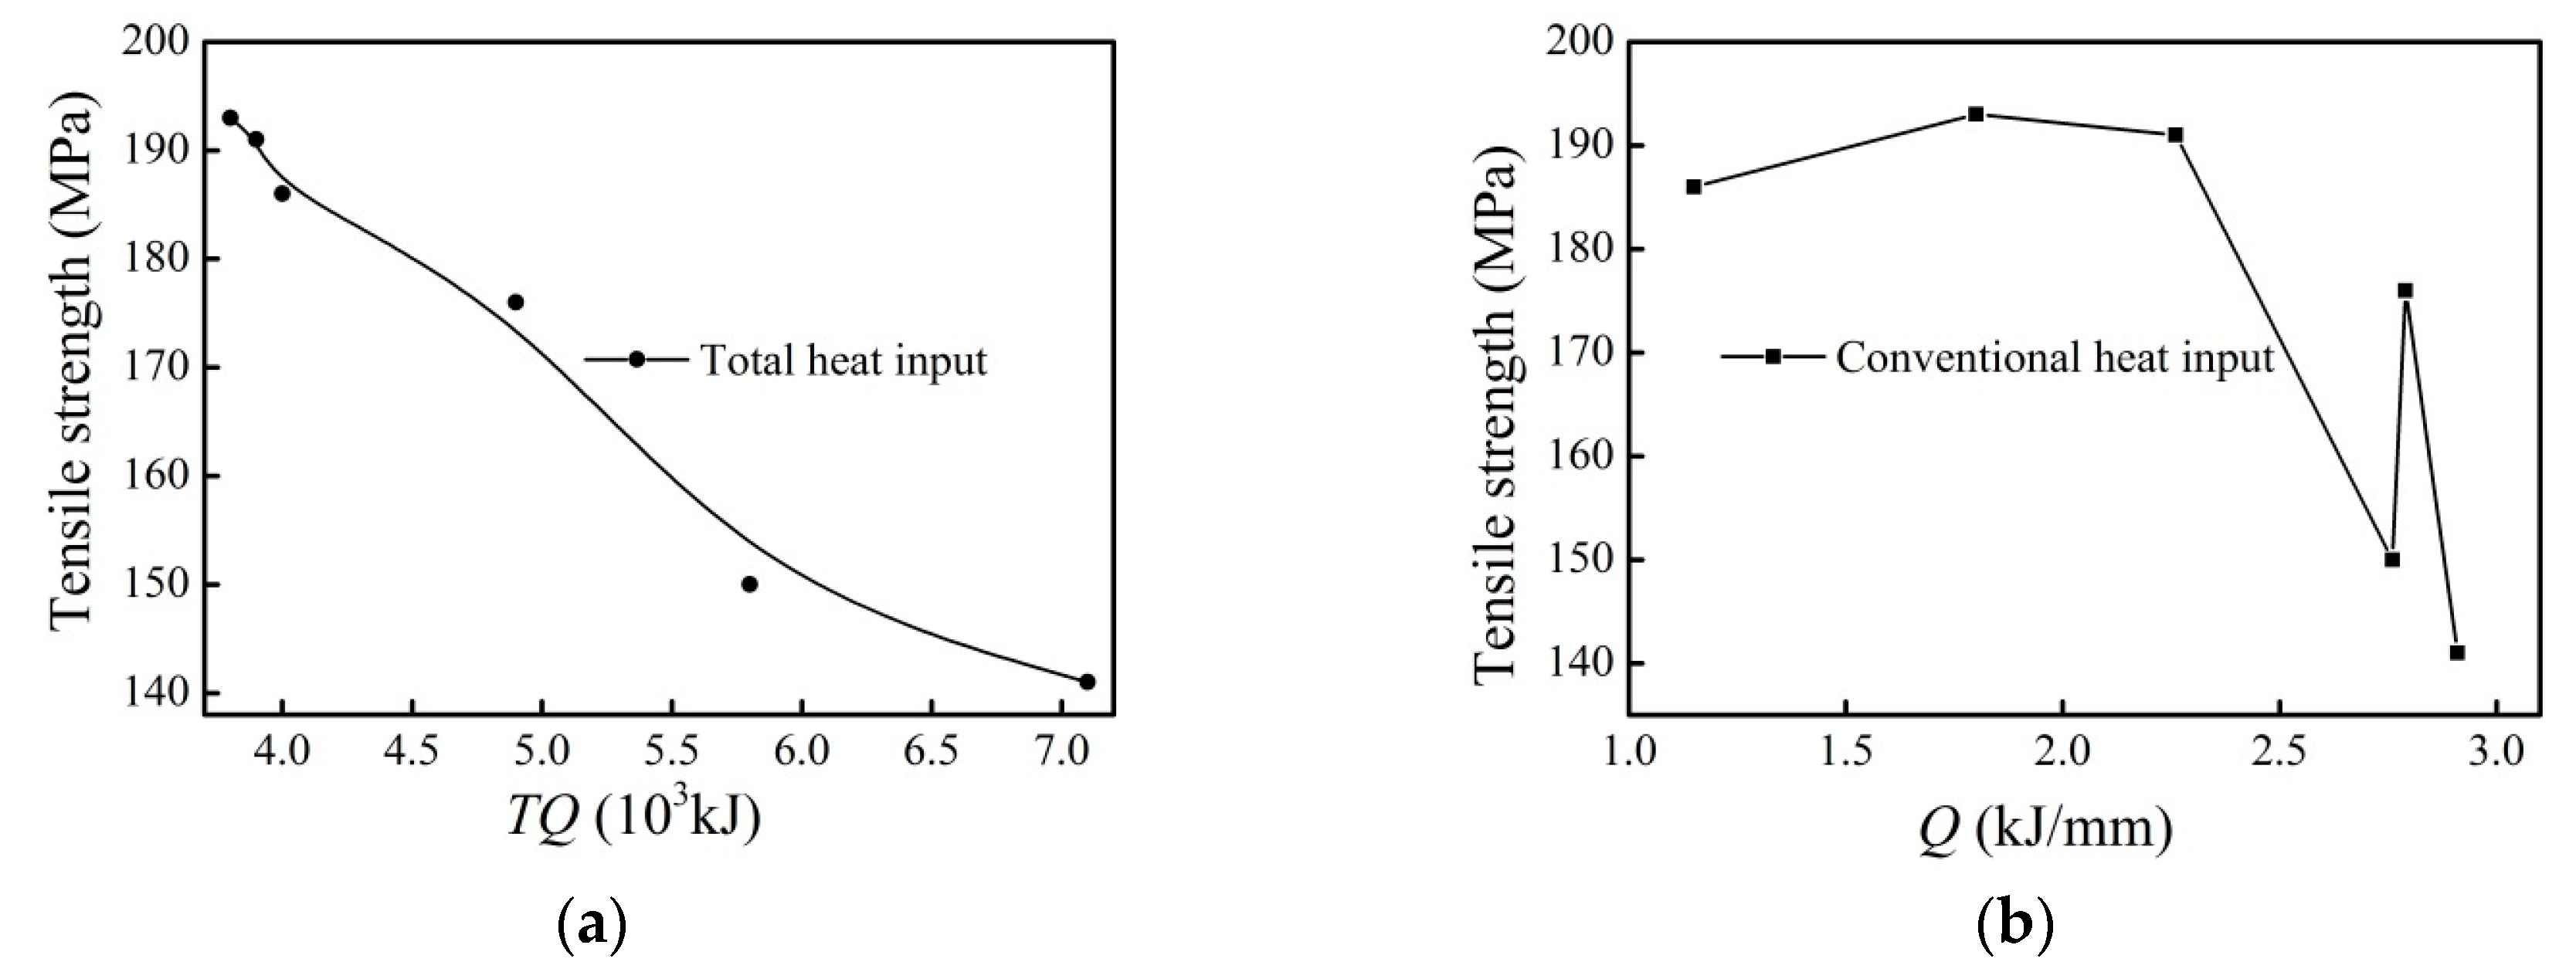
- When the fracture occurred in HAZ, the total heat input TQ had a linear relation with the tensile strength of the as-welded joint. High heat input during welding can induce the overgrowth of Mg2Si precipitates in HAZ and the coarsening of α-Al grains in WZ, resulting in a decrease in the microhardness of the corresponding areas.
- (3)
- The tensile strength of the welded joint increased by approximately 9–13% after the artificial aging treatment as compared to that of the as-welded joint, and the fracture location was also located in HAZ. For the SAG-joint, the tensile strength was the same as the yield strength, and the fracture occurred suddenly at the rising phase of the tensile curve due to porosity defects throughout the weld metal.
- (4)
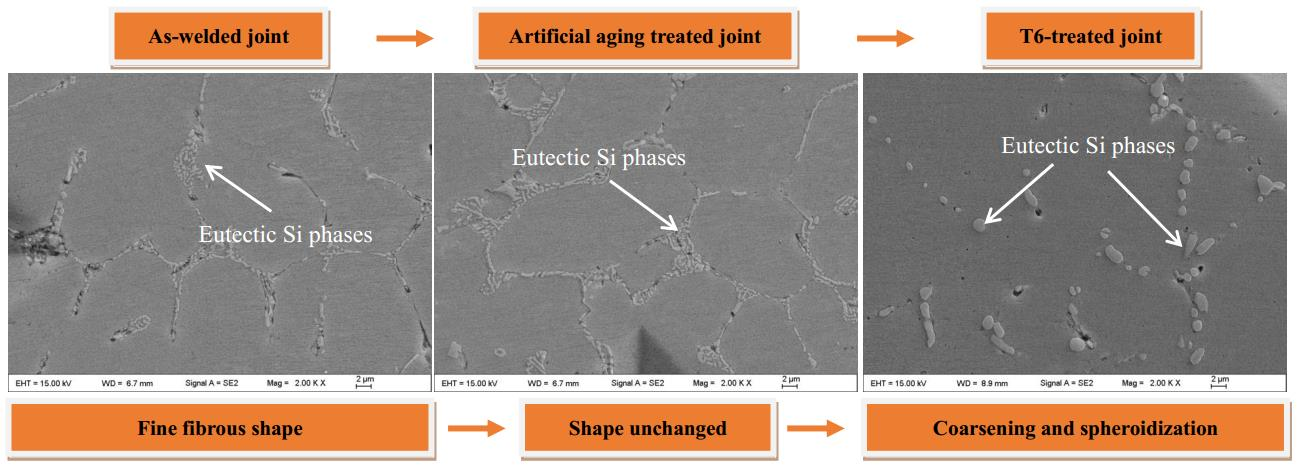
- No appreciable changes in the weld metal microstructure of the welded joint were noticed after the artificial aging treatment, while the eutectic Si particle of the weld metal coarsened and spheroidized after the SAG process, which resulted from the diffusion of Si to the surface of the original Si phases when soaking at high temperature.
Acknowledgments
Author Contributions
Conflicts of Interest
References
- Fahimpour, V.; Sadrnezhaad, S.K.; Karimzadeh, F. Corrosion behavior of aluminum 6061 alloy joined by friction stir welding and gas tungsten arc welding methods. Mater. Des. 2012, 39, 329–333. [Google Scholar] [CrossRef]
- Imam, M.; Racherla, V.; Biswas, K. Effect of post-weld natural aging on mechanical and microstructural properties of friction stir welded 6063-T4 aluminium alloy. Mater. Des. 2014, 64, 675–686. [Google Scholar] [CrossRef]
- Chen, Q.; Ge, H.; Yang, C.; Lin, S.; Fan, C. Study on pores in ultrasonic-assisted TIG weld of aluminum alloy. Metals 2017, 7, 53. [Google Scholar] [CrossRef]
- Liang, Y.; Hu, S.S.; Shen, J.Q.; Zhang, H.; Wang, P. Geometrical and microstructural characteristics of the TIG-CMT hybrid welding in 6061 aluminum alloy cladding. J. Mater. Process. Technol. 2017, 239, 18–30. [Google Scholar] [CrossRef]
- Narsimhachary, D.; Bathe, R.N.; Padmanabham, G.; Basu, A. Influence of temperature profile during laser welding of aluminum alloy 6061 T6 on microstructure and mechanical properties. Mater. Manuf. Process. 2014, 29, 948–953. [Google Scholar] [CrossRef]
- Wang, Q.; Chen, H.; Zhu, Z.; Qiu, P.; Cui, Y. A characterization of microstructure and mechanical properties of A6N01S-T5 aluminum alloy hybrid fiber laser-MIG welded joint. Int. J. Adv. Manuf. Technol. 2016, 86, 1375–1384. [Google Scholar] [CrossRef]
- Ambriz, R.R.; Chicot, D.; Benseddiq, N.; Mesmacque, G.; de la Torre, S.D. Local mechanical properties of the 6061-T6 aluminium weld using micro-traction and instrumented indentation. Eur. J. Mech. A 2011, 30, 307–315. [Google Scholar] [CrossRef]
- Dewan, M.W.; Wahab, M.A.; Okeil, A.M. Influence of weld defects and postweld heat treatment of gas tungsten arc-welded AA-6061-T651 aluminum alloy. J. Manuf. Sci. Eng. 2015, 137, 051027. [Google Scholar] [CrossRef]
- Attar, H.; Bönisch, M.; Calin, M.; Zhang, L.C.; Scudino, S.; Eckert, J. Selective laser melting of in situ titanium-titanium boride composites: Processing, microstructure and mechanical properties. Acta Mater. 2014, 76, 13–22. [Google Scholar] [CrossRef]
- Attar, H.; Ehtemam-Haghighi, S.; Kent, D.; Wu, X.H.; Dargusch, M.S. Comparative study of commercially pure titanium produced by laser engineered net shaping, selective laser melting and casting processes. Mater. Sci. Eng. A 2017, 705, 385–393. [Google Scholar] [CrossRef]
- Rudy, J.F.; Rupert, E.J. Effects of porosity on mechanical properties of aluminum welds. Weld. J. 1970, 49, 322–336. [Google Scholar]
- Gou, G.; Zhang, M.; Chen, H.; Chen, J.; Li, P.; Yang, Y.P. Effect of humidity on porosity, microstructure, and fatigue strength of A7N01S-T5 aluminum alloy welded joints in high-speed trains. Mater. Des. 2015, 85, 309–317. [Google Scholar] [CrossRef]
- Morton, T.M. Defects in 2021 aluminum alloy welds. Weld. J. 1971, 50, 304–312. [Google Scholar]
- Malin, V. Study of metallurgical phenomena in the HAZ of 6061-T6 aluminum welded joints. Weld. J. 1995, 74, 305–318. [Google Scholar]
- Lin, Y.T.; Wang, D.P.; Wang, M.C.; Zhang, Y.; He, Y.Z. Effect of different pre-and post-weld heat treatments on microstructures and mechanical properties of variable polarity TIG welded AA2219 joints. Sci. Technol. Weld. Join. 2016, 21, 234–241. [Google Scholar] [CrossRef]
- Menzemer, C.; Hilty, E.; Morrison, S.; Minor, R.; Srivatsan, T. Influence of post weld heat treatment on strength of three aluminum alloys used in light poles. Metals 2016, 6, 52. [Google Scholar] [CrossRef]
- Huang, Y.X.; Wan, L.; Lv, Z.L.; Lv, S.X.; Zhou, L.; Feng, J.C. Microstructure and microhardness of aluminium alloy friction stir welds with heat treatment. Sci. Technol. Weld. Join. 2016, 21, 637–644. [Google Scholar] [CrossRef]
- Zhu, Z.Y.; Deng, C.Y.; Wang, Y.; Yang, Z.W.; Ding, J.K.; Wang, D.P. Effect of post weld heat treatment on the microstructure and corrosion behavior of AA2219 aluminum alloy joints welded by variable polarity tungsten inert gas welding. Mater. Des. 2015, 65, 1075–1082. [Google Scholar] [CrossRef]
- Balasubramanian, V.; Ravisankar, V.; Reddy, G.M. Effect of pulsed current and post weld aging treatment on tensile properties of argon arc welded high strength aluminium alloy. Mater. Sci. Eng. A 2007, 459, 19–34. [Google Scholar] [CrossRef]
- Pérez, J.S.; Ambriz, R.R.; López, F.F.C.; Vigueras, D.J. Recovery of mechanical properties of a 6061-T6 aluminum weld by heat treatment after welding. Metall. Mater. Trans. A 2016, 47, 3412–3422. [Google Scholar] [CrossRef]
- Zhang, C.; Gao, M.; Wang, D.Z.; Yin, J.; Zeng, X.Y. Relationship between pool characteristic and weld porosity in laser arc hybrid welding of AA6082 aluminum alloy. J. Mater. Process. Technol. 2017, 240, 217–222. [Google Scholar] [CrossRef]
- Ehtemam-Haghighi, S.; Liu, Y.J.; Cao, G.H.; Zhang, L.C. Phase transition, microstructural evolution and mechanical properties of Ti-Nb-Fe alloys induced by Fe addition. Mater. Des. 2016, 97, 279–286. [Google Scholar] [CrossRef]
- Min, D.; Shen, J.; Lai, S.Q.; Chen, J. Effect of heat input on the microstructure and mechanical properties of tungsten inert gas arc butt-welded AZ61 magnesium alloy plates. Mater. Charact. 2009, 60, 1583–1590. [Google Scholar] [CrossRef]
- Sillapasa, K.; Surapunt, S.; Miyashita, Y.; Mutoh, Y.; Seo, N. Tensile and fatigue behavior of SZ, HAZ and BM in friction stir welded joint of rolled 6N01 aluminum alloy plate. Int. J. Fatigue 2014, 63, 162–170. [Google Scholar] [CrossRef]
- Shen, Z.K.; Yang, X.Q.; Yang, S.; Zhang, Z.H.; Yin, Y.H. Microstructure and mechanical properties of friction spot welded 6061-T4 aluminum alloy. Mater. Des. 2014, 54, 766–778. [Google Scholar] [CrossRef]
- Elrefaey, A.; Ross, N.G. Microstructure and mechanical properties of cold metal transfer welding similar and dissimilar aluminum alloys. Acta Metall. Sin. 2015, 28, 715–724. [Google Scholar] [CrossRef]
- Sevim, I.; Hayat, F.; Kaya, Y.; Kahraman, N.; Şahin, S. The study of MIG weldability of heat-treated aluminum alloys. Int. J. Adv. Manuf. Technol. 2013, 66, 1825–1834. [Google Scholar] [CrossRef]
- Forn, A.; Baile, M.T.; Martín, E.; Rupérez, E. Effect of heat treatments in the silicon eutectic crystal evolution in Al-Si alloys. Mater. Sci. Forum 2005, 480–481, 367–372. [Google Scholar] [CrossRef]
- Zhang, D.L.; Zheng, L.H.; StJohn, D.H. Effect of a short solution treatment time on microstructure and mechanical properties of modified Al-7 wt. %Si-0.3 wt. %Mg alloy. J. Light Met. 2002, 2, 27–36. [Google Scholar] [CrossRef]
- Yang, Y.; Zhong, S.Y.; Chen, Z.; Wang, M.; Ma, N.; Wang, H. Effect of Cr content and heat-treatment on the high temperature strength of eutectic Al-Si alloys. J. Alloys Compd. 2015, 647, 63–69. [Google Scholar] [CrossRef]


| Materials | Si | Fe | Cu | Mn | Mg | Ti | Al |
|---|---|---|---|---|---|---|---|
| 6082 | 0.83 | 0.296 | 0.059 | 0.55 | 1.14 | 0.018 | Remainder |
| 4043 | 5.05 | 0.110 | 0.024 | - | - | 0.034 | Remainder |
| Plate No. | Preheat Temperature/°C | Interpass Temperature/°C | Current/A | Gas Flow L/min | Weld Pass Face/Back |
|---|---|---|---|---|---|
| 1 | 50 | 60 | 225 | 16 | 5/2 |
| 2 | 50 | 60 | 225 | 16 | 5/1 |
| 3 | 100 | 110 | 250 | 16 | 8/2 |
| 4 | 100 | 95 | 260 | 16 | 3/2 |
| 5 | 102 | 88 | 280 | 16 | 5/1 |
| 6 | 100 | 100 | 288 | 16 | 3/2 |
| 7 | 65 | 75 | 303 | 16 | 4/2 |
| 8 | 90 | 86 | 320 | 16 | 3/2 |
| Abbreviation | PWHT | Specific Process Parameters |
|---|---|---|
| AW | As-welded | - |
| AG | Artificial aging treatment | 160 °C × 18 h |
| SAG | Solution treatment + artificial aging treatment | 530 °C × 30 min + 160 °C × 18 h |
| Plate No. | Rm(w)/MPa | Rp/MPa | A/% | Fracture Location | T/% | TQ/kJ | Q kJ/mm | WPP/% |
|---|---|---|---|---|---|---|---|---|
| 1 | 141 | - | - | HAZ | 47 | 7126.9 | 2.91 | 5.34 |
| 2 | 150 | 112 | 6.9 | HAZ | 50 | 5791.8 | 2.76 | 6.22 |
| 3 | 186 | 179 | 5 | HAZ | 62 | 4011 | 1.15 | 5.10 |
| 4 | 176 | 145 | 9.7 | HAZ | 58.7 | 4878.3 | 2.79 | 2.58 |
| 5 1 | 173.5 | 149 | 4 | WZ | 57.8 | 4834.8 | 2.30 | 4.36 |
| 6 | 185 | 177 | 4.2 | WZ | 61.7 | 3370.5 | 1.93 | 8.50 |
| 7 | 193 | 157 | 7.1 | HAZ | 64.3 | 3784.4 | 1.80 | 3.46 |
| 8 | 191 | 160 | 6.5 | HAZ | 63.7 | 3947.3 | 2.26 | 6.44 |
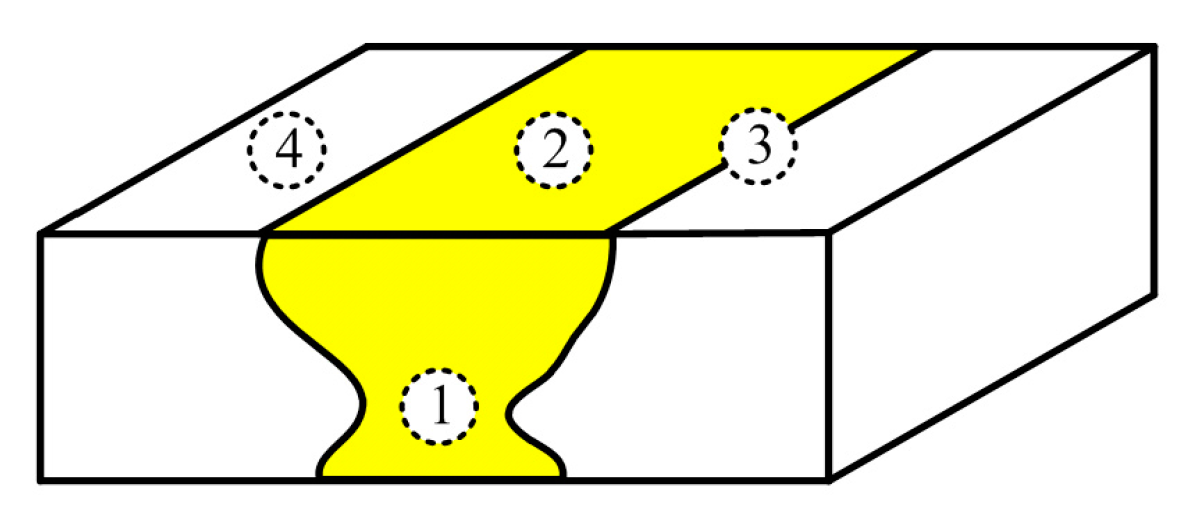
| Point | Al | Mg | Si | Mn | Fe |
|---|---|---|---|---|---|
| A (at. %) | 50.22 | 33.83 | 15.95 | - | - |
| B (wt. %) | 61.27 | 0.84 | 6.45 | 9.81 | 21.63 |
| C (wt. %) | 62.16 | 1.00 | 4.08 | 4.38 | 28.37 |
| D (wt. %) | 88.63 | 0.77 | 2.50 | 2.04 | 6.06 |
| Point | Chemical Element Content (wt. %) | ||||||
|---|---|---|---|---|---|---|---|
| Si | Fe | Cu | Mn | Mg | Ti | Al | |
| ① | 2.78 | 0.195 | 0.029 | 0.296 | 0.72 | 0.018 | Remainder |
| ② | 3.15 | 0.158 | 0.022 | 0.216 | 0.54 | 0.018 | Remainder |
| ③ | 1.14 | 0.280 | 0.056 | 0.51 | 1.10 | 0.016 | Remainder |
| ④ | 0.83 | 0.281 | 0.059 | 0.55 | 1.14 | 0.018 | Remainder |
© 2017 by the authors. Licensee MDPI, Basel, Switzerland. This article is an open access article distributed under the terms and conditions of the Creative Commons Attribution (CC BY) license (http://creativecommons.org/licenses/by/4.0/).
Share and Cite
Wang, B.; Xue, S.; Ma, C.; Wang, J.; Lin, Z. Effects of Porosity, Heat Input and Post-Weld Heat Treatment on the Microstructure and Mechanical Properties of TIG Welded Joints of AA6082-T6. Metals 2017, 7, 463. https://doi.org/10.3390/met7110463
Wang B, Xue S, Ma C, Wang J, Lin Z. Effects of Porosity, Heat Input and Post-Weld Heat Treatment on the Microstructure and Mechanical Properties of TIG Welded Joints of AA6082-T6. Metals. 2017; 7(11):463. https://doi.org/10.3390/met7110463
Chicago/Turabian StyleWang, Bo, Songbai Xue, Chaoli Ma, Jianxin Wang, and Zhongqiang Lin. 2017. "Effects of Porosity, Heat Input and Post-Weld Heat Treatment on the Microstructure and Mechanical Properties of TIG Welded Joints of AA6082-T6" Metals 7, no. 11: 463. https://doi.org/10.3390/met7110463