
Leaching Kinetics of Zinc from Metal Oxide Varistors (MOVs) with Sulfuric Acid


Department of Energy & Resources Engineering, Kangwon National University, Chuncheon 24341, Korea
*
Author to whom correspondence should be addressed.
Metals 2016, 6(8), 192; https://doi.org/10.3390/met6080192
Submission received: 22 July 2016
/
Revised: 13 August 2016
/
Accepted: 17 August 2016
/
Published: 19 August 2016
Abstract
:The leaching kinetics of zinc from zinc oxide-based metal oxide varistors (MOVs) was investigated in H2SO4 at atmospheric pressure. Kinetics experiments were carried out at various agitation speeds, particle sizes, initial H2SO4 concentrations, and reaction temperatures. It was determined that the leaching rate of zinc was independent of agitation speed above 300 rpm and also independent of particle size below 105 μm, whereas it dramatically increased with an increasing H2SO4 concentration. Except for when the H2SO4 concentration was varied, the m-values were almost constant at varying agitation speeds (m-values: 0.554–0.579), particle sizes (m-values: 0.507–0.560) and reaction temperature (m-values: 0.530–0.560) conditions. All of the m-values in these experiments were found to be below 0.580. Therefore, it is proposed that the extraction of zinc is a diffusion-controlled reaction. The leaching kinetics followed the D3 kinetic equation with a rate-controlling diffusion step through the ash layers, and the corresponding apparent activation energy was calculated as 20.7 kJ/mol in the temperature range of 313 K to 353 K.

1. Introduction
Many researchers have recovered metals from waste printed circuit boards (WPCBs) due to the dramatic increase in the amount of WPCBs. There are many papers reporting on the recovery of high content metals (Cu, Al, Sn) or precious metals (Au, Ag) from WPCBs using physical, chemical, or biological methods, or a combination of these approaches [1,2,3,4,5,6,7,8,9,10,11,12]. However, these processes are very difficult to perform and are expensive not only for the concentration of minor metals but also for their individual recovery. For these reasons, few studies have focused on the recovery of metals that have low concentrations of electric/electronic components (EECs) due to the diversity of mounted EECs in WPCBs, such as in varistors, condensers, inductors, resistors, diodes, and so on. These EECs consist of various metals, such as zinc, copper, cobalt, and nickel, as well as toxic substances [12]. Among these EECs, metal oxide varistors (MOVs) are widely used in electronic devices. Due to their excellent nonlinear coefficient, low leakage current, and high energy absorption capacity, they have been used as surge absorbers in small current electrical circuits, as well as in transmission lines, for many years [13,14].
MOVs are made by sintering a mixture of zinc oxide with small amounts of other oxides, such as Bi2O, Sb2O3, Co2O3, Cr2O3, among others [13,14]. Therefore, wasted MOVs, if separated from other types of waste components, could be good starting materials for the recovery of various metals [15]. Gutknecht et al. [15] investigated the leaching of MOVs using four acid solutions, including acetic acid, hydrochloric acid, nitric acid and sulfuric acid. However, this study was not sufficient from an industrial point of view. Similar investigations have been carried out by other research groups [16,17,18]. However, these studies focused on zinc leaching from electric arc furnace dust (EAF dust) or zinc ores. More importantly, except for the Gutknecht study [15], our research group has not found any literature on the recycling of MOVs.
For these reasons, a basic study of the leaching kinetics of the metals from MOVs is important to develop recycling routes for various metals, such as Zn, Bi, Sn, and Co, among others.
The main objective of this work is to provide information on the leaching kinetics of zinc from MOVs. Factors influencing zinc extraction, including the agitation speed, particle size, initial H2SO4 concentration, and reaction temperature, were studied in detail.
2. Experimental Section
2.1. Materials
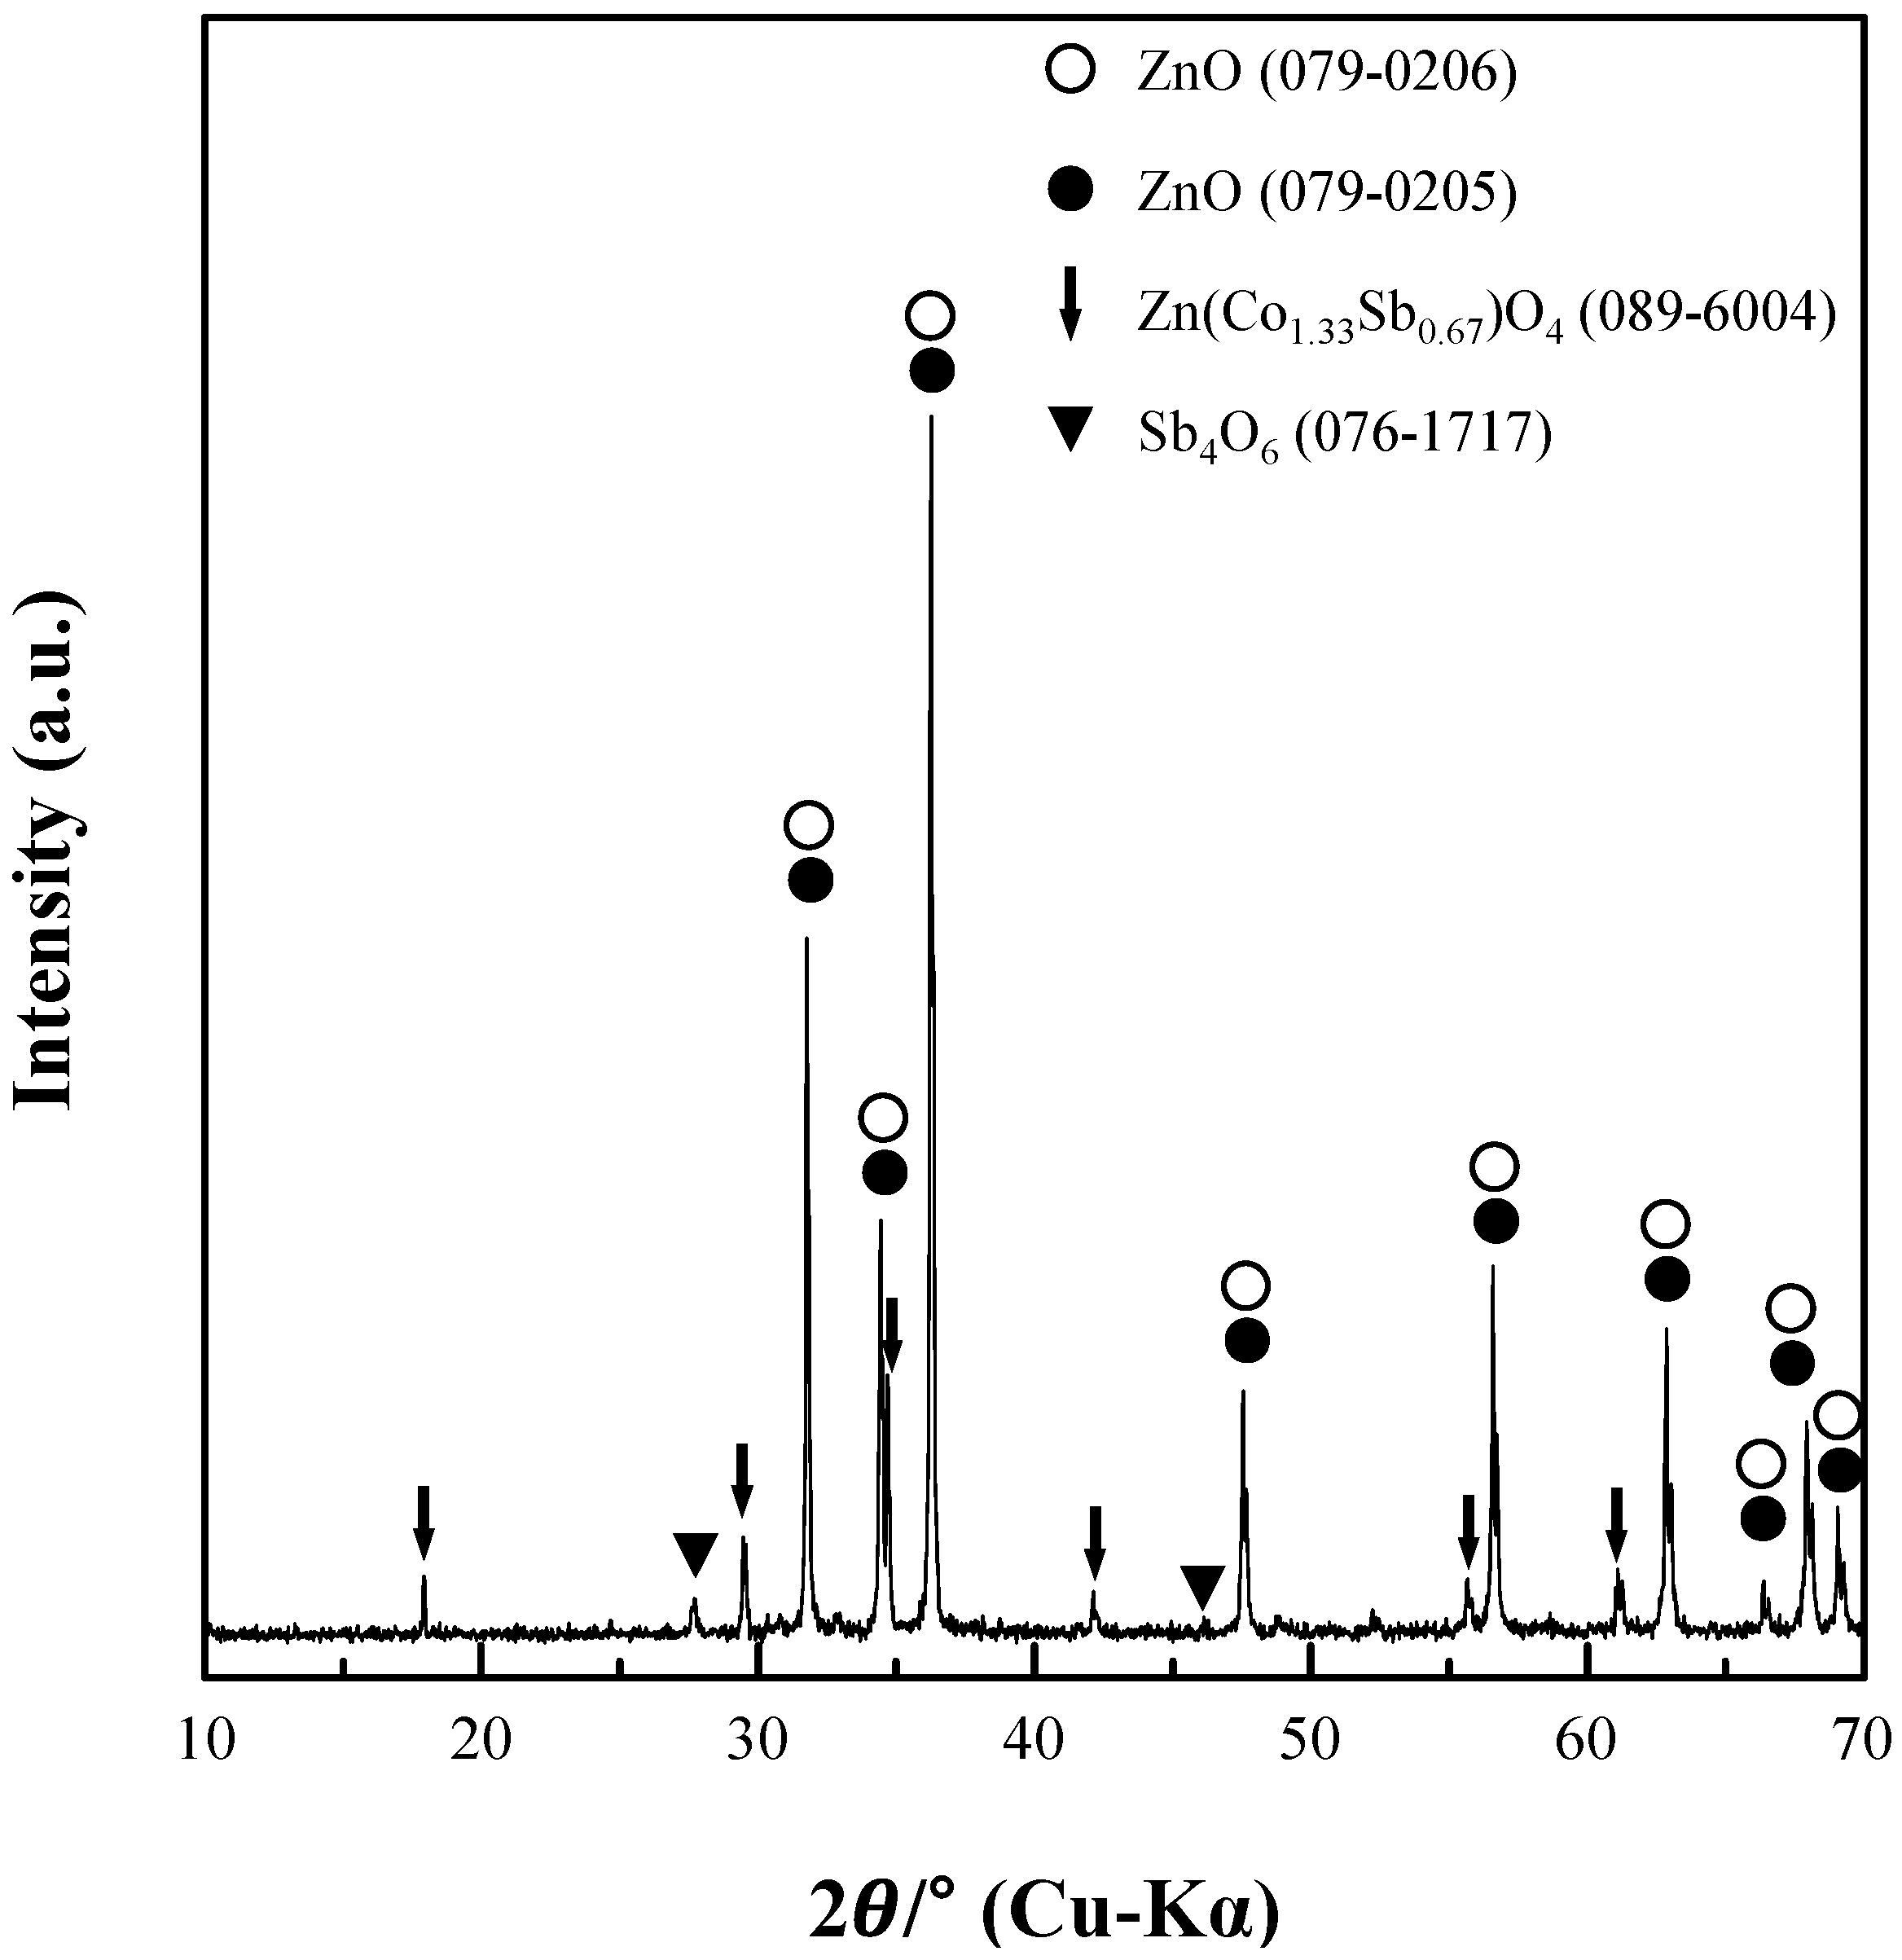
The MOVs with dimensions of 15 mm × 25 mm × 4.5 mm (produced by Thinking Electronic Industrial Co., Ltd., Kaohsiung, Taiwan) were used in the present study. MOVs were ground to a particle size less than 210 μm by using a rod mill, and screened into different sized fractions with Tyler sieves. The −210 μm fraction, containing various metals with chemical compositions, as shown in Table 1, was used as the sample for this study. The chemical composition of MOVs was analyzed using inductively coupled plasma spectrometer (ICP) after these were completely dissolved in aqua regia at 383–393 K. These results are summarized in Table 1. The undersized fraction of MOVs contained 70.97% Zn, 2.76% Sb, and 1.83% Bi as major elements. The analysis of the zinc content of different particle sizes and mass fractions of the MOVs, as presented in Table 2, indicates an increase in the percentage of the zinc content with decreasing particle size. Typical X-ray diffraction (XRD) patterns of the MOVs, prepared by rod milling and sieving, are shown in Figure 1. Major intensity peaks correspond to zinc oxide (ZnO), while minor intensity peaks corresponding to zinc cobalt antimony oxide (Zn(Co1.33Sb0.67)O4) and antimony oxide (Sb4O6) were also detected.
2.2. Procedures
The leaching experiments were carried out in a 1-L four-neck thermostatic Pyrex reactor with a heating mantle. The hole at the center of the reactor was fitted with a stirrer, and three side holes were fitted with a reflux condenser, a temperature controller, and a glass cap to collect leach liquor samples. H2SO4 (0.5 L) was poured into the reactor and allowed to reach thermal equilibrium. Five grams of the samples was added to the reactor and, in all experiments, the solid/liquid ratio was kept constant at 10 g/L. Following this, 2 mL of leach liquor samples were taken periodically (between 0.5 min and 60 min). At selected time intervals, approximately 2 mL of slurry samples were withdrawn and quickly separated by vacuum filtration. All of the aqueous solutions were prepared using distilled water, and reagent grade H2SO4 (95%–97%, Merck, Darmstadt, Germany) was used as the solvent.
For quantitative analysis, the chemical digestion method was used for each of the samples. The zinc content was analyzed by using an inductively coupled plasma spectrometer (ICP, Optima 7300 DV, PerkinElmer, Waltham, MA, USA), and the samples were characterized by the high-resolution X-ray diffraction (HRXRD) analysis (X’pert-pro MPD, PANalytical, Almelo, The Netherlands) method.
3. Results and Discussion
3.1. Effect of Agitation Speed
The effect of the agitation speed on zinc leaching was studied using fine particles of 53 to 105 μm and agitation speeds of 100 to 400 rpm. Within the series of experiments, the reaction temperature, initial H2SO4 concentration, and solid-to-liquid ratios were kept constant at 333 K, 0.1 M, and 10 g/L, respectively. Figure 2 shows the effect of the agitation speed on the leachability of zinc.
As shown in Figure 2, the leachability of zinc increased with increasing agitation speed and leaching time due to the decreasing thickness of the mass transfer boundary layer on the surface of the MOV particles [19]. However, it was also found that the leachability of zinc remained almost constant over 300 rpm. These results indicate that the dissolution process is not controlled by mass transfer through the liquid boundary layer at agitation speeds of or above 300 rpm.
3.2. Effect of Particle Size
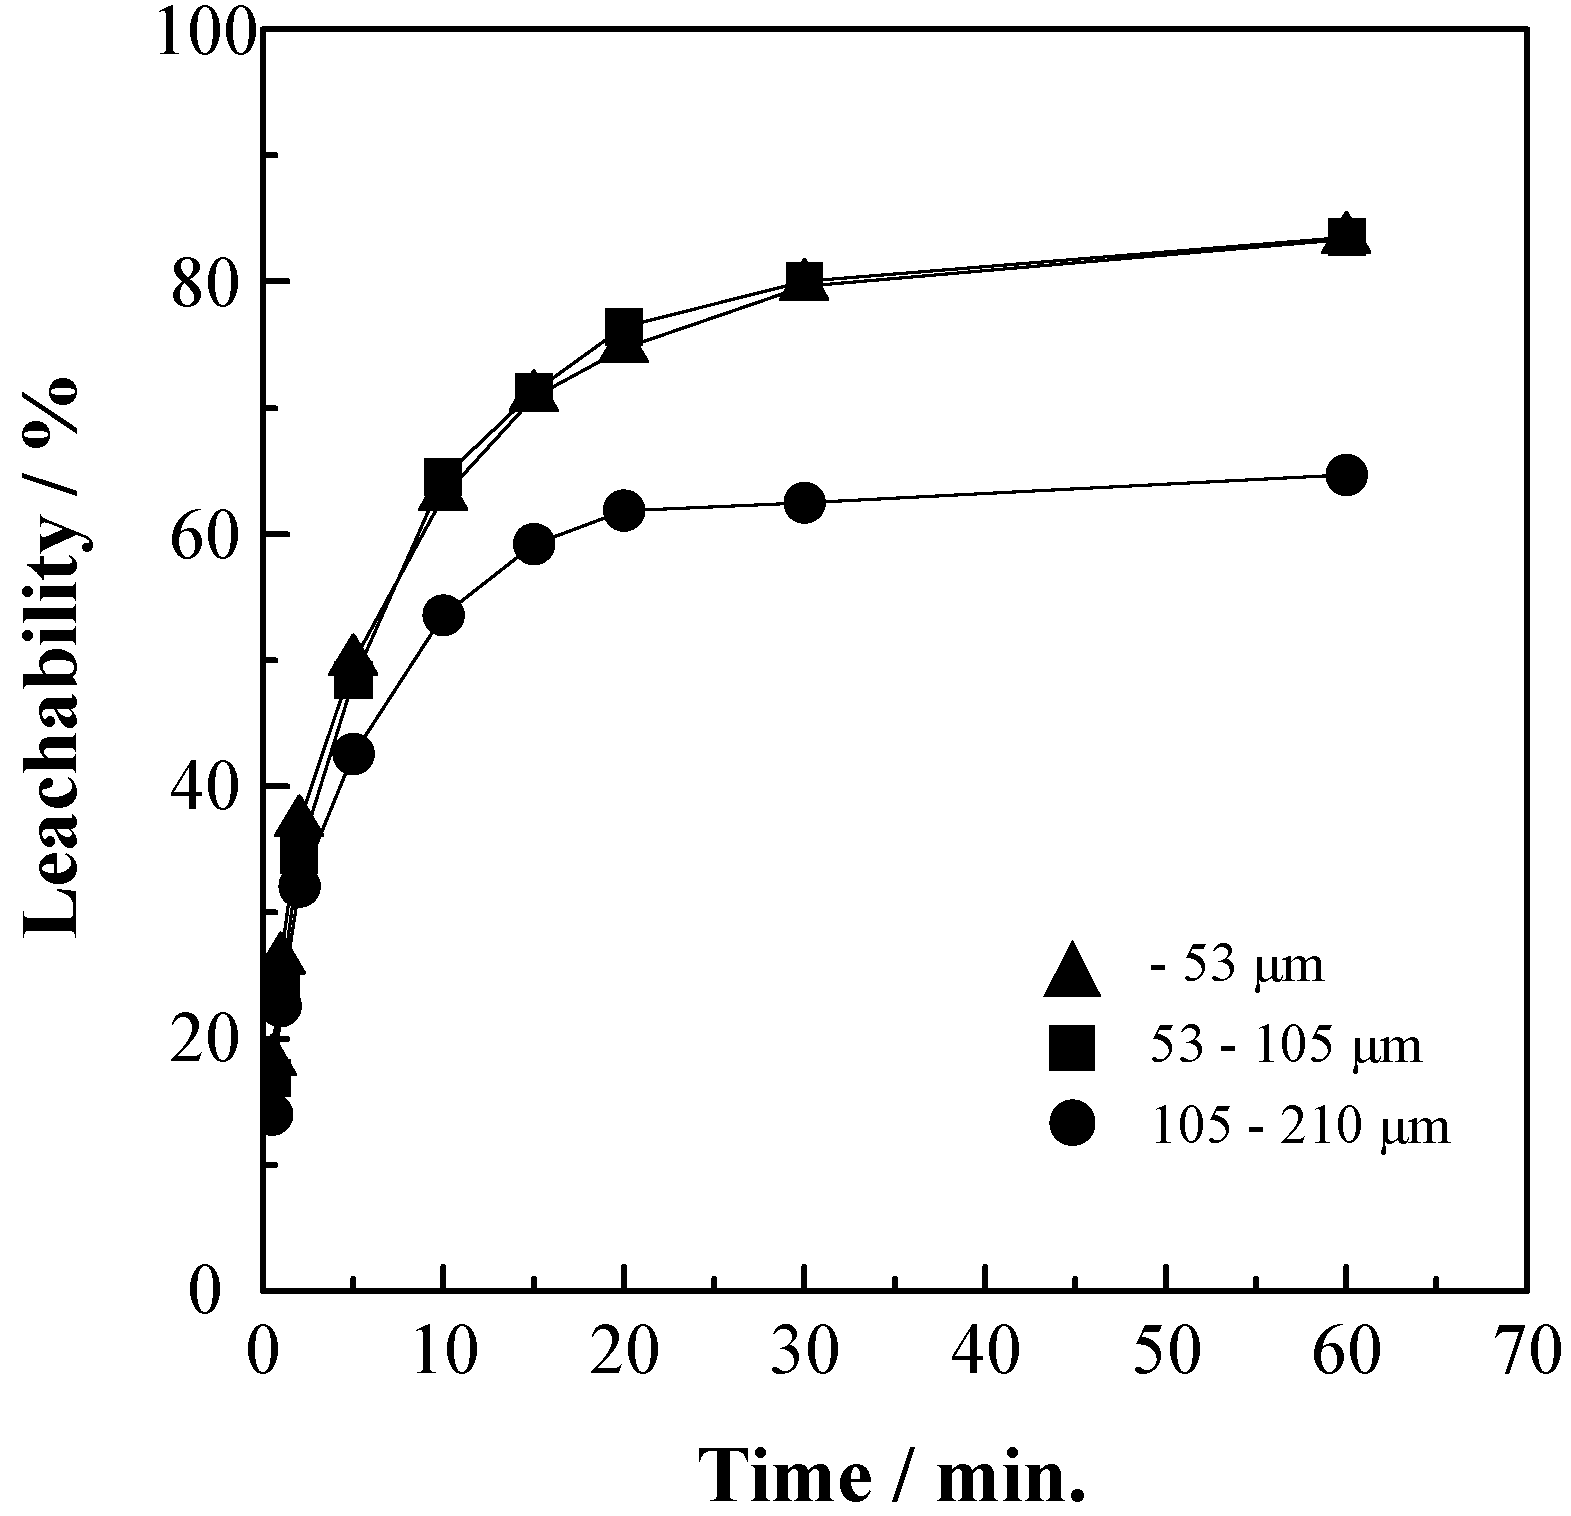
A plot of the leachability of zinc against time using different sized fractions (105–210, 53–105, −53 μm) is presented in Figure 3. In this leaching test, the leaching temperature and initial H2SO4 concentration were fixed at 333 K and 0.1 M, respectively. The results indicate that the leachability of zinc is almost independent of particle size below 105 μm. Thus, for further experiments, particles in the size range of 53 to 105 μm were chosen to minimize the effect of particle size on leaching [20].
3.3. Effect of H2SO4 Concentration
The effect on zinc extraction was studied by varying the initial H2SO4 concentration from 0.05 M to 1 M while the leaching temperature was kept constant at 333 K. The results are shown Figure 4. The leachability of zinc increased with the increasing initial H2SO4 concentration and zinc leaching was typically found to be fast in the initial period up to 10 min, but slowed to a lower rate with further increases in leaching time. It is obvious that the initial H2SO4 concentration had a pronounced effect on the extraction of zinc.
After 60 min, the leaching ratio reached 100% in the H2SO4 concentration range of 0.5 to 1 M, whereas the leaching rate was 83.5% at a H2SO4 concentration of 0.1 M. The effect of H2SO4 concentration found in these investigations agrees well with the results of other investigators [15,16,18]. If all of the zinc in the MOVs is leached, the total zinc concentration will be 0.11 M in the leaching solution because the mole ratio of H2SO4 to zinc ions is 1. The experimental results are almost consistent with the fundamental analysis [21].
3.4. Effect of Reaction Temperature
The Figure 5 shows the extent of zinc leaching at different reaction temperatures between 313 K and 353 K while all of the other parameters were kept constant. The results show that the reaction temperatures do not have a noticeable effect on the zinc extraction. The leachability of zinc initially rose very sharply over approximately 15 min. After 15 min of treatment, the leachability of zinc increased slowly with an increase in reaction time. The molecular collisions, mass transfer co-efficient, and reaction constant are improved with increasing temperature [19]. However, when the reaction temperature increased from 313 K to 353 K, the leachability of zinc increased from 80.48% to 86.8% after 60 min in 0.1 M H2SO4. This weak temperature dependence indicates that the dissolution process does not seem to be controlled by a chemical reaction [22].
3.5. Kinetic Analysis
The leaching process of zinc oxide in a sulfuric acid solution is described by the following chemical reaction [16]:
ZnO + H2SO4 → ZnSO4 + H2O
On the basis of the above reaction, the effects of the temperature, agitation speed, initial H2SO4 concentration, and particle size on the kinetics of zinc extraction in a sulfuric acid solution are analyzed below. Hancock and Sharp [23] inferred the reaction mechanism through m-values, as per the following equation. This method was reported by Sharp et al. [24] and Hancock and Sharp [23]. Baik et al. [25] also used this equation to describe the dissolution of tungsten in NaOH solution.
where a = Fraction of reaction, k = rate constant, t = reaction time.
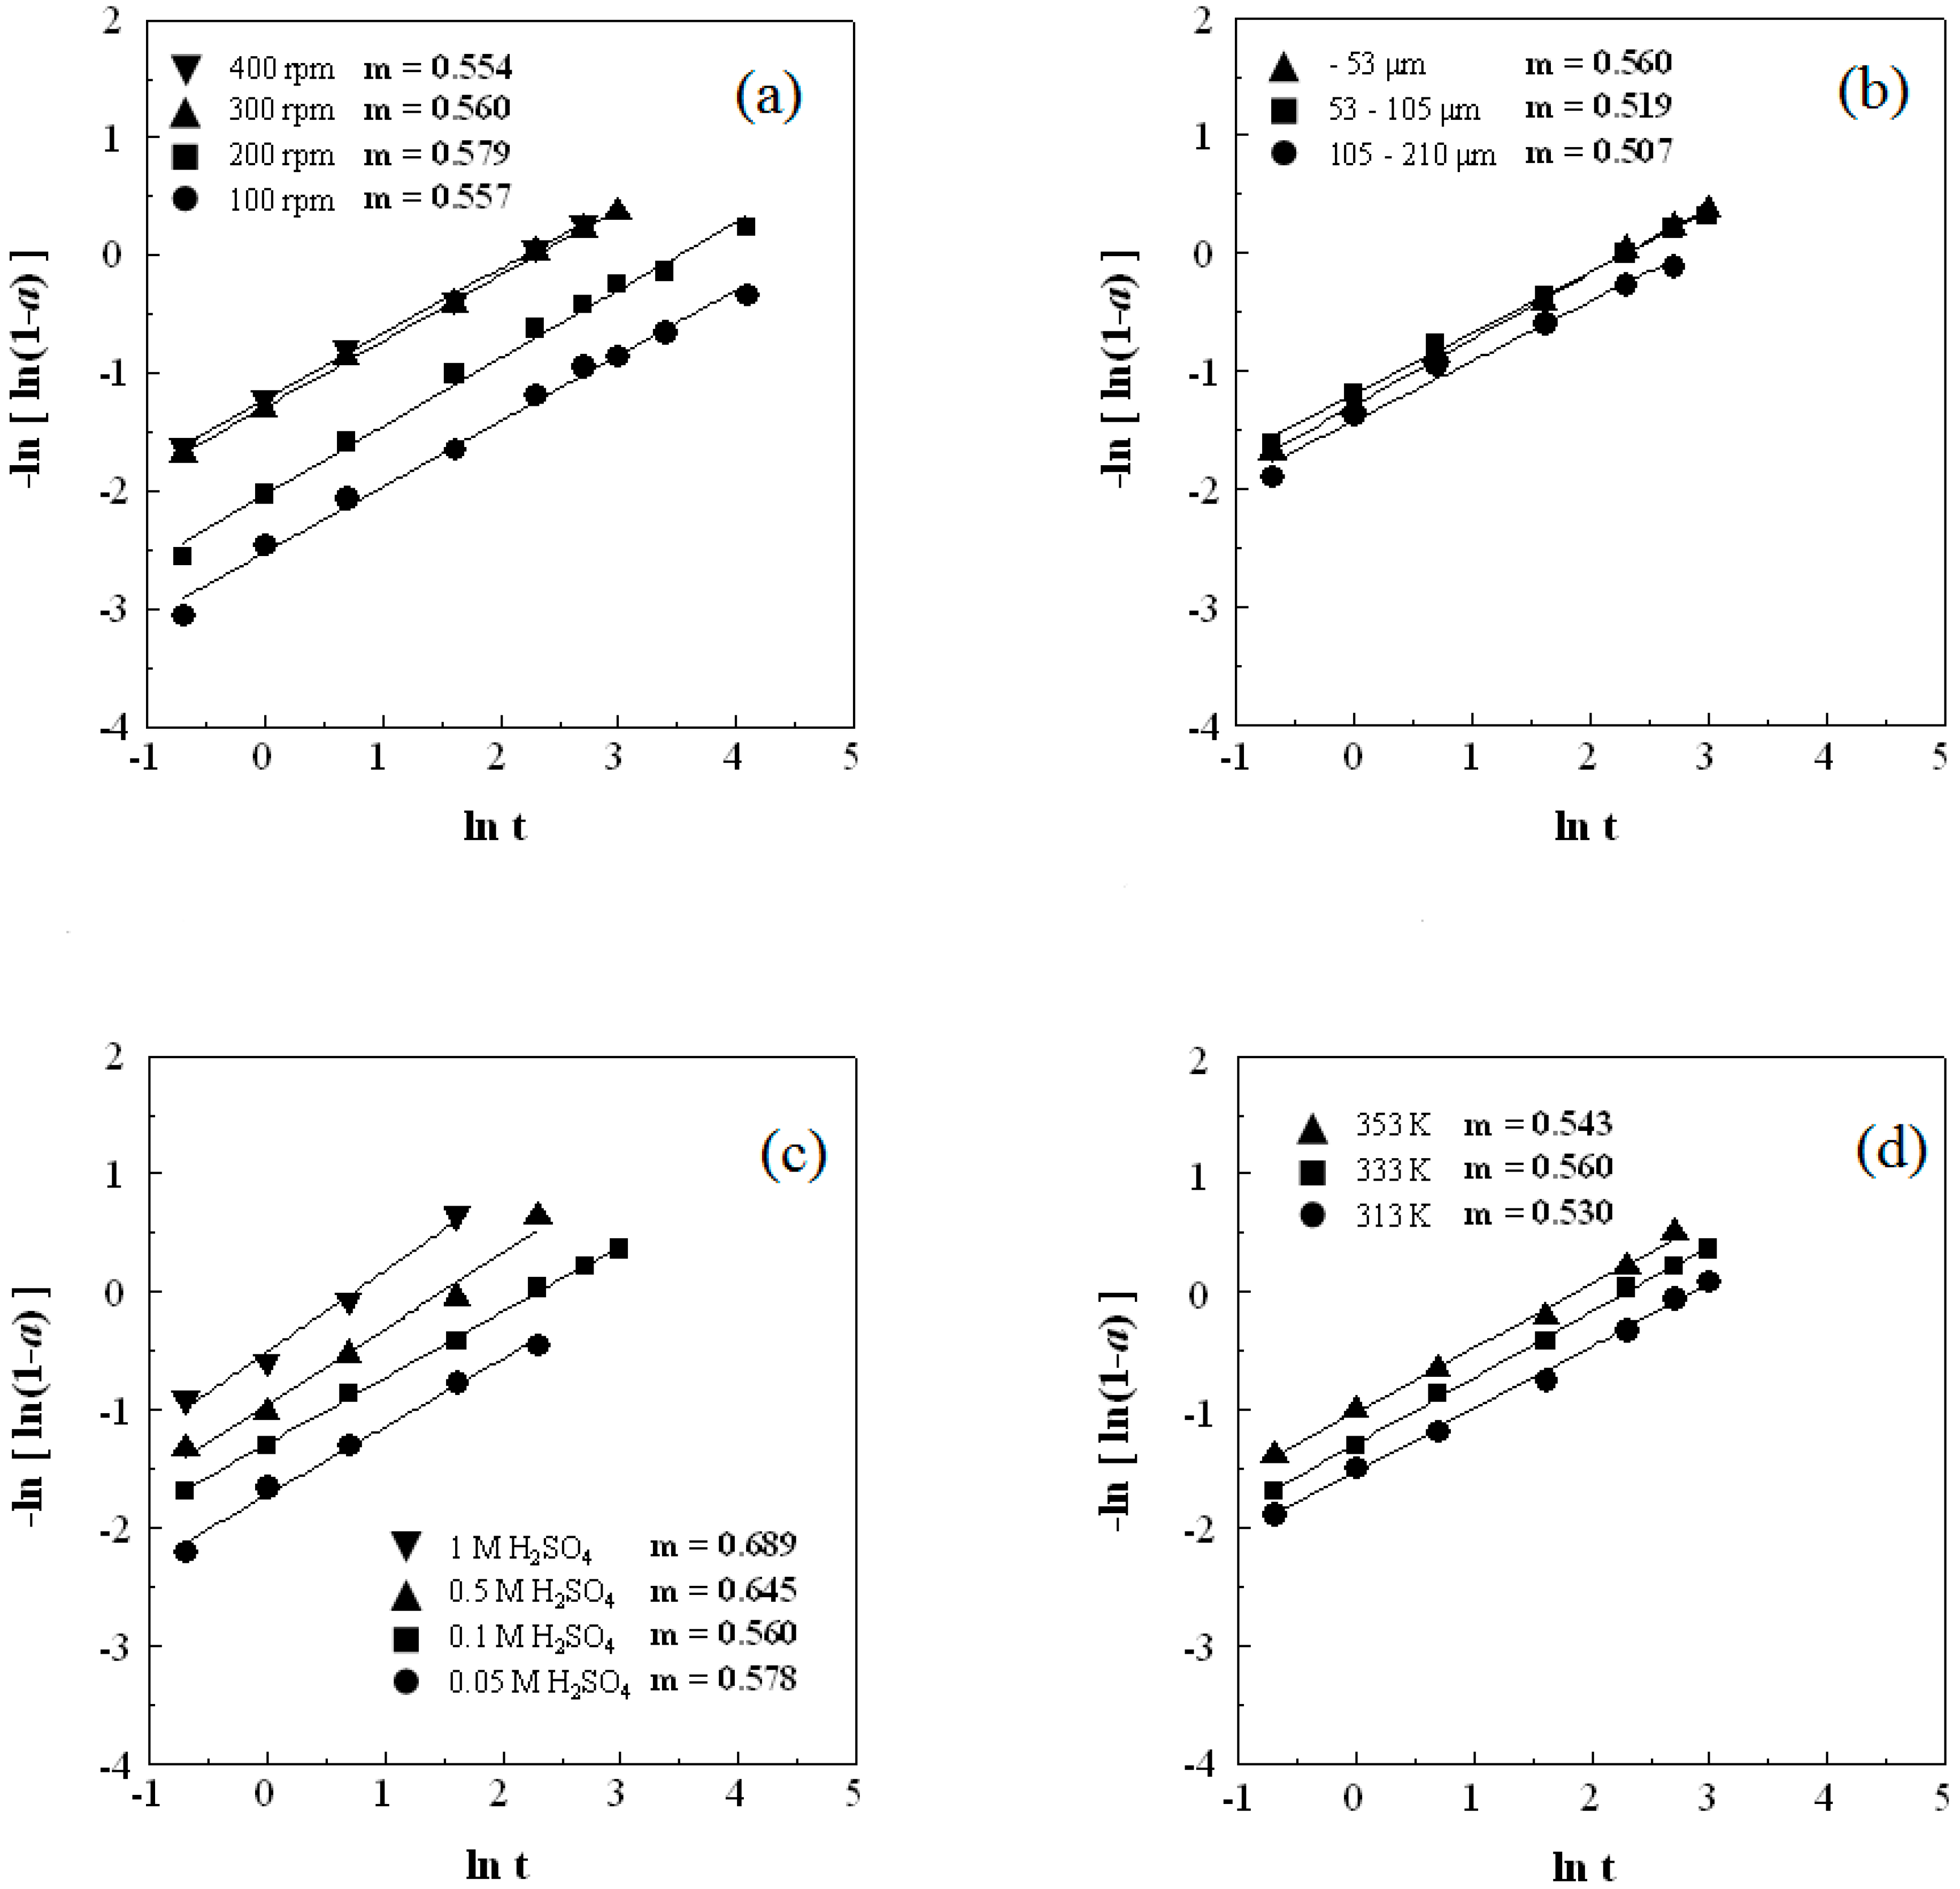
−ln[ln(1 − a)] = lnk + mlnt
Kinetic equations for different reaction mechanisms and m-values are presented in Table 3. The m-values of diffusion-controlled reactions are in the range of 0.54 to 0.62, while reaction-controlled reactions show an m-value of approximately 1.0 [23].
The data presented in Figure 2, Figure 3, Figure 4 and Figure 5 are plotted according to Equation (2) in Figure 6a–d, respectively. The m-values were determined from the straight lines plotted in Figure 6a–d.
Figure 6c shows that the m-values increased with an increasing initial H2SO4 concentration from 0.578 to 0.689. These results suggest that the diffusion mechanism changes with the initial H2SO4 concentration [25]. However, the m-values were almost constant under variable agitation speed (m-values: 0.554–0.579), particle size (m-values: 0.507–0.560) and reaction temperature (m-values: 0.530–0.560) conditions. Further, all of the m-values in these experiments were below 0.70, indicating that the mechanisms for all of these reactions may be diffusion-controlled.
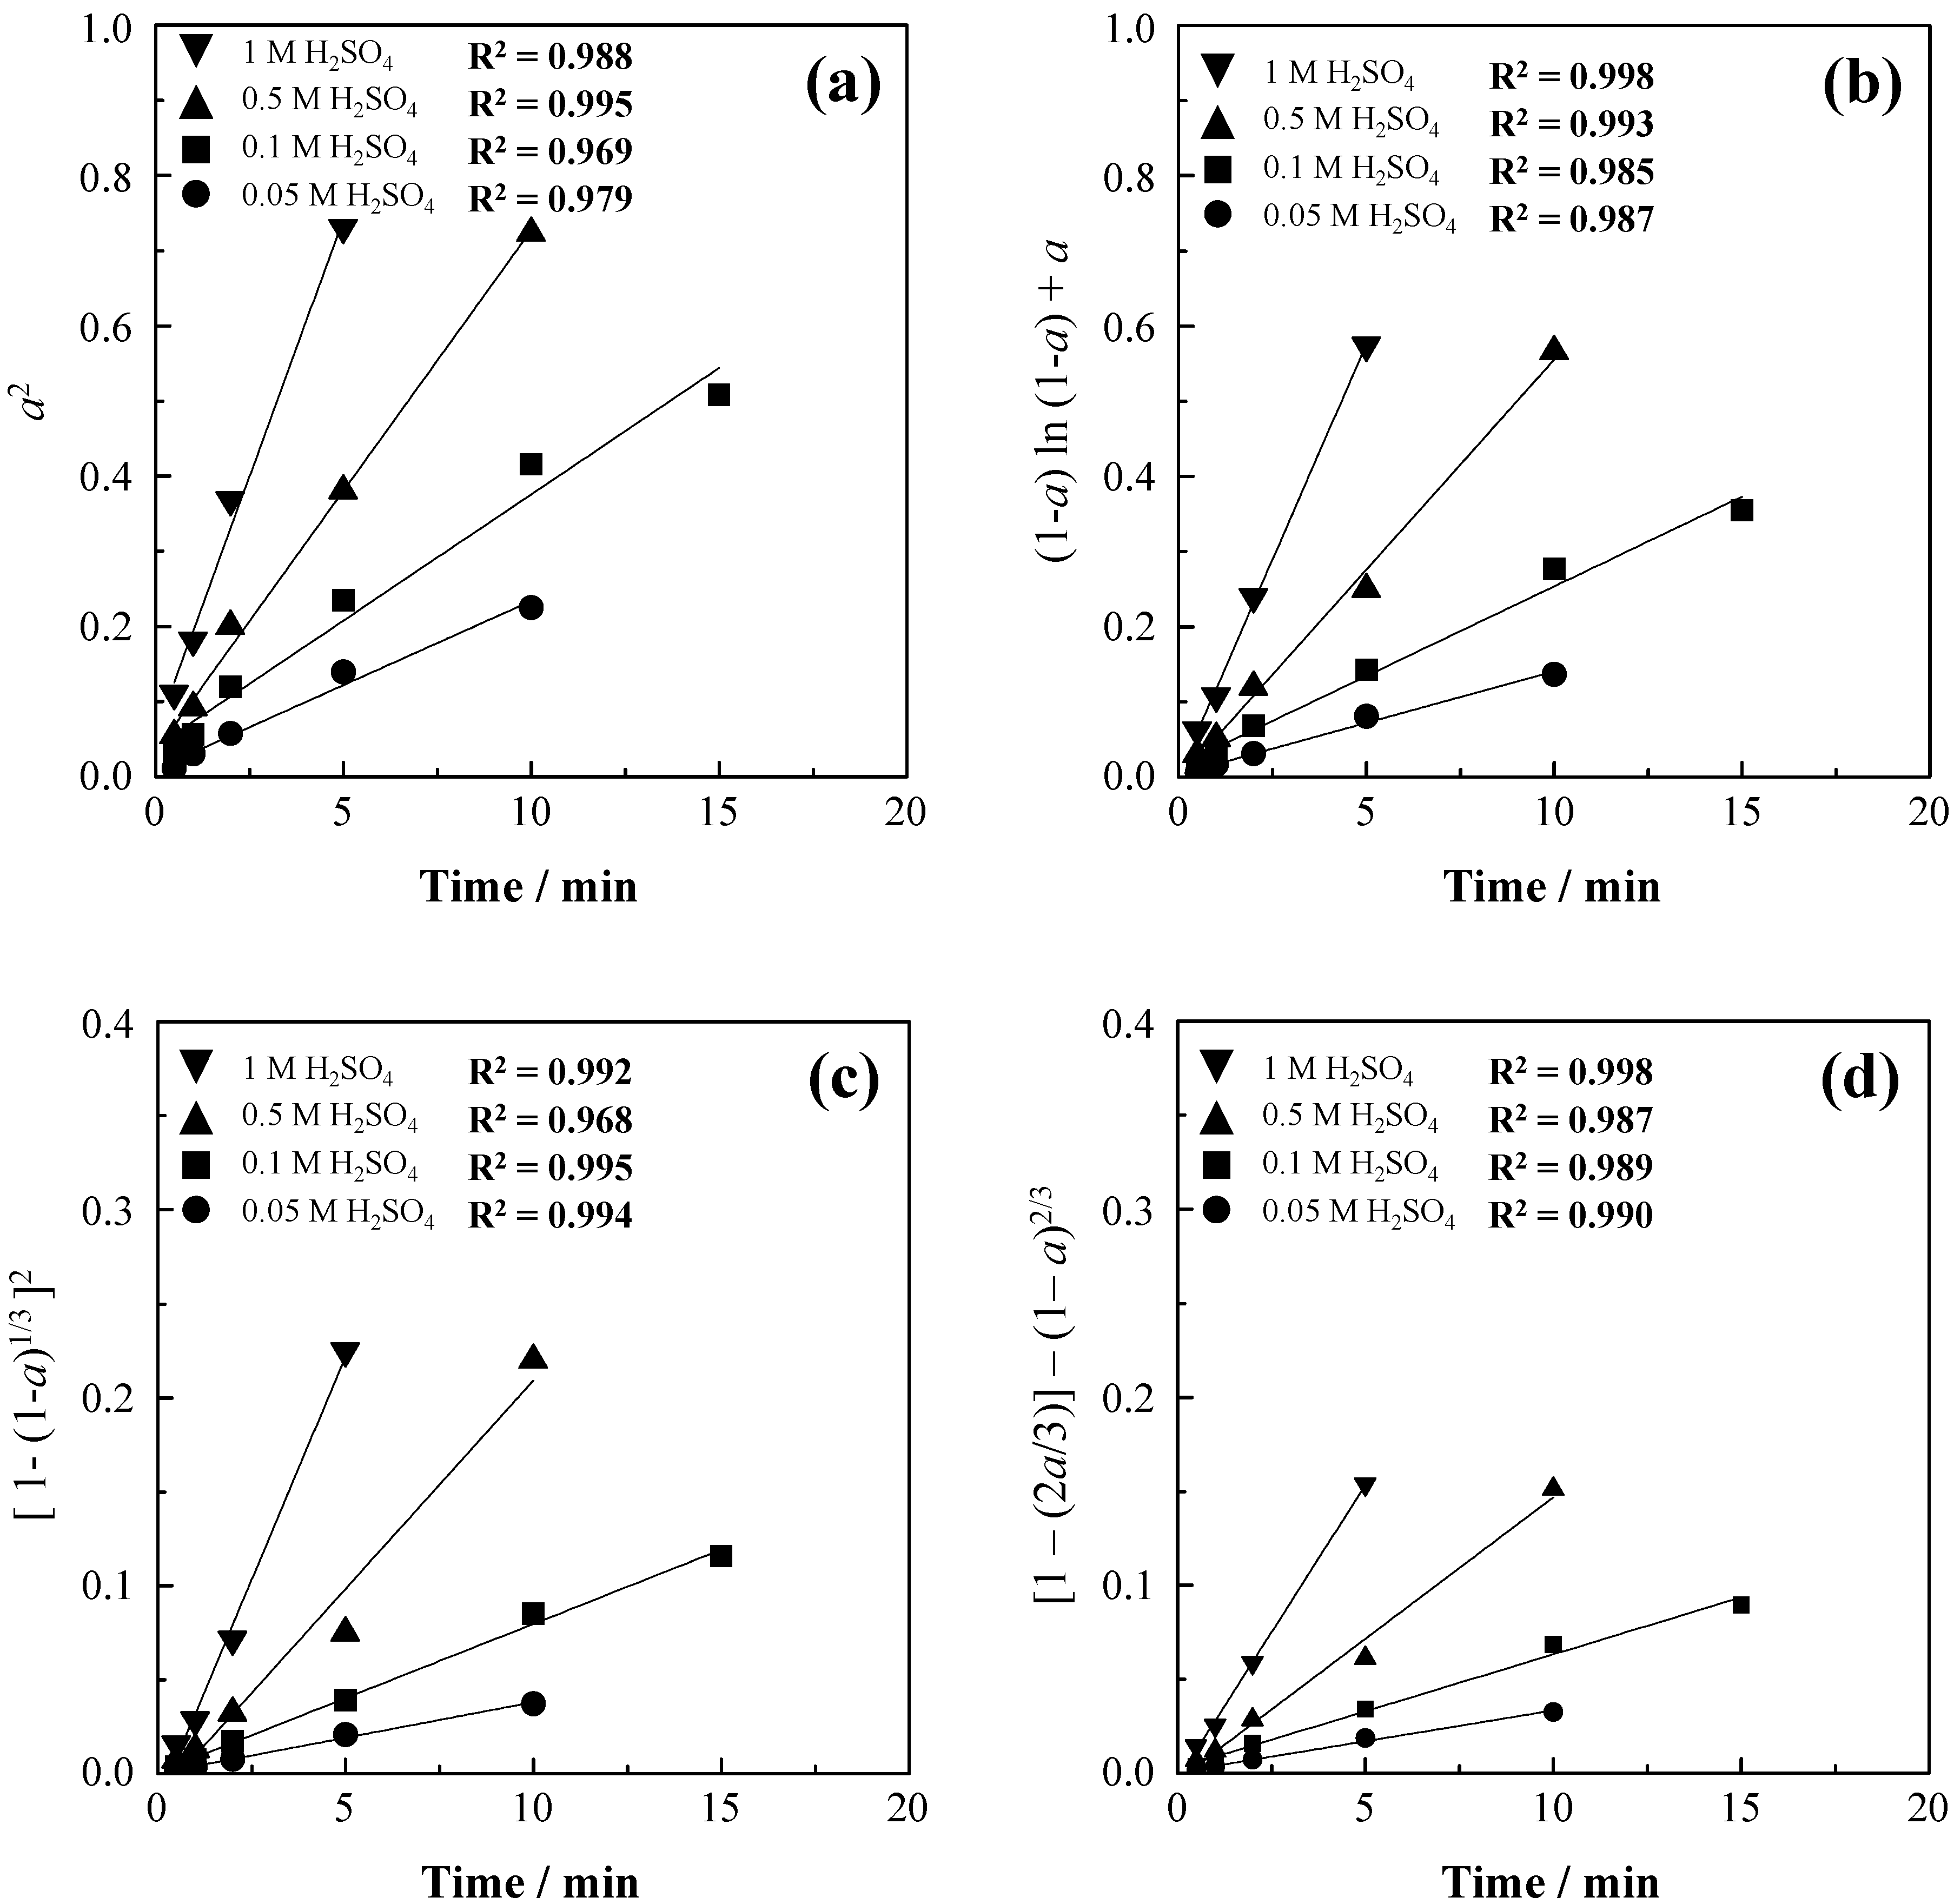
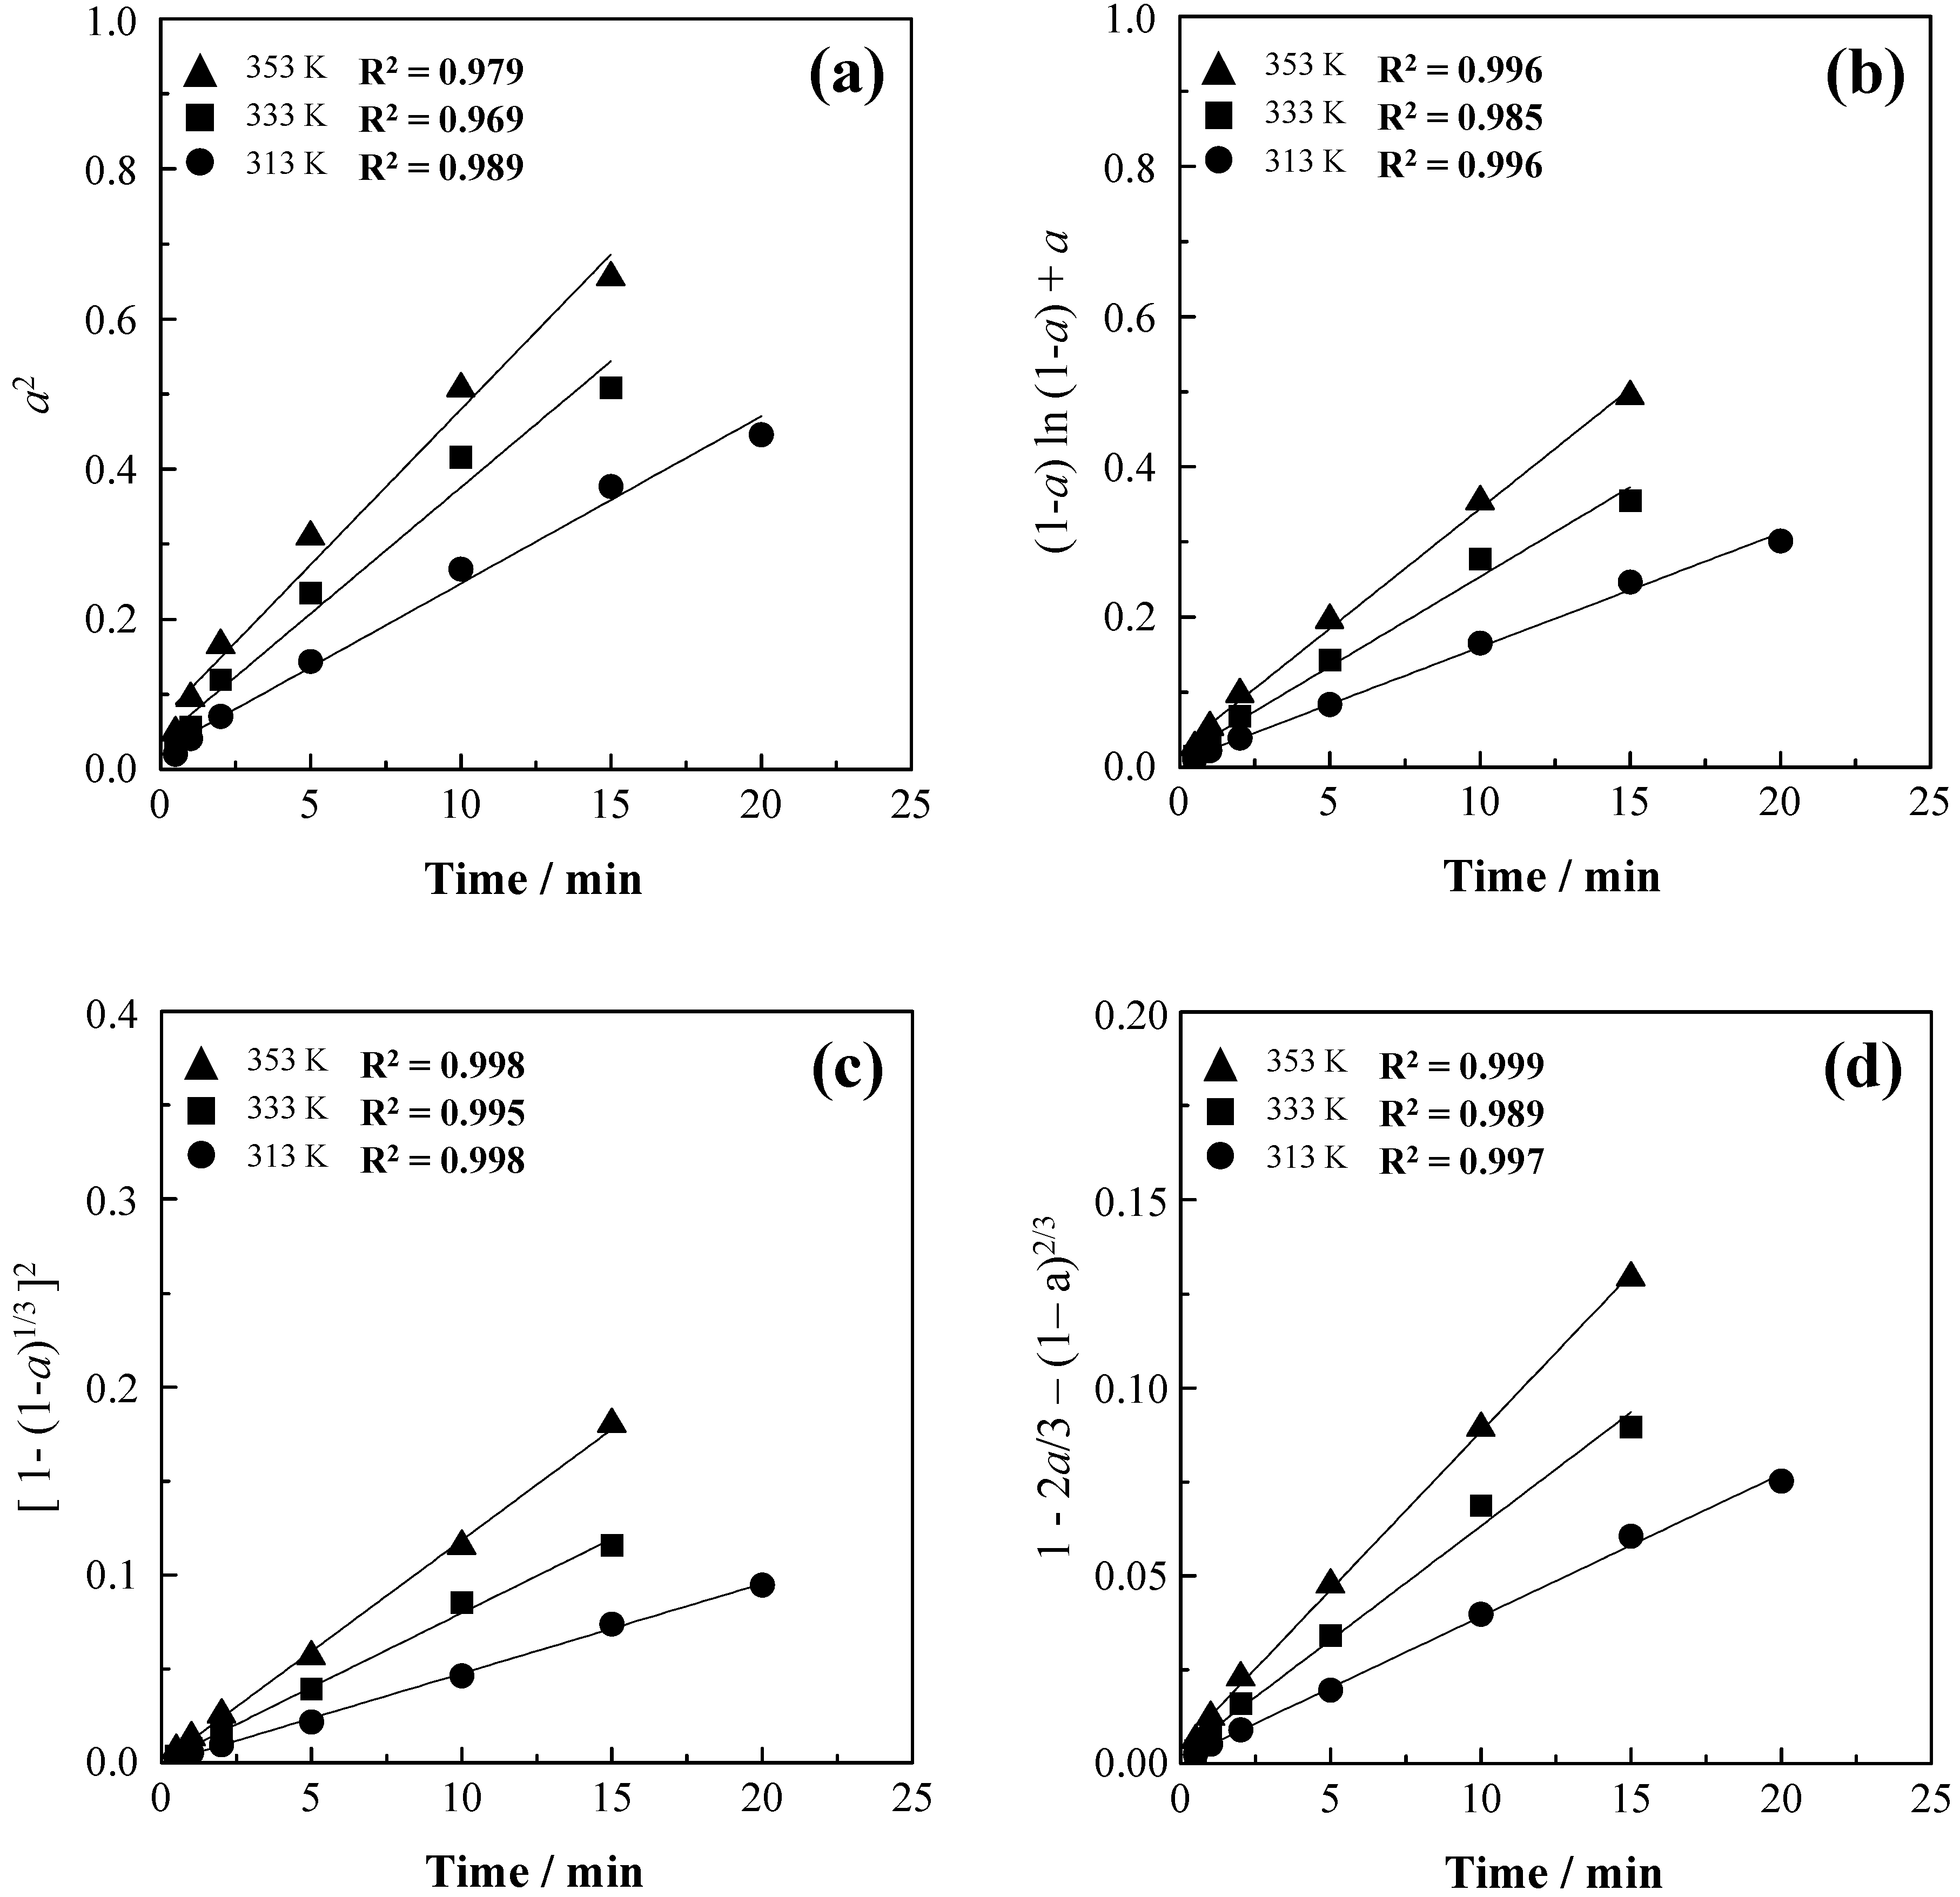
To investigate the relation between m-values and correlation coefficients (R2), zinc extraction at varying agitation speeds, initial H2SO4 concentrations, particle sizes, and temperatures were analyzed according to kinetic equations D1, D2, D3, and D4, respectively, which are shown in Table 3. These expressions were plotted with respect to the reaction time, and the dependence of these diffusion models on the kinetic data was evaluated from R2. The plots of each kinetic equation, that is, D1, D2, D3, and D4, versus reaction time under various conditions are shown in Figure 7, Figure 8, Figure 9 and Figure 10, respectively.
The plots of D1, D2, D3, and D4 versus reaction time at different H2SO4 concentrations show that D1 versus reaction time has a good linear relation at H2SO4 concentrations of 0.5 M and 1 M (m-values: 0.645 and 0.689, respectively) (Figure 9a). However, the leaching data for 0.05 M and 0.1 M H2SO4 (m-value: 0.578 and 0.560, respectively) did not fit well to D1 versus reaction time, as shown in Figure 9a.
Generally, the R2 values for Equations D2 and D4 versus reaction time are similar (Figure 7b,d, Figure 8b,d, Figure 9b,d and Figure 10b,d), because Equations D2 and D4 have the same m-values. In addition, D3 provided a better fit for the kinetic data compared to Equations D1, D2, and D4. On the other hand, Figure 7, Figure 8, Figure 9 and Figure 10 had smaller R2 values for equation D1 versus reaction time those of D2, D3, and D4 versus reaction time for the case of zinc leaching. This may be because the m-values that were calculated using D2, D3, and D4 are in the range of 0.507 to 0.579, which is close to the m-values determined by D2, D3, and D4, as shown in Table 3.
These results indicate that D2 and D4 provide better fits to the kinetic data than D1. However, the model provided by D3 showed the best fit in all of the experiments. Therefore, this model was chosen to describe the zinc extraction from MOVs during H2SO4 leaching.
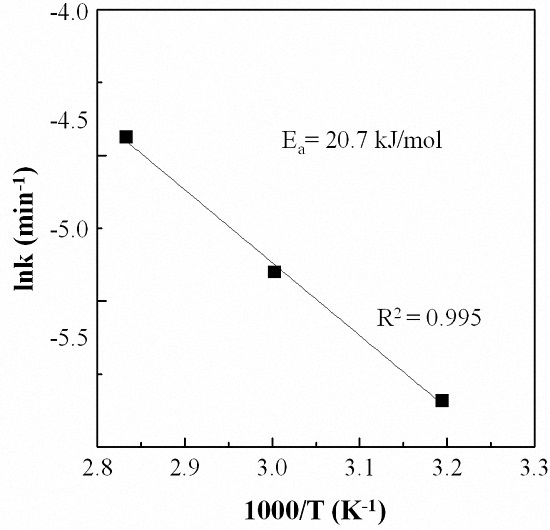
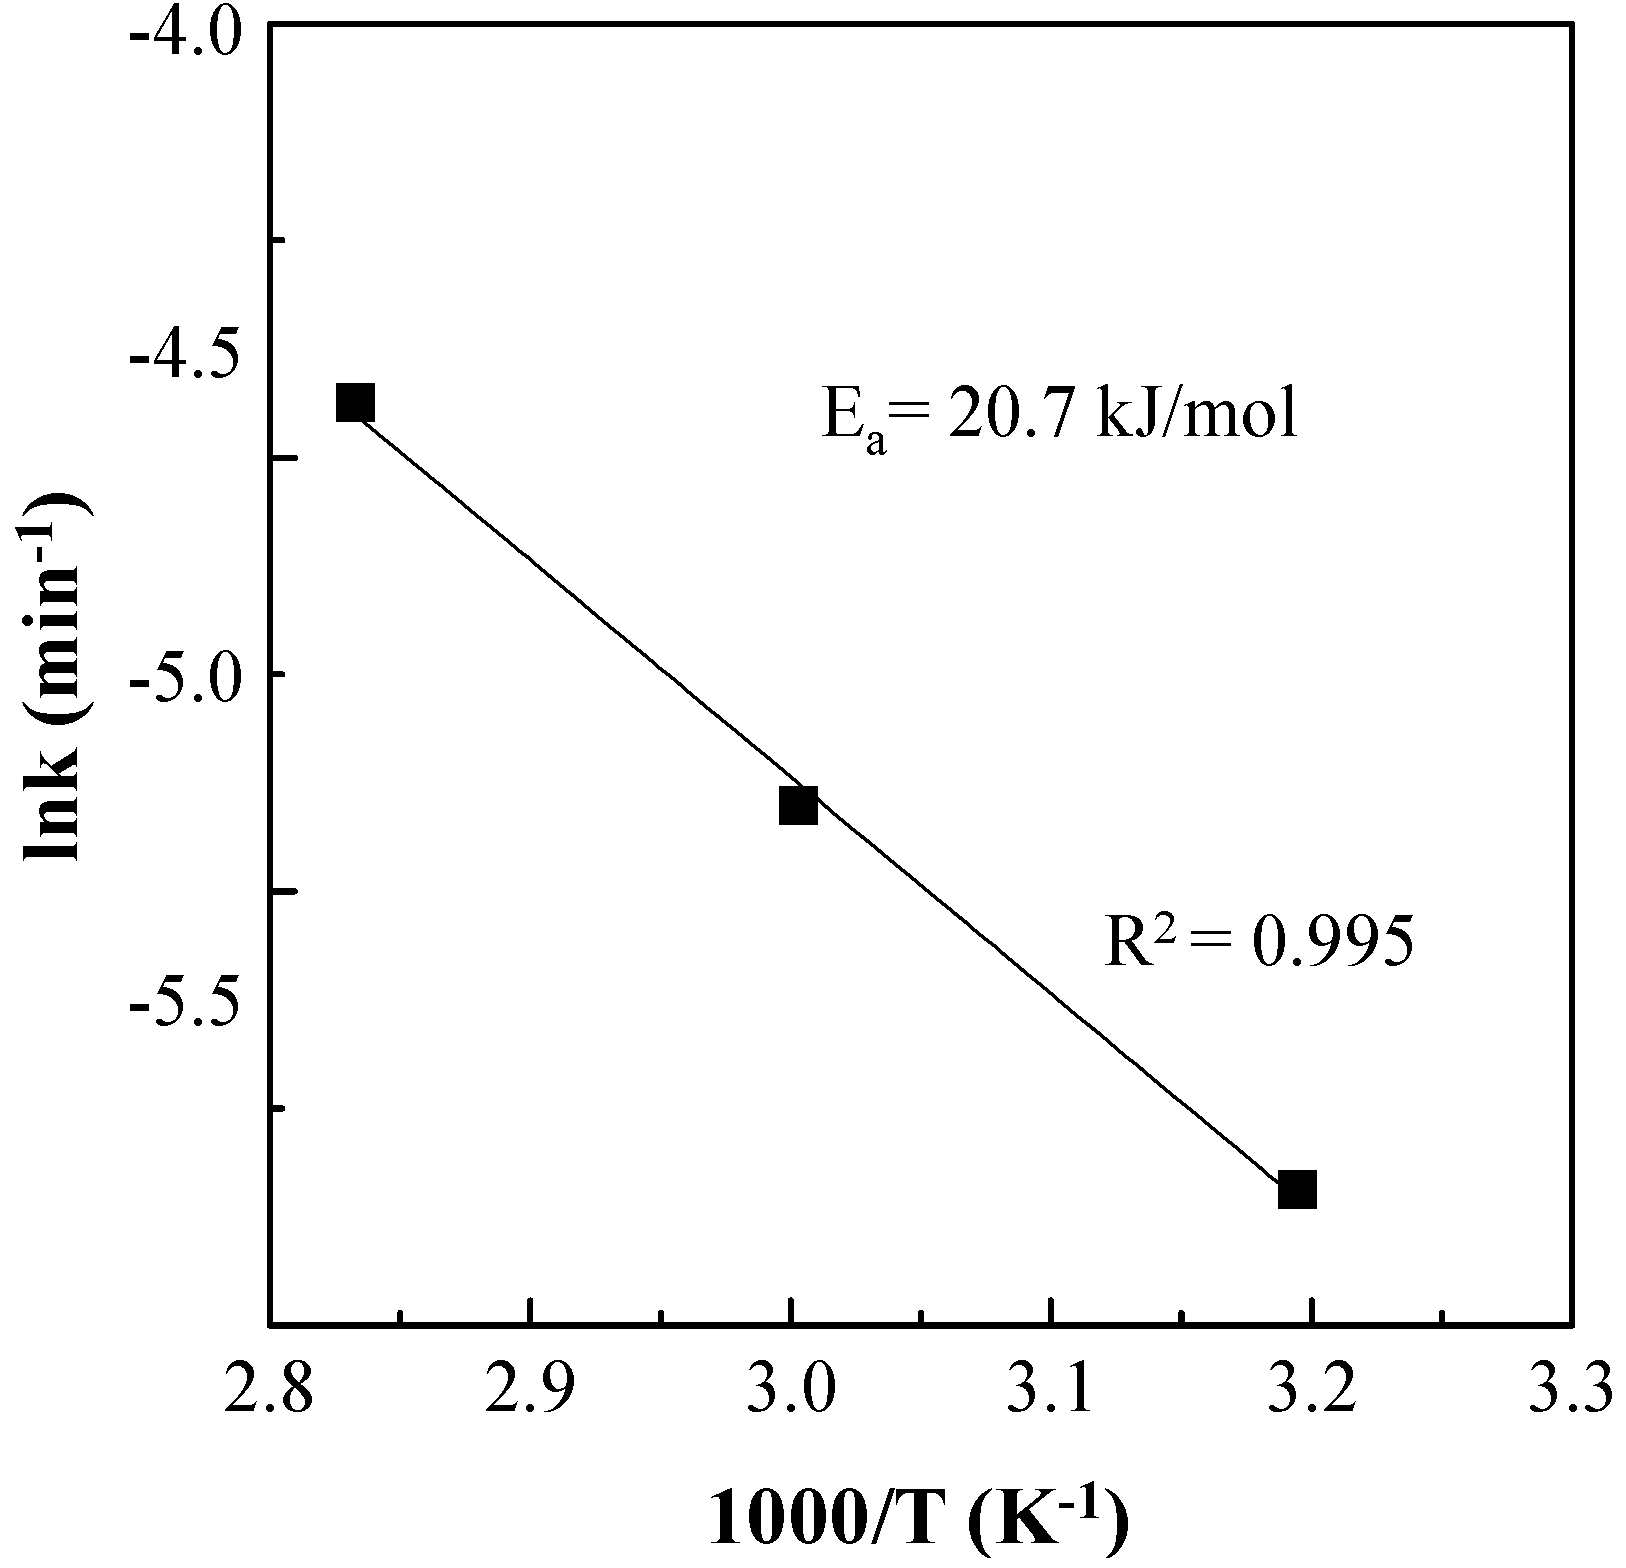
The Arrhenius plot constructed with the rate constant value, k, calculated from the data is presented in Figure 10c. The activation energy of zinc leaching by 0.1 M H2SO4 is 20.7 kJ/mol is in the temperature range of 313 K to 353 K (Figure 11).
Depending on the activation energy value, the heterogeneous reaction mechanism can be diffusion controlled or chemical reaction controlled. Activation energy values lower than 20 kJ/mol usually indicate a diffusion-controlled process, whereas the activation energy of chemical reaction-controlled processes is approximately 50 to 100 kJ/mol [16,17]. The activation energy value obtained in this study for Zn leaching is close to 20 kJ/mol, suggesting a diffusion-controlled process. This confirms that the leaching mechanism is controlled by ash layer diffusion.
4. Conclusions
The leaching kinetics of zinc from zinc oxide based metal oxide varistors (MOVs) were investigated as a function of the H2SO4 concentration, reaction time, agitation speed, and temperature. It was found that an agitation speed above 300 rpm was sufficient to eliminate the effect of this variable on the leaching rate and that the extent of zinc extraction increased with the H2SO4 concentration.
In the plots of −ln[ln(1 − a)] versus lnt, the m-values increased with increasing initial H2SO4 concentrations, from 0.578 to 0.689. These results suggest that the diffusion mechanism changes with the H2SO4 concentration. Except when the H2SO4 concentration was used as the varying condition, the m-values remained almost constant at varying agitation speeds (m-values: 0.554–0.579), particle sizes (m-values: 0.507–0.560), and reaction temperatures (m-values: 0.530–0.560). It is reasonable to conclude that the extraction of zinc seems to be a diffusion-controlled process because all of the m-values in these experiments were below 0.70.
The experimental data agreed quite well with the model described by the D3 kinetic equation:
[1 − (1 − a)1/3]2 = kt
The results of the leaching kinetics experiments show that the zinc leaching process is controlled by ash layer diffusion with an activation energy of 20.7 kJ/mol.
Acknowledgments
This work was supported by the Korea Institute of Energy Technology Evaluation and Planning (KETEP) and the Ministry of Trade, Industry & Energy (MOTIE) of the Republic of Korea (No. 20165010100810).
Author Contributions
Jaeryeong Lee and Youngjin Kim conceived and designed the experiments; Youngjin Kim performed the Leaching experiments and analyzed the ICP data; Youngjin Kim wrote the paper; Jaeryeong Lee modified the paper before submission.
Conflicts of Interest
The authors declare no conflict of interest.
References
- Nakamura, T. E-scrap recycling system and technologies in Japan. Geosyst. Eng. 2014, 17, 104–112. [Google Scholar] [CrossRef]
- Lee, D.J.; Yoo, C.S. Predicting a promising fusion technology in geoscience and mineral resources engineering using Korean patent data. Geosyst. Eng. 2014, 17, 34–42. [Google Scholar] [CrossRef]
- Jeon, S.H.; Park, I.H.; Yoo, K.K.; Ryu, H.J. The effects of temperature and agitation speed on the leaching behaviors of tin and bismuth from spent lead free solder in nitric acid leach solution. Geosyst. Eng. 2015, 18, 213–218. [Google Scholar] [CrossRef]
- Oishi, T.; Koyama, K.; Alam, S.; Tanaka, M.; Lee, J.C. Recovery of high purity copper cathode from printed circuit boards using ammoniacal sulfate or chloride solutions. Hydrometallurgy 2007, 89, 82–88. [Google Scholar] [CrossRef]
- Han, K.N.; Kellar, J.J.; Cross, W.M.; Safarzadeh, S. Opportunities and challenges for treating rare-earth elements. Geosyst. Eng. 2014, 17, 178–194. [Google Scholar] [CrossRef]
- Mecucci, A.; Scott, K. Leaching and electrochemical recovery of copper, lead and tin from scrap printed circuit boards. J. Chem. Technol. Biot. 2002, 77, 449–457. [Google Scholar] [CrossRef]
- Veit, H.M.; Diehl, T.R.; Salami, A.P.; Rodrigues, J.D.S.; Bernardes, A.M.; Tenório, J.A.S. Utilization of magnetic and electrostatic separation in the recycling of printed circuit boards scrap. Waste. Manag. 2005, 25, 67–74. [Google Scholar] [CrossRef] [PubMed]
- Ganji, S.M.S.A.; Shafaei, S.Z.; Goudarzi, N.; Azizi, A. Investigating the best mixture extraction systems in the separation of rare earth elements from nitric acid solution using Cyanex272, D2EHPA, and 8-Hydroxyquinoline. Geosyst. Eng. 2016, 19, 32–38. [Google Scholar] [CrossRef]
- Eswaraiah, C.; Kavitha, T.; Vidyasagar, S.; Narayanan, S.S. Classification of metals and plastics from printed circuit boards (PCB) using air classifier. Chem. Eng. Process. Process Intensif. 2008, 47, 565–576. [Google Scholar] [CrossRef]
- Cui, J.; Forssberg, E. Mechanical recycling of waste electric and electronic equipment: A review. J. Hazard. Mater. 2003, 99, 243–263. [Google Scholar] [CrossRef]
- Li, J.; Lu, H.; Guo, J.; Xu, Z.; Zhou, Y. Recycle technology for recovering resources and products from waste printed circuit boards. Environ. Sci. Technol. 2007, 41, 1995–2000. [Google Scholar] [CrossRef] [PubMed]
- Lee, J.R.; Kim, Y.J.; Lee, J.C. Disassembly and physical separation of electric/electronic components layered in printed circuit boards (PCB). J. Hazard. Mater. 2012, 241, 387–394. [Google Scholar] [CrossRef] [PubMed]
- Levinson, L.M.; Philipp, H.R. Zinc oxide varistors—A review. Am. Ceram. Soc. Bull. 1986, 65, 639–646. [Google Scholar]
- Li, Y.; Li, G.; Yin, Q. Preparation of ZnO varistors by solution nano-coating technique. Mater. Sci. Eng. B 2006, 130, 264–268. [Google Scholar] [CrossRef]
- Gutknecht, T.; Gustafsson, A.; Forsgren, C.; Ekberg, C.; Steenari, B.M. Investigations into Recycling Zinc from Used Metal Oxide Varistors via pH Selective Leaching: Characterization, Leaching, and Residue Analysis. Sci. World. J. 2015. [Google Scholar] [CrossRef] [PubMed]
- Yoshida, T. Leaching of zinc oxide in acidic solution. Mater. Trans. 2003, 44, 2489–2493. [Google Scholar] [CrossRef]
- Erdem, M.; Yurten, M. Kinetics of Pb and Zn leaching from zinc plant residue by sodium hydroxide. J. Min. Metall. Sect. B Metall. 2015, 51, 89–95. [Google Scholar] [CrossRef]
- Souza, A.D.; Pina, P.S.; Lima, E.V.O.; da Silva, C.A.; Leão, V.A. Kinetics of sulphuric acid leaching of a zinc silicate calcine. Hydrometallurgy 2007, 89, 337–345. [Google Scholar] [CrossRef]
- Liao, Y.; Zhou, J.; Huang, F.; Wang, Y. Leaching kinetics of calcification roasting calcinate from multimetallic sulfide copper concentrate containing high content of lead and iron. Sep. Purif. Technol. 2015, 149, 190–196. [Google Scholar] [CrossRef]
- Kim, E.Y.; Lee, J.C.; Kim, B.S.; Kim, M.S.; Jeong, J.K. Leaching behavior of nickel from waste multi-layer ceramic capacitors. Hydrometallurgy 2007, 86, 89–95. [Google Scholar] [CrossRef]
- Rao, S.; Yang, T.; Zhang, D.; Liu, W.; Chen, L.; Hao, Z.; Xiao, Q.; Wen, J. Leaching of low grade zinc oxide ores in NH4Cl-NH3 solutions with nitrilotriacetic acid as complexing agents. Hydrometallurgy 2015, 158, 101–106. [Google Scholar] [CrossRef]
- Levenspiel, O. Chemical Reaction Engineering, 3rd ed.; John Wiley & Sons Int.: New York, NY, USA, 1999; pp. 566–586. [Google Scholar]
- Hancock, J.D.; Sharp, J.H. Method of Comparing Solid-State Kinetic Data and Its Application to the Decomposition of Kaolinite, Brucite, and BaCO3. J. Am. Ceram. Soc. 1972, 55, 74–77. [Google Scholar] [CrossRef]
- Sharp, J.H.; Brindley, G.W.; Achar, B.N.N. Numerical data for some commonly used solid stat reaction equations. J. Am. Ceram. Soc. 1966, 49, 379–382. [Google Scholar] [CrossRef]
- Baik, S.W.; Shibayama, A.; Murata, K.; Fujita, T. The effect of underwater explosion on the kinetics of alkaline leaching of roasted tungsten carbide scraps for recycling. Int. J. Soc. Mater. Eng. Resour. 2004, 12, 55–59. [Google Scholar] [CrossRef]
Figure 1.
XRD patterns of the MOVs used in this research.

Figure 2.
Effect of agitation speed on zinc leaching (initial H2SO4 concentration: 0.1 M; temperature: 333 K; particle size: 53–105 μm; pulp density: 10 g/L).
Figure 2.
Effect of agitation speed on zinc leaching (initial H2SO4 concentration: 0.1 M; temperature: 333 K; particle size: 53–105 μm; pulp density: 10 g/L).
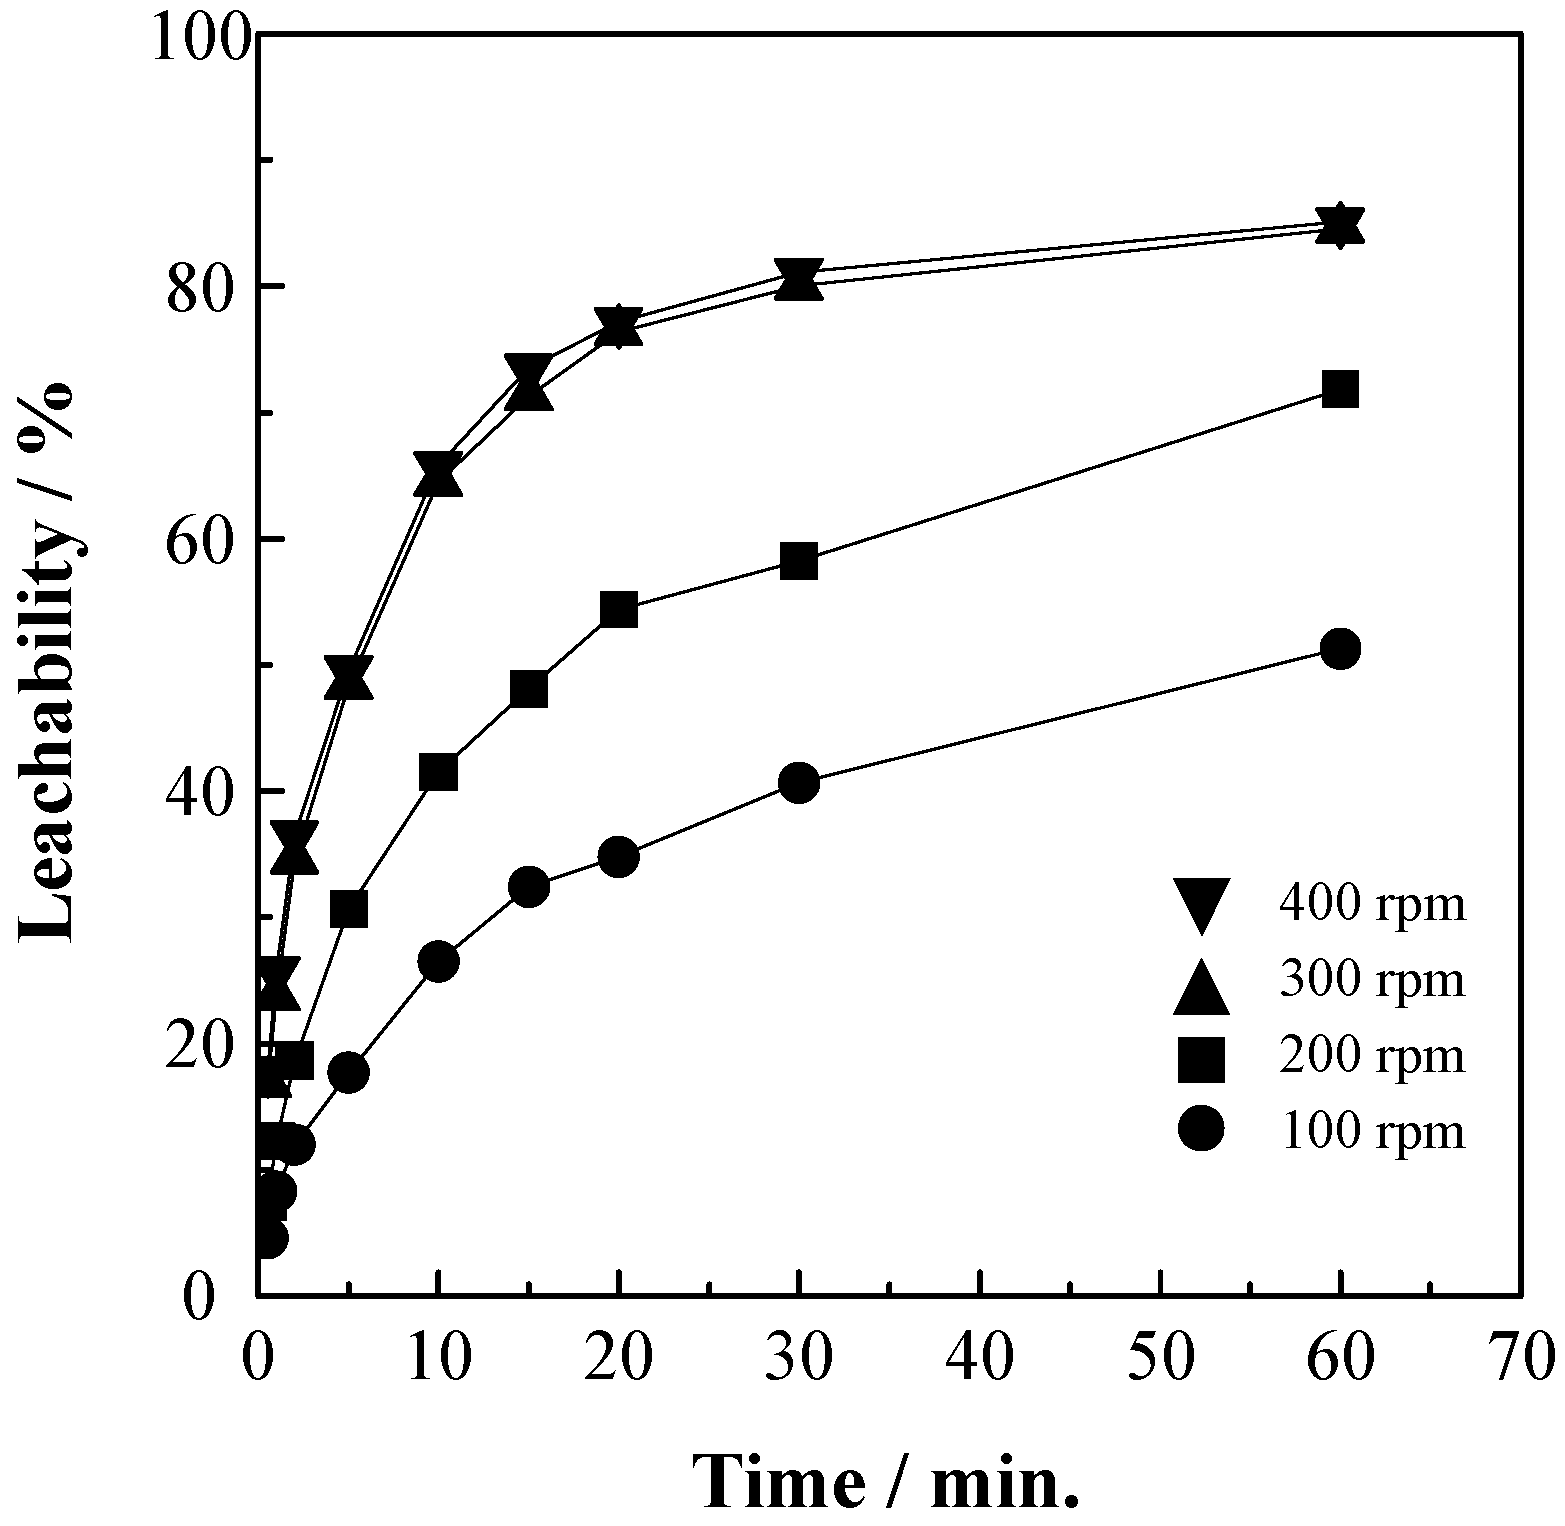
Figure 3.
Effect of particle size on zinc leaching (agitation speed: 300 rpm; initial H2SO4 concentration: 0.1 M; reaction temperature: 333 K; pulp density: 10 g/L).
Figure 3.
Effect of particle size on zinc leaching (agitation speed: 300 rpm; initial H2SO4 concentration: 0.1 M; reaction temperature: 333 K; pulp density: 10 g/L).

Figure 4.
Effect of initial H2SO4 concentration on zinc leaching (agitation speed: 300 rpm; reaction temperature: 333 K; particle size: 53–105 μm; pulp density: 10 g/L).
Figure 4.
Effect of initial H2SO4 concentration on zinc leaching (agitation speed: 300 rpm; reaction temperature: 333 K; particle size: 53–105 μm; pulp density: 10 g/L).
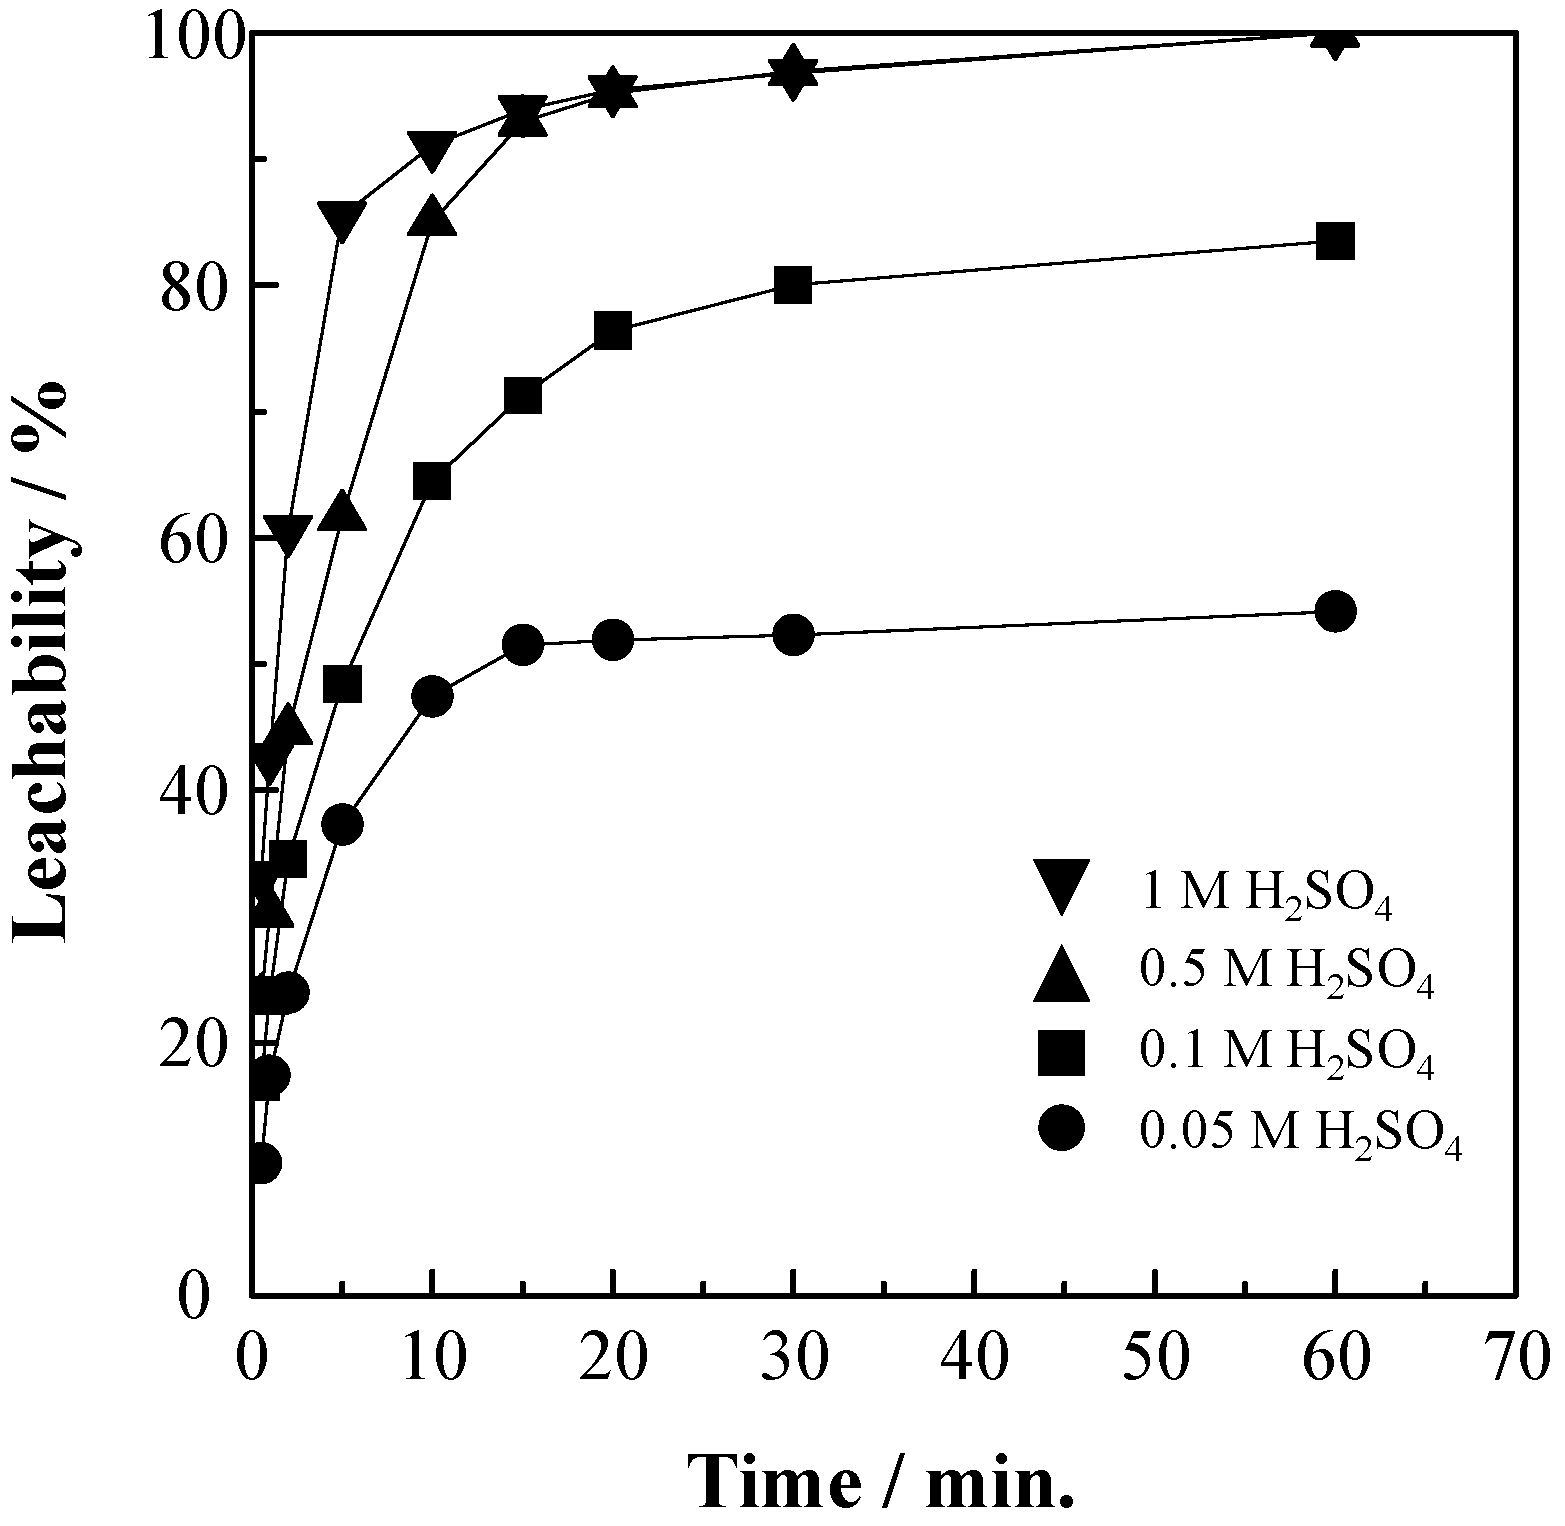
Figure 5.
Effect of leaching temperature on zinc leaching (initial H2SO4 concentration: 0.1 M; agitation speed: 300 rpm; particle size: 53–105 μm; pulp density: 10 g/L).
Figure 5.
Effect of leaching temperature on zinc leaching (initial H2SO4 concentration: 0.1 M; agitation speed: 300 rpm; particle size: 53–105 μm; pulp density: 10 g/L).
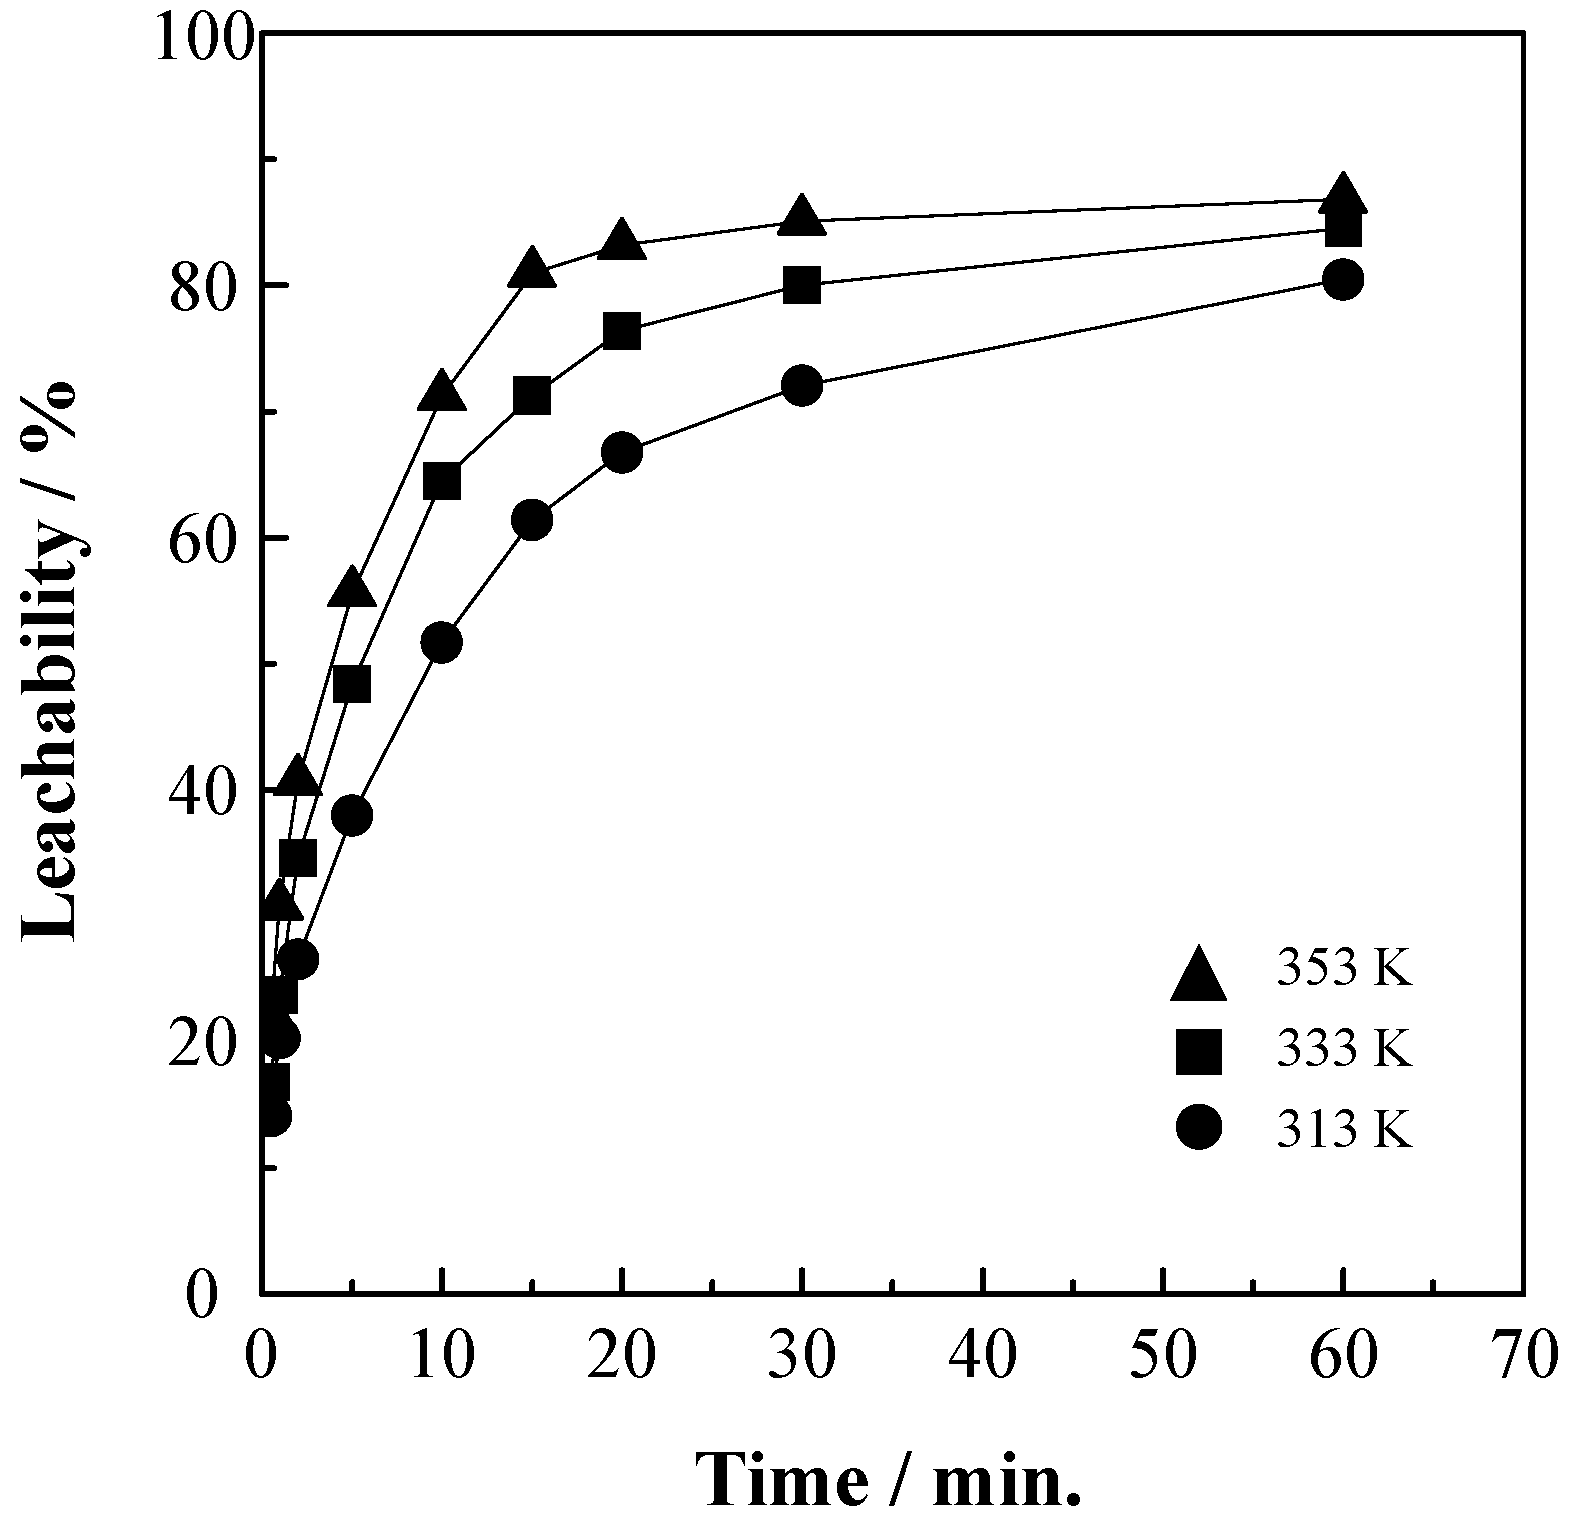
Figure 6.
−ln[ln(1 − a)] vs. lnt plot for estimating the mechanism of zinc leaching in a H2SO4 solution. (a) Plot of the results from Figure 2 according to Equation (2); (b) plot of the results from Figure 3 according to Equation (2); (c) plot of the results from Figure 4 according to Equation (2); (d) plot of the results from Figure 5 according to Equation (2).

Figure 7.
Plots of the diffusion equations vs. time for different agitation speeds according to Figure 2. (a) Plot of the results from Figure 2 according to Equation D1; (b) plot of the results from Figure 2 according to Equation D2; (c) plot of the results from Figure 2 according to Equation D3; (d) plot of the results from Figure 2 according to Equation D4.
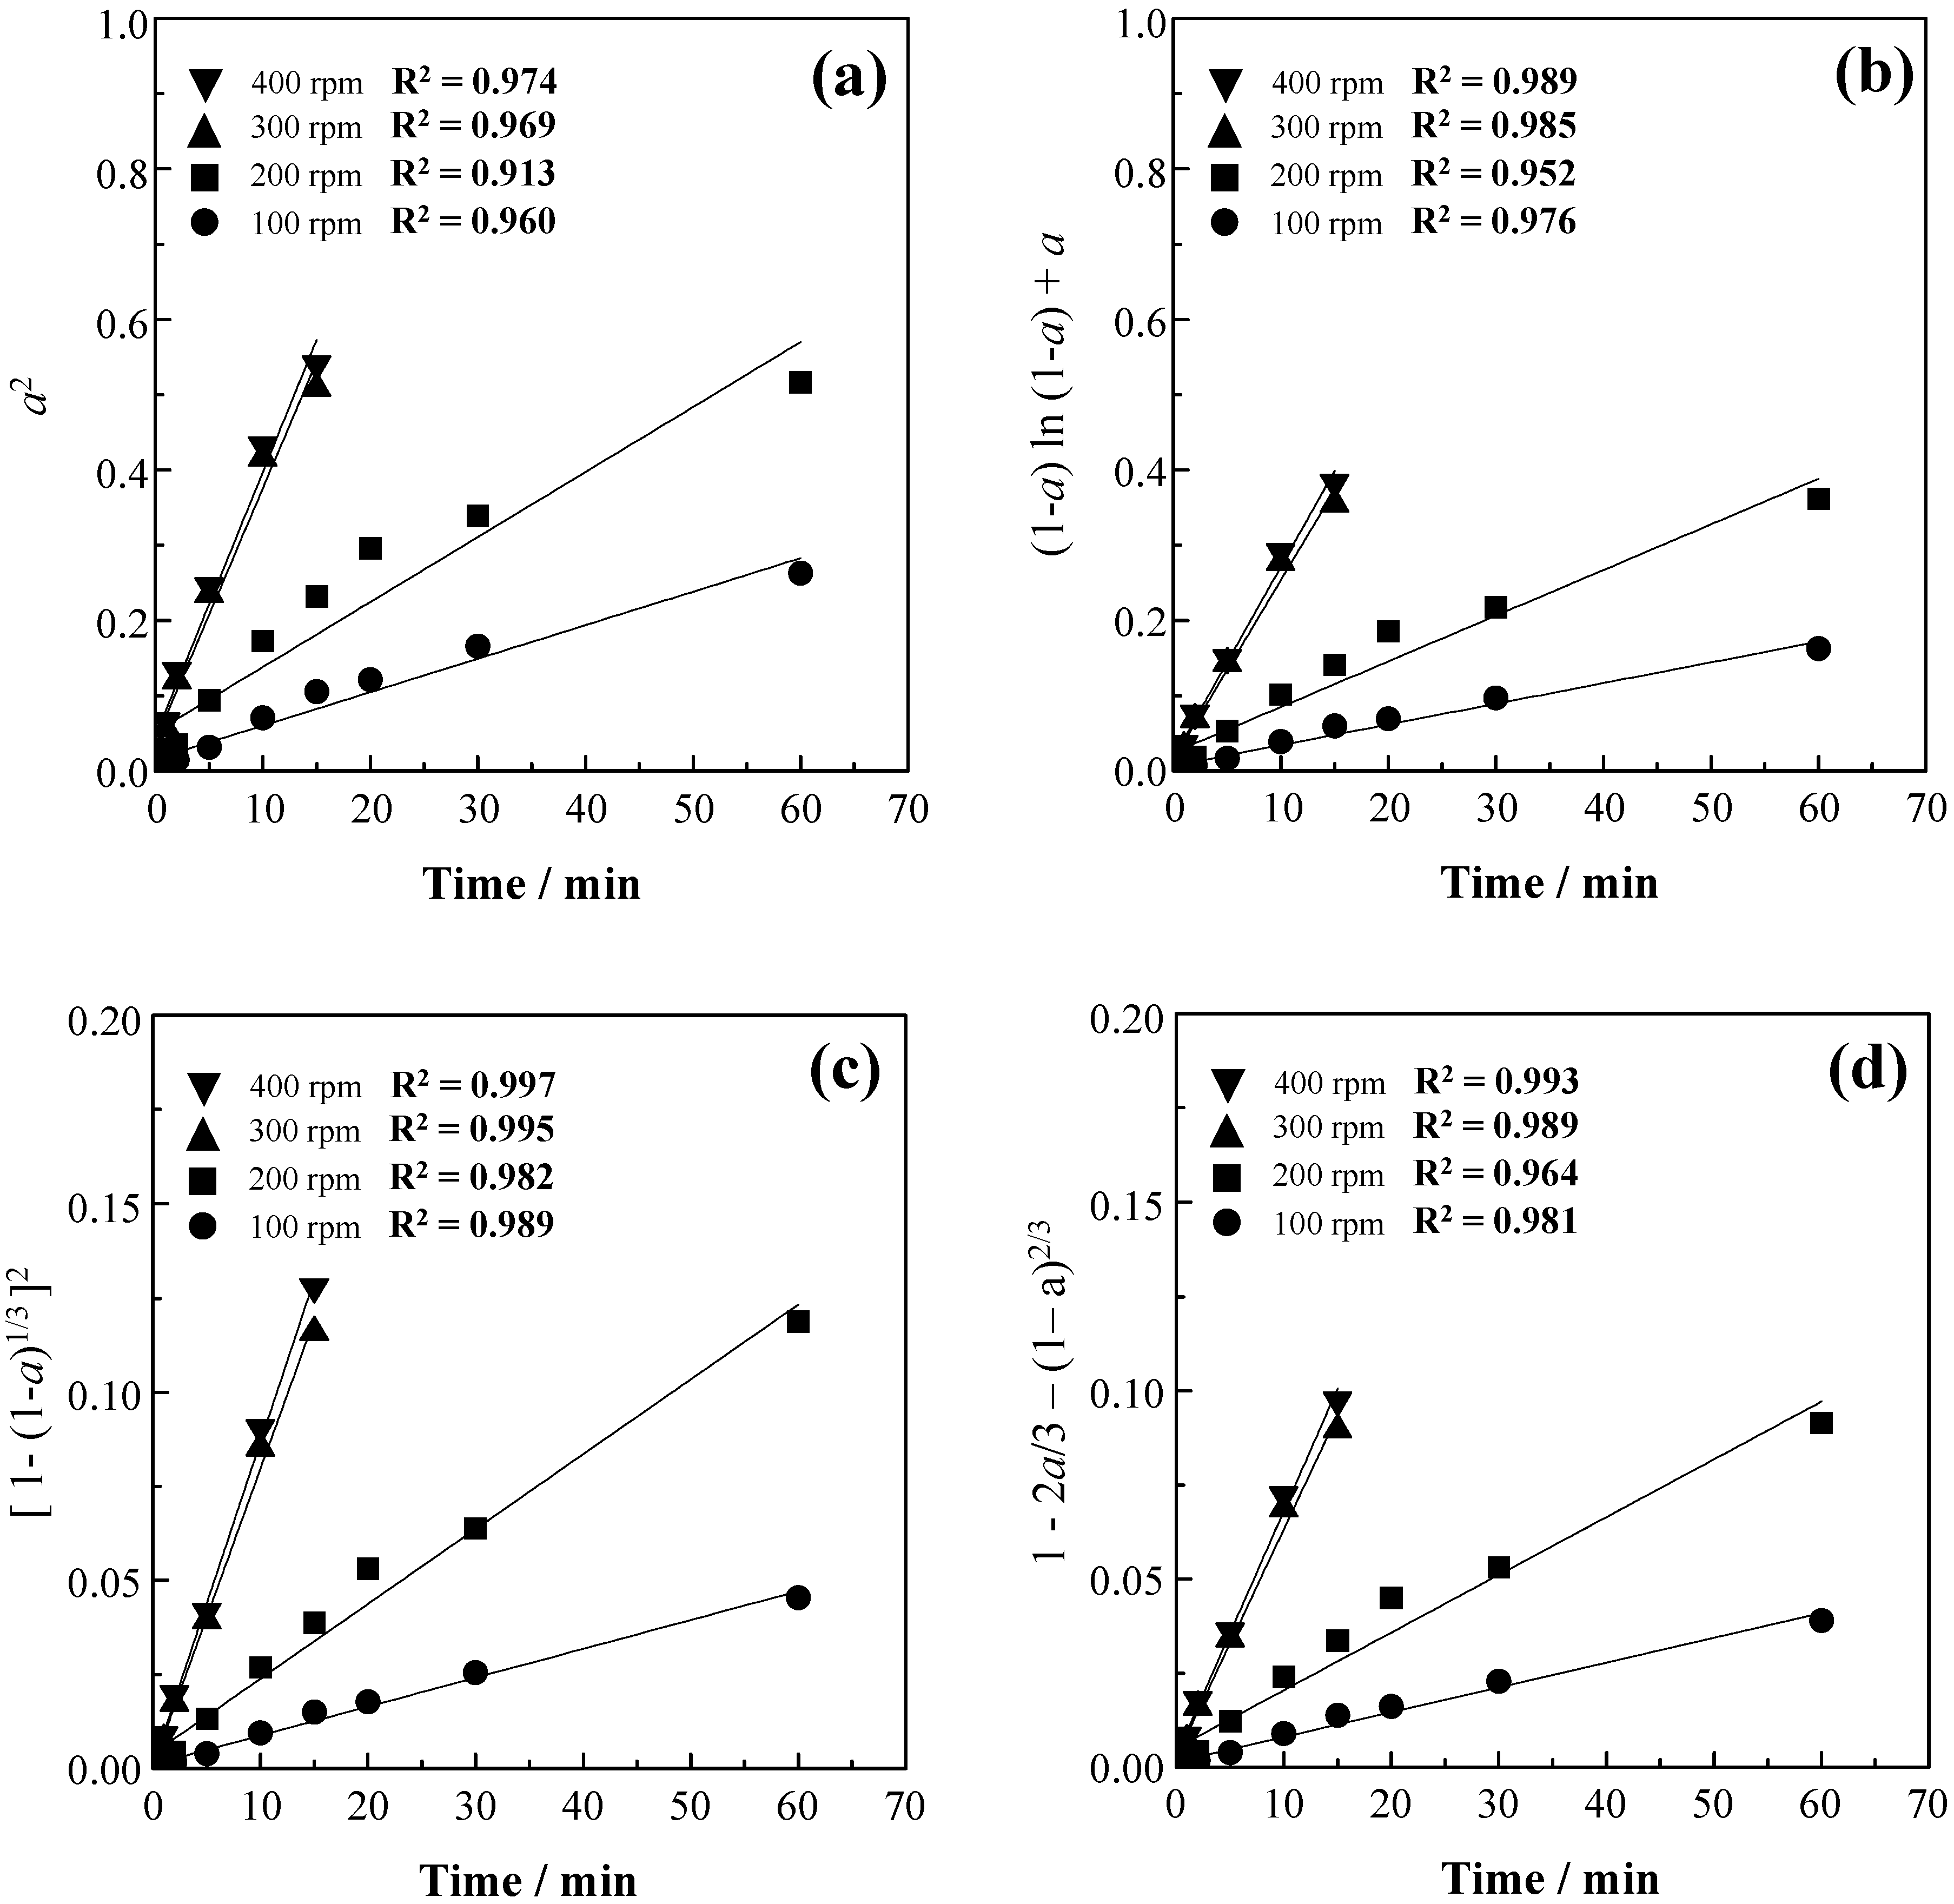
Figure 8.
Plots of the diffusion equations vs. time for different particle sizes according to Figure 3. (a) Plot of the results from Figure 3 according to Equation D1; (b) plot of the results from Figure 3 according to Equation D2; (c) plot of the results from Figure 3 according to Equation D3; (d) plot of the results from Figure 3 according to Equation D4.
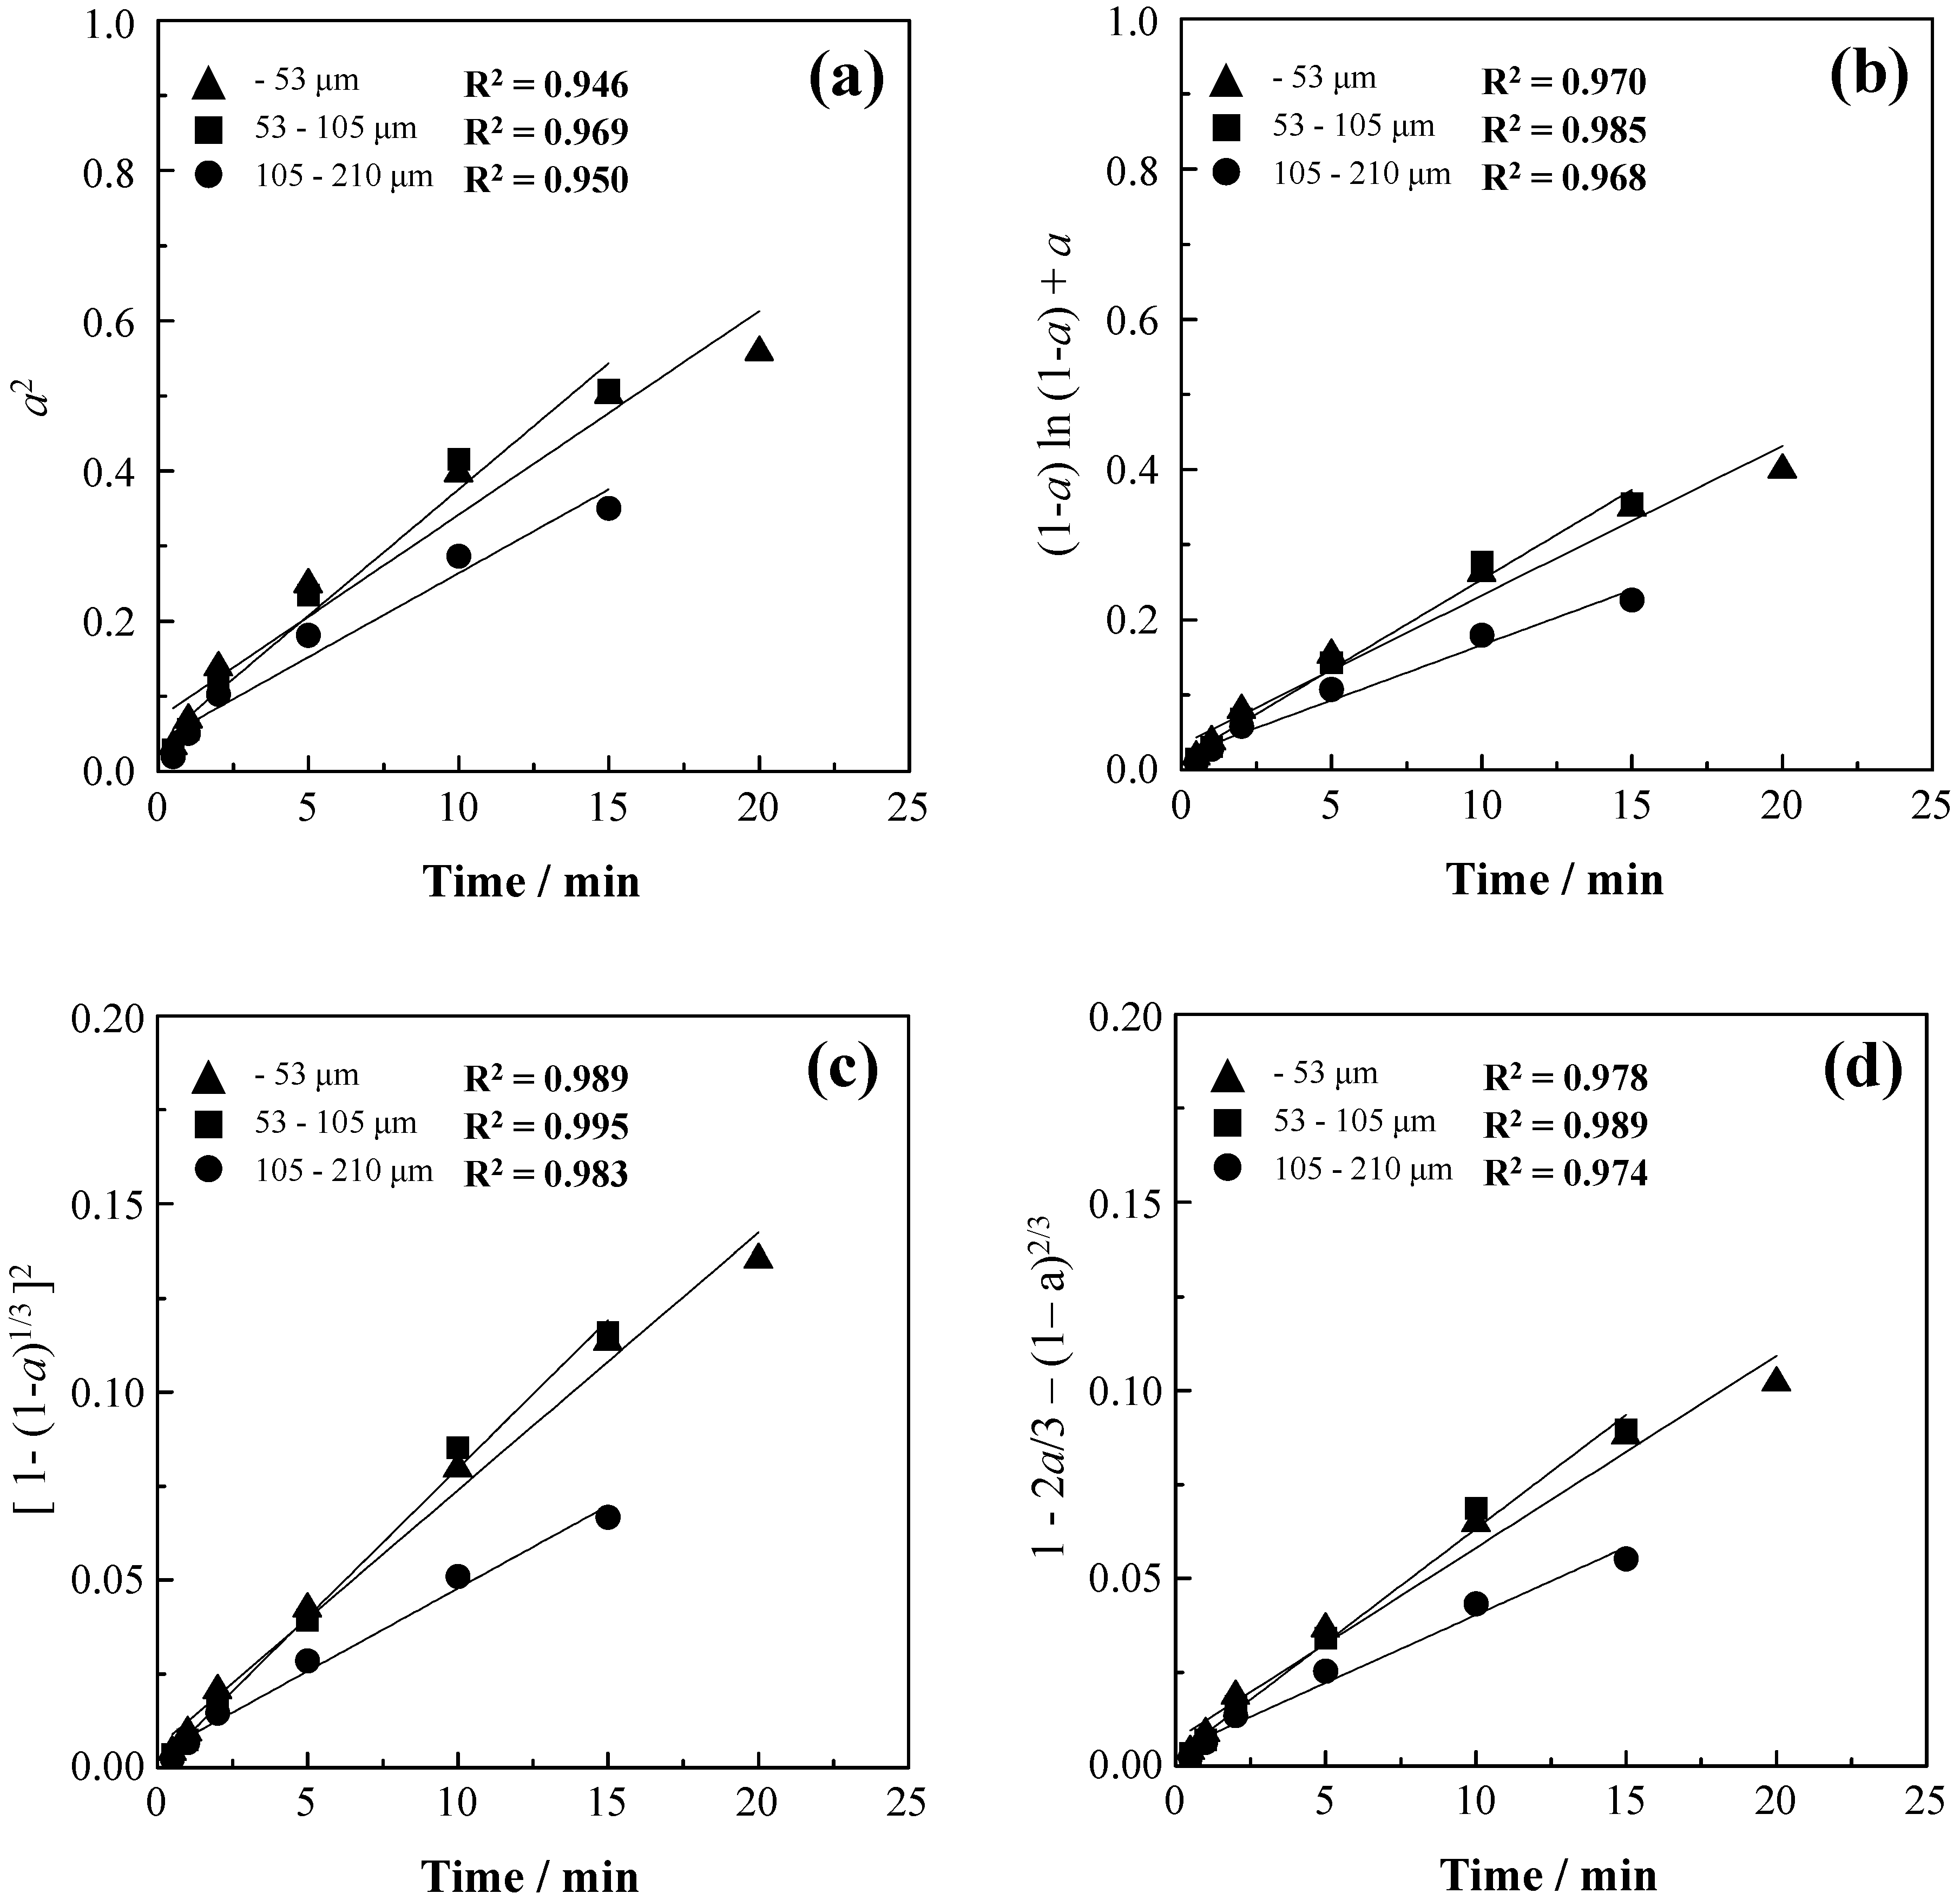
Figure 9.
Plots of the diffusion equations vs. time for different initial H2SO4 concentrations according to Figure 4. (a) Plot of the results from Figure 4 according to Equation D1; (b) plot of the results from Figure 4 according to Equation D2; (c) plot of the results from Figure 4 according to Equation D3; (d) plot of the results from Figure 4 according to Equation D4.

Figure 10.
Plots of the diffusion equations vs. time for different temperatures according to Figure 5. (a) Plot of the results from Figure 5 according to Equation D1; (b) plot of the results from Figure 5 according to Equation D2; (c) plot of the results from Figure 5 according to Equation D3; (d) plot of the results from Figure 5 according to Equation D4.

Figure 11.
Arrhenius plot of the apparent rate constant.


| Metal | Zn | Sb | Bi | Co | Al | Ni | Sn | Ag | Ca | Mn |
|---|---|---|---|---|---|---|---|---|---|---|
| wt. % | 70.97 | 2.76 | 1.83 | 0.77 | 0.58 | 0.44 | 0.43 | 0.41 | 0.33 | 0.33 |
| Particle Size | 105–210 μm | 53–105 μm | −53 μm |
|---|---|---|---|
| wt. % | 63.80 | 72.01 | 72.73 |
| Notation | Reaction Mechanism | Equation | m |
|---|---|---|---|
| D1 | Diffusion | a2 = kt | 0.62 |
| D2 | Diffusion | (1 − a)ln(1 − a) + a = kt | 0.57 |
| D3 | Diffusion | [1 − (1 − a)1/3]2 = kt | 0.54 |
| D4 | Diffusion | 1 − 2a/3 − (1− a)2/3 = kt | 0.57 |
| F0 | Zero order | a = kt | 1.24 |
| F1 | First order reaction | −ln (1 − a) = kt | 1.00 |
| R2 | Interface reaction (contracting area) | 1 − (1 − a)1/2 = kt | 1.11 |
| R3 | Interface reaction (contracting volume) | 1 − (1 − a)1/3 = kt | 1.07 |
| A2 | Nucleation and growth | [−ln (1 − a)]1/2 = kt | 2.0 |
| A3 | Nucleation and growth | [−ln (1 − a)]1/3 = kt | 3.0 |
© 2016 by the authors; licensee MDPI, Basel, Switzerland. This article is an open access article distributed under the terms and conditions of the Creative Commons Attribution (CC-BY) license (http://creativecommons.org/licenses/by/4.0/).
Share and Cite
MDPI and ACS Style
Kim, Y.; Lee, J. Leaching Kinetics of Zinc from Metal Oxide Varistors (MOVs) with Sulfuric Acid. Metals 2016, 6, 192. https://doi.org/10.3390/met6080192
AMA Style
Kim Y, Lee J. Leaching Kinetics of Zinc from Metal Oxide Varistors (MOVs) with Sulfuric Acid. Metals. 2016; 6(8):192. https://doi.org/10.3390/met6080192
Chicago/Turabian StyleKim, Youngjin, and Jaeryeong Lee. 2016. "Leaching Kinetics of Zinc from Metal Oxide Varistors (MOVs) with Sulfuric Acid" Metals 6, no. 8: 192. https://doi.org/10.3390/met6080192
Note that from the first issue of 2016, this journal uses article numbers instead of page numbers. See further details here.