
Serration Behavior in Pd77.5Cu6Si16.5 Alloy

College of Materials Science and Engineering, Taiyuan University of Technology, Taiyuan 030024, China
*
Author to whom correspondence should be addressed.
Metals 2016, 6(8), 191; https://doi.org/10.3390/met6080191
Submission received: 18 May 2016
/
Revised: 1 August 2016
/
Accepted: 1 August 2016
/
Published: 17 August 2016
(This article belongs to the Special Issue High-Entropy Alloys (HEAs))
Abstract
:The strain-rate-dependent plasticity under uniaxial compression at the strain rates of 2 × 10⁻³, 2 × 10⁻⁴ and 2 × 10⁻⁵ s−1 in a Pd77.5Cu6Si16.5 alloy is investigated. At different strain rates, the serration events exhibit different amplitudes and time scales. The intersection effects take place obviously, and the loading time is much longer than the relaxation time in the serration event at three strain rates. However, the time intervals between two neighboring serrations lack any time scale, and the elastic energy density displays a power-law distribution at the strain rate of 2 × 10⁻³ s−1, which means that the self-organized critical (SOC) behavior emerges with increasing strain rates.

1. Introduction
As a new class of advanced metallic materials, high-entropy alloys (HEAs), with an equiatomic or a near equiatomic composition, have been researched extensively [1,2,3]. Different from traditional multicomponent alloys with a very complex microstructure, HEAs are capable of forming simple face-centered cubic (FCC) [4], body-centered cubic (BCC) [5] or hexagonal close-packed (HCP) phases [6,7] and, thus, possess some superior properties, such as high strength, high ductility, good corrosion resistance and thermal stability [1,8]. Recently, a new kind of alloy has been developed and named as high-entropy bulk metallic glass (HE-BMG), which has both the features of HEAs for their composition and those of metallic glasses for their noncrystalline structure. These alloys have a potential to open a new research field by utilizing the unique properties of HEAs and bulk metallic glasses (BMGs) in the near future [9,10,11].
Pd77.5Cu6Si16.5 is a multicomponent alloy with an amorphous structure. It was discovered in 1969, and this particular alloy is one of the first metallic glasses attainable in bulk form (casting thickness higher than 1 mm) [12]. It is reported that a large Poisson’s ration (ν = 0.41) [13] gives rise to good ductility for this alloy [14]. In addition, it is interesting that the serrated fluctuation behavior is presented on the stress-strain curve after a uniaxial compression test. This serrated flow behavior is widely investigated both in HEAs [15,16] and amorphous alloys [17]. In the crystalline alloys, the intermittent yielding exhibits temporal fluctuations during plastic deformation on the stress-strain curves [18], which is called the Portevin–Le Chatelier (PLC) effect [19]. The fluctuations are associated with the spatial localization of dislocations and the collective movement of dislocations in crystalline alloys [20]. Lacking dislocation-mediated plasticity in crystalline alloys at ambient temperature, the serrated flow on the stress-strain curve is known as repeated yielding during deformation, which is usually accompanied by shear-band formation and propagation [21,22,23,24]. The plastic deformation of amorphous alloy is known to be a spatially inhomogeneous flow process with strongly localized shear deformation [25,26]. Shear localization or shear band formation is generally recognized as a direct consequence of strain softening, i.e., an increment of strain applied to a local volume element softens that element, allowing continued local deformation at higher rates in amorphous alloy [27].
Recently, the statistical method is used to investigate the relationship between the plasticity and the internal state [28], which is beneficial to design alloys or applications in some specified condition. Wang et al. have found that the elastic energy density submits to a power-law distribution, which is characterized as self-organized critical (SOC) behavior at the strain rate of 2.5 × 10⁻⁵ s−1 [26]. It is reported that decreasing the strain rates to 2 × 10⁻⁴ s−1, the SOC behavior emerged during the serrated flow behavior of Pd75Si15Ag3Cu7 alloy [29]. The SOC state is characterized by the continuous propagation of shear bands near an upper strain rate boundary of plastic instability [30]. Based on the serration dynamics after yielding, the relationship between the strain-rate sensitivity and SOC behavior is revealed in this study. The serration dynamics in Pd-based multicomponent amorphous alloys, the amplitudes of serrations, compressive plasticity, as well as the SOC behavior of Pd77.5Cu6Si16.5 alloys at different strain rates during serrated flows are investigated by statistical dynamical analysis.
2. Experimental Procedure
Alloy ingots with a nominal composition of Pd77.5Cu6Si16.5 were prepared by arc-melting a mixture of pure metals (weight purity ≥99.9%) in a Ti-gettered argon atmosphere. To ensure the compositional homogeneity, each ingot was remelted at least four times. Rod-shaped samples with a diameter of 2 mm and a length of about 60 mm were prepared by suction casting into a water-cooled copper mold. Compressive testing specimens about 4 mm long were cut from the rod-like samples by a diamond saw with the cooling water and, then, carefully polished with an aspect ratio (height:diameter) of 2:1 to an accuracy of 5 μm. The uniaxial-compressive tests were conducted at the strain rates of 2 × 10⁻³, 2 × 10⁻⁴ and 2 × 10⁻⁵ s−1 at 298 K (room temperature) on the cylindrical specimens using an Instron 5969 materials-testing machine (Instron, Boston, MA, USA). The fracture surface of the specimens was observed using the scanning-electron microscopy (SEM) (Tescan, Brno, Czech) to identify fracture mechanisms.
3. Results and Discussion
Figure 1 shows the compressive engineering stress-strain curves at the strain rates of 2 × 10⁻³, 2 × 10⁻⁴ and 2 × 10⁻⁵ s−1 at ambient temperature. The yield stresses are 1715, 1742 and 1756 MPa, respectively, while the plastic strain is relatively low at different strain rates. It is reported that in a compression test at room temperature, the Pd81Si19 binary amorphous alloy exhibited a large plastic engineering strain of 82% and the plastic true strain of 170% [31]. Granata et al. have found that the better glass-forming ability was linked to the reduction of heterogeneities, whereas the thermal characteristics depended on the cooling rate and purification in Pd-based amorphous alloy, and the properties of fluxed specimens were improved not only by the reduction of heterogeneous nucleation, but also via modified cooling rates during fluxing for Pd77.5Cu6Si16.5 alloy [32]. It is obvious that the plastic strain increases with decreasing the strain rates. The serrated flow behavior is observed apparently, though the plastic strain is very low at the strain rate of 2 × 10⁻³ s−1. When the amorphous alloys yield, the serrated flows prevail until the final fracture, and the flow stress increases with the plastic deformation. One should note that the serration behavior displays obvious different plastic strain before final fracture at different strain rates, suggesting a rate dependence of the shear instability and ductility for Pd-based multicomponent amorphous alloys. Because of the amount of serrations is small, the magnitude of serrated flows presents an increasing tendency at the strain rate of 2 × 10⁻³ s−1. At larger strain rates, only before fracture, the large amplitudes of serrations could be found, and the other fluctuations are relatively stable after yielding. This will be discussed in detail in the following.
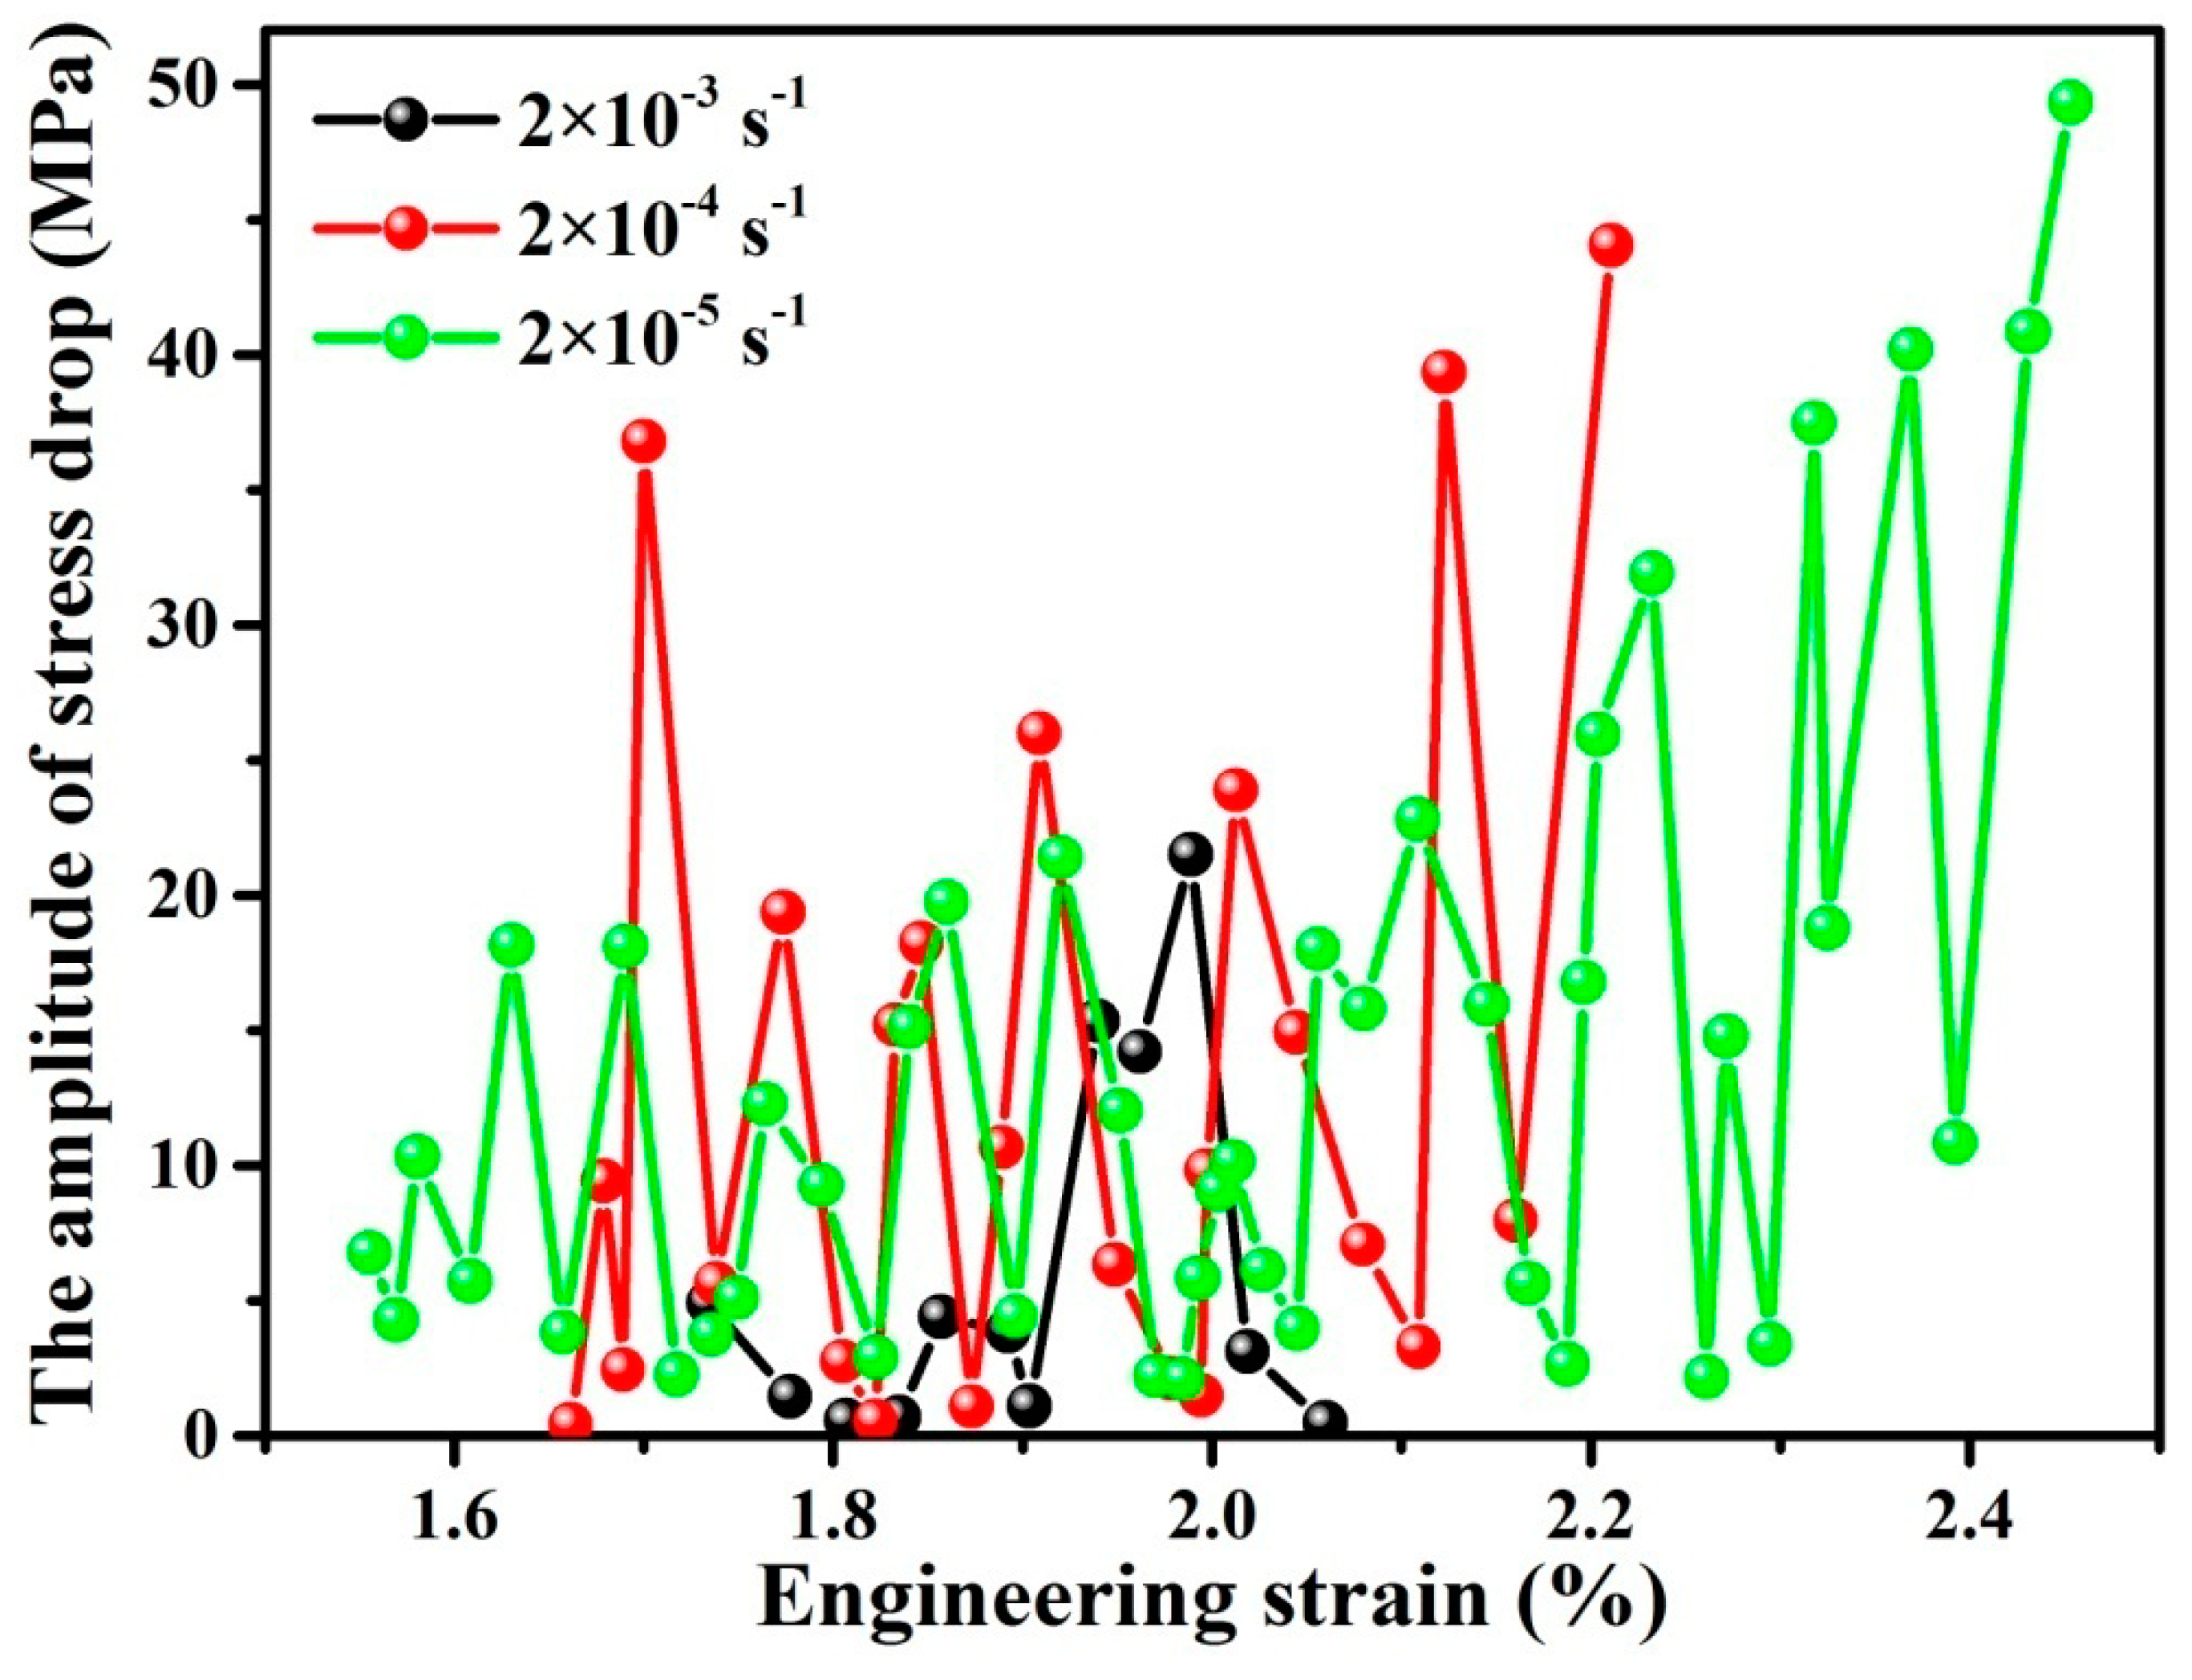
Figure 2 displays the amplitudes of stress drops versus strain curves at the strain rate of 2 × 10⁻³, 2 × 10⁻⁴ and 2 × 10⁻⁵ s−1. In the statistical analysis, the linear fitting is used to calculate the effect of the vibration of noise or a machine in the elastic deformation stage. Usually, the baseline is subtracted from the engineering stress-strain curve, and the stress vibration amplitude is approximately of 0.4 MPa in this study. That is to say, the serrations with amplitudes of stress drop larger than 0.4 MPa are selected, while the others are ignored. The amount of jerky flows is small at the strain rate of 2 × 10⁻³ s−1; most of the stress-drop amplitudes are lower than 5 MPa. Therefore, the average amplitude of the stress drops is 6 MPa. When the strain rates are 2 × 10⁻⁴ and 2 × 10⁻³ s−1, some larger stress-drop amplitudes are concentrated in the region of 30 to 50 MPa. Most of the stress-drop amplitudes range from 5 to 25 MPa. Recently, Qiao et al. [33] have proposed a model to predict the maximum amplitudes of the serration events by , where lv is the thickness of the shearing layer, E is the Young modulus of the BMG, ρ is the density, cp is the heat capacity, Tg is the glass-transition temperature, Tr is the room temperature with a value of about 298 K, a is the aspect ratio (a = H/D), D is the diameter and θ is the shear angle. Based on this model, the burst size is calculated approximately at 69 MPa.
It should be noted that this model is founded according to the transformation between the strain energy and heat, and the calculated result is the maximum value. From Figure 2, the largest stress-drop amplitude is about 50 MPa. Apparently, the larger stress drops could be observed at higher plastic strain. Namely, the larger burst size usually emerges at the end of the whole serrated flows. If the amplitudes become far larger than before, amorphous alloys will fail soon. In the present work, the serrated-flow amplitudes range from 5 to 25 MPa, and the serrated flow behavior goes through a stable state at this range. It is reported that the stable range is from 20 to 35 MPa at an aspect ratio of 1:1 for the Zr-based BMG compression test at the strain rate of 2 × 10⁻⁴ s−1 [34]. Owing to the change of the stress state, the burst size will increase with decreasing aspect ratios [33]. Furthermore, the average amplitudes of the serration behavior are 13 and 14 MPa at the strain rates of 2 × 10⁻⁴ and 2 × 10⁻⁵ s−1, respectively, which is in the same order of magnitude according to the predicted values by the above model.
The morphologies of the deformed samples are observed by SEM at different strain rates to explore the dynamic serrated flow behavior and fracture mechanisms. Figure 3 shows the enlarged profiles of the lateral surfaces near the fracture surface at the strain rate of 2 × 10⁻³ s−1, and the inset in Figure 3 is a part of the sample after failure. From the inset, it is clear that amorphous alloys fracture in a shear mode. A large number of shear bands distribute along the shear direction inhomogenously on the lateral surface. In addition, some secondary shear bands are formed among the primary shear bands. A shear step of about 220 μm in size was observed on the side surfaces of the deformed specimen, and the ductility of the Pd77.5Cu6Si16.5 amorphous alloy was believed to be partially attributed to the strain hardening and the higher resistance of the glassy alloy to crack nucleation and propagation due to a higher Poison’s ratio [14]. When the shear stress is high enough, the shear bands will propagate along different orientations during plastic deformation, which leads to the interaction of shear bands. The fractal geometry suggests that the evolution of multiple shear bands is a process far from thermodynamic equilibrium, and interactions between shear bands are presented [35]. Qiao et al. have proposed multi-step shearing based on the energy dissipation of shear banding during the serrated flow [36]. Numerous shear bands concentrate, and multi-step shearing takes place during jerky flows, which causes the formation of microcracks, as displayed in Figure 3.
It is known that the jerky flow behavior is actually a process of the strain energy accumulation and energy dissipation [26,36]. The strain energy is accumulated during the stress rising, and a stress drop could be regarded as an energy relaxation process in each serration. The rising time at different strain rates covers a large time range because of different amplitudes of serration events, and the relaxation time roughly keeps constant. It is reported that with increasing strain rates from 10−5 s−1 to 10−2 s−1, the loading time is several times the relaxation time, i.e., the rising time is far longer than the decreasing time, and even the maximum loading time and the relaxation time decrease four orders [37]. In addition, to explore the plastic deformation mechanisms for amorphous alloys at different strain rates, the time series analysis is helpful when a scalar time series is suspected to be a projection from a higher-dimensional dynamics, and a positive exponent is taken to be a signature of the underlying chaotic dynamics [38].
An important clue to estimate the chaotic or SOC behavior is to employ the Lyapunov exponents. The positive Lyapunov exponent indicates that the plastic deformation dynamics of amorphous alloys belongs to the chaotic behavior. While the negative Lyapunov exponent suggests that the SOC state emerges, and the system will evolve rapidly to another state if the system condition changes. Increasing strain rate to 10−2 s−1, the largest Lyapunov exponent is negative [37]. That is to say, the SOC behavior happens at the high strain rate. At a strain rate of 10−4 s−1, the temperature decreases from 293 K to 213 K; the plastic deformation dynamics could transform from one state to another rapidly due to the SOC behavior for Zr-based bulk metallic glasses (BMGs) [30]. The SOC state could reveal the characteristic of plastic deformation of BMGs indirectly, for the system may evolve the chaotic state to another stable state.
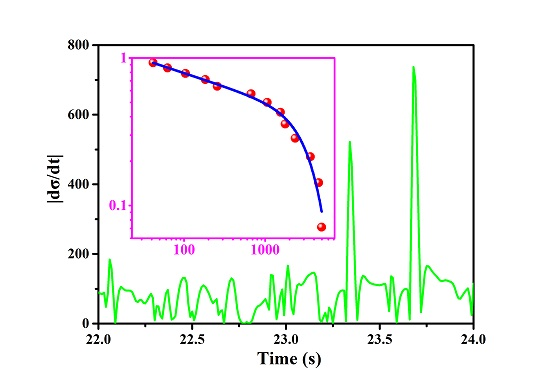
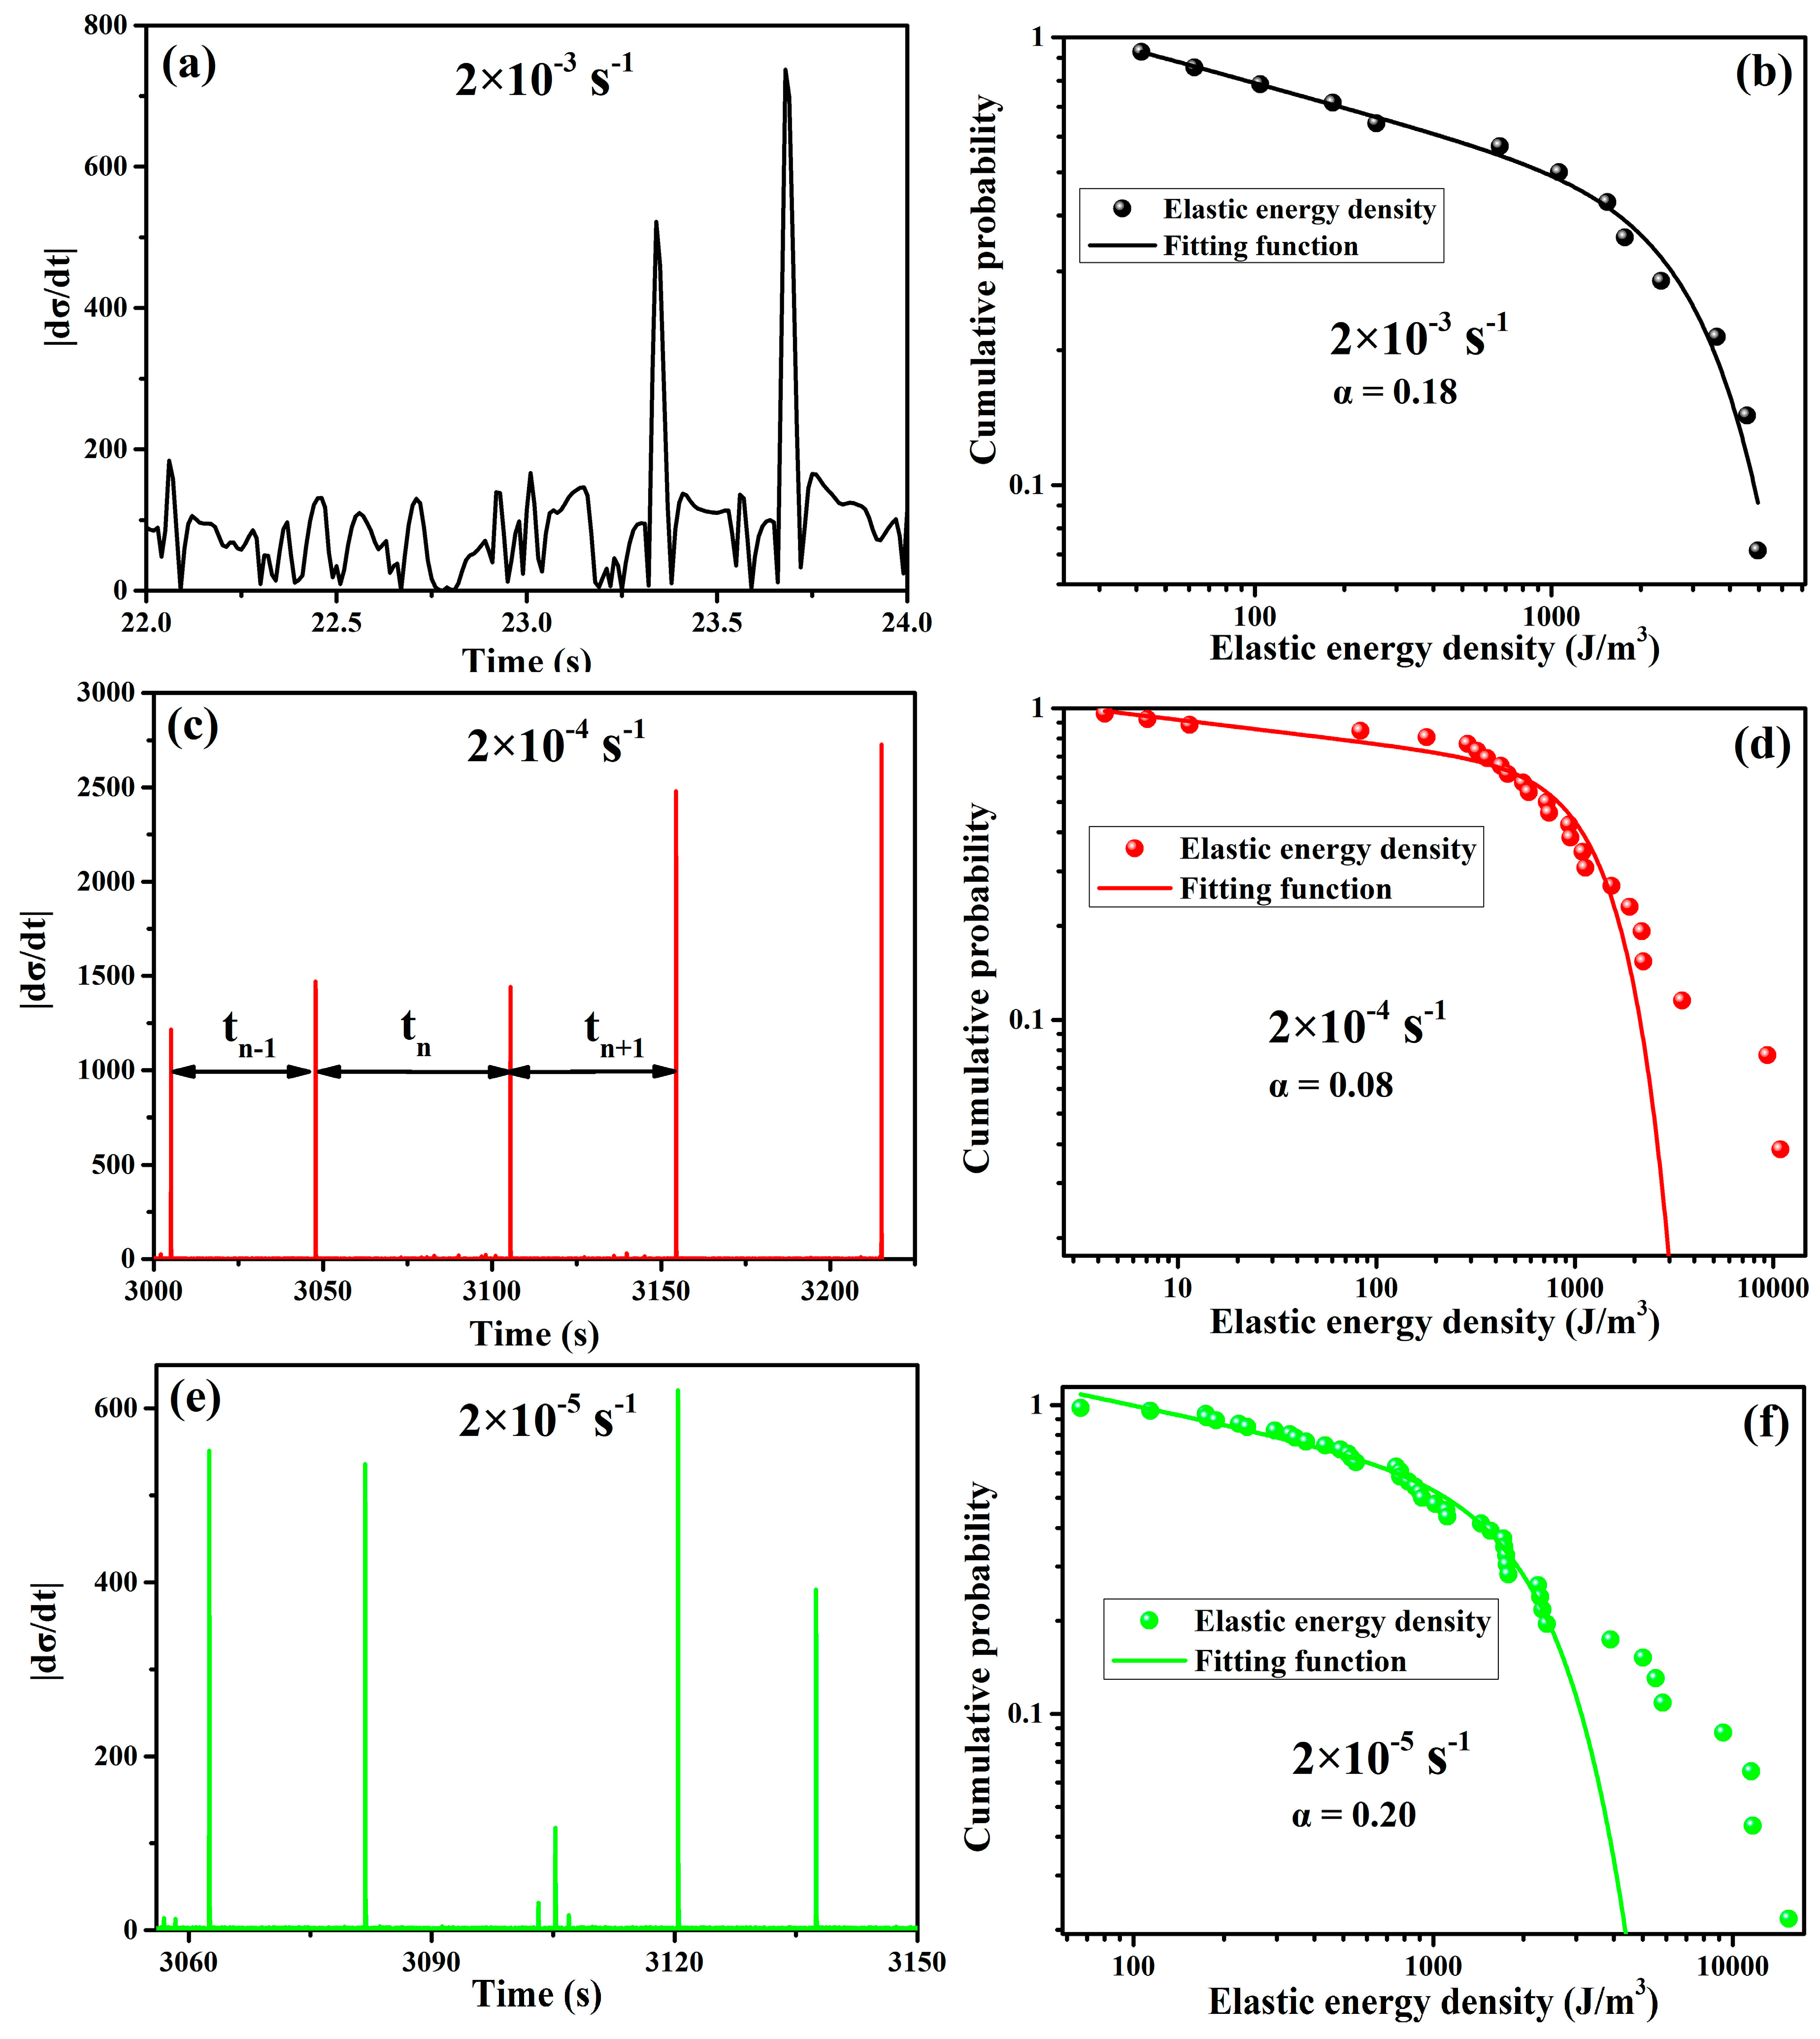
Figure 4a,c,e present the function of the derivative of flow stresses versus time. The X-axis represents the time during serrated flows, which is selected randomly, and the Y-axis means the derivative value. Due to jerky flows, the derivative may be negative values. Hence, to investigate the variation tendency conveniently, all of the derivative values have been changed to the absolute values. During the loading process of each serration event, it is treated as an elastic loading [26], and the slope is almost the same. The slope will change at the peak value and the valley value. When the strain energy accumulates over a threshold value, the shear bands will form and propagate rapidly, which corresponds to the relaxation process. As is known, the relaxation time is much smaller than the elastic loading time in one serration. It is noted that two sharp breaks will come out quickly for the derivative function.
From Figure 4a, it is clear that two distinct peaks could be observed, and there is no regularity between any two fluctuations during serrated flows. However, in Figure 4c,e, it could be found a straight line. This is because the relaxation time is much smaller during serrations at the strain rate of 2 × 10⁻⁴ and 2 × 10⁻⁵ s−1 than that at the strain rate of 2 × 10⁻³ s−1. The time intervals have been marked with tn−1, tn and tn+1, as shown in Figure 4c. Compared to Figure 4c,e, the time intervals are nearly equal between the neighboring serration events, i.e., tn−1 ≈ tn ≈ tn+1. It is about a few tens of seconds between any two continuous serrations at the strain rate of 2 × 10⁻⁴ and 2 ×10⁻⁵ s−1, respectively. The |dσ/dt| value as a function of time indicates that jerky flows exhibit roughly the same periodicity between any two neighboring serration events, which implies that these fluctuations are homogeneous during plastic deformation at strain rates of 2 × 10⁻⁴ and 2 × 10⁻⁵ s−1.
On the contrary, it is obvious that the variation of the derivative value is in the absence of any regularities. In Figure 4a, the derivative values are almost the same, and only before failure, two apparent peaks could be found, suggesting that two large amplitude stress drops must be detected in the end, as shown in the inset of Figure 1. Moreover, there is a distinct span from the starting point to the end point in each fluctuation event at the strain rate of 2 × 10⁻³ s−1, which is not a straight line and different from those in Figure 4c,e. The time interval between the starting point and the peak point is nearly equal to the decreasing time interval, which means that the rising time and the relaxation time are comparable during each serration event at a high strain rate. Actually, the time interval from the peak point to the valley point is regarded as a time period. However, the time interval between any two neighboring serration events is inhomogeneous, i.e., tn−1 ≠ tn ≠ tn+1, which reveals that the serrations at a relatively higher strain rate lack any typical time scale [17].
It is known that the serration event consists of a process of elastic energy accumulation and elastic energy release. The stress drop during the process of the elastic energy relaxation corresponds to the shearing process. The distance of the shearing process is very small, and the shearing avalanche size in the sample is difficult to be measured during stress drops [39]. Therefore, the elastic energy density is used to represent the shearing avalanche size reasonably during jerky flows [37]. The elastic energy density of one serration event (∆δ) is ∆δ = 1/2∆σ∆ε, where ∆σ and ∆ε are the elastic stress and strain during the increasing process in one serration event [26]. For the sake of characterizing the SOC behavior during serrated flows, the distribution of the cumulative probability of the elastic-energy density is investigated. The cumulative probability is the percentage of the number of serration events with the elastic energy density being larger than an elastic energy density, P (≥∆δ). In statistical analysis, the elastic energy density is identified with a power-law distribution function accompanied with a squared exponential decay function [26,40]:
where A is a normalization constant, α is a scaling exponent and δC the cut-off elastic energy density, which corresponds to the characteristic shearing size in BMGs. The distributions of the cumulative probability of the elastic energy density at the strain rates of 2 × 10⁻³, 2 × 10⁻⁴ and 2 × 10⁻⁵ s−1 are displayed in Figure 4b,d,f, respectively.
With the increase of the strain rate, the system will change when one state has been broken down to the level where the signal cannot be controlled in amorphous alloys. In addition, the system might approach, through a self-organized process, a critical point with power-law correlation functions for some physically-observable quantities [41]. As is well known, crystalline alloys exhibit serrated flows under the external stress due to nucleation and the motion of dislocations [20]. Numerical simulations of dislocations that generate scale-free avalanches and power-law behavior in properties are related to acoustic emissions that are characteristics of SOC behavior [42]. In amorphous alloys, the SOC behavior emerging should satisfy the following: (1) the interactions occur between the shear bands; (2) the loading time is longer than the relaxation time in each serration event; (3) the time interval is lacking the typical time scale; and (4) spatial or temporal parameters should display a power-law distribution [26,27,30,43]. The behavior of systems at the SOC point is characterized by some critical exponents, which are connected by scaling relations, and the systems obey finite-size scaling just as equilibrium statistical systems at the critical point, especially a critical state with a power-law correlation for physically-observable quantities [44]. The cumulative probability distributions of the normalized stress drop magnitude and the incubation time in the machine-sample system follow the power-law relations, which indicates that the triggering of serration events is correlated, and the SOC behavior emerges [45]. The distribution of the elastic energy density of serrated flow in BMGs has been demonstrated in accordance with the Equation (1), suggesting that the dynamics of jerky flows in BMGs is SOC behavior [26]. The small serrations might follow the SOC behavior, while a pure SOC behavior might not be the only option for this amorphous alloy plasticity. Because the plasticity of the amorphous alloy can be achieved by mixed large and small serrations, as well [46]. In Figure 4b,d,f, the power-law exponents are 0.18, 0.08 and 0.20, respectively. It is evident that the fitting curves of the power-law function are disparate in the data points at the strain rates of 2 × 10⁻⁴ and 2 × 10⁻⁵ s−1, when the elastic energy densities are larger. However, the fitting curve almost contains all of the data points at the strain rate of 2 × 10⁻³ s−1, as presented in Figure 4b. The goodness of fitting reaches as high as 0.99, though the amount of serration events is relatively small at the strain rate of 2 × 10⁻³ s−1. Therefore, the cumulative probability of elastic energy density follows a power-law distribution, implying that the dynamic plastic deformation of serrated flow characterizes the SOC behavior with increasing the strain rate.
4. Conclusions
In summary, the statistical analysis of the time series and distribution of the elastic energy density is very important to understand the serrated-flow behavior during plastic deformation in multicomponent amorphous alloys. From the fracture morphology, it is evident that the intersection effect takes place among profuse shear bands. In each serration event, the loading time is far larger than the relaxation time at different strain rates. Meanwhile, the time interval during serrations is nearly the same at the strain rates of 2 × 10⁻⁴ and 2 × 10⁻⁵ s−1. However, with increasing the strain rates, the time intervals during serrated flows lack any time scale at the strain rate of 2 × 10⁻³ s−1 in Figure 4a,c,e. The elastic energy density presents a power-law distribution at the strain rate of 2 × 10⁻³ s−1. Following these conditions simultaneously, the SOC behavior occurs at the strain rate of 2 × 10⁻³ s−1 during the serrated flow in the Pd77.5Cu6Si16.5 alloy. The investigation of the SOC behavior sheds light on the understanding of plastic deformation and the dynamics of jerky flows in multi-component amorphous alloys.
Acknowledgments
The authors would like to acknowledge the financial support of the Graduate Science and Technology Innovation Fund Project of Shanxi (No. 2016BY053).
Author Contributions
The statistical analysis was undertaken by Z.W. and J. Li. The preparation of test samples was supported by Z.W. and R.W., and the microstructure analysis of the alloys was performed by B.Y. and J.F. The paper was written by Z.W. and B.W.
Conflicts of Interest
The authors declare no conflict of interest.
References
- Zhang, Y.; Zuo, T.T.; Tang, Z.; Gao, M.C.; Dahmen, K.A.; Liaw, P.K.; Lu, Z.P. Microstructures and properties of high-entropy alloys. Prog. Mater. Sci. 2014, 61, 1–93. [Google Scholar] [CrossRef]
- Yeh, J.W.; Chen, S.K.; Lin, S.J.; Gan, J.Y.; Chin, T.S.; Shun, T.T.; Tsau, C.H.; Chang, S.Y. Nanostructured high-entropy alloys with multiple principal elements: Novel alloy design concepts and outcomes. Adv. Eng. Mater. 2004, 6, 299–303. [Google Scholar] [CrossRef]
- Zhang, Y.; Zhou, Y.J.; Lin, J.P.; Chen, G.L.; Liaw, P.K. Solid-solution phase formation rules for multi-component alloys. Adv. Eng. Mater. 2008, 10, 534–538. [Google Scholar] [CrossRef]
- Qiao, J.W.; Wang, Z.; Ren, L.W.; Jia, H.L.; Ma, S.G.; Yang, H.J.; Zhang, Y. Enhancement of mechanical and electrochemical properties of Al0.25CrCoFe1.25Ni1.25 high-entropy alloys by coating Ni–P amorphous films. Mater. Sci. Eng. A 2016, 657, 353–358. [Google Scholar] [CrossRef]
- Zhou, Y.; Zhang, Y.; Wang, Y.; Chen, G. Solid solution alloys of AlCoCrFeNiTix with excellent room-temperature mechanical properties. Appl. Phys. Lett. 2007, 90, 1904. [Google Scholar] [CrossRef]
- Zhao, Y.J.; Qiao, J.W.; Ma, S.G.; Gao, M.C.; Yang, H.J.; Chen, M.W.; Zhang, Y. A hexagonal close-packed high-entropy alloy: The effect of entropy. Mater. Des. 2016, 96, 10–15. [Google Scholar] [CrossRef]
- Gao, M.C.; Zhang, B.; Guo, S.M.; Qiao, J.W.; Hawk, J.A. High-entropy alloys in hexagonal close-packed structure. Metall. Mater. Trans. A 2016, 47, 3322–3332. [Google Scholar] [CrossRef]
- Gludovatz, B.; Hohenwarter, A.; Catoor, D.; Chang, E.H.; George, E.P.; Ritchie, R.O. A fracture-resistant high-entropy alloy for cryogenic applications. Science 2014, 345, 1153–1158. [Google Scholar] [CrossRef] [PubMed]
- Inoue, A.; Takeuchi, A. Recent development and application products of bulk glassy alloys. Acta Mater. 2011, 59, 2243–2267. [Google Scholar] [CrossRef]
- Wang, W.H. High-entropy metallic glasses. JOM 2014, 66, 2067–2077. [Google Scholar] [CrossRef]
- Takeuchi, A.; Gao, M.G.; Qiao, J.W.; Widom, M. Chapter 13 High-Entropy Metallic Glasses. In High Entroph Alloys: Fundamentals and Applications, 1st ed.; Gao, M.C., Yeh, J.W., Liaw, P.K., Zhang, Y., Eds.; Springer International Publishing: Cham, Switzerland, 2016. [Google Scholar]
- Chen, H.S.; Turnbull, D. Formation, stability and structure of palladium-silicon based alloy glasses. Acta Metall. 1969, 17, 1021–1031. [Google Scholar] [CrossRef]
- Chen, H.S.; Krause, J.T.; Coleman, E. Elastic constants, hardness and theri implications to flow properties of metallic glasses. J. Non Cryst. Sol. 1975, 18, 157–171. [Google Scholar] [CrossRef]
- Yao, K.F.; Yang, Y.Q.; Chen, N. Mechanical properties of Pd-Cu-Si bulk metallic glass. Intermetallics 2007, 15, 639–643. [Google Scholar] [CrossRef]
- Carroll, R.; Lee, C.; Tsai, C.W.; Yeh, J.W.; Antonaglia, J.; Brinkman, B.A.; LeBlanc, M.; Xie, X.; Chen, S.; Liaw, P.K.; Dahmen, K.A. Experiments and model for serration statistics in low-entropy, medium-entropy, and high-entropy alloys. Sci. Rep. 2015, 5, 16997. [Google Scholar] [CrossRef] [PubMed]
- Antonaglia, J.; Xie, X.; Tang, Z.; Tsai, C.W.; Qiao, J.W.; Zhang, Y.; Laktionova, M.O.; Tabachnikova, E.D.; Yeh, J.W.; Senkov, O.N.; et al. Temperature effects on deformation and serration behavior of high-entropy alloys (HEAs). JOM 2014, 66, 2002–2008. [Google Scholar] [CrossRef]
- Qiao, J.W.; Zhang, Y.; Liaw, P.K. Serrated flow kinetics in a Zr-based bulk metallic glass. Intermetallics 2010, 18, 2057–2064. [Google Scholar] [CrossRef]
- Friedman, N.; Jennings, A.T.; Tsekenis, G.; Kim, J.Y.; Tao, M.; Uhl, J.T.; Greer, J.R.; Dahmen, K.A. Statistics of dislocation slip avalanches in nanosized single crystals show tuned critical behavior predicted by a simple mean field model. Phys. Rev. Lett. 2012, 109, 095507. [Google Scholar] [CrossRef] [PubMed]
- Chihab, K.; Estrin, Y.; Kubin, L.P.; Vergnol, J. The kinetics of the Portevin-Le Chatelier bands in an Al-5at%Mg alloy. Scr. Metall. 1987, 21, 203–208. [Google Scholar] [CrossRef]
- Ananthakrishna, G. Current theoretical approaches to collective behavior of dislocations. Phys. Rep. 2007, 440, 113–259. [Google Scholar] [CrossRef]
- Klaumünzer, D.; Lazarev, A.; Maaß, R.; Dalla Torre, F.H.; Vinogradov, A.; Löffler, J.F. Probing shear-band initiation in metallic glasses. Phys. Rev. Lett. 2011, 107, 185502. [Google Scholar] [CrossRef] [PubMed]
- Dalla Torre, F.H.; Klaumünzer, D.; Maaß, R.; Löffler, J.F. Stick-slip behavior of serrated flow during inhomogeneous deformation of bulk metallic glasses. Acta Mater. 2010, 58, 3742–3750. [Google Scholar] [CrossRef]
- Qiao, J.W.; Yang, F.Q.; Wang, G.Y.; Liaw, P.K.; Zhang, Y. Jerky-flow characteristics for a Zr-based bulk metallic glass. Scr. Mater. 2010, 63, 1081–1084. [Google Scholar] [CrossRef]
- Song, S.X.; Bei, H.; Wadsworth, J.; Nieh, T.G. Flow serration in a Zr-based bulk metallic glass in compression at low strain rates. Intermetallics 2008, 16, 813–818. [Google Scholar] [CrossRef]
- Schuh, C.; Hufnagel, T.; Ramamurty, U. Mechanical behavior of amorphous alloys. Acta Mater. 2007, 55, 4067–4109. [Google Scholar] [CrossRef]
- Wang, G.; Chan, K.C.; Xia, L.; Yu, P.; Shen, J.; Wang, W.H. Self-organized intermittent plastic flow in bulk metallic glasses. Acta Mater. 2009, 57, 6146–6155. [Google Scholar] [CrossRef]
- Wang, Z.; Li, J.; Zhang, W.; Qiao, J.; Wang, B. The self-organized critical behavior in Pd-based bulk metallic glass. Metals 2015, 5, 1188–1196. [Google Scholar] [CrossRef]
- Greer, A.L. Metallic glasses. Science 1995, 267, 1947–1953. [Google Scholar] [CrossRef] [PubMed]
- Qiao, J.W.; Jia, H.L.; Liaw, P.K. Metallic glass matrix composites. Mater. Sci. Eng. R Rep. 2016, 100, 1–69. [Google Scholar] [CrossRef]
- Ren, J.L.; Chen, C.; Liu, Z.Y.; Li, R.; Wang, G. Plastic dynamics transition between chaotic and self-organized critical states in a glassy metal via a multifractal intermediate. Phys. Rev. B 2012, 86, 134303. [Google Scholar] [CrossRef]
- Yao, K.F.; Ruan, F.; Yang, Y.Q.; Chen, N. Superductile bulk metallic glass. Appl. Phys. Lett. 2006, 88, 122106. [Google Scholar] [CrossRef]
- Granata, D.; Fischer, E.; Wessels, V.; Löffler, J.F. Fluxing of Pd–Si–Cu bulk metallic glass and the role of cooling rate and purification. Acta Mater. 2014, 71, 145–152. [Google Scholar] [CrossRef]
- Qiao, J.W.; Wang, Z.; Jiao, Z.M.; Yang, H.J.; Ma, S.G.; Wang, Z.H.; Xu, B.S. Predicting burst sizes in amorphous alloys during plastic flows. Mater. Sci. Eng. A 2014, 609, 222–225. [Google Scholar] [CrossRef]
- Wang, Z.; Qiao, J.W.; Wang, G.; Dahmen, K.A.; Liaw, P.K.; Wang, Z.H.; Wang, B.C.; Xu, B.S. The mechanism of power-law scaling behavior by controlling shear bands in bulk metallic glass. Mater. Sci. Eng. A 2015, 639, 663–670. [Google Scholar] [CrossRef]
- Sun, B.A.; Wang, W.H. Fractal nature of multiple shear bands in severely deformed metallic glass. Appl. Phys. Lett. 2011, 98, 201902. [Google Scholar] [CrossRef]
- Qiao, J.W.; Jia, H.L.; Zhang, Y.; Liaw, P.K.; Li, L.F. Multi-step shear banding for bulk metallic glasses at ambient and cryogenic temperatures. Mater. Chem. Phys. 2012, 136, 75–79. [Google Scholar] [CrossRef]
- Ren, J.L.; Chen, C.; Wang, G.; Mattern, N.; Eckert, J. Dynamics of serrated flow in a bulk metallic glass. AIP Adv. 2011, 1, 032158. [Google Scholar] [CrossRef]
- Sarmah, R.; Ananthakrishna, G.; Sun, B.A.; Wang, W.H. Hidden order in serrated flow of metallic glasses. Acta Mater. 2011, 59, 4482–4493. [Google Scholar] [CrossRef]
- Song, S.X.; Wang, X.L.; Nieh, T.G. Capturing shear band propagation in a Zr-based metallic glass using a high-speed camera. Scr. Mater. 2010, 62, 847–850. [Google Scholar] [CrossRef]
- Csikor, F.F.; Motz, C.; Weygand, D.; Zaiser, M.; Zapperi, S. Dislocation avalanches, strain bursts, and the problem of plastic forming at the micrometer scale. Science 2007, 318, 251–254. [Google Scholar] [CrossRef] [PubMed]
- Bak, P.; Tang, C.; Wiesenfeld, K. Self-organized criticality: An explanation of the 1/f noise. Phys. Rev. Lett. 1987, 59, 381–384. [Google Scholar] [CrossRef] [PubMed]
- Koslowski, M.; LeSar, R.; Thomson, R. Avalanches and scaling in plastic deformation. Phys. Rev. Lett. 2004, 93, 125502. [Google Scholar] [CrossRef] [PubMed]
- Qiao, J.W.; Wang, Z. Self-organized Criticality Behavior in Bulk Metallic Glasses. J. Iron Steel Res. Int. 2016, 23, 7–13. [Google Scholar] [CrossRef]
- Bak, P.; Tang, C.; Wiesenfeld, K. Self-organized criticality. Phys. Rev. A 1988, 38, 364–374. [Google Scholar] [CrossRef]
- Sun, B.A.; Pauly, S.; Tan, J.; Stoica, M.; Wang, W.H.; Kühn, U.; Eckert, J. Serrated flow and stick–slip deformation dynamics in the presence of shear-band interactions for a Zr-based metallic glass. Acta Mater. 2012, 60, 4160–4171. [Google Scholar] [CrossRef]
- Yang, G.N.; Chen, S.Q.; Gu, J.L.; Zhao, S.F.; Li, J.F.; Shao, Y.; Wang, H.; Yao, K.F. Serration behaviours in metallic glasses with different plasticity. Philos. Mag. 2016, 96, 2243–2255. [Google Scholar] [CrossRef]
Figure 1.
Engineering stress-strain curves of Pd77.5Cu6Si16.5 alloys compressed at strain rates of 2 × 10⁻³, 2 × 10⁻⁴ and 2 × 10⁻⁵ s−1, respectively. The inset shows the local stress-strain curve at the strain rate of 2 × 10⁻³ s−1.
Figure 1.
Engineering stress-strain curves of Pd77.5Cu6Si16.5 alloys compressed at strain rates of 2 × 10⁻³, 2 × 10⁻⁴ and 2 × 10⁻⁵ s−1, respectively. The inset shows the local stress-strain curve at the strain rate of 2 × 10⁻³ s−1.
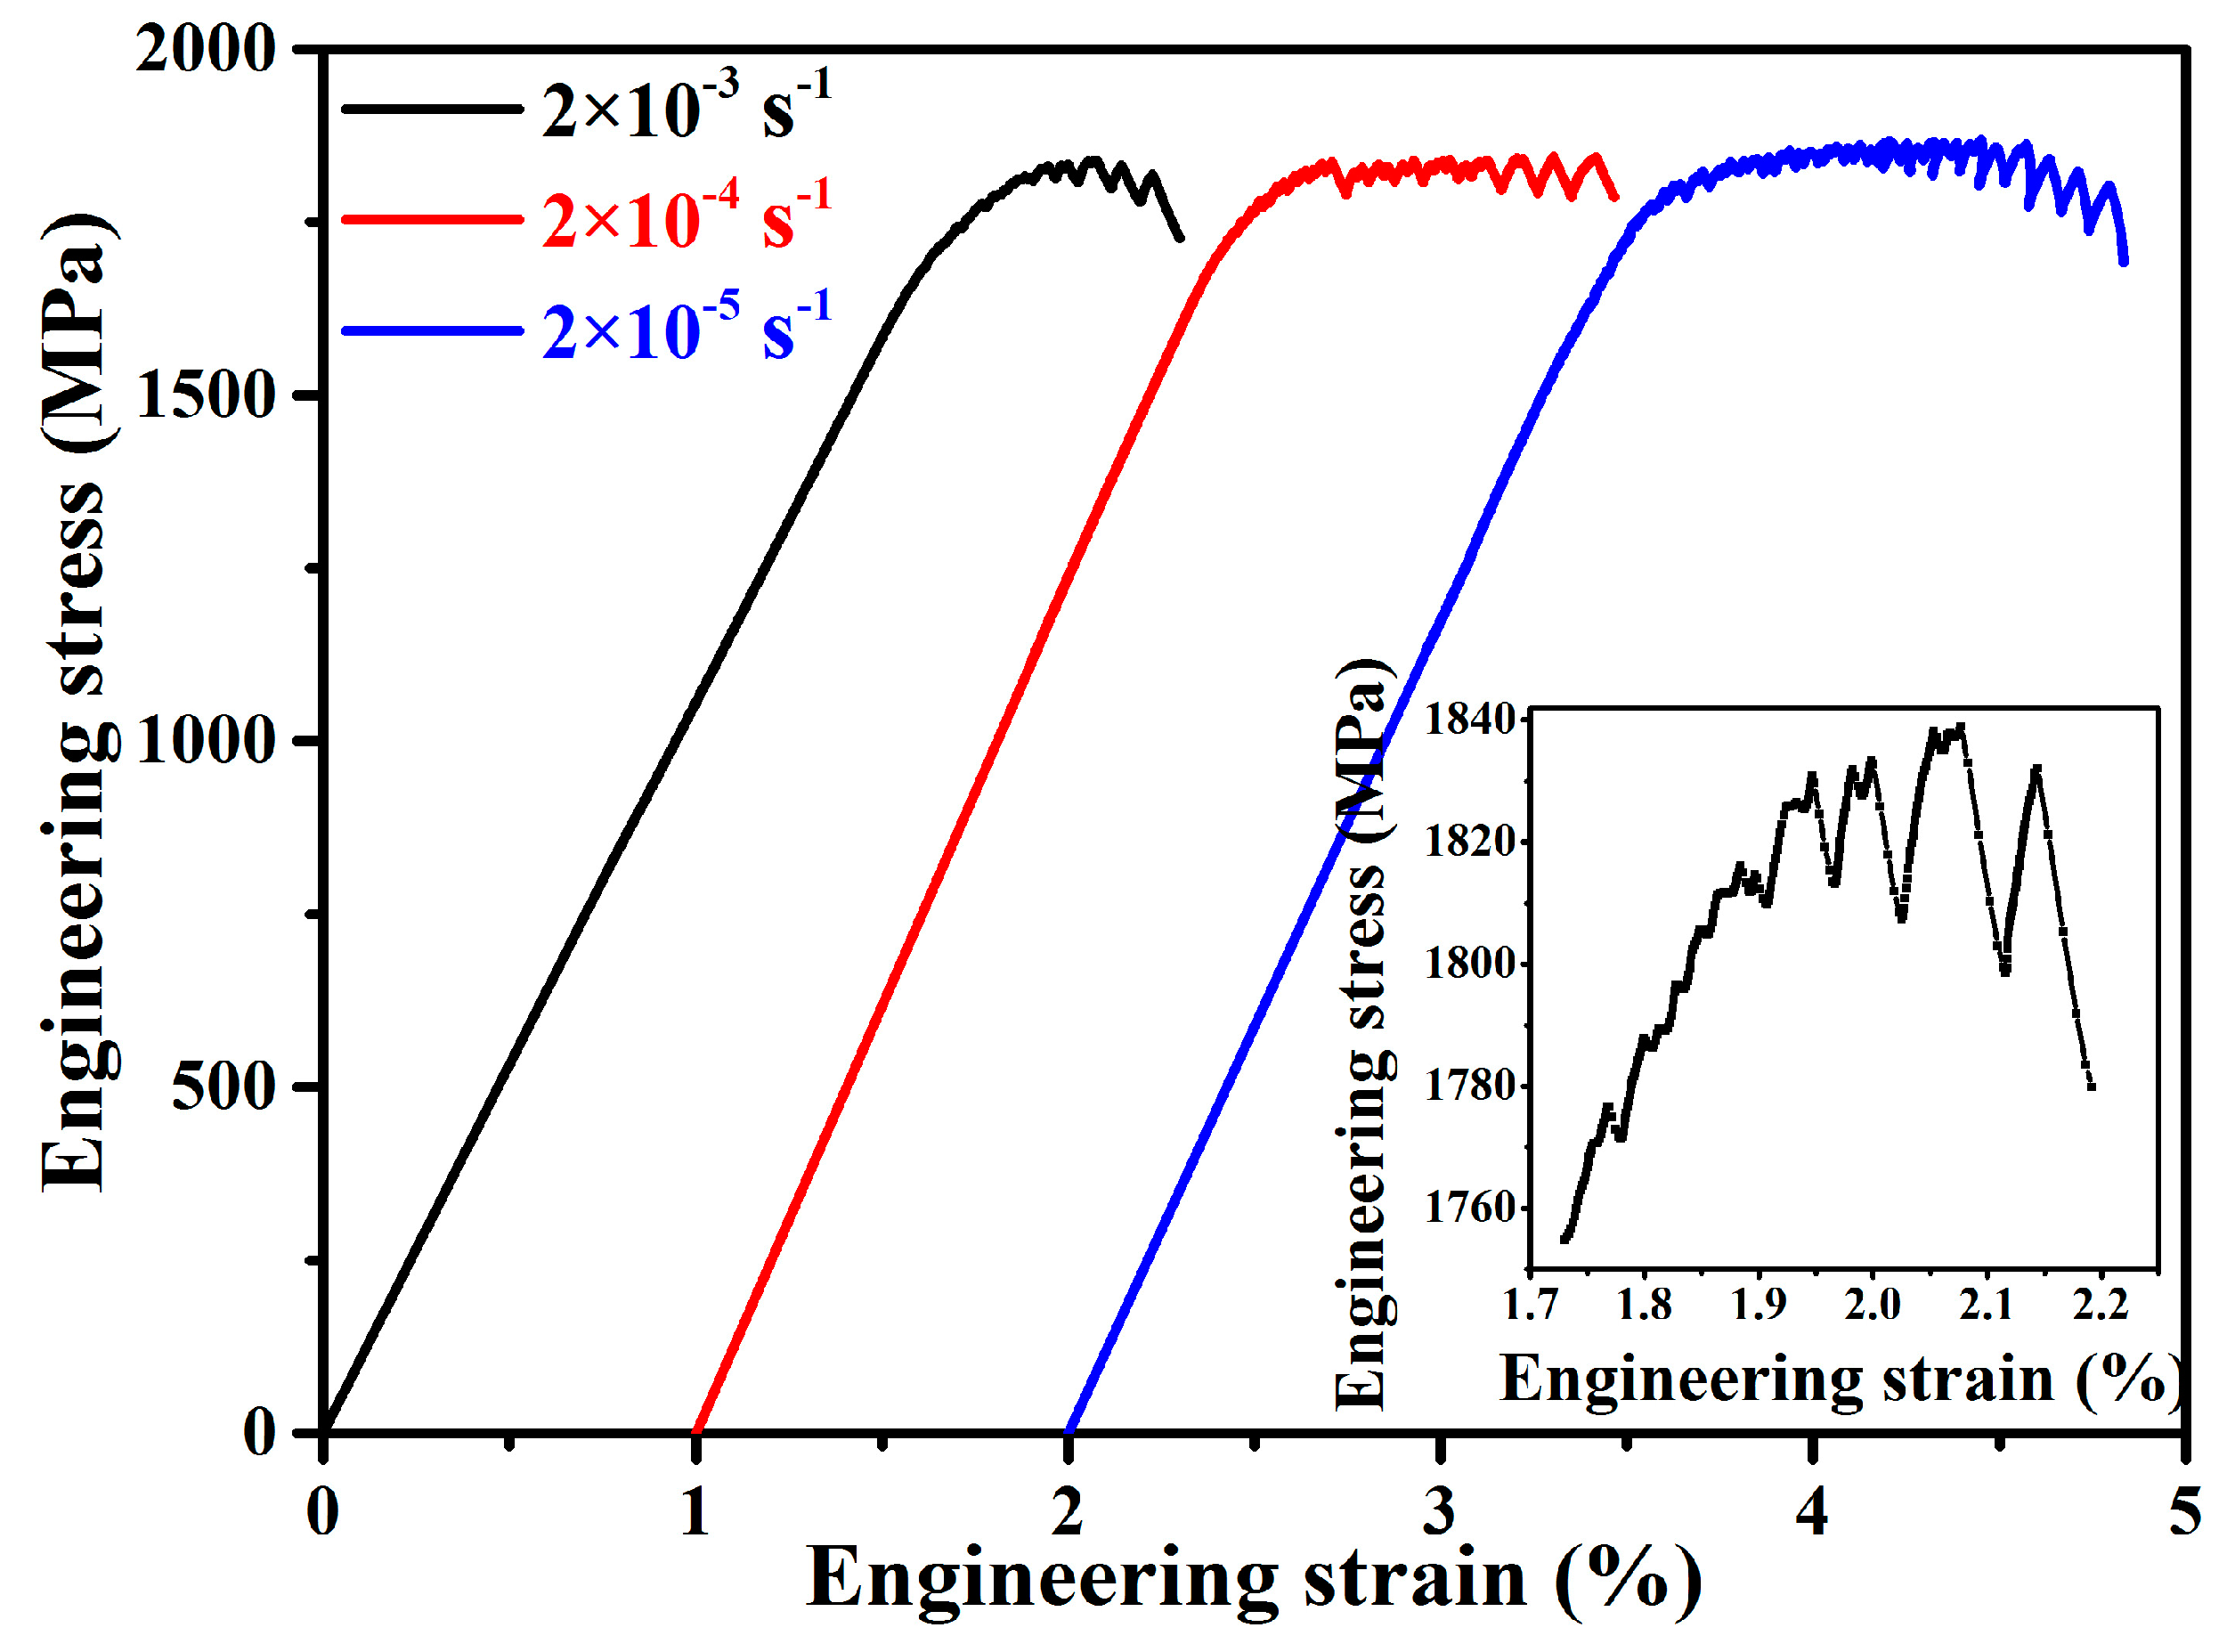
Figure 2.
The amplitudes of serration events at the strain rates of 2 × 10⁻³, 2 × 10⁻⁴ and 2 × 10⁻⁵ s−1, respectively.
Figure 2.
The amplitudes of serration events at the strain rates of 2 × 10⁻³, 2 × 10⁻⁴ and 2 × 10⁻⁵ s−1, respectively.

Figure 3.
The morphology of the lateral surface of the fractured sample at strain rates of 2 × 10⁻³ s−1.
Figure 3.
The morphology of the lateral surface of the fractured sample at strain rates of 2 × 10⁻³ s−1.
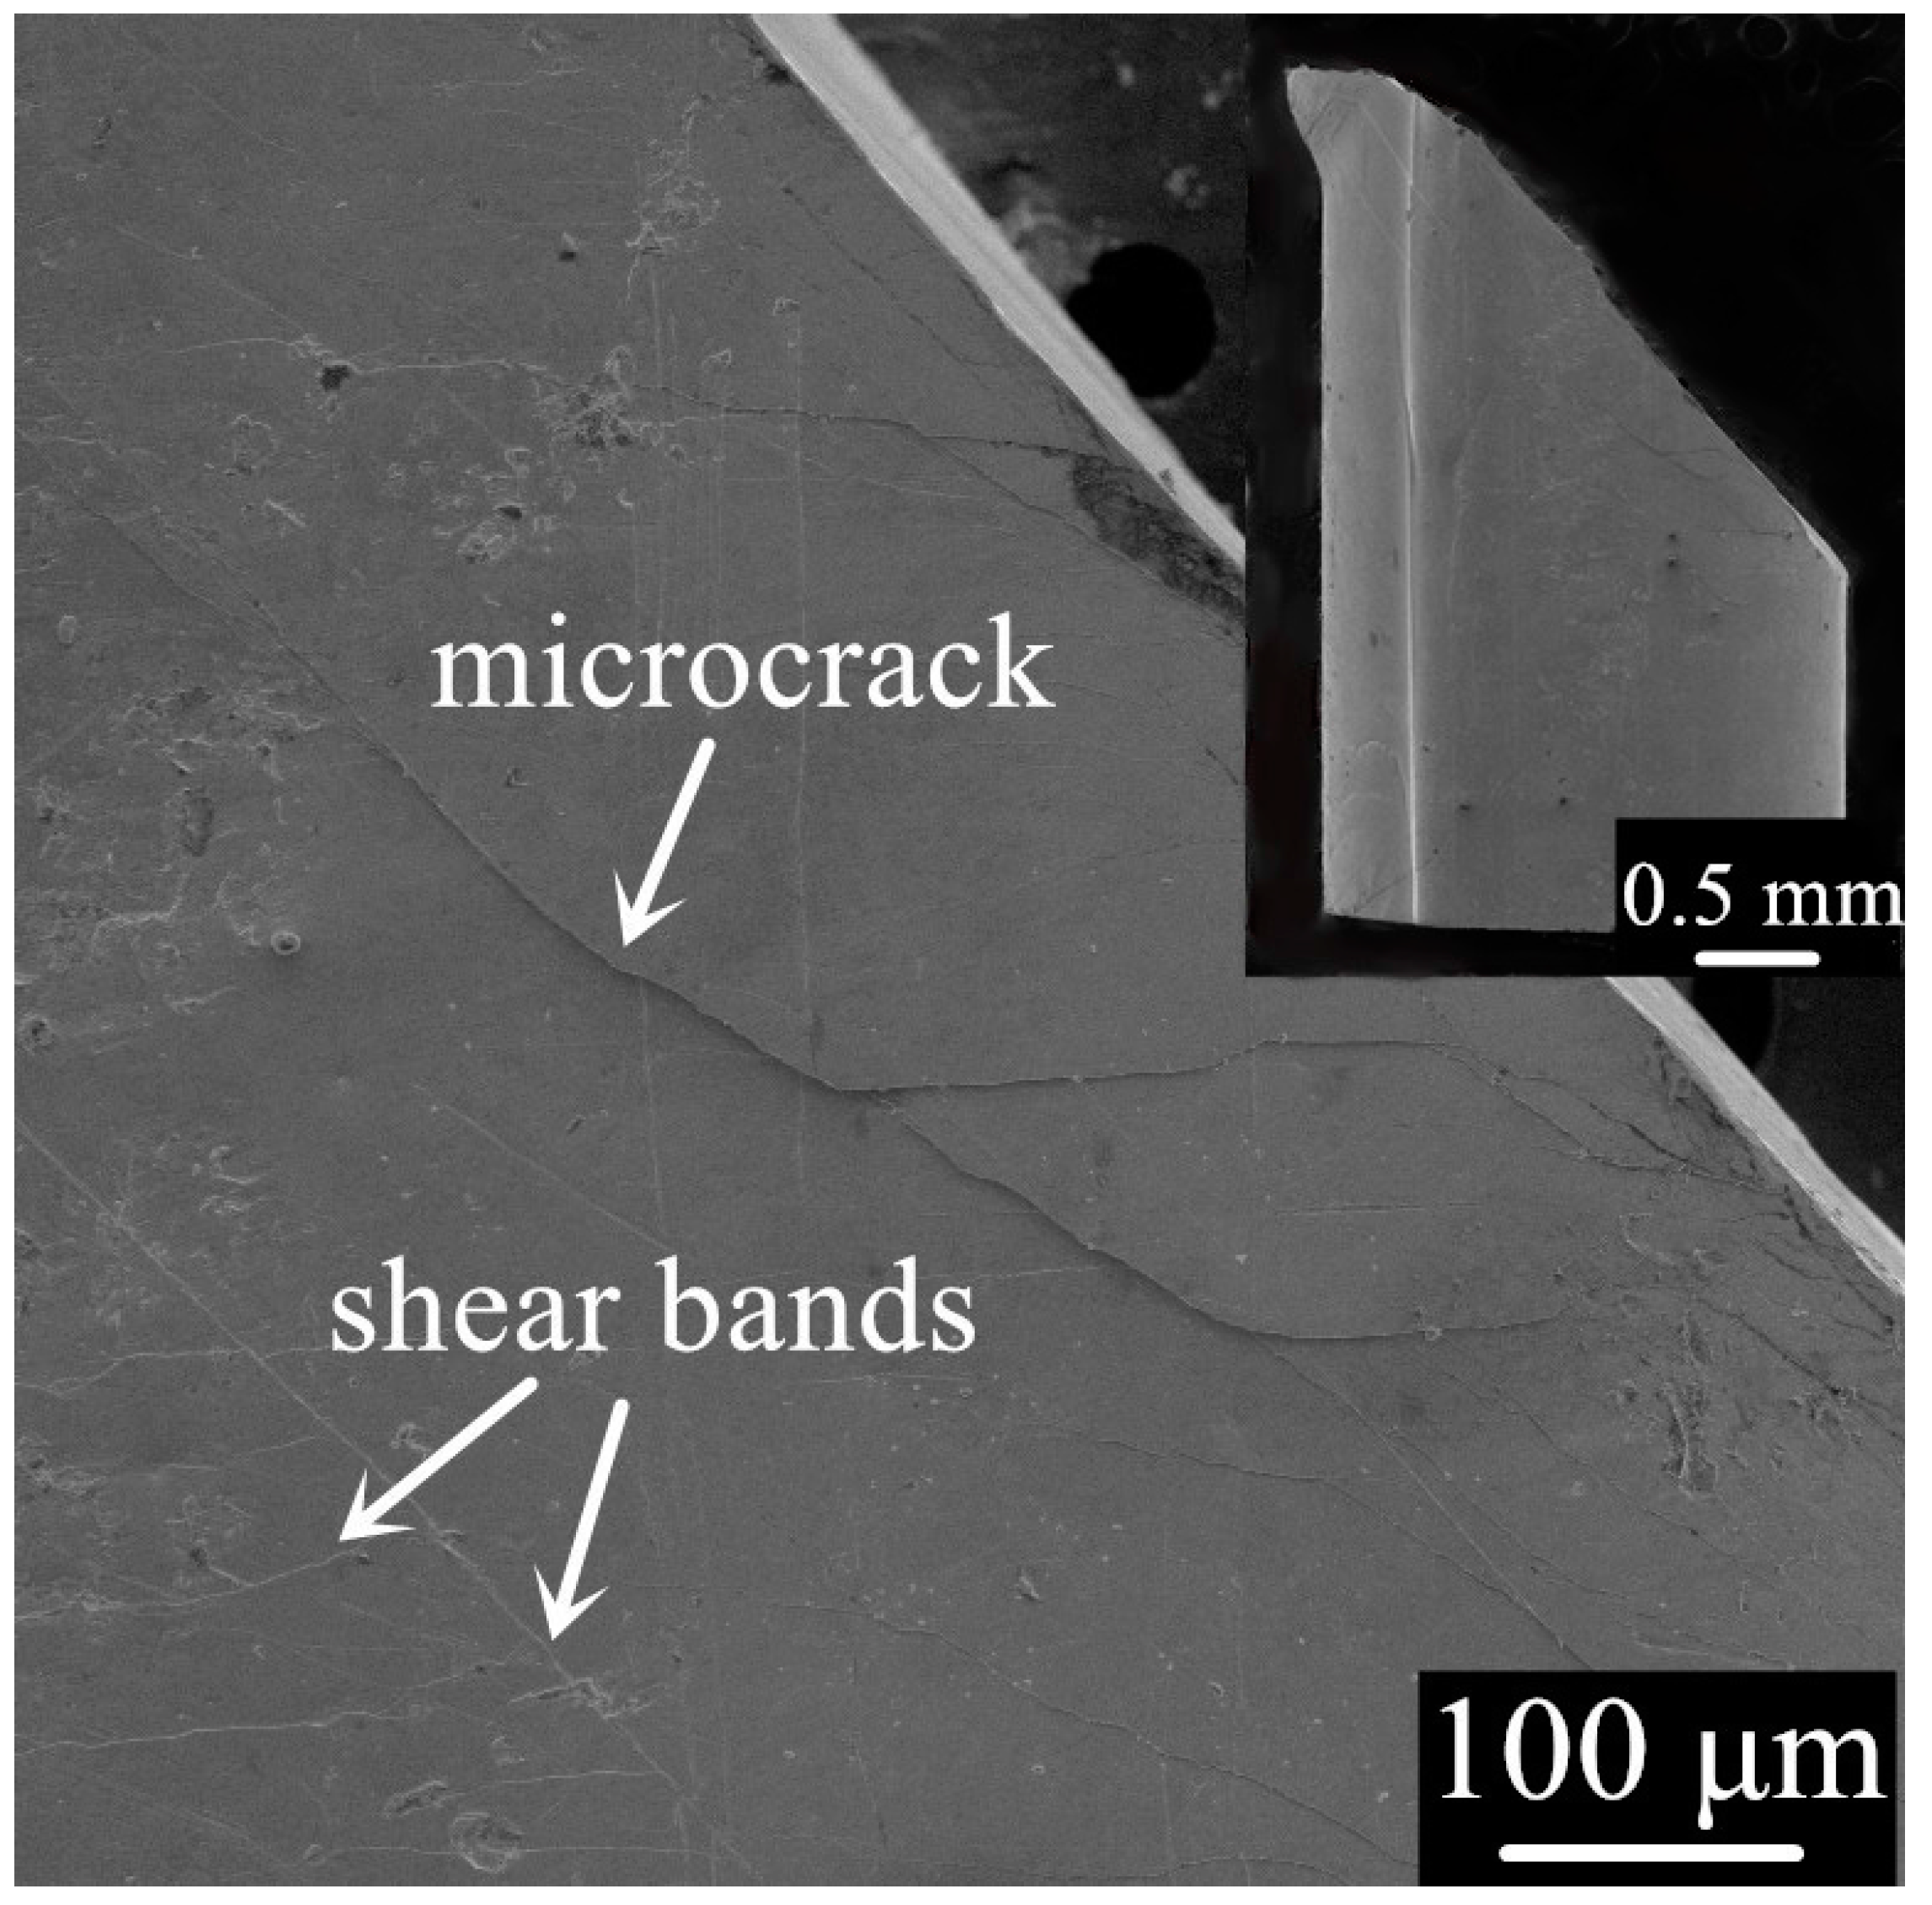
Figure 4.
(a,c,e) Profile of |dσ/dt| vs. time at three strain rates of 2 × 10⁻³, 2 × 10⁻⁴ and 2 × 10⁻⁵ s−1, respectively. (b,d,f) Cumulative probability distributions of the elastic energy density at three strain rates of 2 × 10⁻³, 2 × 10⁻⁴ and 2 × 10⁻⁵ s−1, respectively.
Figure 4.
(a,c,e) Profile of |dσ/dt| vs. time at three strain rates of 2 × 10⁻³, 2 × 10⁻⁴ and 2 × 10⁻⁵ s−1, respectively. (b,d,f) Cumulative probability distributions of the elastic energy density at three strain rates of 2 × 10⁻³, 2 × 10⁻⁴ and 2 × 10⁻⁵ s−1, respectively.

© 2016 by the authors; licensee MDPI, Basel, Switzerland. This article is an open access article distributed under the terms and conditions of the Creative Commons Attribution (CC-BY) license (http://creativecommons.org/licenses/by/4.0/).
Share and Cite
MDPI and ACS Style
Wang, Z.; Li, J.; Yuan, B.; Wu, R.; Fan, J.; Wang, B. Serration Behavior in Pd77.5Cu6Si16.5 Alloy. Metals 2016, 6, 191. https://doi.org/10.3390/met6080191
AMA Style
Wang Z, Li J, Yuan B, Wu R, Fan J, Wang B. Serration Behavior in Pd77.5Cu6Si16.5 Alloy. Metals. 2016; 6(8):191. https://doi.org/10.3390/met6080191
Chicago/Turabian StyleWang, Zhong, Jiaojiao Li, Bo Yuan, Rongfeng Wu, Jing Fan, and Baocheng Wang. 2016. "Serration Behavior in Pd77.5Cu6Si16.5 Alloy" Metals 6, no. 8: 191. https://doi.org/10.3390/met6080191
Note that from the first issue of 2016, this journal uses article numbers instead of page numbers. See further details here.