Article

Failure Analysis of High Strength Galvanized Bolts Used in Steel Towers

by
Jose Alberto Álvarez
1,*,
Roberto Lacalle
1,2,
Borja Arroyo
1,
Sergio Cicero
1 and
Federico Gutiérrez-Solana
1
1
LADICIM (Laboratory of Materials Science and Engineering), University of Cantabria, ETS. Ingenieros de Caminos, Av/Los Castros 44, Santander 39005, Spain
2
Inesco Ingenieros, CDTUC módulo 9, Av/Los Castros 44, Santander 39005, Spain
*
Author to whom correspondence should be addressed.
Metals 2016, 6(7), 163; https://doi.org/10.3390/met6070163
Submission received: 26 May 2016 / Revised: 28 June 2016 / Accepted: 7 July 2016 / Published: 13 July 2016

Abstract

:
This paper analyses the failure of three bolts used in the structural connections of a number of steel towers located in northern Europe. The analysis comprises optical and scanning electron microscopy, microstructural and hardness analysis, mechanical testing and structural integrity assessments. The three bolts present very similar failure processes, with a circumferential external crack that led to the final failure. The morphology of the crack propagation is typical of Hydrogen-Induced Stress Corrosion Cracking (HISCC), with mixed intergranular-transgranular micromechanisms, tearing processes and secondary cracking. The cracks then grew subcritically until they reached their critical size. Quench cracking or fatigue processes have been ruled out.

Graphical Abstract

1. Introduction

This paper analyses the failure of several high strength bolts used in the connection between the different stretches composing structural steel towers operating on the coast of northern Europe. The bolts were prestressed before being put into service and started to fail after two months of operation. All of them were in galvanised conditions in order to have better corrosion behaviour. Three of these bolts were received at the Laboratory of Materials Science and Engineering of the University of Cantabria (LADICIM) in order to determine the cause or causes of the failures.
The literature gathers a number of documents analysing the failure of in-service high strength galvanised bolts. Boyd and Hyler [1] demonstrated how galvanising generates both a significant reduction of the resistance of bolts against Stress Corrosion Cracking (SCC) and Hydrogen Embrittlement (HE) for similar bolts to the ones analysed here. Townsend [2] analysed the influence of the material hardness on the HE of AISI-4140 steel bars, and established a limit of around 350 HV as an acceptance criterion. The same author defines the possible sources of hydrogen during galvanising and describes how the galvanising itself acts as an impenetrable layer that prevents the hydrogen from escaping.
Other authors (e.g., [3,4,5,6,7,8]) have analysed those aspects related to the micromechanisms of crack generation and propagation, as well as the processes explaining these phenomena, which are basically Liquid Metal Embrittlement, Quench Cracking and Hydrogen-Induced Cracking.
The analysis performed here has also taken into account the reference standards for the structural application of bolts. These documents [9,10,11,12,13,14,15] include recommendations for both the fabrication and the design stages, and emphasise the need to perform analyses into the possible effects of hydrogen on this kind of bolt.
With all this, Section 2 gathers a description of both the components being analysed and the experimental and analytical programmes performed, Section 3 presents the corresponding results, Section 4 provides a discussion about the findings and the possible causes of the failures, and Section 5 gathers the final conclusions.

2. Materials and Methods

2.1. Description of the Bolts

Three of the bolts that had experienced a previous failure were received at the LADICIM in order to determine the possible causes of such failures. The bolts had identical geometries, with a metric size of 56 mm (M56), class 10.9, following UNE-EN-ISO 898-1 [9] and UNE-EN-ISO 898-2 [10], and were fabricated with steel 42CrMo4 following UNE-EN-10027-1 [16] (equivalent to AISI 4140), the nominal composition being gathered in Table 1. The bolts had the following identification:
  • Bolt A, batch 1, material 42CrMo4
  • Bolt B, batch 2, material 42CrMo4
  • Bolt C, batch 3, material 42CrMo4
As an example, Figure 1 shows bolt B at reception.
During the fabrication process, the three bolts were first forged and then subjected to a subcritical annealing followed by quenching and tempering. Finally, the bolts were hot-dip galvanised. Table 2 gathers the data of the thermal treatments, after which the bolts should present tempered martensite on the surface and a combination of tempered martensite and bainite in the inner material.
The mechanical properties of the material being analysed should follow the specifications established by UNE-EN-ISO 898-1 [9], which are shown in Table 3. The bolts were put into service after the application of a 1280 kN preload. Here, it should be noted that failures occurred after two months of operation, not during the application of the preload.

2.2. Experimental and Analytical Procedure

The procedure performed here with the aim of determining the cause or causes of the failures comprises the following steps:
  • Visual inspection and macrographic analysis
  • Chemical composition
  • Microstructural analysis
  • Hardness measurements
  • Mechanical tests
  • Fractographic analysis
  • Structural integrity assessment of the fractured bolts
The analyses were performed on the three bolts, with totally analogous results in all of them. Thus, for the sake of simplicity, the results presented below will be focussed on bolt A.

3. Results

This section may be divided by subheadings. It should provide a concise and precise description of the experimental results, their interpretation, as well as the experimental conclusions that can be drawn.

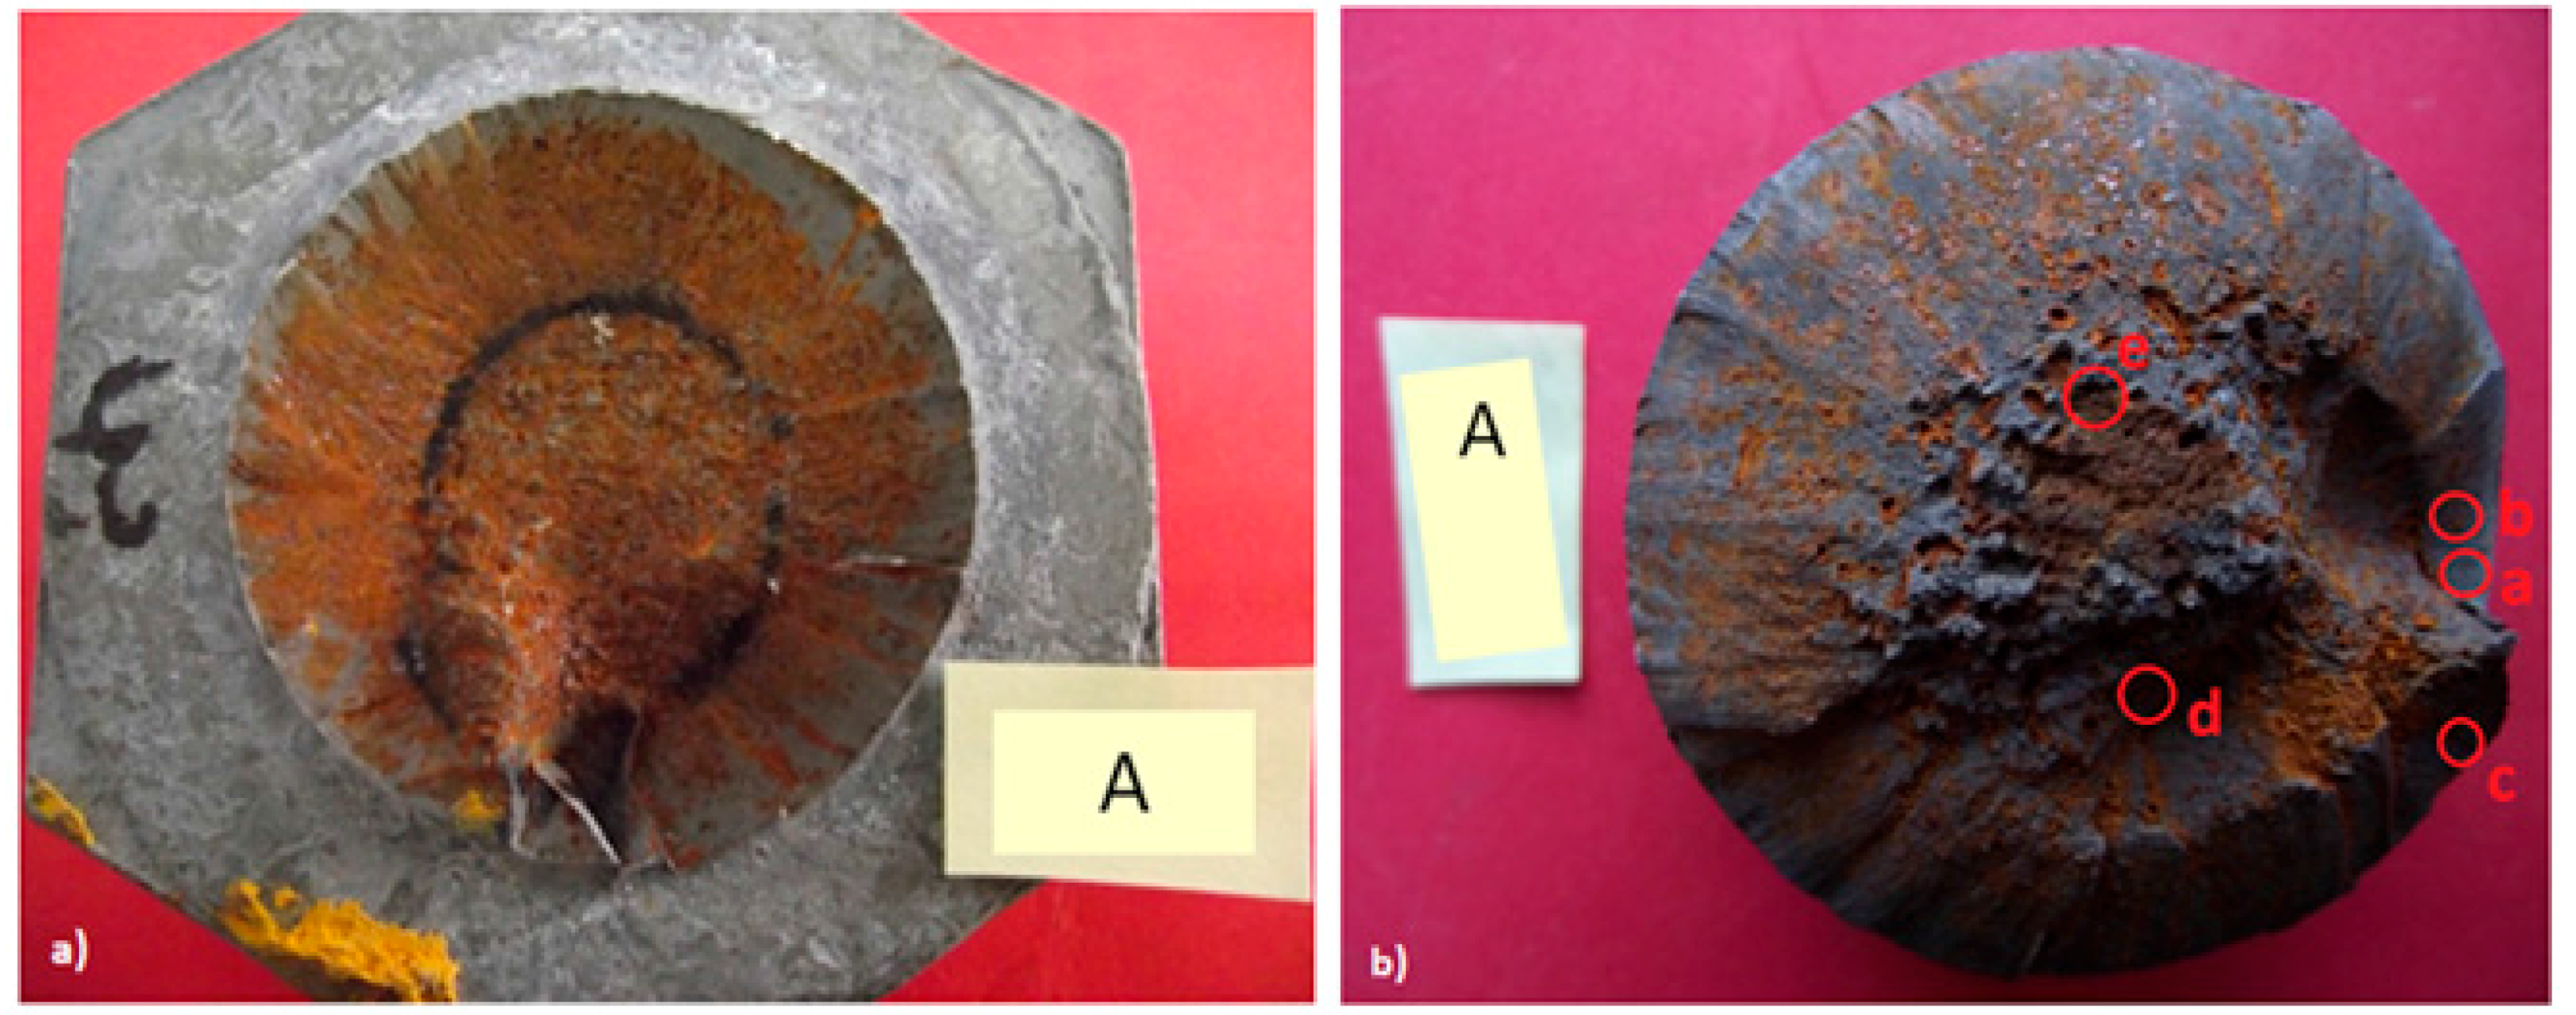
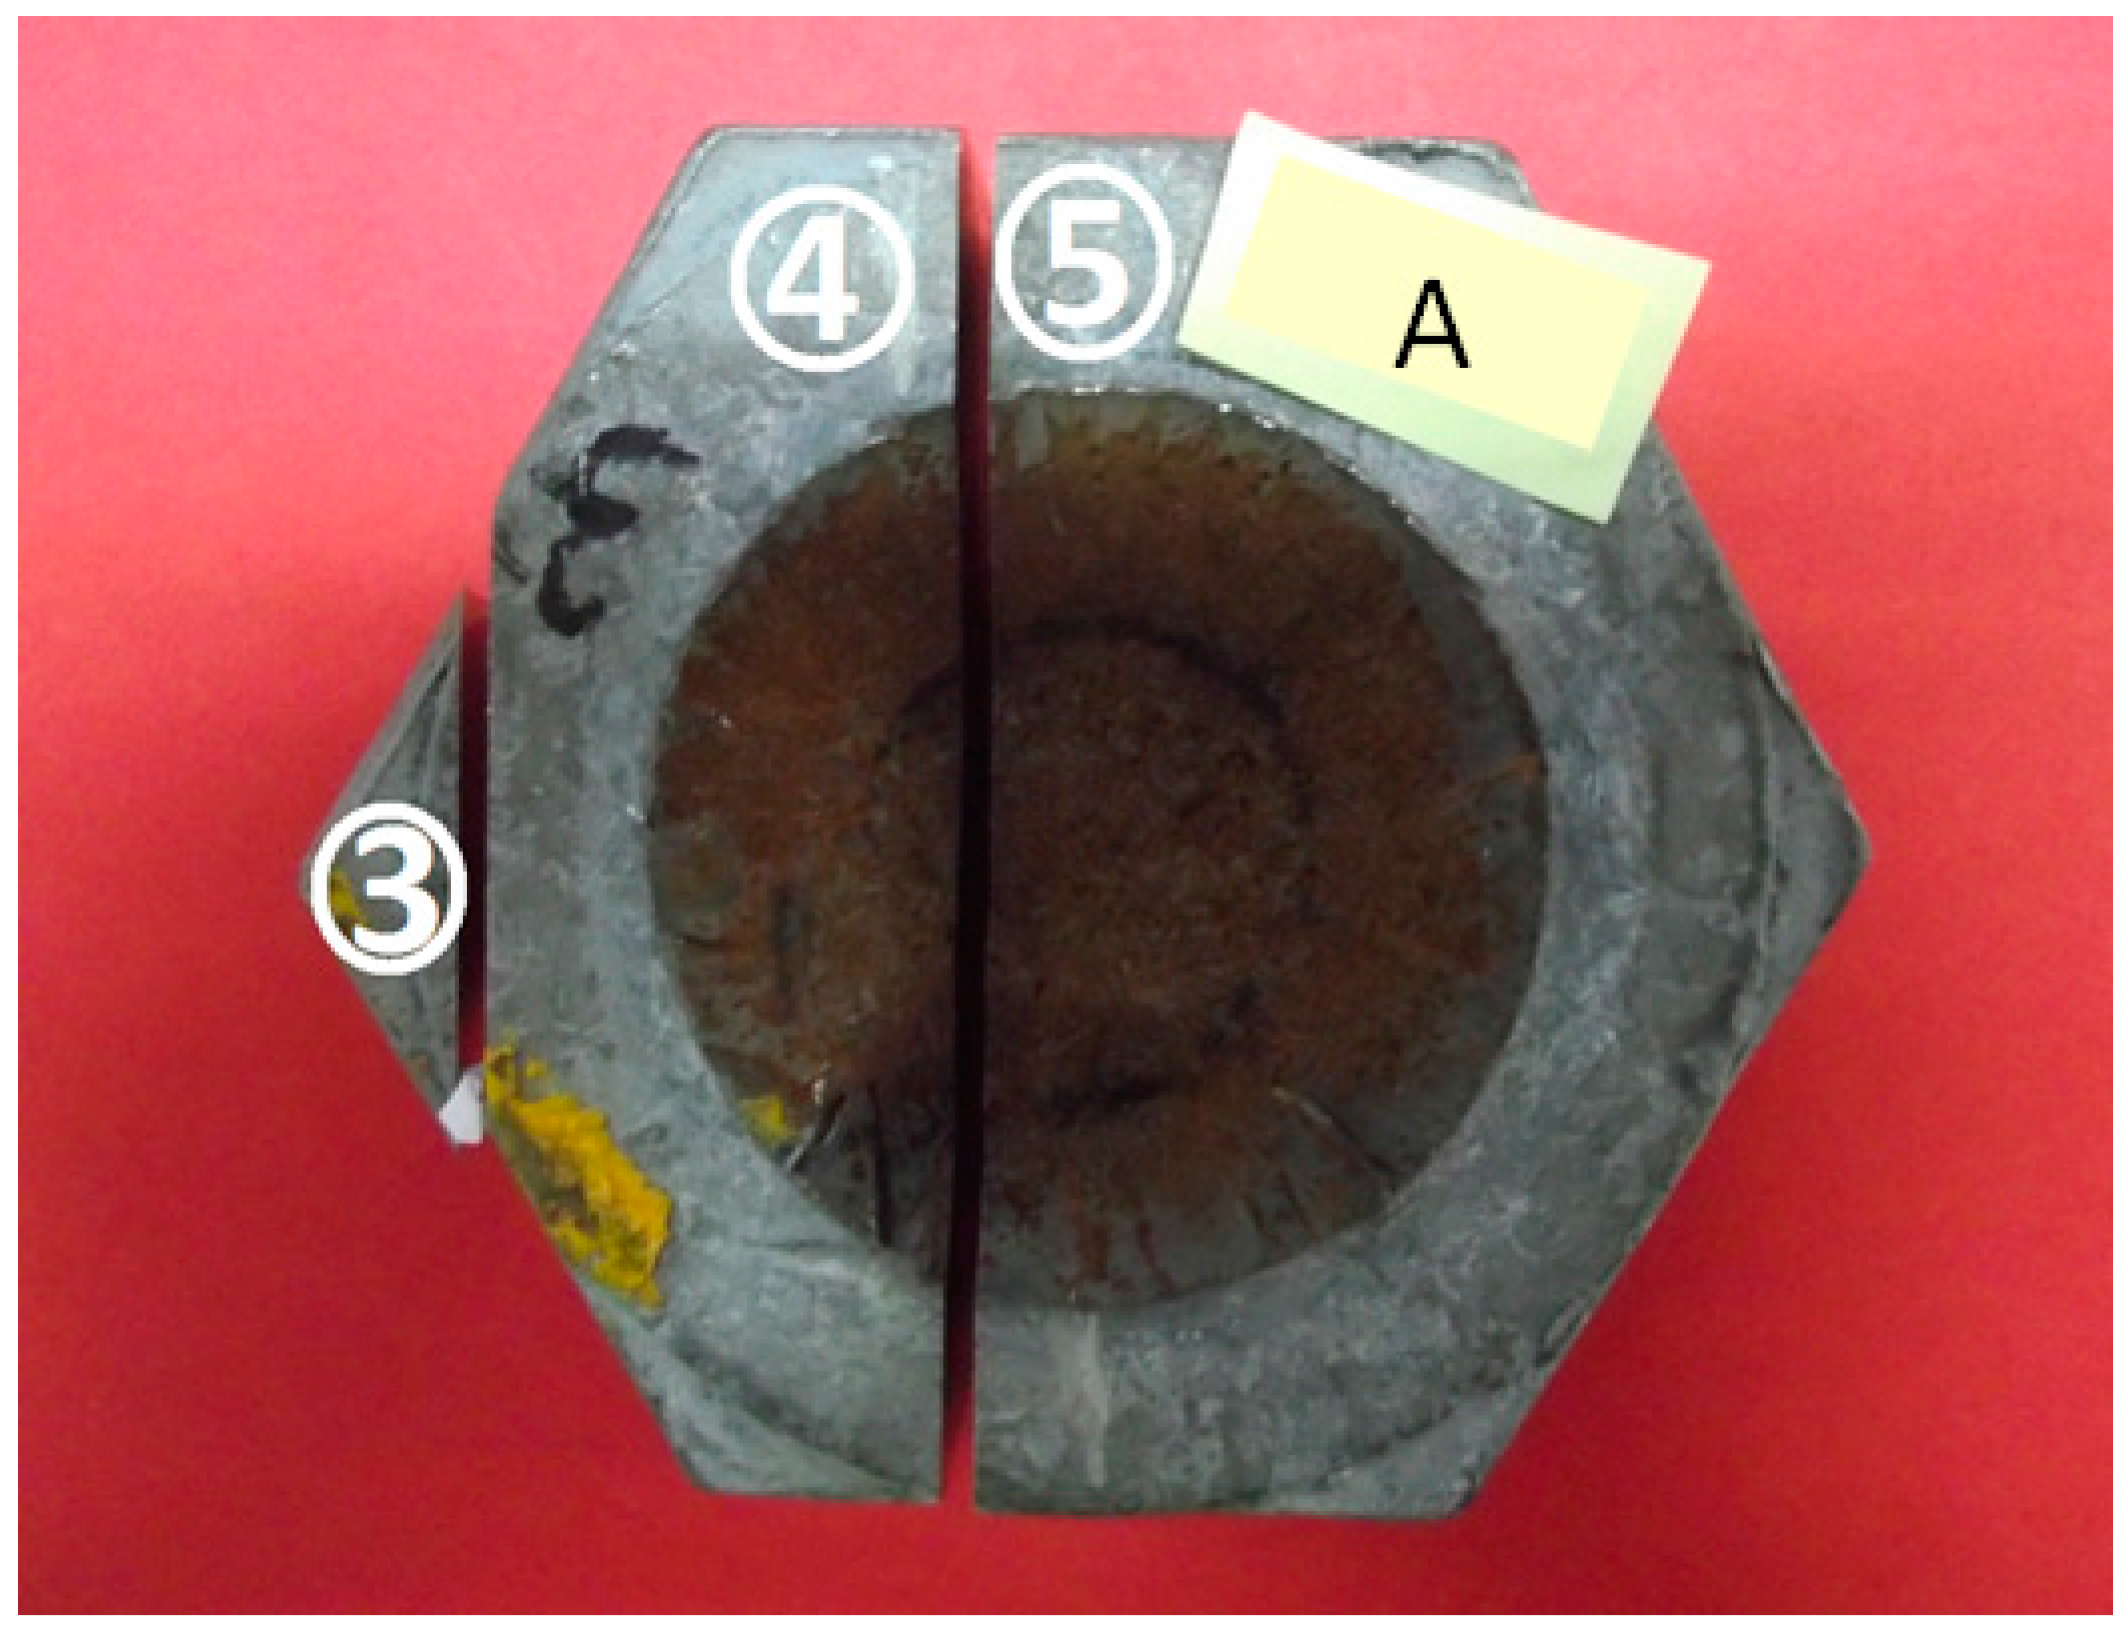
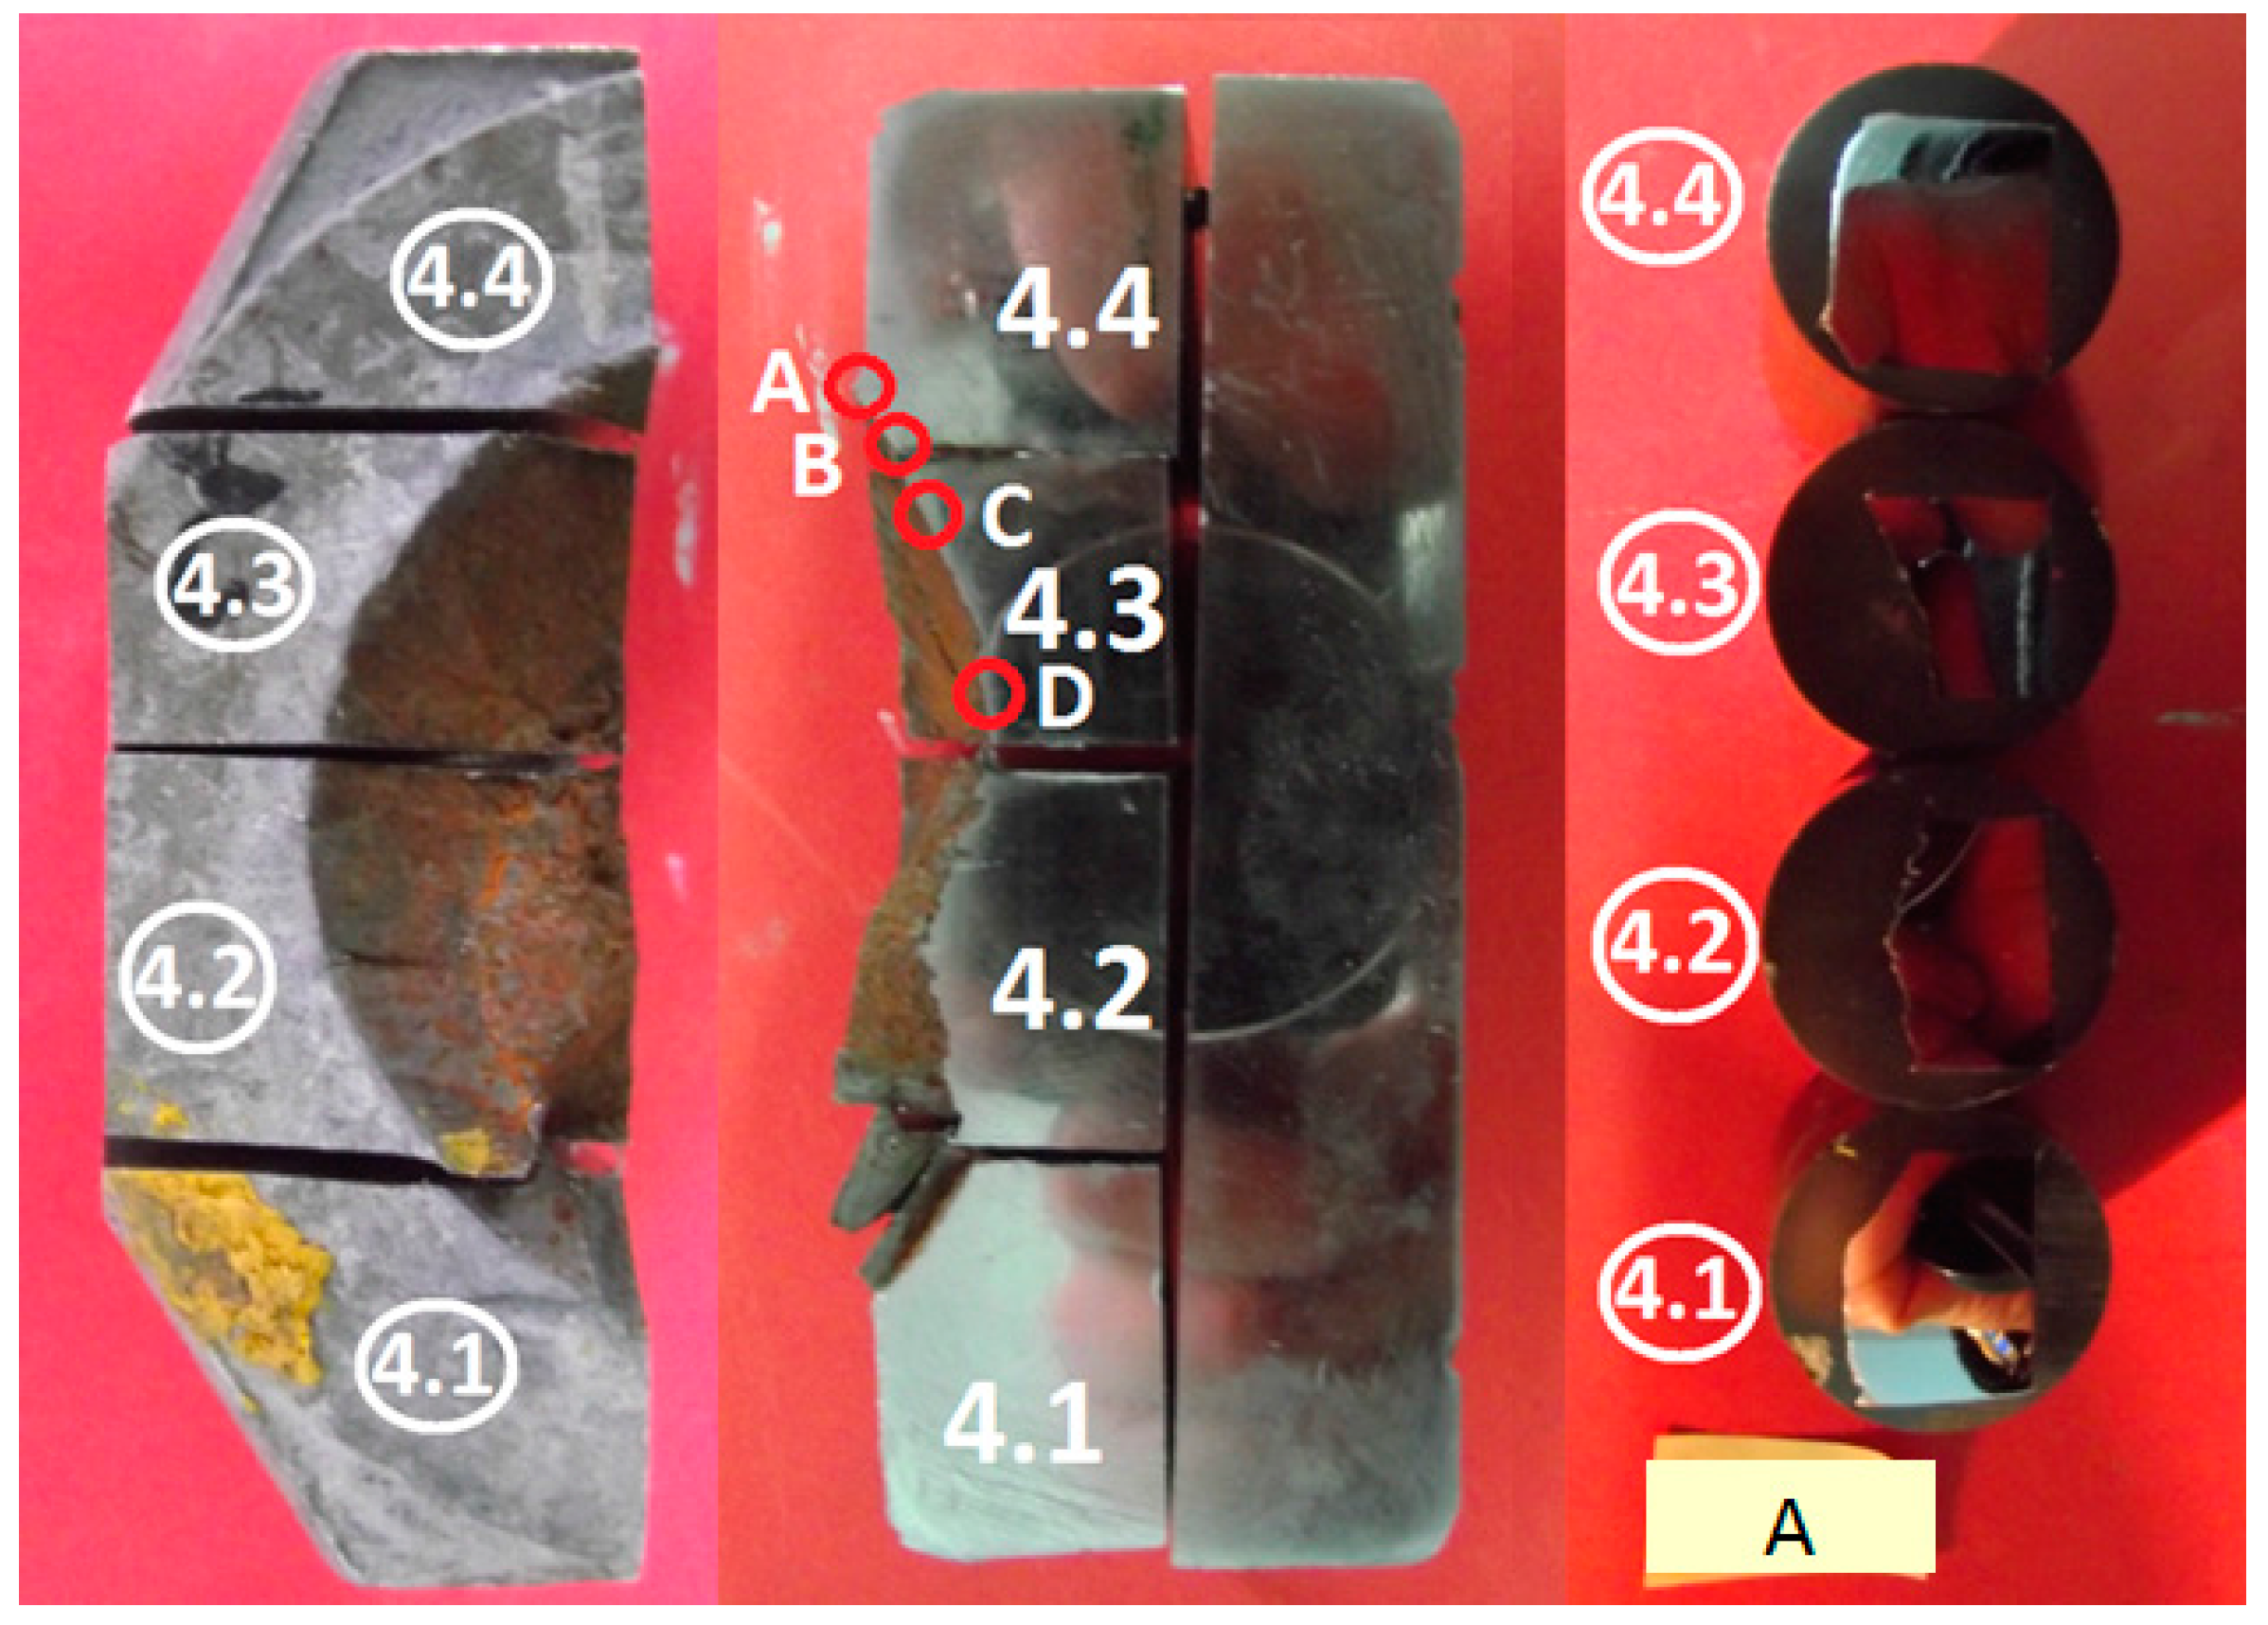
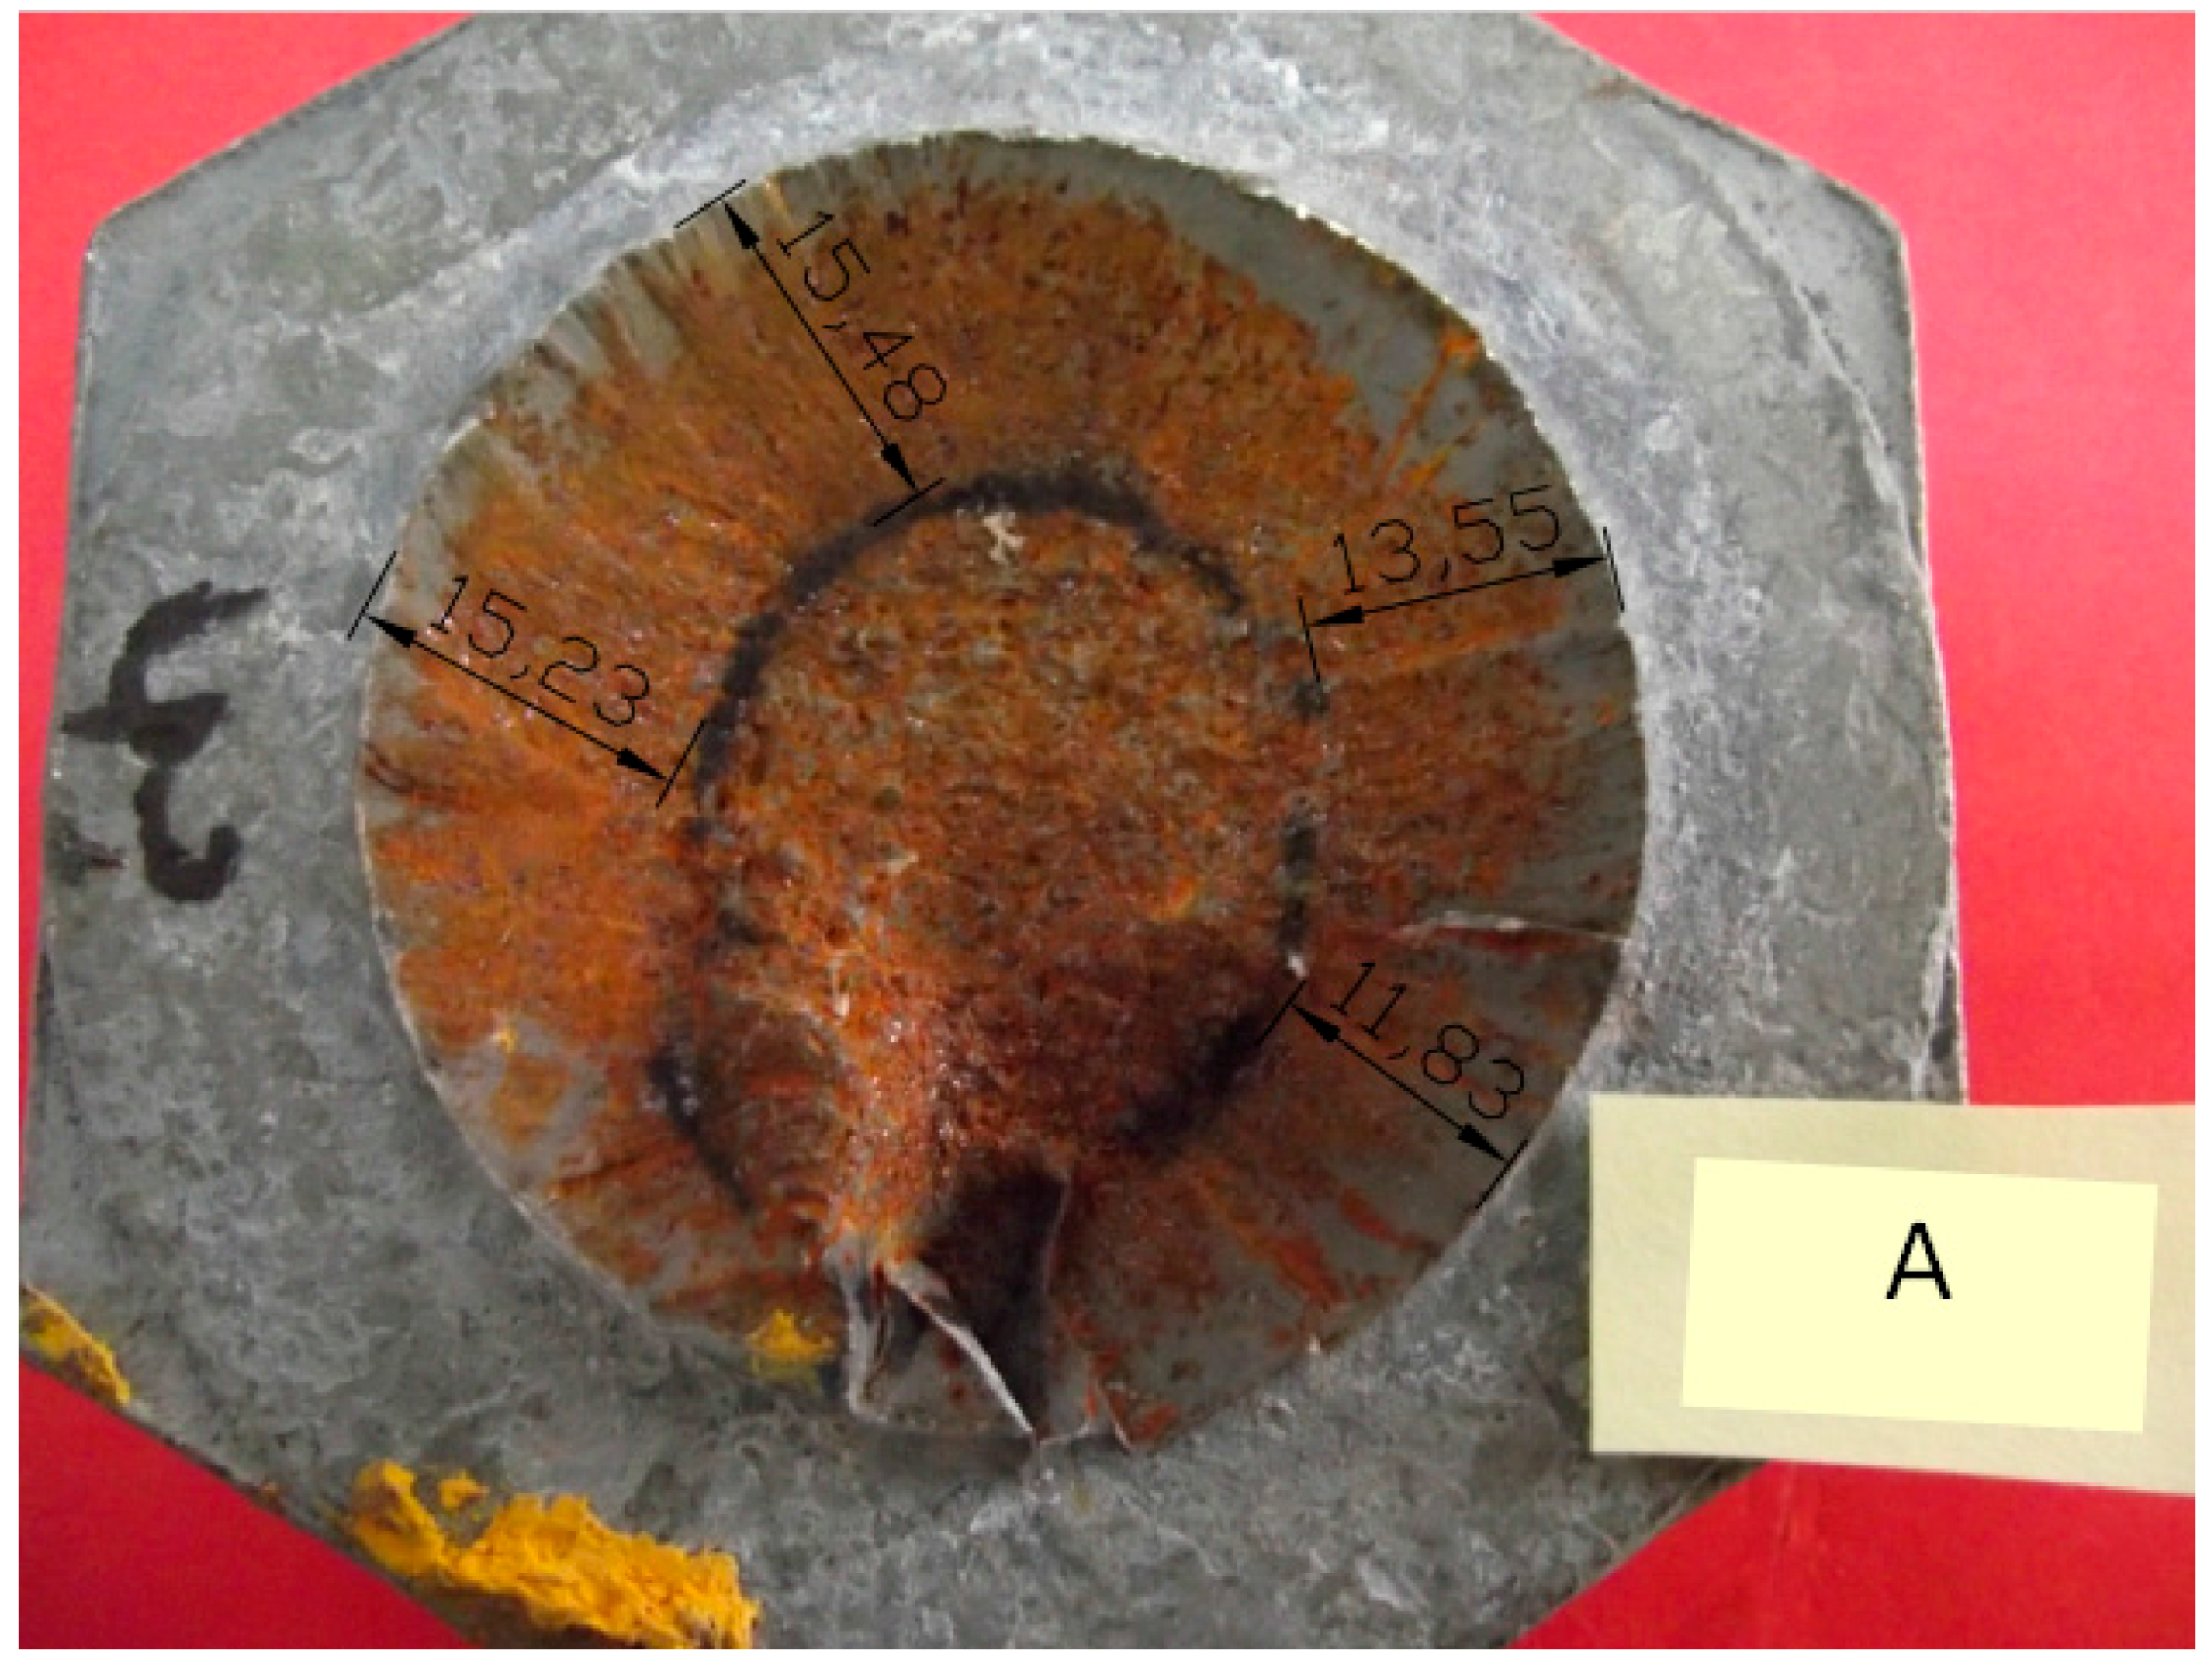
3.1. Visual Inspection and Macrographic Analysis

The failure sections of the three bolts presented two clearly different areas: a smooth one all along the external perimeter, and a quasi-circular rough area located in the centre. This appearance has been previously reported in a number of similar failures (e.g., [1]), where the smooth area was related to subcritical crack propagation processes and the rough central area was identified as the final resistant ligament with the presence of ductile micromechanisms. As an example, Figure 2 shows the fracture surface of bolt A at both the head and the shank.

3.2. Chemical Composition

A chemical analysis was performed using optical emission spectroscopy, with the results shown in Table 4. It can be observed, by comparison to Table 1, that the chemical composition satisfies the nominal composition of steel 42CrMo4.

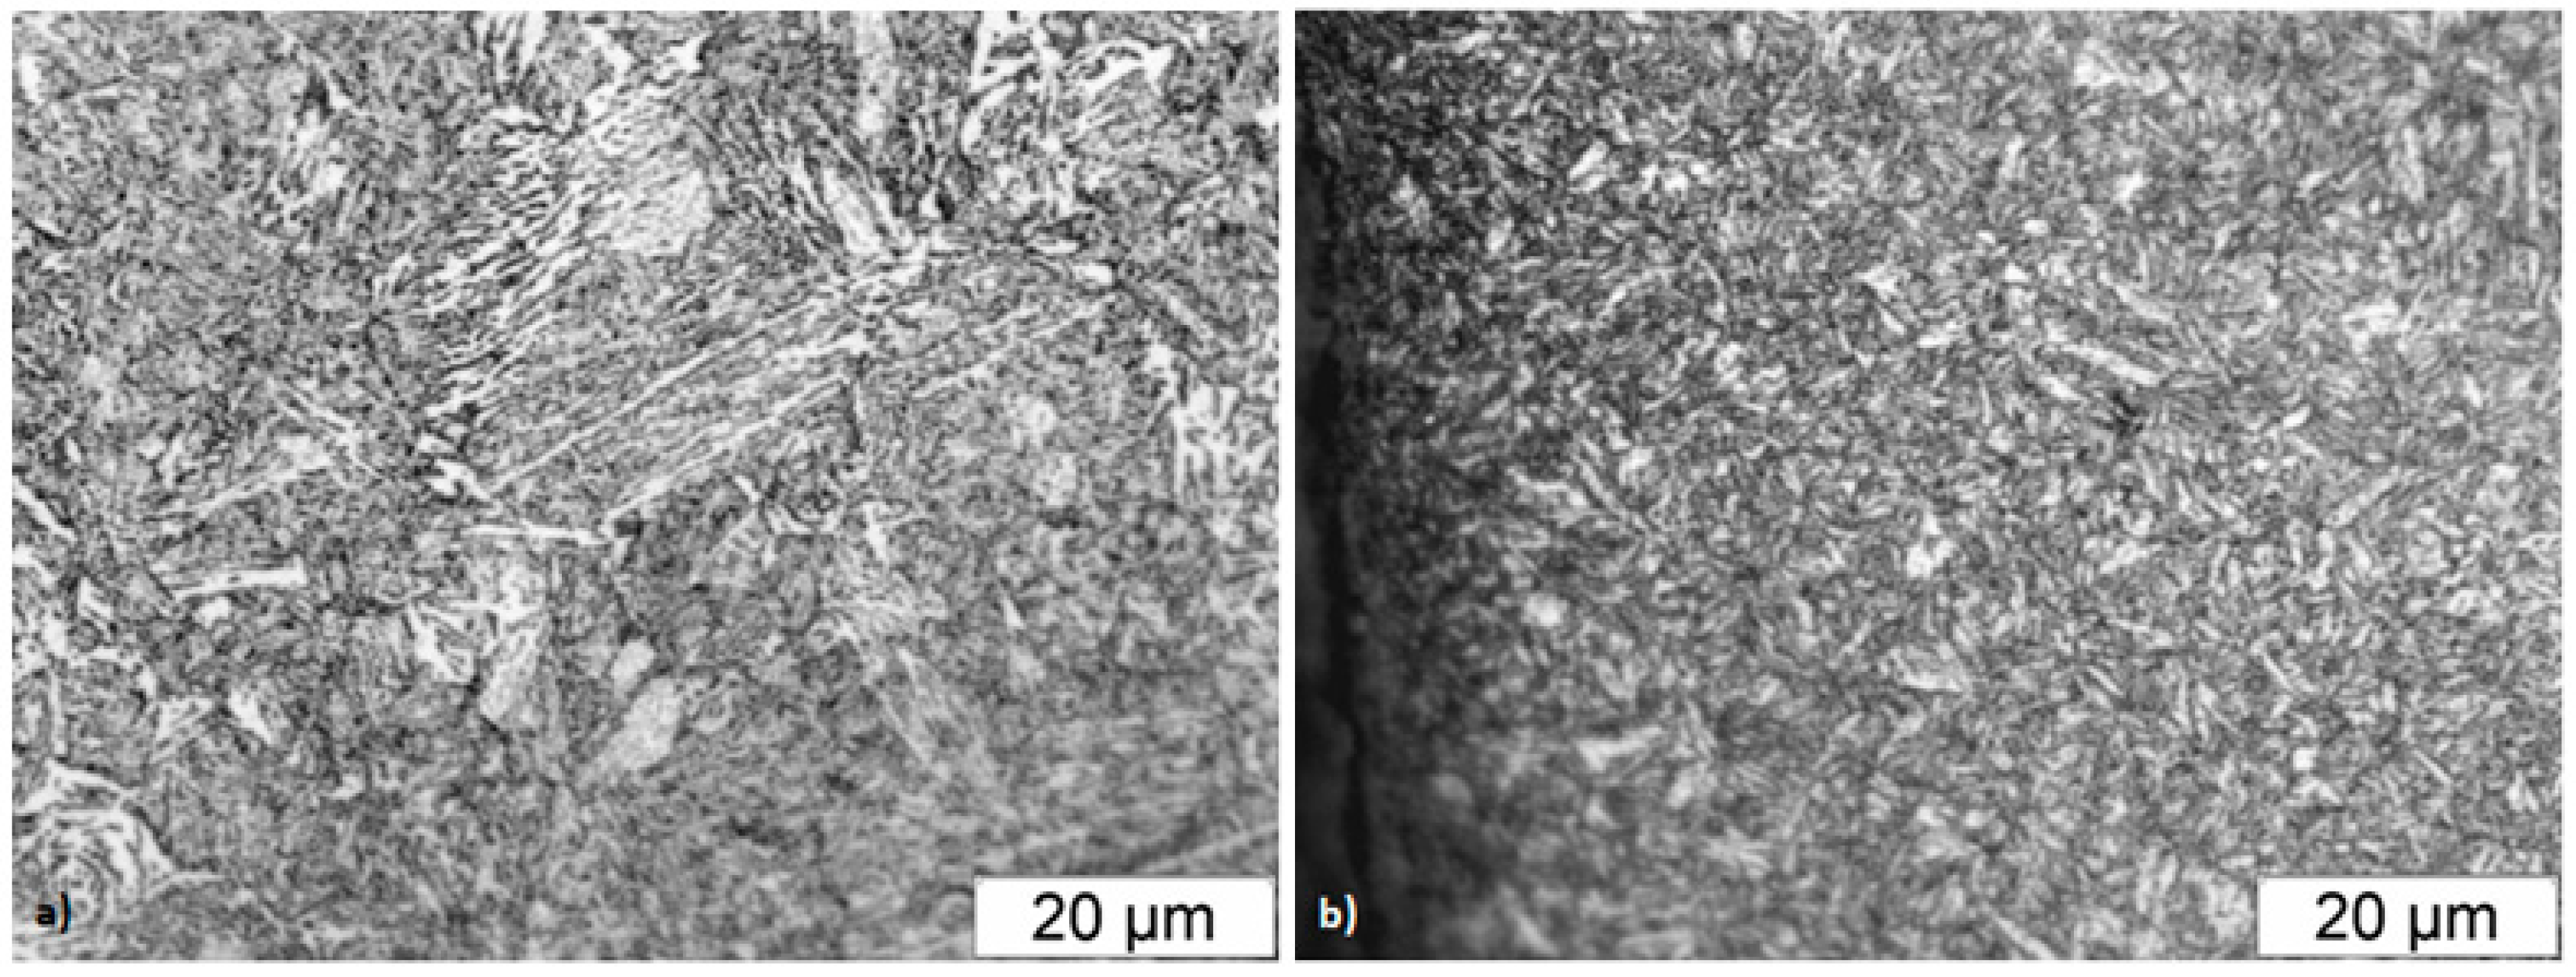
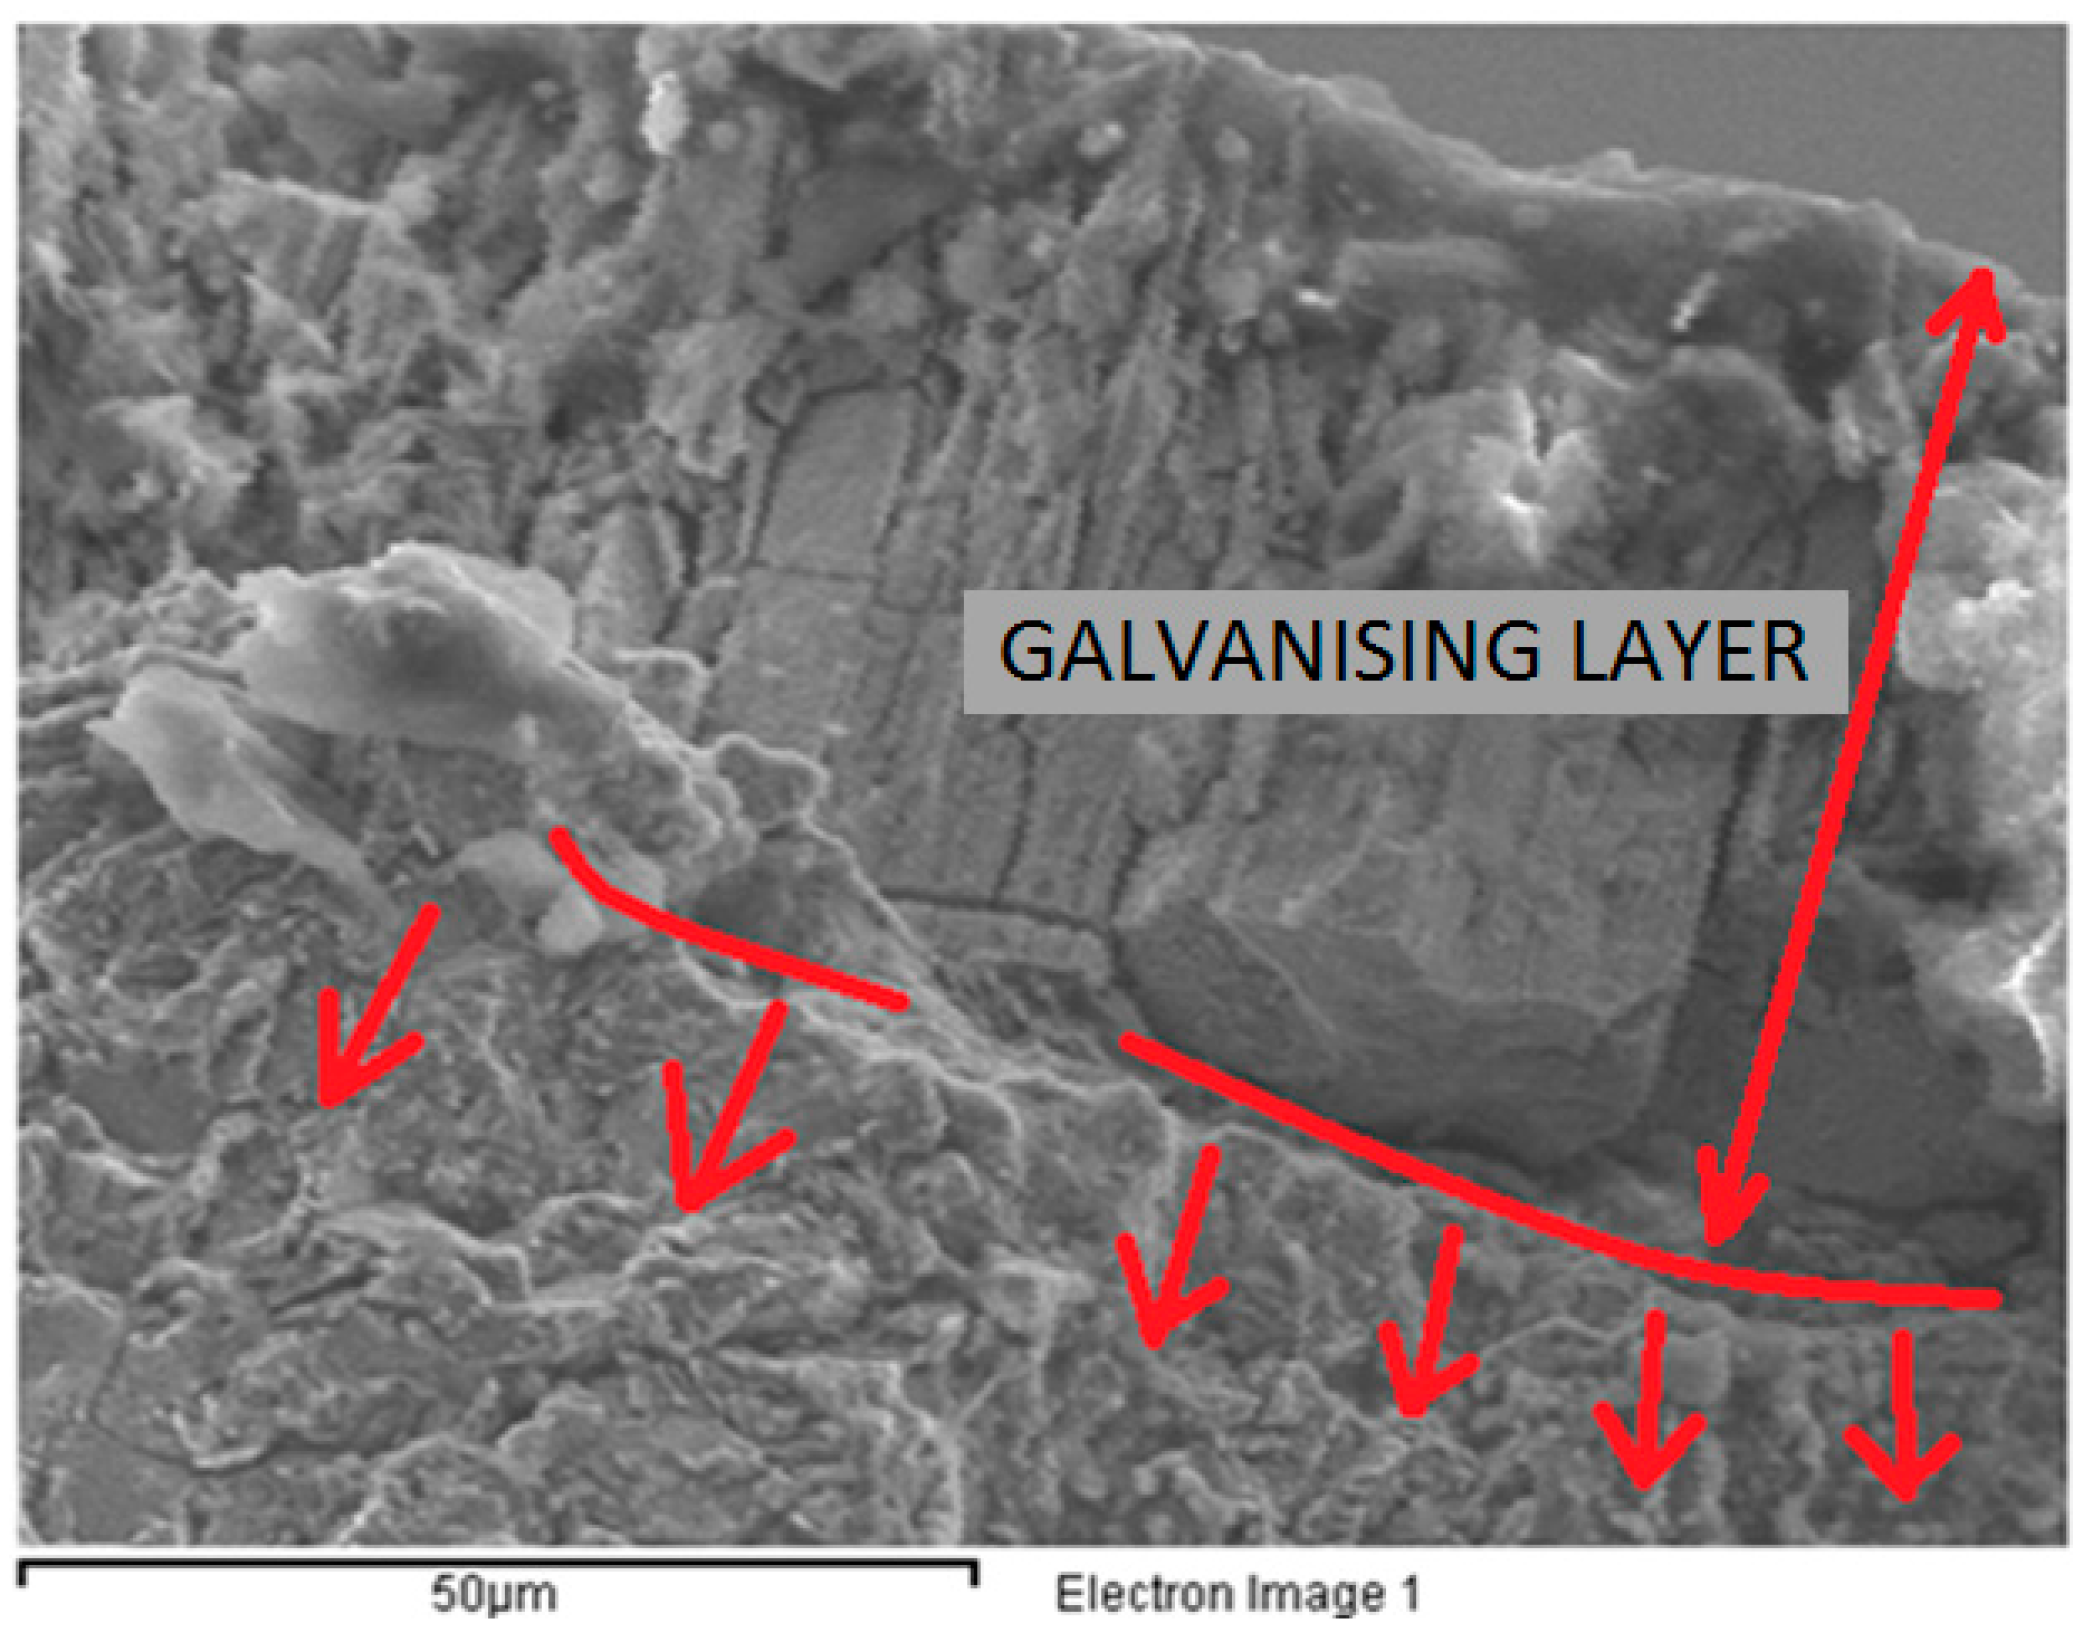
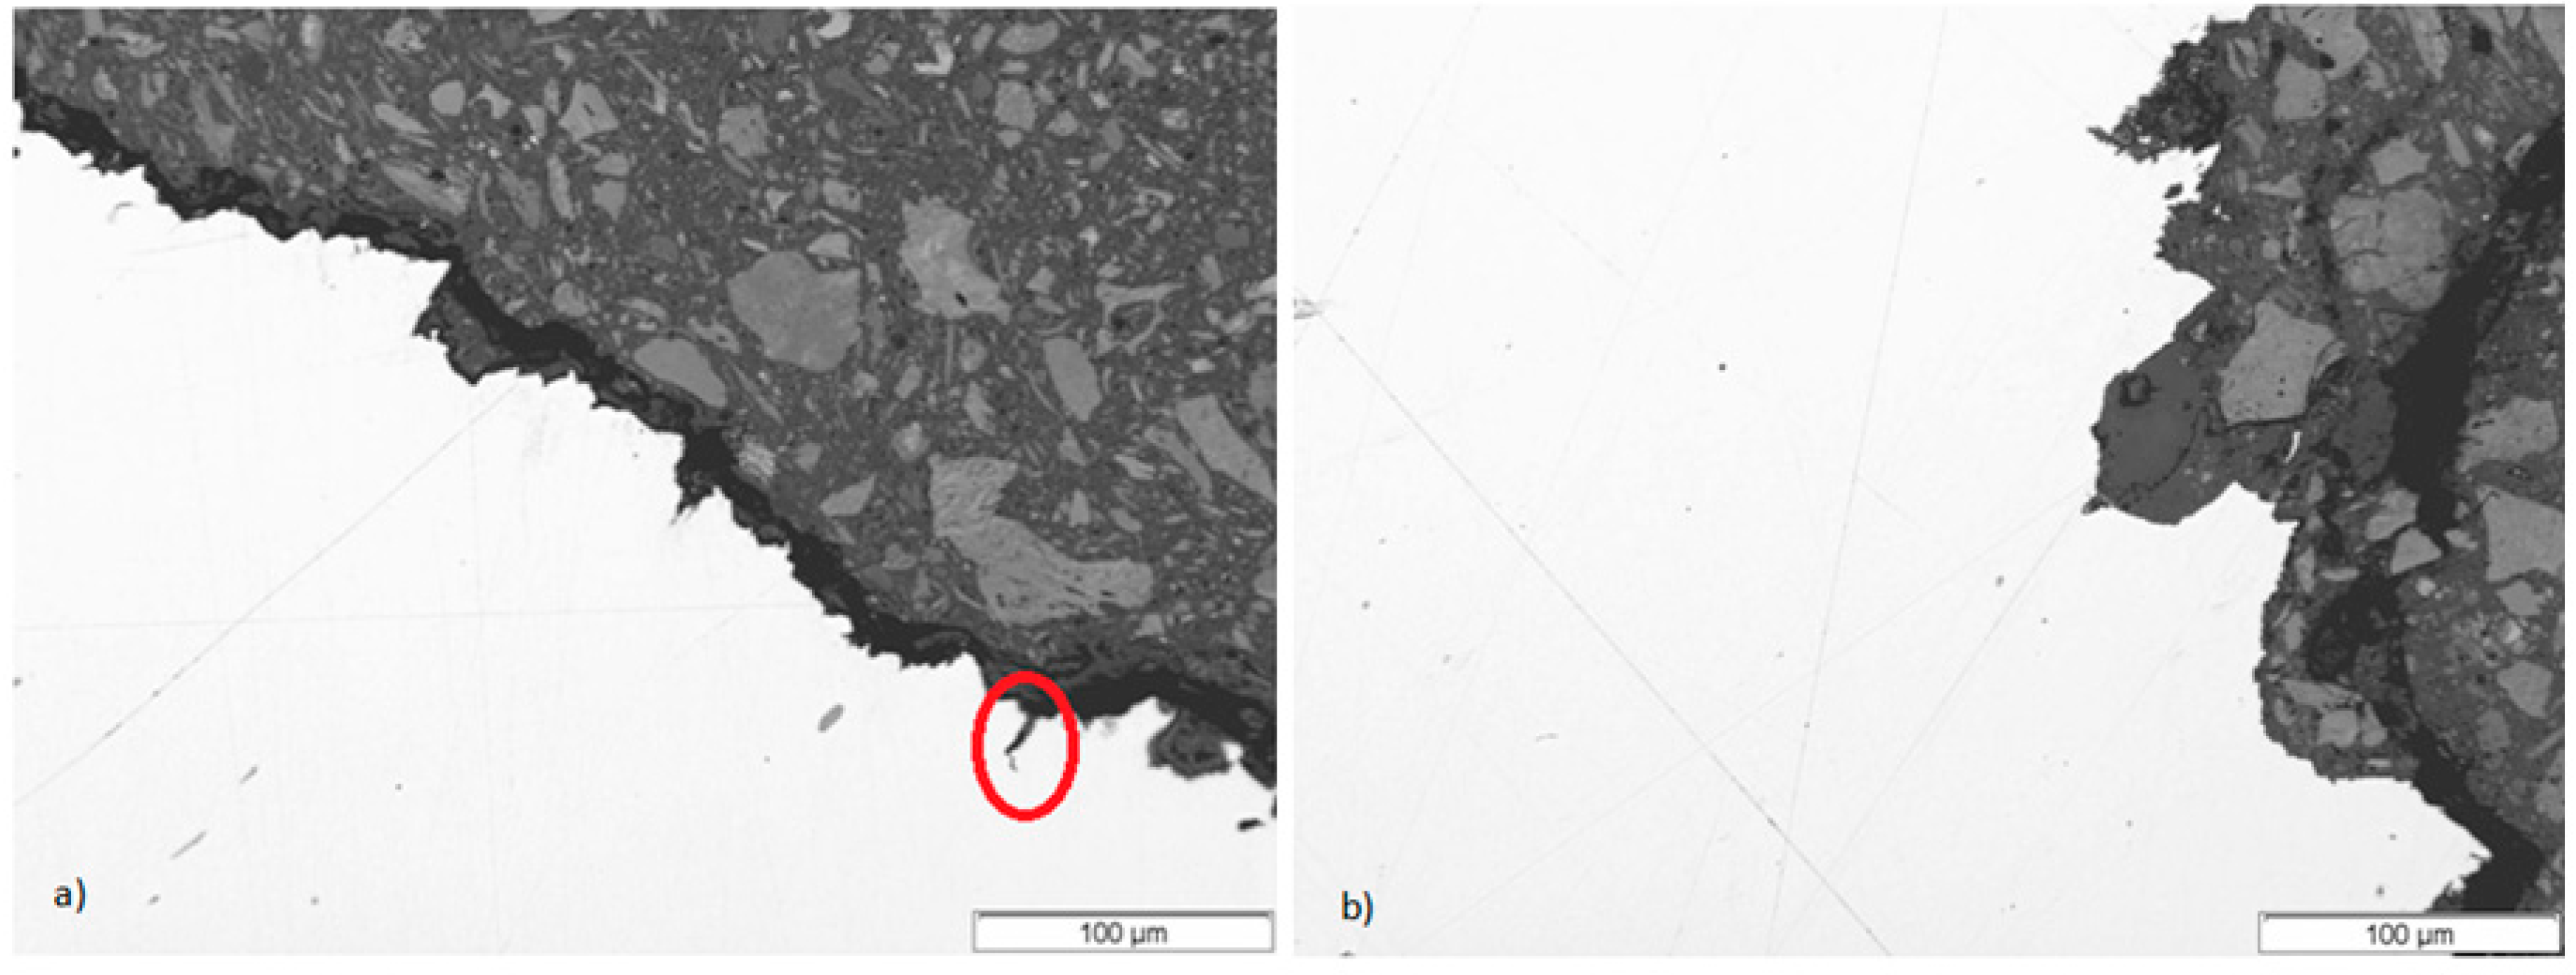
3.3. Microstructural Analysis

The bolts were sectioned as shown in Figure 3. Two sections (identified as 1 and 2) were obtained from each shank: the first piece contained the fracture section, while the second section was used to analyse the material microstructure in two different locations (samples 2.1 and 2.2, as shown in Figure 3).
Samples 2.1 and 2.2 were polished and etched in 3% nital solution. The corresponding microstructures were obtained along a radius of Section 2. Figure 4 shows the results obtained in the centre (sample 2.1) and from the surface (sample 2.2) of Section 2. It can be observed that the centre of the section (Figure 4a) presents tempered martensite together with bainite, whereas the microstructure on the surface of the bolt is basically tempered martensite. This agrees with the material specification.
The heads of the three bolts were also cut (see Figure 5) into three sections (named 3, 4 and 5). Different samples were obtained from Section 4 in order to analyse the corresponding microstructure. This was analysed at different points (A to D, as shown in Figure 6). In all cases, tempered martensite was found to be the dominant microstructure, with bainite in the centre of the section (point D, see Figure 7).

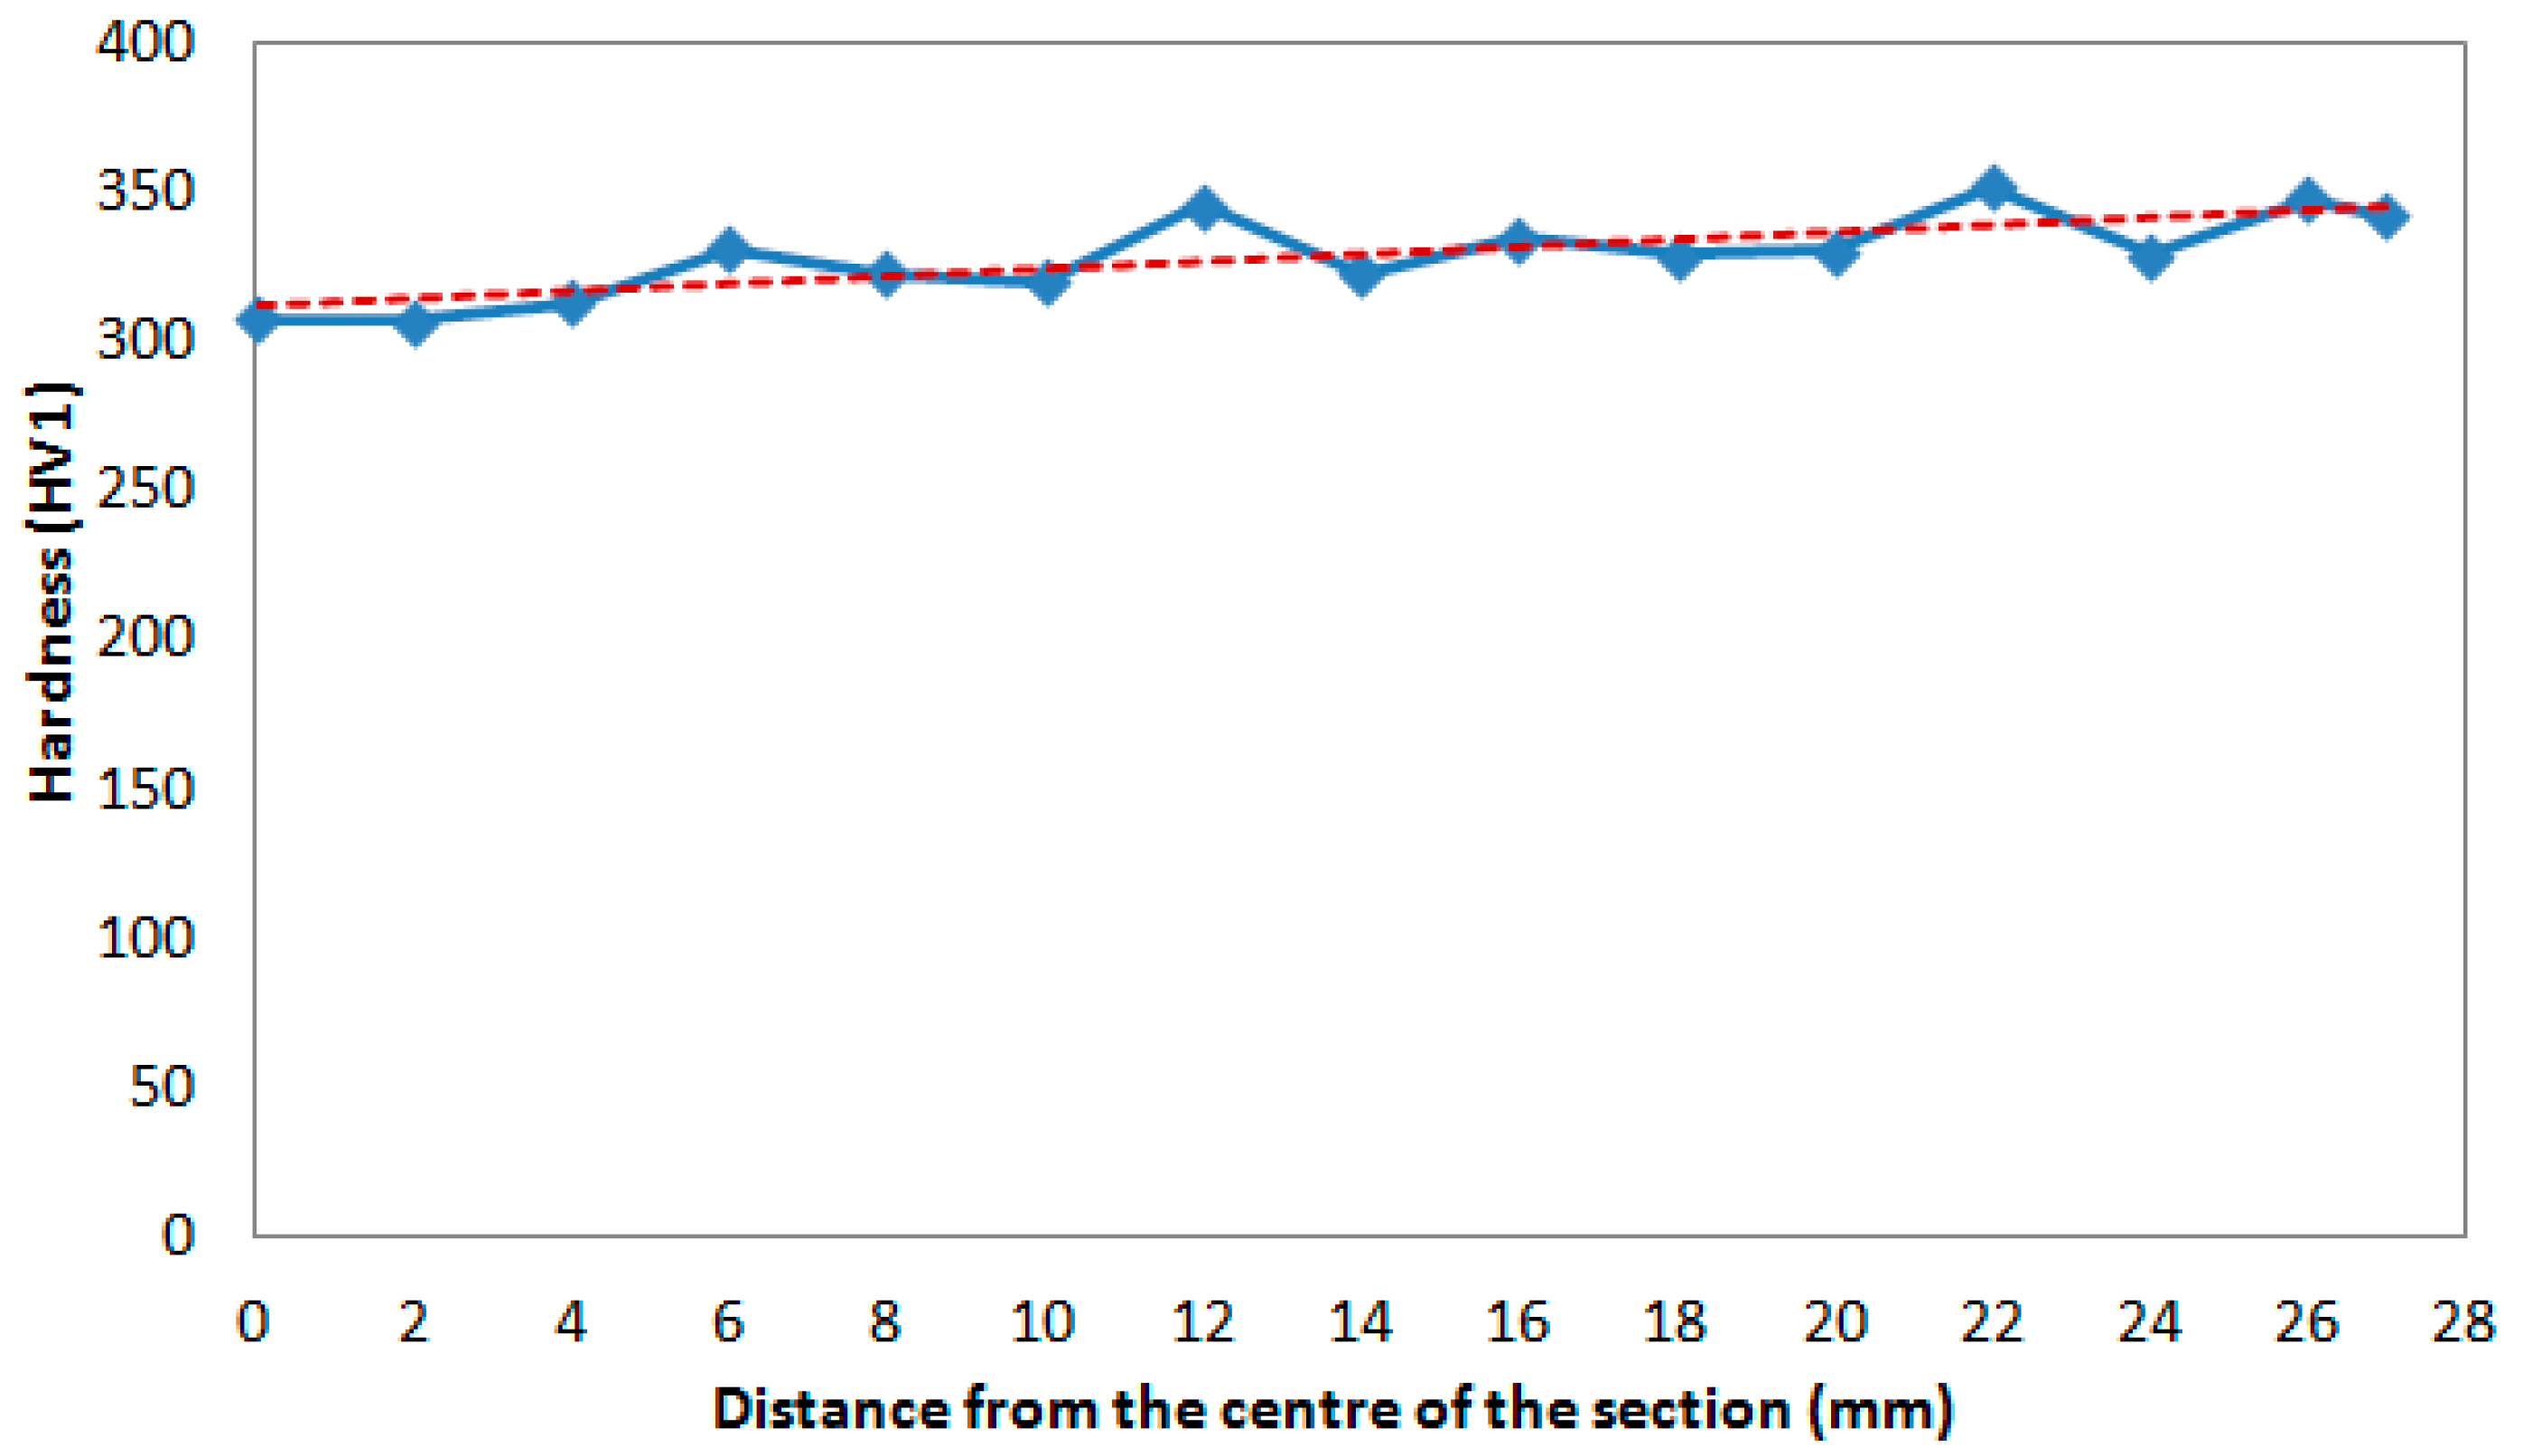
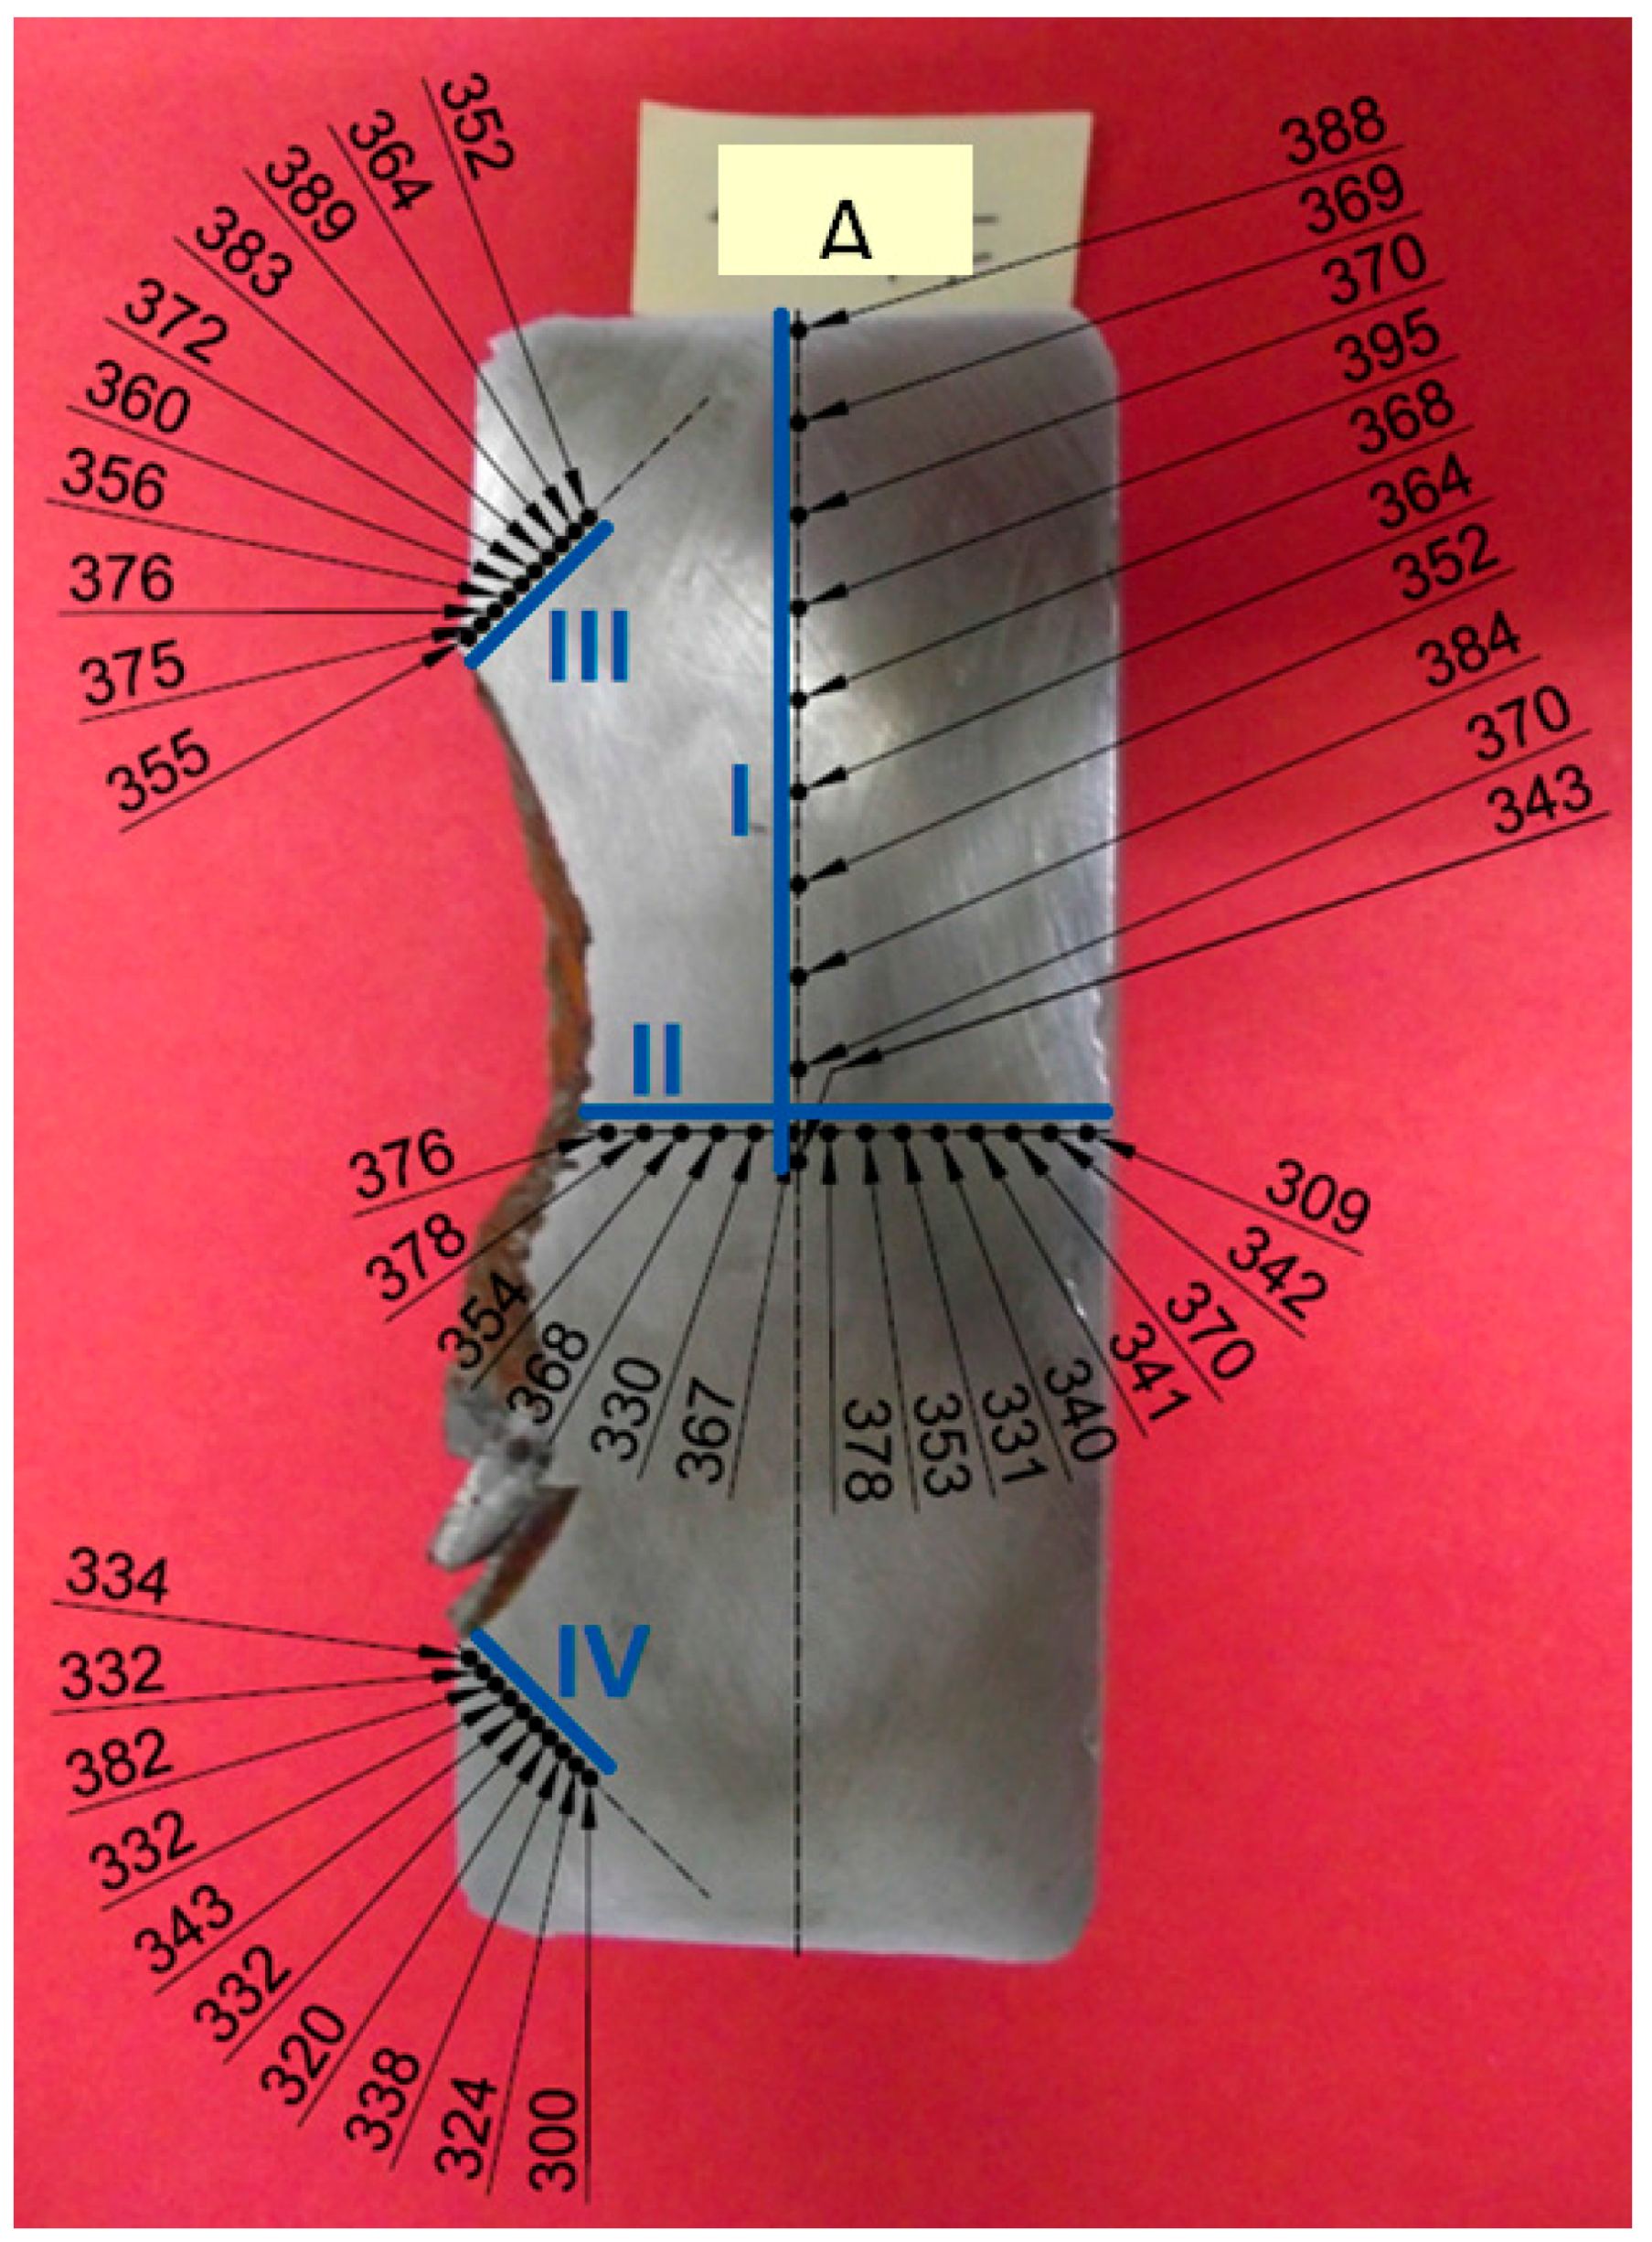
3.4. Hardness Measurements

Hardness measurements were performed on both Section 2 (all along the radius of the shank) and Section 4. For this purpose, a Vickers microdurometer was used, applying a load of 1 kg for 10 s (following [17]). Figure 8 shows the results along the mentioned radius, while Figure 9 presents a schematic of the hardness measurements performed in Section 4, where four paths were analysed:
  • Path I: all along the half-width of the bolt head, approximately in the middle of the thickness.
  • Path II: from the fracture surface to the head upper surface, all along the thickness of the bolt head.
  • Paths III and IV: following 45° with the fracture surface and starting from the points (on the fracture surface) where the bolt head and the bolt shank originally met.
The results reveal an average hardness value between 350 and 370 HV1 in paths I, II and III, and slightly lower than 350 in path IV. In any case, the hardness values observed in the bolt head are higher than those measured along the radius of the bolt shank (which vary from 300 HV1 up to 350 HV1).

3.5. Tensile Tests

Tensile tests were performed following UNE-EN-ISO 6892-1:2010 [18]. More precisely, one tensile test was performed to characterise each bolt. The tensile specimens were taken from the centre of the shank, along its longitudinal direction, with a nominal diameter of 14 mm. The results are shown in Table 5. It can be observed that the results satisfy the requirements of the material specification (Table 3).

3.6. Fractographic Analysis

The fracture surfaces of the three bolts were analysed in a Scanning Electron Microscope (SEM). Images were taken from different areas of the fracture surfaces, as shown in Figure 2b (points “a” to “e”) for bolt A. The most significant observations are shown in Figure 10: the perimeter of the section (i.e., points “a”, “b”, and “c”) presented a mixed fracture surface combined with a predominant intergranular fracture with transgranular tearing and secondary cracking (Figure 10a). This confirms a subcritical crack propagation process prior to final fracture; the inner part of the fracture surface (i.e., points “d” and “e”) reveals a ductile fracture with multiple microvoids, corresponding to the remnant ligament of the section at failure.
Figure 11, taken at point “c”, shows the galvanising layer with an important presence of cracks. Cracks are also observed in the interface between the galvanising layer and the base material of the bolt, with multiple initiation points.
The profile of the fracture surface was also analysed using optical microscopy. As an example, Figure 12 shows some significant results. Figure 12a corresponds to an area located in the external perimeter, near point “b”. A brittle aspect with secondary cracks emerging from the primary quasi-plane crack path can be observed, proof of the HISCC mechanism; Figure 12b corresponds to an area around point “d”, revealing a much more ductile behaviour.

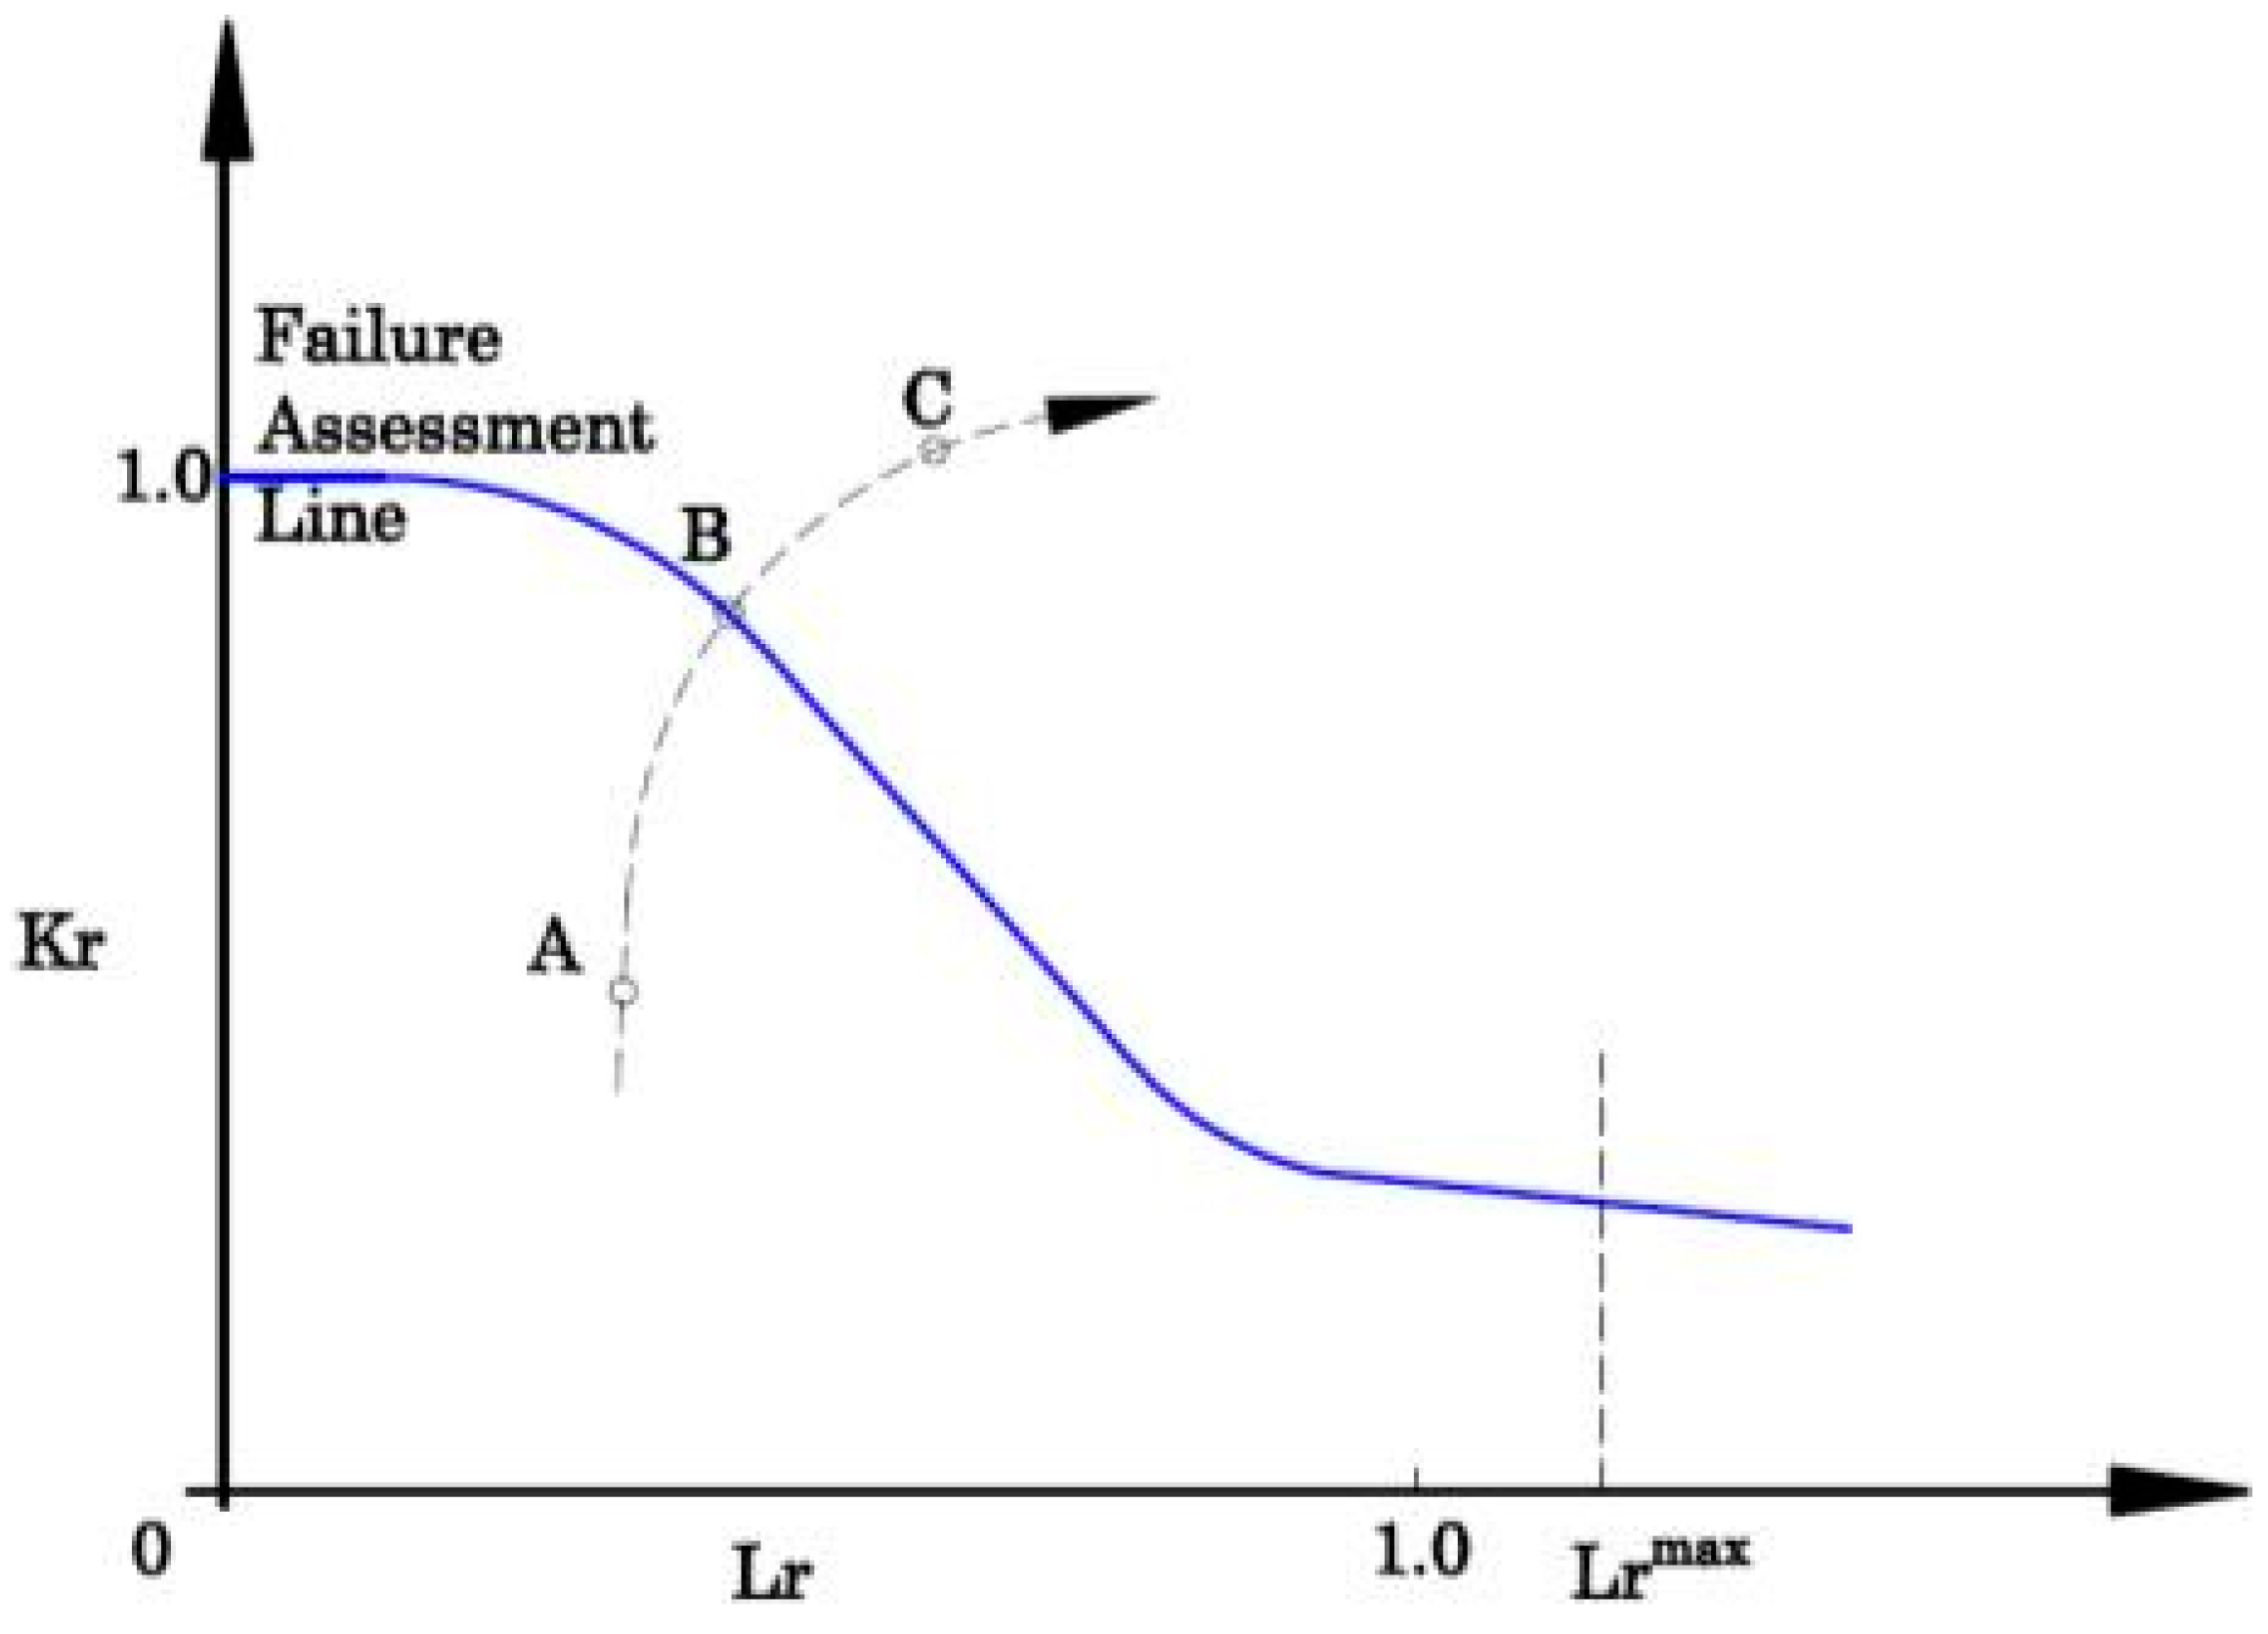
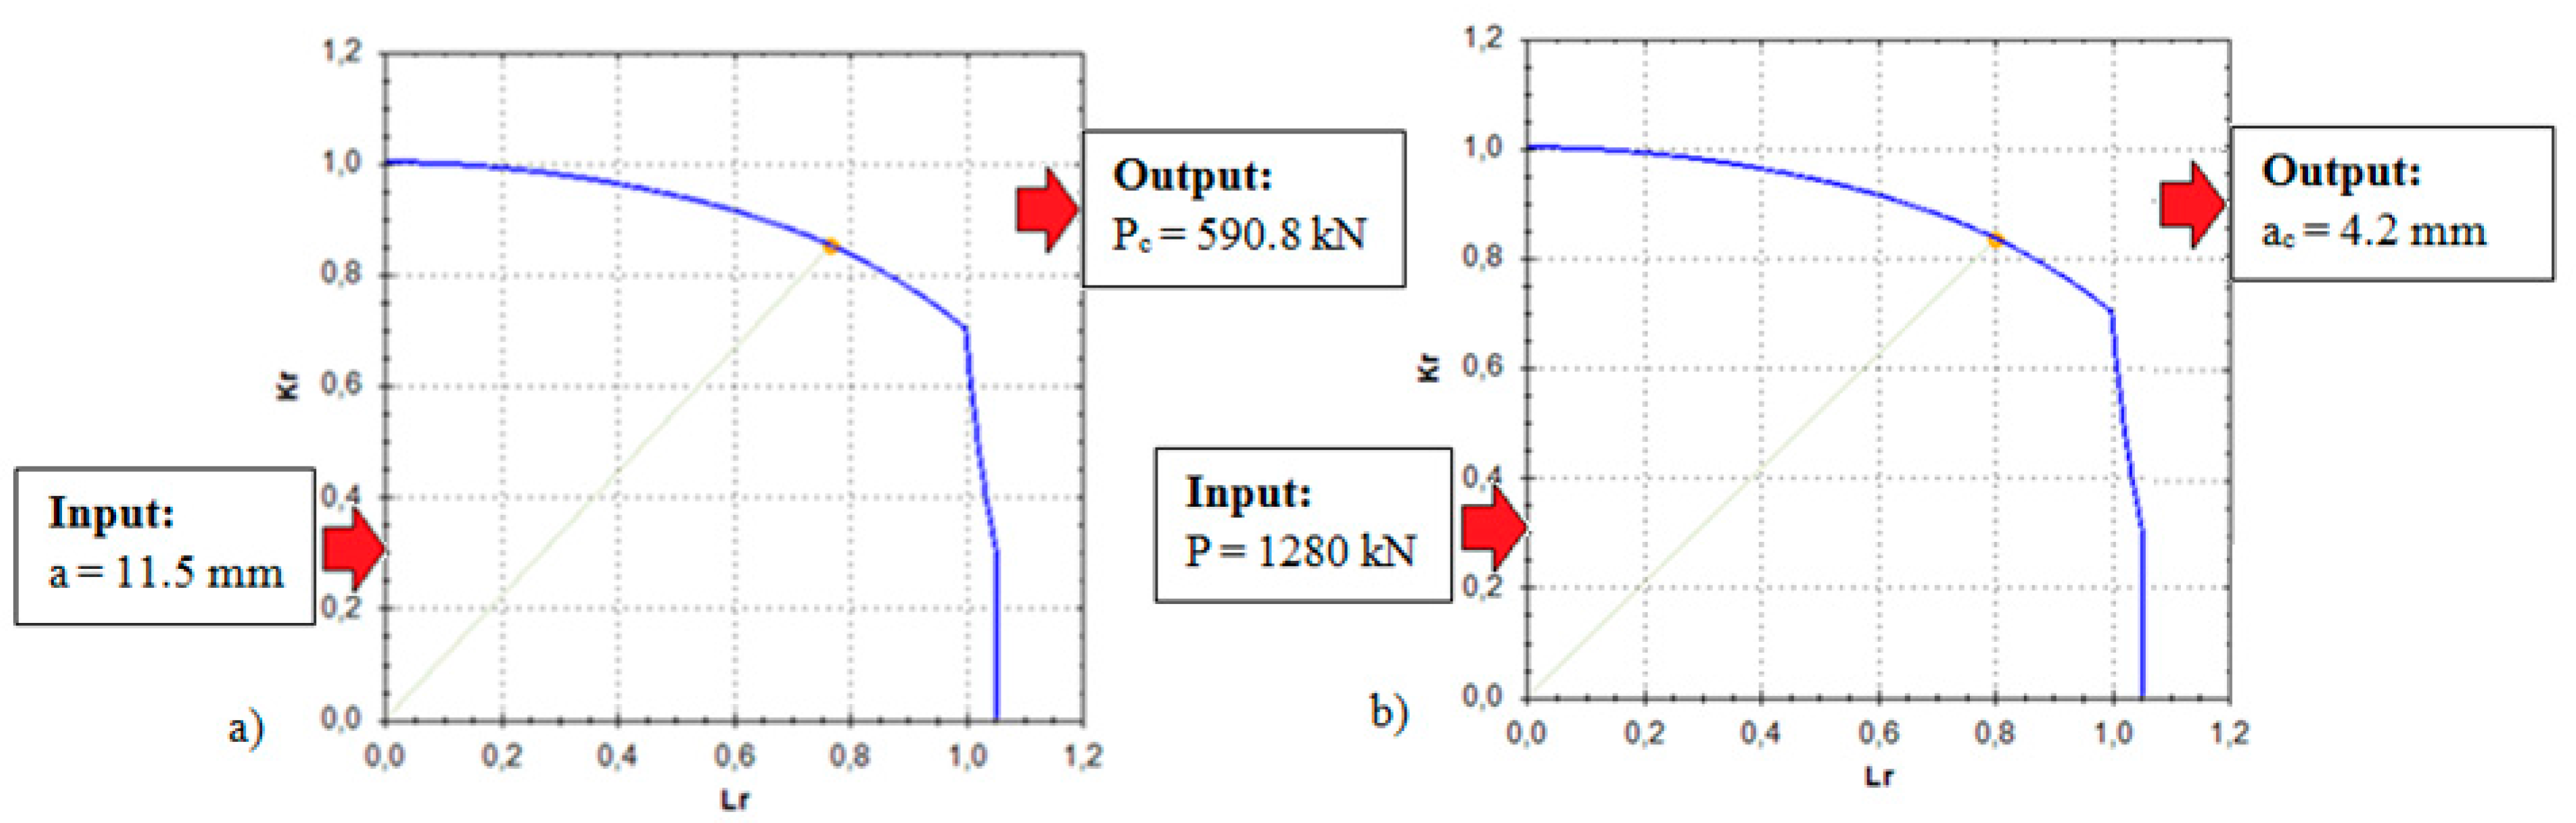
3.7. Structural Integrity Assessment

This section presents the structural integrity assessment of the analysed bolts using Failure Assessment Diagrams (FADs) [19,20]. For a given structural component containing a crack, the FADs present a simultaneous assessment of both the fracture and plastic collapse processes by using two normalised parameters, Kr and Lr, whose expressions are (e.g., [19,20]):
K r = K I K mat
L r = P P L
where P is the applied load, PL is the plastic collapse load, KI is the stress intensity factor, and Kmat is the material fracture resistance measured by the stress intensity factor (e.g., KIC, KJC, etc.). Lr may also be expressed by the following Equation (3), which is totally equivalent to Equation (2) [19]:
L r = σ ref σ Y
where σref is the reference stress and σY is the material yield stress.
Lr evaluates the structural component situation against plastic collapse, and Kr evaluates the component against fracture, with the assessed component being represented by a point of coordinates (Kr, Lr). Once the component assessment point is defined through these coordinates, it is necessary to define the component-limiting conditions (i.e., those leading to final failure). To this end, the Failure Assessment Line (FAL) is defined, so that if the assessment point is located between the FAL and the coordinate axes, the component is considered to be under safe conditions, whereas if the assessment point is located above the FAL, the component is considered to be under unsafe conditions. The critical situation (failure condition) is that in which the assessment point lies exactly on the FAL. Figure 13 shows an example with the three different possible situations when performing fracture initiation analyses.
In practice, structural integrity assessment procedures (e.g., [19,20]) provide approximate solutions to the FAL, which are generally defined through the tensile properties of the material. As an example, Option 1 of the FITNET FFS Procedure for those materials that do not have a yield plateau (continuous yielding), is defined by the following equations [20]:
K r = f ( L r ) = ( 1 + 0.5 ( L r ) 2 ) 1 / 2 ( 0.3 + 0.7 × exp ( μ L r 6 ) ) , L r 1
K r = f ( L r ) = f ( 1 ) × L r N 1 2 N , 1 < L r L rmax
μ = min [ 0.001 × ( E / σ y ) ; 0.6 ]
N = 0.3 ( 1 σ y σ u )
L r max = 0.5 σ y + σ u σ y
f ( 1 ) = ( λ + 1 2 λ ) 1 / 2
where σy, σu and E are the proof stress, the ultimate tensile strength and the elastic modulus, respectively.
In any case, in order to complete the structural integrity assessment of the bolts, it is necessary to quantify several parameters: the crack size (a), the applied load or stress, the material fracture resistance (Kmat), and the material tensile properties.
Concerning the crack size, the results shown above (at both the macro- and microscopical levels) reveal that the fracture surfaces present two distinct zones: an external smooth perimeter corresponding to a mixed fracture surface combining a predominant intergranular fracture with transgranular tearing, and an internal area with a clear presence of ductile micromechanisms. The external perimeter seems to correspond to subcritical crack propagation prior to final failure, and it has been macroscopically marked out in the three bolts, as shown in Figure 14 for the particular case of bolt A. The extension (thickness) of this perimeter, corresponding to the crack size at failure, generally varies between 11.5 mm and 16.5 mm, although it may be punctually lower.
Regarding the applied load, and following the information provided by the property, the bolts were subjected to a preload of 1280 kN before being put into service. It is also known that failures took place after several weeks of service, so the bolts did not fail during the application of the preload.
Moreover, six Charpy specimens were machined from the bolts. Three of the specimens were machined from the external part of the bolt section, and the other three were obtained from the centre (in all cases, the longitudinal direction of the Charpy specimens coincided with the longitudinal axle of the bolt shank). The Charpy tests were performed following ISO 148-1:2011 [21]. The test temperature was −20 °C, considering the possibility of working conditions at low temperatures and also to compare the obtained results with the material specifications (Table 3). The average values of the Charpy energy were 69 J and 72 J, respectively, for the external material and the core of the bolt. This little difference agrees with the small differences found in the corresponding microstructures and hardness measurements. Nevertheless, in both cases the results are well beyond the material specification (Table 3). BS7910:2005 [19] provides a formulation that allows the fracture resistance to be correlated from Charpy measurements:
K mat = [ ( 12 C v 20 ) ( 25 / B ) 0.25 ] + 20
where Cv is the Charpy energy of the material and B is the thickness of the component (here, the diameter of the bolts). The resulting estimations of Kmat are 85.1 MPa·m1/2 in the external material and 86.9 MPa·m1/2 in the middle of the bolt. This little difference justifies, for the sake of simplicity, the use of the lower value in the FAD assessments shown below.
Finally, tensile properties have been taken from the material specifications (Table 3). Therefore, a yield stress of 940 MPa and an ultimate tensile strength of 1040 MPa have been considered. Given the results obtained in the tensile tests, which are 6%–8% higher than those required in the specification, this is a slightly conservative assumption.
With all these data, it is already possible to perform the structural integrity (FAD) assessment. Here, software VINDIO 1.1 has been used, which is based on the KI and PL (or σref) solutions provided by BS7910:2005 [19] and the FITNET FFS Procedure [20], and the FAL solutions provided by the FITNET FFS Procedure (now coincident with those gathered in the newest version of BS7910 [19]). Two situations have been analysed:
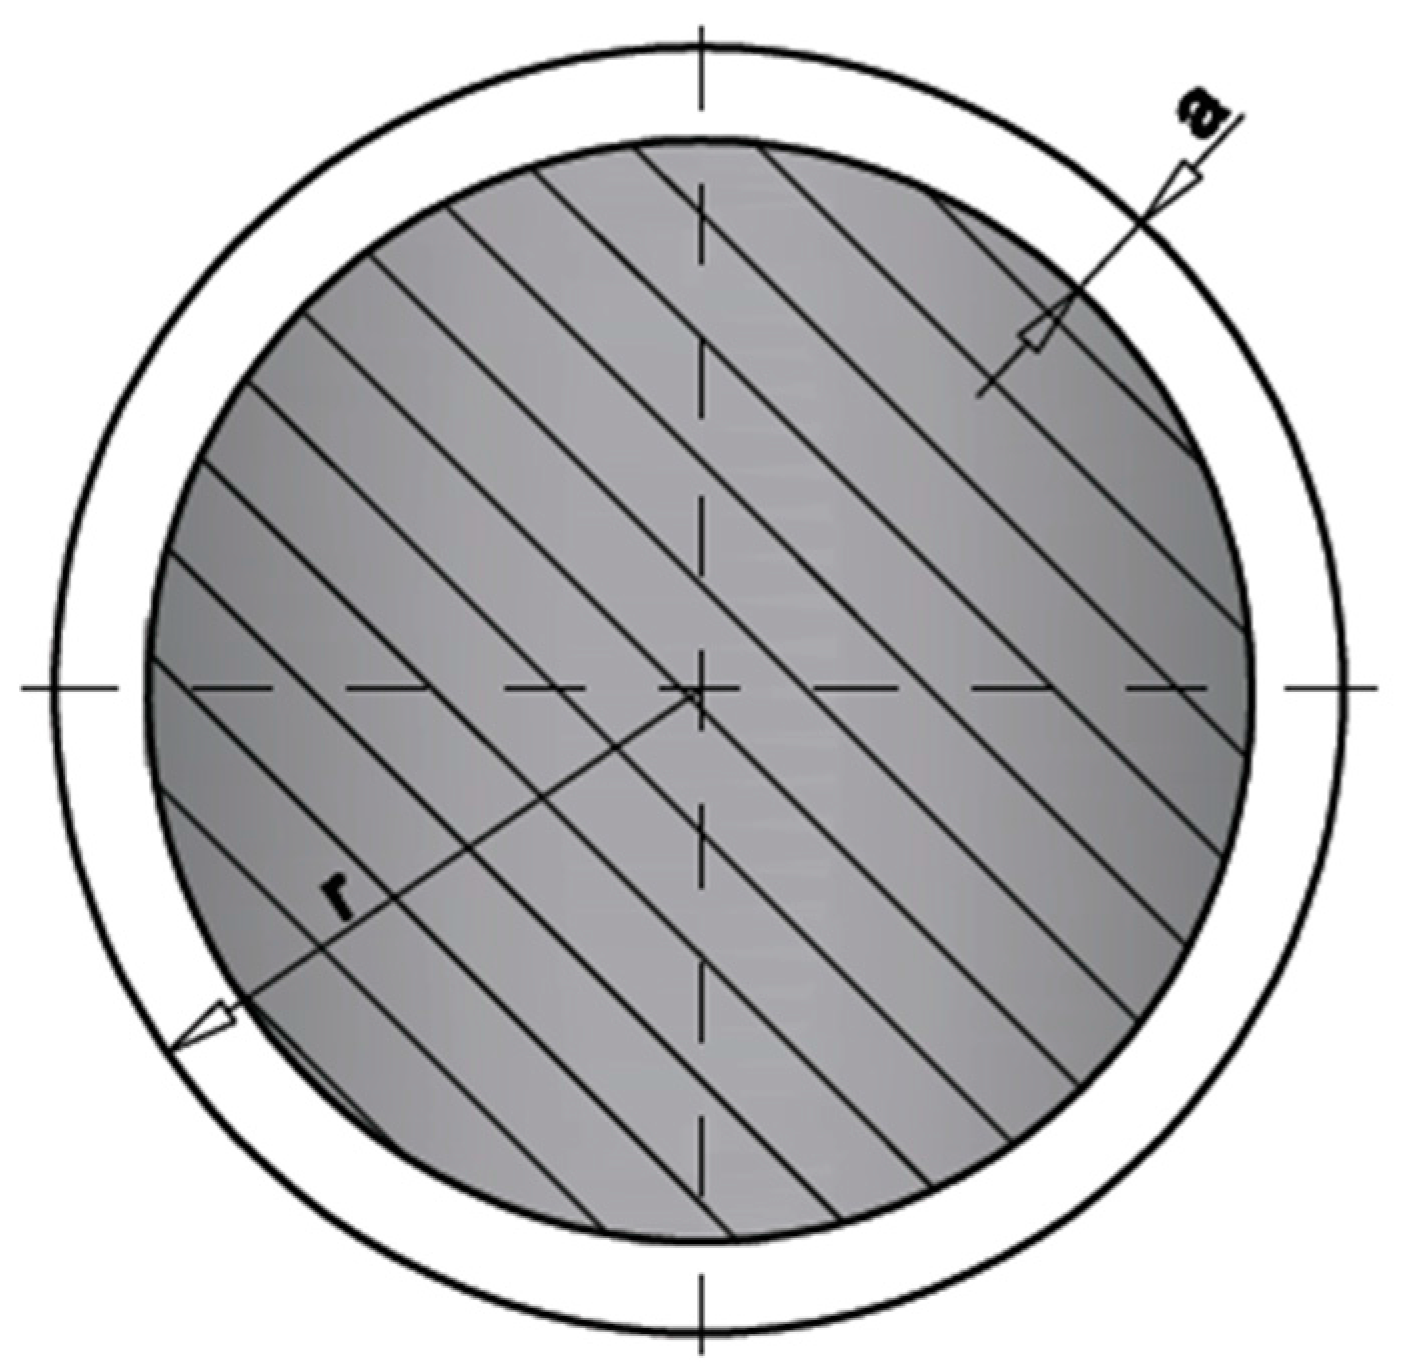
  • Circumferential flaw in the round bar (Figure 15), the crack size (a) being 11.5 mm (as a lower value of the size of the external smooth area). The corresponding critical load is determined.
  • Circumferential flaw in the round bar, the applied load being 1280 kN (equal to the preload). Thus, the critical crack size is determined.
  • Preload of 1280 kN, considering a bolt of M56 and class 10.9, leads to an axial stress of the tower bolt of 671 MPa, clearly under the level at yield stress (900 MPa).
Figure 16 shows the corresponding reults obtained for analysis Option 1 [19,20], which defines the FAL from both the yield stress and the ultimate tensile strength of the material (Equations (4)–(9)). In the first analysis (Figure 16a), the critical load is 5908 kN, which is noticeably lower than the applied preload. This discards that the notion that the external smooth area found in the fracture section corresponds to a pre-existing crack (e.g., quench cracking), given that, in such a case, the application of the preload (1280 kN) would have caused the failure of the bolts. The discarding of quench cracking is also supported by the lack of zinc deposits in the surface of the pre-existing cracks.
The second analysis (Figure 16b) provides a critical defect of 4.2 mm. This corresponds to the maximum crack size in the bolts during the application of the preload (larger cracks would also have caused failure).

4. Discussion

The results shown above suggest that there has been a subcritical crack propagation process from the time at which the preload was applied to the final failure of the bolts, when the (approximately) circumferential cracks reached the size shown in Figure 13. Considering the morphology of the fracture micromechanisms, the small time lapse between the application of the preload and the failures, the nature of the steel used in the bolts (high strength steel), and the sequence of treatments performed on the bolts (thermal treatments, galvanising, preload), it can be concluded that the most probable cause of failure was Hydrogen-Induced Stress Corrosion Cracking (HISCC). Other possible causes of cracking, such as fatigue, may be ruled out due to both the short time period during which the bolts were in service and the small effects of variable loads on these kinds of prestressed components. Quench cracking has also been ruled out due to both the absence of zinc deposits in the fracture surface and the lack of failures during the application of the preloads.
Here, it should also be noted that crack propagation increased the compliance of the bolts. Thus, the acting preload was decreasing as long as the crack size was increasing, until a given moment in which the acting load and the critical load converged and failures took place (a = 11.5–16.5 mm).
Finally, following the literature [2], this kind of steel, with the hardness values measured here, presents critical stress intensity factors for (hydrogen-governed) stress corrosion cracking (KIscc) in the range of 20–30 MPa·m1/2, and crack propagation rates in the order of 10−6–10−7 m/s. For the case being analysed, KIscc would be achieved for crack sizes around 1 mm. In the case of pre-existing cracks of 1 mm (or larger), the time to reach the critical value would be in the order of several hours, which is much lower than the time between the application of the preload and the failure of the bolts. This indicates that the pre-existing cracks were lower than 1 mm, and most of the time during which the bolts were operating corresponded to the incubation time of such cracks, after which they propagated until failure.
With all this, the crack propagation process is composed of several stages: the first one corresponds to the rupture of the zinc layer, after which a galvanic pair is formed. This facilitates the initiation of the cracks in the base material, just below the coating. Once the cracks have been generated, they propagate due to Hydrogen-Induced Cracking mechanisms until they reach their critical size for the load sustained by the bolts.

5. Conclusions

This paper analyses the failure of three bolts used in the structural connections of a number of steel towers located in northern Europe. It has been observed that the three analysed bolts present very similar failure processes, with a circumferential external crack that led to the final failure. The morphology of the crack propagation is typical of Hydrogen-Induced Stress Corrosion Cracking (HISCC), with mixed intergranular-transgranular micromechanisms, numerous tearing processes and secondary cracking. The cracks then grew subcritically until they reached their critical size.
The high strength steel of the bolts presents high susceptibility to Stress Corrosion Cracking and Hydrogen-Induced Cracking phenomena when it is subjected to thermal treatments that, as in the case here analysed, generate hardness values around (and above) 350 HV. Under such conditions, the critical stress intensity factor for hydrogen-controlled stress corrosion cracking processes (KIscc) is drastically reduced, facilitating the initiation and subsequent propagation of cracks.
Quench cracking or fatigue processes have been ruled out given that, in the first case, the failures would have occured during the application of the preloads and/or the in absence of zinc deposits on the fracture surface; in the second case, the in-service time and the stress conditions in the bolts do not justify any fatigue process.

Author Contributions

All the authors have contributed in the experimental tasks and analysis of the results.

Conflicts of Interest

The authors declare no conflicts of interest.

References

  1. Boyd, W.K.; Hyler, W.S. Factors affecting environmental performance of high-strength bolts. J. Struct. Div. 1973, 99, 1571–1588. [Google Scholar]
  2. Townsend, H.E. Effects of Zinc Coatings on the Stress Corrosion Cracking and Hydrogen Embrittlement of Low-Alloy Steel. Metall. Trans. A 1975, 6, 877–883. [Google Scholar] [CrossRef]
  3. Timmins, P.F. Solutions to Hydrogen Attack in Steels; ASM International: Materials Park, OH, USA, 1997. [Google Scholar]
  4. Levy, E. Cracking of an alloy steel bolt. In Handbook of Case Histories in Failure Analysis; Esakul, K.A., Ed.; ASM International: Materials Park, OH, USA, 1992; Volume 1, pp. 303–304. [Google Scholar]
  5. Kerns, G.E. Fractures of hot dip galvanized steel anchor bolts in chemical plant construction project. In Handbook of Case Histories in Failure Analysis; Esakul, K.A., Ed.; ASM International: Materials Park, OH, USA, 1992; Volume 1, pp. 328–331. [Google Scholar]
  6. Baggerly, R.G. Hydrogen-assisted Stress cracking of carburized and zinc plated SAE Grade 8 wheel studs. In Handbook of Case Histories in Failure Analysis; Esakul, K.A., Ed.; ASM International: Materials Park, OH, USA, 1992; Volume 2, pp. 396–400. [Google Scholar]
  7. Levy, E. Hydrogen embrittlement delayed failure of a 4340 steel draw-in bolt. In Handbook of Case Histories in Failure Analysis; ASM International: Materials Park, OH, USA, 1992; Volume 2, pp. 401–404. [Google Scholar]
  8. Carpio, J.; Casado, J.A.; Álvarez, J.A.; Méndez, D.; Gutiérrez-Solana, F. Stress corrosion cracking of structural steels immersed in hot-dip galvanizing baths. Eng. Fail. Anal. 2010, 17, 19–27. [Google Scholar] [CrossRef]
  9. Asociación Española de Normalización y Certificación. Características Mecánicas de los Elementos de Fijación de Acero al Carbono y Acero Aleado. Parte 1: Pernos, Tornillos y Bulones con Clases de Calidad Especificadas. Rosca de Paso Grueso y Rosca de Paso Fino; UNE-EN-ISO 898-1:2010; AENOR: Madrid, Spain, 2010. [Google Scholar]
  10. Asociación Española de Normalización y Certificación. Características Mecánicas de los Elementos de Fijación de Acero al Carbono y Acero Aleado. Parte 2: Tuercas con Valores de Carga de Prueba Especificados. Rosca de Paso Grueso; UNE-EN-ISO 898-2:2010; AENOR: Madrid, Spain, 2010. [Google Scholar]
  11. Asociación Española de Normalización y Certificación. Conjuntos de Elementos de Fijación Estructurales de Alta Resistencia Para Precarga. Parte 2: Ensayo de Aptitud a la Precarga; UNE-EN-ISO 14399-2:2009; AENOR: Madrid, Spain, 2009. [Google Scholar]
  12. Asociación Española de Normalización y Certificación. Elementos de Fijación. Recubrimientos por Galvanización en Caliente; UNE-EN-ISO 10684:2006; AENOR: Madrid, Spain, 2006. [Google Scholar]
  13. Asociación Española de Normalización y Certificación. Eurocódigo 3: Proyecto de Estructuras de Acero; UNE-EN-ISO 1993-1-8:2011; AENOR: Madrid, Spain, 2011. [Google Scholar]
  14. Asociación Española de Normalización y Certificación. Uniones Atornilladas Estructurales sin Precarga. Parte 1: Requisitos Generals; UNE-EN-ISO 15048-1:2008; AENOR: Madrid, Spain, 2008. [Google Scholar]
  15. Asociación Española de Normalización y Certificación. Tuercas Hexagonales Autofrenadas de Acero. Propiedades de Funcionamiento. Ensayos de Par y Fuerza de Apriete y par de Autofrenado; UNE-EN-ISO 2320:2009; AENOR: Madrid, Spain, 2009. [Google Scholar]
  16. Asociación Española de Normalización y Certificación. Sistemas de Designación de Aceros. Parte 1: Designación Simbólica; UNE-EN-10027-1:2006; AENOR: Madrid, Spain, 2006. [Google Scholar]
  17. American Society for Testing and Materials. Standard Test Method for Knoop and Vickers Hardness of Materials; ASTM: West Conshohocken, PA, USA, 2011. [Google Scholar]
  18. Asociación Española de Normalización y Certificación. Materiales Metálicos. Ensayo de Tracción. Parte 1: Método de Ensayo a Temperatura Ambiente; UNE-EN-ISO 6892-1:2010; AENOR: Madrid, Spain, 2010. [Google Scholar]
  19. British Standards. Guide to Methods for Assessing the Acceptability of Flaws in Metallic Structures; British Standards: London, UK, 2013. [Google Scholar]
  20. GKSS Forschungszentrum. FITNET Fitness-for-Service (FFS) Procedure; Kocak, M., Webster, S., Janosch, J.J., Ainsworth, R.A., Koers, R., Eds.; GKSS Forschungszentrum: Geesthacht, Germany, 2008; Volume 1. [Google Scholar]
  21. Asociación Española de Normalización y Certificación. Materiales Metálicos. Ensayo de Flexión por Choque con Péndulo Charpy. Parte 1: Método de Ensayo; ISO 148-1:2011; AENOR: Madrid, Spain, 2011. [Google Scholar]
Figure 1. Bolt B at reception, showing the failure section.
Metals 06 00163 g001
Figure 2. Fracture surfaces at reception of bolt A. (a) Head; (b) shank.
Metals 06 00163 g002
Figure 3. Sectioning of the shaft (bolt A). (a) Sections 1 and 2; (b) samples 2.1 and 2.2 taken from Section 2; (c) samples 2.1 and 2.2 mounted.
Metals 06 00163 g003
Figure 4. Microstructures observed in bolt A. (a) Centre of the section (sample 2.1); (b) sub-surface material (sample 2.2).
Metals 06 00163 g004
Figure 5. Quartering of the head (bolt A).
Metals 06 00163 g005
Figure 6. Quartering of Section 4 (bolt A) with the identification of the different samples and the location of the points where the microstructure was analysed.
Metals 06 00163 g006
Figure 7. Microstructure observed in the head of bolt A (sample 4.3, point D).
Metals 06 00163 g007
Figure 8. Hardness measurements along the radius of the bolt shank (bolt A). The dotted line shows the trend line.
Metals 06 00163 g008
Figure 9. Hardness measurements (HV1) in the bolt head (bolt A).
Metals 06 00163 g009
Figure 10. Fracture surface of bolt A. (a) Point “b”; (b) point “d”.
Metals 06 00163 g010
Figure 11. Zone “c” of the fracture surface, showing subcritical crack growth starting at the interface between the base material and the galvanising layer.
Metals 06 00163 g011
Figure 12. Profile of the fracture surface in bolt A: (a) Brittle aspect of the external perimeter (the red circumference shows secondary cracking); (b) ductile aspect of the inner area.
Metals 06 00163 g012
Figure 13. Approximate measurement of the external perimeter. Bolt A.
Metals 06 00163 g013
Figure 14. FAD analysis (initiation) showing three possible situations: A, safe conditions; B, critical condition; C, unsafe conditions.
Metals 06 00163 g014
Figure 15. Idealisation of the bolt section and the crack geometry.
Metals 06 00163 g015
Figure 16. FAD analysis of the bolts: (a) critical load (Pc) for a 11.5 mm crack size (a); (b) critical crack size (ac) for a 1280 kN load (P).
Metals 06 00163 g016
Table 1. Nominal composition of steel 42CrMo4 [16] (% weight).
CSiMnPSCrMo
0.38–0.45≤0.40.6–0.9≤0.025≤0.0350.90–1.200.15–0.3
Table 2. Data of the thermal treatments.
BoltQuenching Temperature (°C)Time (min)Tempering Temperature (°C)Time (min)Oil Temperature (°C)
A85518057018090
B85518055518090
C85518056018090
Table 3. Specifications for 42CrMo4 material following UNE-EN-898-1 [9].
PropertyMinMax
Tensile strength, Rm (MPa)1040-
Proof stress 0.2%, Rp0.2 (MPa)940-
Strain under max. load (L0 = 5d0) (%)9-
Reduction of area, Z (%)48-
Charpy Energy (−20 °C) 27-
Hardness Brinell, HB326355
Surface hardness HV 0.3-390
Table 4. Chemical composition of the steel 42CrMo4 being analysed (% weight).
CSiMnPSCrMo
0.420.270.80≤0.025≤0.0351.100.22
Table 5. Results of the mechanical tests performed on the bolts.
PropertyABC
Tensile strength, Rm (MPa)110111061117
Proof stress 0.2%, Rp0.2 (MPa)100110021011
Strain under max. load (L0 = 5d0) (%)15.613.813.9
Reduction of area, Z (%)56.052.052.0

