
The Influence of Transition Metals Addition on the Corrosion Resistance of Nanocrystalline Al Alloys Produced by Mechanical Alloying


Abstract
:
1. Introduction
2. Experimental Procedure
2.1. Production of Ultrafine/Nanocrystalline Al, Al-10 wt. % Fe and Al-10 wt. % Fe-5 wt. % Cr Alloys
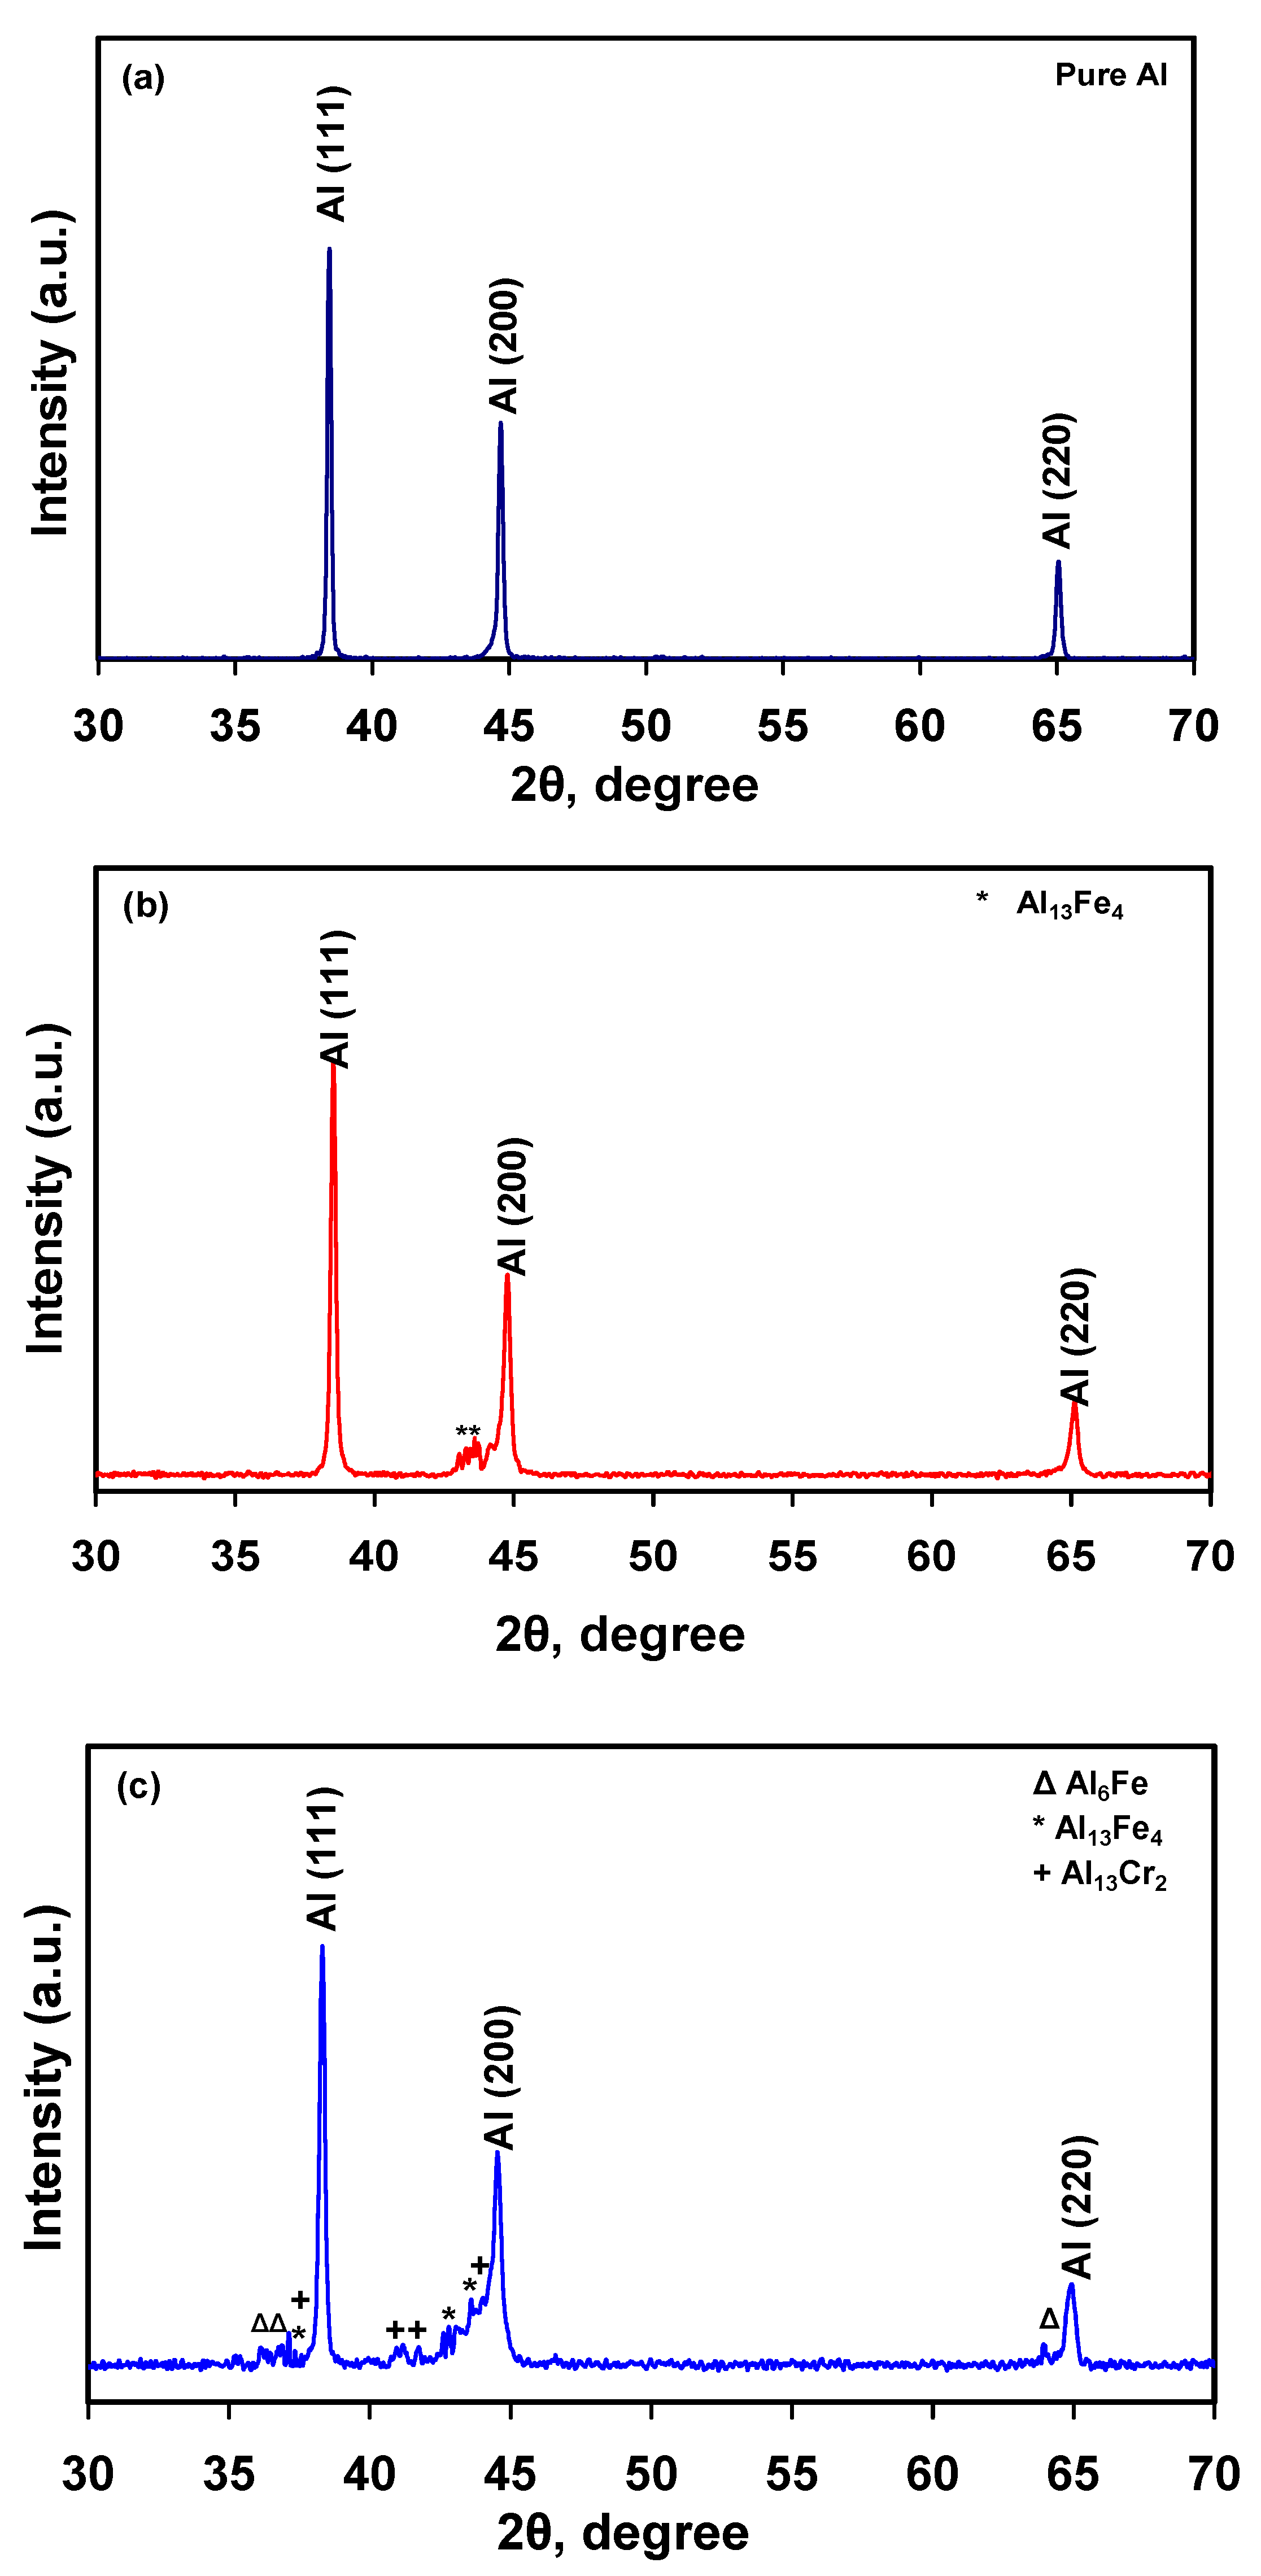
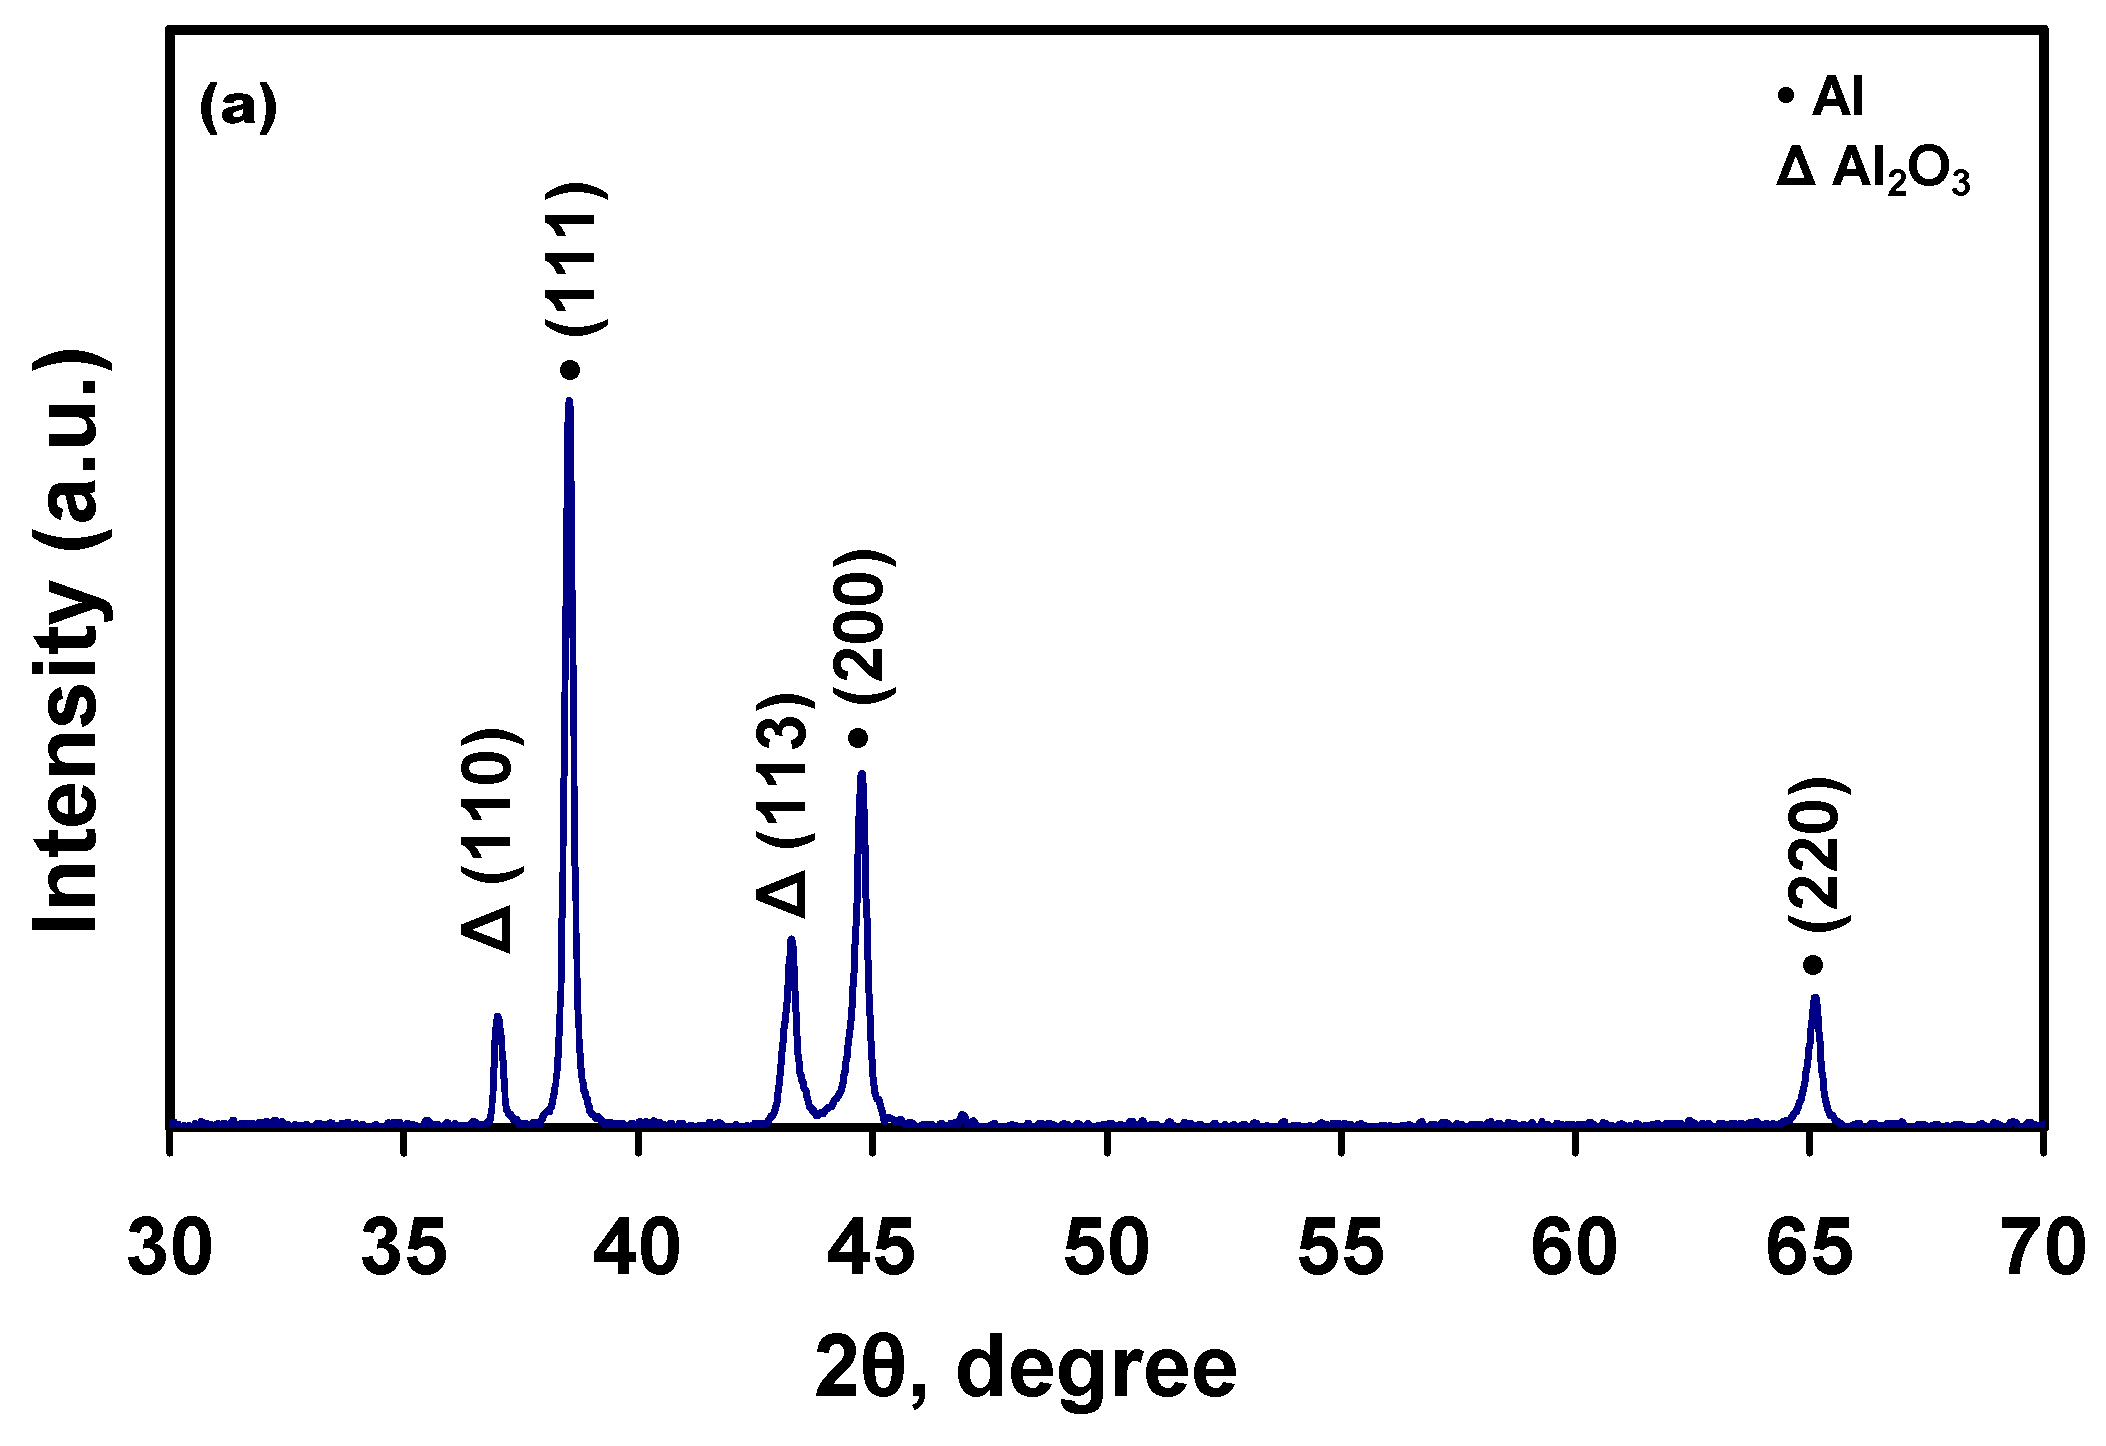
2.2. X-ray Diffraction (XRD)
2.3. Microstructural Characterization of Sintered Alloy
2.4. Chemicals, Materials, and Electrochemical Cell
2.5. Electrochemical Experiments
3. Results and Discussion
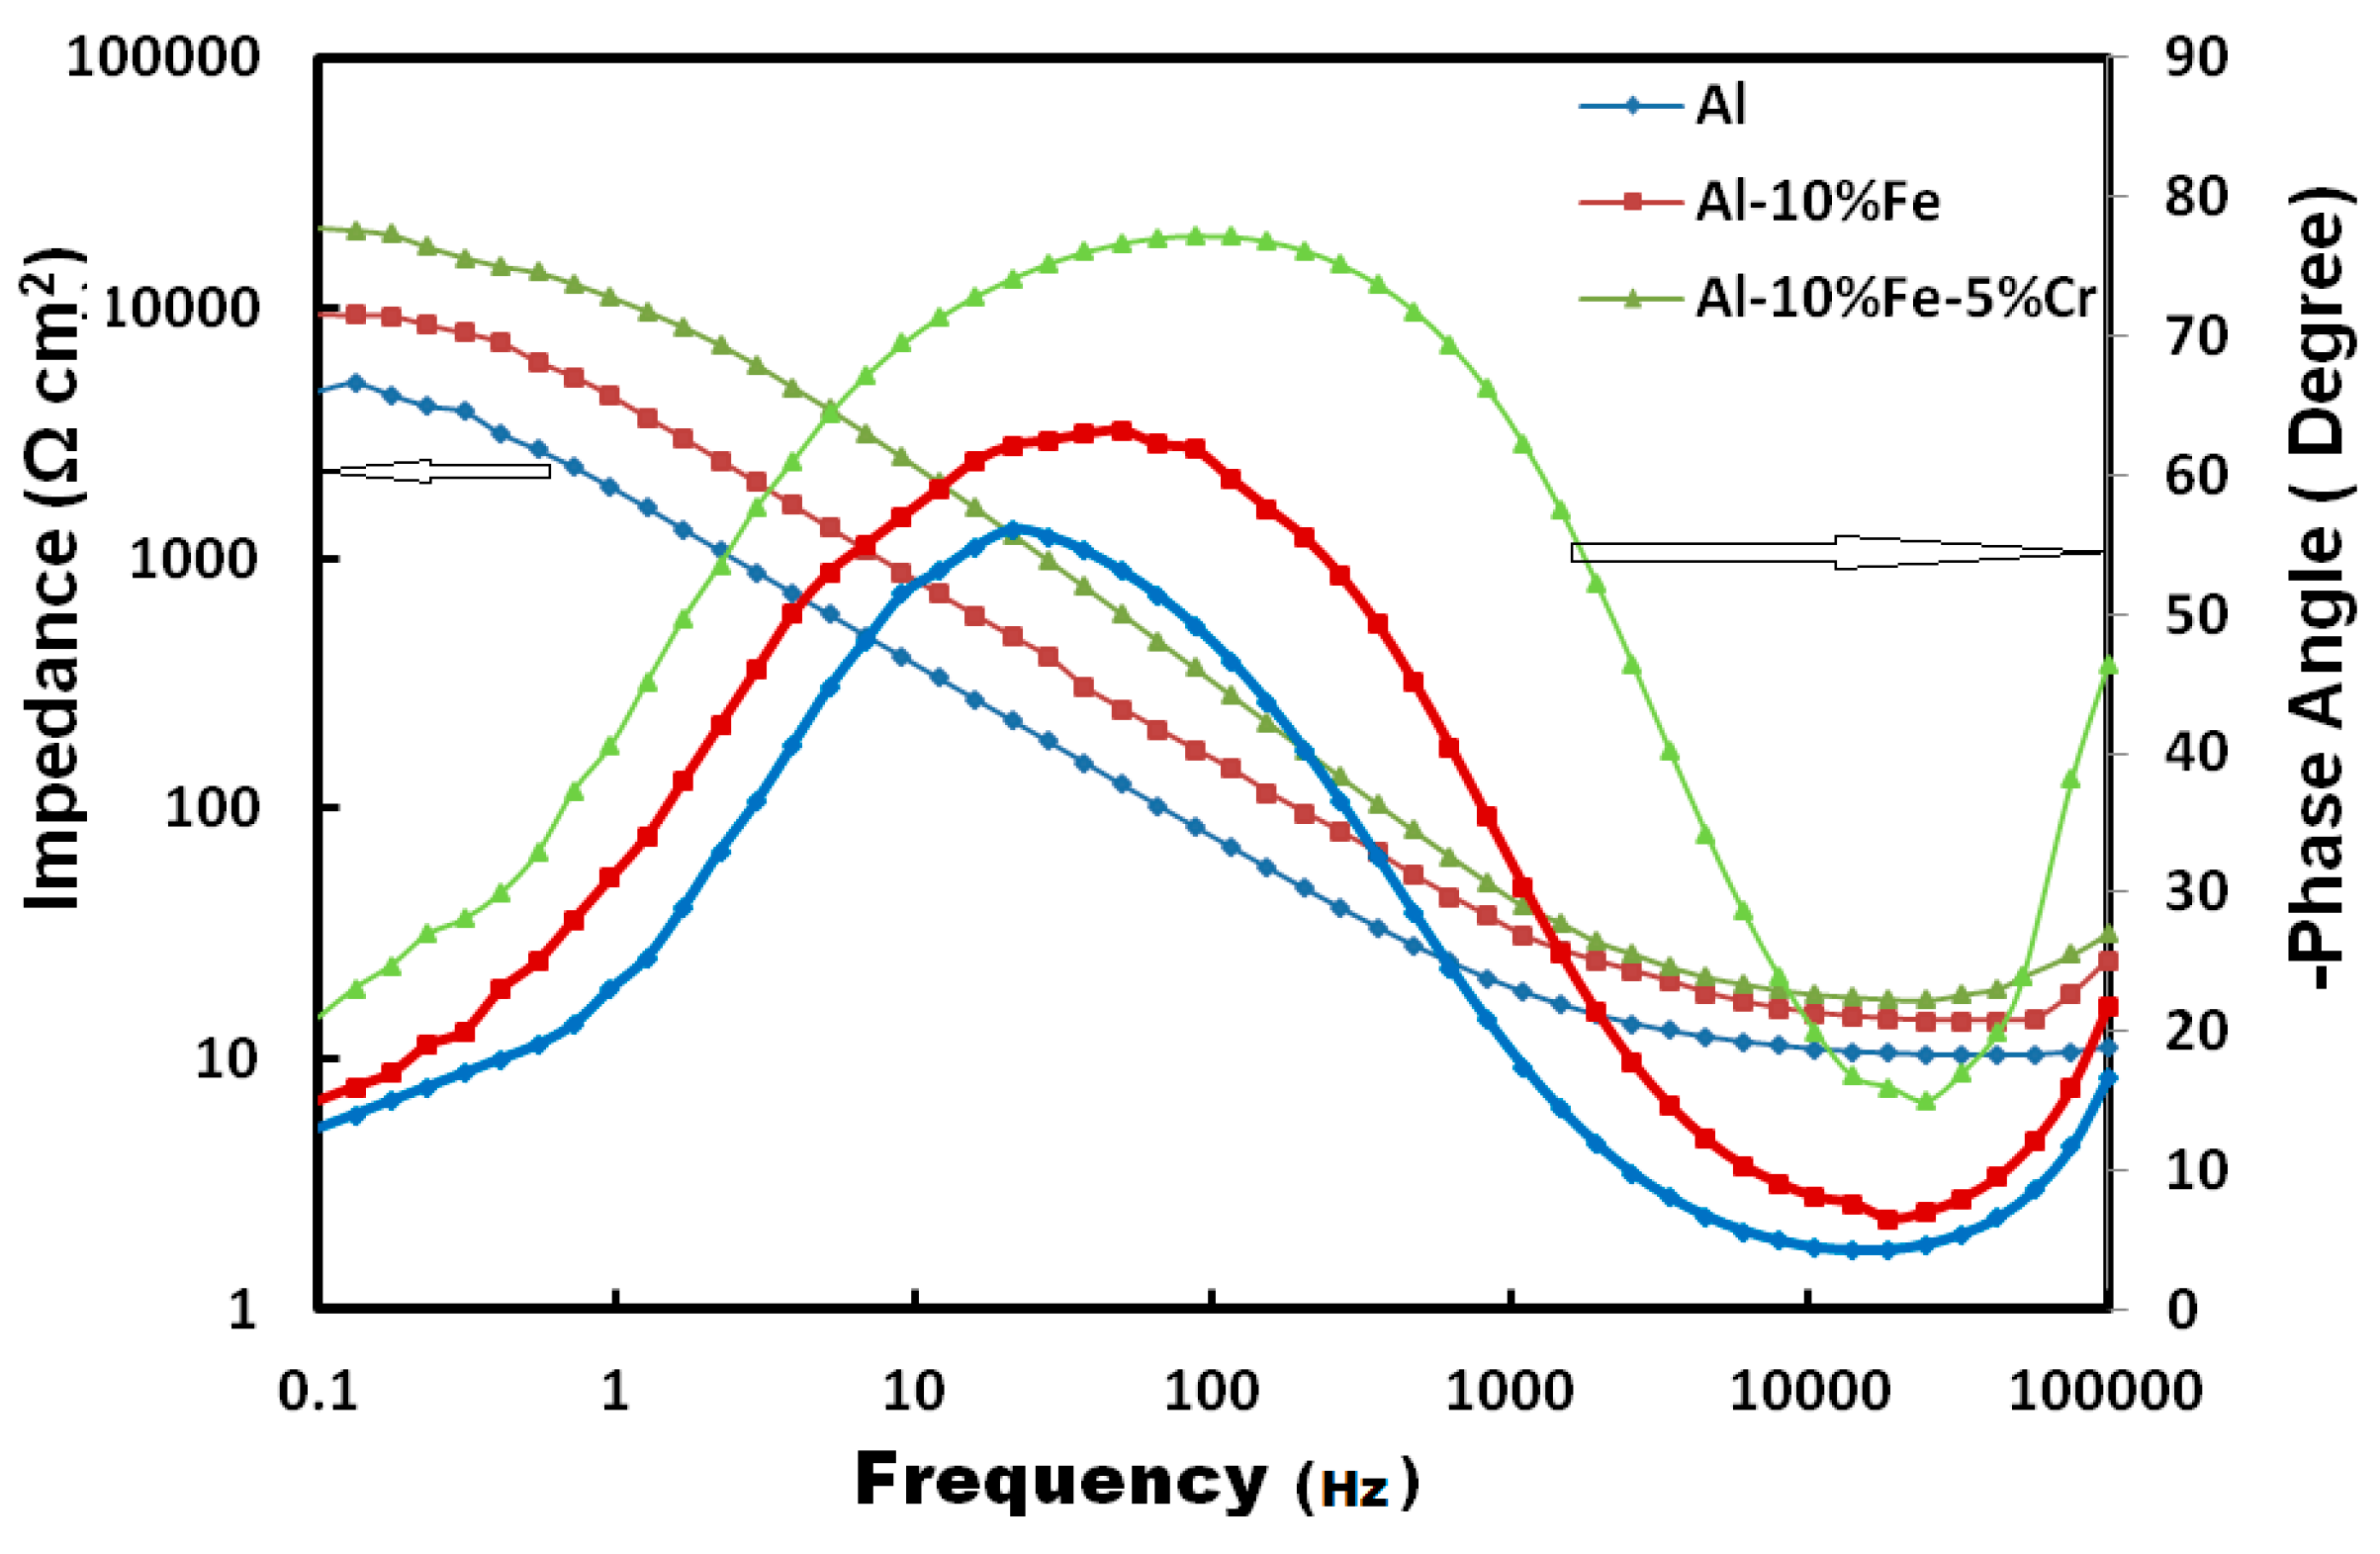
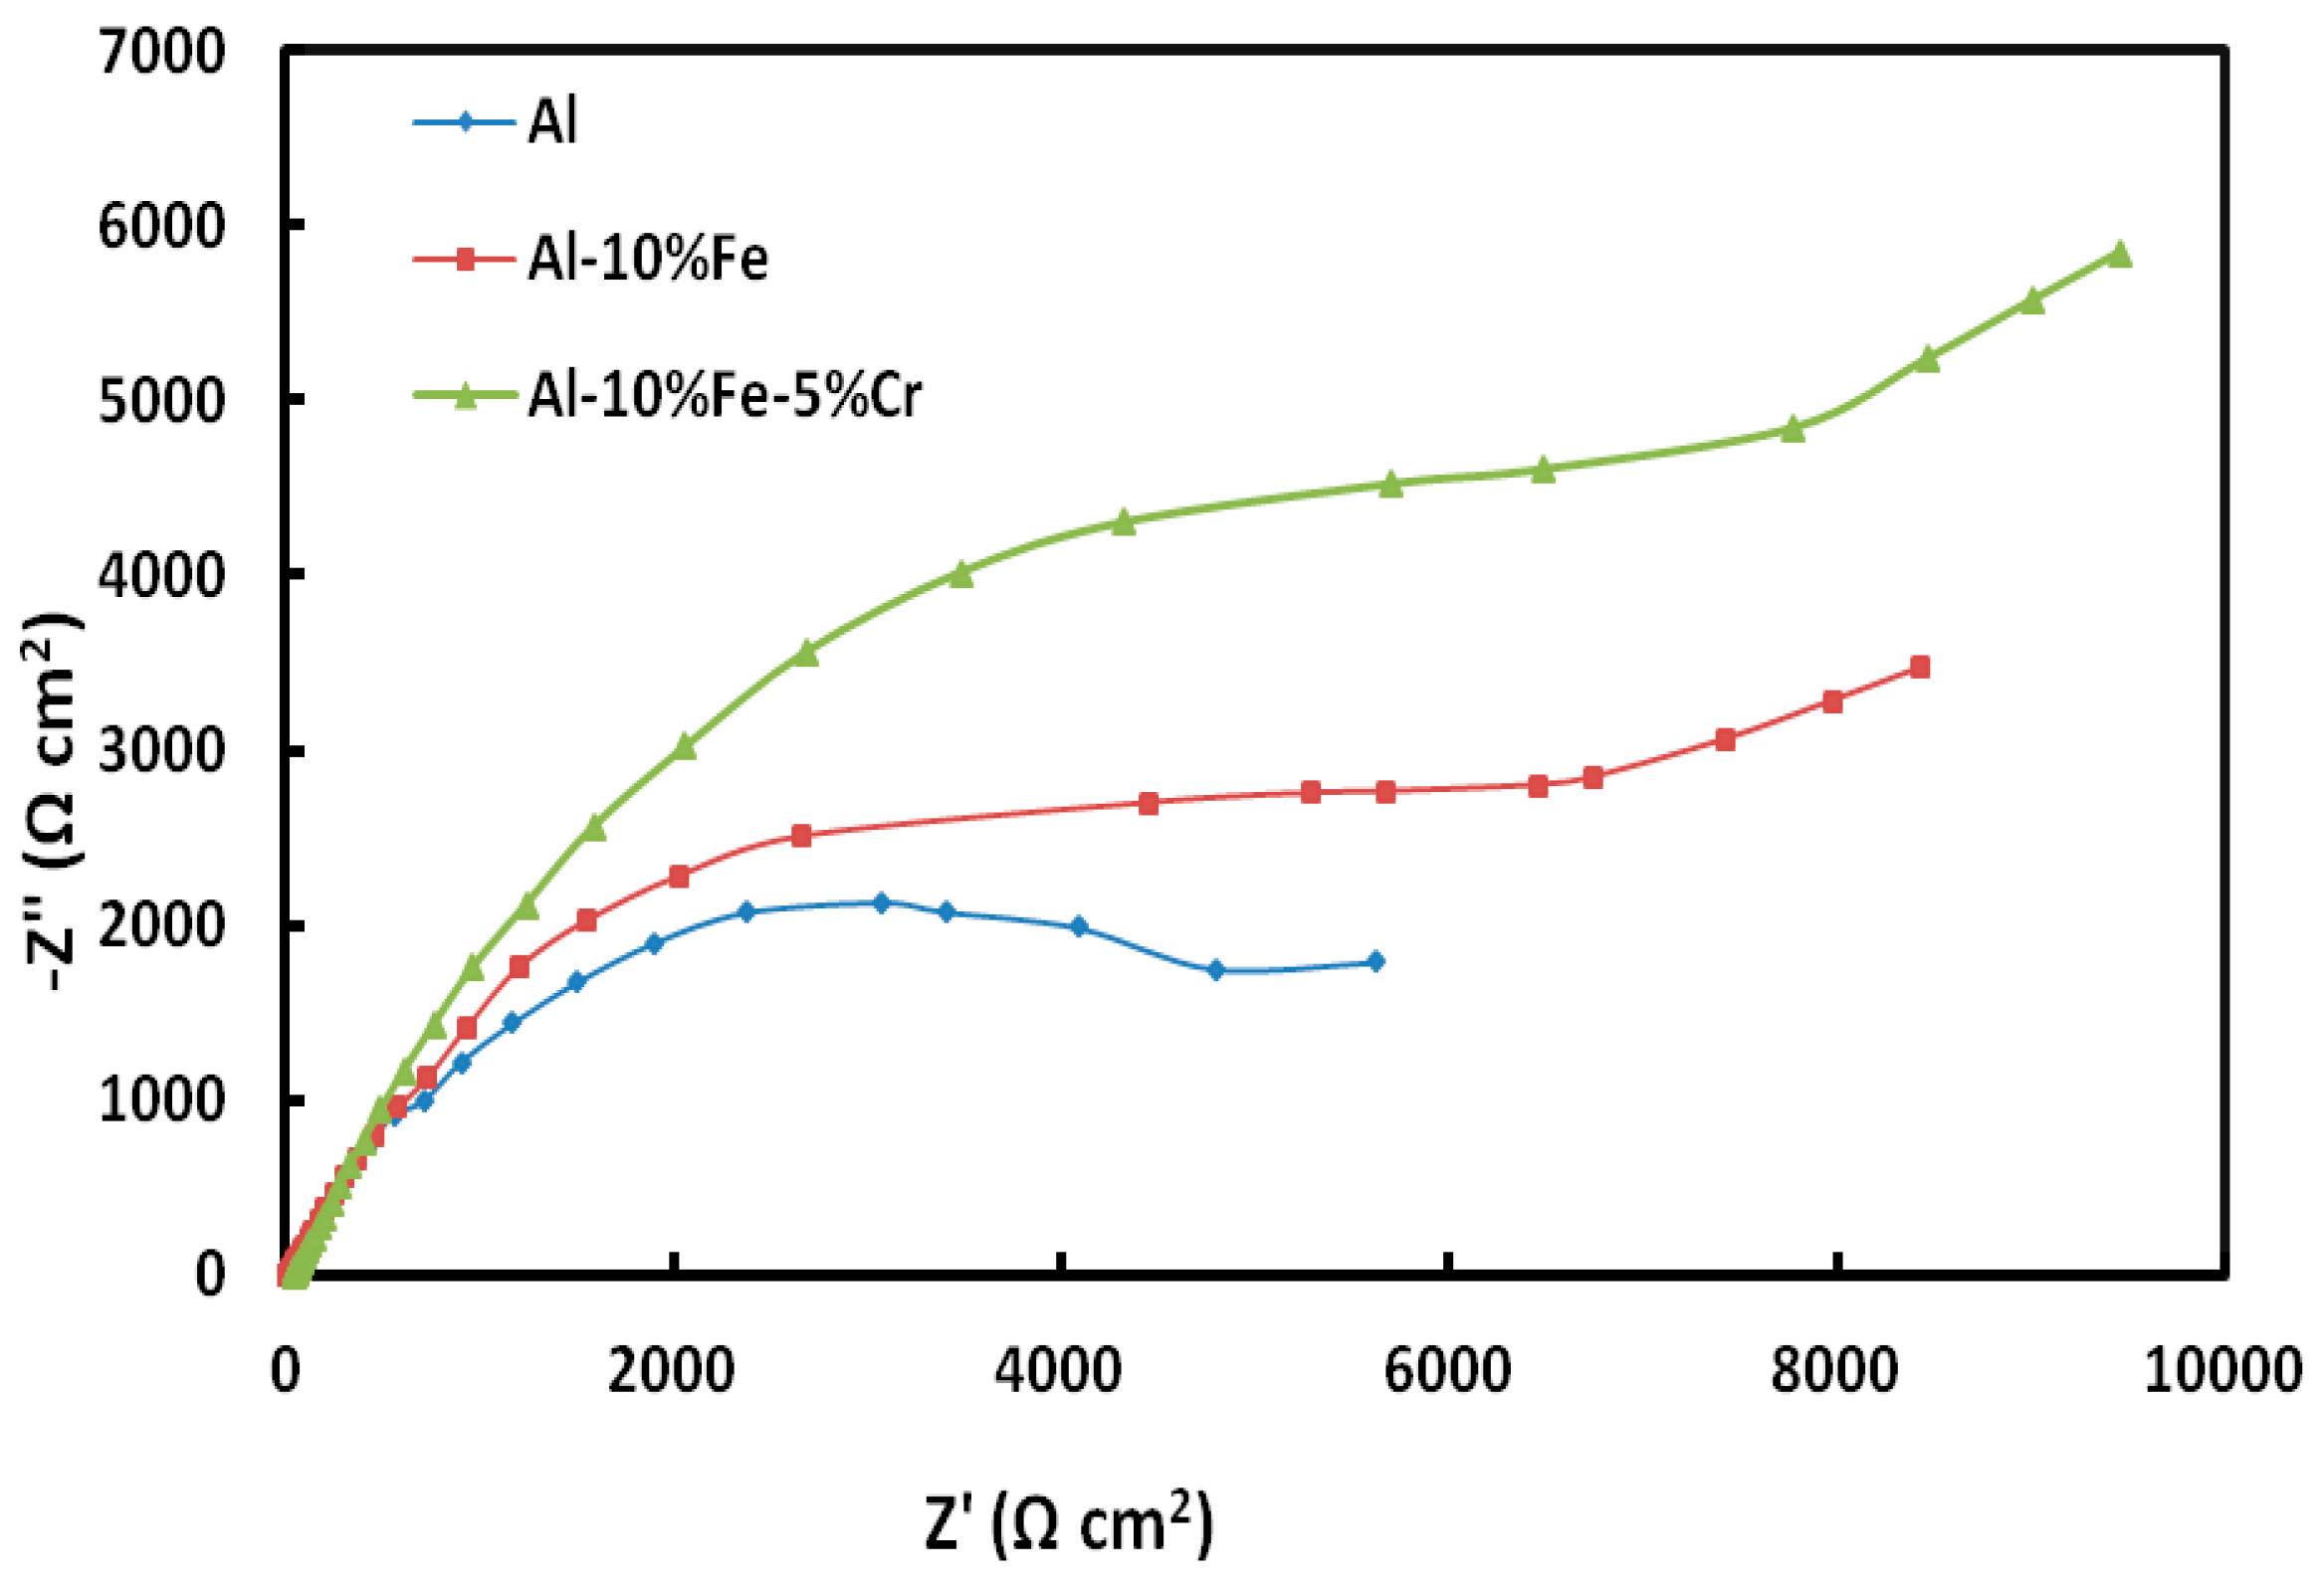
3.1. Electrochemical Measurements
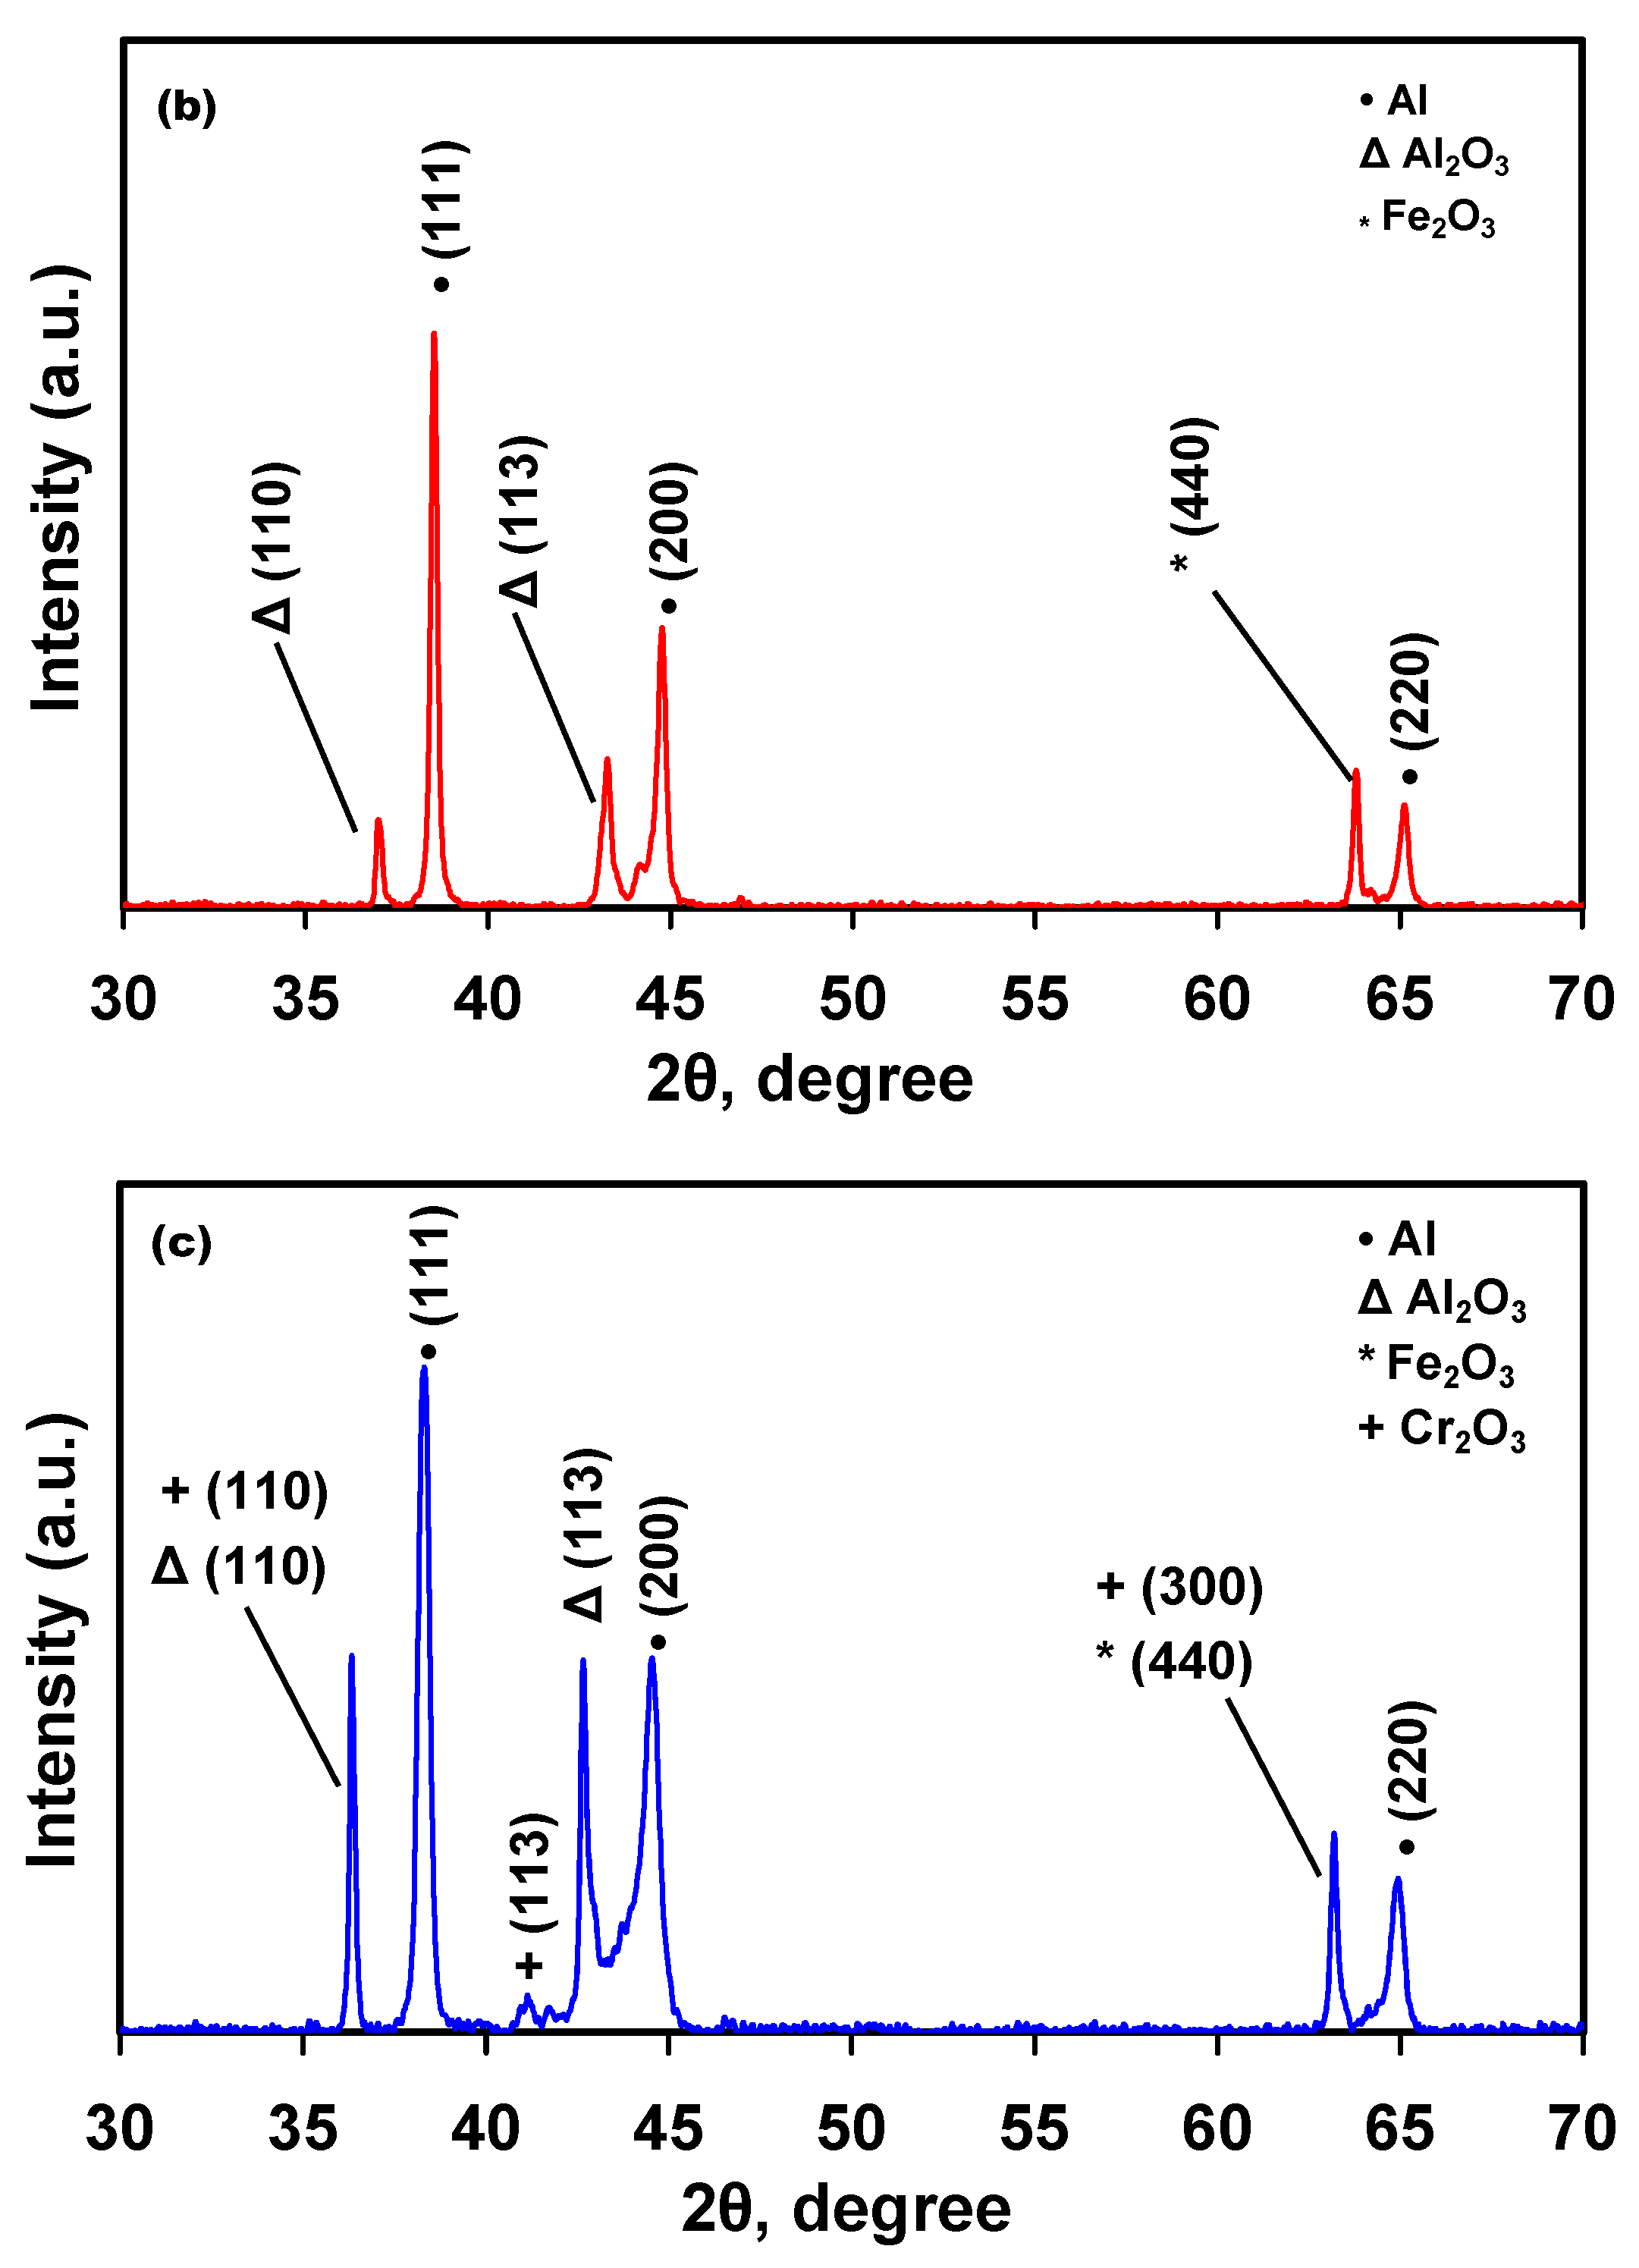
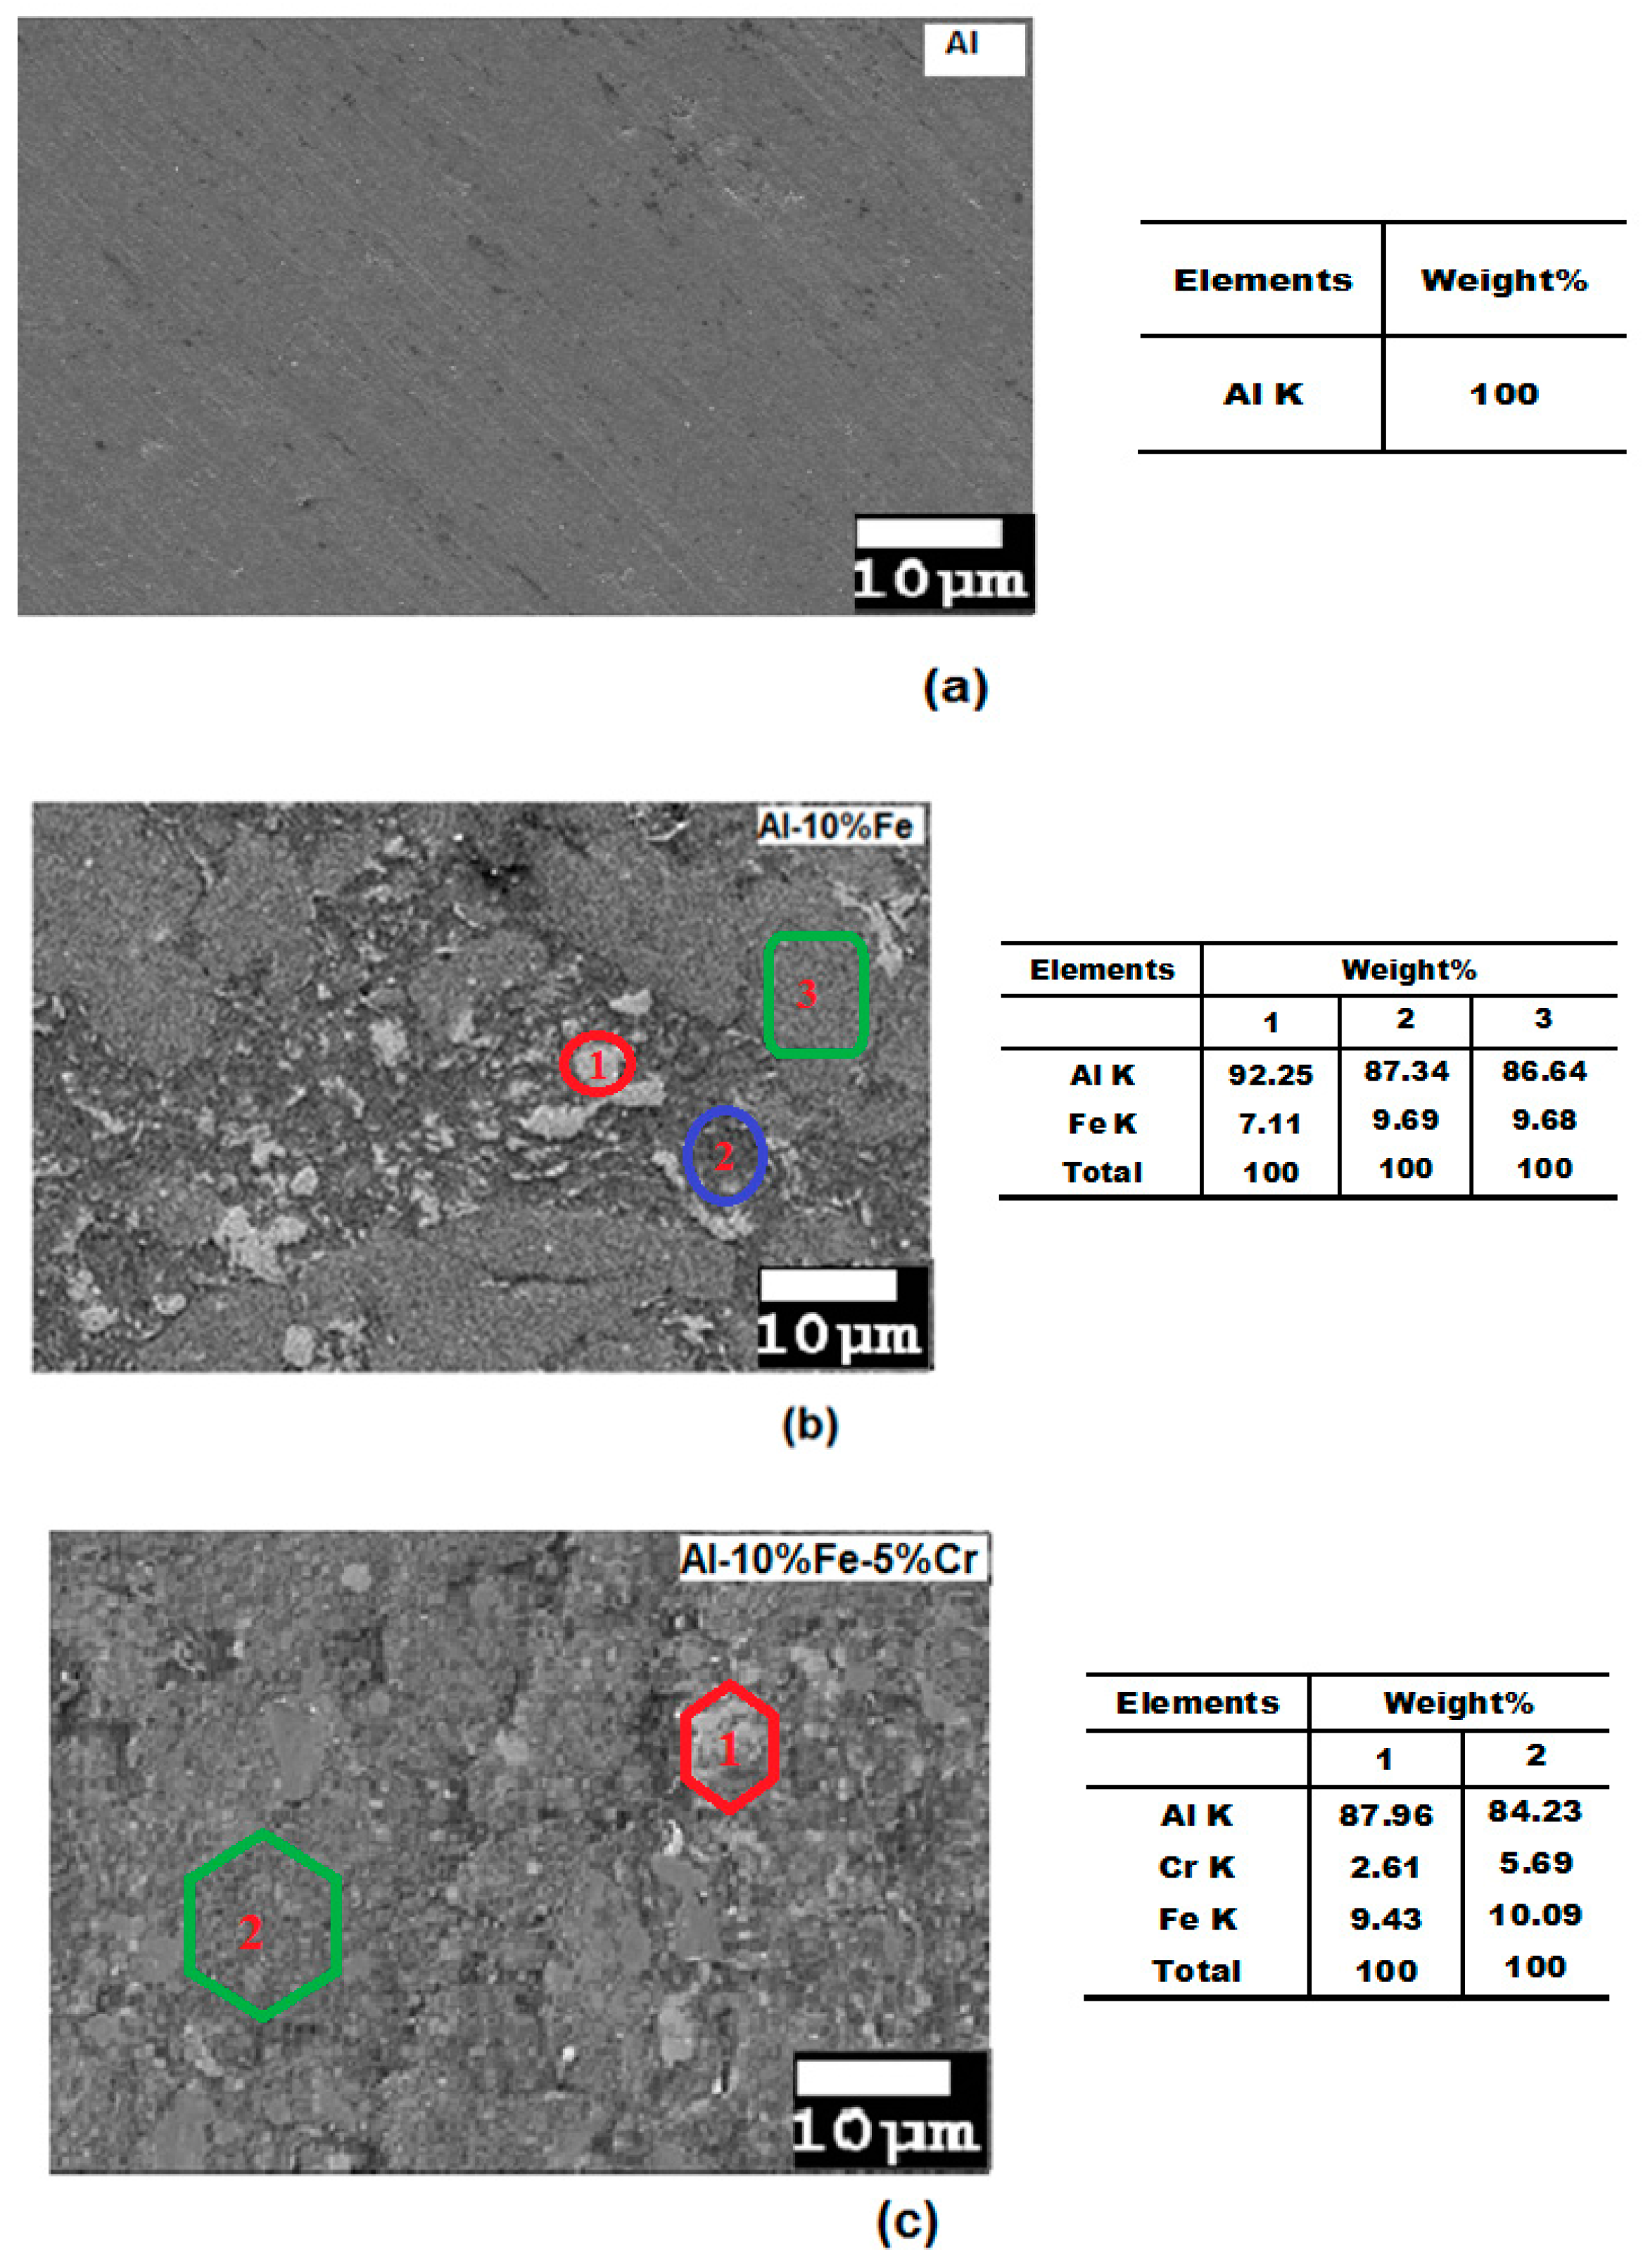
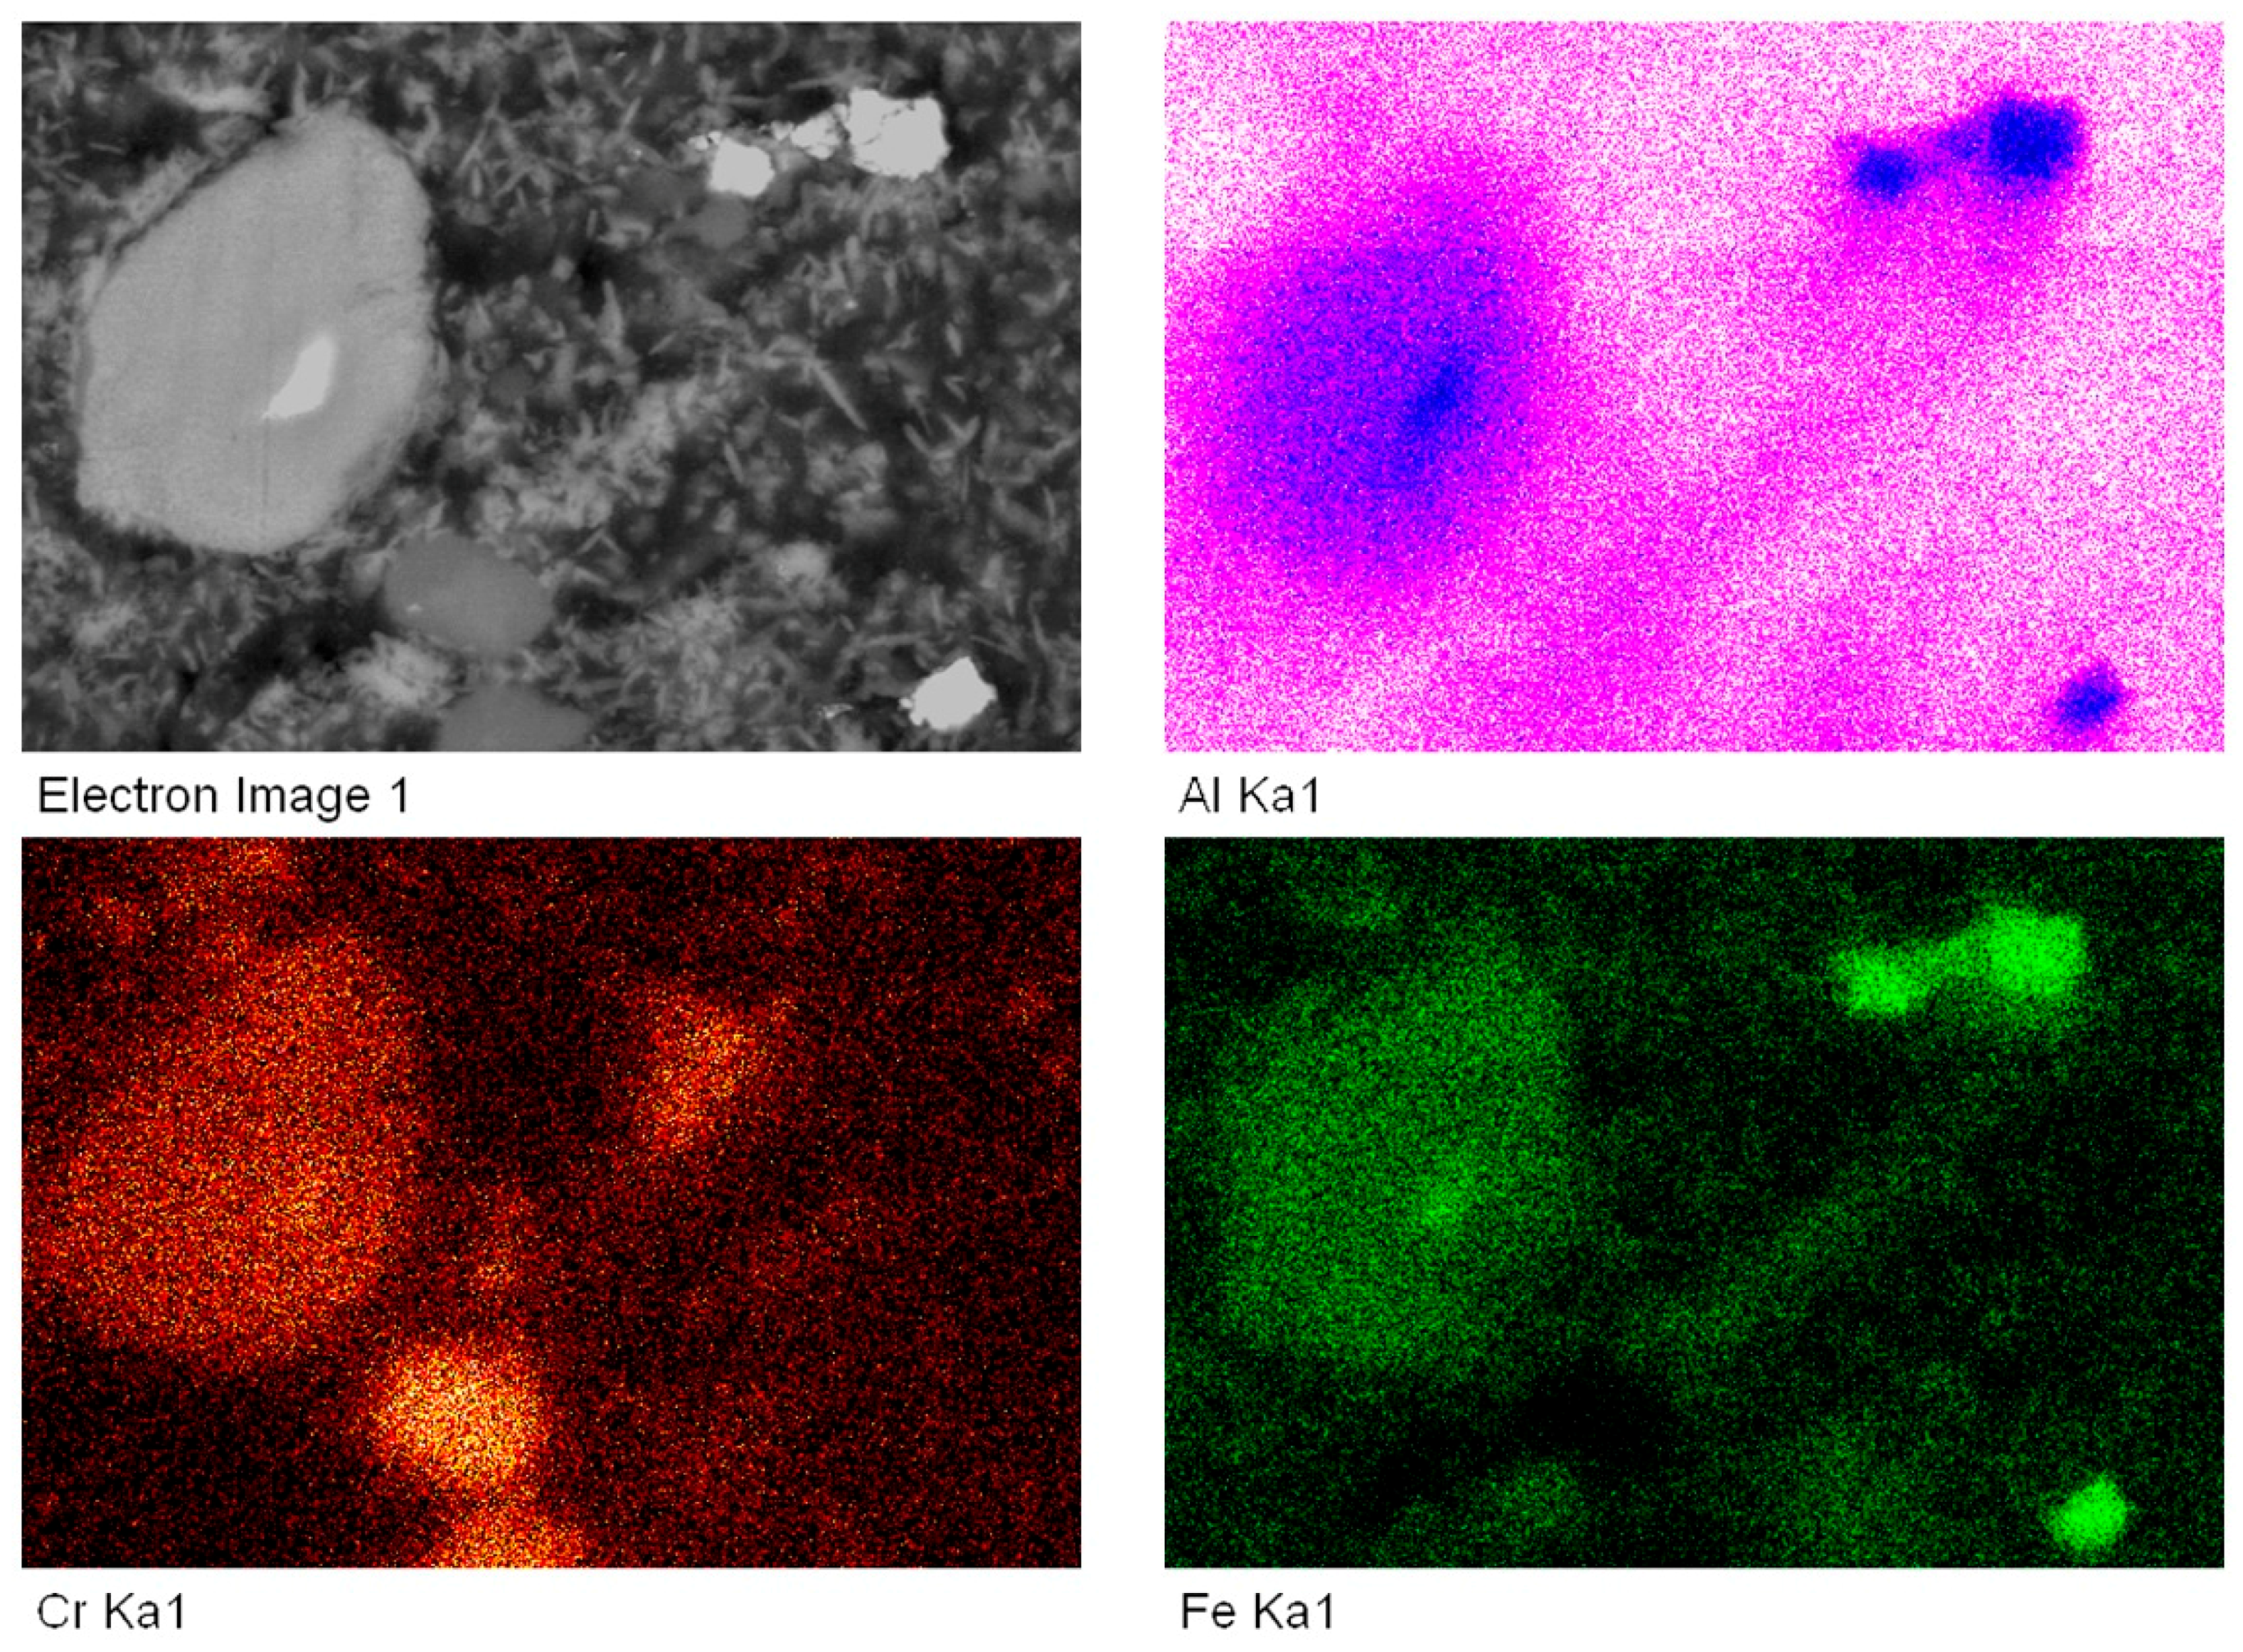
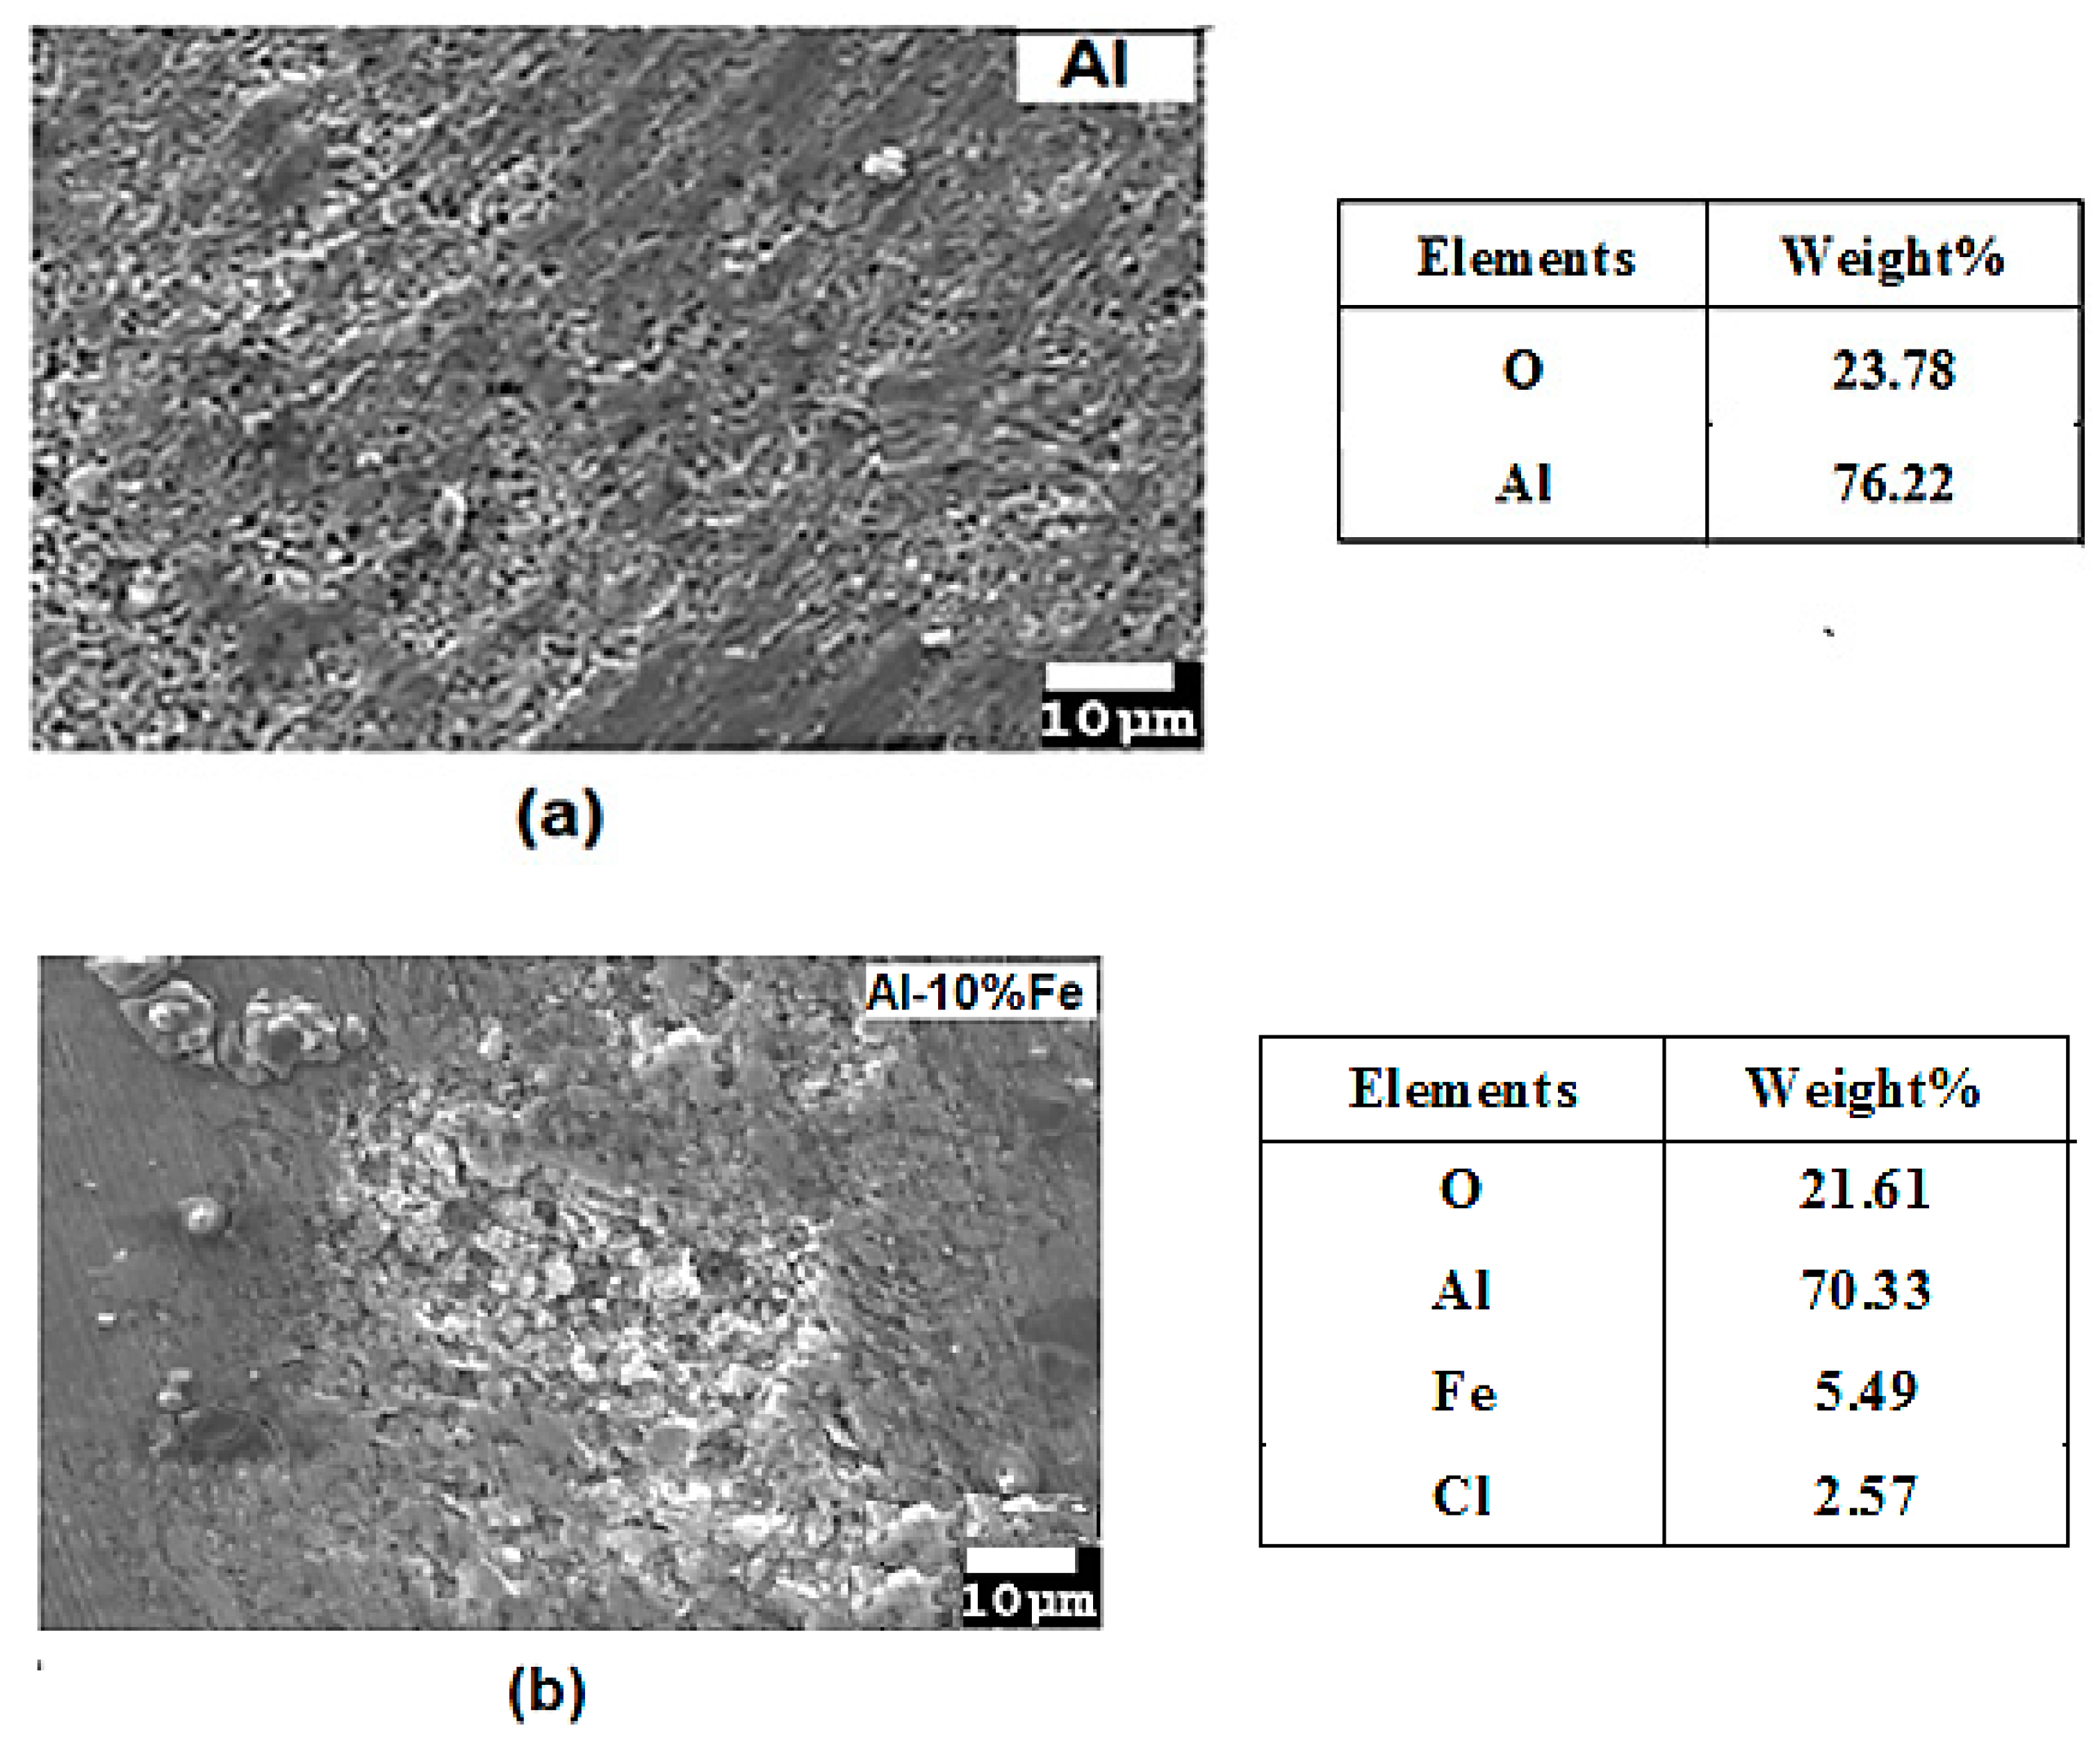
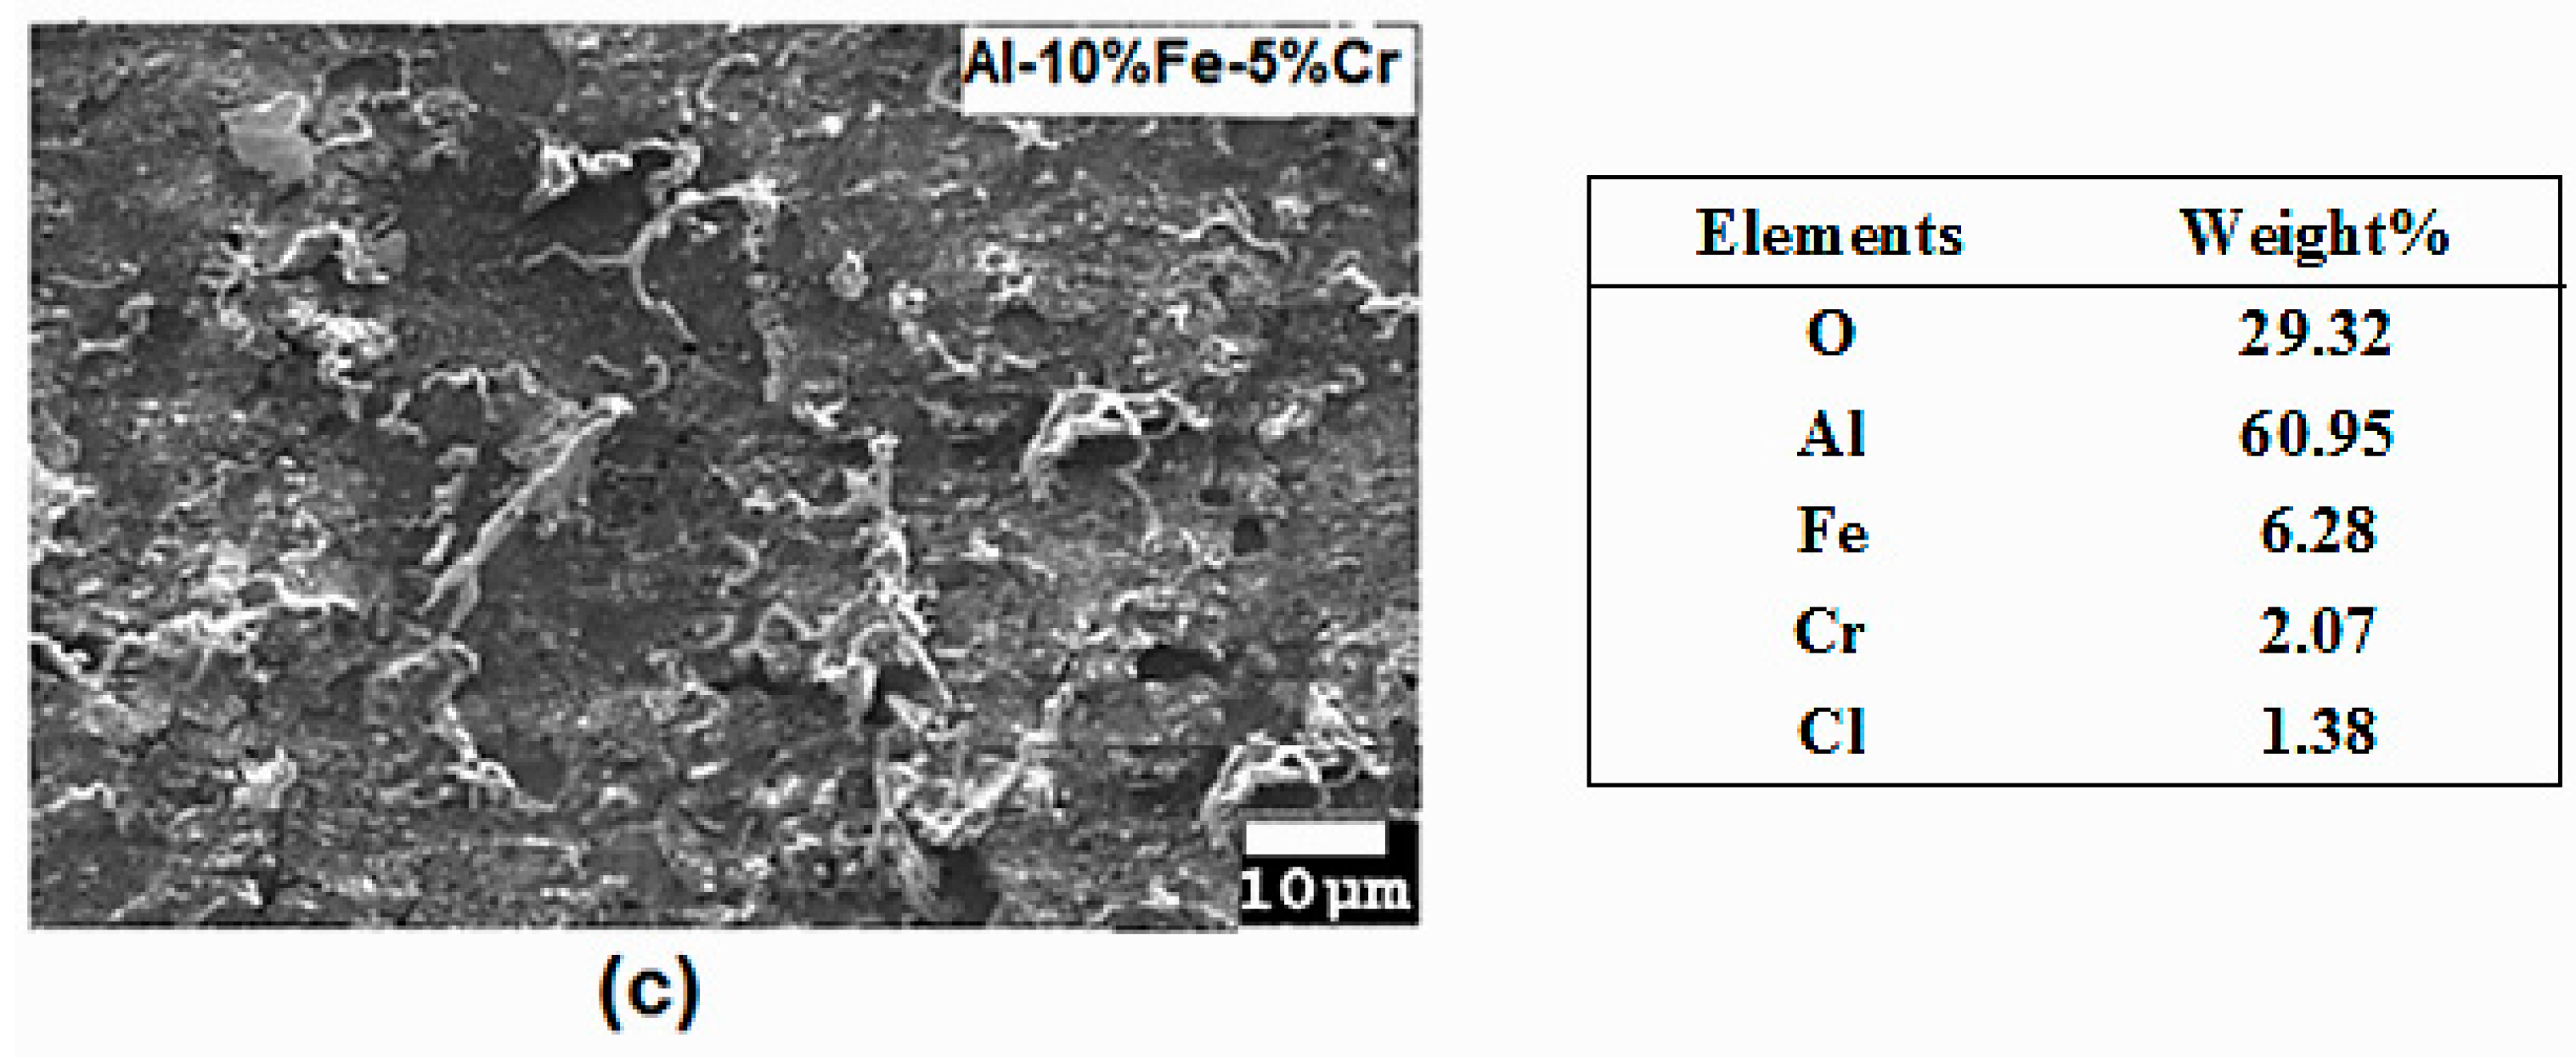
3.2. Microstructural Characterization
4. Conclusions
Acknowledgments
Author Contributions
Conflicts of Interest
References
- Handbook of Aluminum: Vol. 1—Physical Metallurgy and Processes; Totten, G.E.; MacKenzie, D.S. (Eds.) Marcel Dekker Inc.: New York, NY, USA, 2003.
- Gonzalez-Rodriguez, J.G.; Salazar, M.; Luna-Ramirez; Porcayo-Calderon, J.; Rosas, G.; Villfane, A.M. Effect of Li, Ce and Ni on the corrosion resistance of FeAl in molten Na2SO4 and NaVO3. High Temp. Mater. Proc. 2004, 23, 177–183. [Google Scholar] [CrossRef]
- Sasaki, T.; Mukai, T.; Hono, K. A high-strength bulk nanocrystalline Al-Fe alloy processed by mechanical alloying and spark plasma sintering. Scr. Mater. 2007, 57, 189–192. [Google Scholar] [CrossRef]
- Lu, L.; Zhang, Y. Influence of process control agent on interdiffusion between Al and Mg during mechanical alloying. J. Alloys Compd. 1999, 290, 279–283. [Google Scholar] [CrossRef]
- Mishra, R.; Balasubramaniam, R. Effect of nanocrystalline grain size on the electrochemical and corrosion behavior of nickel. Corros. Sci. 2004, 46, 3019–3029. [Google Scholar] [CrossRef]
- Luo, W.; Xu, Y.; Wang, Q.; Shi, P.; Yan, M. Effect of grain size on corrosion of nanocrystalline copper in NaOH solution. Corros. Sci. 2010, 52, 3509–3513. [Google Scholar] [CrossRef]
- Kim, S.; Aust, K.; Erb, U.; Gonzalez, F.; Palumbo, G. A comparison of the corrosion behaviour of polycrystalline and nanocrystalline cobalt. Scr. Mater. 2003, 48, 1379–1384. [Google Scholar] [CrossRef]
- Srinivasan, P.B.; Heitmann, V.; Dietzel, W. Stress corrosion cracking behaviourof chromated AA2024 T351 alloy in chloride solution. Corros. Sci. Eng. Technol. 2004, 39, 174–177. [Google Scholar] [CrossRef]
- Gudi´c, S.; Smoljko, I.; Kliˇski´c, M. The effect of small addition of tin and indium onthe corrosion behavior of aluminium in chloride solution. J. Alloys Compd. 2010, 505, 54–63. [Google Scholar] [CrossRef]
- Li, S.; Zhang, H.; Liu, J. Corrosion behavior of aluminumalloy 2024-T3 by 8-hydroxy-quinoline and its derivative in 3.5% chloride solu-tion. Trans. Nonferr. Met. Soc. China 2007, 17, 318–325. [Google Scholar] [CrossRef]
- Shen, D.; Li, G.; Guo, C.; Zou, J.; Cai, J.; He, D.; Ma, H.; Liu, F. Microstructure and corrosion behavior of micro-arc oxidationcoating on 6061 aluminum alloy pre-treated by high temperature oxidation. Appl. Surf. Sci. 2013, 287, 451–456. [Google Scholar] [CrossRef]
- Cai, C.; Zhang, Z.; Cao, F.; Gao, Z.; Zhang, J.; Cao, C. Analysis of pitting corrosion behavior of pure Al in sodium chloride solutionwith the wavelet technique. J. Electroanal. Chem. 2005, 578, 143–150. [Google Scholar] [CrossRef]
- Ensinger, W.; Lensch, O.; Matsutani, T.; Kiuchi, M. Corrosion performance of thinamorphous carbon films on aluminum formed by ion beam-based coating tech-niques. Surf. Coat. Technol. 2005, 196, 231–135. [Google Scholar] [CrossRef]
- Jafarzadeh, K.; Shahrabi, T.; Hosseini, M.G. Effect of cathodic polarisation on pit-ting corrosion of AA5083–H321 aluminium-magnesium alloy in stagnant 3.5% NaCl solution. Corros. Sci. Eng. Technol. 2009, 44, 144–148. [Google Scholar] [CrossRef]
- Ralston, K.D.; Birbilis, N. Effect of grain size on corrosion: A review. Corrosion 2010, 66, 075005/1–075005/13. [Google Scholar] [CrossRef]
- Gupta, R.K.; Fabijanic, D.; Dorin, T.; Qiu, Y.; Wang, J.T.; Birbilis, N. Simultaneous improvement in the strength and corrosion resistance of Al via high-energy ball milling and Cr alloying. Mater. Des. 2015, 84, 270–276. [Google Scholar] [CrossRef]
- Gupta, R.K.; Fabijanic, D.; Zhang, R.; Birbilis, N. Corrosion behaviour and hardness of in situ consolidate nanostructured Al and Al-Cr alloys produced via high-energy ball milling. Corros. Sci. 2015, 98, 643–650. [Google Scholar] [CrossRef]
- Dorin, T.; Stanford, N.; Birbilis, N.; Gupta, R.K. Infuence of cooling rate on the microstructure and corrosion behaviour of Al-Fe Alloys. Corros. Sci. 2015, 100, 396–403. [Google Scholar] [CrossRef]
- Sherif, E.M.; Ammar, H.R.; Khalil, K.A. Effects of copper and titanium on the corrosion behavior of newly fabricated nanocrystalline aluminum in natural seawater. Appl. Surf. Sci. 2014, 301, 142–148. [Google Scholar] [CrossRef]
- Ghosh, S.; Dey, G.; Dusane, R.; Grover, A. Improved pitting corrosion behaviour of electrodeposited nanocrystalline Ni-Cu alloys in 3.0 wt. % NaCl solution. J. Alloys Compd. 2006, 426, 235–243. [Google Scholar] [CrossRef]
- Liu, L.; Li, Y.; Wang, F. Electrochemical corrosion behavior of nanocrystalline materials—A review. J. Mater. Sci. Technol. 2010, 26, 1–14. [Google Scholar] [CrossRef]
- Miyamoto, H.; Harada, K.; Mimaki, T.; Vinogradov, A.; Hashimoto, S. Corrosion of ultra-fine grained copper fabricated by equal-channel angular pressing. Corros. Sci. 2008, 50, 1215–1220. [Google Scholar] [CrossRef]
- Birbilis, N.; Estrin, Y. Corrosion of pure Mg as a function of grain size and processing route. Adv. Eng. Mater. 2008, 10, 579–582. [Google Scholar]
- Osório, W.R.; Freire, C.M.; Garcia, A. The role of macrostructural morphology and grain size on the corrosion resistance of Zn and Al castings. Mater. Sci. Eng. 2005, 402, 22–32. [Google Scholar] [CrossRef]
- Ralston, K.; Fabijanic, D.; Birbilis, N. Effect of grain size on corrosion of high purity aluminium. Electrochim. Acta 2011, 56, 1729–1736. [Google Scholar] [CrossRef]
- Barbucci, A.; Farne, G.; Matteazzi, P.; Riccieri, R.; Cerisola, G. Corrosion behaviour of nanocrystalline Cu90Ni10 alloy in neutral solution containing chlorides. Corros. Sci. 1998, 41, 463–475. [Google Scholar] [CrossRef]
- Chianpairot, A.; Lothongkum, G.; Schuh, C.A.; Boonyongmaneerat, Y. Corrosion of nanocrystalline Ni-W alloys in alkaline and acidic 3.5 wt. % NaCl solutions. Corros. Sci. 2011, 53, 1066–1071. [Google Scholar] [CrossRef]
- Seikh, A.H.; Baig, M.; Ammar, H.R. Corrosion Behavior of Nanostructure Al-Fe Alloy Processed by Mechanical Alloying and High Frequency Induction Heat Sintering. Int. J. Electrochem. Sci. 2015, 10, 3054–3064. [Google Scholar]
- Patterson, A. The Scherrer formula for X-ray particle size determination. Phys. Rev. 1939, 56, 978–982. [Google Scholar] [CrossRef]
- Zawrah, M.; Shaw, L. Microstructure and hardness of nanostructured Al-Fe-Cr-Ti alloys through mechanical milling. Mater. Sci. Eng. A 2003, 355, 37–49. [Google Scholar] [CrossRef]
- Shaw, L.; Luo, H.; Villegas, J.; Miracle, D. Thermal stability of nanostructured Al93Fe3Cr2Ti2 alloys prepared via mechanical alloying. Acta. Mater. 2003, 51, 2647–2663. [Google Scholar] [CrossRef]
- Sherif, E.M.; Park, S.-M. Effects of 1,4-naphthoquinone on aluminum corrosion in 0.50 M sodium chloride solutions. Electrochim. Acta 2006, 51, 1313–1321. [Google Scholar] [CrossRef]
- Frangini, S.; Masci, A. Intermetallic FeAl based coatings deposited by the electrospark technique: Corrosion behavior in molten (Li + K) carbonate. Surf. Coat. Technol. 2004, 184, 31–39. [Google Scholar] [CrossRef]
- Ma, H.; Chen, S.; Niu, L.; Zhao, S.; Li, S.; Li, D. Inhibition of copper corrosion by several Schiff bases in aerated halide solutions. J. Appl. Electrochem. 2002, 32, 65–72. [Google Scholar] [CrossRef]
- Singh, A.K.; Shukla, S.K.; Singh, M.; Quraishi, M.A. Inhibitive effect of ceftadizime on corrosion of mild steel in hydrochloric acid solution. Mater. Chem. Phys. 2011, 129, 68–76. [Google Scholar] [CrossRef]
- Sherif, E.M.; Park, S.-M. Effects of 2-amino-5-ethylthio-1,3,4-thiadiazole on copper corrosion as a corrosion inhibitor in aerated acidic pickling solutions. Electrochim. Acta 2006, 51, 6556–6562. [Google Scholar] [CrossRef]
- Rehim, S.S.A.; Hassan, H.H.; Amin, M.A. Corrosion and corrosion inhibition of Aland some alloys in sulphate solutions containing halide ions investigated by an impedance technique. Appl. Surf. Sci. 2002, 187, 279–290. [Google Scholar] [CrossRef]
- Zhou, Y.L.; Ninomi, M.; Akahori, T.; Fukui, H.; Toda, H. Corrosion resistance and biocompatibility of Ti-Ta alloys for biomedical applications. Mater. Sci. Eng. 2005, 398, 28–36. [Google Scholar] [CrossRef]
- Gupta, R.K.; Birbilis, N. The influence of nanocrystalline structure and processing route on corrosion of stainless steel: A review. Corros. Sci. 2015, 92, 1–15. [Google Scholar] [CrossRef]
- Frankel, G.S.; Newman, R.C.; Jahnes, C.V.; Russak, M.A. On the pitting resistance of sputter-deposited aluminum alloys. J. Electrochem. Soc. 1993, 140, 2192–2197. [Google Scholar] [CrossRef]


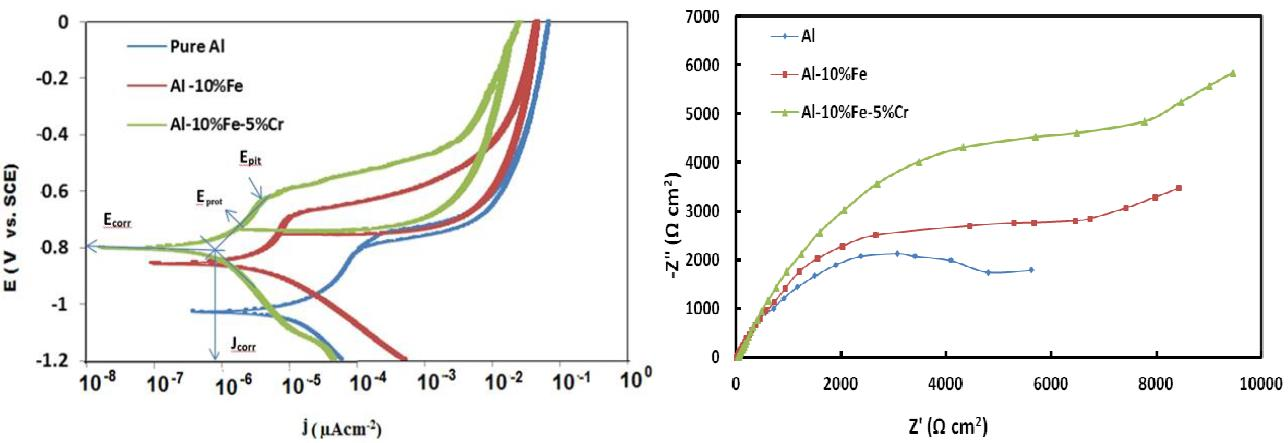
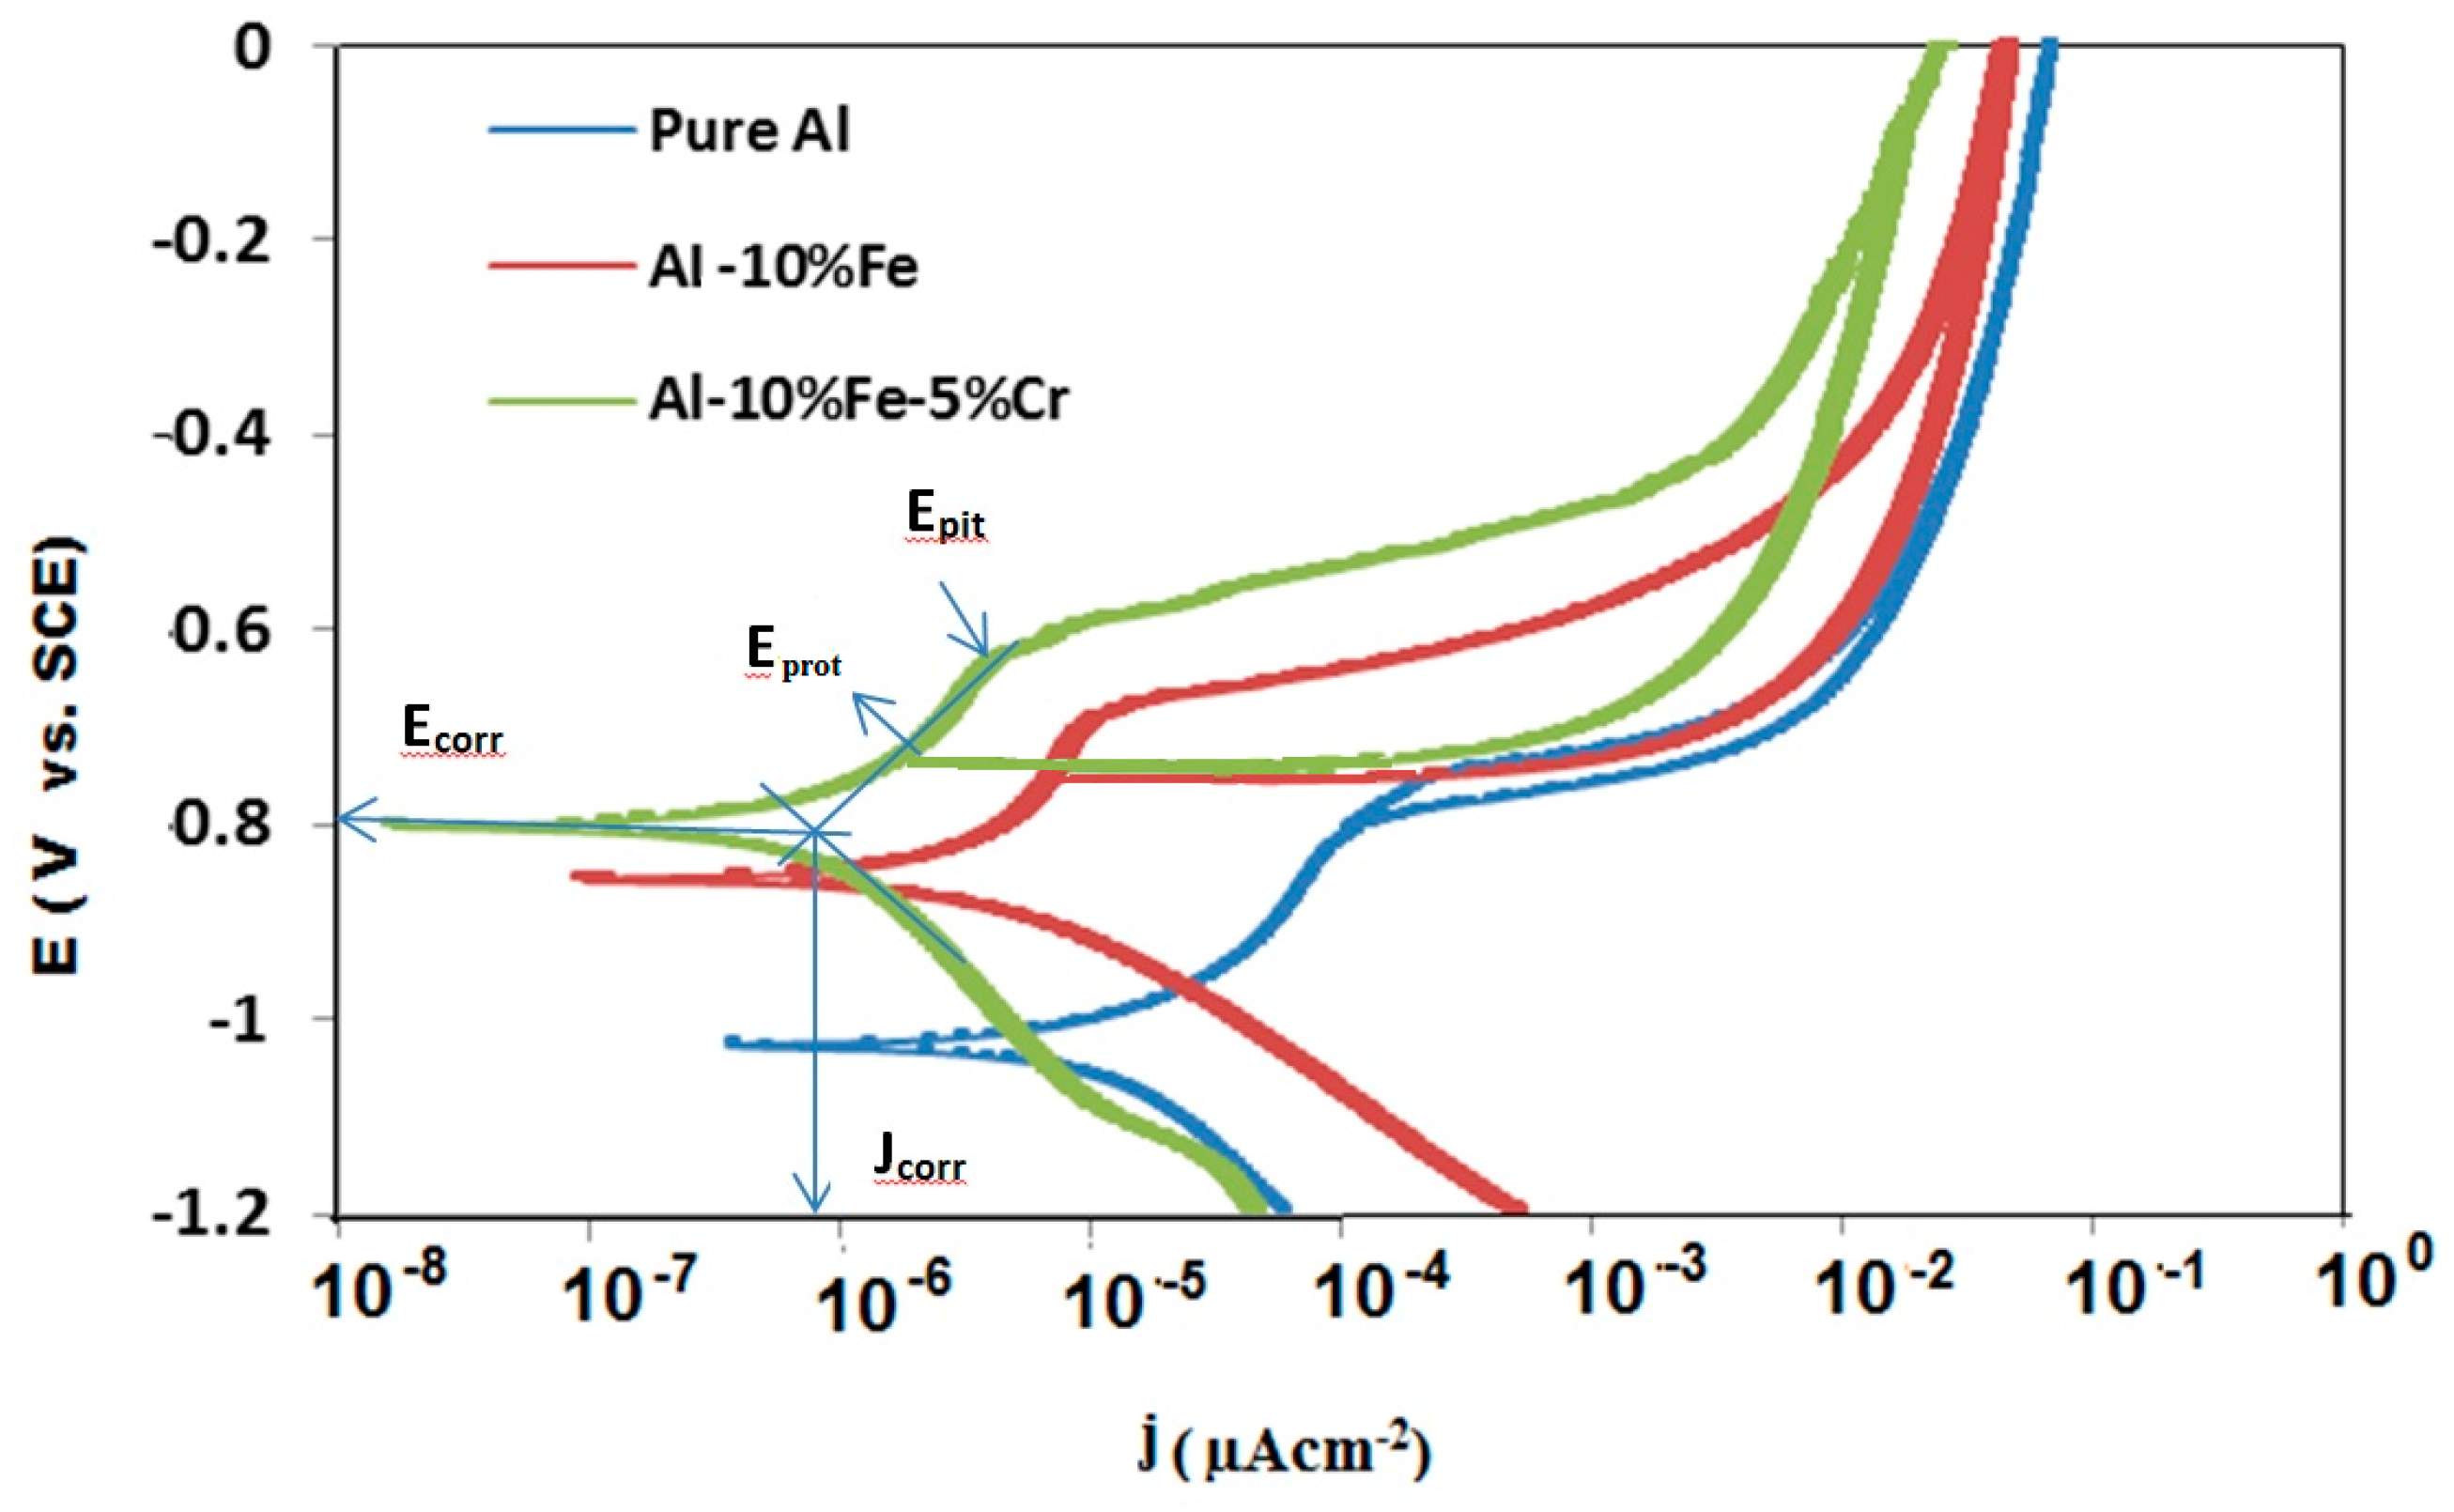
| Materials | Corrosion Parameters | |||||
|---|---|---|---|---|---|---|
| Ecorr, mV | jcorr, µA·cm−2 | Eprot, mV | Epit, mV | jpit, µA·cm−2 | Rp (kΩ·cm2) | |
| Al | −1048 | 14.47 | −941 | −824 | 89.3 | 4.873 |
| Al-10% Fe | −842 | 3.06 | −754 | −694 | 10.33 | 9.356 |
| Al-10% Fe-5%Cr | −802 | 0.796 | −706 | −633 | 4.84 | 19.005 |
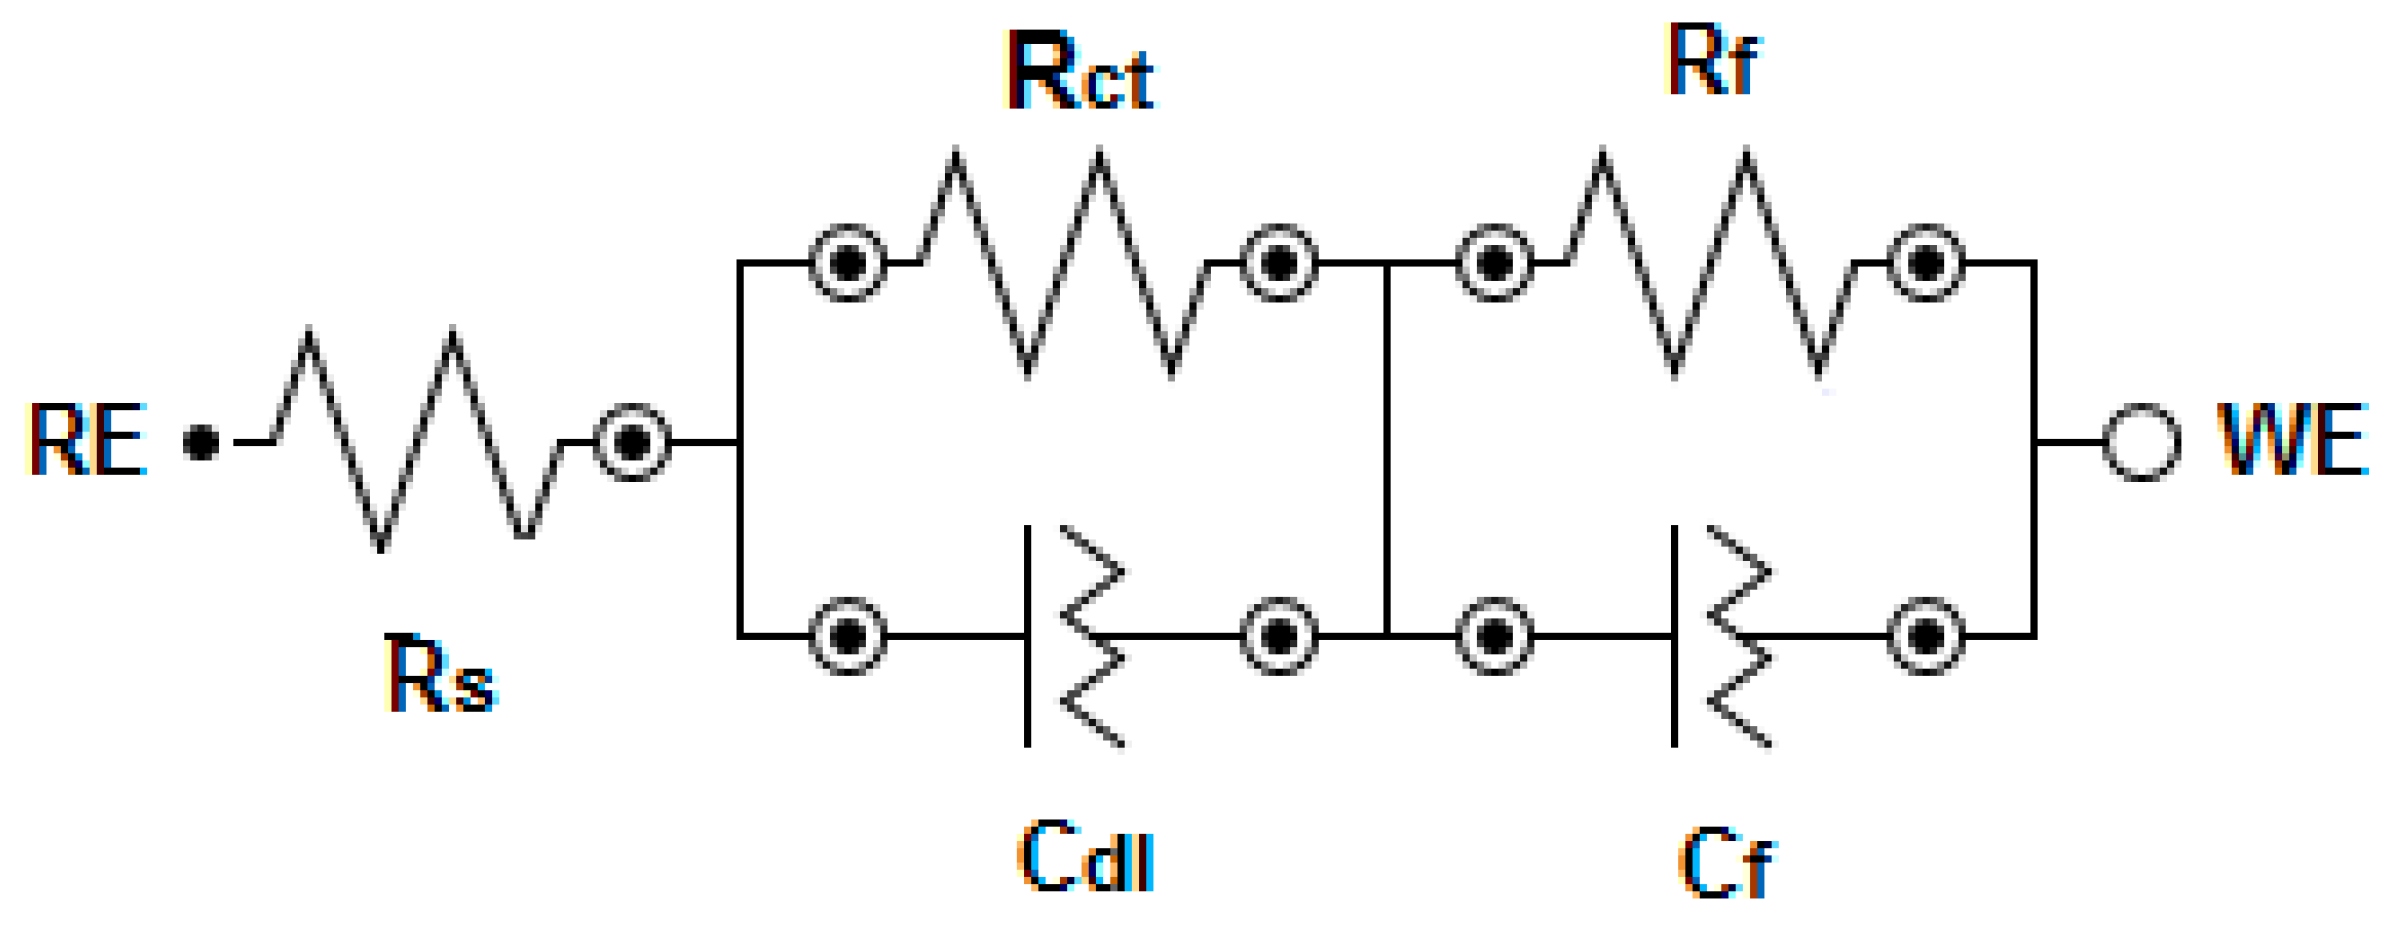
| Materials | EIS Parameters | ||||||
|---|---|---|---|---|---|---|---|
| RS, Ω cm2 | Q1 | Rct (kΩ cm2) | Q2 | Rf (kΩ cm2) | |||
| Cdl (μMho cm−2) | n | Cf (μMho cm−2) | n | ||||
| Al | 3.85 | 248.4 | 0.978 | 1.1 | 616 | 0.57 | 2.8 |
| Al-10% Fe | 5.38 | 180.1 | 1.00 | 1.8 | 523 | 0.62 | 6.2 |
| Al-10% Fe- 5% Cr | 5.36 | 48.1 | 0.999 | 7.05 | 363 | 0.54 | 17.1 |
© 2016 by the authors; licensee MDPI, Basel, Switzerland. This article is an open access article distributed under the terms and conditions of the Creative Commons Attribution (CC-BY) license (http://creativecommons.org/licenses/by/4.0/).
Share and Cite
Seikh, A.H.; Baig, M.; Ammar, H.R.; Alam, M.A. The Influence of Transition Metals Addition on the Corrosion Resistance of Nanocrystalline Al Alloys Produced by Mechanical Alloying. Metals 2016, 6, 140. https://doi.org/10.3390/met6060140
Seikh AH, Baig M, Ammar HR, Alam MA. The Influence of Transition Metals Addition on the Corrosion Resistance of Nanocrystalline Al Alloys Produced by Mechanical Alloying. Metals. 2016; 6(6):140. https://doi.org/10.3390/met6060140
Chicago/Turabian StyleSeikh, Asiful Hossain, Muneer Baig, Hany Rizk Ammar, and Mohammed Asif Alam. 2016. "The Influence of Transition Metals Addition on the Corrosion Resistance of Nanocrystalline Al Alloys Produced by Mechanical Alloying" Metals 6, no. 6: 140. https://doi.org/10.3390/met6060140