Article

Hydrogen Absorption in Metal Thin Films and Heterostructures Investigated in Situ with Neutron and X-ray Scattering

1
Department of Physics, California State University, San Bernardino, CA 92407, USA
2
Australian Nuclear Science and Technology Organisation, Lucas Heights, NSW 2234, Australia
3
Institute for Superconducting and Electronic Materials, University of Wollongong, Wollongong, NSW 2522, Australia
4
School of Physics, The University of Western Australia, Crawley, WA 6009, Australia
5
Department of Physics and Materials Science, The City University of Hong Kong, Hong Kong
*
Author to whom correspondence should be addressed.
Metals 2016, 6(6), 125; https://doi.org/10.3390/met6060125
Submission received: 16 April 2016 / Revised: 13 May 2016 / Accepted: 17 May 2016 / Published: 24 May 2016
(This article belongs to the Special Issue Metals Challenged by Neutron and Synchrotron Radiation)

Abstract

:
Due to hydrogen possessing a relatively large neutron scattering length, hydrogen absorption and desorption behaviors in metal thin films can straightforwardly be investigated by neutron reflectometry. However, to further elucidate the chemical structure of the hydrogen absorbing materials, complementary techniques such as high resolution X-ray reflectometry and diffraction remain important too. Examples of work on such systems include Nb- and Pd-based multilayers, where Nb and Pd both have strong affinity to hydrogen. W/Nb and Fe/Nb multilayers were measured in situ with unpolarized and polarized neutron reflectometry under hydrogen gas charging conditions. The gas-pressure/hydrogen-concentration dependence, the hydrogen-induced macroscopic film swelling as well as the increase in crystal lattice plane distances of the films were determined. Ferromagnetic-Co/Pd multilayers were studied with polarized neutron reflectometry and in situ ferromagnetic resonance measurements to understand the effect of hydrogen absorption on the magnetic properties of the system. This electronic effect enables a novel approach for hydrogen sensing using a magnetic readout scheme.

Graphical Abstract

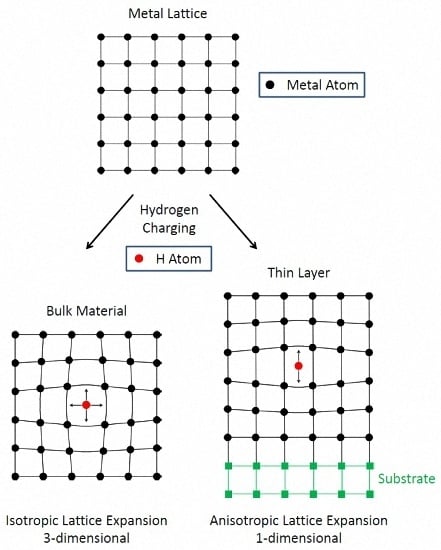
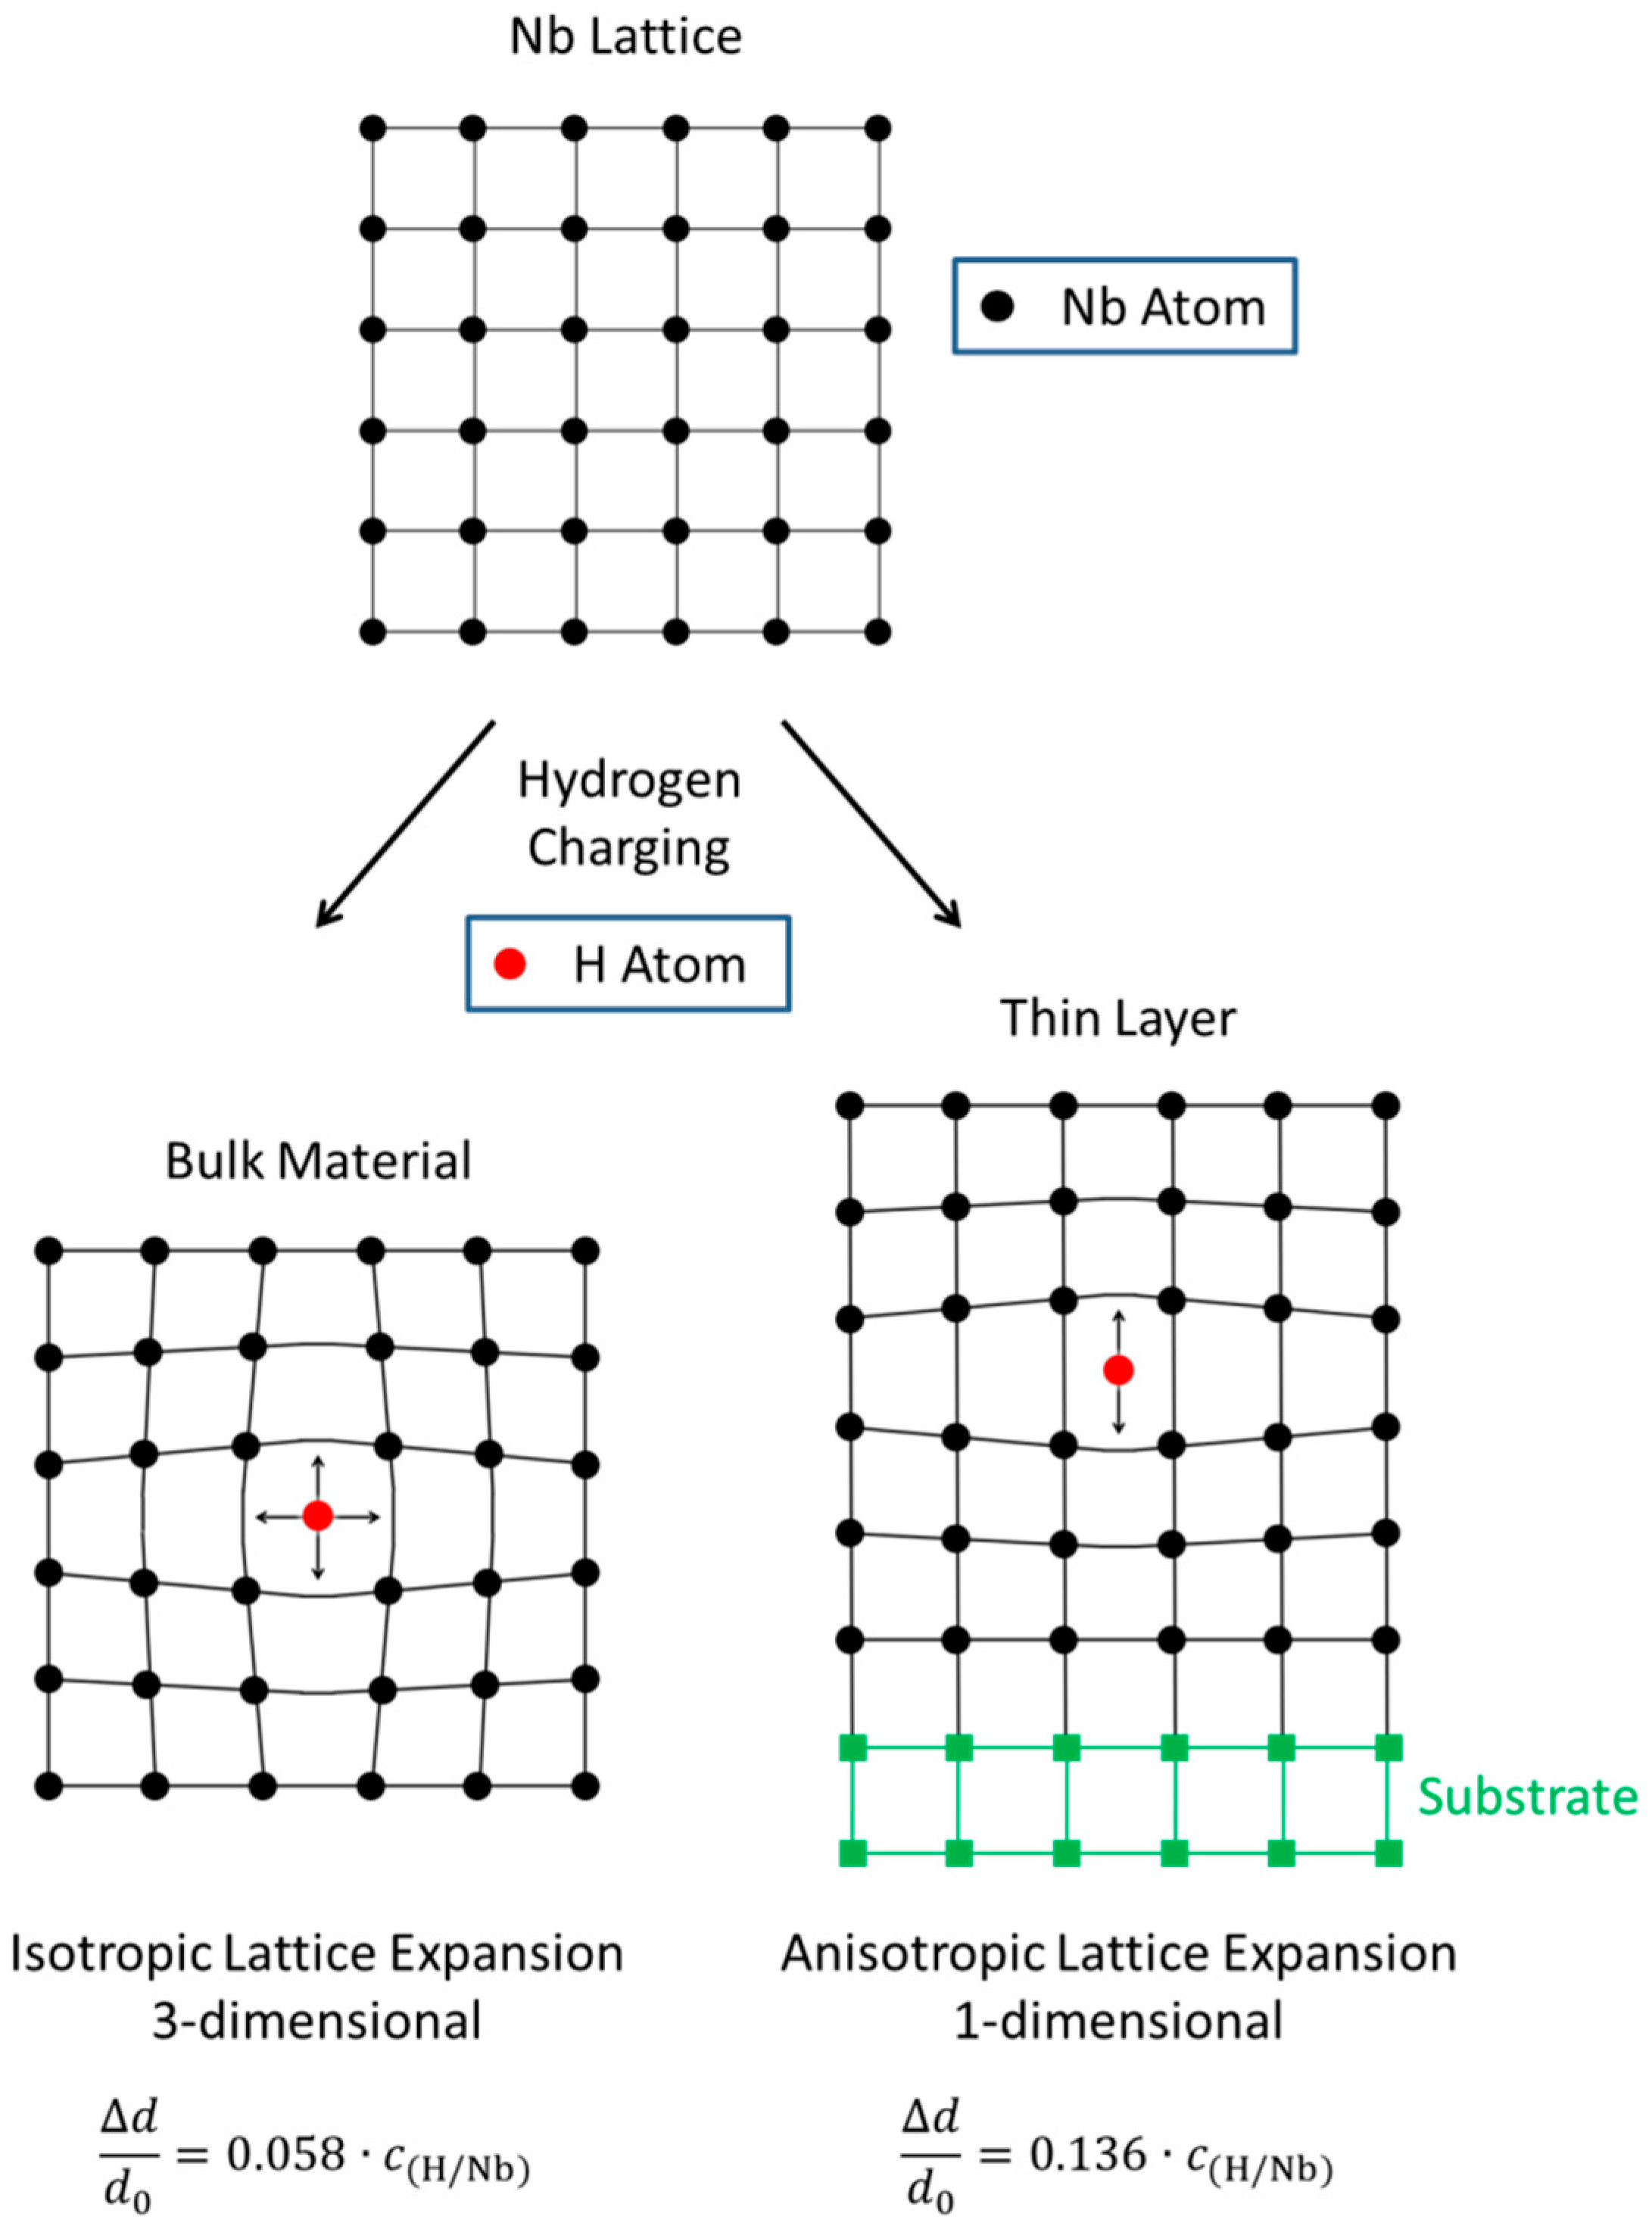
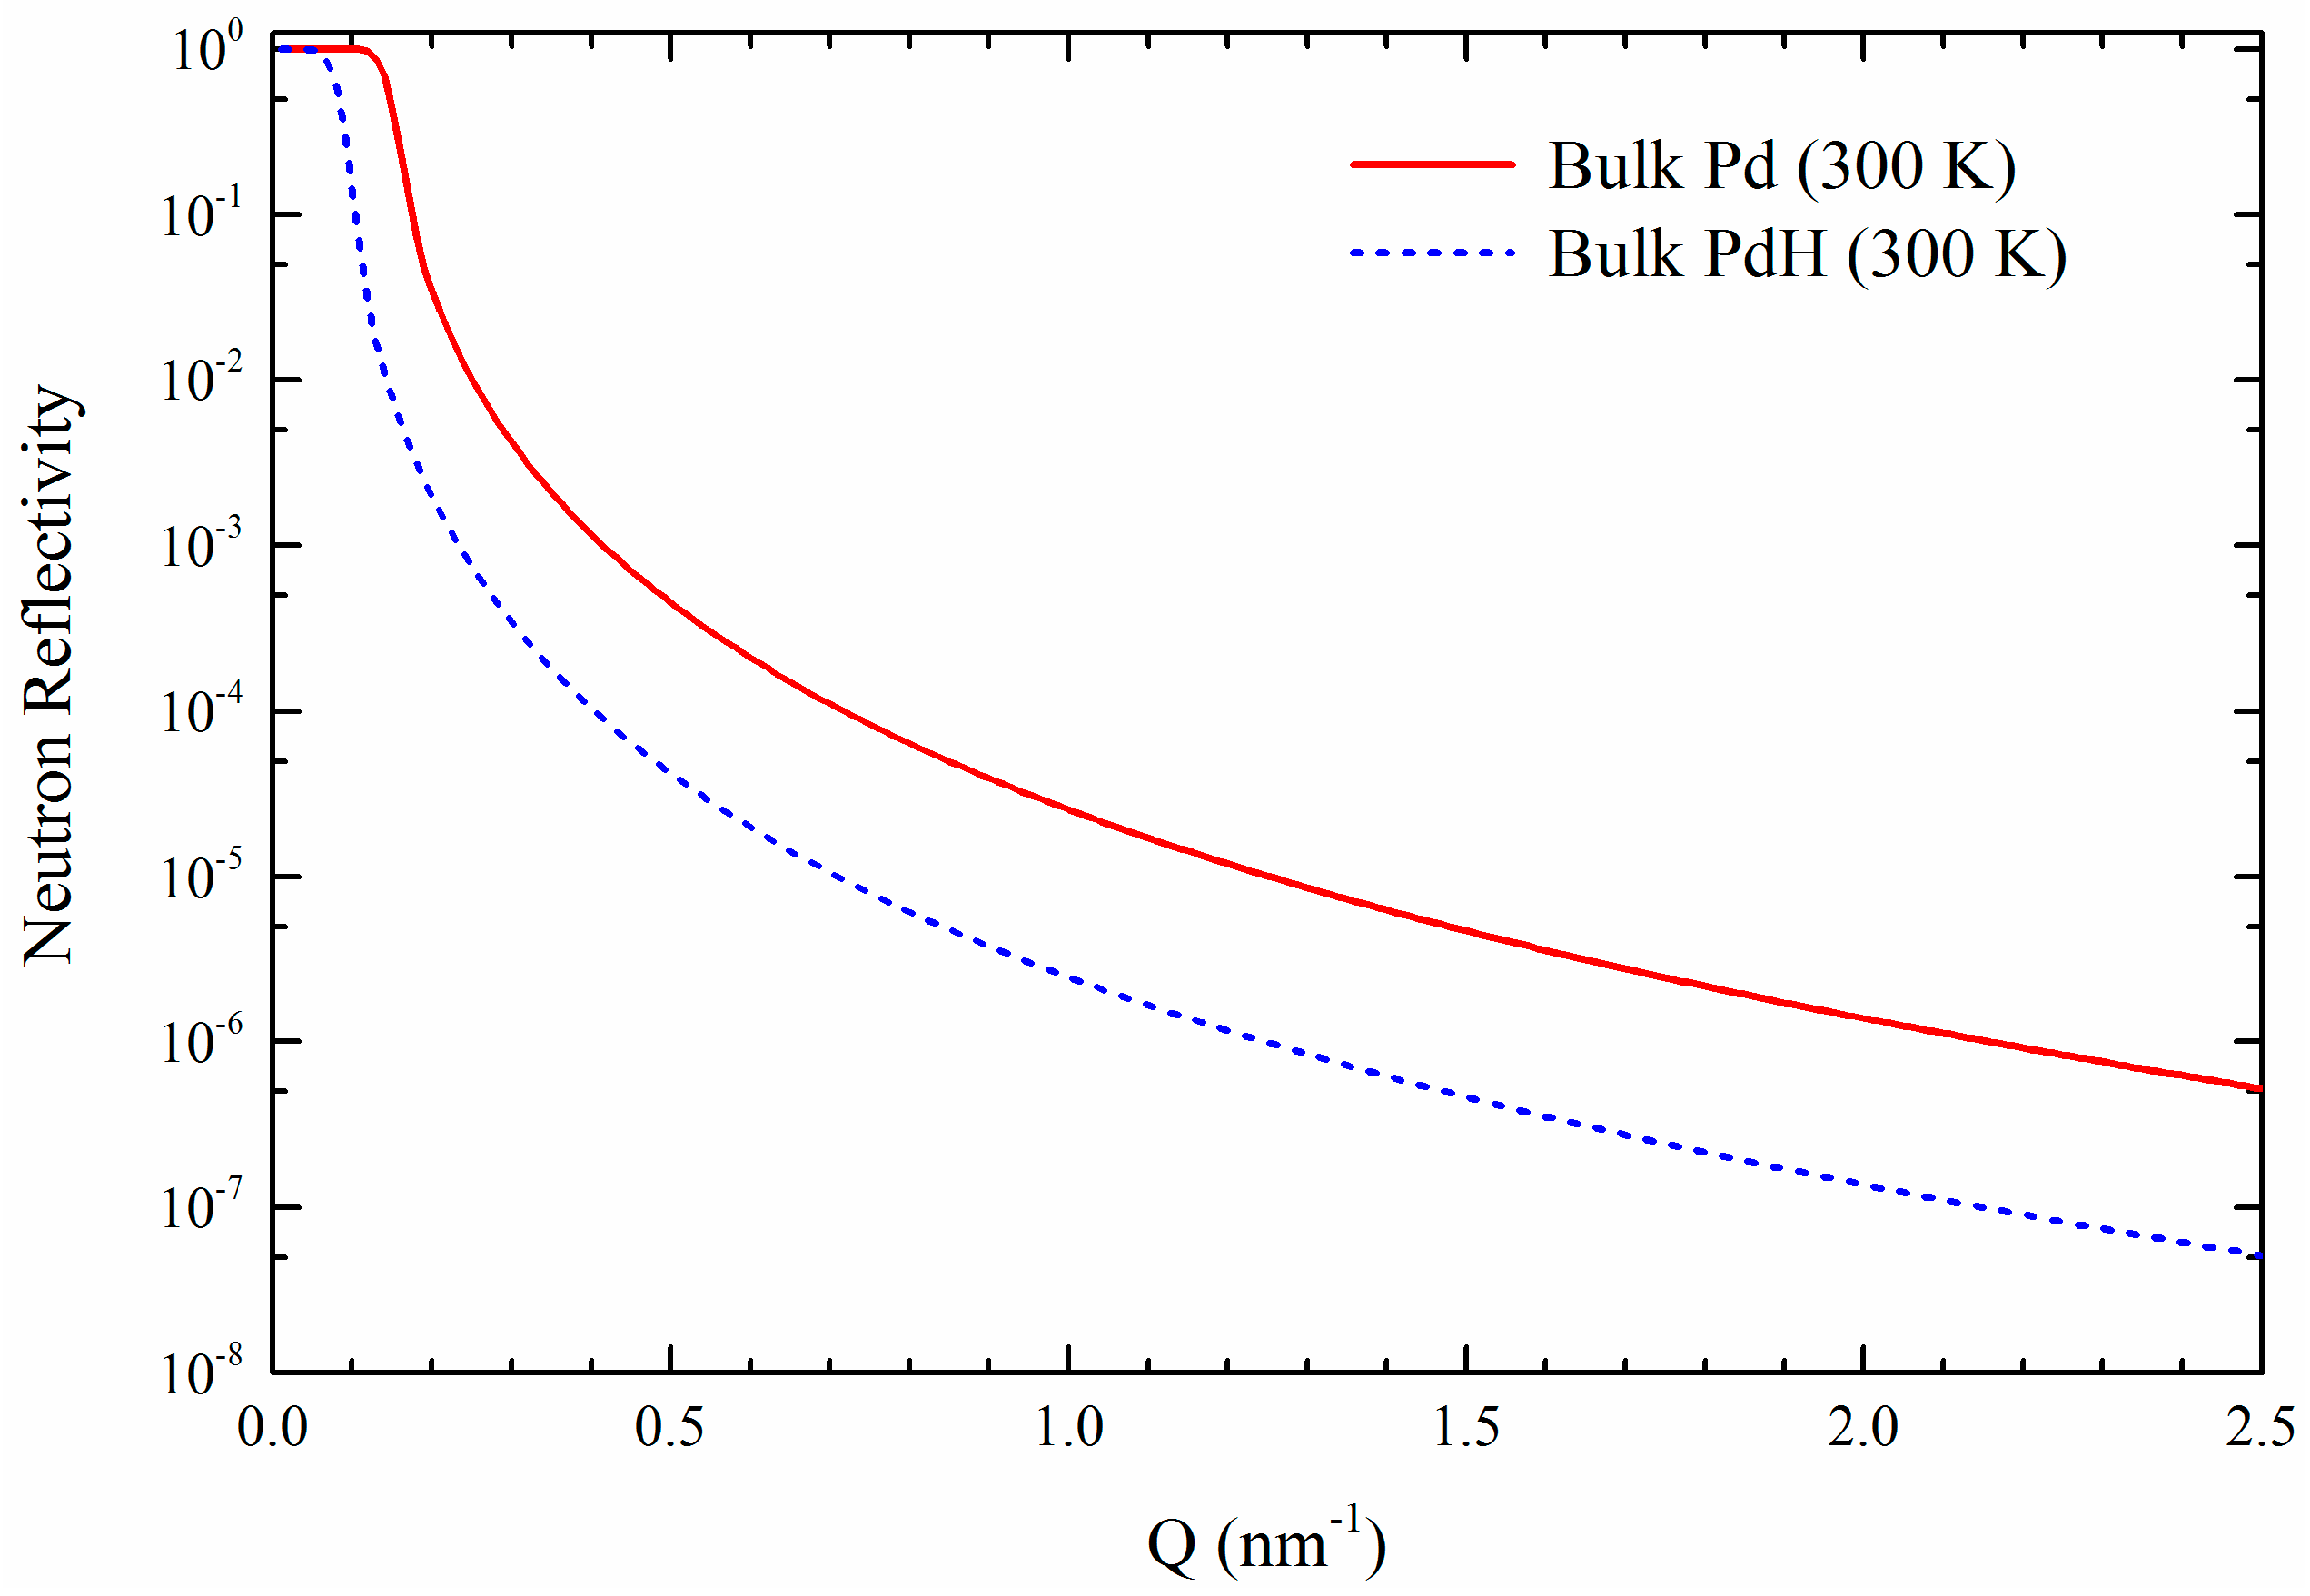
1. Introduction: Hydrogen Absorption in Metals—Bulk versus Thin Films

Thin films and layers of metals with chemical affinity to hydrogen such as Nb, Pd, Pt, V, Mg, Ti, the rare earth metals and related alloys play an important role in many technological and engineering materials and devices. A prime area of research is chemical energy storage in the vast field of metal hydrides [1,2,3]. Here, the thin-film approach is of particular interest as it allows studying hydrogen-metal interactions on the nanoscale, which may show distinct novel features as well as non-equilibrium states of hydride materials that would not exist in bulk form [4,5,6].
Generally, the absorbed hydrogen occupies interstitial sites in the host crystal lattice. As a result, the host atoms are displaced from their regular lattice positions and the associated strain/stress fields will give rise to altered physical properties. Metal hydrides can show disordered and ordered arrangements of hydrogen sublattices, depending on the hydrogen concentration and temperature. Formation of dislocations due to lattice coherency stresses in multi-phase regions exceeding the critical yield stress is another important reason for modified material properties [7].
As in the case of bulk materials showing the ability to absorb large quantities of hydrogen, the interaction of hydrogen with thin films can lead to significant modification of their electronic, magnetic, and structural properties [8]. Exciting results have been achieved in the past. Among these are Y and La thin films that reversibly switch their optical properties upon hydrogen absorption [9], and Fe/Nb [10] or Fe/V [11] multilayers that reversibly switch their magnetic coupling and magnetoresistivity during hydrogen charging/discharging, and fine-tuning of the spin-density-wave state in Cr/V heterostructures via hydrogen uptake [12].
In some systems, such as Fe/V [13] and Pd/Nb [14], giant lattice expansions caused by hydrogen absorption have been reported. A more recent area of thin-film research is hydrogen sensors based on gas absorption [15,16,17], of which there is a growing demand due to their importance in fuel-cell developments and hydrogen-powered cars. While many approaches to this challenge have been investigated, there are still obstacles in the development of higher quality sensors, for example cross-sensitivity to other gas species [18].
In some systems, hydrogen uptake can cause physical properties of the metal to deteriorate. An example is Nb-based superconducting radio-frequency cavities of particle accelerators, where metal-hydride surface layers can develop, leading to undesirable extra surface resistivity [19]. For a theoretical understanding of the remarkable changes of thin-film properties due to hydrogen charging, it is important to know how hydrogen is incorporated into the films, whether thermodynamic phase diagrams of the corresponding bulk materials are applicable, and how hydrogen absorption and its kinetics depend on various external parameters such as temperature and hydrogen pressure.
Much research has been performed on understanding the bulk metal-hydrogen systems and their temperature/concentration phase diagrams [20]. For the case of Nb, early X-ray diffraction work identified two structural phases at moderate temperatures: a gas-like phase α and a liquid-like phase α’, associated with low and high hydrogen concentrations, respectively, both with disordered hydrogen distributions in which the Nb bcc lattice is retained [21]. The α-α′ two-phase region terminates at a critical point at T = 444 K with 23.7% (H/Nb). The H/Nb phase diagram shows a triple point temperature of 361 K below which a wide two-phase α-β region occurs with β being an ordered Nb hydride phase with fcc orthorhombic structure [22].
The fcc-metal Pd (lattice parameter a = 0.38874 nm) can be loaded with hydrogen retaining the primary α phase up to a H/Pd ratio of 1.7% at 25 °C (corresponding to a = 0.3895 nm) [23]. Increasing the macroscopic hydrogen concentration beyond 1.7% (H/Pd) results in a two-phase α-α′ region in which the fcc-α′ phase has a H/Pd ratio of 60% with a distinct lattice parameter of 0.4025 nm. Beyond 60% (H/Pd), the crystal is in a single α′ phase and the lattice parameter further increases with increasing concentration. Stoichiometric PdH can be approached by filling all octahedral interstices resulting in an ideal NaCl structure.
In general, charging experiments reveal that the hydrogen absorption process is altered in thin-film geometry (see Ref. [24] for a recent review on microstructural aspects of hydrogen absorption in nanoscale materials). In comparison to hydrogen charging experiments on bulk samples, two additional important effects have to be taken into account for thin films. One effect is the interaction between the hydrogen-absorbing film and the substrate. Generally, the substrate-film bond leads to a lateral clamping effect. During hydrogen uptake, the film is allowed to expand freely only in the out-of-plane direction, while in-plane expansion is strongly hindered. Figure 1 shows three-dimensional versus one-dimensional lattice expansion schematically.
However, in thin films, the hydrogen absorption process will build up very large lateral (in-plane) stresses, which may exceed the yield stress of the system. Should this occur, the stress will be released by non-reversible formation of dislocations or even by delamination of the film from the substrate. It is quite remarkable that in some cases thin film systems can be completely reversibly charged and discharged with hydrogen. For Nb films on sapphire substrates, for example, it has been emphasized that the adhesive forces at the metal-ceramic interface must be enormous as the in-plane stress resulting from hydrogen loading exceeded the yield stress of bulk Nb by at least one order of magnitude [25]. It turns out that the yield stress for thin film/substrate systems may significantly differ from the corresponding bulk yield stress of that particular film material. For example, it was recently demonstrated that nanometer thick ultra-thin epitaxial Nb films can absorb very high amounts of hydrogen, c = 1 (H/Nb), reversibly without any noticeable plastic deformation or delamination from the substrate [26]. The measured value of the hydrogen-induced stress was on the order of −10 GPa, i.e., over an order of magnitude higher than the Nb bulk yield stress. The effective yield stress of a particular thin film/substrate system will depend on a number of factors, including the specific material combinations, layer thicknesses, crystalline quality and intrinsic stress levels of the films, temperature, etc.
Charging bulk Nb with hydrogen, for example, usually results in an isotropic, three-dimensional lattice expansion of the Nb. In the α and α′ phases, the experimentally determined relation between relative expansion Δd/d0 of lattice parameters and the hydrogen concentration c is Δd/d0 = 0.058·c (H/Nb), and it is linear up to c (H/Nb) = 1 [21]. For a hydrogen absorbing thin film being firmly clamped to a rigid substrate, one would find an anisotropic, one-dimensional out-of-plane lattice expansion. Due to the clamping to the substrate, no layer expansion within the layer plane is possible, and the proportionality factor will differ from the case of hydrogen charged bulk material. Theoretically, one would expect to find Δd/d0 = 0.136·c (H/Nb) [14].
The second important effect is the spatial proximity between a hydrogen absorbing layer and any neighboring material. Close to the interface, within the first few monolayers, drastic deviations from bulk behavior may occur due to charge-transfer processes altering the absorption potential for hydrogen [27]. Thus, one can expect a film-thickness dependence of the average hydrogen solubility. Figure 2 shows this effect schematically.
It should be noted that the absorption of hydrogen by Nb lattice vacancies is energetically strongly preferred to absorption into interstitial sites. First-principle calculations of Nb hydride formation showed that a single vacancy can accommodate six hydrogen atoms in the symmetrically equivalent lowest-energy sites and additional hydrogen in the nearby interstitial sites affected by the strain field. This indicates that a vacancy can serve as a nucleation center for hydride phase formation [19]. The trapping in vacancies was experimentally confirmed by positron annihilation experiments [28] where four hydrogen atoms were detected in one vacancy. The issue of hydrogen absorption and trapping in thin films (<100 nm) due to strain field effects is extensively discussed in the literature, see references 17–25 in [19], and in [29].
In view of the important role that the surface and surface-near layers play in the hydrogen absorption and diffusion process, it is imperative that the structural effects of hydrogen within these systems must be well understood. However, it is experimentally difficult to study hydrogen-induced structural changes in nanoscale layers. In this regard, neutrons provide a unique opportunity to directly probe hydrogen absorbed in metallic systems by scattering methods [8,10,11,12,30,31,32]. Often, X-rays are used to assess the structure of hydrogen absorbing materials and they are capable of observing effects such as lattice and layer expansion of the host crystal with increased hydrogen concentration [33,34,35,36,37,38]. However, X-rays are nearly completely insensitive to the hydrogen atoms themselves since the X-ray scattering length is determined by the atomic number. In contrast, the scattering length for neutrons varies randomly from element to element, and, as a consequence, hydrogen in a given material usually scatters as strongly, or sometimes stronger, than the absorbing medium. The fact that both hydrogen and deuterium atoms strongly scatter neutrons opens up the opportunity for isotope contrast variation [39]. These combined properties make neutron scattering a unique tool to identify the location and concentration of hydrogen in hydride materials.
Specifically for thin films, neutron reflectometry has proven to be an important technique when studying systems where the layered geometry is relevant to the behavior of the material or to their eventual applications. Neutron reflectometry is capable of determining the chemical profile of hydrogen and the host compound across thin films and multilayer samples up to roughly 200 nm in thickness. The depth sensitivity of this technique can elucidate properties such as hydrogen concentration gradients or the qualities of buried interfaces. Besides hydrogen sensitivity, neutrons have an additional advantage over X-rays in that they are strongly sensitive to magnetic moments, and, as such, polarized neutron reflectometry can be used to obtain magnetic depth profiles, which can be correlated with structural information.
This script focuses on utilizing both neutron and X-ray scattering techniques to study thin films and multilayers containing hydrogen absorbing metal components. In the first part of this review, we discuss hydrogen behavior in polycrystalline Fe/Nb multilayers. The results are compared with the case of epitaxially grown single-crystalline W/Nb [001] superlattices. The latter show distinctively different hydrogen absorption/desorption behavior due to a much stronger impact of the initial adherence to the substrate. The second portion of the work presented here reports on Pd/Co multilayers as a hybrid metallic-spintronic system for sensing hydrogen using a magnetic readout based on the ferromagnetic resonance technique. In this case, polarized neutron reflectometry proved especially useful as it allowed the observation of the magnetism of the Co layer simultaneous with hydrogen absorption studies.

2. Experimental Section

2.1. Materials and Applications

2.1.1. Hydrogen in Fe/Nb and W/Nb Films

Due to its high corrosion resistance, Nb is widely used across many types of applications, including hypoallergenic medical device and jewelry coatings, and linings in chemical plants. Despite the pure Nb surface being quite reactive, under most conditions, Nb will readily form a very thin oxide layer (Nb2O5 being the most stable oxide), which is responsible for its chemical stability. However, a cold-worked piece of Nb metal manufactured for a real-world application will still possess numerous vacancies, dislocations and grain boundaries, and these can very effectively transport hydrogen from an external source, e.g., from processing materials, to the Nb bulk interior. Even relatively low hydrogen concentrations at levels of 100 ppm may substantially deteriorate particular properties, e.g., the ductility of Nb alloy construction materials [40].
For the work presented here, polycrystalline thin Nb layers of variable thickness were prepared by growing Fe/Nb multilayers on oxidized Si substrates [41]. These samples were prepared by ion-beam sputtering at room temperature in an ultra-high vacuum chamber with a base pressure <5 × 10⁻⁹ mbar, where the Nb layers grew strongly (110) textured. Epitaxial Nb layers were prepared by growing W/Nb(001) superlattices at elevated temperatures of 200 °C on etched MgO(001) substrates by magnetron sputtering [42,43]. Both Fe/Nb and W/Nb multilayers had a 5 nm thick Pd capping layer to prevent oxidation and to facilitate hydrogen absorption. Both systems were prepared in the form of multilayers to optimize the intensity for the scattering experiments discussed below.
The effect of hydrogen on Nb thin films was initially studied by us due to observed hydrogen-induced changes of the magnetic coupling and the related giant magnetoresistivity effect in Fe/Nb multilayers [10]. The hydrogen-induced structural changes in the polycrystalline Fe/Nb system [41] were later compared with the behavior of epitaxially grown W/Nb superlattices [43].
For the Fe/Nb system, the Fe layer thickness, dFe, was kept constant at 2.6 nm, while the Nb thickness, dNb, varied from 2 to 100 nm. In the W/Nb system, the W layer thickness, dW, was 2.6 nm, and dNb was 3 or 10 nm. The number of repeats of each Fe/Nb bilayer was chosen to provide a strong reflectivity signal allowing for the characterization of the Nb layers. Typical interface roughnesses, as determined by X-ray reflectivity, were 0.5 nm for Fe/Nb and 0.3 nm for W/Nb. A summary of the samples can be found in Table 1.

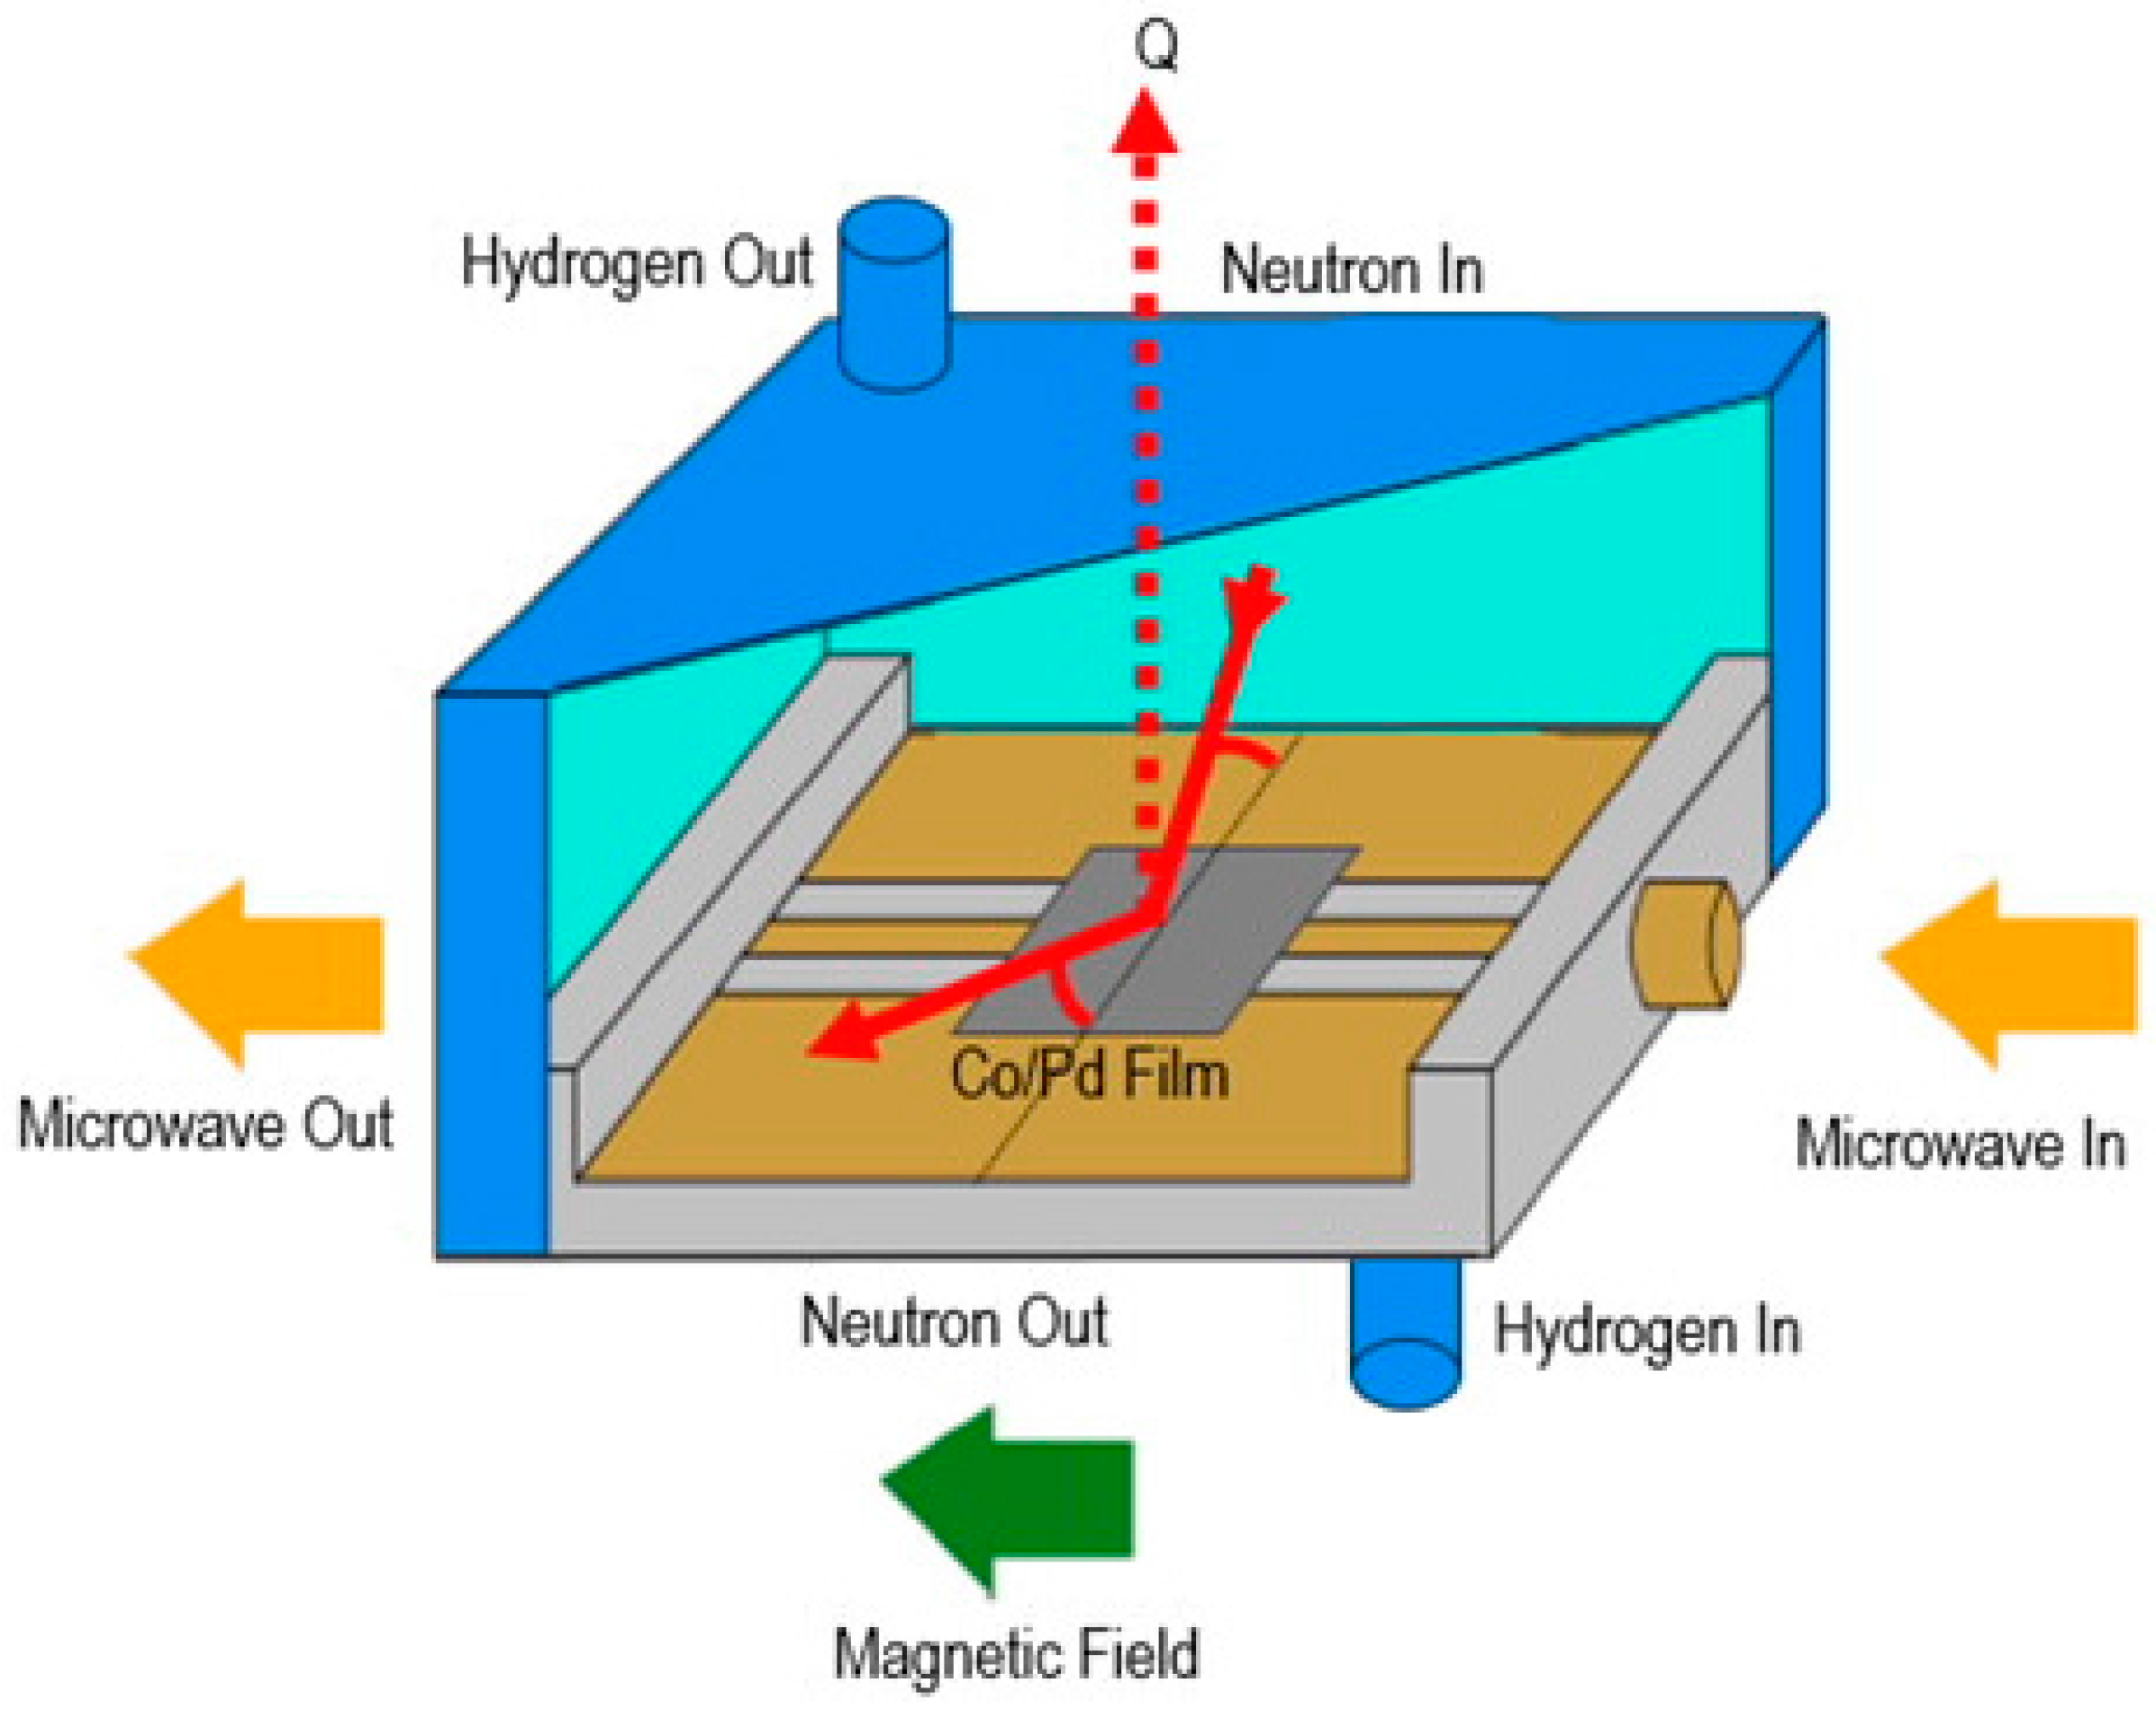
2.1.2. Hydrogen in Co/Pd Films

Pd is one of the most utilized materials in hydrogen gas sensing due to its ability to reversibly absorb hydrogen [44]. The absorption process is accompanied by several changes to the physical properties of Pd, including the aforementioned lattice expansion of up to several percent and an increase in resistivity as high as 80% for PdH0.7 at 25 °C [45]. Pd is also quite selective regarding hydrogen absorption and exhibits low sensitivity to other gases, such as CO, Cl2, SO2, H2S, NOx, and hydrocarbons, making it a suitable material in hydrogen sensors [46]. The challenge to reach the application stage lies in how to most effectively sense these hydrogen-induced changes to Pd. Current devices have several drawbacks: poor sensitivity, complex detection systems, slow response time, high power consumption, or potential flammability [18].
A novel approach to this problem lies in exploiting one of the lesser known aspects of Pd: magnetic properties. Although Pd itself is paramagnetic, when it neighbors ferromagnetic metals, such as Co, Fe, and NiFe, a perpendicular magnetic anisotropy (PMA) develops at the interface [47]. For ultra-thin ferromagnetic films (~0.5–1 nm), PMA aligns the magnetization of the ferromagnetic layer in the out-of-plane direction. For increased film thickness of the ferromagnet, the magnetization direction lies in the film plane, but the presence of PMA at the interface can affect a number of magnetic properties, including ferromagnetic resonance (FMR). Monitoring the magnetic response of these systems may then be a way to approach the design of novel hydrogen gas sensors.
Here, work is presented on a (10 nm) Co/(10 nm) Pd bilayer deposited via sputtering on a Si substrate [15], with the Pd layer on top allowing more Pd surface area to be exposed to external hydrogen gas.

2.2. Experimental Methods

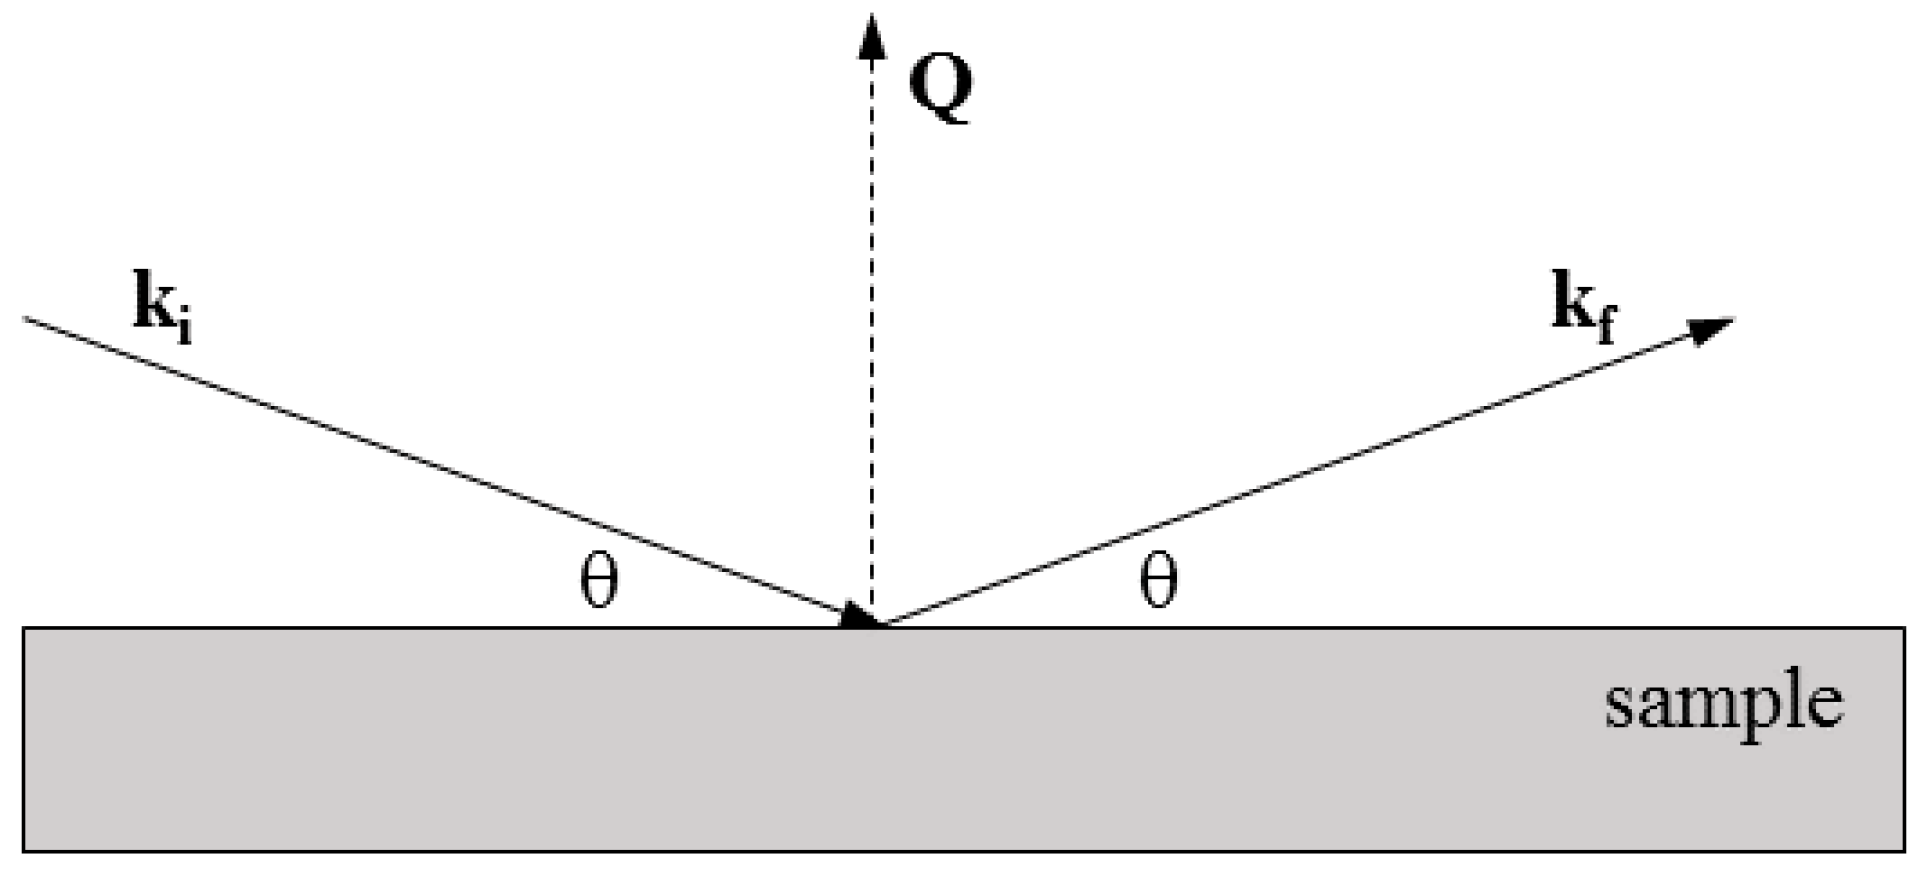
2.2.1. Neutron Reflectometry

Reflectometry uses small-angle specular reflection (θi = θf) to probe the chemical depth profile across a surface, thin film, or multilayer as a function of depth. The geometry of this technique is shown in Figure 3 where the scattering vector, Q, is given by Q = kfki. Q is related to the wavelength of the incoming neutrons, λ, and the angle of reflection, θ, by
Q = 4 π sin θ λ
At each surface and interface, some fraction of the incoming beam is reflected and the other fraction is transmitted and refracted. As neutrons pass through each layer, they are exposed to an effective nuclear scattering potential given as
V n = 2 π 2 m b N
where b is the scattering length of the element, N is its atomic density and m is the neutron mass. The term bN is the scattering length density (SLD) and is related to the chemical makeup of a material as well as its physical density of the contained elements (for compounds: btotal·Ntotal = b1·N1 + b2·N2 + … + bi·Ni) [48]. Reflectometry allows one to model the SLD as a function of sample depth, which can be used to link features like hydrogen concentration to the change in SLD from a material’s expected bulk value.
As previously mentioned, neutrons as scattering probes are particularly well suited to investigate hydrogen-sensitive materials because the magnitude of the hydrogen scattering length is of the same order as for many other metals. However, hydrogen has a negative scattering length, which can lead to its easy detection by comparing reflections from hydrogenated and non-hydrogenated materials. An example of this is demonstrated in Figure 4, where neutron reflectivity curves are simulated for a bulk Pd surface (red solid line), which would have an SLD of 402 μm−2, as compared to the α′ phase of PdH (blue dashed line), where the SLD changes to 126 μm−2.
Neutron reflectivity measurements on the Fe/Nb and W/Nb samples were performed at the V6 reflectometer [49,50] at the Hahn-Meitner-Institut Berlin, Germany, and the POSY2 reflectometer [51] at the Intense Pulsed Neutron Source at Argonne National Laboratory, Argonne, IL, USA.

2.2.2. Polarized Neutron Reflectometry (PNR)

Polarized neutron reflectometry (PNR) exploits the spin of the neutron as an additional tool for observing magnetic depth profiles across samples. In addition to the nuclear scattering potential in Equation (2), neutrons travelling through a magnetic layer will be exposed to a magnetic scattering potential given by
V m = 2 π 2 m b mag N = B · s ^
where B is the magnetic induction vector, s ^ is the neutron spin, and bmag is the magnetic scattering length (1 µB/atom results in bmag = 2.695 fm). Depending on the direction of the incoming neutron spin, the total scattering potential (combining Equations (2) and (3)) is then Vtot = Vn ± Vm. By performing reflectivity measurements with two incoming, antiparallel neutron polarization states (+ and −), the difference between the R+ and R− channels essentially excludes the nuclear scattering and can be used to ascertain a profile of the magnetization across thin layers.

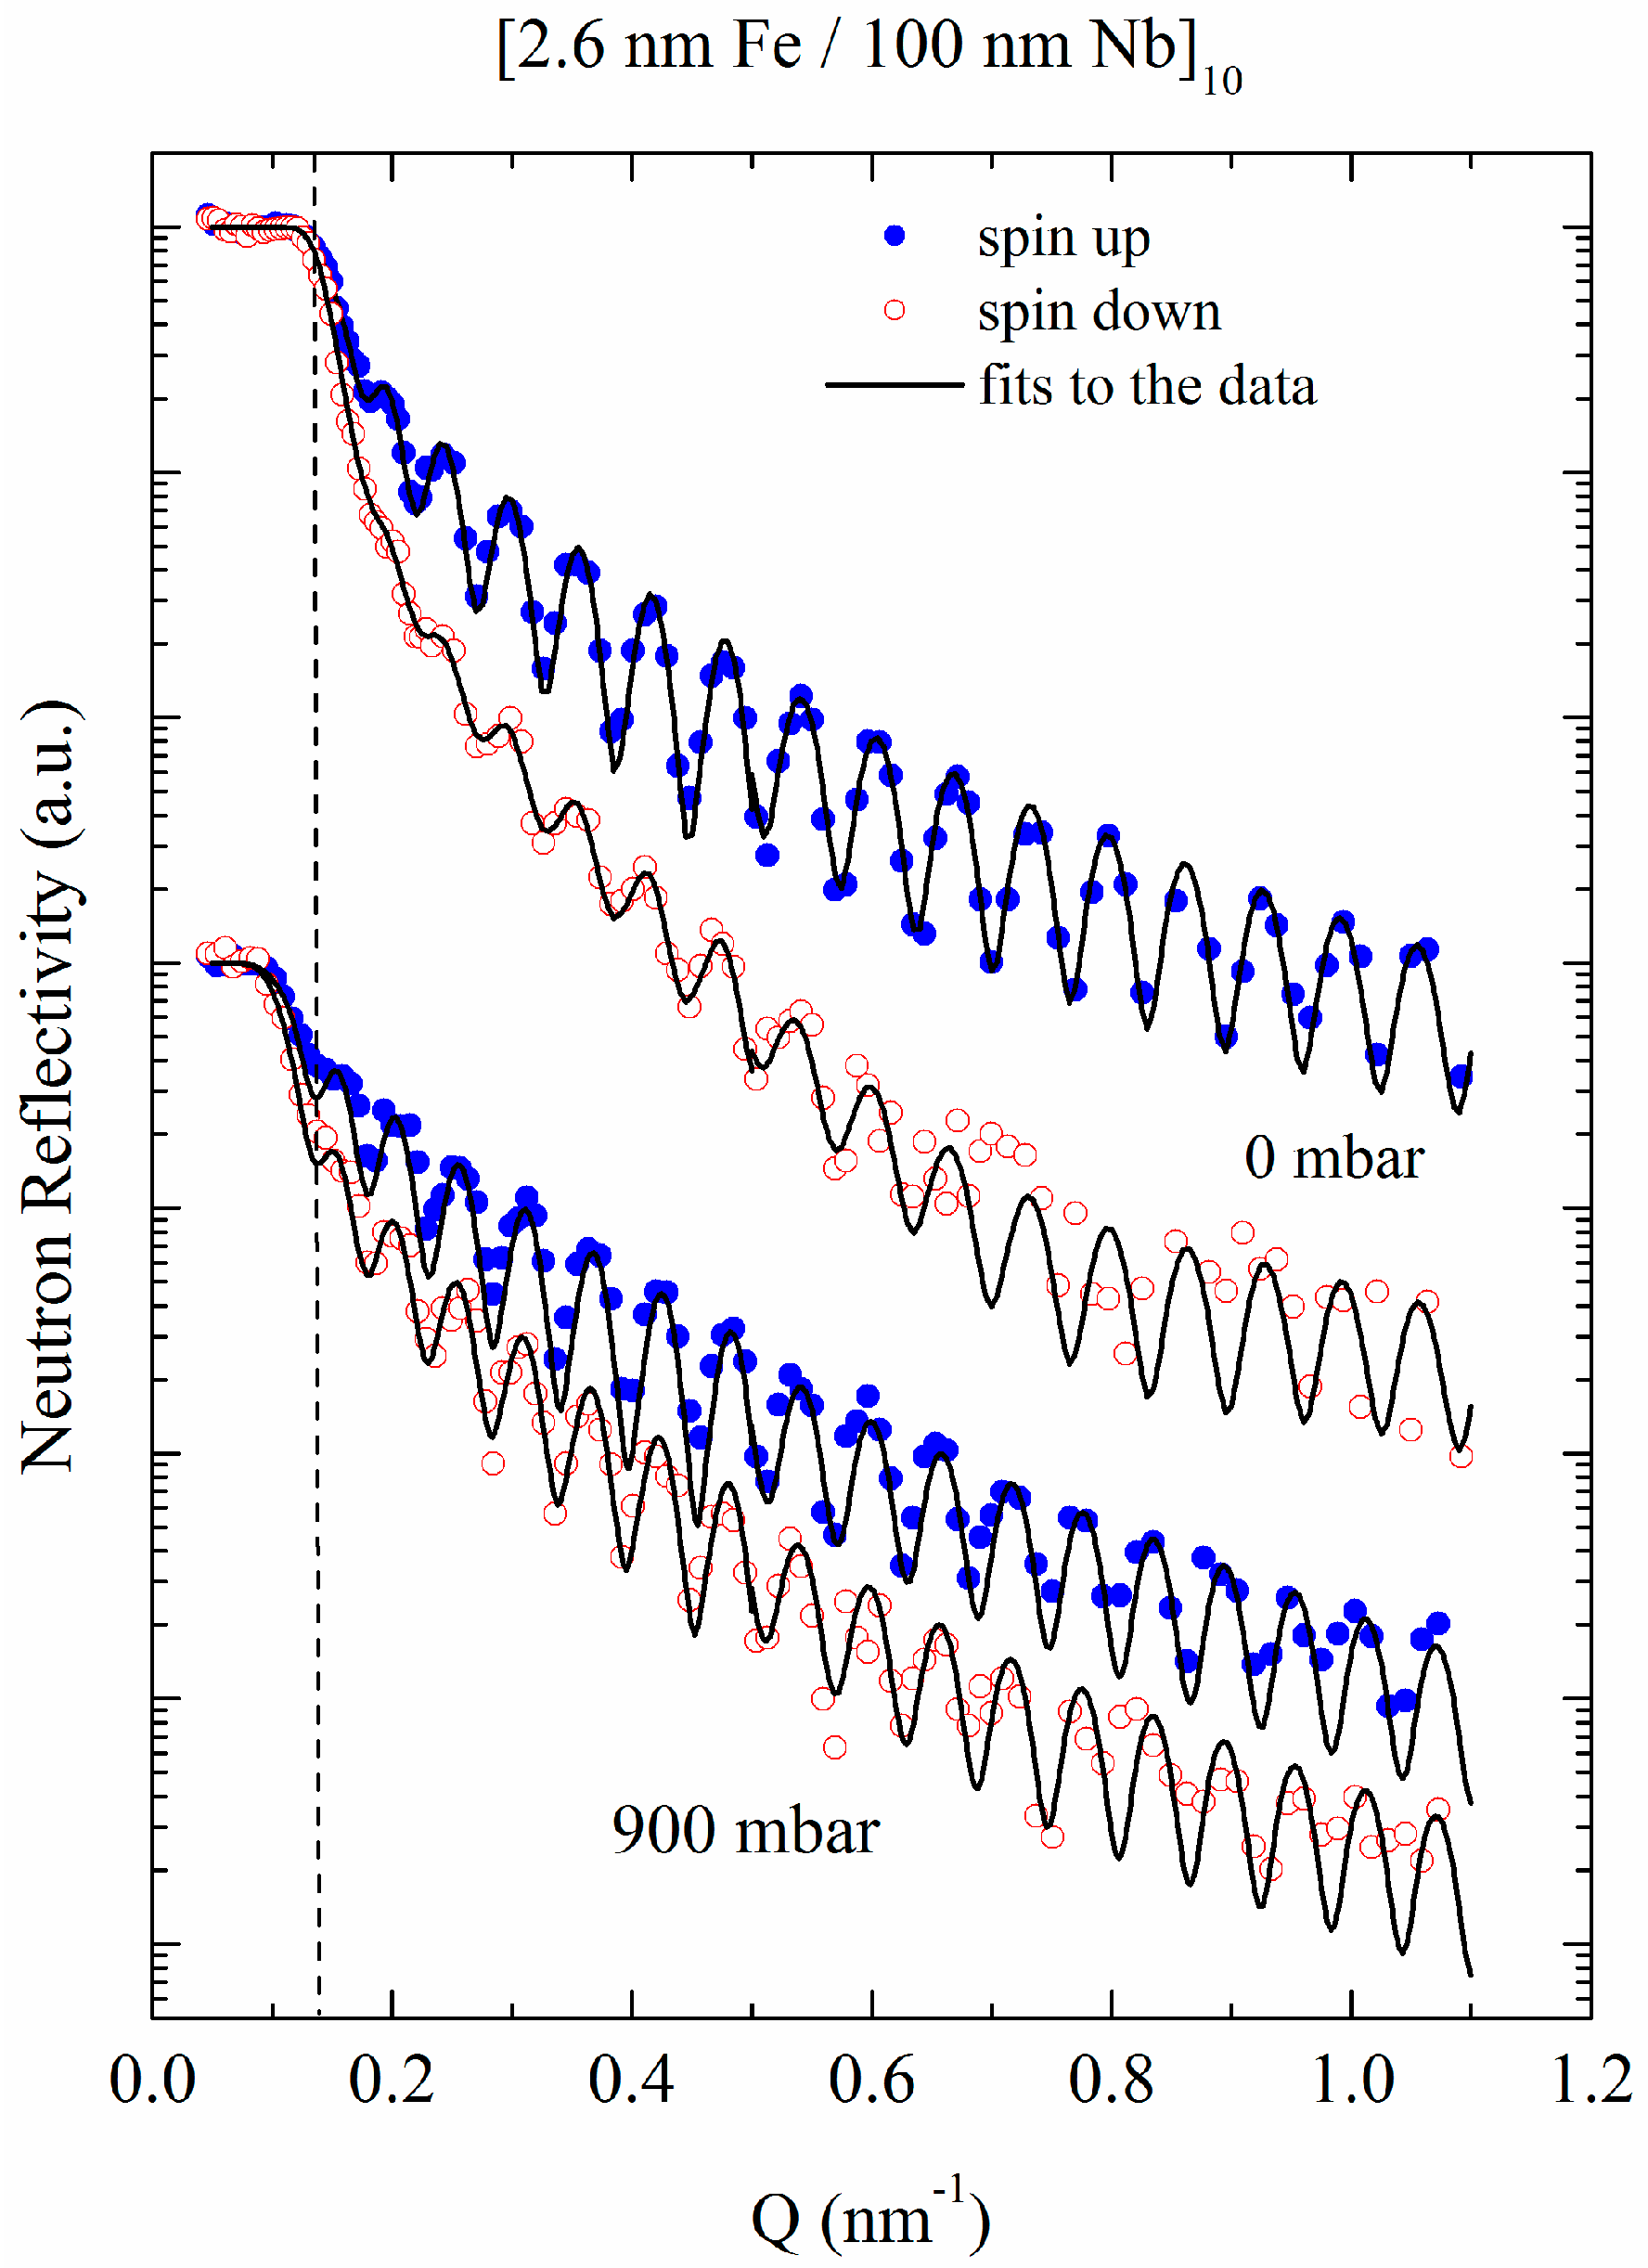
2.2.3. In Situ Ferromagnetic Resonance (FMR) Measurements and Polarized Neutron Reflectometry (PNR)

Ferromagnetic Resonance (FMR) is the effect of spin precession of the macroscopic magnetization vector in an external magnetic field and is driven experimentally by microwave power [52]. The FMR signal for a magnetic sample is observed as a sharp increase in the absorption of microwave power by the sample in a magnetic resonance condition. FMR has been applied to Pd/Co bilayers and multilayers in order to study how magnetic properties associated with perpendicular magnetic anisotropy (PMA) change with the hydrogen concentration in the Pd layer in order to investigate the feasibility of this system to act as a metallic spintronic hydrogen sensor [15]. In Ref. [15], it was reported that hydrogen absorption resulted in narrowing and shifting of the FMR absorption peak for the Co layer, indicating a coupling between these two properties.
In situ FMR and PNR measurements were carried out as a function of external hydrogen gas pressure at the PLATYPUS beamline [53,54,55] at the OPAL reactor at ANSTO, Lucas Heights, Australia. Figure 5 schematically shows the custom-made scattering chamber with FMR capability. The samples were placed face-up across the microwave coplanar transmission line, and aluminum windows mounted at the front and the rear of the chamber allowed the neutron beam to enter and exit. The gas atmosphere within the chamber was controlled by a mass flow controller system capable of delivering pure N2 gas or N2/H2 gas mixtures of ≤3.5% hydrogen gas at slightly above normal atmospheric pressure and at an ambient temperature of 23 °C. The external magnetic field was generated using a 1 T electromagnet.

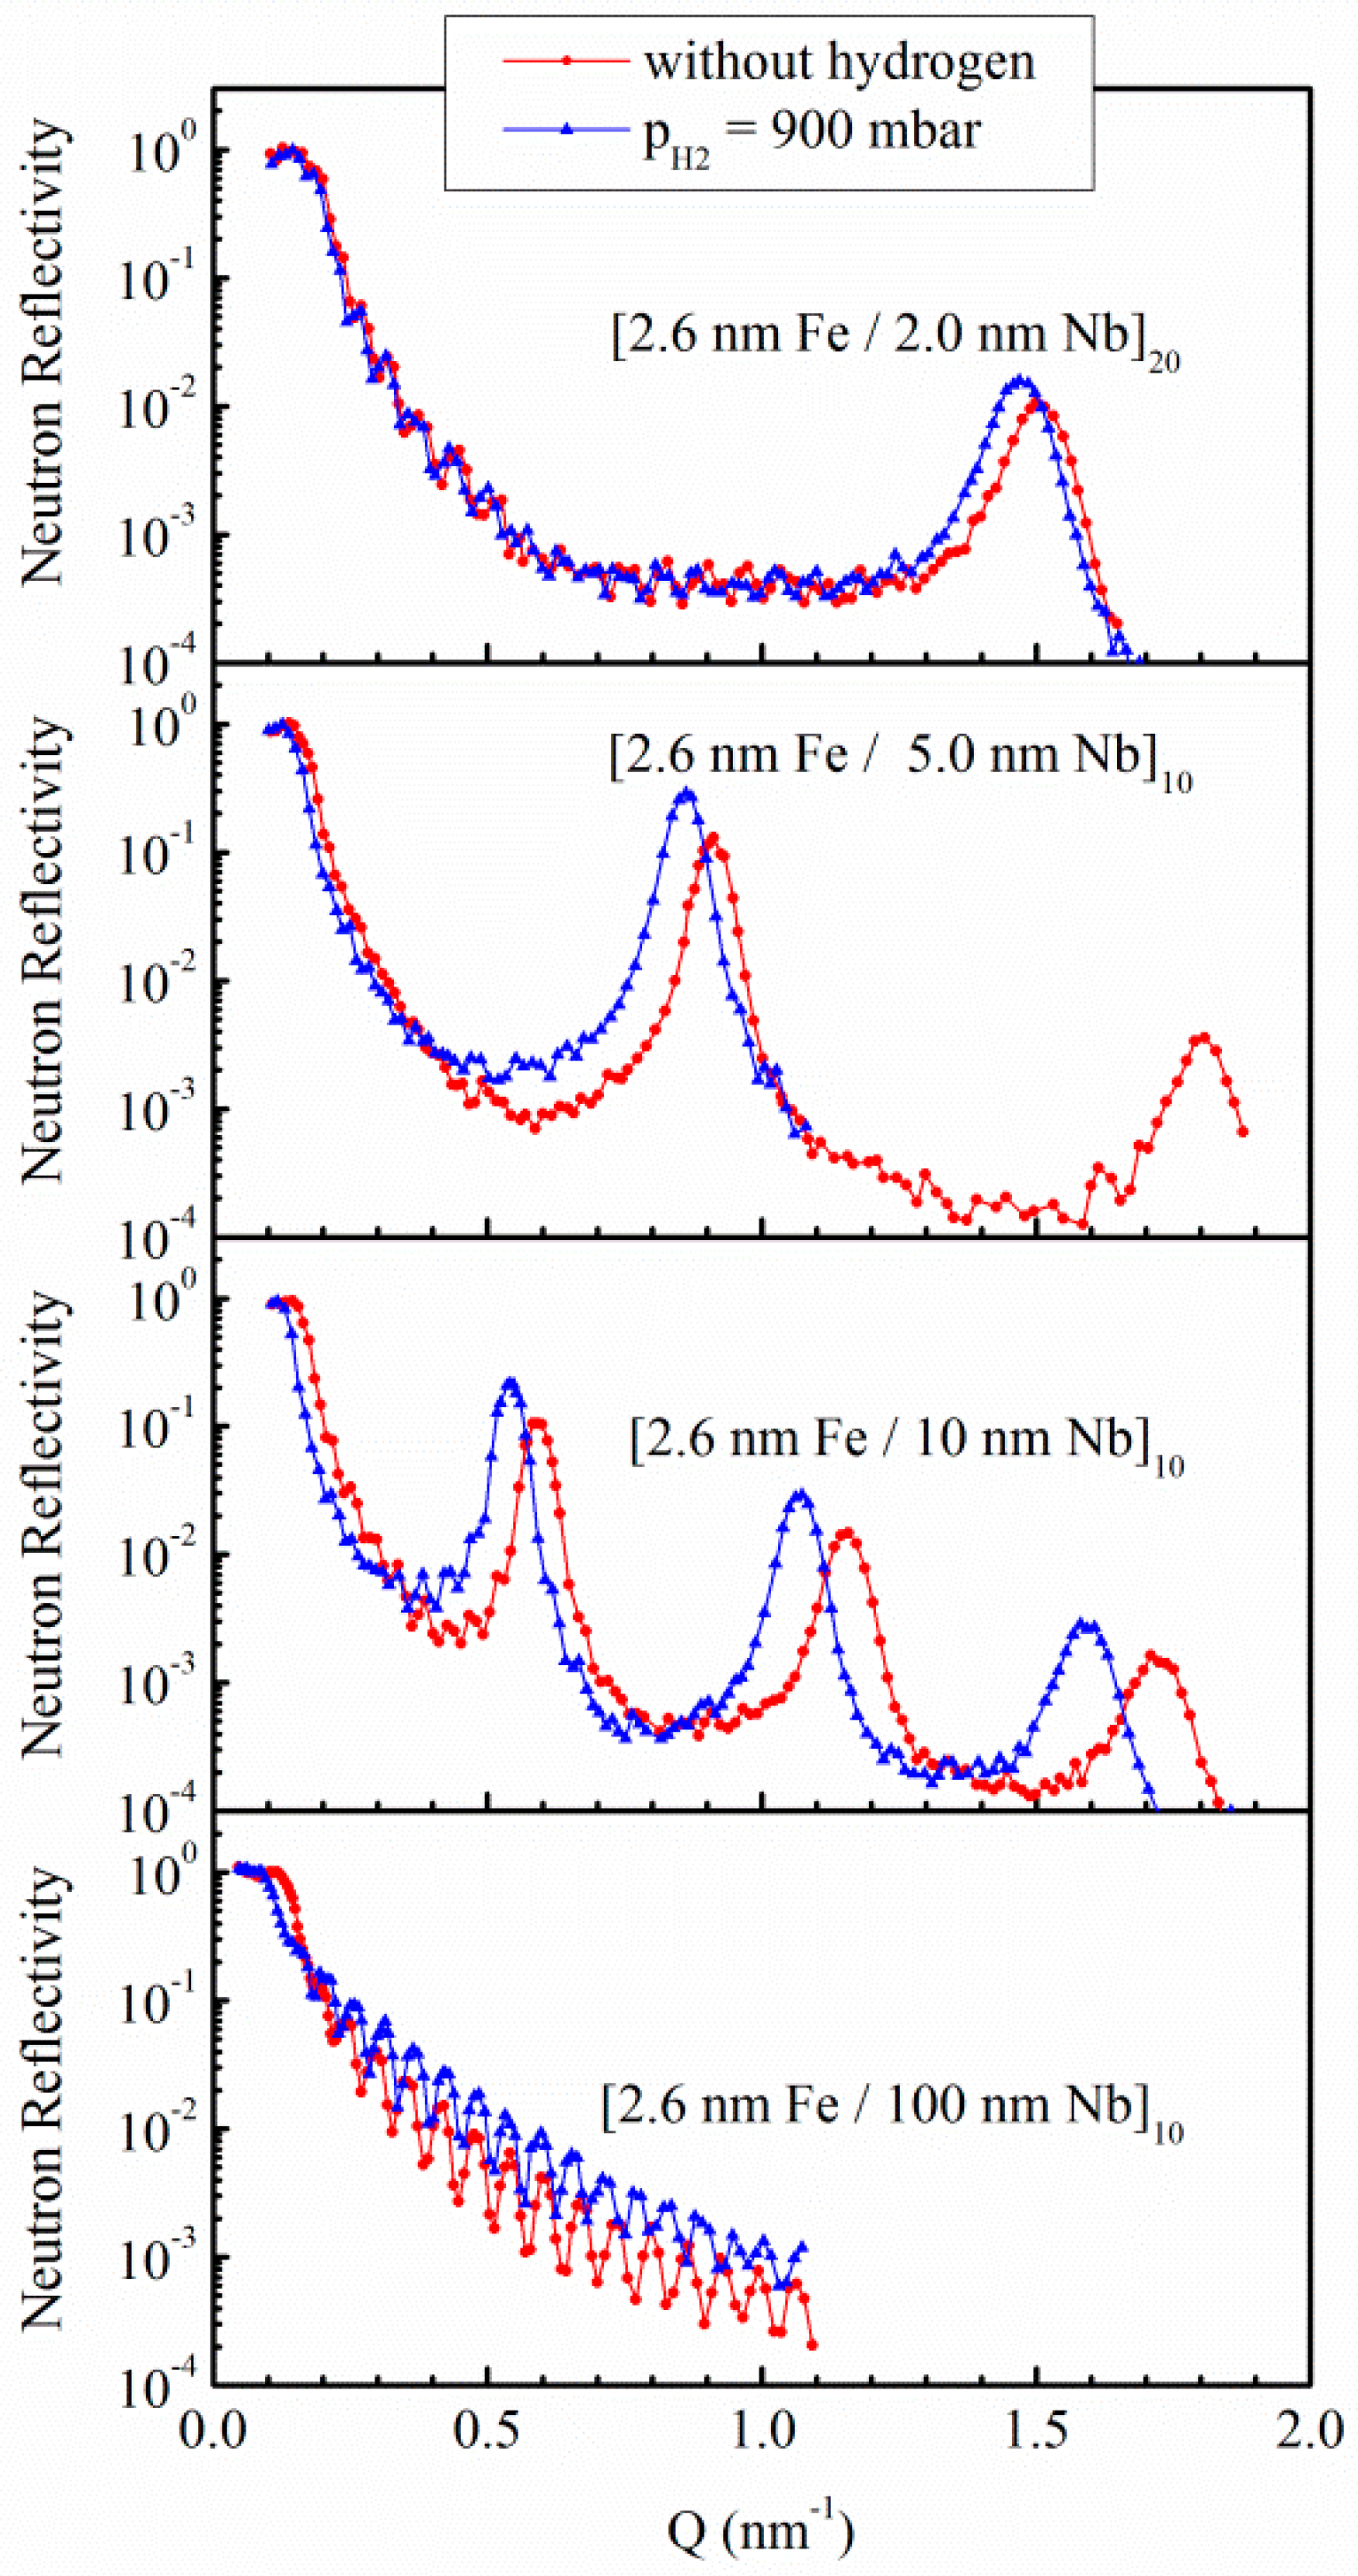
3. Results and Discussion

3.1. Nb Thin Films and Multilayers

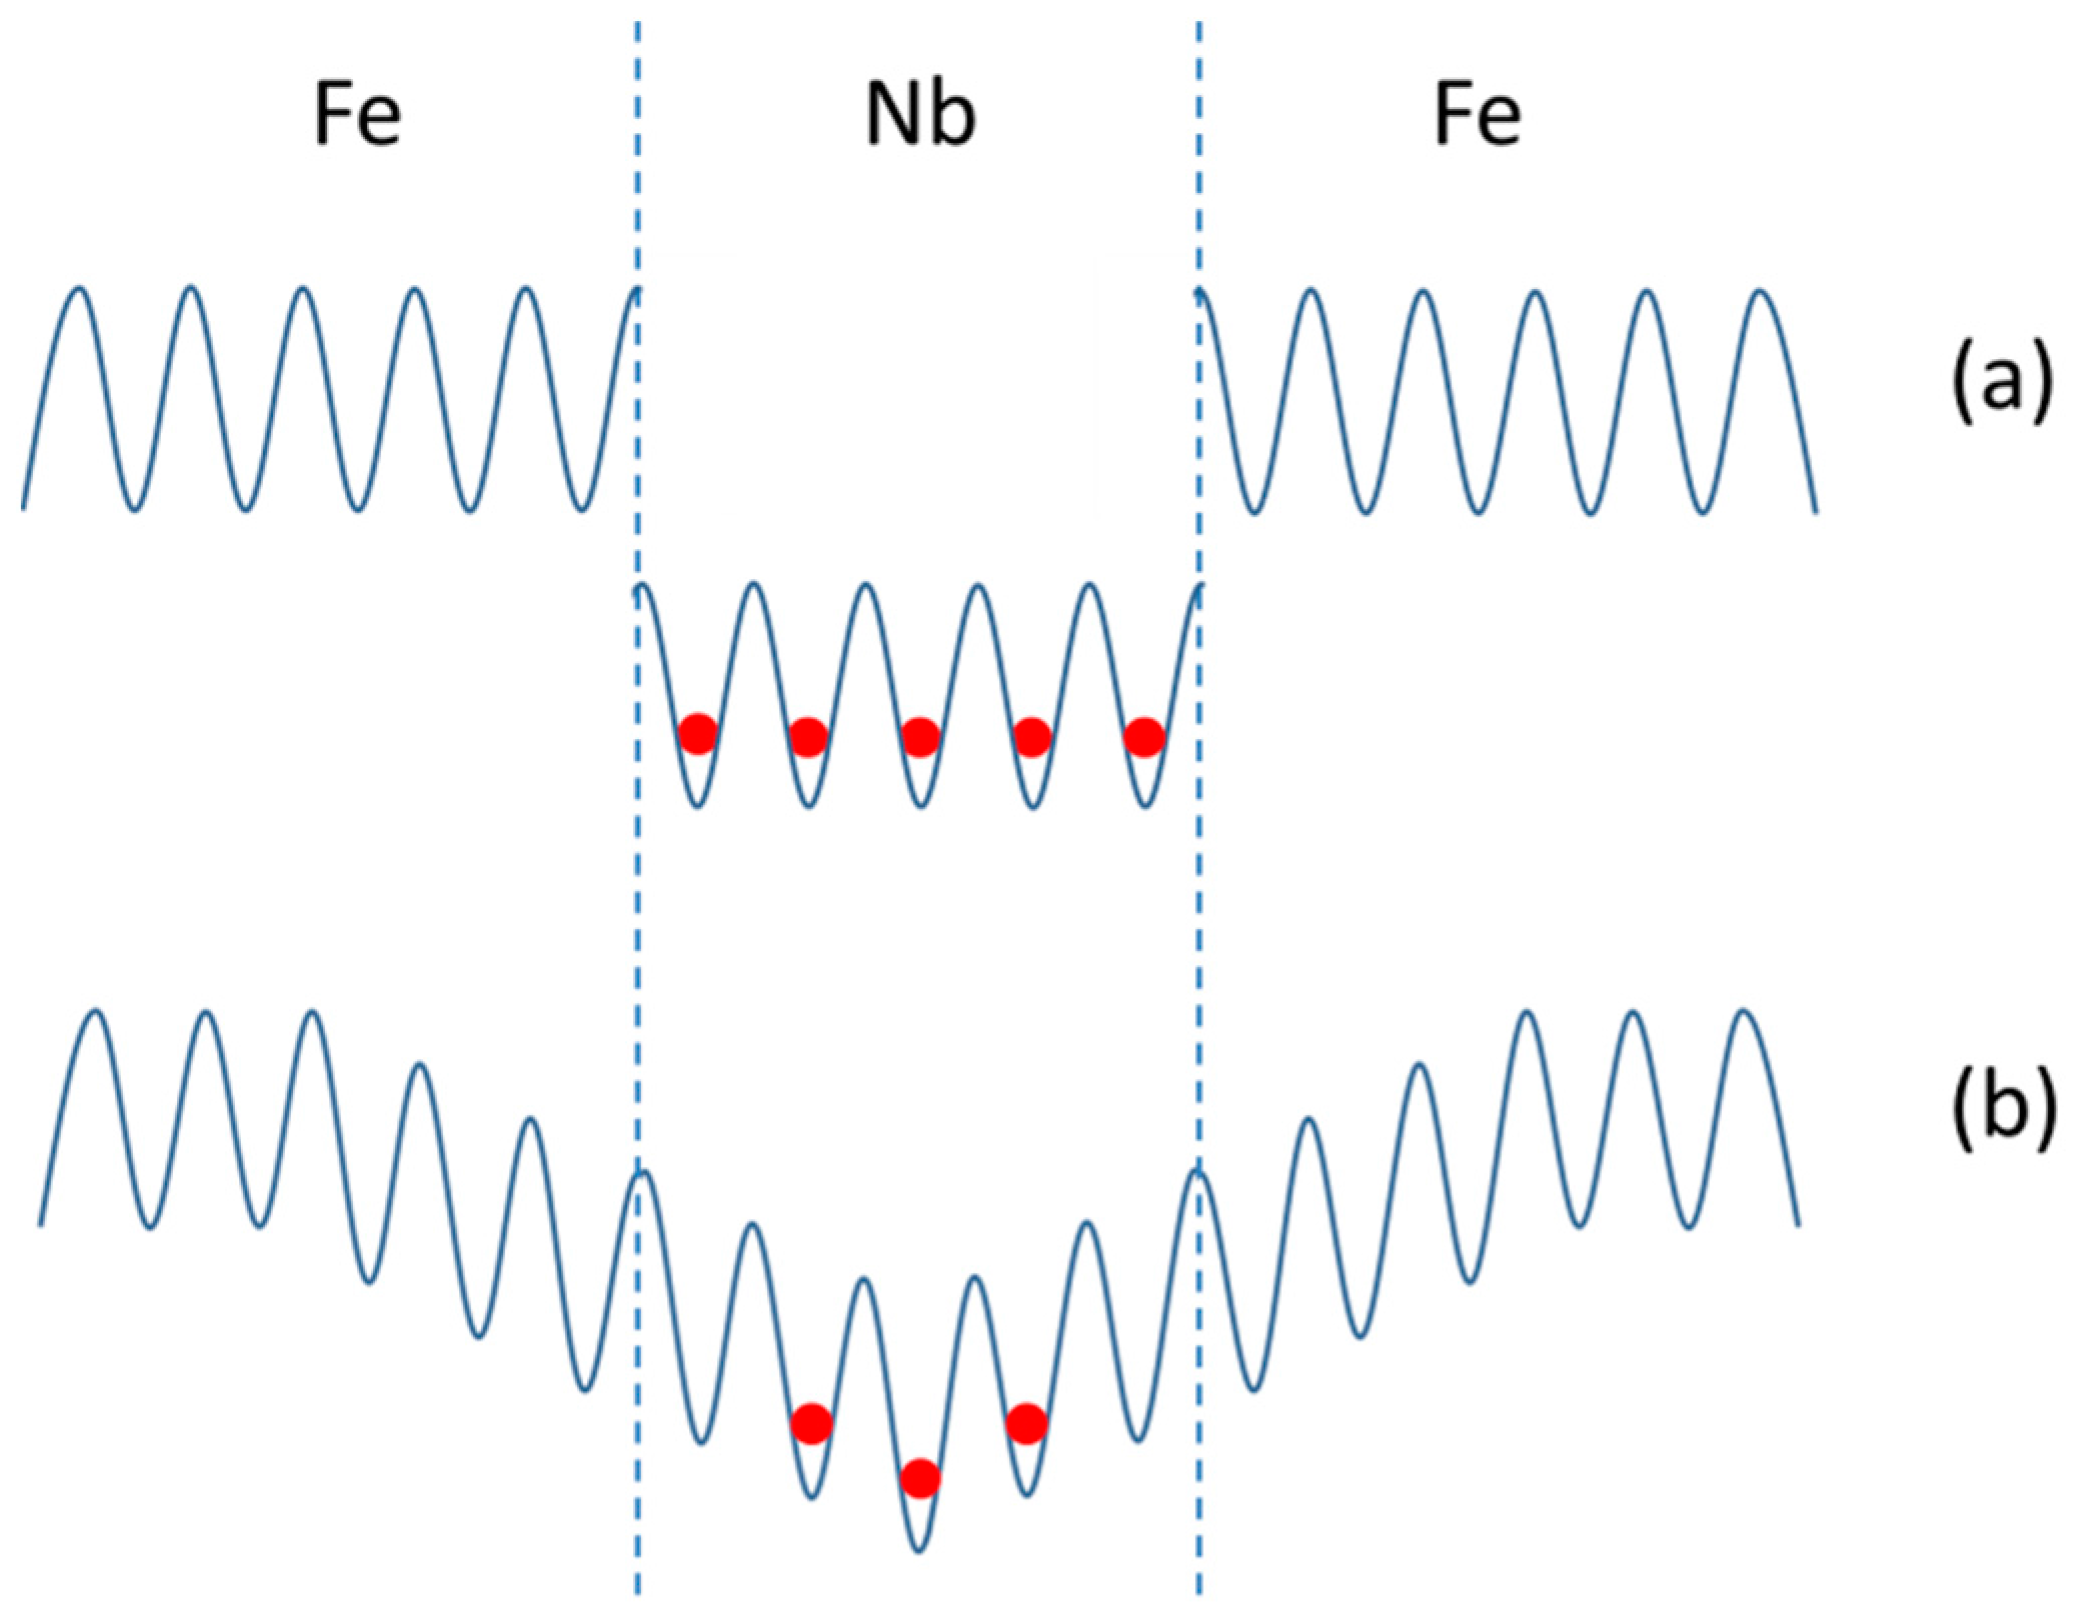
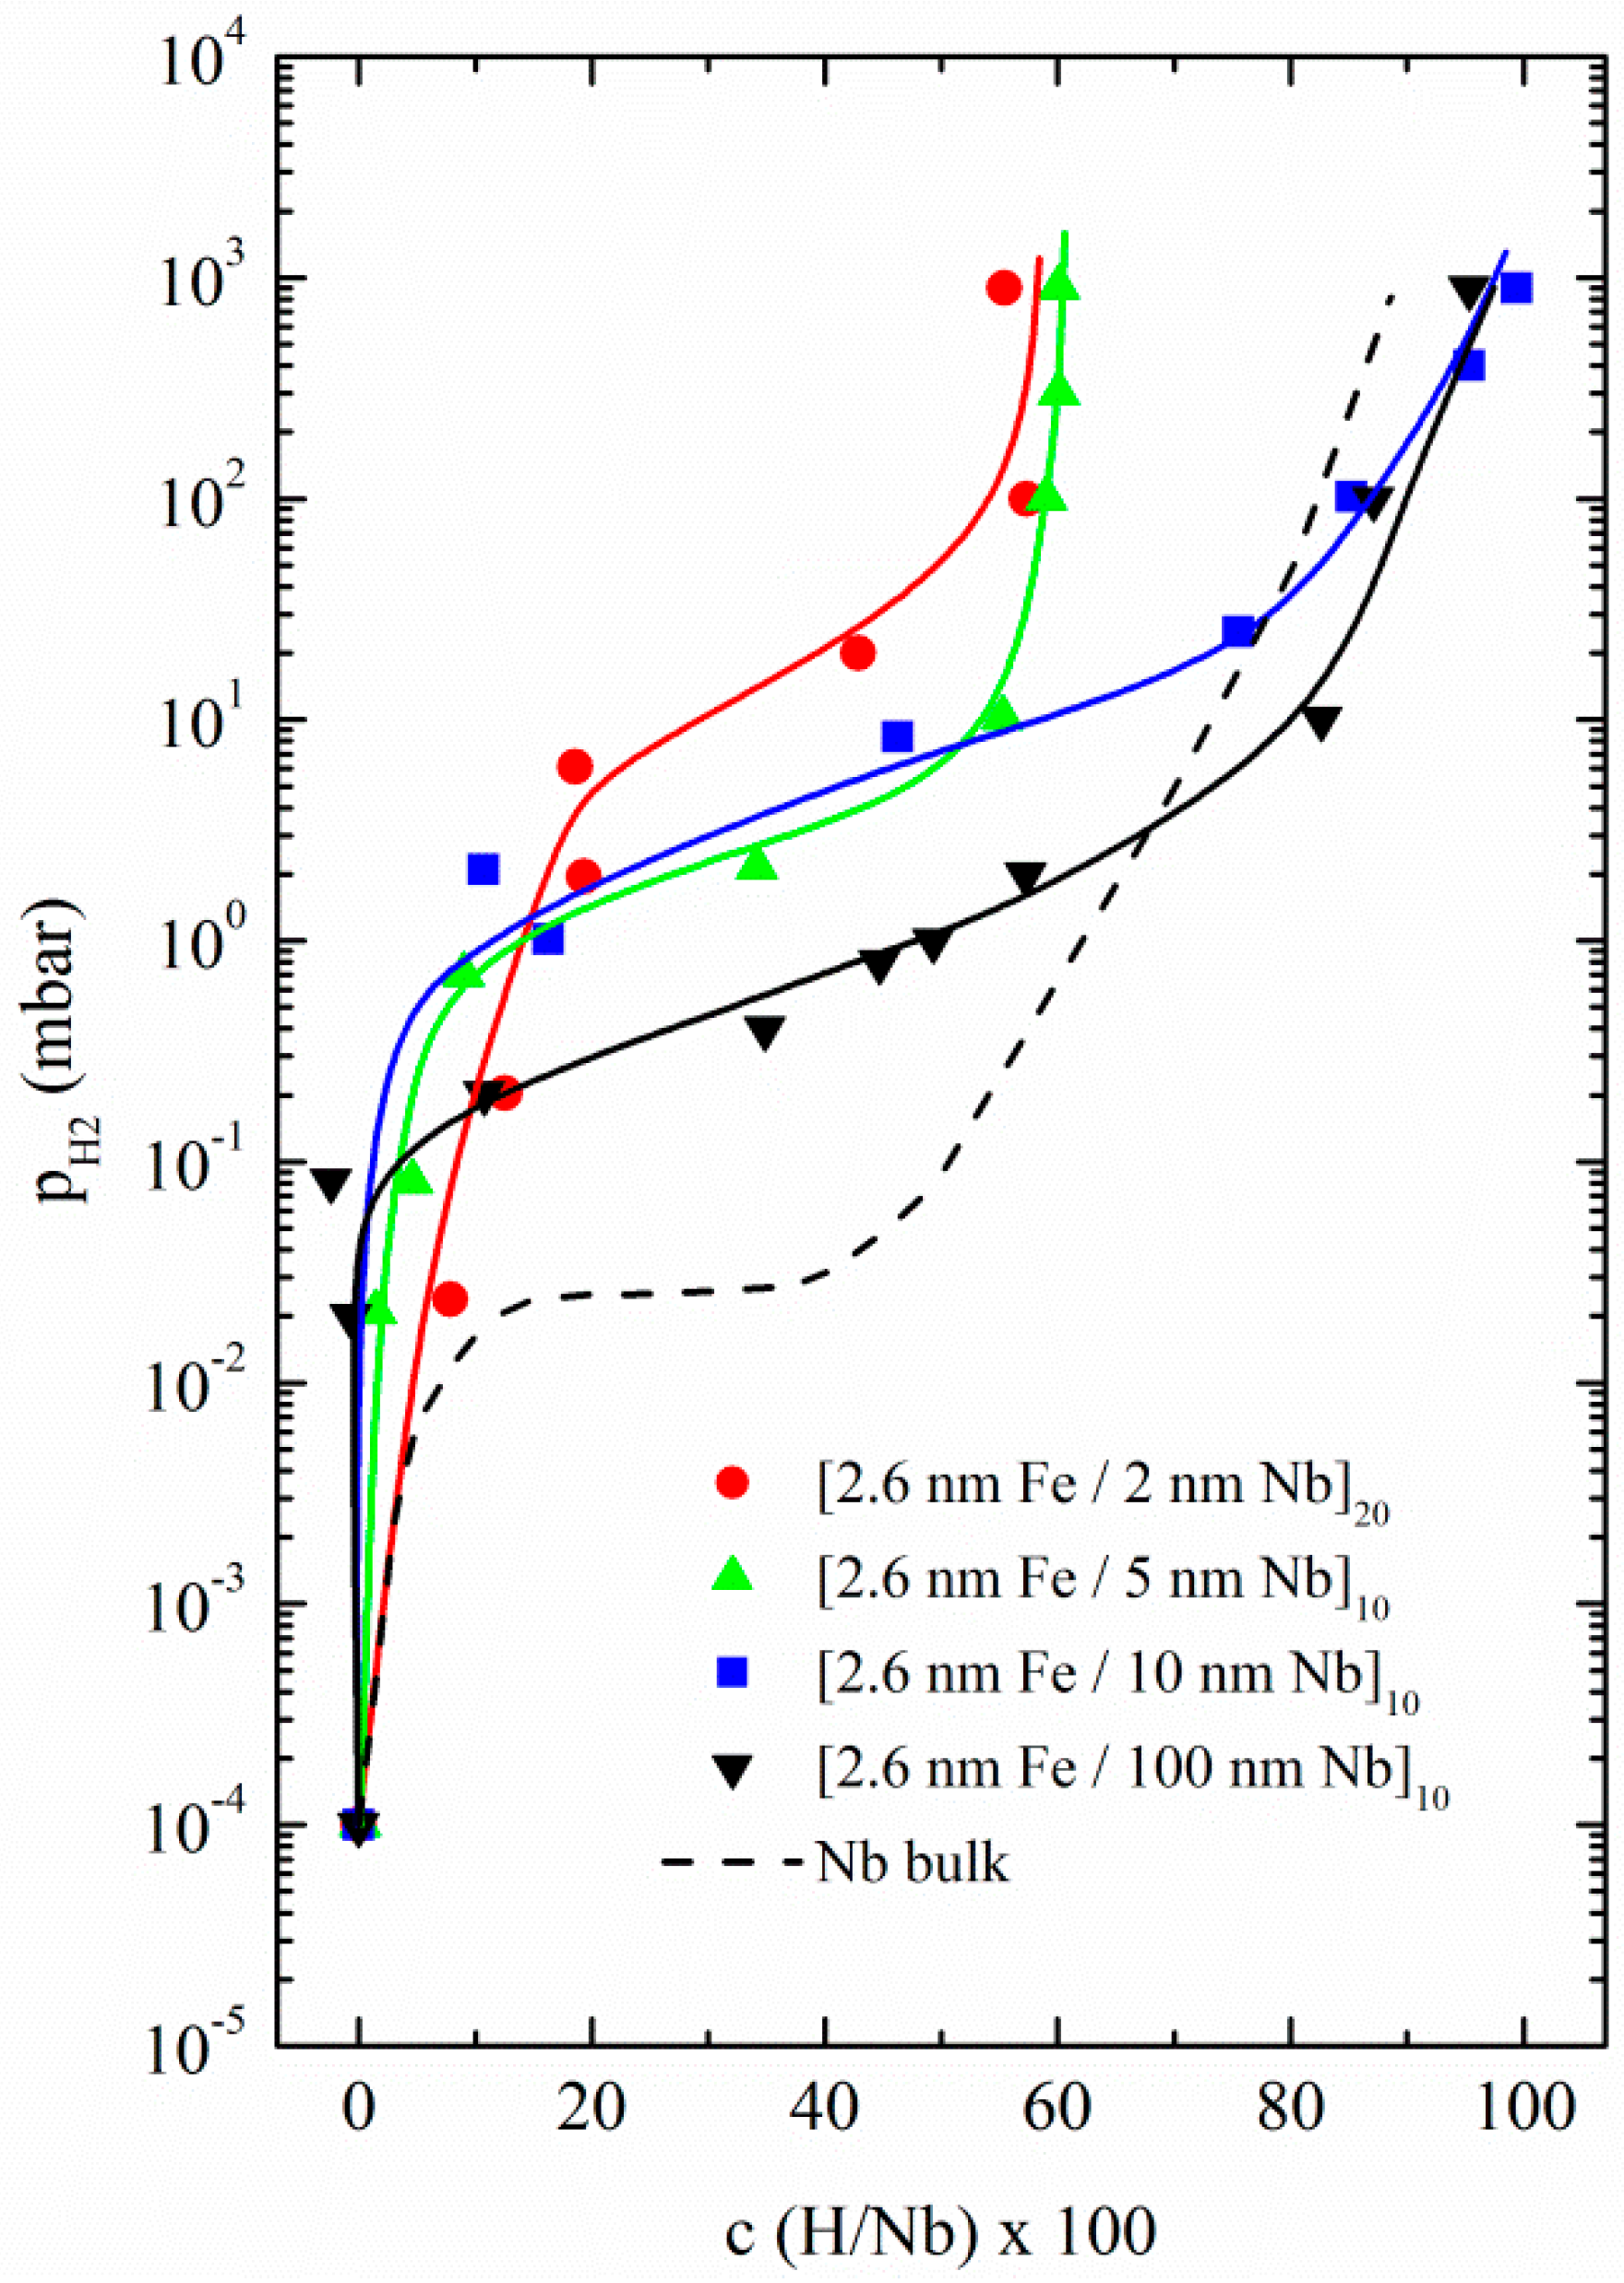
3.1.1. Fe/Nb Multilayers

In order to study the correlation between hydrogen absorption and resulting changes of the structural properties of Nb films, Fe/Nb heterostructures were measured with neutron reflectometry (NR) and X-ray diffraction/reflectometry [41,42,43]. The multilayer geometry is advantageous as the scattering signals are strongly amplified. Using Fe as a partnering element is an apt choice, as it does not absorb hydrogen but is sufficiently transparent for hydrogen diffusion, which was experimentally confirmed. Multilayer samples were charged in situ with hydrogen at various pressures from 10−4 to 900 mbar. Measurements were made at a sample temperature of 185 °C to allow for relatively fast hydrogen absorption and to avoid phase separation that can occur at lower temperatures. For the Fe/Nb system (and for W/Nb discussed below), we present experimental data collected in the first cycle of hydrogen absorption.
Sample NR curves for polycrystalline samples are shown in Figure 6, comparing the systems in the virgin state and at the largest hydrogen pressure. The strong peaks in the top three sections are Bragg peaks resulting from the superlattice geometry. There is a noticeable shift in the peak position to a lower Q value with increased hydrogen content, indicating an expansion of the Nb layers within the heterostructures. In addition, we observe a significant increase in the Bragg peak intensity with increasing hydrogen absorption due to the increase in scattering contrast between Fe and Nb + H layers.
PNR was also performed due to the ferromagnetism of the Fe layers. While the Fe magnetism was found to be almost entirely unaffected by the Nb hydrogen concentration, the ability to measure two data channels for each pressure allowed for more certainty in the determination of the SLD of each material.
The data were fitted to ascertain the SLDs and thicknesses of the Nb and Fe layers. From the SLDs, the hydrogen concentrations can be calculated from [41]:
c H = ( SLD Nb+H SLD Nb × d Nb+H d Nb 1 ) b Nb b H
where the subscripts represent Nb before and after the introduction of hydrogen, d is the thickness of the Nb layer, and cH is the number of hydrogen atoms per Nb metal atom. Data sets could be fitted well assuming a homogenous distribution of hydrogen throughout the Nb thickness. A sample of the fitted PNR data is shown in Figure 7. The resulting SLDs and layer thicknesses are shown in Table 2.
The most striking differences between the high and low hydrogen pressure data occur in the Nb layer. First, there is a decrease in SLD with hydrogen, from 380 to 170 µm−2, which is accounted for by the negative hydrogen scattering length. There is also an increase in the Nb thickness by nearly 10 nm or 10%. This data can be used with Equation (4) to calculate the hydrogen concentration, and the example data indicated a hydrogen concentration of 95% (H/Nb) at 900 mbar external hydrogen pressure, i.e., nearly one hydrogen atom for each Nb atom. This analysis was performed for several samples over a range of hydrogen pressures, leading to the development of a Nb/hydrogen concentration/pressure phase diagram shown in Figure 8 [56]. Here, it is demonstrated that in thin-film form, the phase diagram is drastically different than in bulk, particularly for samples with Nb thicknesses below 5 nm, where the peak hydrogen concentration reached is much less than the bulk value, and the pressures for obtaining a particular hydrogen concentration are orders of magnitude higher. As the W/Nb system shows similar behavior, we will discuss the causes for thickness dependence of the hydrogen absorption of both systems together in the Section 3.1.2.

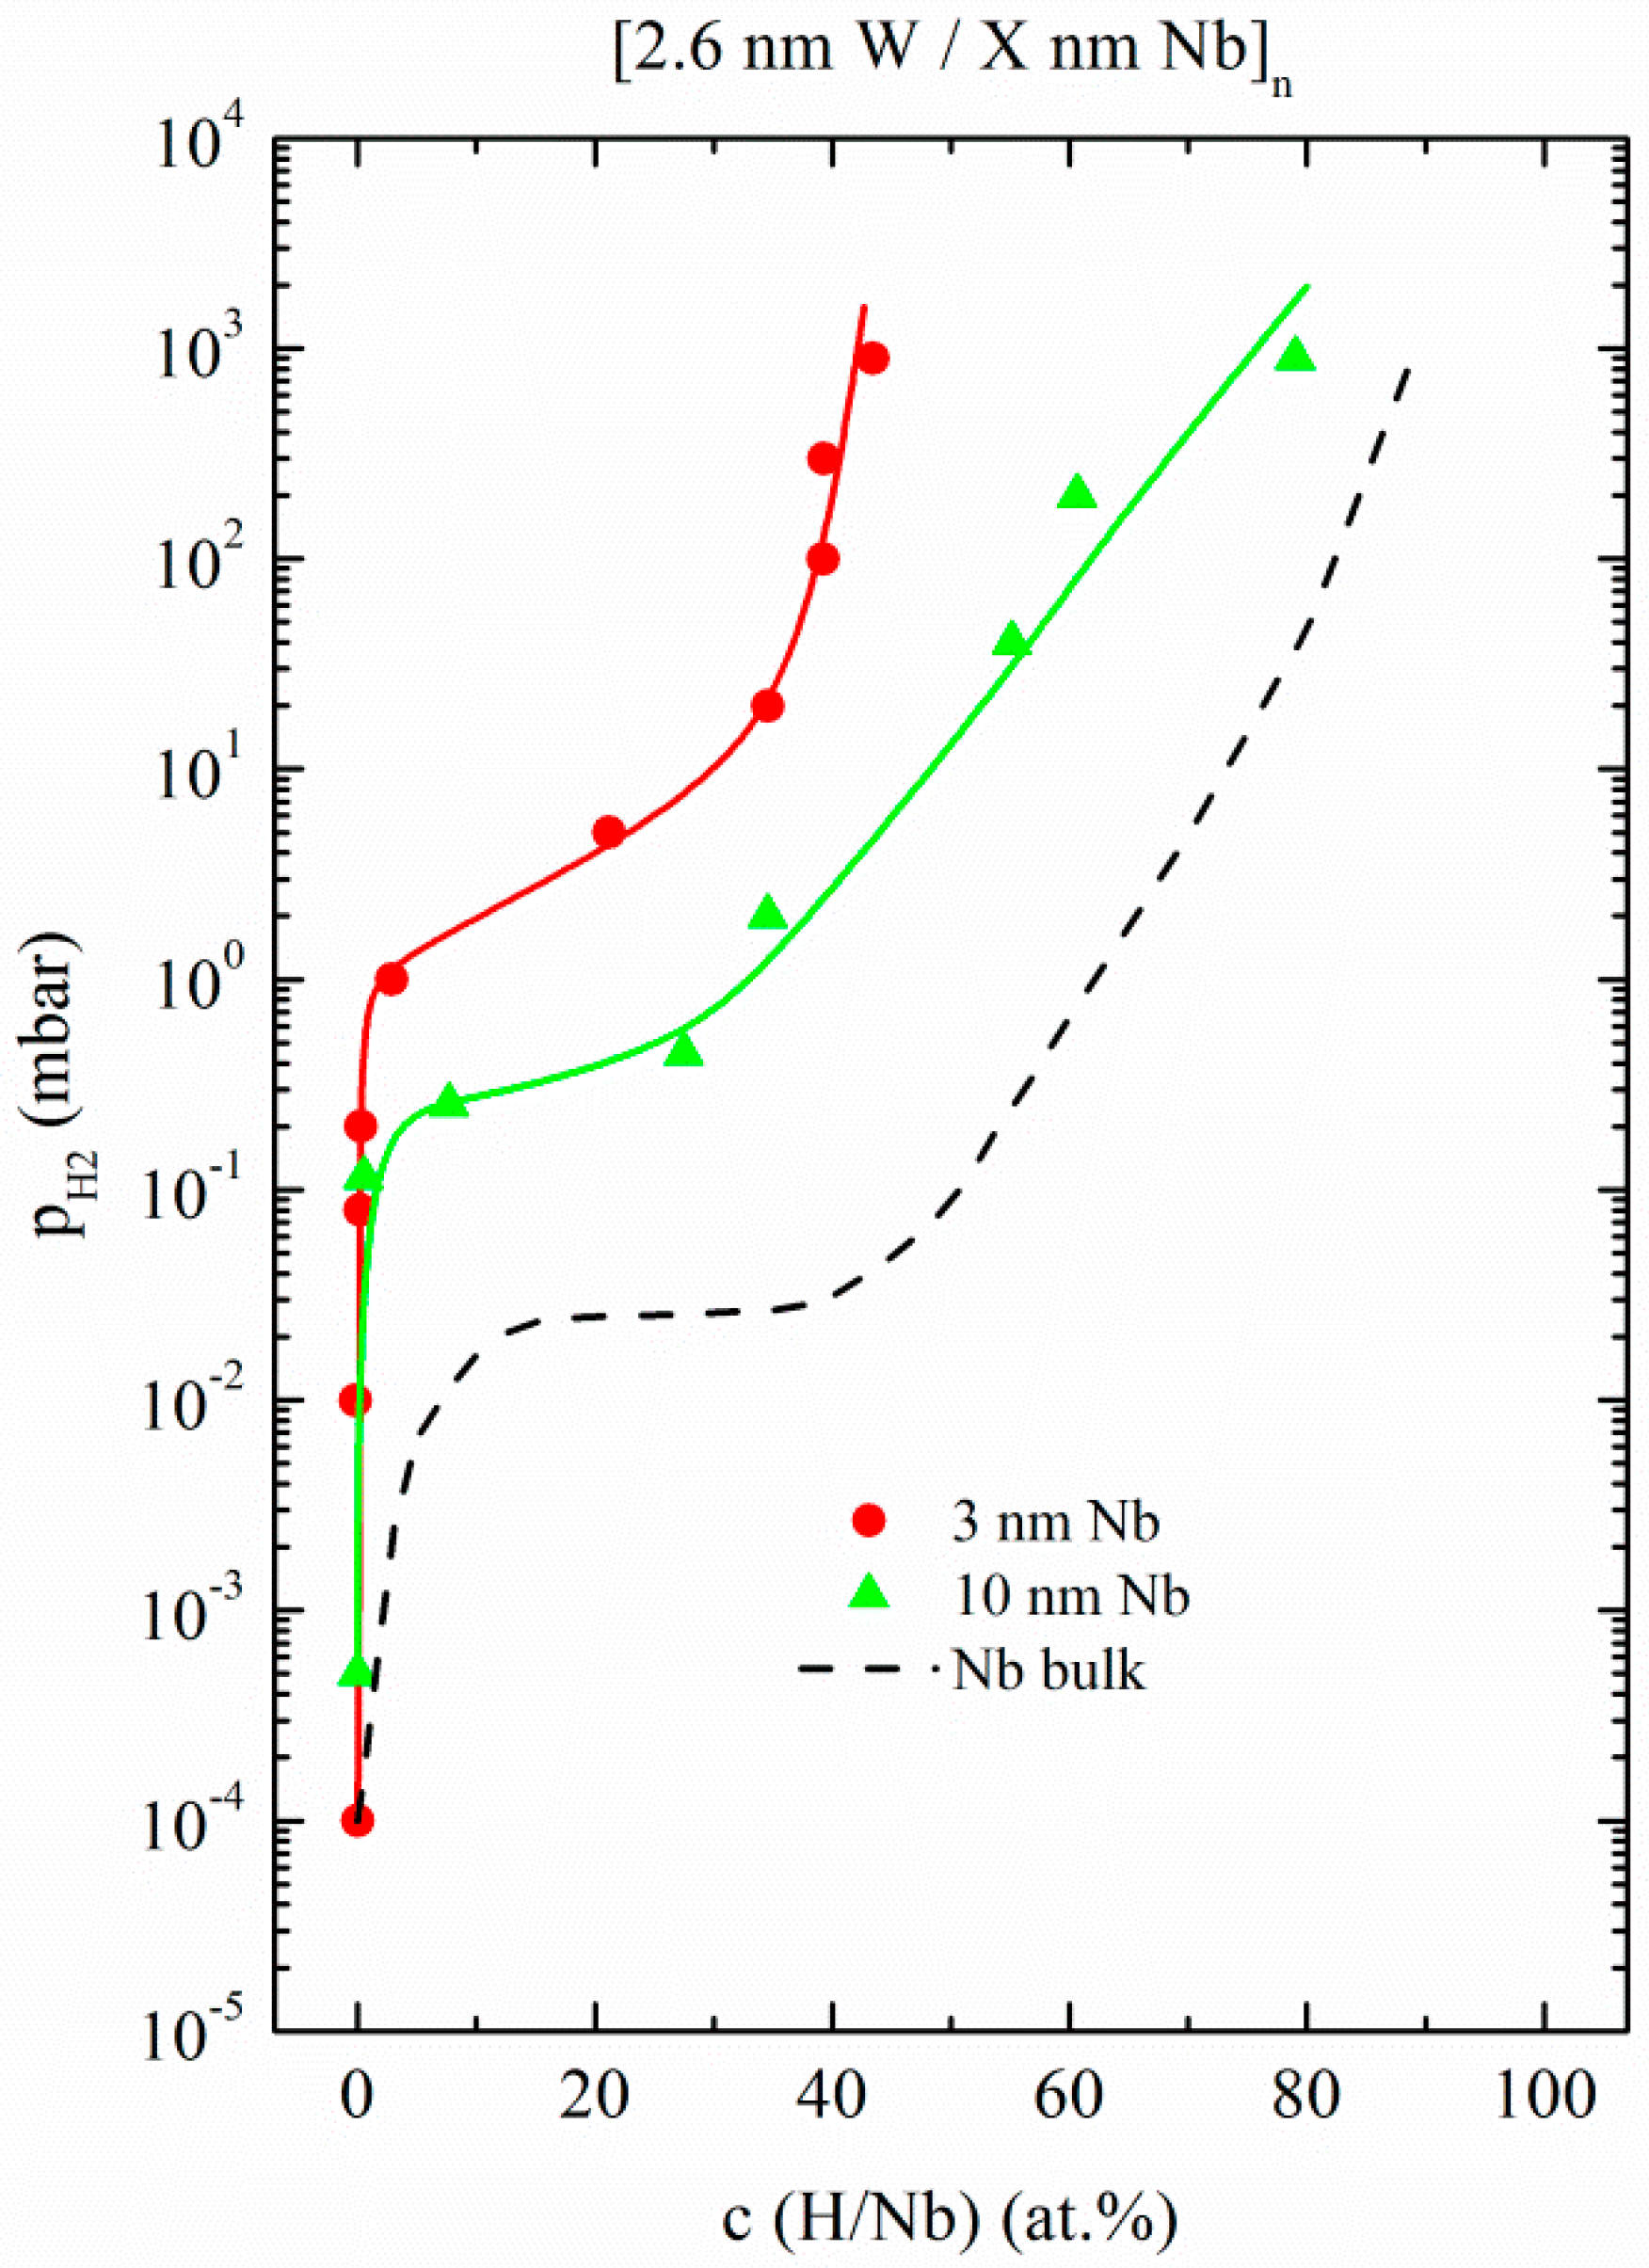
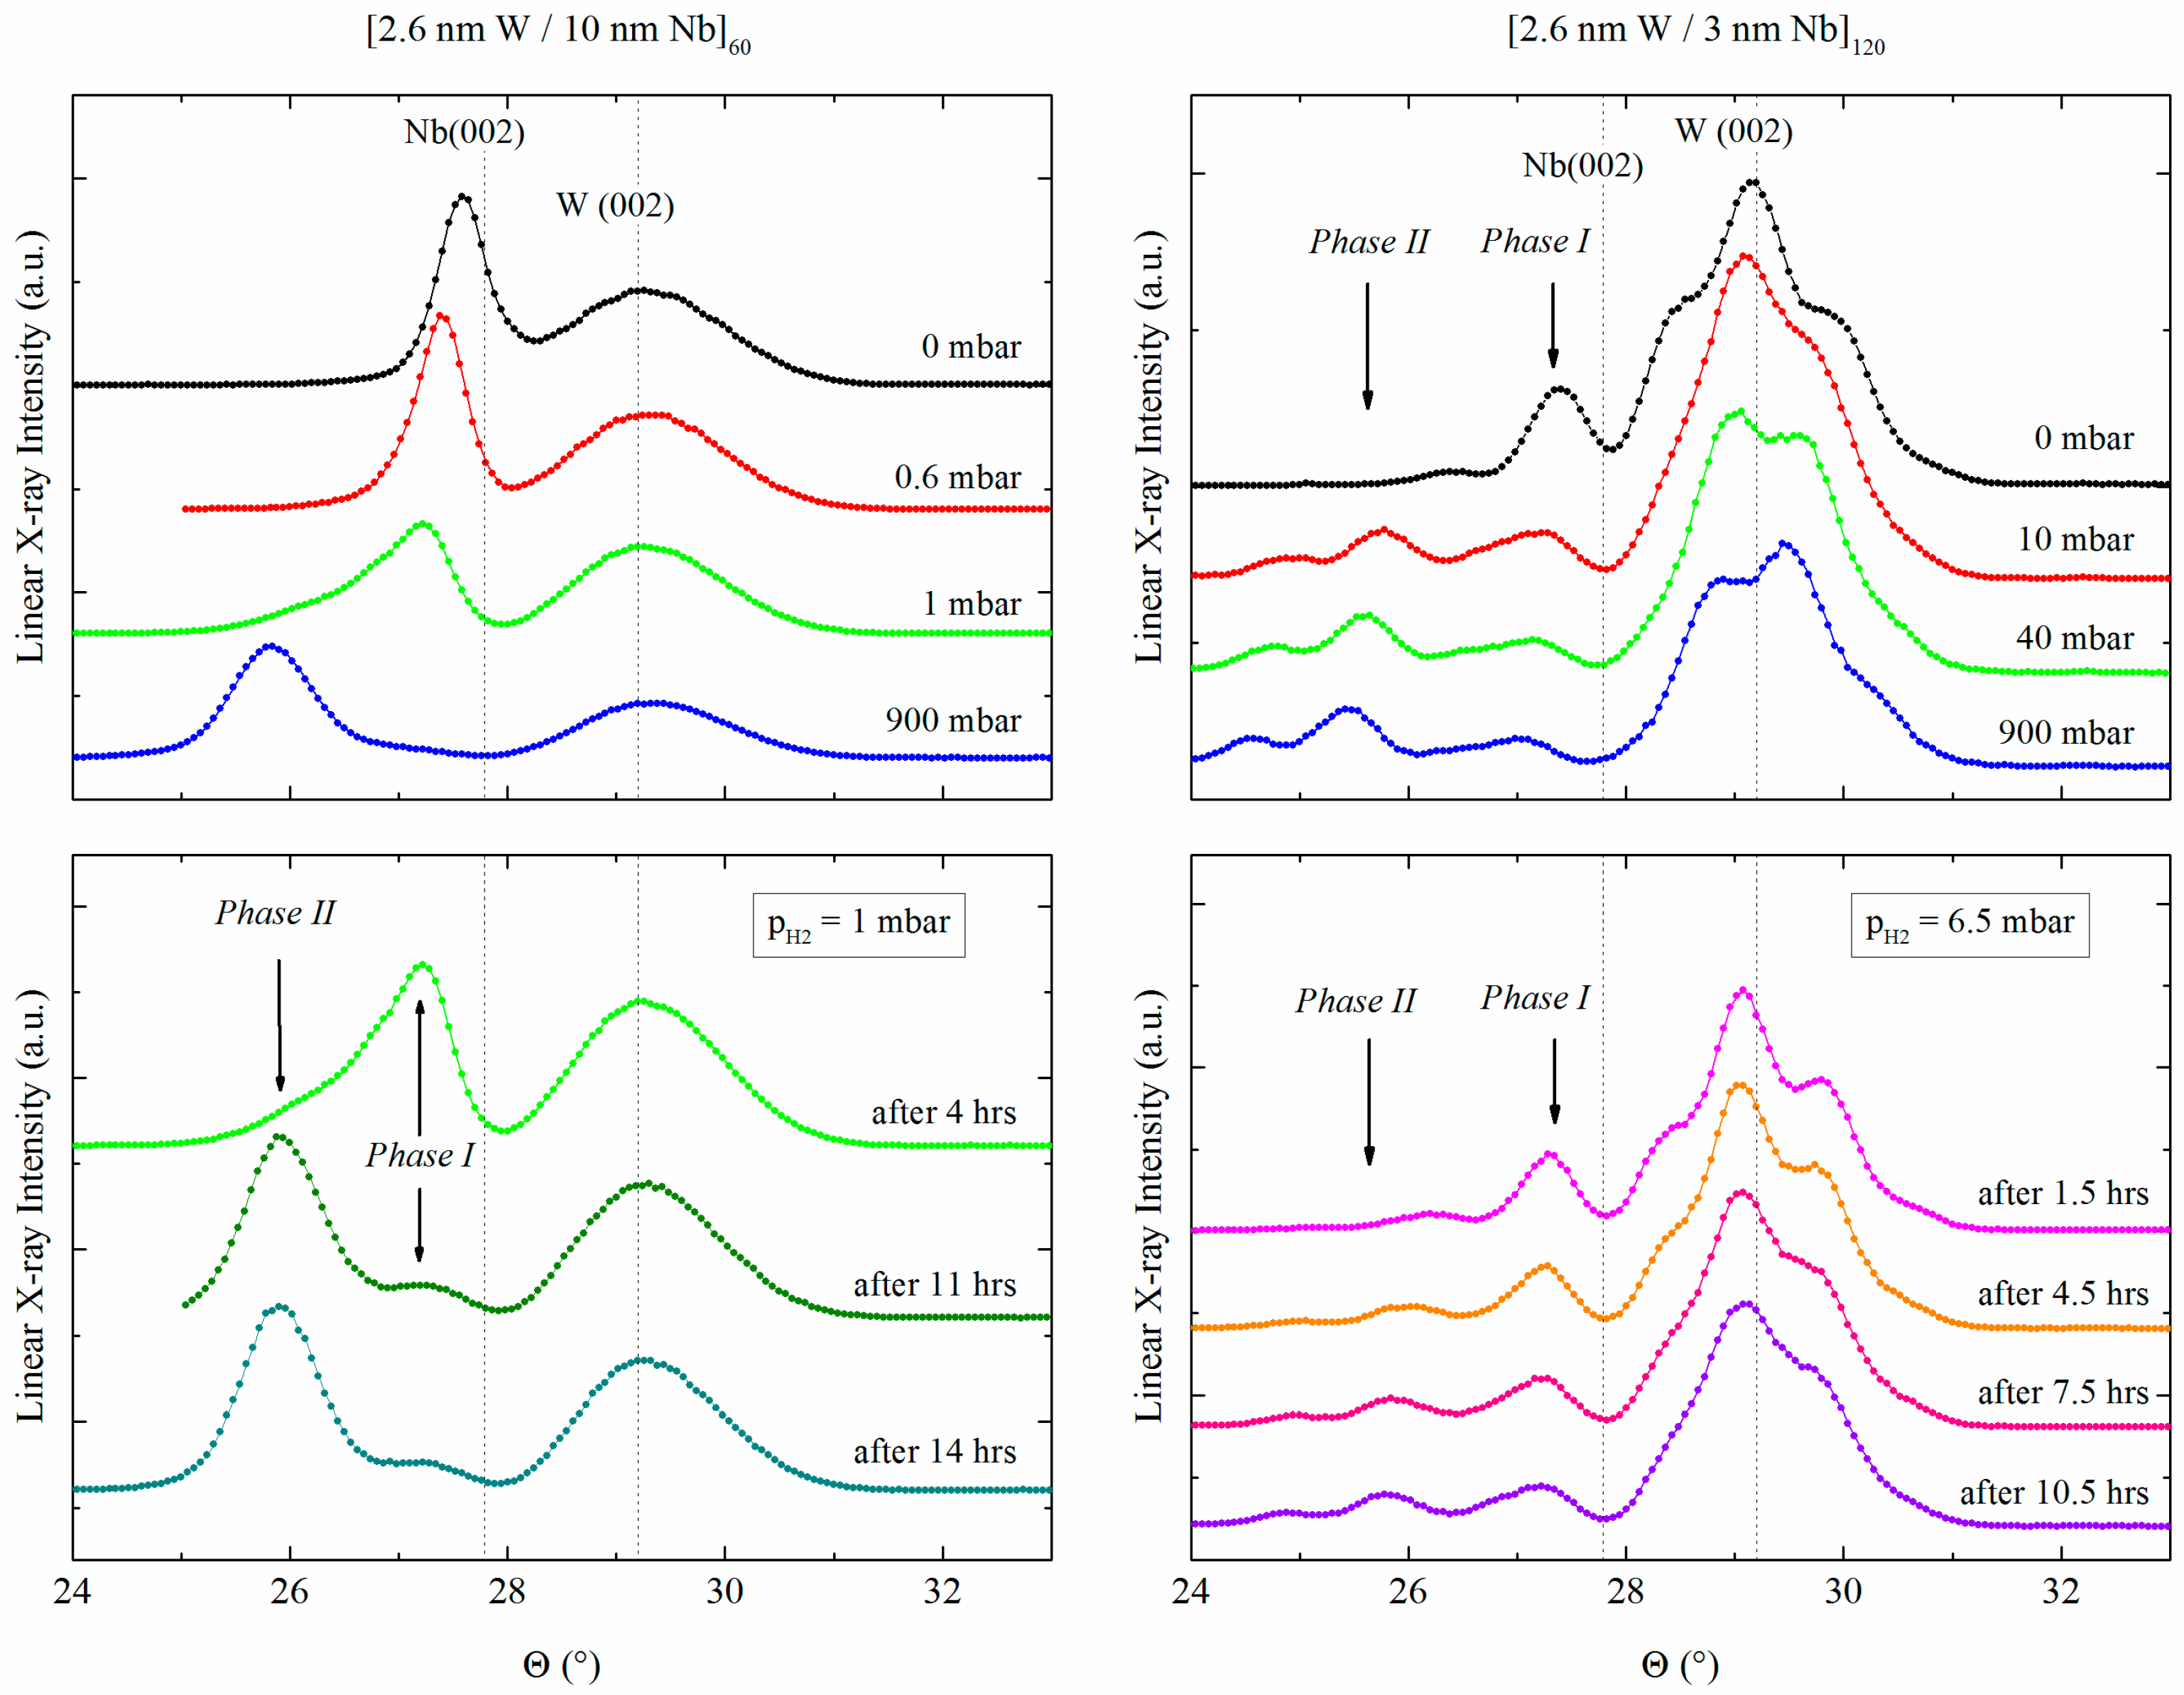
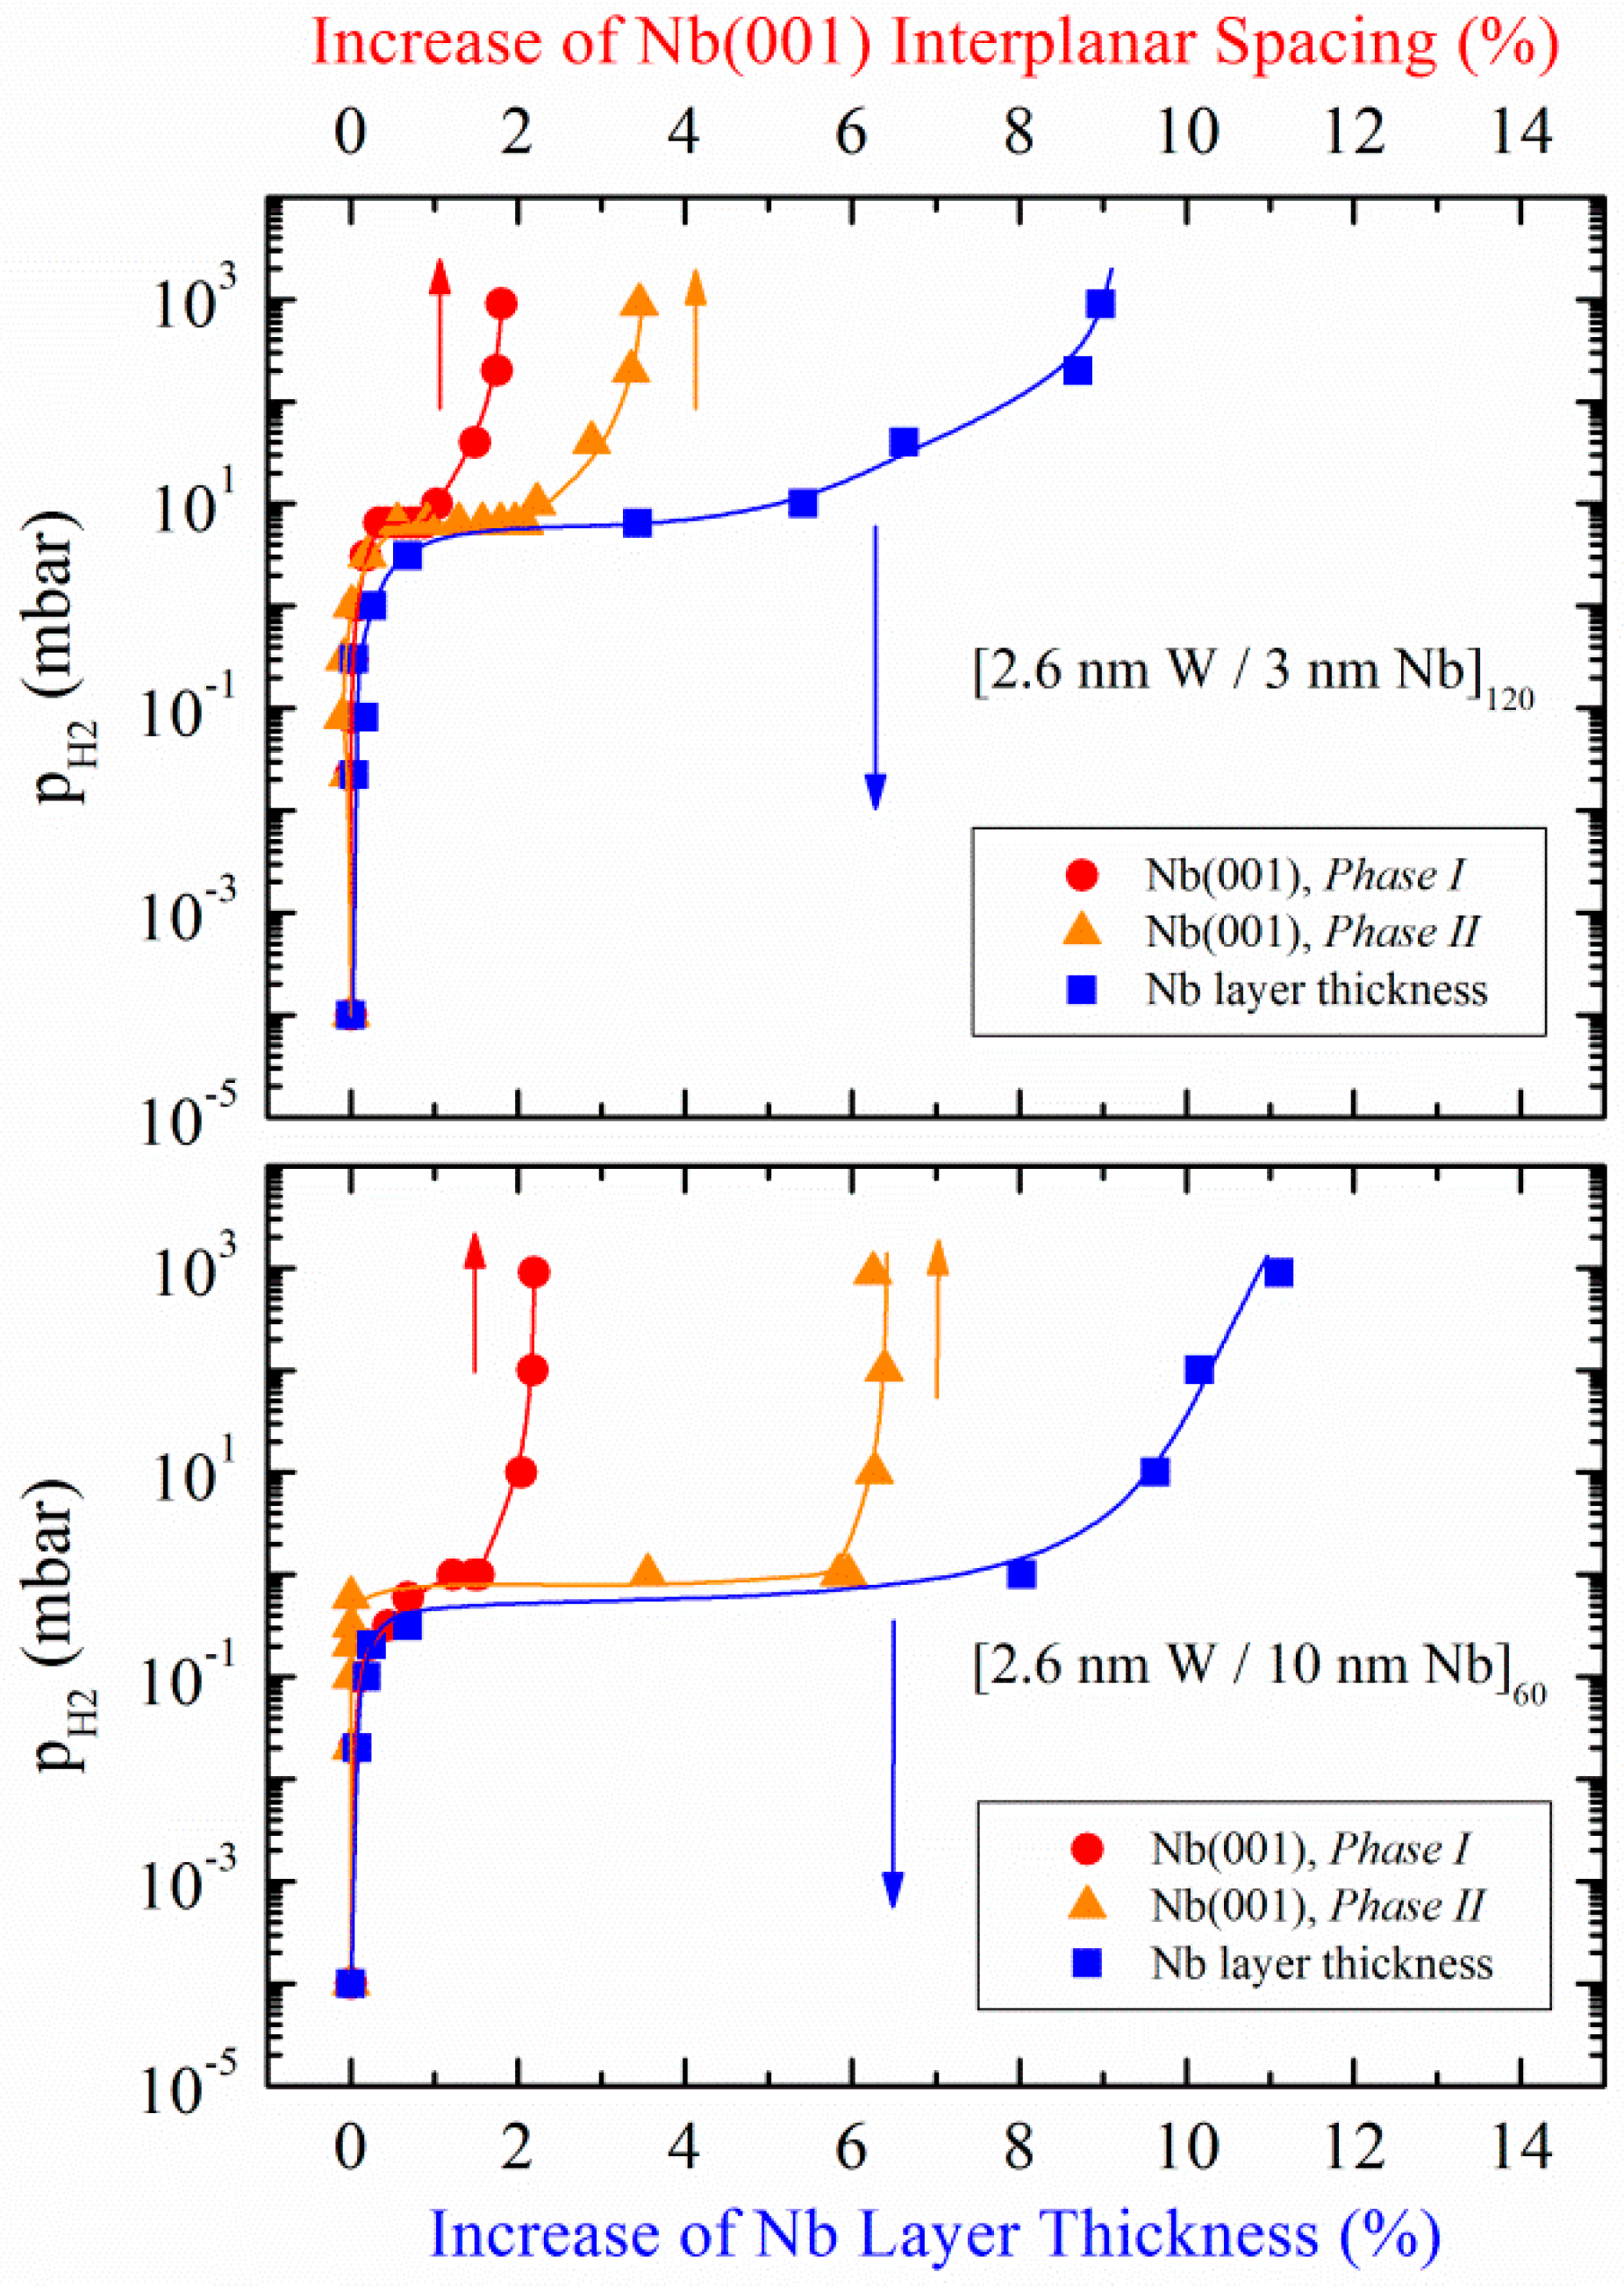
3.1.2. W/Nb Multilayers

This section describes hydrogen absorption of Nb layers embedded in single-crystal (epitaxial) W/Nb multilayers and demonstrates how the degree of structural perfection impacts the hydrogen solubility in comparison to the previously presented polycrystalline Fe/Nb system. Similar to Fe, W does not accumulate hydrogen in any significant way due to its positive solution enthalpy for hydrogen. However, at T = 185 °C, W as well as Fe is sufficiently transparent to allow a homogeneous charging of all the Nb layers in the layer stack.
In contrast to the Fe/Nb system, the W/Nb samples were charged with deuterium gas. The reason is as follows: In neutron reflectivity measurements of the Fe/Nb system, the scattering contrast between Fe (high SLD) and Nb + H (lower SLD) continuously increases with increasing hydrogen absorption due to the negative scattering length of hydrogen (the averaged bH of hydrogen gas with naturally occurring isotope fractions is −3.739 fm). In contrast, hydrogen absorption in Nb layers of W/Nb would decrease the scattering contrast between W and Nb which would have made analysis of the data more difficult. Using deuterium with its positive scattering length of bD = 6.671 fm avoids this problem. It has previously been shown on bulk [57,58] and on thin layers [59] that the solubility of deuterium in Nb deviates insignificantly from that of hydrogen. Note that, in order to facilitate the readability of the text, we continue to use the term hydrogen.
Results of in situ neutron reflectivity measurements on W/Nb multilayers are shown in Figure 9. The measurement on the uncharged sample is represented by red circles while the blue triangles represent the spectrum measured after hydrogen charging at P H 2 = 900 mbar.
The influence of the hydrogen is clearly reflected in both the shift of the Bragg reflections which originate from the W/Nb bilayer period and their apparent increase in intensity due to the change in scattering contrast. Due to the lower double-layer thickness of the sample with 3 nm Nb, however, only one Bragg reflection can be found in the experimentally accessible Q region.
The neutron reflectivity measurement of the sample with [2.6 nm W/3.0 nm Nb]60 features a specific characteristic: in the Q region of about 1.1 nm−1, the structural Bragg reflection is significantly asymmetrical. Such an effect can be observed if the sample possesses a slight layer thickness gradient in the lateral direction, which is present here and needed to be taken into account in the data analysis process.
Figure 10 shows the experimentally determined hydrogen solubility curves of the two W/Nb samples with 3 nm and 10 nm Nb, respectively, together with the theoretical curve of Nb bulk material.
For the sample with 3 nm Nb, a maximal hydrogen concentration of about c (H/Nb) = 40 at. % can be found, whereas this value amounts to about 80 at. % for the sample with 10 nm Nb (both at P H 2 = 900 mbar). The latter approaches the solubility of bulk samples at high pressures. As for the Fe/Nb multilayer system, the plateau-like regions—where most of the hydrogen is absorbed—depend on the Nb layer thickness. For 10 nm Nb, such a region is one order of magnitude, and, for 3 nm Nb, such a region is two orders of magnitude higher in pressure than for the Nb bulk material. The concentration/pressure gradient within this region increases with thinner Nb layer thickness. This indicates that the critical temperature for phase separation is significantly reduced for thin Nb layers compared to thicker Nb layers.
In order to elucidate the impact of hydrogen loading on the Nb crystal structure, in situ X-ray diffraction measurements were performed on the samples [2.6 nm W/10 nm Nb]60 and [2.6 nm W/3 nm Nb]120, see Figure 11, during the hydrogen charging at increasing hydrogen pressures. The data were taken with the scattering vector directing out-of-plane.
A reflection characteristic of the thin-film Nb crystal structure is located at a Bragg angle of Θ ≈ 27.3° for both samples, a value that is shifted to smaller reflection angles when compared to bulk samples indicating larger Nb/Nb lattice plane distances in the out-of-plane direction. This is most likely due to a close matching of the W and Nb in-plane lattice parameters due to the epitaxy. We call the peak at this scattering angle Phase I reflection. Charging the sample with hydrogen changes the spectrum as expected. Most significantly the intensity of the Phase I reflection is highly reduced at higher pressures, its full width at half maximum increased, and its position shifted to smaller Θ values. At higher gas pressures, a new reflection can be identified at Θ ≈ 25.9°. We assume that a transition occurs between these two phases: first a slight one-dimensional lattice expansion occurs (the Phase I peak shifts towards lower angles), followed by a transition of Nb volume into a vertically strongly expanded phase with significantly higher hydrogen content (Phase II). Note that Phase II grows at the expense of Phase I (see bottom panels of Figure 11) which shows the time dependence of the Nb crystal transformation upon hydrogenation. Phase II is most pronounced at P H 2 = 900 mbar for both samples.
Our interpretation of this transformation is that above a Nb thickness dependent critical hydrogen pressure, the Nb lattice cannot keep its structural coherence to the W and the substrate lattice. It seems that the initially only slightly out-of-plane expanded Nb (marked as Phase I) undergoes a non-coherent transition to a largely out-of-plane expanded Phase II at hydrogen pressures above 1 mbar (see below for details). We note that only a very small fraction of the Nb is still in Phase I at 900 mbar, but the sum of the integrated intensities of the Phases I and II peaks stays constant for all hydrogen pressures.
Figure 12 compares relative changes of the Nb interplanar spacing and the Nb layer thickness for the two in situ hydrogen-charged W/Nb samples. As evidenced by the in situ X-ray diffraction measurements, the data sets reveal a second, unexpected hydrogen absorption mechanism which seems to be of equal importance to the hydrogen absorption on interstitial sites.
The data show that the relative increase in the Nb layer thickness of both samples is significantly larger than the expansion of the Nb interplanar spacing. This result is consistent with what was found in the Fe/Nb system except that during the hydrogen absorption at no time a distinct transformation from a low out-of-plane state to a high out-of-plane state could be observed in the Fe/Nb system. Overall, the effects of changes in Nb layer thickness and Nb interplanar spacing through hydrogen charging during a first charging cycle in Fe/Nb and W/Nb (Phase II) are comparable. Also numerically, the same values can approximately be found. In both systems, the layer expansion in the direction of growth is considerably larger than the corresponding lattice expansion. This clearly demonstrates that, besides the well-known process of absorption at interstitial sites that entails expansion of the atomic lattice planes, there is an additional hydrogen absorption mechanism at work, which leads to a large macroscopic swelling of the Nb film.
An explanation for the large macroscopic swelling effect and for the distinct transformation between Phase I and Phase II in W/Nb was found by performing extended X-ray absorption fine structure (EXAFS) studies on the same series of samples [43]. It turned out that Phase II is related to a state in which, due to the large hydrogen concentrations, the in-plane Nb lattice parameter is significantly expanded indicating loss of coherency with the W lattice. In contrast, the Nb in-plane lattice parameter related to the low hydrogen concentration Phase I is smaller, still epitaxially matching the W in-plane lattice parameter. For the (001) orientated epitaxial [2.6 nm W/10 nm Nb]60 multilayer, EXAFS revealed a small 2.5% in-plane expansion of the Nb lattice under hydrogen absorption. The in-plane expansion of 2.5% and the corresponding out-of-plane lattice expansion of 6.2% result in a total increase in volume of 11.5%. This amount coincides with the relative increase of the Nb layer thickness expansion of 11.1% as determined from reflectivity experiments. Hence, one only has to take into account the boundary condition of a fixed in-plane area (i.e., a one-dimensional degree of freedom to expand macroscopically in the out-of-plane direction) in order to explain quantitatively the results in Figure 12. This model implies a three-dimensional rearrangement of Nb atoms caused by the massive mechanical lateral strain and its relaxation with increasing hydrogen charging within the Nb layers, especially near the interfaces to the substrate and the unloaded Fe or W layers. As a result, individual Nb atoms are squeezed out of existing lattice planes and start to form additional planes, which finally causes the anomalous large expansion of the layer thickness. Note that the newly created partial lattice planes imply a large amount of additional dislocations. The latter are evidenced by the fact that the out-of-plane X-ray diffraction peaks broaden significantly upon hydrogen absorption. For [2.6 nm W/10 nm Nb]60, for example, we find a decrease in coherence length in growth direction from 9.0 nm after preparation, to 5.5 nm after hydrogen absorption at 900 mbar. Since lattice imperfections effectively trap hydrogen atoms, the new effect likely also explains the extraordinarily high hydrogen concentrations found in our Nb films and the partial non-reversibility of the hydrogen absorption process itself.

3.1.3. Co/Pd Bilayers

A combination of in situ PNR and FMR measurements was performed on Co/Pd bilayer films in order to study the magnetic effects of hydrogen absorption in this ferromagnet/metallic system and to correlate FMR changes with structural and/or magnetic changes in each individual layer.
Figure 13 shows a comparison of the experimental R+ reflectivity data and the theoretical model fits of a Co/Pd bilayer before (solid red line) and after (solid blue line) absorption of hydrogen from an ambient pressure N2/H2 gas mixture containing 3.5% hydrogen partial pressure (this corresponds to an absolute hydrogen partial pressure of ≈35.5 mbar within the loading chamber). The experimental data set prior to hydrogen absorption was fitted using a model consisting of dPd = 13.50 nm and dCo = 8.36 nm. However, a best fit to the data was obtained by considering an interfacial region of thickness dinterface = 1.43 nm and SLDinterface = 162 µm−2 in the virgin state. This interface layer had a rather large roughness of 1.0 nm at its transition to the Pd layer. After exposure to a 3.5% hydrogen gas partial pressure the interfacial layer was found to undergo a 25% reduction in SLD accompanied by an increase in the in-plane magnetic moment by 66%, and a sharpening of its interfacial roughness to the Pd layer from 1.0 nm to 0.2 nm. Due to the negative scattering length of hydrogen, these observed changes to structure and magnetism highlight the presence of hydrogen at the Co/Pd interface, which have additionally resulted in modifications to the PMA strength within the Pd lattice.
Determining the Pd SLDs and exact layer thicknesses before and after hydrogen exposure and using Equation (4) established the number density ratio of hydrogen atoms to Pd atoms to be 30% in the 3.5% hydrogen partial pressure state. Similar to the Fe/Nb (see Figure 2 in Ref. [41]) and W/Nb (see Figure 5 in Ref. [43]) systems, we found that, after the initial hydrogen absorption and desorption cycle was performed on the Co/Pd sample, the Pd layer did not return to its original thickness or density, demonstrating that the presence of hydrogen within the Pd led to the creation of irreversible deformations. It is significant, however, to note that a reproducible and reversible Pd structure was established between the second and third hydrogen absorption and desorption cycling experiments. This “training” effect needs to be taken into account for technical applications. Reversibility and training effects of the PdHx system have been extensively studied in References [60,61].
The in situ FMR signal responses of the 8.36 nm Co/13.50 nm Pd bilayer obtained on PLATYPUS during two hydrogen absorption and desorption cycles are shown in Figure 14. During these measurements, the microwave frequency was kept constant and equal to 3.4 GHz, and the applied field was swept across the resonance to produce the plots shown in the figure. Ensuring efficient neutron reflection from the film requires taking FMR measurements in the “film facing up” geometry (see Section 2.2.3). For this film orientation, the FMR signal is significantly reduced because of film separation from the microwave transmission line by the 0.5-mm-thick silicon substrate of the film. In order to compensate for this signal reduction, the applied-field modulation technique combined with lock-in signal detection was utilized [62]. For this reason, the registered FMR traces have the shape of the first derivative of a Lorentzian instead of the Lorentzian itself.
The characteristic resonance changes its location with respect to the applied magnetic field depending on the hydrogen concentration within the Pd layer, shifting to lower applied fields upon hydrogen absorption, and shifting upwards upon hydrogen desorption. The downshift of the resonance peak implies that the PMA strength is reduced when hydrogen atoms are incorporated into the Pd crystal lattice. Reproducible responses analogous to those observed in the PNR data between the second and third hydrogen absorption and desorption cycling stages were also evident in the FMR data.

4. Conclusions

In summary, the combination of the scattering methods neutron reflectometry, X-ray reflectometry, high-angle X-ray diffraction and EXAFS, all performed in situ during various hydrogen charging and discharging cycles, revealed substantial new insights in understanding the detailed physics related to hydrogen absorption and desorption in thin metal films.
Our case studies of the individual metal systems Fe/Nb, W/Nb and Co/Pd revealed that such structures absorb hydrogen in large quantities. Focusing on structural property changes upon hydrogenation, for Fe/Nb and W/Nb, we found that the relative out-of-lane expansion of the Nb layers is considerably larger than the relative increase of the Nb interplanar spacing, which indicates two distinctly different mechanisms of hydrogen absorption. In polycrystalline Fe/Nb multilayers, hydrogen expands the Nb interplanar spacing in a continuous way as a function of the external hydrogen pressure. In contrast, in epitaxial W/Nb multilayers—due to a much stronger impact of the initial adherence to the substrate—the Nb lattice expansion is discontinuous and can be regarded as a structural phase transition from exclusively out-of-plane to a three-dimensionally expanded state at low and high hydrogen pressures, respectively.
The hydrogen-induced structural changes, such as layer and lattice plane expansions, that we present in this manuscript are most pronounced during the first hydrogen absorption process. The initial absorption process results in large plastic deformations as the original state of the layer thickness and lattice constants cannot be recovered during the following hydrogen desorption process. The second process and following hydrogen absorption/desorption cycles, however, show, to a large extent, reversible behaviors of layer thickness and lattice spacings.
Our studies of the effect of hydrogen absorption on the magnetic properties of our systems revealed that the magnetic exchange coupling in Fe/Nb multilayers can reversibly be switched by hydrogen charging and discharging. In the Co/Pd system, the magnetic anisotropy at the interfaces can reversibly be changed by absorption and desorption of hydrogen. These two observed electronic effects enable a novel approach for hydrogen sensing using a magnetic readout scheme.

Acknowledgments

The authors would like to acknowledge technical support provided during their research work carried out at: Hahn-Meitner-Institut (now Helmholtz-Zentrum) Berlin, Germany; Hamburg Synchrotron Radiation Laboratory (HASYLAB) at Deutsches Elektronen-Synchrotron (DESY), Hamburg, Germany; Intense Pulsed Neutron Source (IPNS) at Argonne National Laboratory, Argonne, IL, USA; Australian Nuclear Science and Technology Organisation (ANSTO), Lucas Heights, Australia.

Author Contributions

S.J.C., C.R. and F.K. prepared the manuscript. C.R. and F.K. performed data collection and analysis of the Fe/Nb and W/Nb systems. S.J.C., G.C., M.K. and F.K. performed data collection and analysis of the Co/Pd systems.

Conflicts of Interest

The authors declare no conflict of interest.

References

  1. Sakintuna, B.; Lamari-Darkrim, F.; Hirscher, M. Metal hydride materials for solid hydrogen storage: A review. Int. J. Hydrog. Energy 2007, 32, 1121–1140. [Google Scholar] [CrossRef]
  2. Van den Berg, A.W.C.; Areán, C.O. Materials for hydrogen storage: Current research trends and perspectives. Chem. Commun. 2008, 668–681. [Google Scholar] [CrossRef]
  3. Liu, C.; Li, F.; Ma, L.P.; Cheng, H.M. Advanced materials for energy storage. Adv. Mater. 2010, 22, E28–E62. [Google Scholar] [CrossRef] [PubMed]
  4. Chen, X.; Li, C.; Grätzel, M.; Kostecki, R.; Mao, S.S. Nanomaterials for renewable energy production and storage. Chem. Soc. Rev. 2012, 41, 7909–7937. [Google Scholar] [CrossRef] [PubMed]
  5. Pukazhselvan, D.; Kumar, V.; Singh, S.K. High capacity hydrogen storage: Basic aspects, new developments and milestones. Nano Energy 2012, 1, 566–589. [Google Scholar] [CrossRef]
  6. Baldi, A.; Gonzalez-Silveira, M.; Palmisano, V.; Dam, B.; Griessen, R. Destabilization of the Mg–H System through Elastic Constraints. Phys. Rev. Lett. 2009, 102, 226102. [Google Scholar] [CrossRef] [PubMed]
  7. Peisl, H. Lattice strains due to hydrogen in metals. In Hydrogen in Metals I; Springer Berlin Heidelberg: Berlin, Germany, 1978; pp. 53–74. [Google Scholar]
  8. Zabel, H. Thin films: Hydrogen. In Encyclopedia of Materials: Science and Technology, 2nd ed.; Buschow, K.H.J., Cahn, R.W., Flemings, M.C., Ilschner, B., Kramer, E.J., Mahajan, S., Veyssière, P., Eds.; Elsevier: Oxford, UK, 2001; pp. 9246–9250. [Google Scholar]
  9. Huiberts, J.N.; Griessen, R.; Rector, J.H.; Wijngaarden, R.J.; Dekker, J.P.; de Groot, D.G.; Koeman, N.J. Yttrium and lanthanum hydride films with switchable optical properties. Nature 1996, 380, 231–234. [Google Scholar] [CrossRef]
  10. Klose, F.; Rehm, C.; Nagengast, D.; Maletta, H.; Weidinger, A. Continuous and reversible change of the magnetic coupling in an Fe/Nb multilayer induced by hydrogen charging. Phys. Rev. Lett. 1997, 78, 1150–1153. [Google Scholar] [CrossRef]
  11. Hjörvarsson, B.; Dura, J.A.; Isberg, P.; Watanabe, T.; Udovic, T.J.; Andersson, G.; Majkrzak, C.F. Reversible tuning of the magnetic exchange coupling in Fe/V(001) superlattices using hydrogen. Phys. Rev. Lett. 1997, 79, 901–904. [Google Scholar] [CrossRef]
  12. Kravtsov, E.; Nefedov, A.; Nowak, G.; Zhernenkov, K.; Zabel, H.; Hjörvarsson, B.; Liebig, A.; Hoser, A.; McIntyre, G.J.; Paolasini, L.; et al. Fine-tuning of the spin-density-wave state in Cr/V heterostructures via hydrogen uptake. J. Phys. Condens. Matter 2009, 21, 336004. [Google Scholar] [CrossRef] [PubMed]
  13. Andersson, G.; Hjörvarsson, B.; Zabel, H. Hydrogen-induced lattice expansion of vanadium in a Fe/V(001) single-crystal superlattice. Phys. Rev. B 1997, 55, 15905. [Google Scholar] [CrossRef]
  14. Yang, Q.M.; Schmitz, G.; Fähler, S.; Krebs, H.U.; Kirchheim, R. Hydrogen in Pd/Nb multilayers. Phys. Rev. B 1996, 54, 9131–9140. [Google Scholar] [CrossRef]
  15. Chang, C.S.; Kostylev, M.; Ivanov, E. Metallic spintronic thin film as a hydrogen sensor. Appl. Phys. Lett. 2013, 102, 142405. [Google Scholar] [CrossRef]
  16. Westerwaal, R.J.; Rooijmans, J.S.A.; Leclercq, L.; Gheorghe, D.G.; Radeva, T.; Mooij, L.; Mak, T.; Polak, L.; Slaman, M.; Dama, B.; et al. Nanostructured Pd-Au based fiber optic sensors for probing hydrogen concentrations in gas mixtures. Int. J. Hydrog. Energy 2013, 38, 4201–4212. [Google Scholar] [CrossRef]
  17. Ngene, P.; Radeva, T.; Slaman, M.; Westerwaal, R.J.; Schreuders, H.; Dam, B. Seeing hydrogen in colors: Low-cost and highly sensitive eye readable hydrogen detectors. Adv. Funct. Mater. 2014, 24, 2374–2382. [Google Scholar] [CrossRef]
  18. Hübert, T.; Boon-Brett, L.; Black, G.; Banach, U. Hydrogen sensors—A review. Sens. Actuators B 2011, 157, 329–352. [Google Scholar] [CrossRef]
  19. Ford, D.C.; Cooley, L.D.; Seidman, D.N. First principles calculations of niobium hydride formation in superconducting radio-frequency cavities. Supercond. Sci. Technol. 2013. [Google Scholar] [CrossRef]
  20. Fukai, Y. The Metal-Hydrogen System: Basic Bulk Properties; Springer: Berlin, Germany, 2005. [Google Scholar]
  21. Zabel, H.; Peisl, H. X-ray study of the phase diagram of hydrogen in niobium. Phys. Stat. Sol. A 1976, 37, K67–K70. [Google Scholar] [CrossRef]
  22. Walter, R.J.; Chandler, W.T. The columbium-hydrogen constitution diagram. Trans. Met. Soc. AIME 1965, 233, 762–765. [Google Scholar]
  23. Manchester, F.D.; San-Martin, A.; Pitre, J.M. The H-Pd (hydrogen-palladium) system. J. Phase Equilib. 1995, 15, 62–83. [Google Scholar] [CrossRef]
  24. Pundt, A.; Kirchheim, R. Hydrogen in Metals: Microstructural Aspects. Annu. Rev. Mater. Res. 2006, 36, 555–608. [Google Scholar] [CrossRef]
  25. Song, G.; Remhof, A.; Theis-Bröhl, K.; Zabel, H. Extraordinary adhesion of niobium on sapphire substrates. Phys. Rev. Lett. 1997, 79, 5062–5065. [Google Scholar] [CrossRef]
  26. Hamm, M.; Burlaka, V.; Wagner, S.; Pundt, A. Achieving reversibility of ultra-high mechanical stress by hydrogen loading of thin films. Appl. Phys. Lett. 2015. [Google Scholar] [CrossRef]
  27. Hjörvarsson, B.; Andersson, G.; Karlsson, E. Metallic superlattices: Quasi two-dimensional playground for hydrogen. J. Alloy. Compd. 1997, 51, 253–254. [Google Scholar] [CrossRef]
  28. Čížek, J.; Procházka, I.; Bečvář, F.; Kužel, R.; Cieslar, M.; Brauer, G.; Anwand, W.; Kirchheim, R.; Pundt, A. Hydrogen-induced defects in bulk niobium. Phys. Rev. B 2004. [Google Scholar] [CrossRef]
  29. Romanenko, A.; Edwardson, C.J.; Coleman, P.G.; Simpson, P.J. The effect of vacancies on the microwave surface resistance of niobium revealed by positron annihilation spectroscopy. Appl. Phys. Lett. 2013. [Google Scholar] [CrossRef]
  30. Fritzsche, H.; Saoudi, M.; Haagsma, J.; Ophus, C.; Luber, E.; Harrower, C.T.; Mitlin, D. Neutron reflectometry study of hydrogen desorption in destabilized MgAl alloy thin films. Appl. Phys. Lett. B 2008. [Google Scholar] [CrossRef]
  31. Maxelon, M.; Pundt, A.; Pyckhout-Hintzen, W.; Barker, J.; Kirchheim, R. Interaction of hydrogen and deuterium with dislocations in palladium as observed by small angle neutron scattering. Acta Mater. 2001, 49, 2625–2634. [Google Scholar] [CrossRef]
  32. Munter, A.E.; Heuser, B.J. Deuterium phase behavior in thin-film Pd. Phys. Rev. B 1998, 58, 678–684. [Google Scholar] [CrossRef]
  33. Song, G.; Geitz, M.; Abromeit, A.; Zabel, H. Solubility isotherms of hydrogen in epitaxial Nb(110) films. Phys. Rev. B 1996, 54, 14093–14101. [Google Scholar] [CrossRef]
  34. Reimer, P.M.; Zabel, H.; Flynn, C.P.; Matheny, A.; Ritley, K. Elastic properties of hydrogen-loaded epitaxial films. Z. Phys. Chem. 1993, 181, 367–373. [Google Scholar] [CrossRef]
  35. Reimer, P.M.; Zabel, H.; Flynn, C.P.; Dura, J.A. Extraordinary alignment of Nb films with sapphire and the effects of added hydrogen. Phys. Rev. B 1992, 45, 11426–11429. [Google Scholar] [CrossRef]
  36. Laudahn, U.; Pundt, A.; Bicker, M.; Hülsen, U.; Geyer, U.; Wagner, T.; Kirchheim, R. Hydrogen-induced stress in Nb single layers. J. Alloy. Compd. 1999. [Google Scholar] [CrossRef]
  37. Hjörvarsson, B.; Rydén, J.; Karlsson, E.; Birch, J.; Sundgren, J.E. Interface effects of hydrogen uptake in Mo/V single-crystal superlattices. Phys. Rev. B 1991, 43, 6440–6445. [Google Scholar] [CrossRef]
  38. Stillesjö, F.; Hjörvarsson, B.; Zabel, H. Hydrogen-induced lattice expansion in a (001)-oriented Mo/V superlattice. Phys. Rev. B 1996, 54, 3079–3083. [Google Scholar] [CrossRef]
  39. Munter, A.E.; Heuser, B.J.; Ruckman, M.W. In situ neutron reflectometry measurements of hydrogen and deuterium absorption in a Pd/Nb/Pd layered film. Phys. Rev. B 1997, 55, 14035–14038. [Google Scholar] [CrossRef]
  40. Gahr, S.; Grossbeck, M.L.; Birnbaum, H.K. Hydrogen embrittlement of Nb I-macroscopic behavior at low temperatures. Acta Met. 1977, 25, 125–134. [Google Scholar] [CrossRef]
  41. Rehm, C.; Fritzsche, H.; Maletta, H.; Klose, F. Hydrogen concentration and its relation to interplanar spacing and layer thickness of 1000-Å Nb(110) films during in situ hydrogen charging experiments. Phys. Rev. B 1999, 59, 3142–3152. [Google Scholar] [CrossRef]
  42. Klose, F.; Rehm, C.; Fieber-Erdmann, M.; Holub-Krappe, E.; Bleif, H.J.; Sowers, H.; Goyette, R.; Tröger, L.; Maletta, H. Hydrogen absorption in epitaxial W/Nb(001) and polycrystalline Fe/Nb(110) multilayers studied in situ by X-ray/neutron scattering techniques and X-ray absorption spectroscopy. Phys. B 2000, 283, 184–188. [Google Scholar] [CrossRef]
  43. Rehm, C.; Maletta, H.; Fieber-Erdmann, M.; Holub-Krappe, E.; Klose, F. Anomalous layer expansion in thin niobium films during hydrogen absorption. Phys. Rev. B 2002. [Google Scholar] [CrossRef]
  44. Buttner, W.J.; Post, M.B.; Burgess, R.; Rivkin, C. An overview of hydrogen safety sensors and requirements. Int. J. Hydrog. Energy 2011, 36, 2462–2470. [Google Scholar] [CrossRef]
  45. Lewis, F.A. The Palladium Hydrogen System; Academic Press: New York, NY, USA, 1967. [Google Scholar]
  46. Gupta, R.; Sagade, A.A.; Kulkarni, G.U. A low cost optical hydrogen sensing device using nanocrystalline Pd grating. Int. J. Hydrog. Energy 2012, 37, 9443–9449. [Google Scholar] [CrossRef]
  47. Engel, B.N.; England, C.D.; van Leeuwen, R.A.; Wiedmann, M.H.; Falco, C.M. Interface magnetic anisotropy in epitaxial superlattices. Phys. Rev. Lett. 1991, 67, 1910–1913. [Google Scholar] [CrossRef] [PubMed]
  48. Neutron Activation Calculator. Available online: https://www.ncnr.nist.gov/resources/activation/ (accessed on 12 April 2016).
  49. Mezei, F.; Golub, R.; Klose, F.; Toews, H. Focussed beam reflectometer for solid and liquid surfaces. Phys. B 1995. [Google Scholar] [CrossRef]
  50. Paul, A.; Krist, T.; Teichert, A.; Steitz, R. Specular and off-specular scattering with polarization and polarization analysis on reflectometer V6 at BER II, HZB. Physica B 2011, 406, 1598–1606. [Google Scholar] [CrossRef]
  51. Crawford, R.K.; Felcher, G.P.; Kleb, R.; Epperson, J.E.; Thiyagarajan, P. New Instruments at IPNS: POSY II and SAD II; Hyer, D.K., Ed.; IOP Publishing Ltd.: Bristol, UK, 1989. [Google Scholar]
  52. Gurevich, A.G.; Melkov, G.A. Magnetization Oscillation and Waves; C.R.C. Press: New York, NY, USA, 1996. [Google Scholar]
  53. James, M.; Nelson, A.; Brule, A.; Schulz, J.C. Platypus: A time-of-flight neutron reflectometer at Australia’s new research reactor. J. Neutron Res. 2006, 14, 91–108. [Google Scholar] [CrossRef]
  54. James, M.; Nelson, A.; Holt, S.A.; Saerbeck, T.; Hamilton, W.A.; Klose, F. The multipurpose time-of-flight neutron reflectometer “Platypus” at Australia’s OPAL reactor. Nucl. Instrum. Methods Phys. Res. Sec. A 2011, 632, 112–123. [Google Scholar] [CrossRef]
  55. Saerbeck, T.; Klose, F.; LeBrun, A.P.; Füzi, J.; Brule, A.; Nelson, A.; Holt, S.A.; James, M. Polarization “Down Under”: The polarized time-of-flight neutron reflectometer PLATYPUS. Rev. Sci. Instrum. 2012. [Google Scholar] [CrossRef] [PubMed]
  56. Maletta, H.; Rehm, C.; Klose, F.; Fieber-Erdmann, M.; Holub-Krappe, E. Anomalous effects of hydrogen absorption in Nb films. J. Magn. Magn. Mater. 2002, 240, 475–477. [Google Scholar] [CrossRef]
  57. Hydrogen in Metals I; Alefeld, G.; Völkl, J. (Eds.) Springer: Berlin, Germany, 1978; Volume 28.
  58. Hydrogen in Metals III; Wipf, H. (Ed.) Springer: Berlin, Germany, 1997; Volume 73.
  59. Remhof, A.; Song, G.; Sutter, C.; Schreyer, A.; Siebrecht, R.; Zabel, H.; Güthoff, F.; Windgasse, J. Hydrogen and deuterium in epitaxial Y(0001) films: Structural properties and isotope exchange. Phys. Rev. B 1999, 59, 6689–6699. [Google Scholar] [CrossRef]
  60. Pivak, Y.; Gremaud, R.; Gross, K.; Gonzalez-Silveira, M.; Walton, A.; Book, D.; Schreuders, H.; Dam, B.; Griessen, R. Effect of the substrate on the thermodynamic properties of PdHx films studied by hydrogenography. Scr. Mater. 2009, 60, 348–351. [Google Scholar] [CrossRef]
  61. Gremaud, R.; Gonzalez-Silveira, M.; Pivak, Y.; de Mana, S.; Slaman, M.; Schreuders, H.; Dam, B.; Griessen, R. Hydrogenography of PdHx thin films: Influence of H-induced stress relaxation processes. Acta Mater. 2009, 57, 1209–1219. [Google Scholar] [CrossRef]
  62. Maksymov, I.S.; Kostylev, M. Broadband stripline ferromagnetic resonance spectroscopy of ferromagnetic films, multilayers and nanostructures. Phys. E 2015, 69, 253–293. [Google Scholar] [CrossRef]
Figure 1. Hydrogen-induced three-dimensional isotropic expansion of the host lattice (bulk) versus one-dimensional lattice expansion (thin films).
Metals 06 00125 g001
Figure 2. Schematic characteristic of the potential energy (chemical potential) of hydrogen atoms at a metal/metal-hydride/metal interface. Example: Fe (small solubility for hydrogen) and Nb (large solubility for hydrogen). The red dots indicate preferred hydrogen absorption sites. (a) Fe and Nb layers separated; (b) Fe and Nb layers in contact.
Metals 06 00125 g002
Figure 3. Schematic of reflectometry geometry.
Metals 06 00125 g003
Figure 4. Simulated neutron reflectivity curves of a bulk Pd surface (red solid line) and a Pd-hydride bulk surface (blue dashed line).
Metals 06 00125 g004
Figure 5. Schematic of the FMR/PNR experimental chamber.
Metals 06 00125 g005
Figure 6. Unpolarized neutron reflectivity data for several polycrystalline Fe/Nb heterostructures. The red curves represent data taken in the virgin (pre-hydrogen) state, while the blue curves represent data taken at the highest hydrogen pressure of 900 mbar.
Metals 06 00125 g006
Figure 7. PNR data (circles) and fits (black lines) for a polycrystalline Fe/Nb heterostructure. Figure adapted with permission from Ref. [41]. Copyrighted by the American Physical Society.
Metals 06 00125 g007
Figure 8. Phase diagram for hydrogen absorbing Nb thin films. Reprinted from [56] with permission from Elsevier.
Metals 06 00125 g008
Figure 9. Neutron reflectivity curves of W/Nb multilayers with different Nb layer thicknesses as indicated, measured in the as-prepared state (red circles), and at a hydrogen pressure of 900 mbar (blue triangles).
Metals 06 00125 g009
Figure 10. Hydrogen solubility curves of epitaxial [2.6 nm W/dNb]n multilayers and Nb bulk material as indicated.
Metals 06 00125 g010
Figure 11. Cu Kα X-ray diffraction on the multilayers [2.6 nm W/10 nm Nb]60 (left); and [2.6 nm W/3 nm Nb]120 (right) as a function of increasing external hydrogen pressure, and (bottom) time-resolved measurement at 1 mbar and 6.5 mbar, respectively. The dashed lines indicate the positions of the Nb(002) and W(002) bulk reflections.
Metals 06 00125 g011
Figure 12. Comparison between hydrogen-induced relative increase of the out-of-plane Nb(110) interplanar spacing (top); and increase of the Nb layer thickness (bottom) in W/Nb multilayers for various hydrogen pressures.
Metals 06 00125 g012
Figure 13. Comparison of R+ polarized neutron reflectivity data (circles) and fits (solid lines) for a Co/Pd bilayer before (red) and after (blue) exposure to 3.5% hydrogen gas partial pressure.
Metals 06 00125 g013
Figure 14. In situ FMR response of a 8.36 nm Co/13.50 nm Pd bilayer at various stages during the hydrogen absorption and desorption cycling PNR experiment.
Metals 06 00125 g014
Table 1. List of samples for the Fe/Nb and W/Nb measurements. The description in the brackets is the thickness of each layer in a single bilayer. The number in subscript represents how many times each bilayer was repeated.
Fe/Nb(110)—PolycrystallineW/Nb(110)—Single Crystal
[2.6 nm Fe/2 nm Nb]20[2.6 nm W/3 nm Nb]120
[2.6 nm Fe/5 nm Nb]10[2.6 nm W/10 nm Nb]100
[2.6 nm Fe/10 nm Nb]10-
[2.6 nm Fe/100 nm Nb]10-
Table 2. SLD and layer thicknesses for the sample data shown in Figure 7.
Layer MaterialSLD at 0 mbar (μm−2)SLD at 900 mbar (μm−2)Bulk SLD (μm−2)d at 0 mbar (nm)d at 900 mbar (nm)
Pd40240240255
Nb38017039293.6103.5
Fe (R+)1010103013002.62.6
Fe (R−)4905703032.62.6
Cr30330330355
Si207207207--

