Article

Metallographic Index-Based Quantification of the Homogenization State in Extrudable Aluminum Alloys

by
Panagiota I. Sarafoglou
,
John S. Aristeidakis
,
Maria-Ioanna T. Tzini
and
Gregory N. Haidemenopoulos
*
Department of Mechanical Engineering, University of Thessaly, Volos 38334, Greece
*
Author to whom correspondence should be addressed.
Metals 2016, 6(5), 121; https://doi.org/10.3390/met6050121
Submission received: 10 April 2016 / Revised: 12 May 2016 / Accepted: 16 May 2016 / Published: 21 May 2016
(This article belongs to the Special Issue Aluminum Alloys)

Abstract

:
Extrudability of aluminum alloys of the 6xxx series is highly dependent on the microstructure of the homogenized billets. It is therefore very important to characterize quantitatively the state of homogenization of the as-cast billets. The quantification of the homogenization state was based on the measurement of specific microstructural indices, which describe the size and shape of the intermetallics and indicate the state of homogenization. The indices evaluated were the following: aspect ratio (AR), which is the ratio of the maximum to the minimum diameter of the particles, feret (F), which is the maximum caliper length, and circularity (C), which is a measure of how closely a particle resembles a circle in a 2D metallographic section. The method included extensive metallographic work and the measurement of a large number of particles, including a statistical analysis, in order to investigate the effect of homogenization time. Among the indices examined, the circularity index exhibited the most consistent variation with homogenization time. The lowest value of the circularity index coincided with the metallographic observation for necklace formation. Shorter homogenization times resulted in intermediate homogenization stages involving rounding of edges or particle pinching. The results indicated that the index-based quantification of the homogenization state could provide a credible method for the selection of homogenization process parameters towards enhanced extrudability.

Graphical Abstract

1. Introduction

The process chain of extrudable Al-alloys of the 6xxx series involves direct-chill casting followed by a homogenization cycle, prior to hot extrusion. The as-cast billets contain several inhomogeneities, such as elemental microsegregation, grain boundary segregation, and formation of low-melting eutectics as well as the formation of iron intermetallics. The presence of intermetallic phases, in particular, which possess sharp edges, can impair the deformability of 6xxx extrudable alloys especially when located in the grain boundary regions [1,2,3,4]. Among the intermetallics the most important are the Fe-bearing intermetallics, α-Al12(FeMn)3Si and β-Al5FeSi, from now on called α-AlFeSi and β-AlFeSi respectively. The α-AlFeSi has a cubic crystal structure and globular morphology while the β-AlFeSi possesses a monoclinic structure and a plate-like morphology, limiting the extrudability of the as-cast billet by inducing local cracking and surface defects in the extruded material [5,6,7]. The above effects are partially removed by the homogenization treatment, which includes the removal of elemental microsegregation, removal of non-equilibrium low-melting eutectics, the transformation of β-AlFeSi to α-AlFeSi and the spheroidization of the remaining undissolved intermetallics [1]. The effect of various parameters of the homogenization treatment, such as the homogenization temperature, time, as well as the cooling rate, have been studied experimentally [8,9,10,11]. The dissolution of Mg2Si during homogenization is a rather fast process while the transformation of β-AlFeSi to α-AlFeSi is a much slower process [12,13,14]. In industrial practice, the minimum homogenization time is controlled by the completion of the β-AlFeSi to α-AlFeSi transformation. After the transformation β → α-AlFeSi is complete, the α-AlFeSi phase undergoes coarsening and spheroidization, adopting, finally, a “necklace” morphology, which enhances the extrudability of the billet. This explains the fact that the actual homogenization times in industrial practice are longer than the times required for Mg2Si dissolution and the completion of the β → α-AlFeSi transformation.
The morphological changes of the α-AlFeSi phase have been described mostly qualitatively in the published literature. Studies have been made on the microstructural evolution during the homogenization of AA7020 aluminum alloy concerning the dissolution of detrimental grain-boundary particles, which degrade the hot workability of the alloy [15,16,17]. In other studies, it was found that the spheroidization of intermetallic phases is a key mechanism in the microstructural evolution during homogenization [1,18,19]. A method to quantify the microstructure with 3D metallography has been applied for a 6005 Al-alloy [20]. The method, which involved serial sectioning and 3D reconstruction techniques, revealed that the connectivity of the intermetallics decreases with homogenization time. Despite the above works, studies on the “quantification” of the homogenization state are still very limited.
The aim of the present paper is the quantification of the homogenization state by means of quantitative metallography, in order to describe the morphological evolution of the intermetallic phases. An index-based methodology has been developed. The aspect ratio, feret, and circularity are metallographic indices, among others, that can be used to characterize the homogenization state. These indices can be determined by quantitative metallography, involving image analysis. A fully homogenized billet, with the potential for high extrudability should have all β-AlFeSi transformed to α-AlFeSi with necklace morphology and appropriate values of aspect ratio and circularity.

2. Materials and Methods

The chemical composition of the 6060 alloy investigated is Al-0.38Mg-0.40Si-0.2Fe-0.03Mn (mass %). Three homogenization heat treatments consisted of holding at 560 °C, for 2, 4, and 6 h followed by air cooling (see also Table 1). These conditions were selected in order to study the morphological changes of the α-AlFeSi phase after the complete transformation of β → α-AlFeSi.
After the homogenization heat treatment, the specimens were prepared for standard metallographic examination involving optical microscopy (Leitz Aristomet, Leica Microsystems, Wetzlar, Germany), SEM-JEOL 6400 (JEOL Ltd, Tokyo, Japan), and image analysis (Image J software, Version 1.50g, 2016, National Institutes of Health, Bethesda, MD, USA). The specimens were subjected to grinding, polishing, and etching with a Poulton’s reagent consisting of 1 mL HF, 12 mL HCl, 6 mL HNO3, and 1 mL H2O, modified by the addition of 25 mL HNO3 and 12 g Cr2O3 (in 40 mL H2O). The as-cast as well as the homogenized microstructures were characterized for intermetallic phases and the particles were categorized in three morphological types as rounded particles, pinched particles, and particles exhibiting a necklace formation. It should be noted that pinched particles are those that are in the initial stage of separation to smaller rounded particles towards the formation of a necklace group. The number of images processed and the number of particles measured for each condition appears in Table 2.
As mentioned above, the quantification of the homogenization state was based on the measurement of indices that describe the size and shape of the intermetallics and indicate the state of homogenization. The indices employed were the aspect ratio (AR), feret (F), and circularity (C) and are defined in Table 3.
After the standard metallographic observation, measurement of particle dimensions was carried out in the SEM using the appropriate magnification and a suitable numerical aperture as suggested in [21]. The method is indicated for a group of particles (Figure 1a). The group is isolated (Figure 1b) and transferred to the image analysis program (Figure 1c) where the particles are numbered and their dimensions measured. The respective measurements for each particle in the group are depicted in Table 4. In most cases, the measuring frames contained whole particles. In the cases where the frame passes through a particle, then this particle was not taken into account.
The area of measurement (scanned area) was kept constant for all homogenization treatments. Statistical analysis is required to assess the data and allow for credible conclusions to be made. In order to examine if the data samples were comparable, the Kruskal-Wallis test [22] was used. It is a non-parametric method for testing whether samples originate from the same distribution and it is used to compare two or more independent samples of equal or different sample size. With a confidence level of 99%, it was proved that the samples derive from different distributions. As a result, the samples are not comparable without further processing. In order to compare between the dissimilar samples, the “Bootstrapped Mean” [23] method was used. Bootstrapping is a non-parametric statistical technique that allows accurate estimations about the characteristics of a population to be made when the examined sample size is limited. As it is non-parametric, the method can be used to compare between samples derived from different distributions, such as Normal and LogNormal distributions. It works by recursively calculating the preferred parameter, like the mean or the median, for a part of the sample and then combining the results to make robust estimates of standard errors and confidence intervals of the population parameter. In this case, a 95% confidence interval was used, while the standard error was kept to a minimum by using a large number of iterations. This process leads to comparable statistical parameters for each measurement.

3. Results and Discussion

The microstructural evolution of the 6060 alloy during homogenization is depicted in Figure 2. The as-cast microstructure is depicted in Figure 2a. Mg2Si, α-AlFeSi, and β-AlFeSi intermetallics are located at the grain boundaries, while the α-AlFeSi phase exhibits the characteristic “Chinese-script” morphology. The morphological evolution with homogenization time is indicated in Figure 2b,c for 2 h, Figure 2d,e for 4 h and Figure 2f,g for 6 h homogenization time. Connectivity between intermetallics is decreased with homogenization time, in agreement with the observations in [20]. Clear spheroidization of particles and necklace formation is evident only in the micrographs of Figure 2f,g, i.e., after 6 h homogenization. It is clear that optical metallography can supply only qualitative data on the progress of homogenization.
The SEM analysis revealed that the morphological changes of the α-AlFeSi phase during homogenization could be classified in three stages:
First stage, rounding of edges, 2 h homogenization (Figure 3). The β-AlFeSi particles exhibit sharp edges, this being the main reason for their detrimental effect on extrudability. After 2 h, all particles with sharp edges have been transformed and there are no particles with sharp edges in the microstructure. Therefore, we assume that there are no β-AlFeSi particles after 2 h homogenization. As discussed in the previous section after the completion of the β to α-AlFeSi transformation, the intermetallic α-AlFeSi phase undergoes spheroidization. In the first stage of this process the plate-like particles exhibit a slight decrease in their width. Although they do not exhibit complete spheroidization the particles become more rounded at the edges as depicted in Figure 3.
Second stage, particle pinching, 4 h homogenization (Figure 4). At the second stage, the rounding of edges is intensified while there is a clear tendency of the particles to be separated into smaller rounded particles by a process called particle pinching. The process has been also observed during homogenization of a 7020 alloy [15] and is indicated by arrows in Figure 4.
Third stage, necklace formation, 6 h homogenization (Figure 5). The reduction of surface energy of the α-AlFeSi phase is the driving force for spheroidization. With this process, the total interface area between the matrix and the α-AlFeSi phase is reduced. The particles finally adopt a spherical shape and are arranged in a necklace formation during the third stage, as depicted in Figure 5.
The morphological changes of the α-AlFeSi phase described above, include rounding of edges, pinching, and spheroidization. A reduction in surface energy drives the rounding of the edges, since the total interfacial area of the particle is reduced. Particle pinching, i.e., the breakdown of a large plate to smaller particles is driven by the reduction of strain energy, caused by the plate morphology. The spheroidization of the small particles and necklace formation are also driven by the reduction in surface energy. All the above processes are accomplished by the diffusion of alloying elements through the matrix.
The mean values of microstructural indices, aspect ratio, feret and circularity have been determined for the as-cast and homogenized alloys. The 2.5% and 97.5% quantiles were used to define a confidence interval of 95%. The mean index values for the entire population (not just the measured sample), are located inside the confidence interval and have an expected value given by the Bootstrapped Mean. From these data, which are shown in Figure 6a–c, the following remarks can be made.
The as-cast condition exhibits the highest values of all three indices. Homogenization leads to the reduction in these indices. Regarding the aspect ratio (Figure 6a) the greatest reduction appears up to 4 h homogenization. Extending the homogenization time to 6 h does not change the aspect ratio considerably. Regarding feret, (Figure 6b), the index is reduced appreciably at 2 h homogenization with a further slight reduction at 6 h homogenization. The intermediate slight increase of the feret index between 2 and 4 h homogenization is attributed to the protrusions formed at the particle surface, a process accompanying the pinching process, as suggested in [15,16]. The circularity index, (Figure 6c), exhibits a continuous reduction with homogenization time, with the largest reduction appearing after 2 h homogenization. This is attributed to the initiation of the spheroidization process at the first stage (rounded particles) discussed above. Circularity achieves its lowest value at after 6 h homogenization. This is in agreement with the observation of necklace formation after 6 h homogenization (third stage). The necklace formation is characterized by the lowest value of the circularity index among the conditions examined. The fact that there is no further reduction of the aspect ratio between 4 and 6 h homogenization, discussed above, is attributed to the decreased connectivity of the α-AlFeSi phase, which follows the necklace formation. A continuous decrease of connectivity with homogenization time has been also observed for a 6005 Al-alloy [20]. Spheroidization and in particular, necklace formation, has been considered a key process for increased extrudability [18,19]. It appears that the index exhibiting the more consistent variation with homogenization time is the circularity index, which, as stated above, exhibits a continuous reduction with homogenization time.

4. Conclusions

An index-based method to quantify the homogenization state has been developed. Indices such as the aspect ratio, feret, and circularity have been determined in order to characterize the stage of spheroidization of the α-AlFeSi phase, following the β to α-AlFeSi transformation. The effect of the homogenization time was studied in a 6060 alloy. The major conclusions are the following:
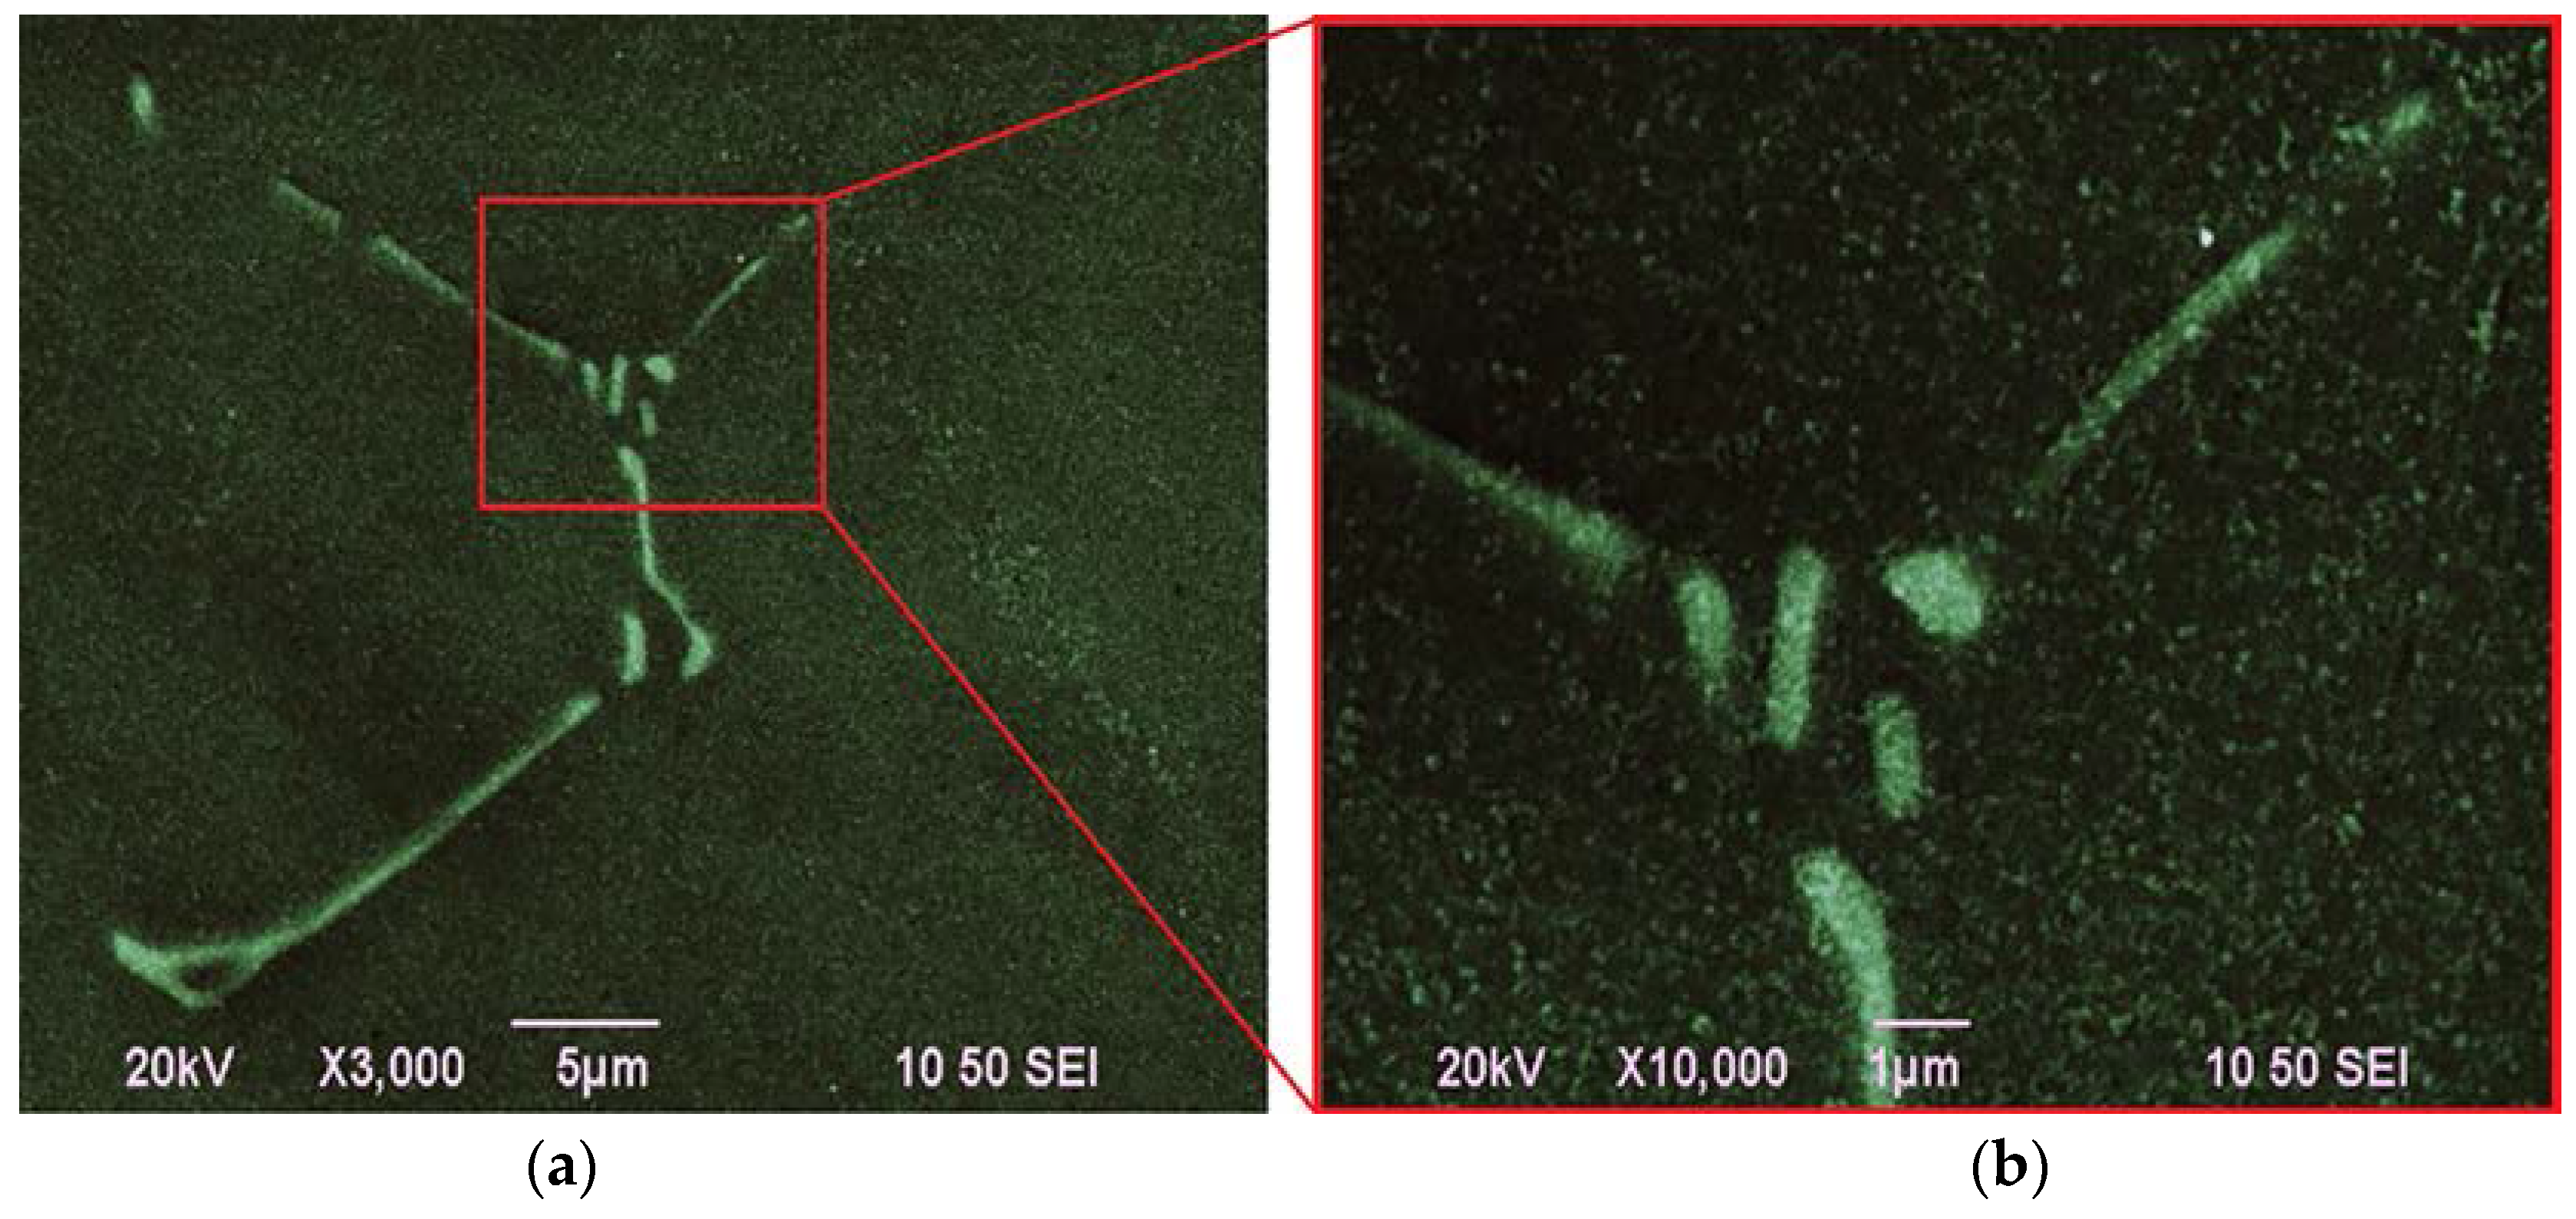
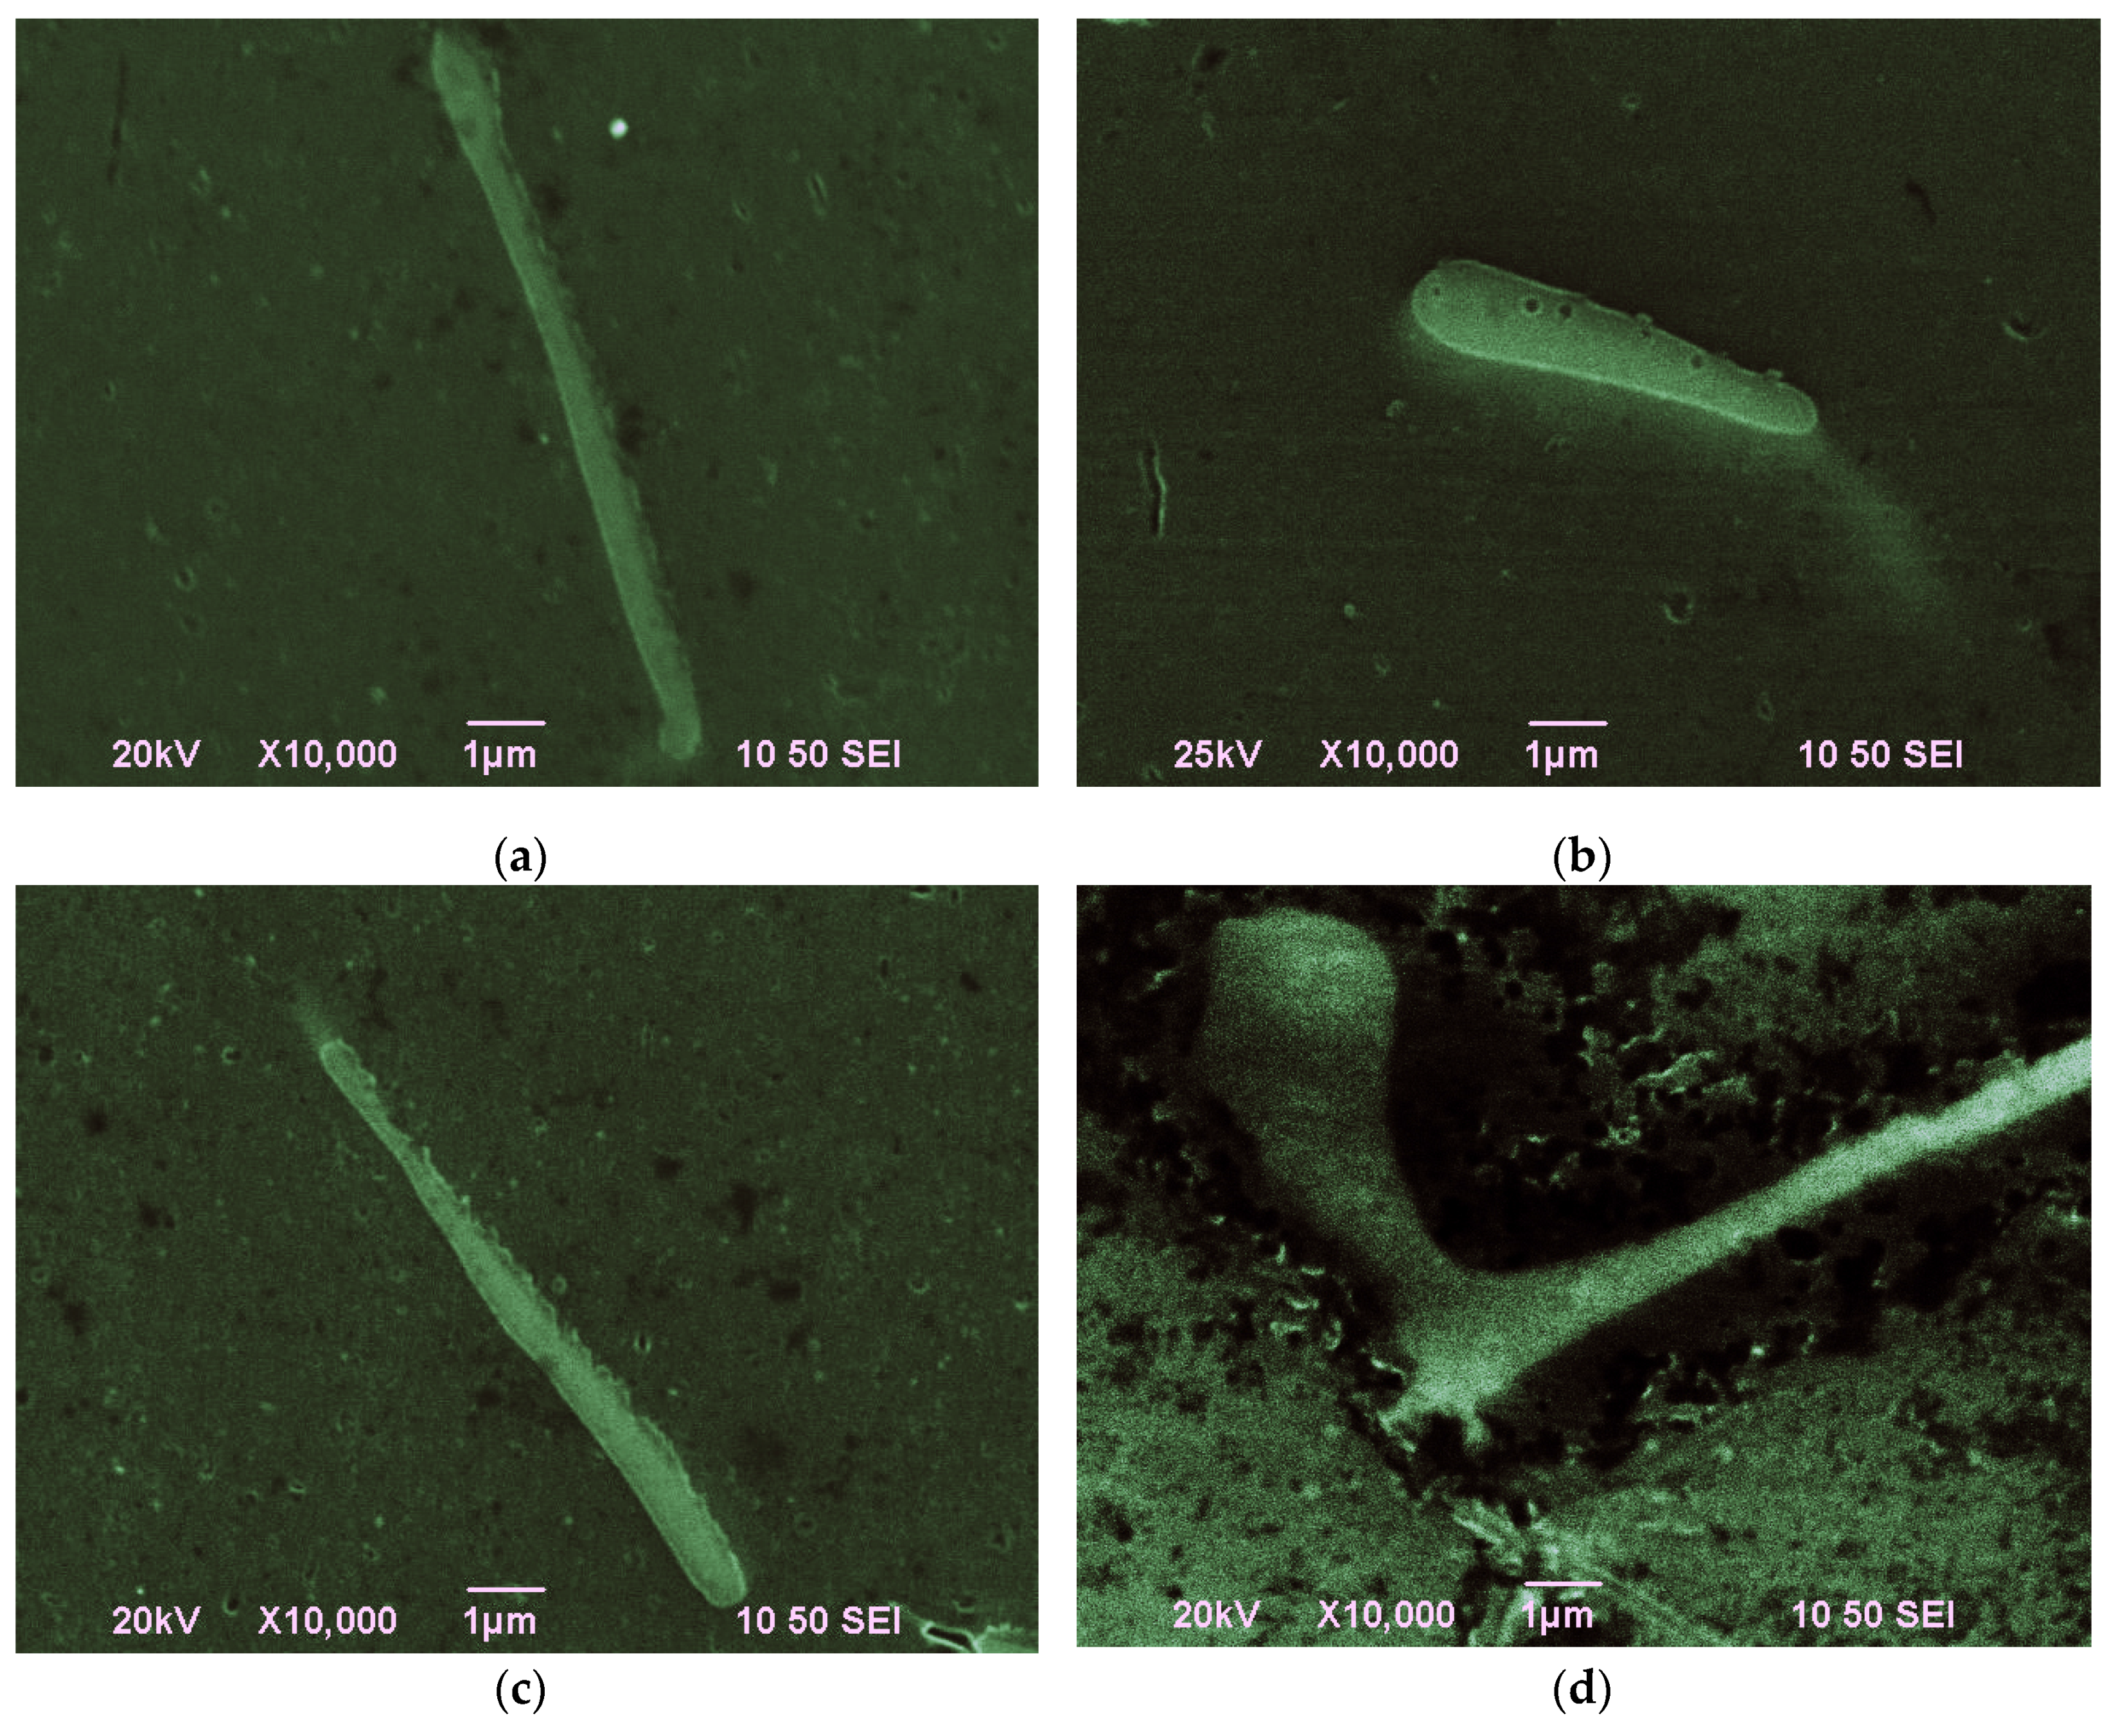
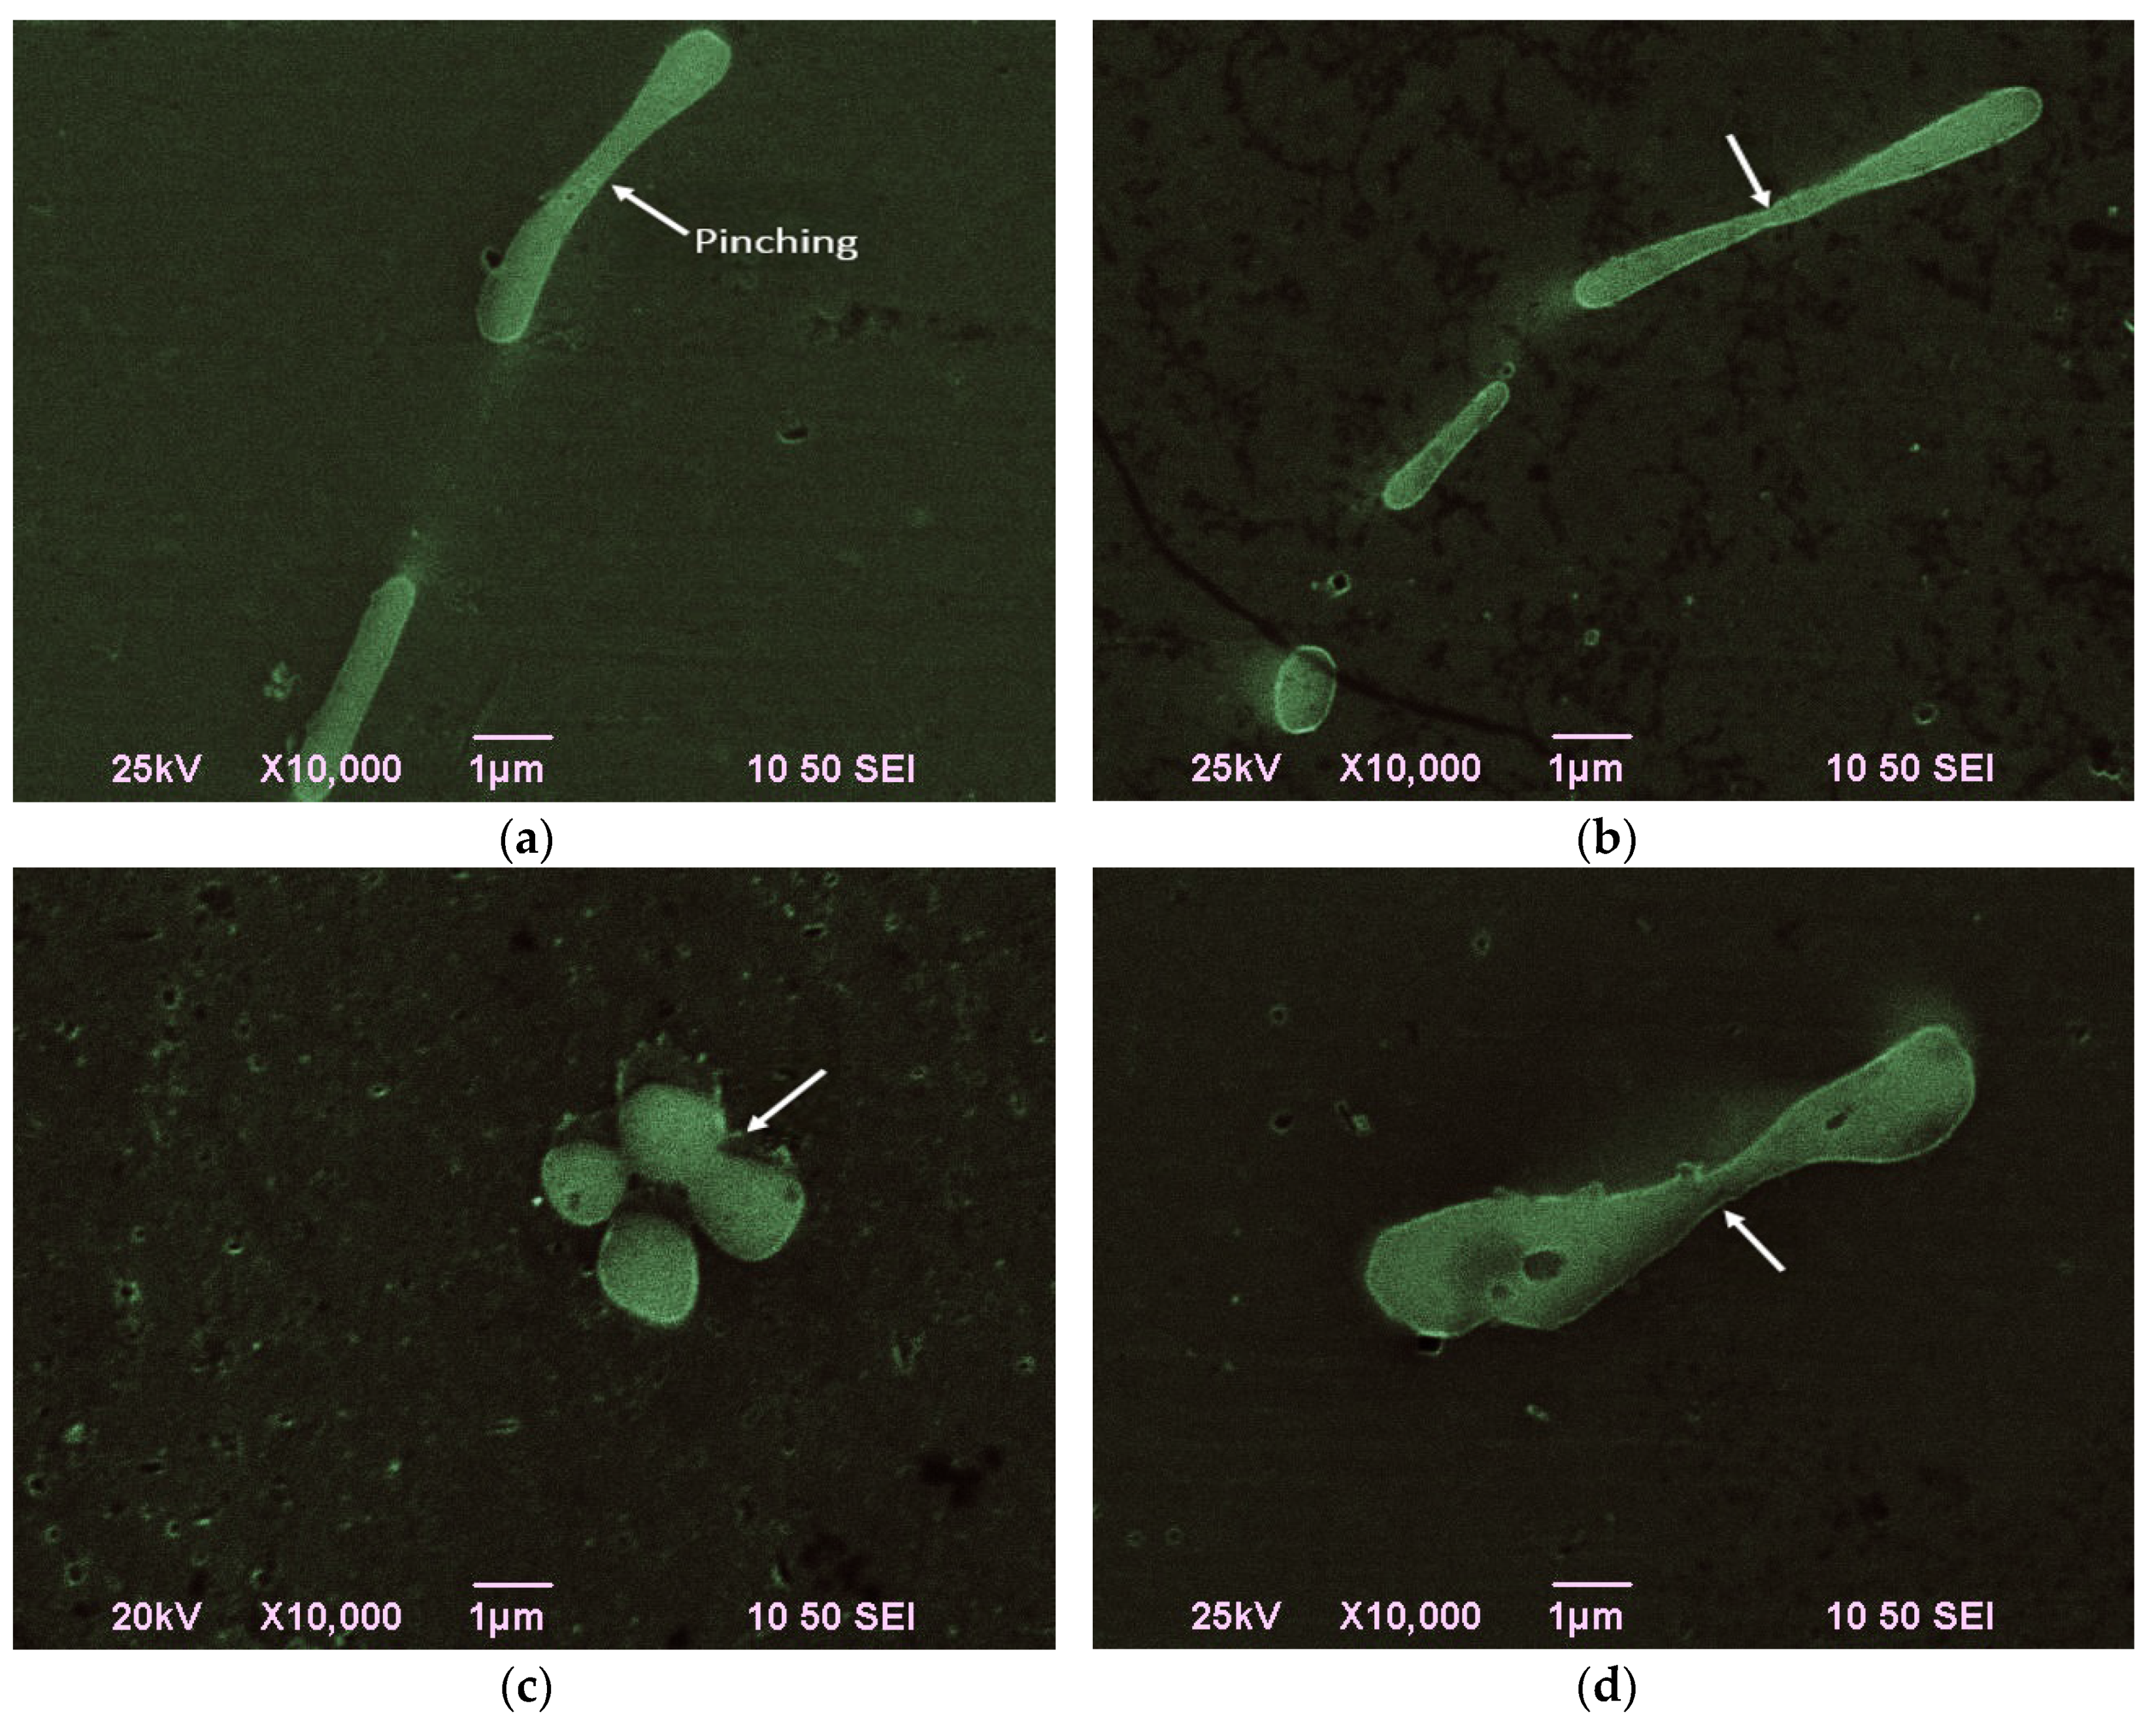
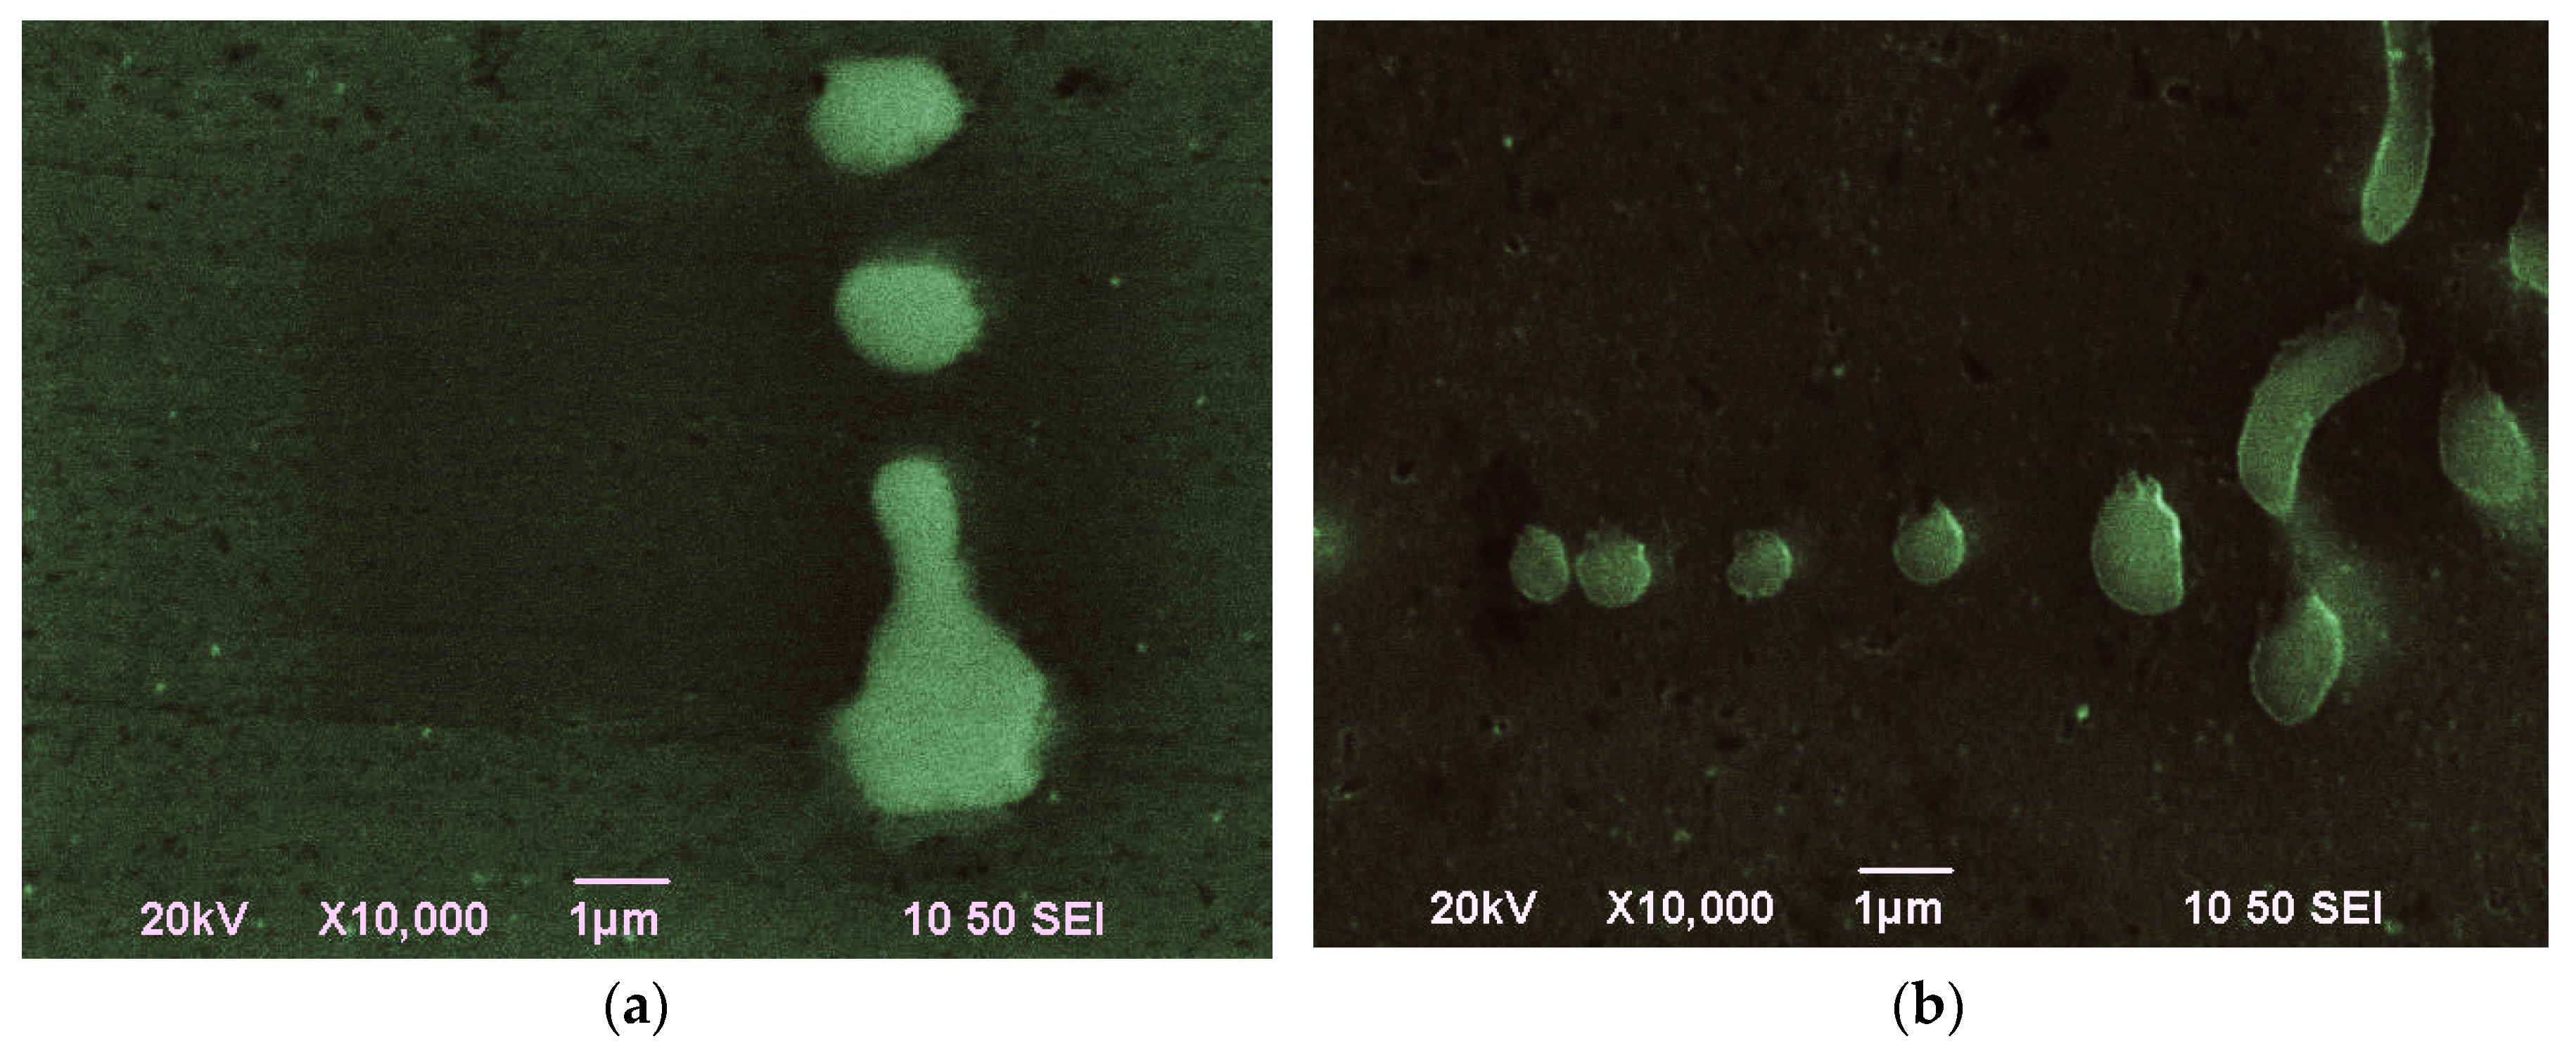
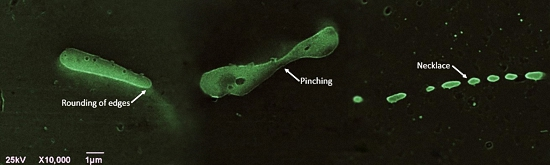
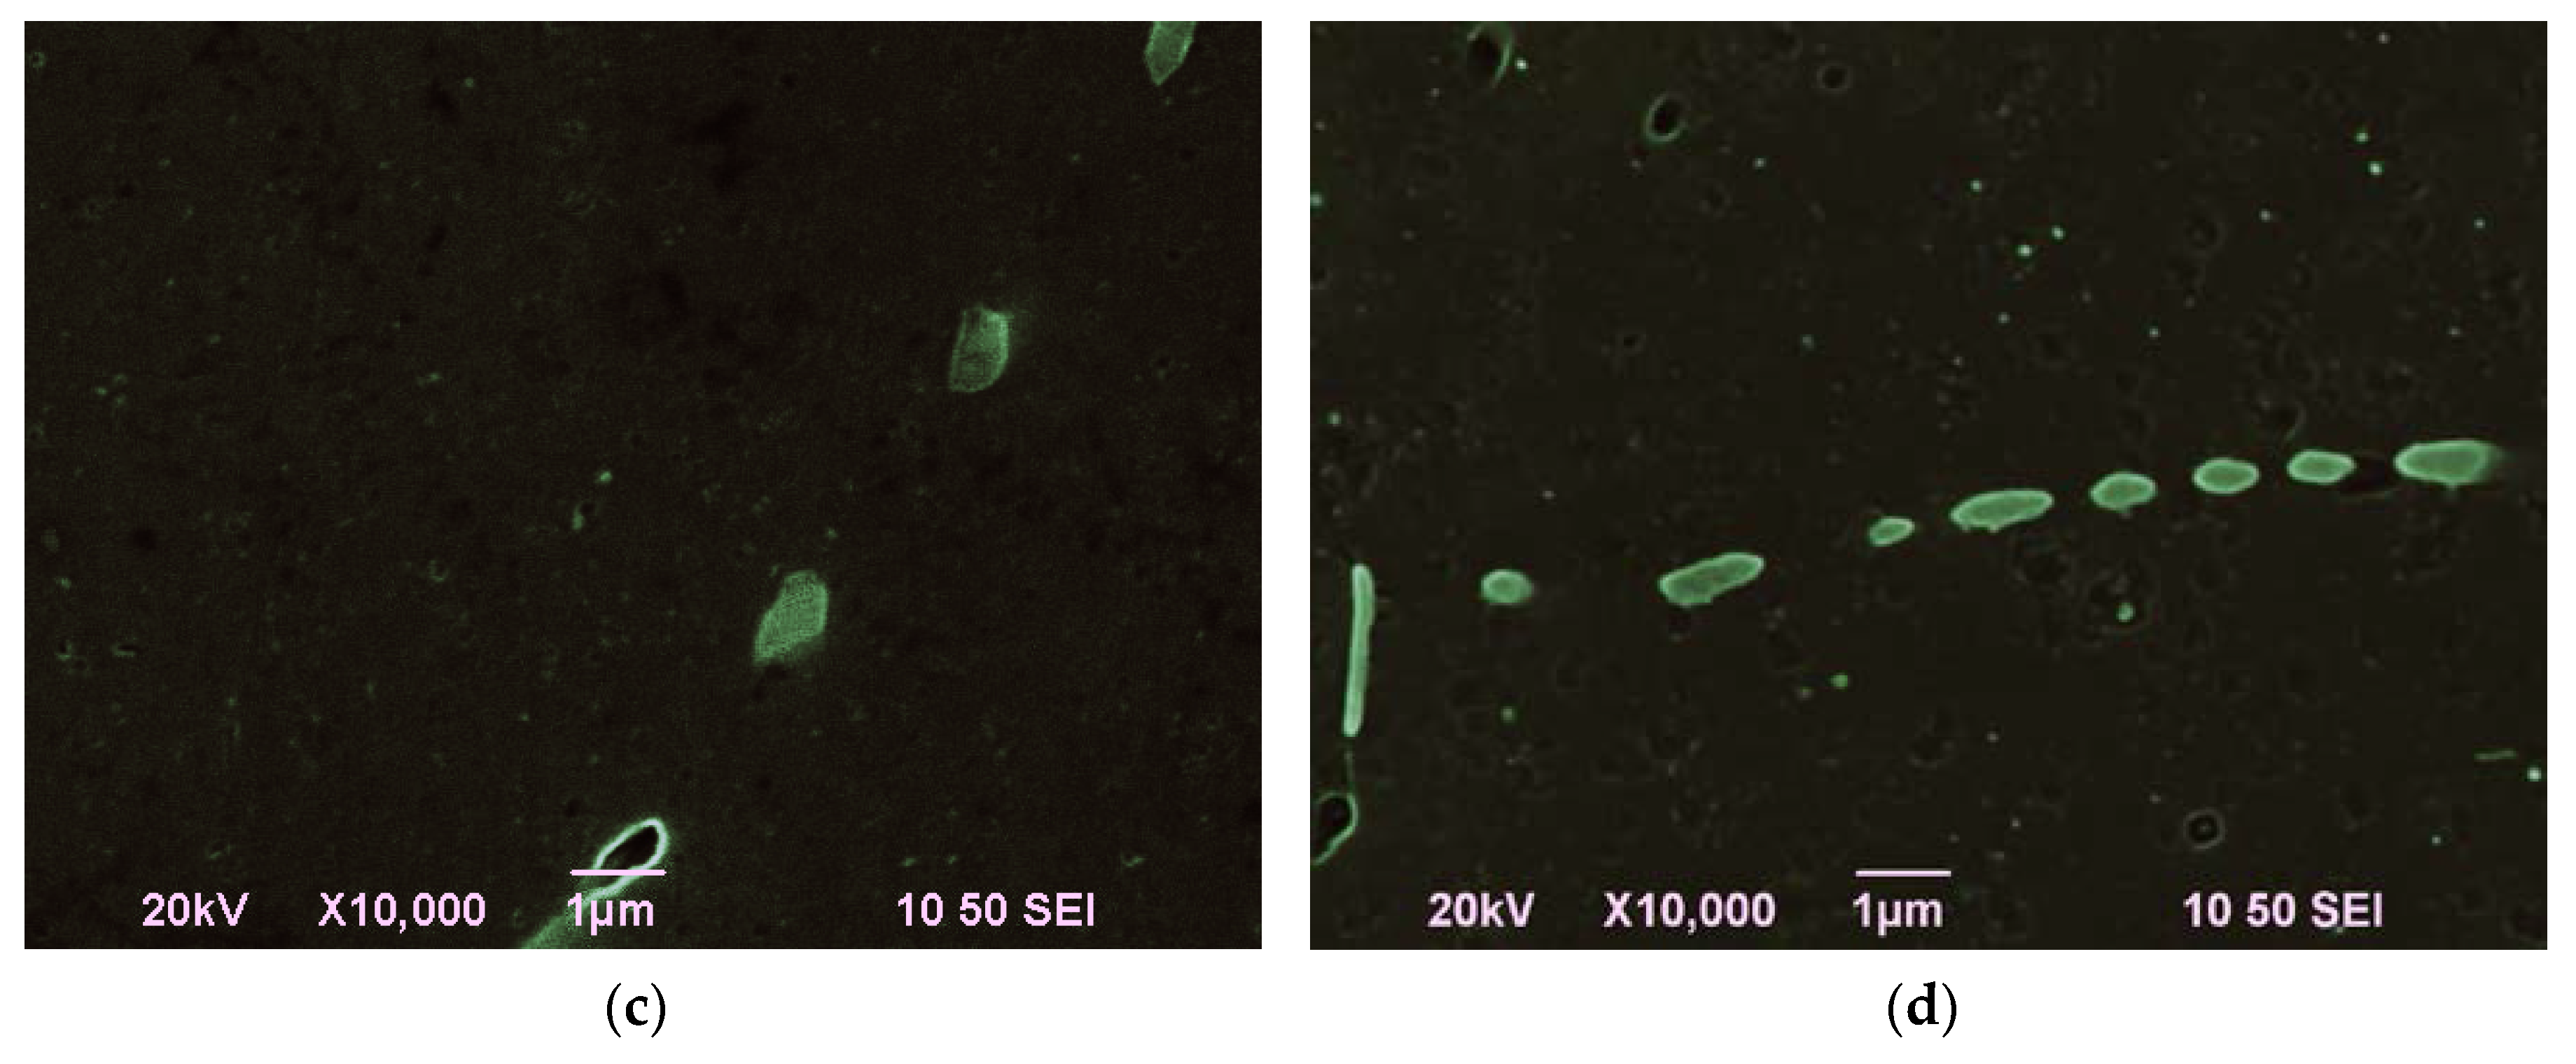
  • The α-AlFeSi particles, after the completion of the β to α-AlFeSi transformation undergo morphological changes leading to spheroidization. This process can be divided in three stages: (1) rounding of edges, (2) particle pinching, and (3) necklace formation.
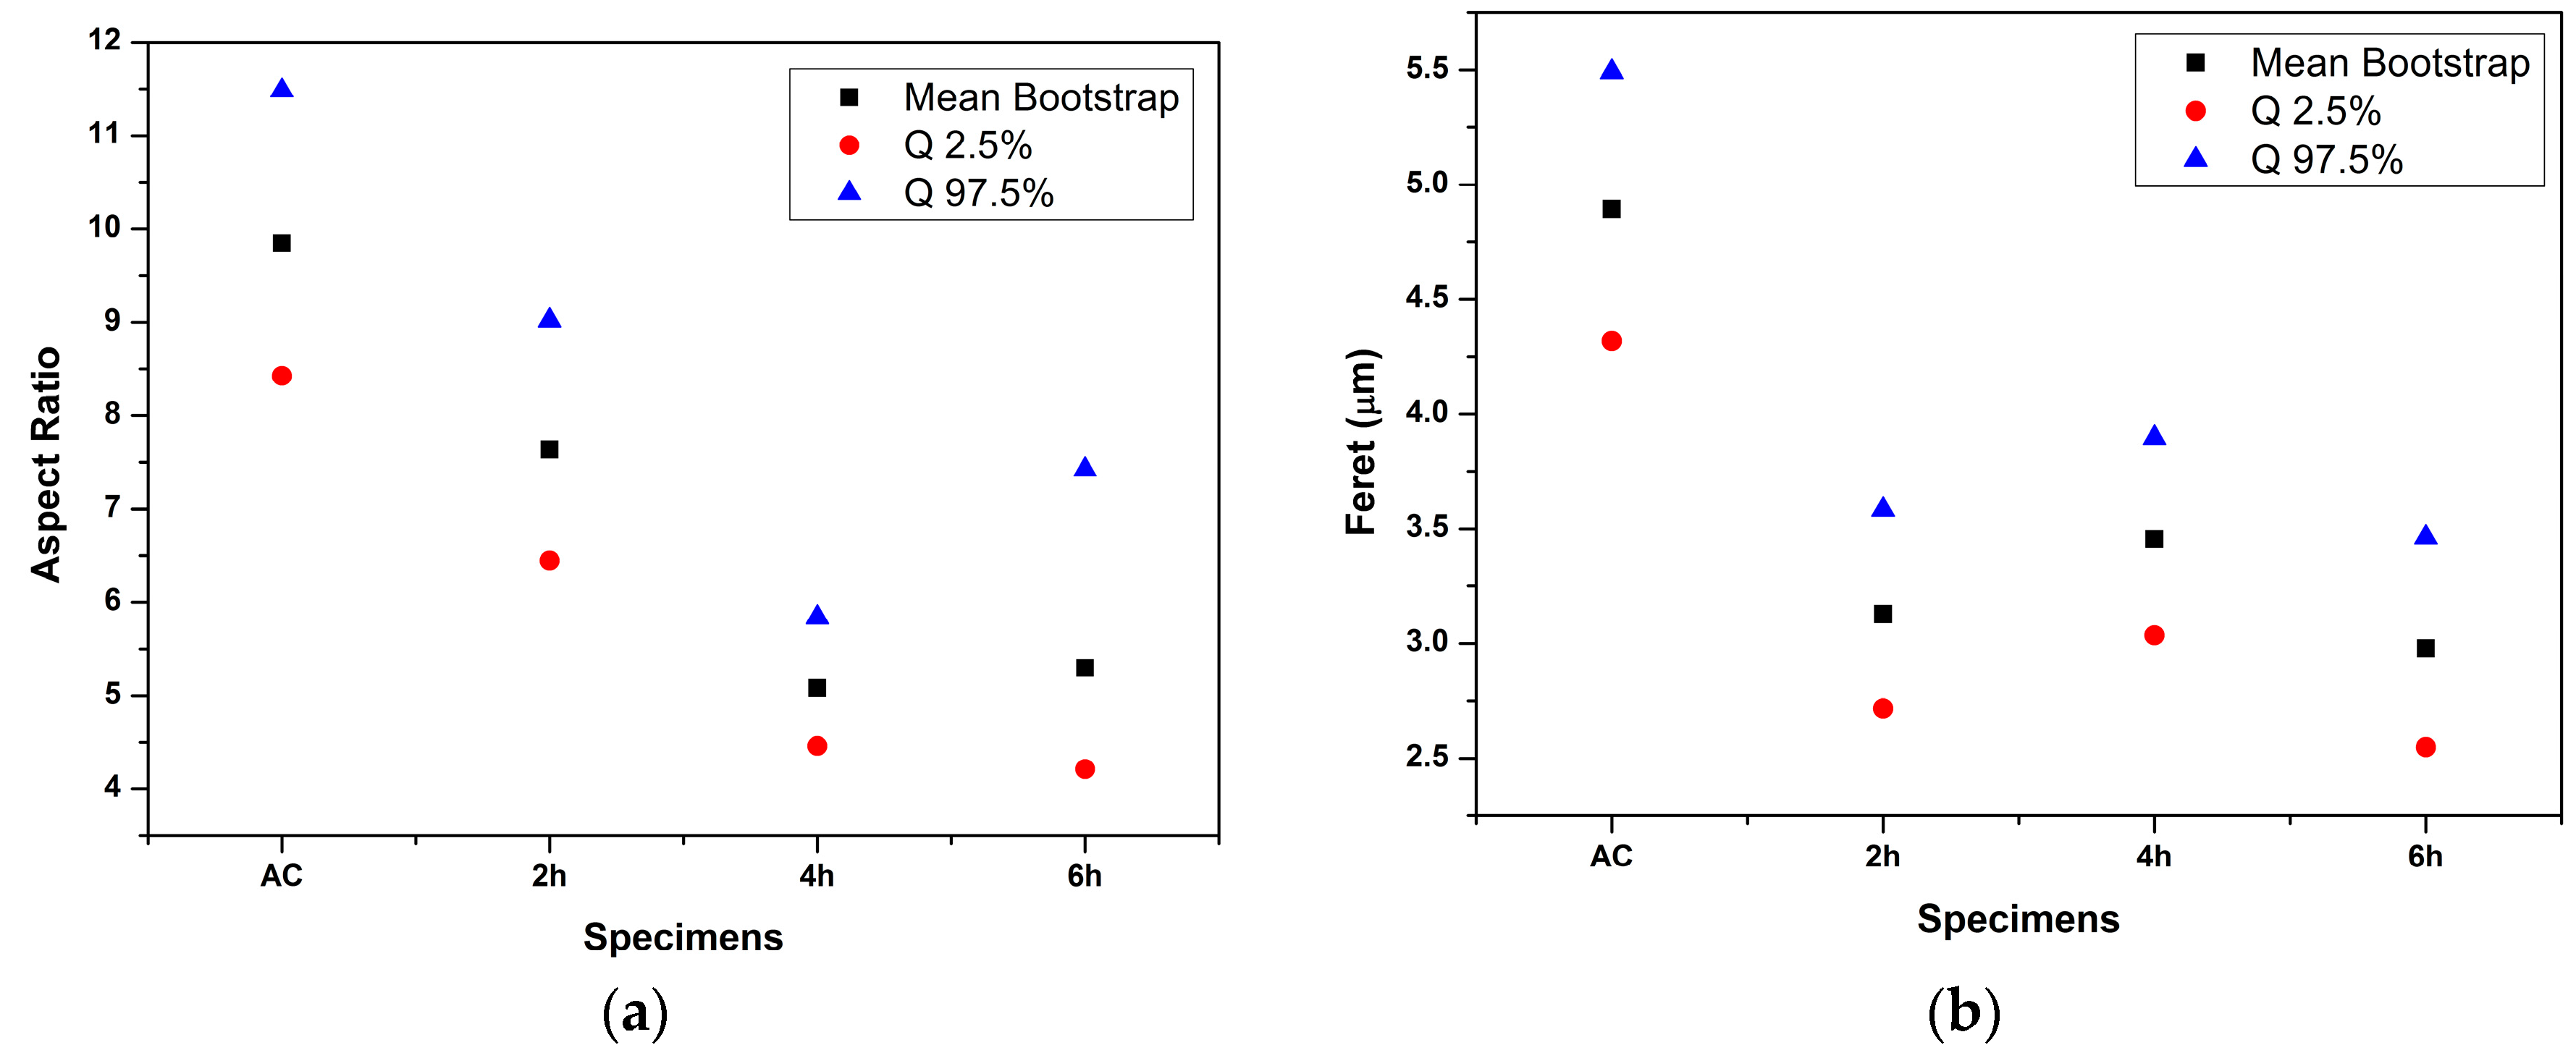
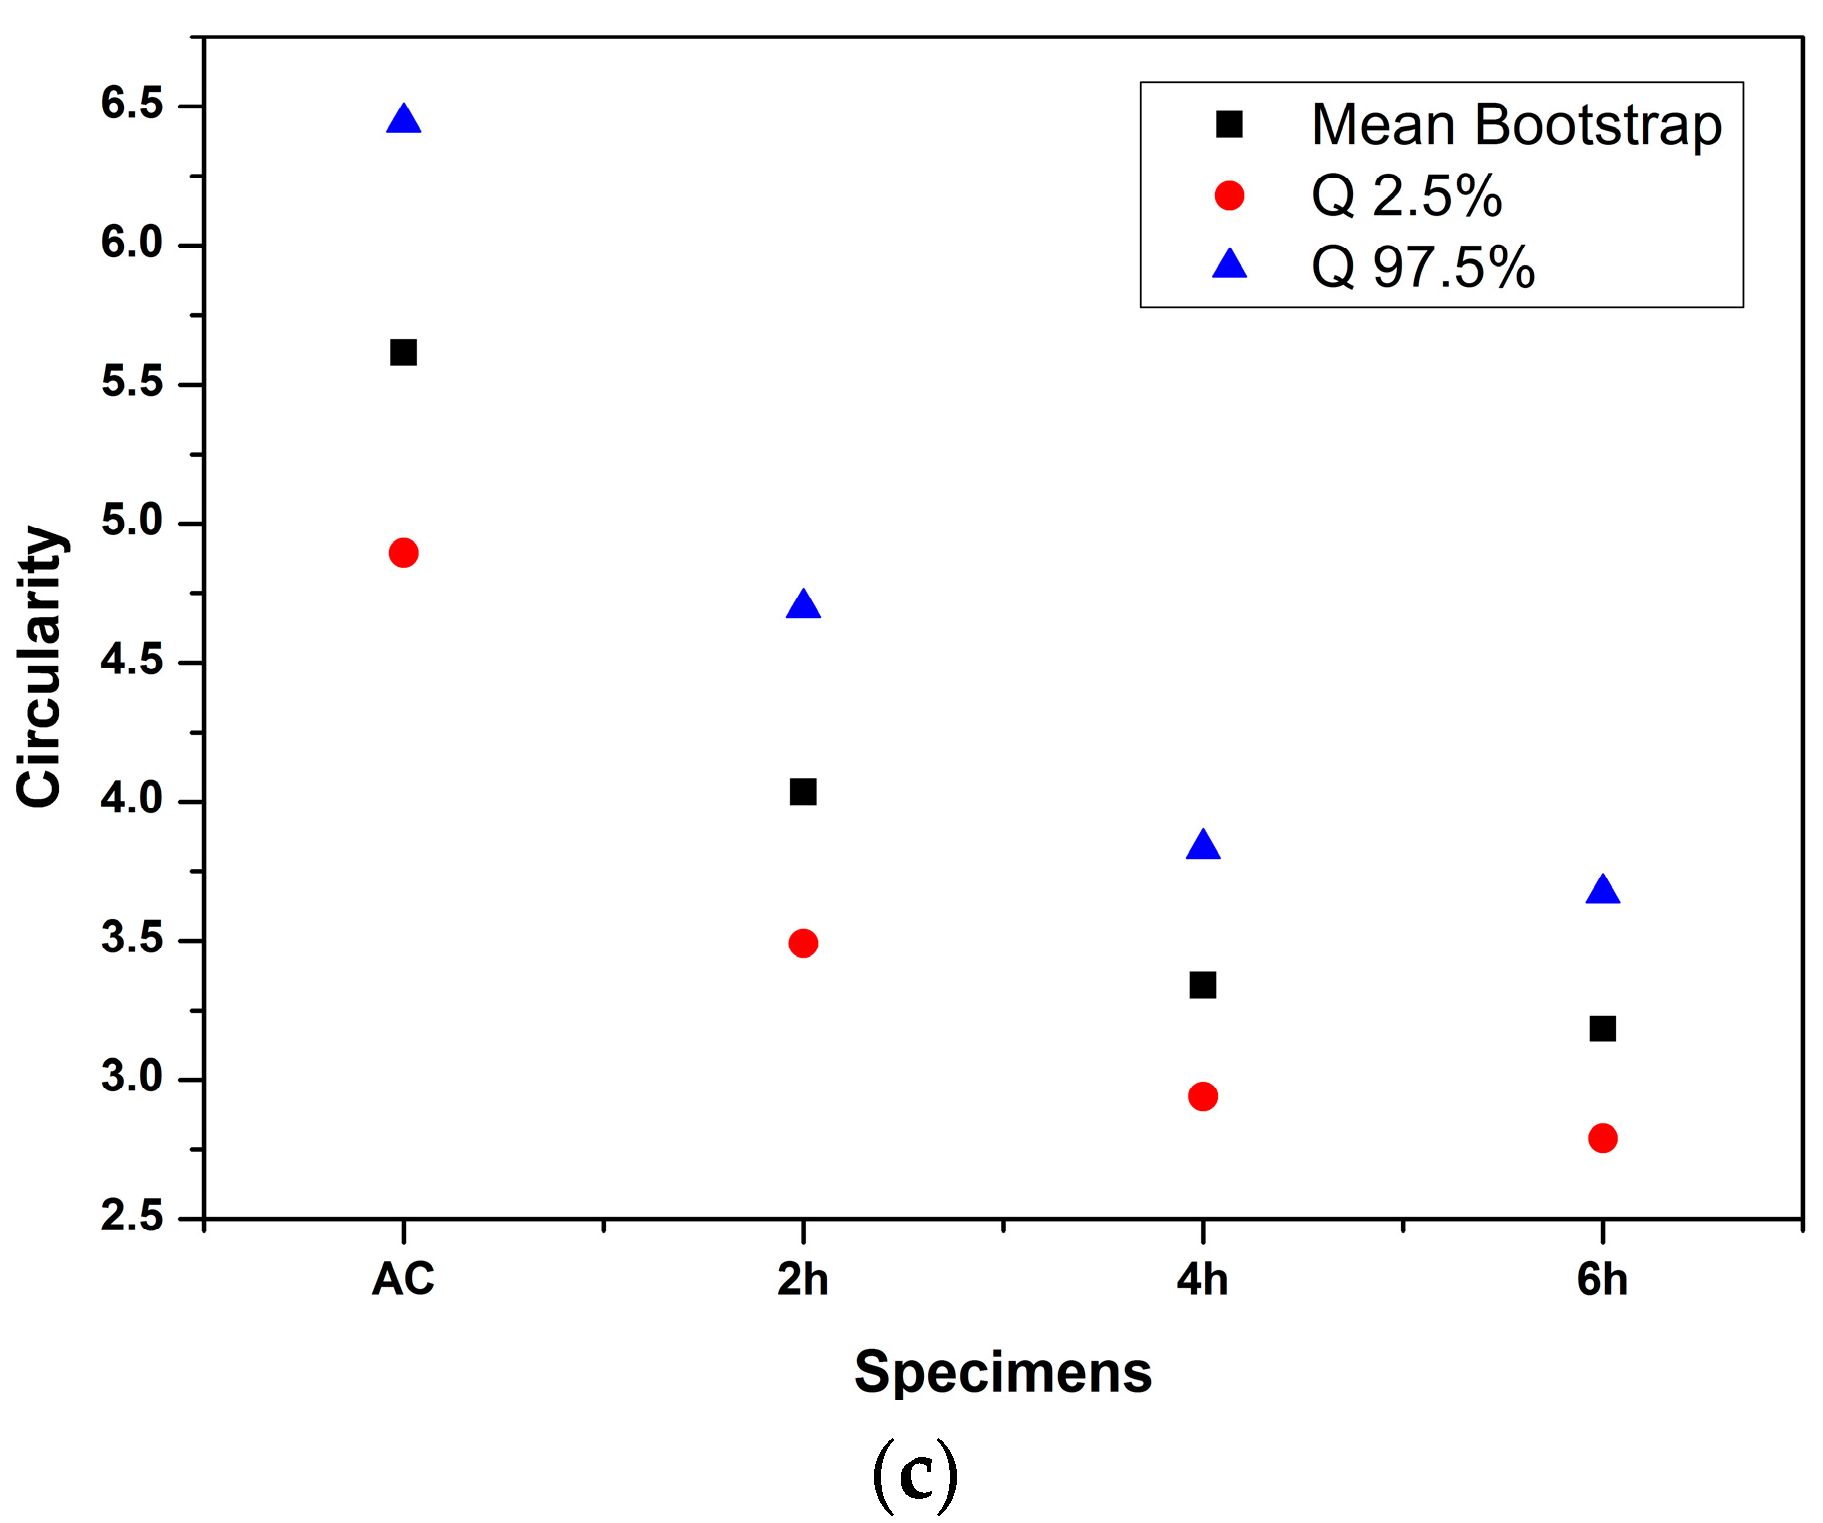
  • The evolution of the morphological changes can be described quantitatively by the use of indices, such as aspect ratio, feret and circularity, which are sensitive to homogenization process parameters, such as the homogenization time.
  • The circularity index exhibited the most consistent variation with homogenization time. The lowest value of the circularity index (more circular particles) coincided with the metallographic observation for necklace formation. Shorter homogenization times resulted in intermediate stages involving rounding of edges or particle pinching.
  • The method requires the measurement of a large number of particles and the implementation of a statistical analysis in order to be credible.

Acknowledgments

Part of this work has been supported by a grant from Aluminium of Greece (AoG).

Author Contributions

P.I. Sarafoglou and G.N. Haidemenopoulos conceived and designed the experiments; P.I. Sarafoglou, M.-I.T Tzini, and J.S. Aristeidakis performed the experiments and analyzed the data; All authors contributed to the preparation of the manuscript.

Conflicts of Interest

The authors declare no conflicts of interest.

References

  1. Sheppard, T. Extrusion of Aluminum Alloys; Kluwer Academic Publishers: Dordrecht, The Netherlands, 1999. [Google Scholar]
  2. Xie, F.Y.; Kraft, T.; Zuo, Y.; Moon, C.H.; Chang, Y.A. Microstructure and microsegregation in Al-rich Al-Cu-Mg alloys. Acta Mater. 1999, 47, 489–500. [Google Scholar] [CrossRef]
  3. Robinson, J.S. Influence of retrogression and reaging on fracture toughness of 7010 aluminum alloy. Mater. Sci. Tech. Ser. 2003, 19, 1697–1701. [Google Scholar] [CrossRef]
  4. Rokhlin, L.L.; Dobatkina, T.V.; Bochvar, N.R.; Lysova, E.V. Investigation of phase equilibria in alloys of the Al-Zn-Mg-Cu-Zr-Sc system. J. Alloy. Compd. 2004, 367, 10–16. [Google Scholar] [CrossRef]
  5. Liu, Y.L.; Kang, S.B. The solidification process of Al-Mg-Si alloy. J. Mater. Sci. 1997, 32, 1443–1447. [Google Scholar] [CrossRef]
  6. Saha, P.K. Aluminum Extrusion Technology; ASM International: Metals Park, OH, USA, 2000. [Google Scholar]
  7. Mukhopadhyay, P. Alloy designation, processing and use of AA6xxx series aluminum alloys. ISRN Metall. 2012. [Google Scholar] [CrossRef]
  8. Birol, Y. The effect of homogenization practice on the microstructure of AA6063 billets. J. Mater. Process. Technol. 2004, 148, 250–258. [Google Scholar] [CrossRef]
  9. Cai, M.; Rodson, J.D.; Lorimer, G.W.; Parson, N.C. Simulation of the casting and Homogenization of two 6xxx Series Alloys. Mater. Sci. Forum 2002, 396, 209–214. [Google Scholar] [CrossRef]
  10. Usta, M.; Glicksman, M.E.; Wright, R.N. The effect of Heat Treatment on Mg2Si Coarsening in Aluminum 6105 Alloy. Metall. Mater. Trans. A 2004, 35, 435–438. [Google Scholar] [CrossRef]
  11. Van de Langkruis, J. The effect of thermal treatments on the extrusion behaviour of AlMgSi alloys. Ph.D. Thesis, Technical University of Delft, Delft, The Netherlands, June 2000. [Google Scholar]
  12. Kuijpers, N.C.W.; Vermolen, F.J.; Vuik, K.; van der Zwaag, S. A model of the β-AlFeSi to α-Al(FeMn)Si transformation in Al-Mg-Si alloys. Mater. Trans. 2003, 44, 1448–1456. [Google Scholar] [CrossRef]
  13. Kuijpers, N.C.W.; Vermolen, F.J.; Vuik, C.; Koenis, P.T.G.; Nilsen, K.E.; van der Zwaag, S. The dependence of the β-AlFeSi to α-Al(FeMn)Si transformation kinetics in Al-Mg-Si alloys on the alloying elements. Mater. Sci. Eng. A 2005, 394, 9–19. [Google Scholar] [CrossRef]
  14. Haidemenopoulos, G.N.; Kamoutsi, H.; Zervaki, A.D. Simulation of the transformation of iron intermetallics during homogenization of 6xx series extrudable aluminum alloys. J. Mater. Process. Technol. 2012, 212, 2255–2260. [Google Scholar] [CrossRef]
  15. Eivani, A.R.; Ahmed, H.; Zhou, J.; Duszczyk, J. Evolution of Grain Boundary Phases during the Homogenization of AA7020 Aluminum Alloy. Metall. Mater. Trans. A 2009, 40, 717–728. [Google Scholar] [CrossRef]
  16. Eivani, A.R.; Ahmed, H.; Zhou, J.; Duszczyk, J. Correlation between Electrical Resistivity, Particle Dissolution, Precipitation of Dispersoids, and Recrystallization Behavior of AA7020 Aluminum Alloy. Metall. Mater. Trans. A 2009, 40, 2435–2446. [Google Scholar] [CrossRef]
  17. Eivani, A.R.; Ahmed, H.; Zhou, J.; Duszczyk, J. Modelling dissolution of low melting point phases during the homogenisation of AA7020 aluminium alloy. Mater. Sci. Technol. 2010, 26, 215–222. [Google Scholar] [CrossRef]
  18. Robson, J.D.; Prangnell, P.B. Dispersoid precipitation and process modelling in zirconium containing commercial aluminium alloys. Acta Mater. 2001, 49, 599–613. [Google Scholar] [CrossRef]
  19. Fan, X.; Jiang, D.; Meng, Q.; Zhong, L. The microstructural evolution of an Al-Zn-Mg-Cu alloy during homogenization. Mater. Lett. 2006, 60, 1475–1479. [Google Scholar] [CrossRef]
  20. Kuijpers, N.C.W.; Tirel, J.; Hanlon, D.N.; van der Zwaag, S. Quantification of the evolution of the 3D intermetallic structure in a 6005A aluminium alloy during a homogenisation treatment. Mater. Charact. 2002, 48, 379–392. [Google Scholar] [CrossRef]
  21. ASTM Specification F1877 Standard Practice for Characterization of Particles; ASTM International: Philadelphia, PA, USA, 1998. [CrossRef]
  22. Wayne, D. Applied Nonparametric Statistics, 2nd ed.; Cengage Learning: Andover, UK, 2000; pp. 226–234. [Google Scholar]
  23. Efron, B.; Tibshirani, R.J. An Introduction to the Bootstrap, 1st ed.; Chapman & Hall/CRC: London, UK, 1993; pp. 1–16. [Google Scholar]
Figure 1. SEM image used for the measurement of indices: (a) low magnification image; (b) high magnification isolation of the group of particles; (c) image J display used for the measurement of indices.
Metals 06 00121 g001aMetals 06 00121 g001b
Figure 2. Metallographic images: as-cast (a); homogenized at 560 °C (b) and (c) for 2 h; (d) and (e) for 4 h; (f) and (g) for 6 h.
Metals 06 00121 g002
Figure 3. Images indicating the rounding of the edges of the particles after 2 h holding time. (a) Long elongated particle; (b) short particle; (c) elongated particle and (d) particle with segment.
Metals 06 00121 g003
Figure 4. Images revealing the pinching process after 4 h holding time. (a) Local reduction of thickness; (b) pinching at advanced stage with seperation and local thickness reduction; (c) pinching in spherical particles; (d) local necking leading to pinching of a particle.
Metals 06 00121 g004
Figure 5. Images revealing the spheroidization and necklace formation after 6 h holding time. (a) Pinching leading to particle separation; (b) separated particles; (c) isolated particles after pinching; (d) neclace formation (aligned particles).
Metals 06 00121 g005aMetals 06 00121 g005b
Figure 6. The values of indices for the as-cast and after homogenization time 2 h, 4 h, and 6 h: (a) aspect ratio; (b) feret; (c) circularity.
Metals 06 00121 g006aMetals 06 00121 g006b
Table 1. Chemical composition and homogenization conditions for the 6060 alloy.
Chemical Composition (wt. %)Temperature (°C)Time (h)
AlBal.5602
Mg0.38
Si0.44
Fe0.26
Mn0.03
Table 2. The number of images processed and the number of particles measured for each condition.
AlloyNumber of ImagesNumber of Particles
As-cast58106
2 h57161
4 h56150
6 h58133
Table 3. The indices employed for the quantification of the homogenization state.
Aspect RatioFeretCircularity
A ratio of the major to the minor diameter of a particle, where dmax and dmin correspond to the longest and the shortest lines passing through the centroidThe longest caliper lengthCircularity is a measure of how closely a particle resembles a circle. It varies from zero to one with a perfect circle having a value of one
A R = d max d min F C = p 2 4 π A
Metals 06 00121 i001 Metals 06 00121 i002 Metals 06 00121 i003
Table 4. Respective measurements for each particle referring to Figure 1c. Indices AR, C, and F correspond to the aspect ratio, circularity, and feret of the measured particles respectively. Accordingly, dmax and dmin are the major and minor diameters, p is the perimeter and A is the area of particles (refer to Table 3).
No.dmax/μmdmin/μmARp/μmA/μm2CF/μm
13.6550.3769.7208.4051.0835.1903.656
23.2890.3798.6787.4270.8445.2003.308
31.7920.3894.6064.3950.7352.1031.793
41.0690.5342.0012.8200.4411.4331.068
51.1230.6321.7763.0800.5241.4391.160
60.9760.4891.9952.7120.4231.3841.000

