4. Results and Discussion
Using the property prediction model developed above and the experimentally/empirically determined values of parameters contained in
Table 1,
Figure 3,
Figure 4,
Figure 5,
Figure 6 and
Figure 7 present the predicted property values in comparison to the results obtained from the tensile tests of Al-A319 alloys. In
Table 1, the parameters (Ψ,
Cy,
Cfail, and
Qfail) in the shaded boxes were empirically-determined and all other parameters were experimentally determined.
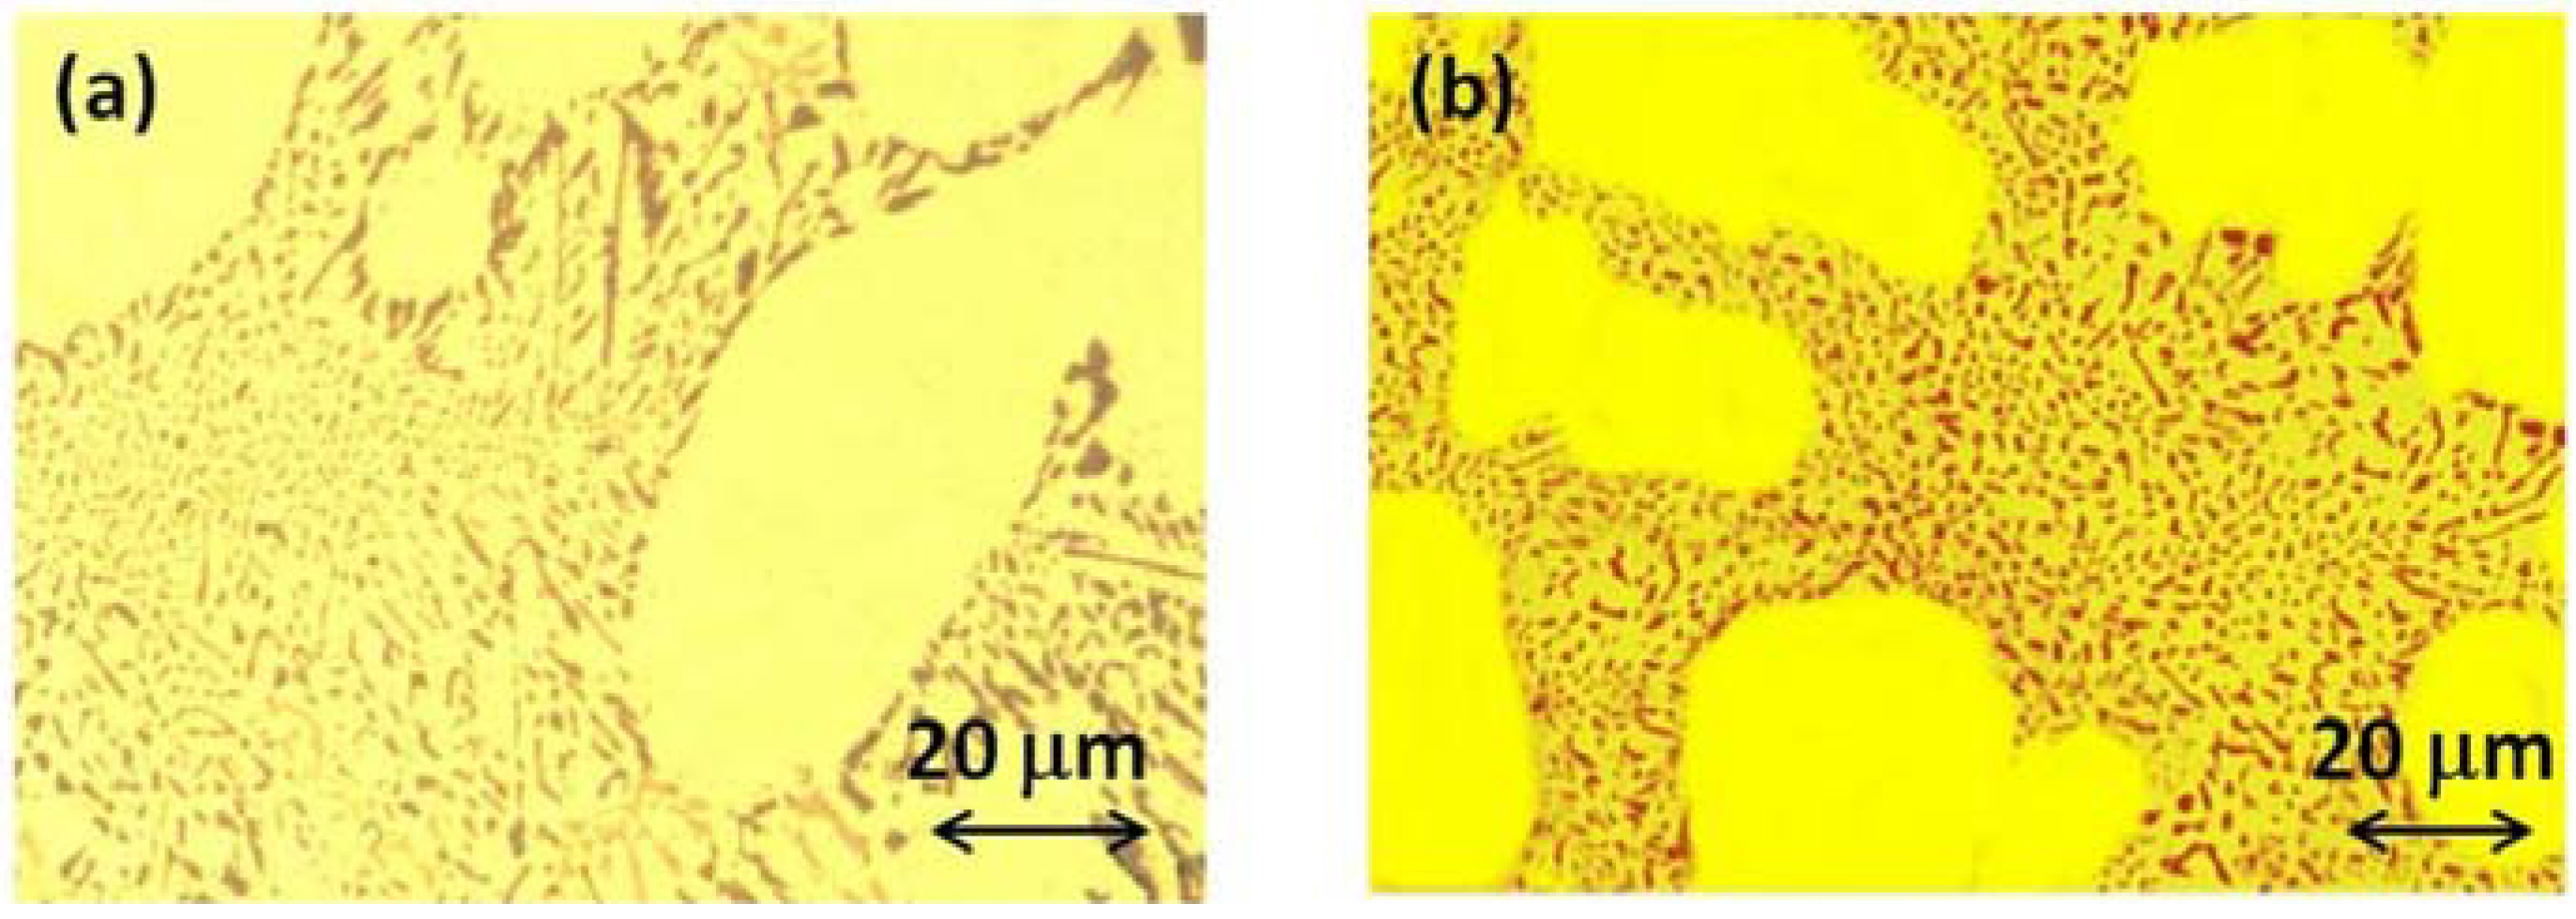
It is important to note that the Al-A319 chemical composition is such that many different types of intermetallics are evolved during solidification, some of which can be dissolved by a solutionizing heat treatment and others (especially Fe-containing species) that cannot [
8,
14]. Rincon
et al. [
8,
14] have shown that these brittle intermetallics can be large and significantly degrade tensile properties due to their tendency to initiate and propagate cracks. In Al-A319 in particular, and precipitation-hardenable alloys in general, the as-cast condition is likely to have a variety of intermetallics that are non-uniformly distributed throughout the material. This is due to differences in cooling rates in various parts of the casting, which causes differing degrees of concentration gradients during the solidification. Differences in cooling rate will also result in variability in grain size and grain morphology. Both of these factors will affect the mechanical properties. Therefore, it is to be expected that the material properties of the as-cast metal will possess the most variability. Material in the W condition would be expected to show less variability due to the homogenizing effect of the solutionizing treatment, where some intermetallics are dissolved, and differences in grain sizes are to a certain extent evened out. The material in the T7 condition would be expected to show the least variability in mechanical properties, because (i) it has undergone the solutionizing heat treatment to form more homogenous microstructure; and (ii) it derives its strength primarily from the Orowan strengthening mechanism [
15], which depends on concentration, size, and distribution of nanoscopic precipitates—making it relatively insensitive to grain size effects on the yield stress of alloys.
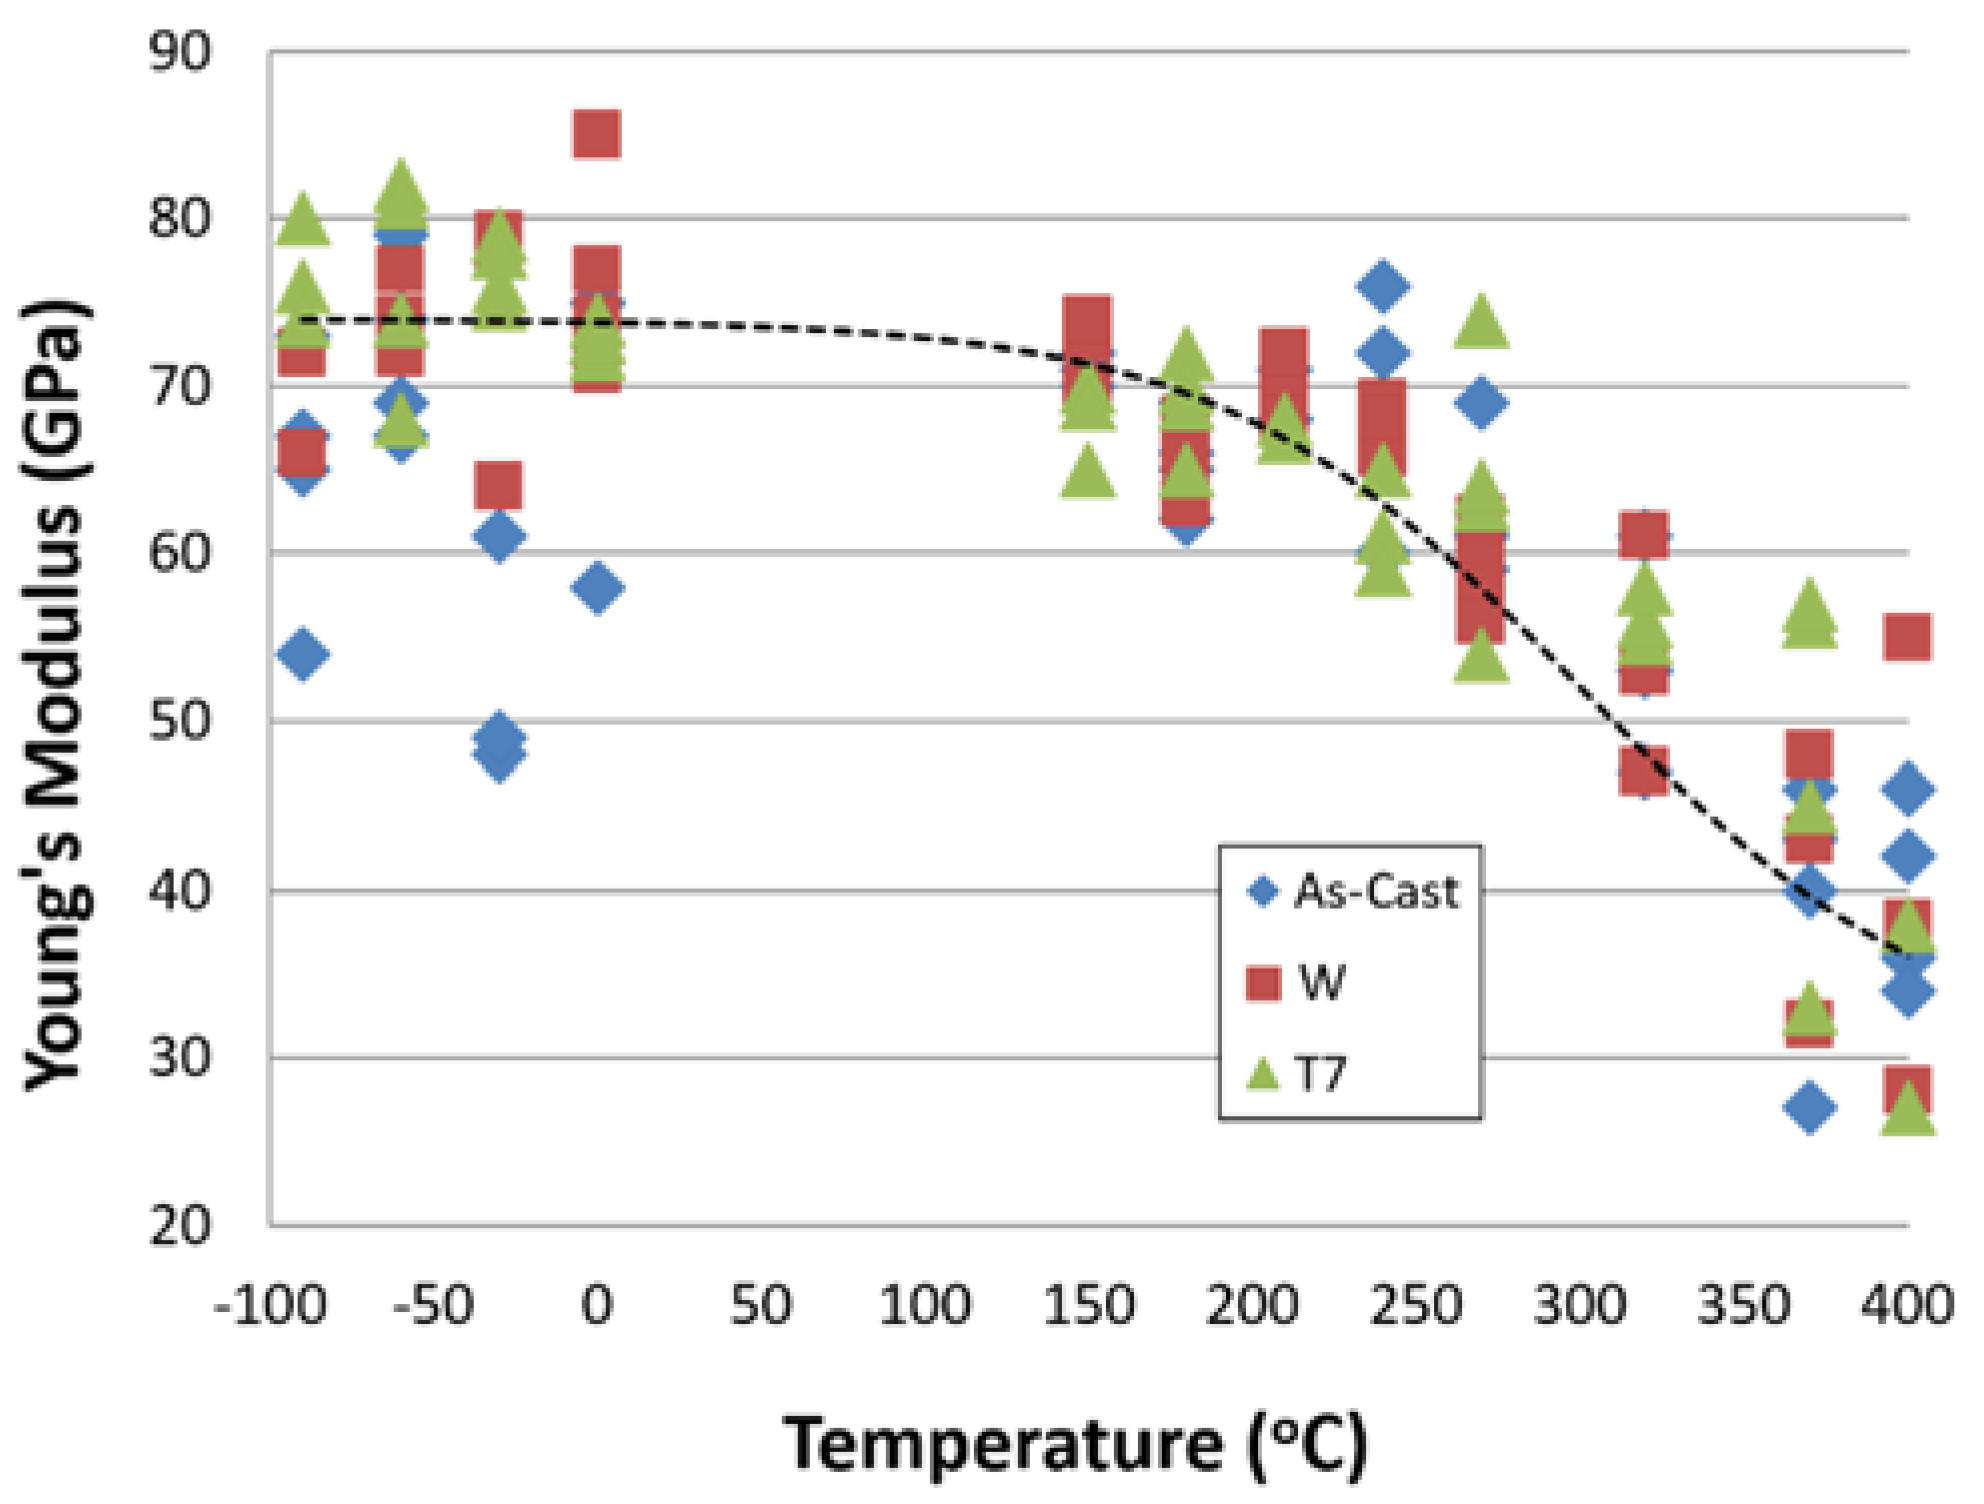
Figure 3 shows the temperature-dependence of Young’s modulus for Al-A319 alloys in various heat treatment conditions. In the figure, the symbols and dashed curve represent experimental data and the prediction of the model using Equation (1), respectively. It should be noted that in the case of the Young’s modulus of Al-A319, the scatter in the data does not allow for the adequate determination of the slight linear decrease in Young’s modulus (Δ
Y/Δ
T = 0). Therefore, to include a more marked non-linearity in Equation (1), Δ
Y/Δ
T was set to 0 for all heat treatment conditions. Also, because the modulus did not decrease with decreasing temperature below room temperatures, we selected
Y0 (=
YLT) as the nominal modulus of Al-319,
i.e., 74 GPa. The Young’s modulus at HT was assumed as the
YHT at
Tsolidus and was asymptotically extrapolated based on the experimental measurement data (
i.e.,
YHT ≈ 30 GPa). The alloy softening temperature (
T*) was set as 300 °C for all of the Al-A319 alloy systems tested in the present study [
8]. The transition parameter (Ψ) of the logistic function is the only empirical parameter to describe the temperature-dependent behaviors of the Young’s modulus. As shown in
Figure 3, the experimental measurements exhibit considerable scatter in the Young’s modulus. In particular, the Young’s moduli of the as-cast sample show large variations, and the measured values sometimes display a decreasing trend with decreasing temperatures, which can be explained by the inhomogeneous non-uniform distributions of intermetallics as addressed in the previous paragraph. Though there is considerable scatter in the modulus data,
Figure 3 shows that Equation (1) with the empirically determined transition parameter (Ψ) value of 55 °C provides an adequate description of the temperature-dependent behavior of the material. Due to the scatter, it was not feasible to determine if Young’s modulus depends significantly on the heat treatment conditions. A significant difference in the modulus would only be expected if (i) the various intermetallic or dispersed phases in the different heat treated materials are substantially more or less stiff than the metallic phase; and (ii) the intermetallics are present in sufficient concentrations that they have a non-negligible effect. Examination of microstructures with different heat treatment conditions did not show such difference. Further, from
Figure 3, it is clear that any obvious trend is not observed among the as-cast, W, and, T7 samples. In addition, because the Young’s modulus used in Equations (2) and (3) to predict the yield (σ
t−y) and failures stresses (σ
t−fail) will demonstrate below that these predictions are seemingly accurate, the assumption that Young’s modulus is roughly independent of the heat treatment conditions seems justified as a first approximation, at least in the case of Al-A319 alloys considered in the present work.
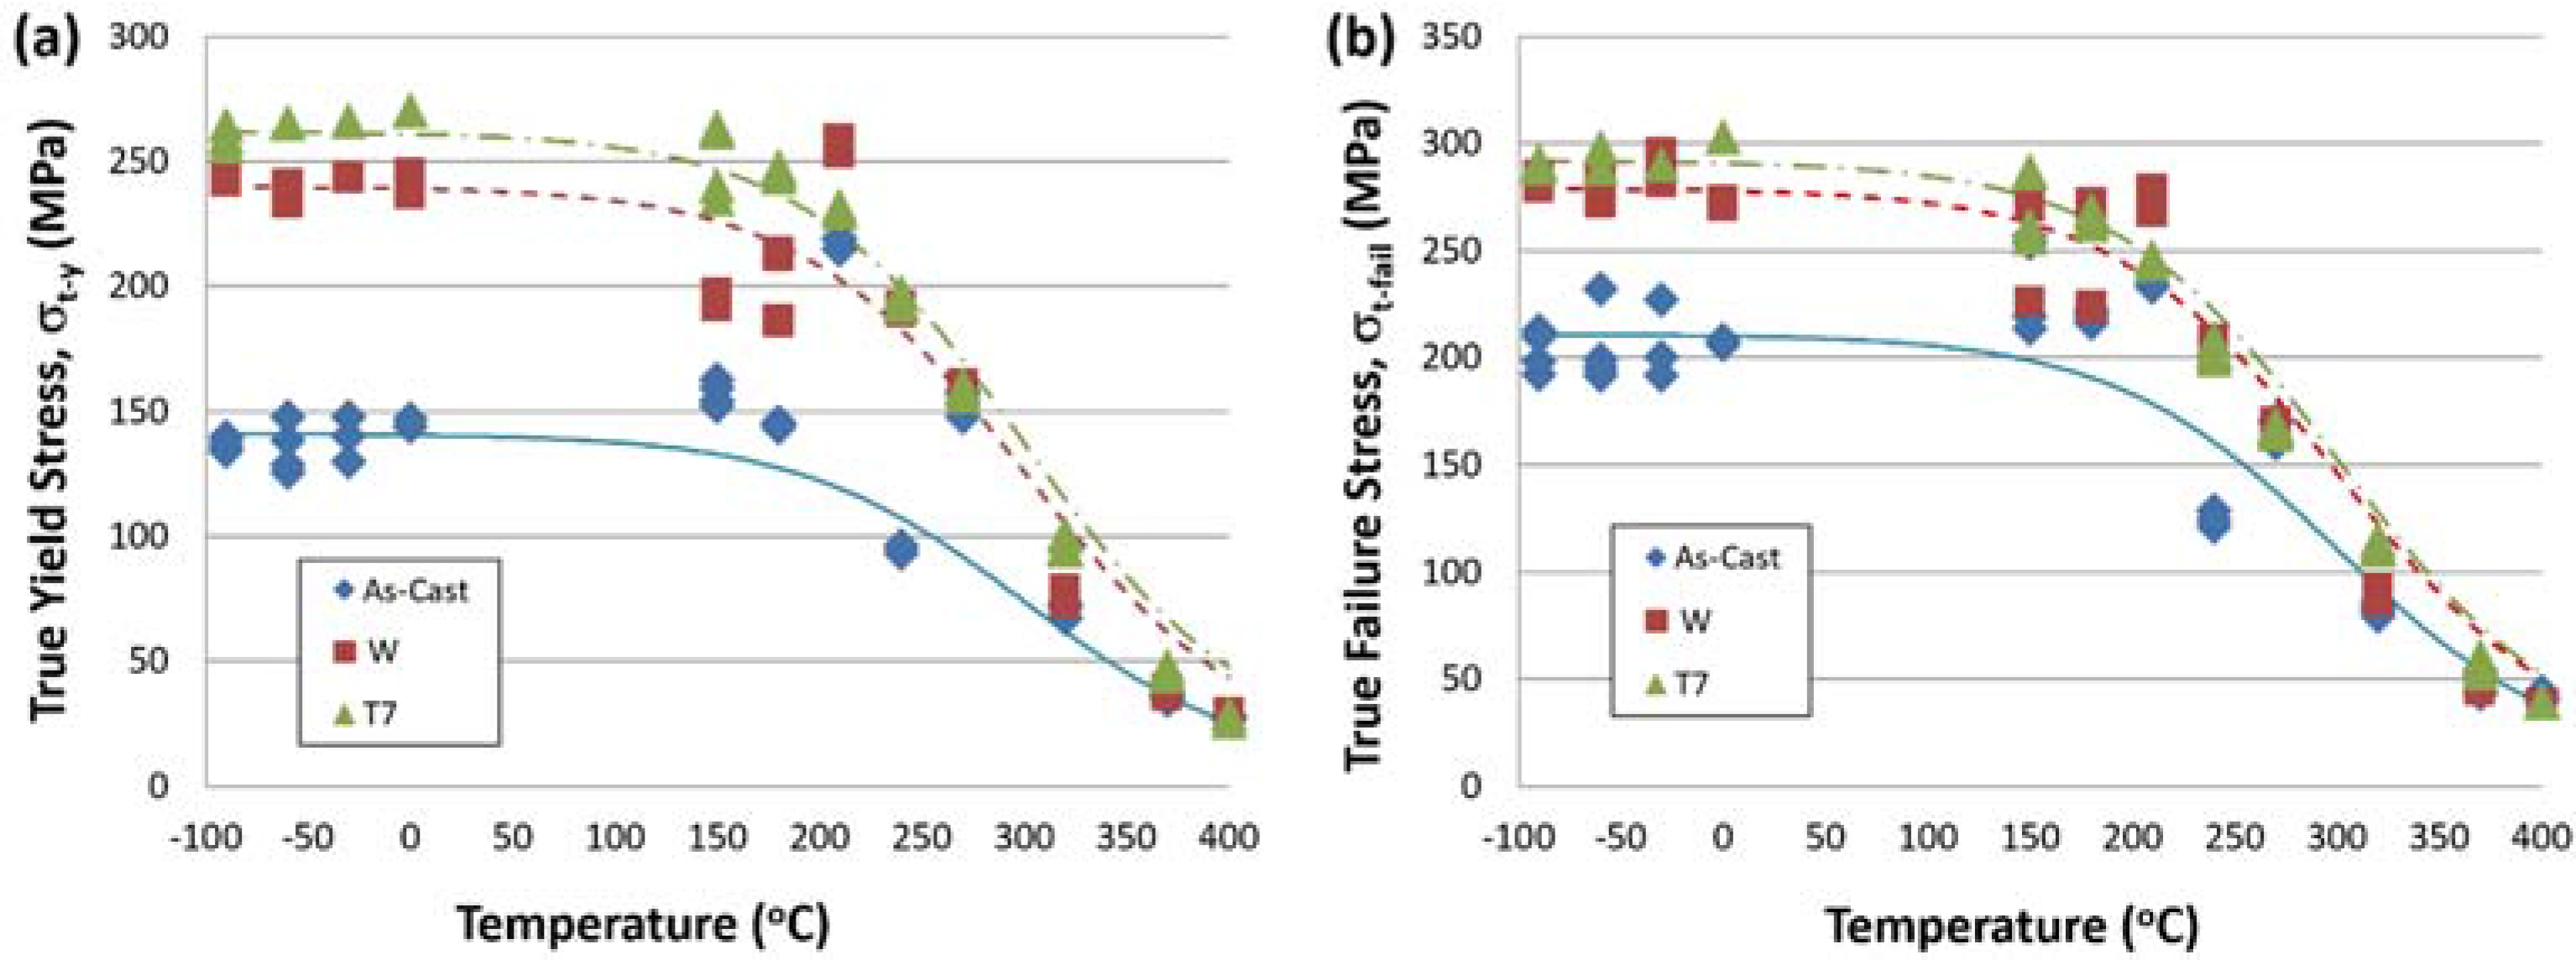
In
Figure 4, using Equations (2) and (3), the temperature dependence of (a) true yield stress (σ
t−y) and (b) true failure stress (σ
t−fail) for Al-A319 alloys in various heat treatment conditions is plotted. Again, symbols represent experimental data and the curves are the prediction of the model, respectively. The
and
values were determined by the averages of σ
t−y and σ
t−fail in the temperature ranges of −90 °C and 30 °C, because it was observed that these properties are not affected by the temperature below the room temperature for Al-A319 alloys [
8]. In determining the experimental σ
t−y values, we used the 0.2% offset method from the measured stress-strain curves. By the regression analysis, we identified that the proportionality constant
Cy and
Cfail values of 1.6 produce the best-fit to the experimental observations. This implies that the loss of σ
t−y and σ
t−fail from LT due to the temperature increase can be successfully expressed by the multiples of elastic true strain of LT and the loss conversion constants for both cases are 1.6. Also, this validates that the approximation of Equations (2) and (3) could be applied to the estimation of true yield stress and true failure strain in Al-A319 systems considered in this work. From the figure, it is seen that the analytical prediction shows good agreements with the experimental observations. As expected,
Figure 4a clearly shows that true yield stress (σ
t−y) depends significantly on the heat treatment conditions.
Figure 4b indicates that in general the as-cast material fails at much lower stresses compared with the W and T7 materials. Low failure stress is likely the result of higher concentrations of brittle intermetallics in grain boundary regions of the as-cast material. It is, however, notable that, at a given temperature, there is little difference between the failure stresses (σ
t−fail) of the W and T7 conditions, though age-hardening (
i.e., T7) induces slightly higher yield stress (σ
t−y). It is known from Al-5083 bimodal materials that the grain size has a significant effect on the failure stress [
6], but it would appear that in homogenized Al-A319 (
i.e., W and T7 samples), the failure stress is influenced by alloy composition (
i.e., chemical composition) rather than the concentration, size, and distribution of precipitates. This indicates it is likely that grain size and chemical composition primarily control failure stress in homogenized Al-A319. An analysis of failure stress data from Talamantes-Silva
et al. [
16] for Al-206 in W and T7 heat treat conditions over a range of grain sizes has shown that there is also little difference in true failure stress between W and T7 conditions if the samples have the same grain size. It is, however, thought that further investigation would be necessary to determine if this is the case for alloys other than Al-A319 and Al-206. At temperatures of 210 °C and 270 °C, the behavior of the as-cast material significantly departs from its general behavior and takes on the attributes of the T7 material. However, at a temperature of 240 °C, the behavior exhibits its predicted behavior. The W material also seems to take on the attributes of the T7 material in the temperature range of 210 °C to 240 °C. The abrupt changes in behavior are likely due to the dissolution and/or precipitation of various intermetallic phases. At temperatures of 300 °C (
i.e., alloy softening temperature) and above, there appears to be little difference between the materials.
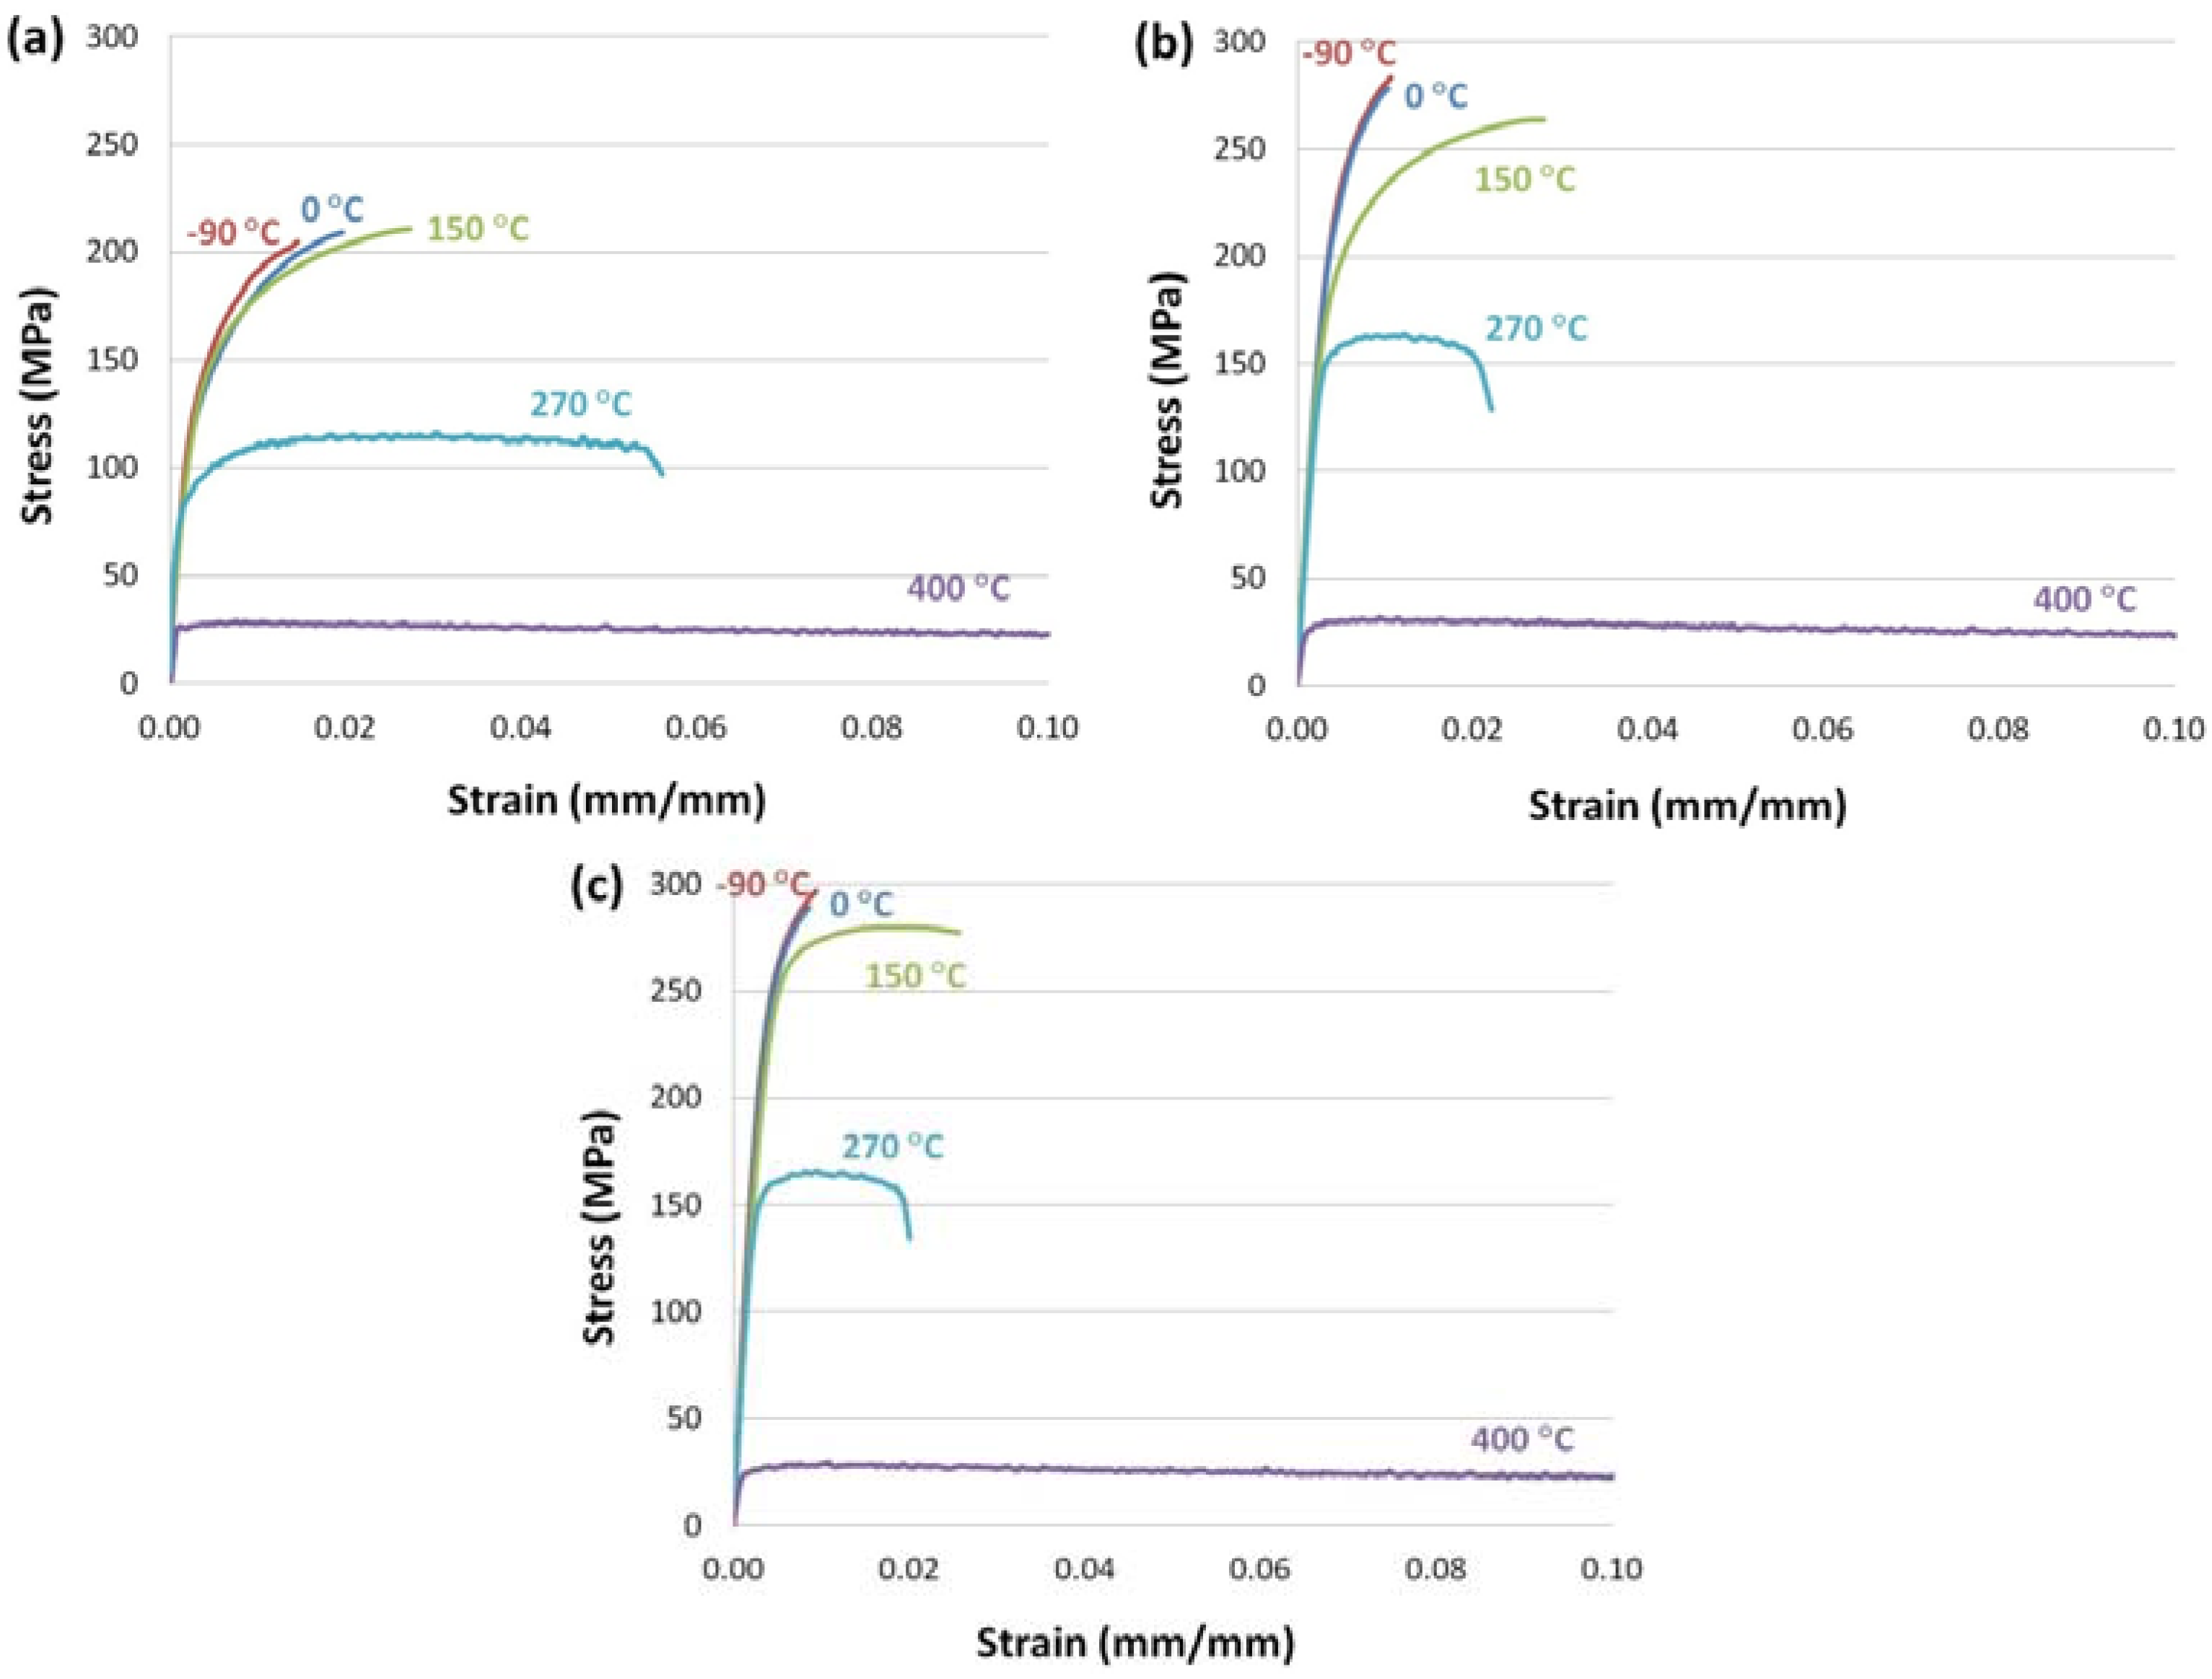
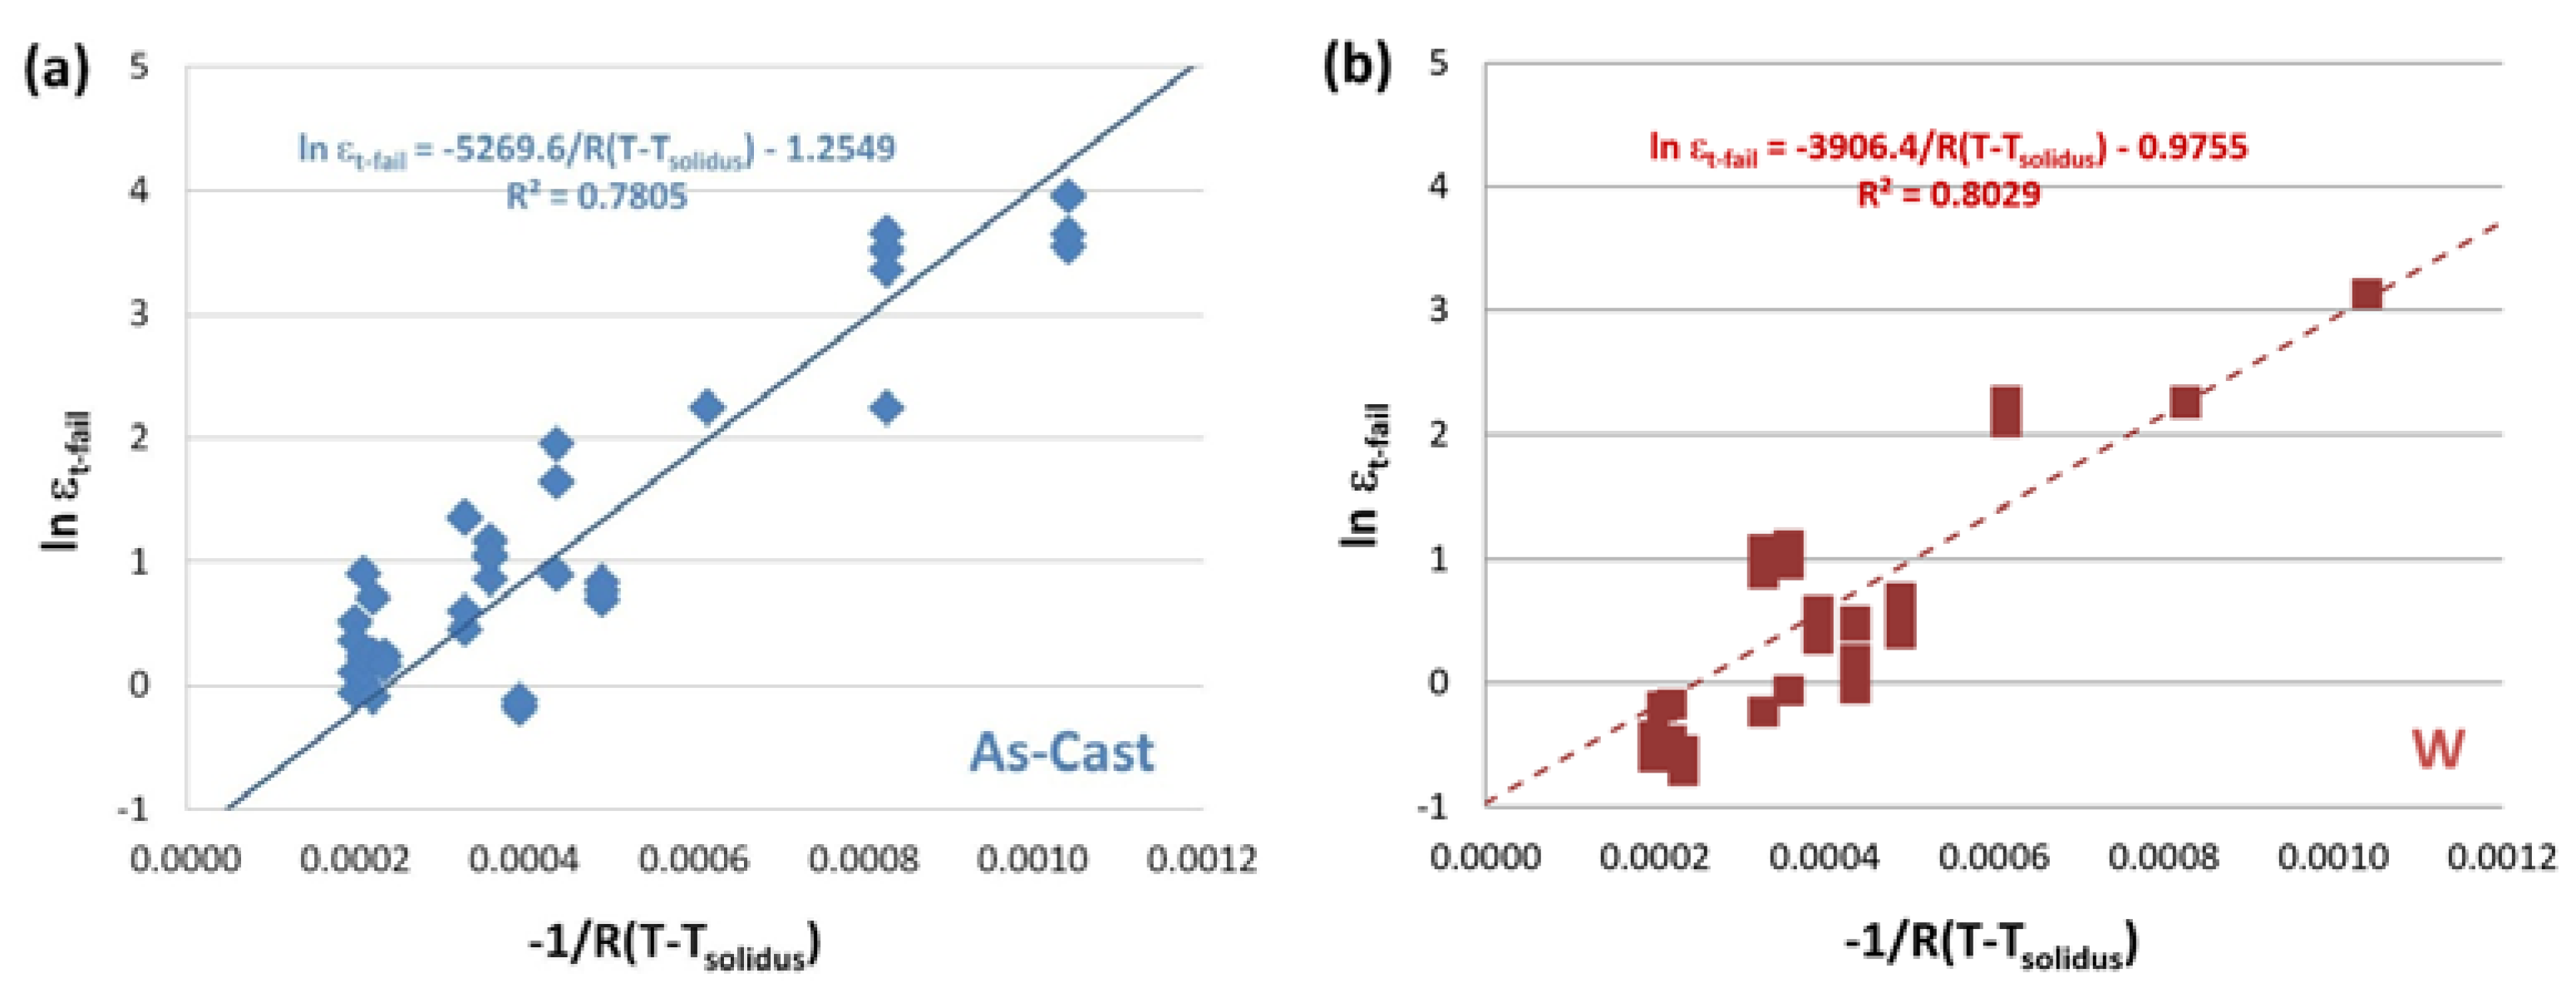
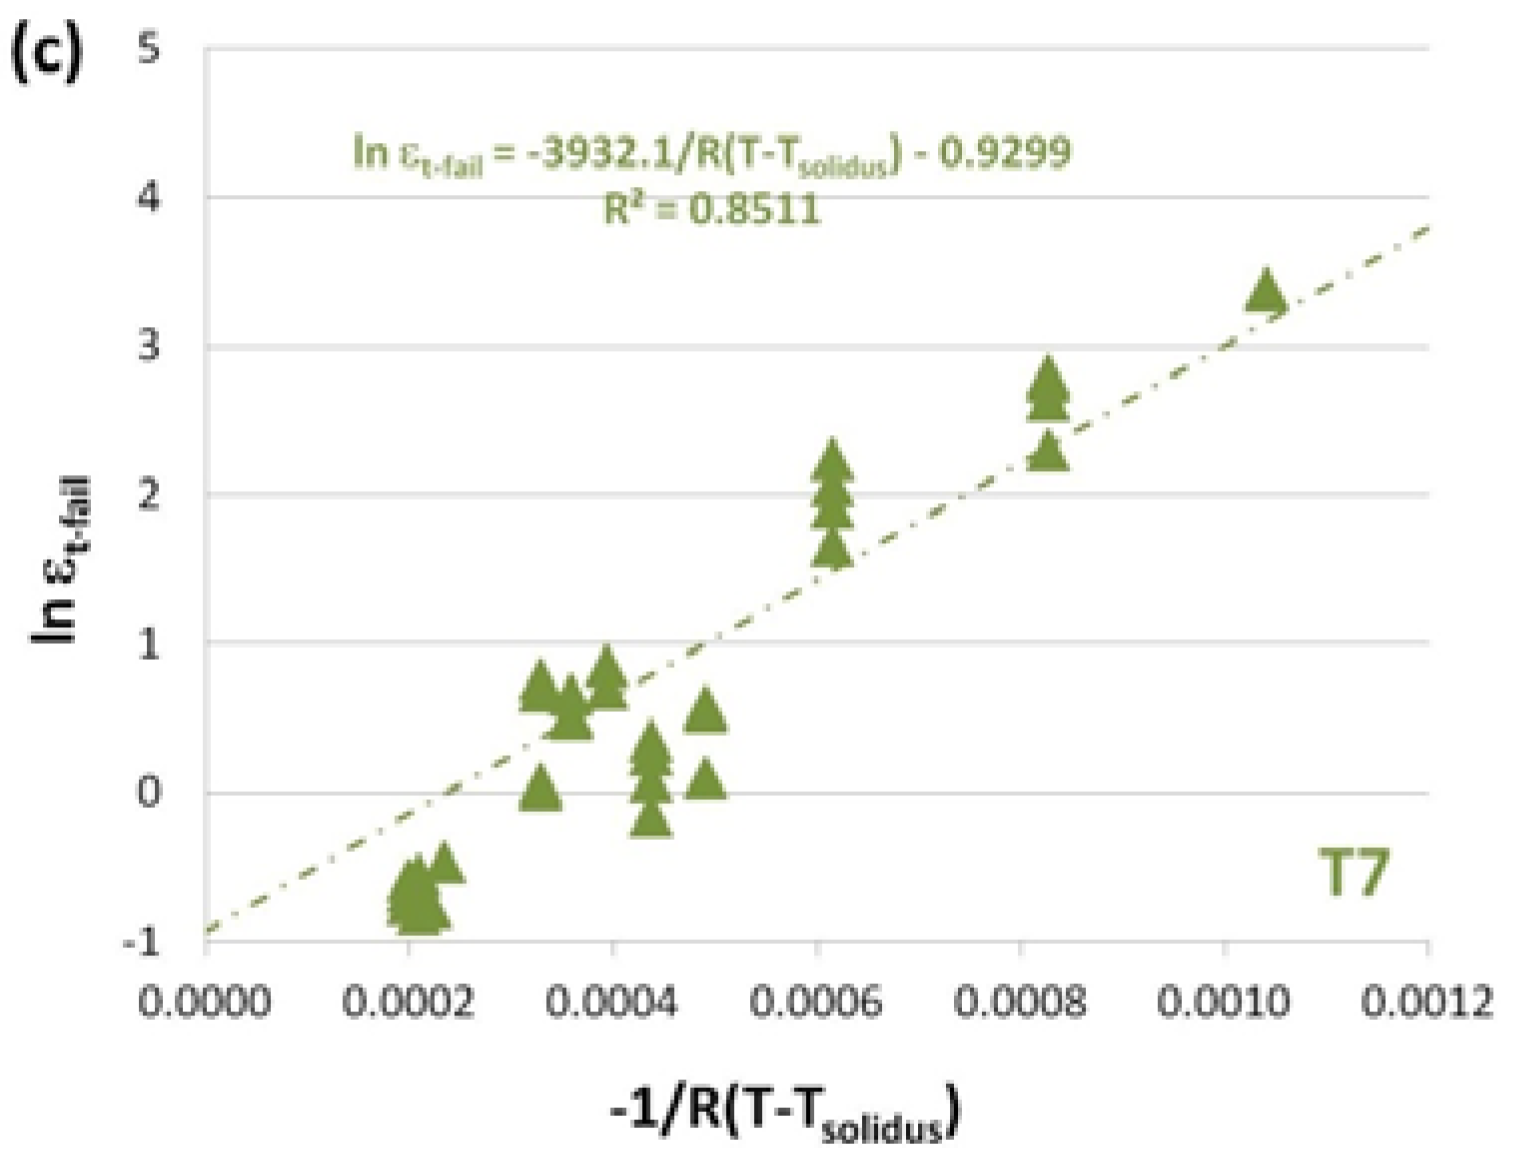
Figure 5 shows the Arrhenius-like dependence of true failure strain (ε
t−fail) for Al-A319 alloys using the expression given in Equations (4) and (5) in (a) as-cast, (b) W, and (c) T7 heat treatment conditions. Again, the symbols represent experimental data and the lines are the prediction of the model, respectively.
values were calculated using
for each heat treatment condition. After obtaining the y-intercept values (
), the linear regression was used to predict the slopes shown in
Figure 5.
R-squared values (
R2) of the linear regression are also provided in the figure. The data in the figure evidently exhibit a higher true failure strain (ε
t−fail) with higher temperature (
i.e., higher
). From the figures, it is clearly seen that the predictions from the proposed Equation (4) provide a reasonably accurate estimate of the true failure strain (ε
t−fail), although there are instances in the as-cast and W data where there is some departure from the general trend. The slopes of the prediction lines in
Figure 5 can be used to understand the temperature effects on the changes of the true failure strain (ε
t−fail). From the figure, it is seen that the true failure strain (ε
t−fail) of the as-cast sample shows the highest failure activation energy (
i.e., high
Qfail value in Equations (4) and (5)), while the heat treated samples (W and T7) show a lower failure activation energy (
i.e., smaller
Qfail value in Equations (4) and (5)). This can be explained from the different microstructural homogeneity of as-cast and heat treatment samples. As-cast materials possess a large variation in intermetallic phase size, shape, and composition, and therefore, possess many inhomogeneous microstructural features that could lead to failure. Hence, the as-cast samples likely show more temperature-sensitive behavior for the strain failure. On the other hand, W and T7 materials are more refined and homogenous and thus the types/degrees of defects that can cause failure are less in these solutionized and age-hardened materials, which will exhibit less sensitivity to the temperature changes with regards to the temperature changes.
In addition to yield stress (σ
t−y), failure stress (σ
t−fail), and failure-to-strain (ε
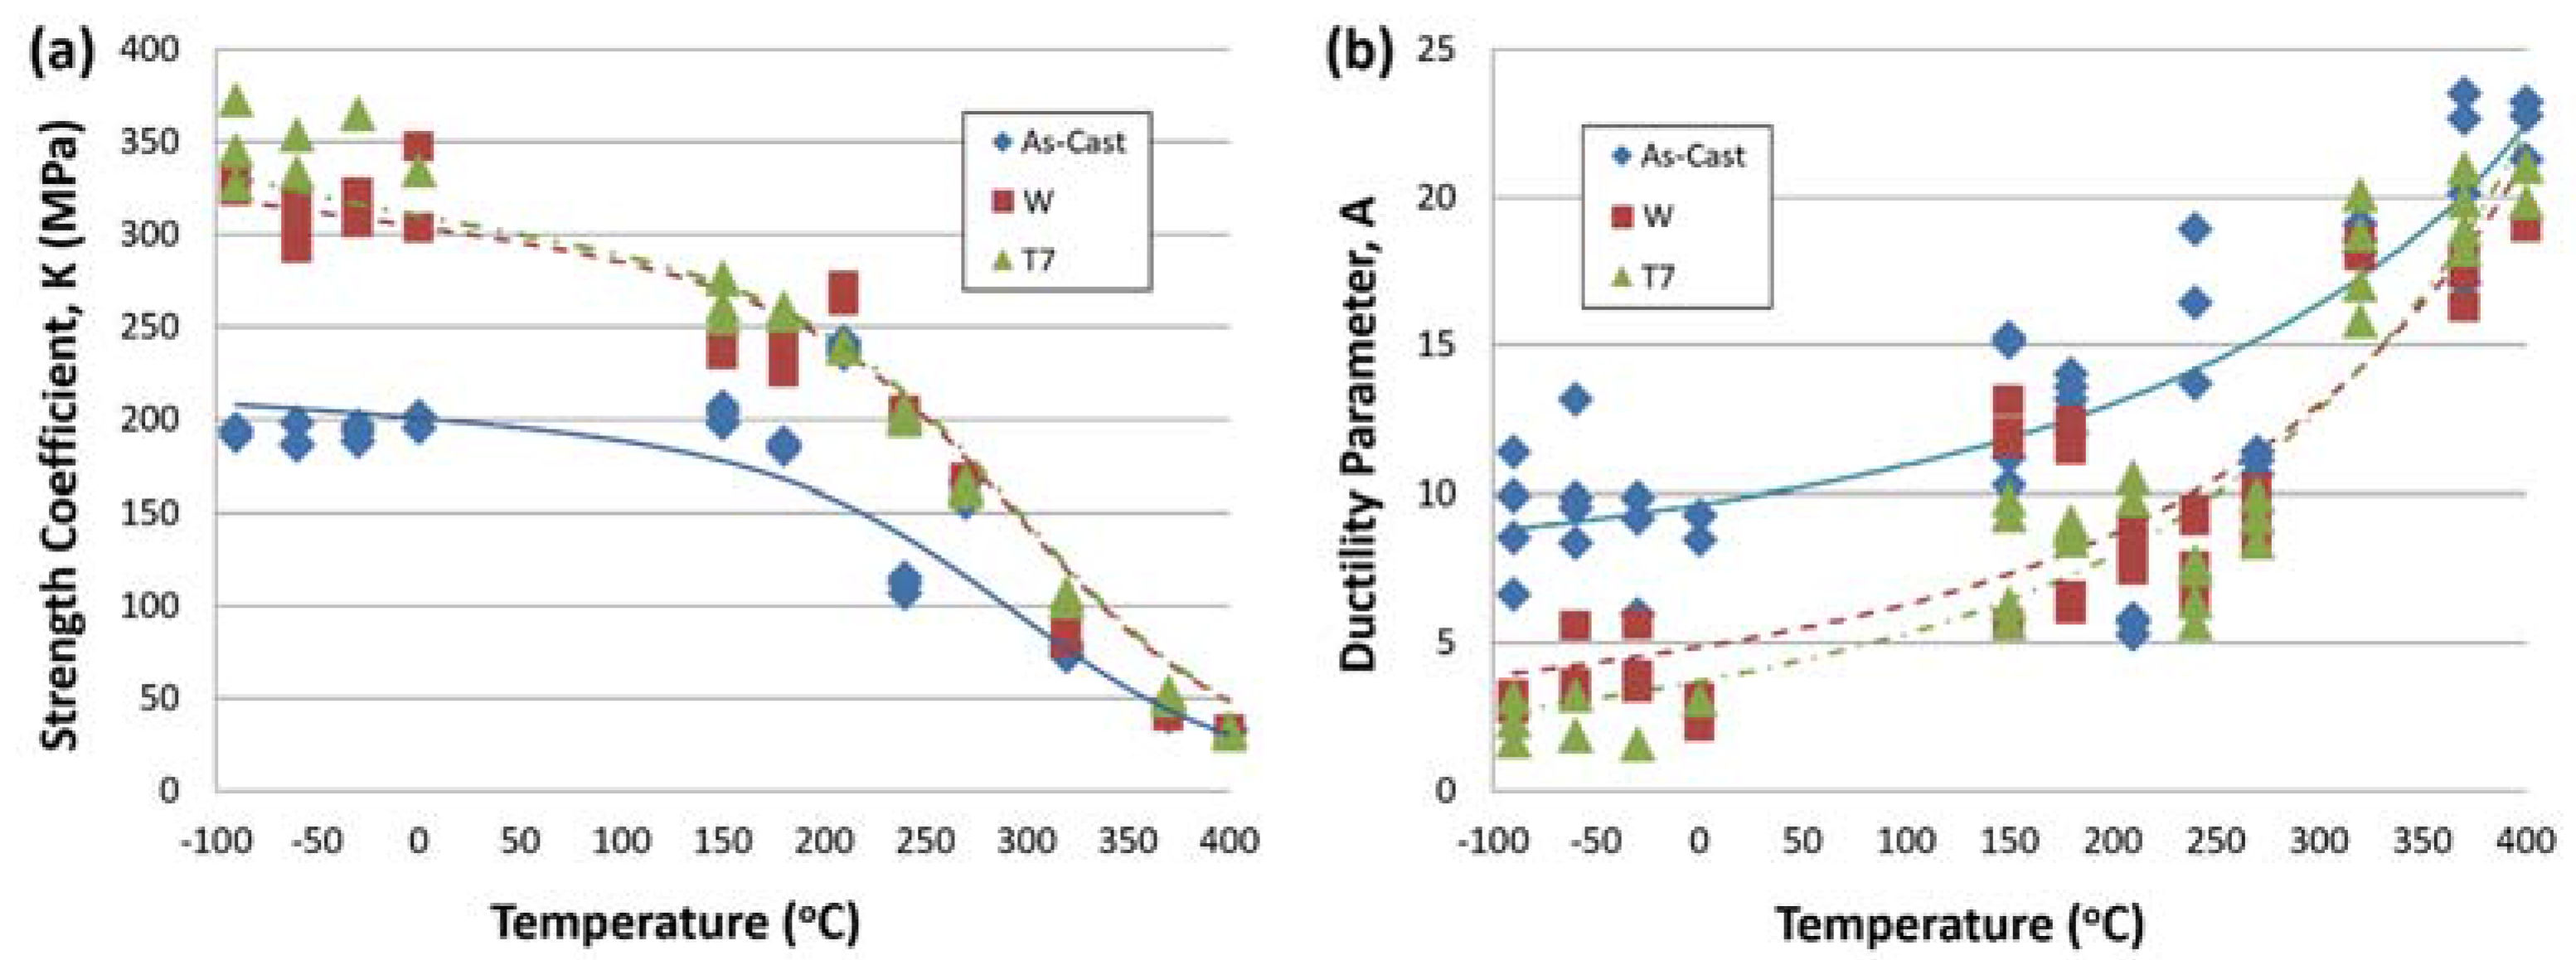
t−fail) of alloys, in
Figure 6, the predictions of other mechanical parameters of interest including the strain hardening exponent (
n), strength coefficient (
K), and ductility parameter (
A) are compared with values calculated based on the Holloman equation (
) with the experimental data.
Figure 6a,b shows that there is good agreement between the predicted and experimental values of strength coefficient (
K) and ductility parameter (
A) with the same some deviations at 210 °C and 240 °C for the as-cast condition and the W condition from 240 °C to 320 °C. From these figures, it is seen that the strength coefficient (
K) increases and the ductility parameter (
A) decreases with W/T7 heat treatments, respectively, which indicates that the heat treatment will increase the strength coefficient (
K) (~48%) as well as the true yield stress (σ
t−y) and the true failure stress (σ
t−fail) as shown in
Figure 4, and it will decrease the ductility of alloys. Further, it is observed that the general trend of these two parameters (
i.e.,
K and
A) for the W and T7 samples are similar, although the
K and
A parameters of W condition are slightly lower and higher, respectively, compared with those from T7 specimen. On the other hand,
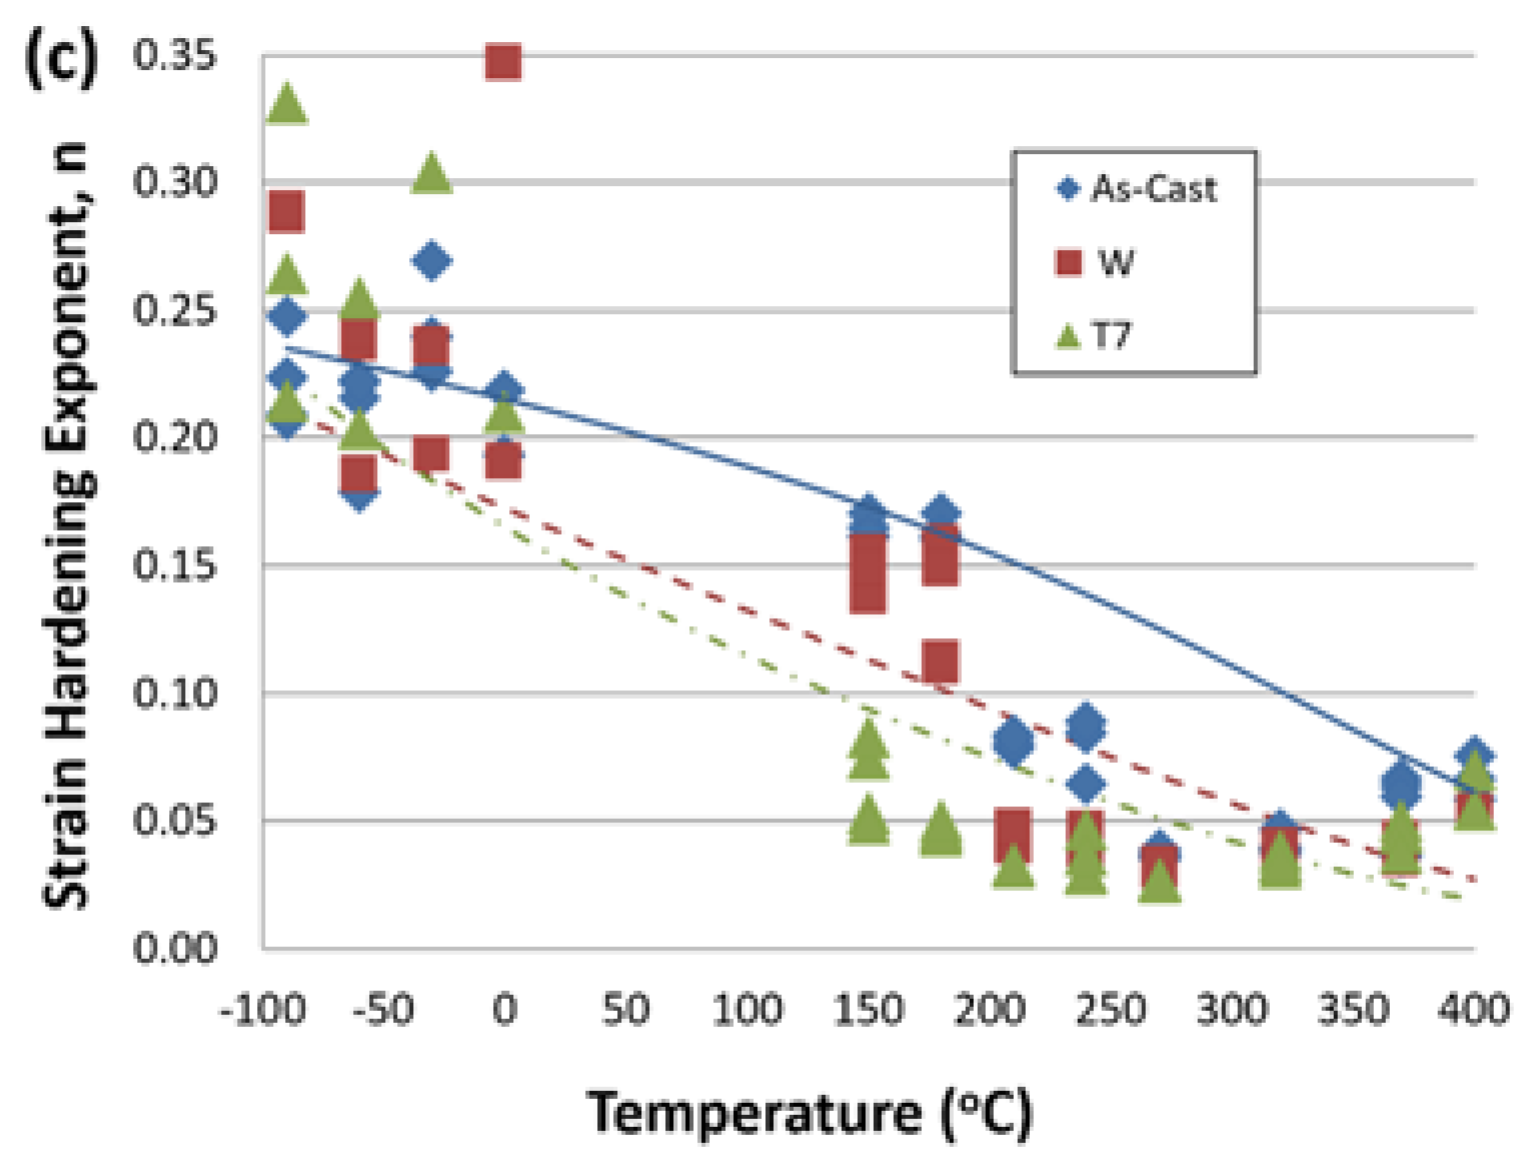
Figure 6c shows that there is considerable scatter in the experimental data for the strain hardening exponent (
n) and the agreement is relatively poor between the experimental values and the predicted trend, especially at temperatures above 180 °C, which indicates that either the growth or dissolution of precipitates can abruptly affect the mechanical properties.
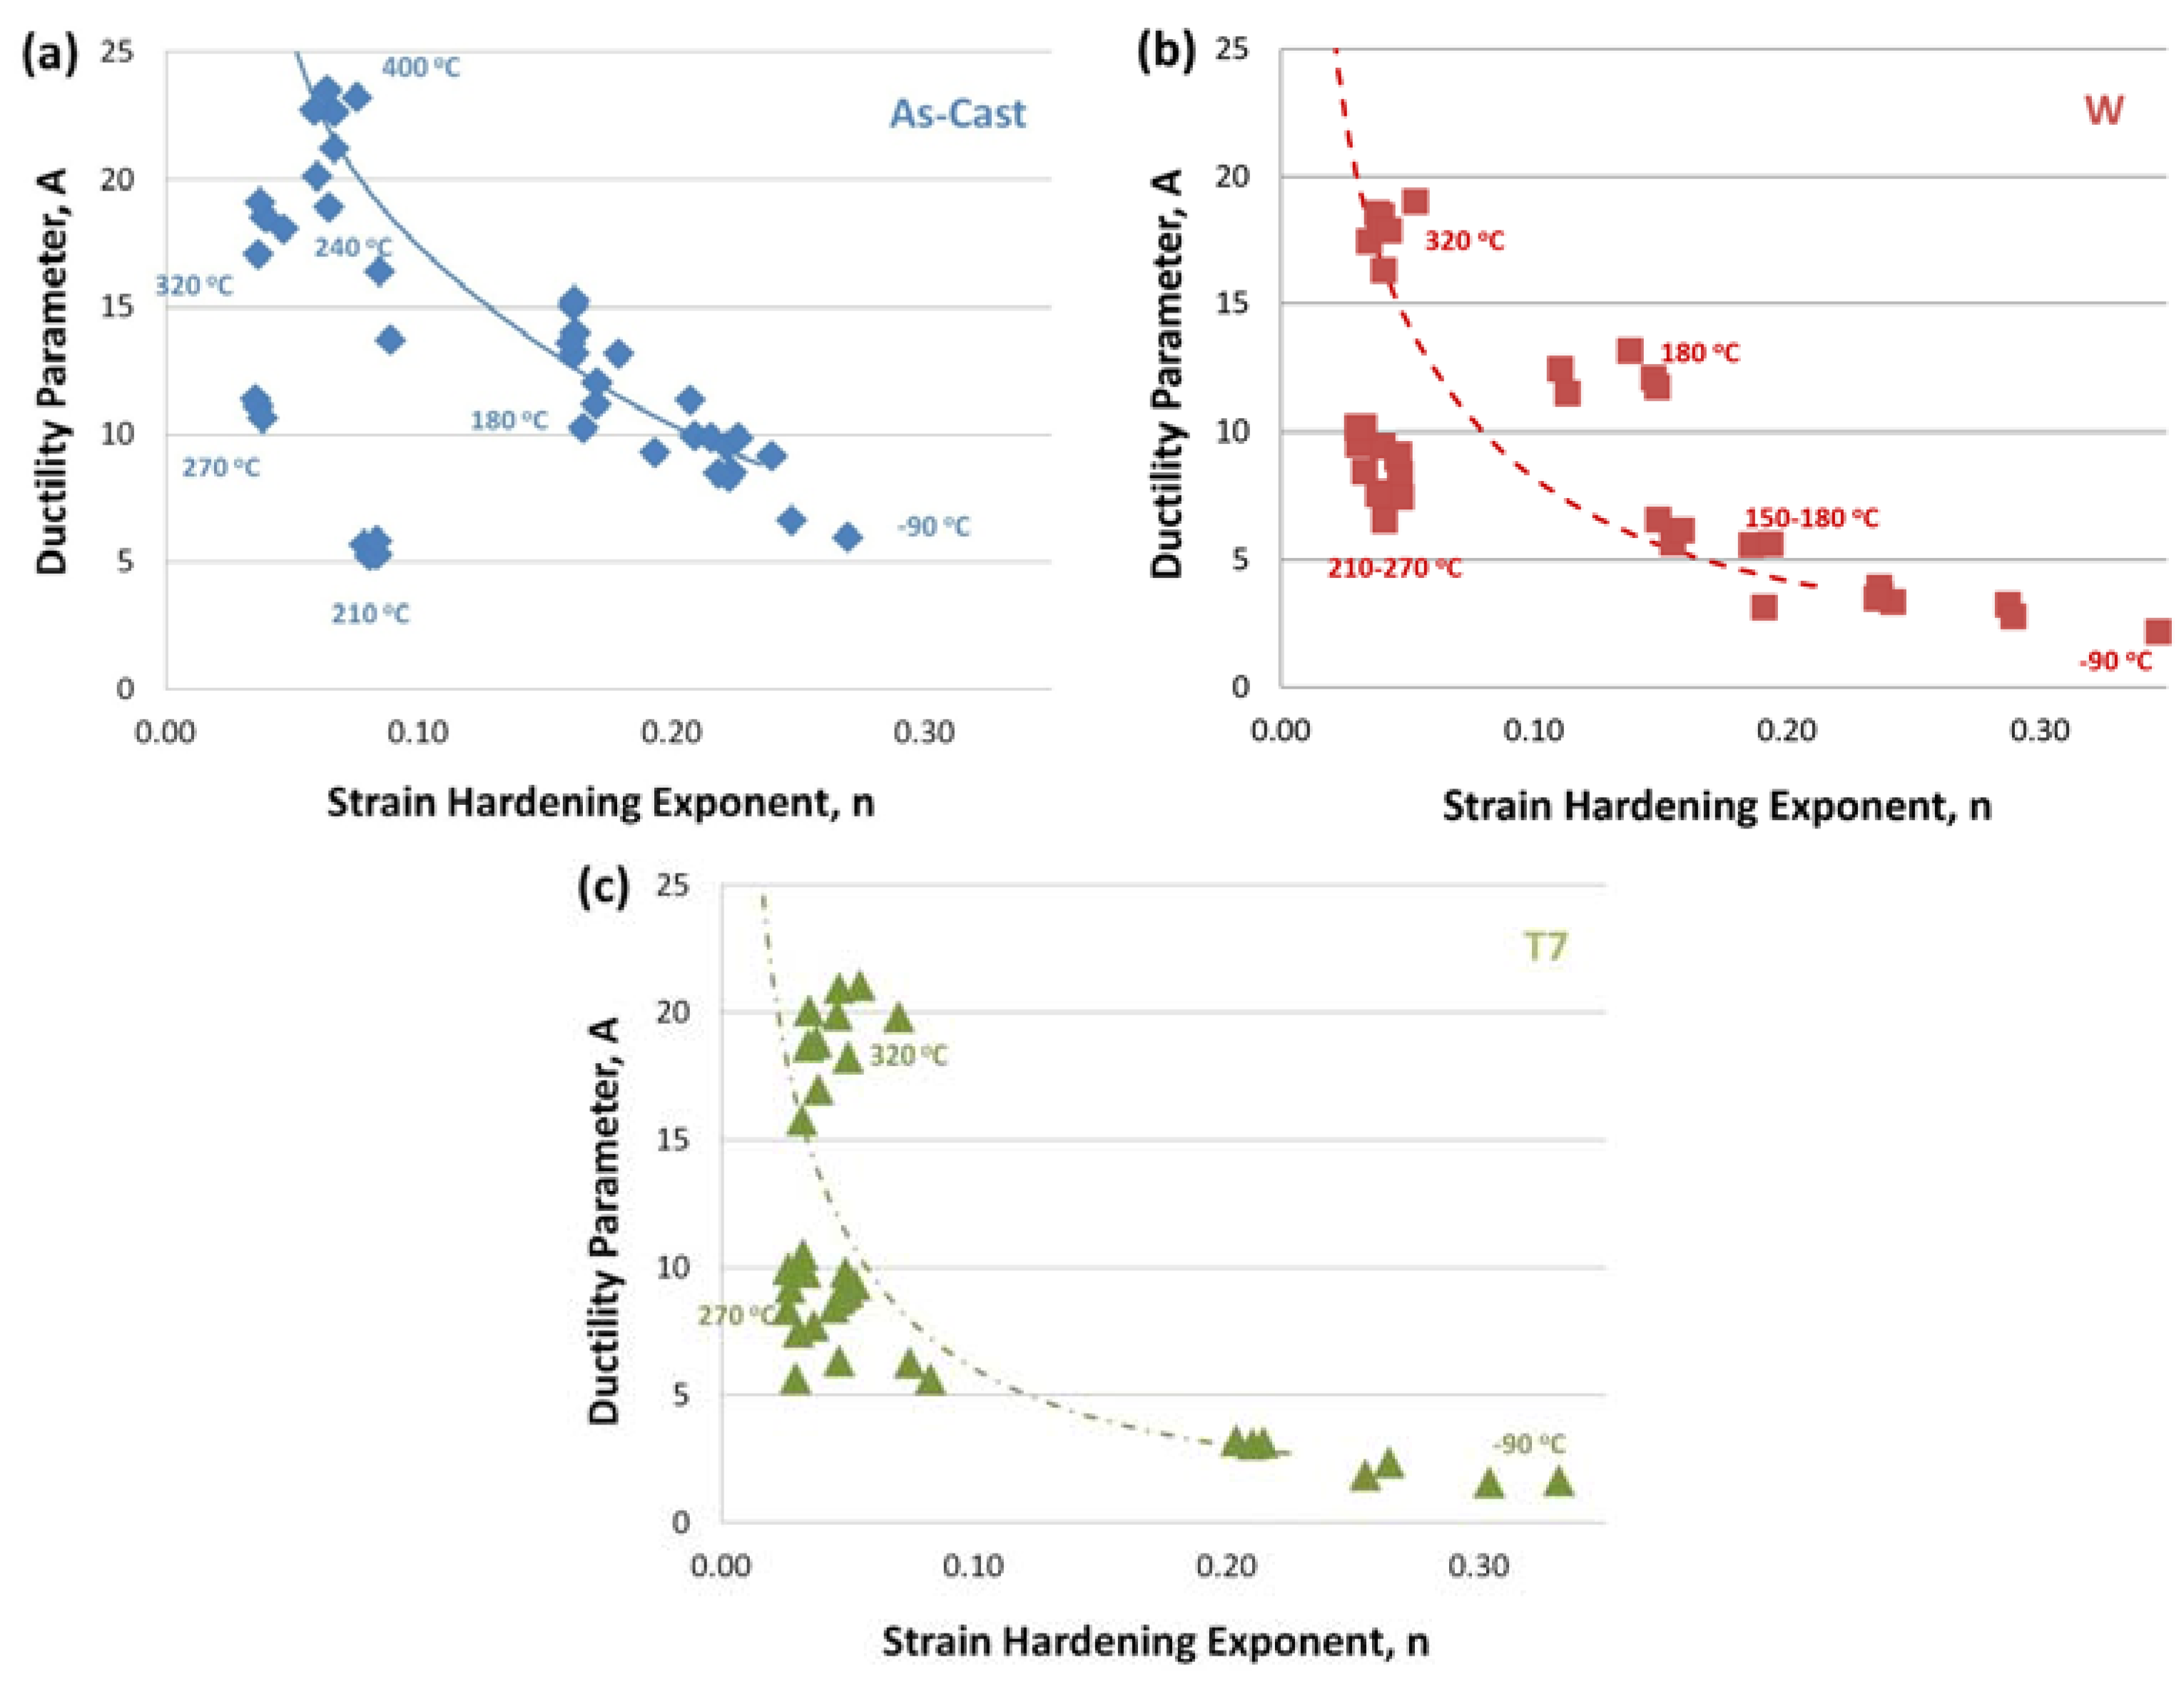
In
Figure 7, the relationships between the ductility parameter (
A) and the strain hardening exponent (
n) are displayed for the (a) as-cast, (b) W, and (c) T7 specimens. The symbols and curve lines represent the experimental and prediction data, respectively. From the figures, it is clear that, in general, the
A and
n parameters exhibit an inverse relationship; that is,
A decreases and
n increases as the temperature decreases. Further, the experimental data in
Figure 7 show that there is a complicated temperature-dependent behavior of
n and
A, which can account for the relative inconsistency between experimental and predicted values in
Figure 6c, and again shows that either the growth or dissolution of precipitates can abruptly affect the mechanical properties. Although there are some deviations from the experimental measurement data, the analytical predictions show reasonable averaged behavior over a wide range of temperatures for as-cast and heat treated specimens.
Across
Figure 3,
Figure 4,
Figure 5,
Figure 6 and
Figure 7, we have shown that the developed analytical model can predict various mechanical properties such as Young’s modulus (
Y), true yield stress (σ
t−y), true failure stress (σ
t−fail), true failure strain (ε
t−fail), strength coefficient (
K), ductility parameter (
A), and strain hardening exponent (
n) of Al-A319 alloys at different temperatures. Although we have only demonstrated that the model can be applied to the Al-A319 material systems at various temperatures with different heat treatment conditions in the current study, it is generally expected that the presented analytical model approach can be applied to predict the mechanical behaviors of precipitation-hardened alloys where the stress-strain curves are described by the Hollomon equation under various temperatures.


