
Microstructure and High Temperature Deformation of Extruded Al-12Si-3Cu-Based Alloy

Division of Materials Science and Engineering, Inha University, Incheon 22207, Korea
*
Author to whom correspondence should be addressed.
Metals 2016, 6(2), 32; https://doi.org/10.3390/met6020032
Submission received: 3 November 2015
/
Revised: 13 January 2016
/
Accepted: 25 January 2016
/
Published: 2 February 2016
Abstract
:The high temperature deformation behavior of commercial Al-12Si-3Cu-2Ni-1Mg alloy (DM104™) which was fabricated by casting and subsequent hot extrusion was evaluated by compressive tests over the temperature range of 250–470 °C and strain rate range of 0.001–1/s. The extruded alloy had equiaxed grains, spherical Si particles and fine intermetallic phases, such as δ(Al3NiCu) and Q(Al5Cu2Mg3Si6). The true stress-true strain curves from the compressive tests exhibited steady-state flow after reaching the peak stress. A close relationship between the steady-state stress and a constitutive equation for high temperature deformation was observed. Fine equiaxed grains and a dislocation structure within the equiaxed grains were observed in the deformed specimens, suggesting the occurrence of dynamic recrystallization during high temperature deformation.
1. Introduction
Al-Si-based alloys are used widely as a piston materials because of their good specific strength, excellent wear resistance and low coefficient of thermal expansion [1,2,3,4]. The addition of Cu and Mg to Al-Si alloys was reported to promote their mechanical properties through the precipitation of the Al2Cu, Mg2Si phases [5,6,7,8]. Furthermore, it was reported that Ni is a desirable element for improving the mechanical properties of Al-Si-based alloys at elevated temperatures by forming thermally stable Ni-containing intermetallics [9]. To meet the strength requirement of advanced aluminum material for high performance automotive engines, the Al-12Si-3Cu-2Ni-1Mg piston alloy (DM104™) was recently developed by DYP (Dong Yang Piston Co, Ltd., Gyeonggi-do, Korea). The DM104 alloy can be applicable as a forging stock for forged pistons and as a cast piston material. In the case of its use as a forging stock, a careful study of the plastic deformation behavior of the material up to the high temperature region is needed to determine the optimal processing conditions for forging. In this study, the plastic deformation behavior of the extruded Al-12Si-3Cu-2Ni-1Mg alloy was examined using compressive tests over a wide range of temperatures and strain rates. Plastic flow curves were obtained from compressive tests and used to evaluate a constitutive equation. Detailed microstructural observations were made for the specimens before and after deformation.
2. Experimental Section
The material used in this study was a commercial Al-12Si-3Cu-2Ni-1Mg (nominal composition, wt. %) alloy, designated as DM104™, which was fabricated by casting and subsequent hot extrusion. The extrusion billet had a cylindrical shape with a diameter of 90 mm.
Table 1 lists the chemical composition of the as-received alloy (hereafter, “the alloy” or “the billet” denotes DM104 extruded alloy). Cross-sections of the billet were ground using SiC paper up to a grit number of 2000, and polished using a diamond suspension and colloidal silica. The microstructure was observed using an Olympus PME3-313UN optical microscope (Olympus, Tokyo, Japan) after etching with modified Weak’s reagent. The hardness was measured using a Akashi HM-124 Vickers hardness tester (Mitsudoyo, Tokyo, Japan) with a load of 0.1 kg and a dwell time of 10 s. The Vickers hardness was obtained by an average of at least 20 measurements. Cylindrical compression test specimens with a diameter of 5 mm and a height of 7.5 mm were fabricated from the billet. The samples were taken from the 3 cm radius location from the billet edge. Compressive tests were conducted over the temperature range, 250–470 °C and strain rate range 0.001–1/s. The compressive tests were performed up to the true strain of approximately 100% after holding for 15 min at the target temperature. After the compressive test, the sample was quenched in water and cut along the loading axis to observe the microstructure. Phase analysis was conducted by energy dispersive spectroscopy (EDS; Emax 132-10, Horiba, Kyoto, Japan) and X-ray diffraction (XRD; X’pert MPD PRO, Philips, Amsterdam, The Netherlands), and compared with the JMatPro simulation data.

| Alloy Compositions (wt. %) | |||||||||
|---|---|---|---|---|---|---|---|---|---|
| Element | Si | Fe | Cu | Mg | Ni | Ti | V | Zr | Al |
| DM104 | 12 | 0.3 | 3.2 | 0.9 | 2.0 | 0.1 | 0.1 | 0.1 | Bal. |
3. Results and Discussion
3.1. Microstructure of the As-Received Alloy
Figure 1 shows the etched microstructure of a cross-section. As shown in the figure, the microstructure consisted of well-developed equiaxed grains (see arrow a), spherical Si particles (arrow b) and fine intermetallic phases (arrow c). The mean grain size of the equiaxed grains was measured to be approximately 5 μm. The Vickers hardness value of the matrix was measured to be 90 Hv.
Figure 1.
Optical micrograph of the cross-section for as-received alloy.
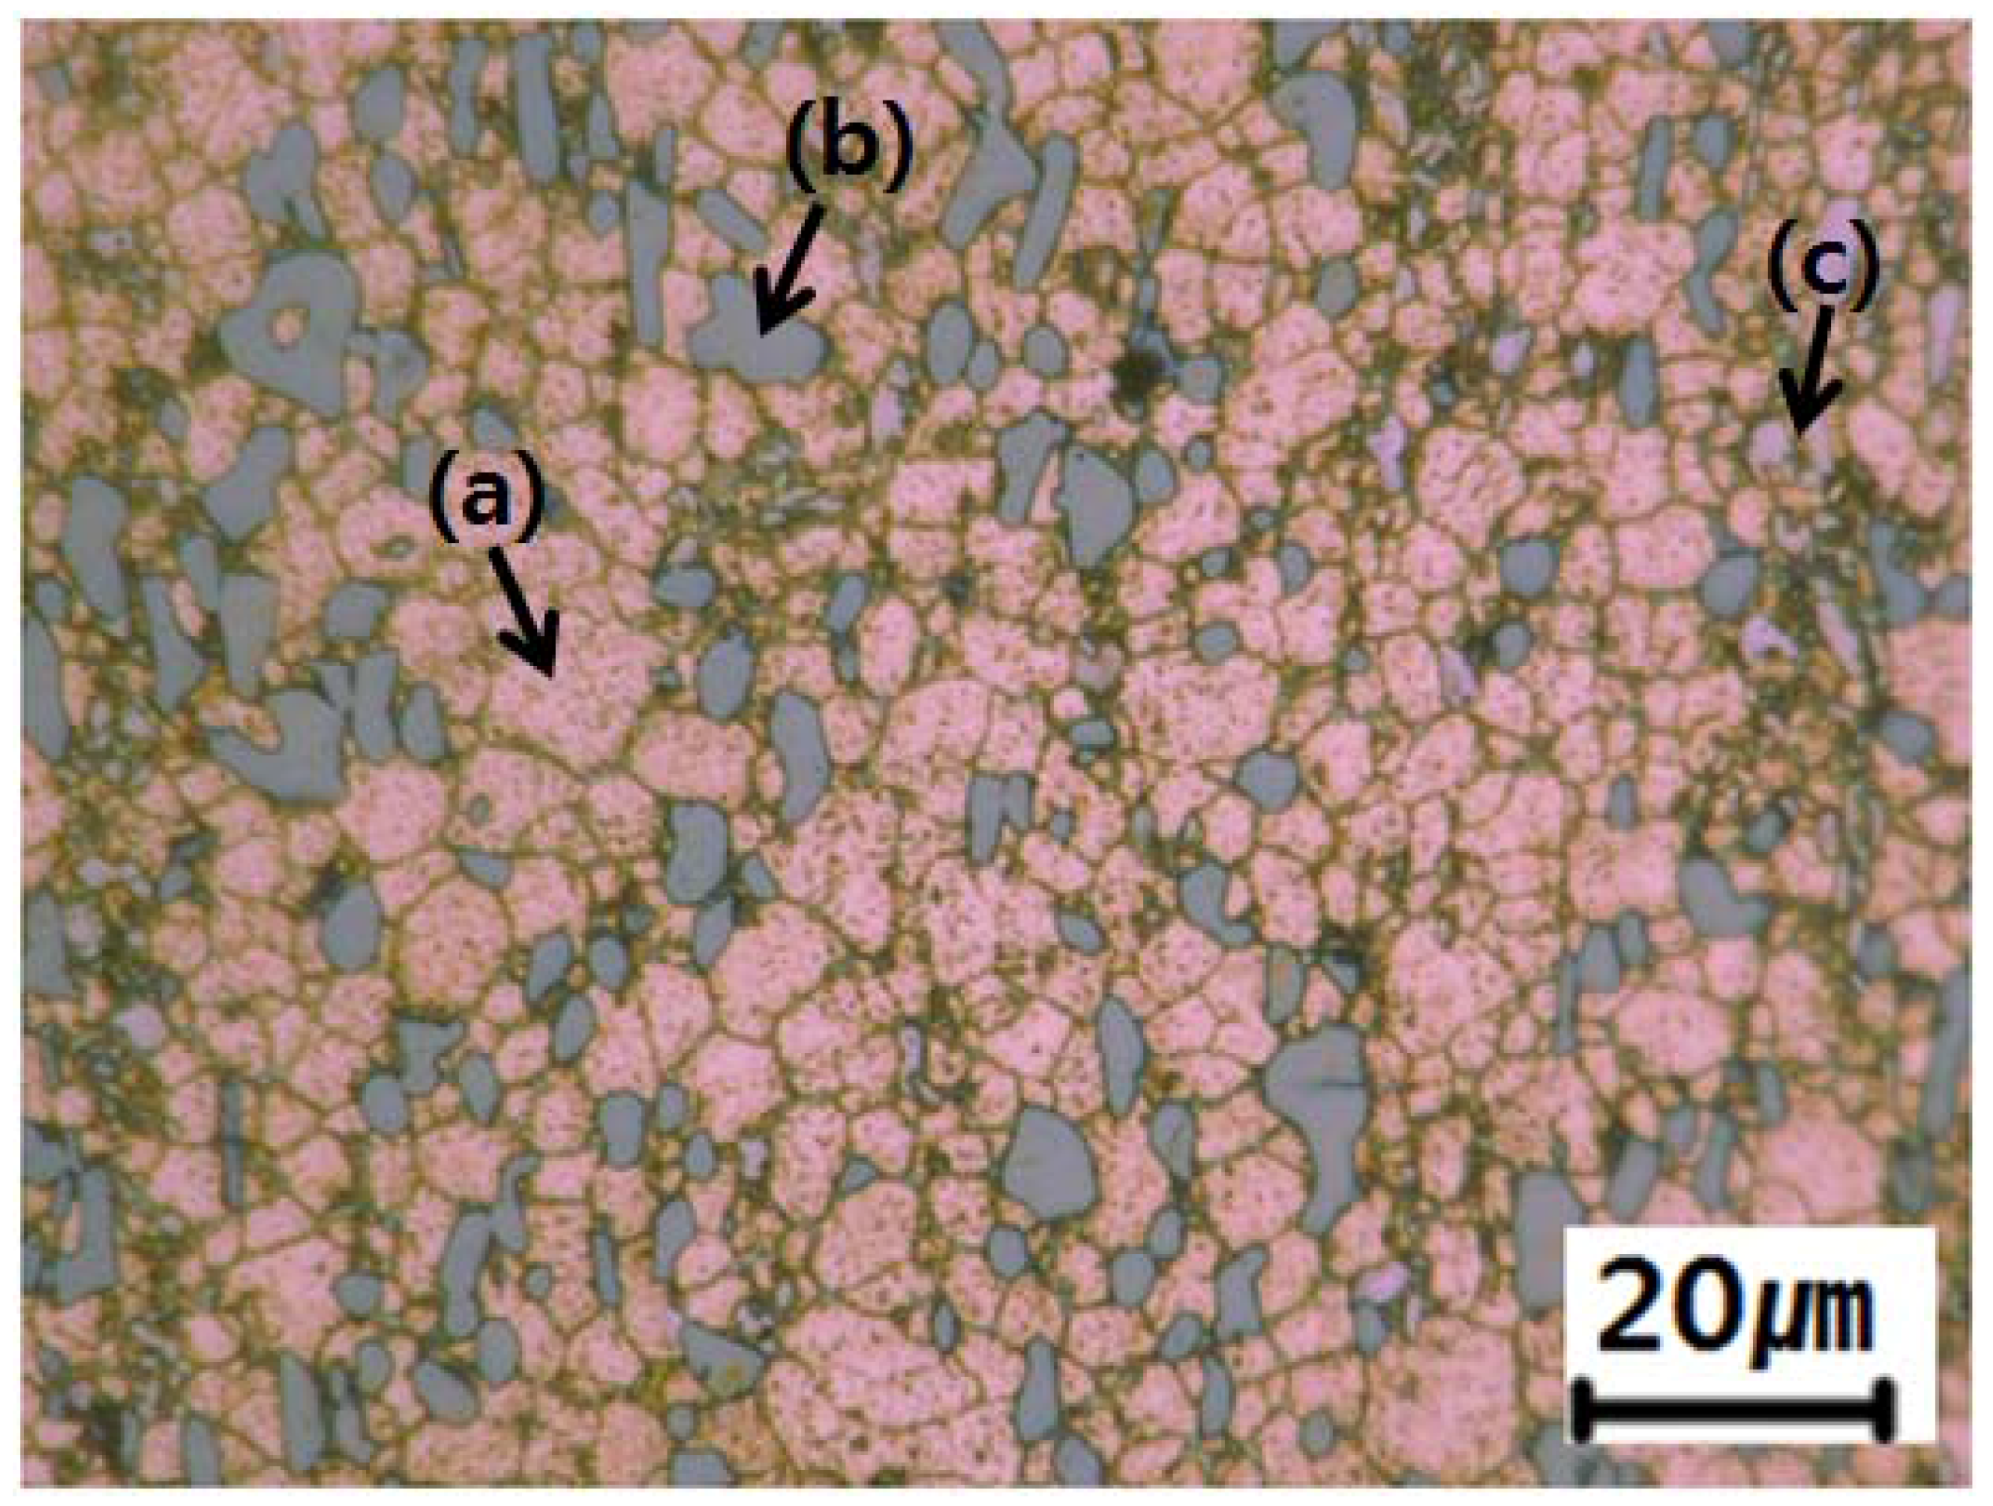
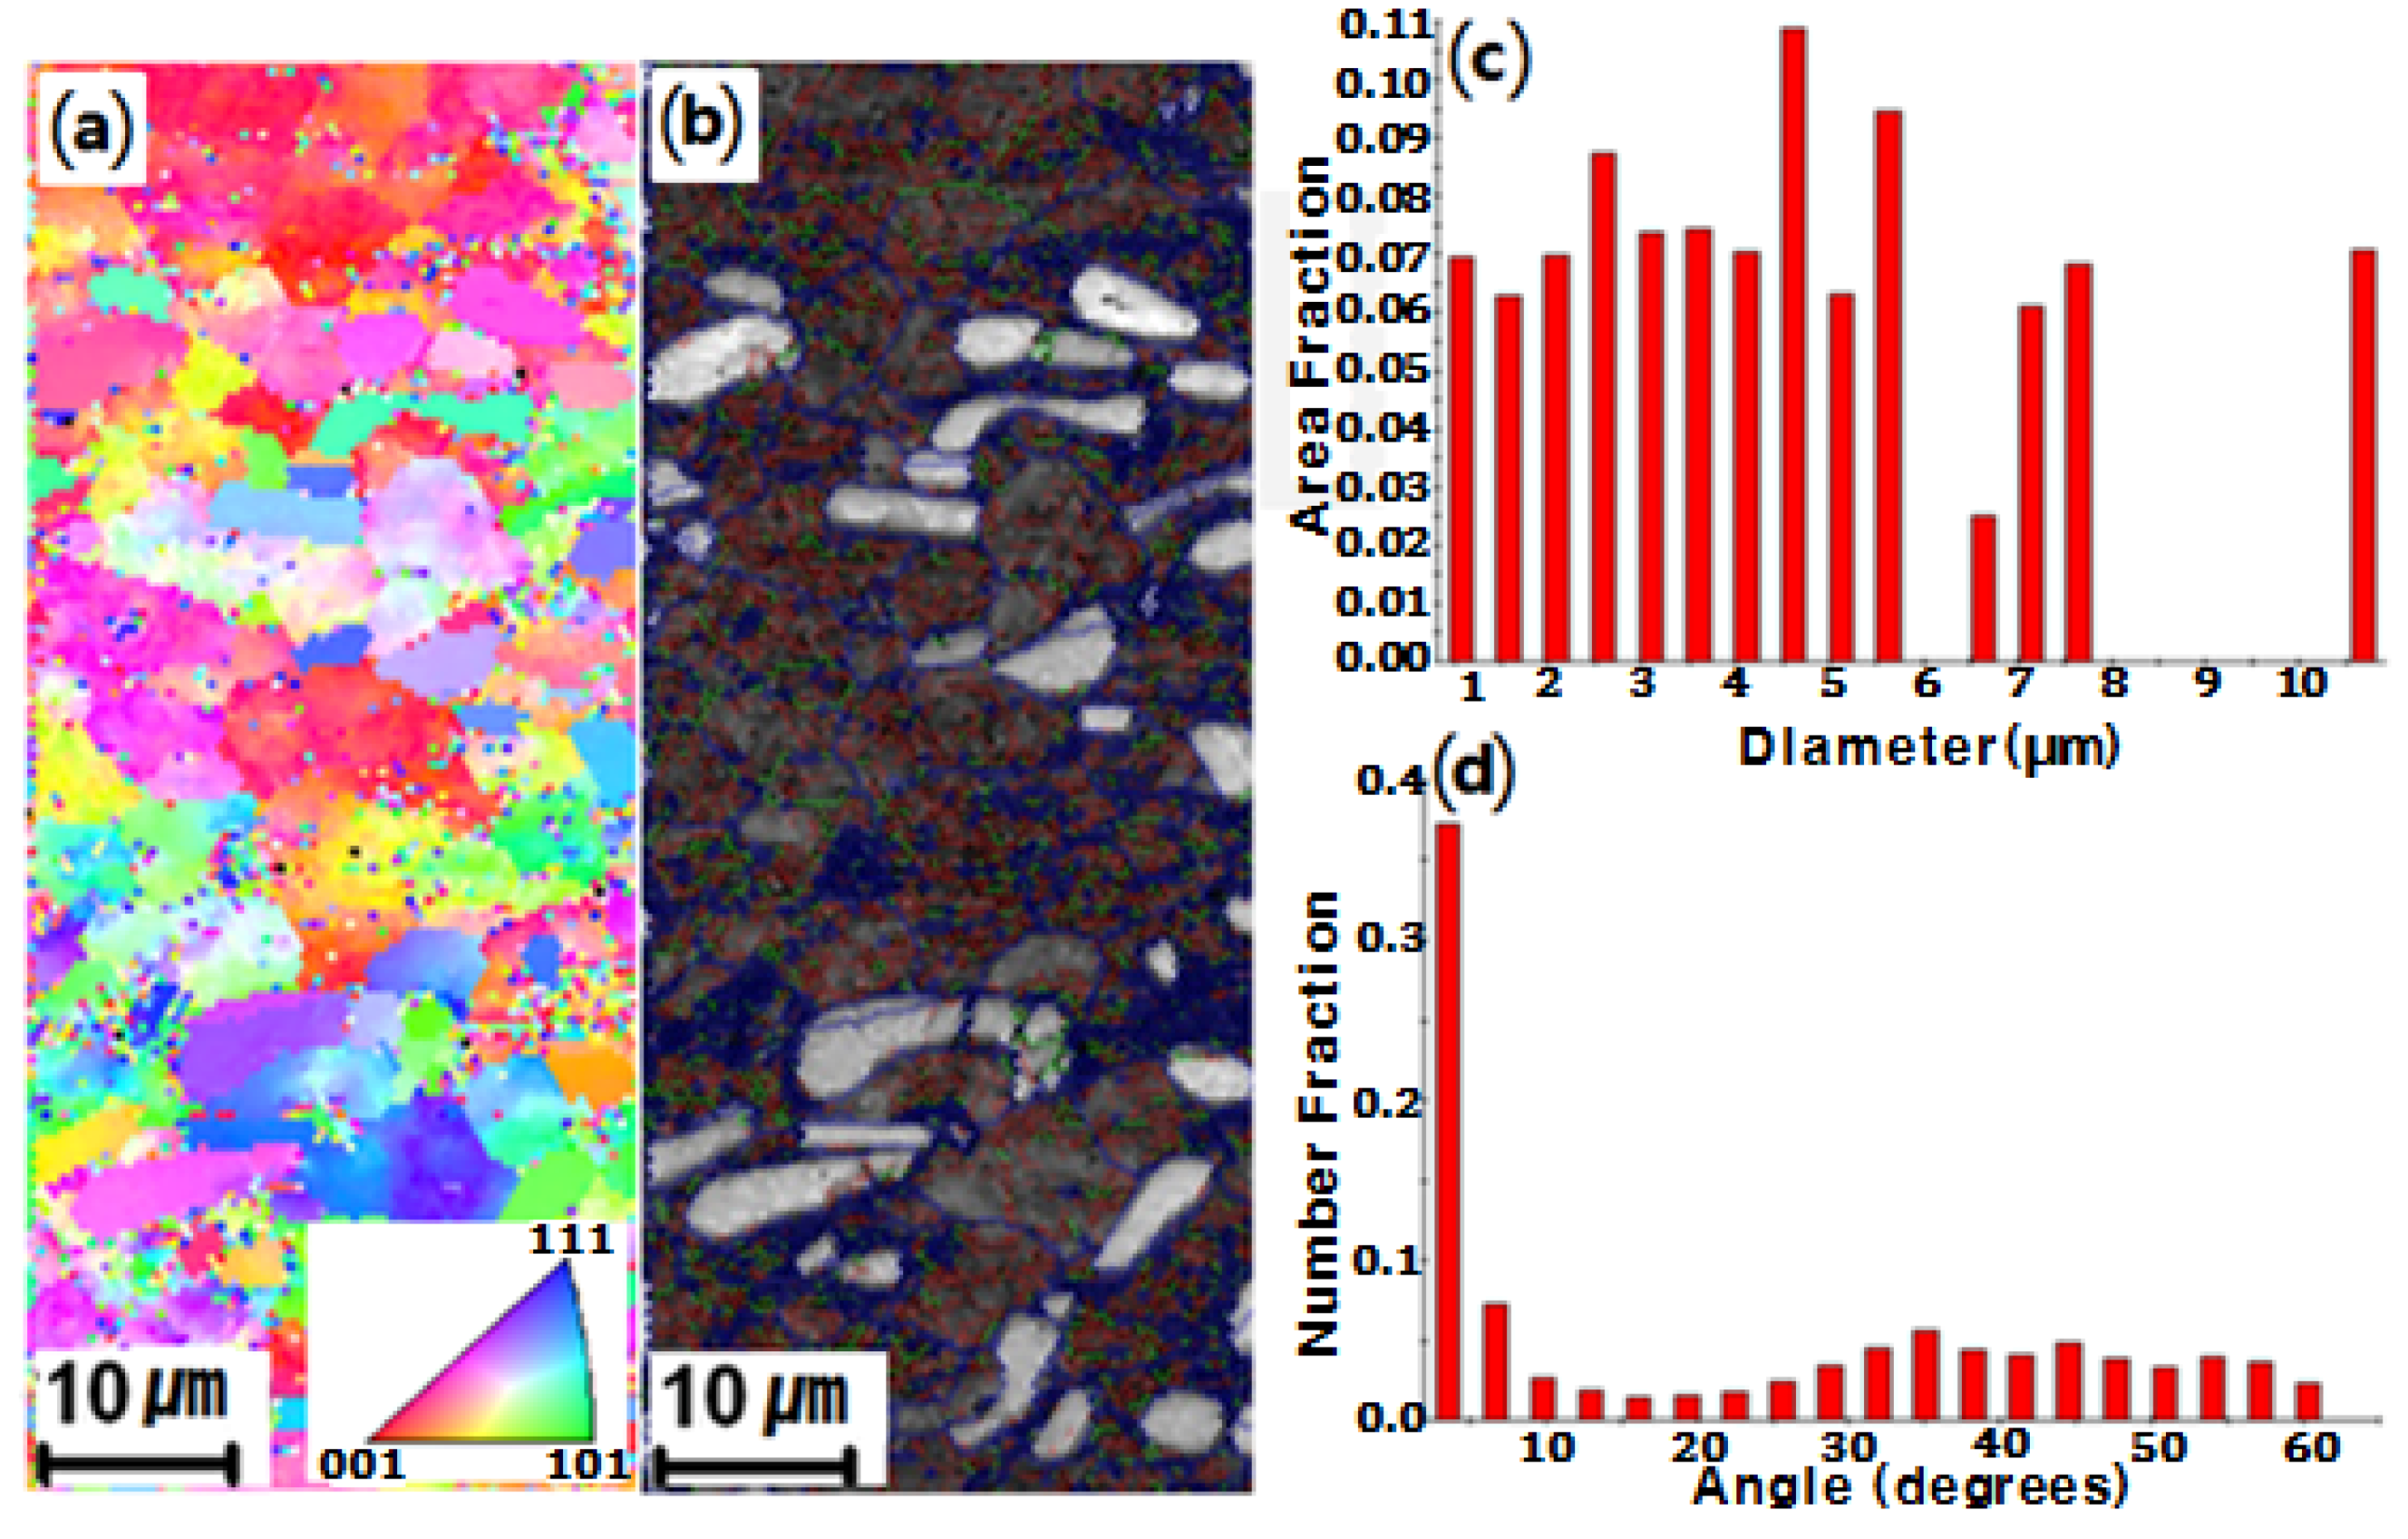
Figure 2 shows the results of the EBSD analysis data for the cross-section of the alloy. In the EBSD map (Figure 2b), low-angle boundaries (LABs) (misorientation < 15°) and high-angle boundaries (HABs) (misorientation > 15°) are shown with red and blue colors, respectively. Figure 2b also shows that the LABs which are known to show evidence of the sub-grain boundaries are mostly distributed within HABs. From Figure 2d, the fraction of HABs was measured to be approximately 60%. These results suggest that the alloy had experienced dynamic recrystallization during the extrusion process [10].
Figure 2.
EBSD analysis data of the as-received alloy: (a) EBSD map (the insert in bottom right corner of (a) showing the representation of the color key used to identify the crystallographic orientations on a standard stereographic projection); (b) grain boundary misorientation map; (c) grain size distribution; (d) misorientation angle distribution.

3.2. Phase Analysis
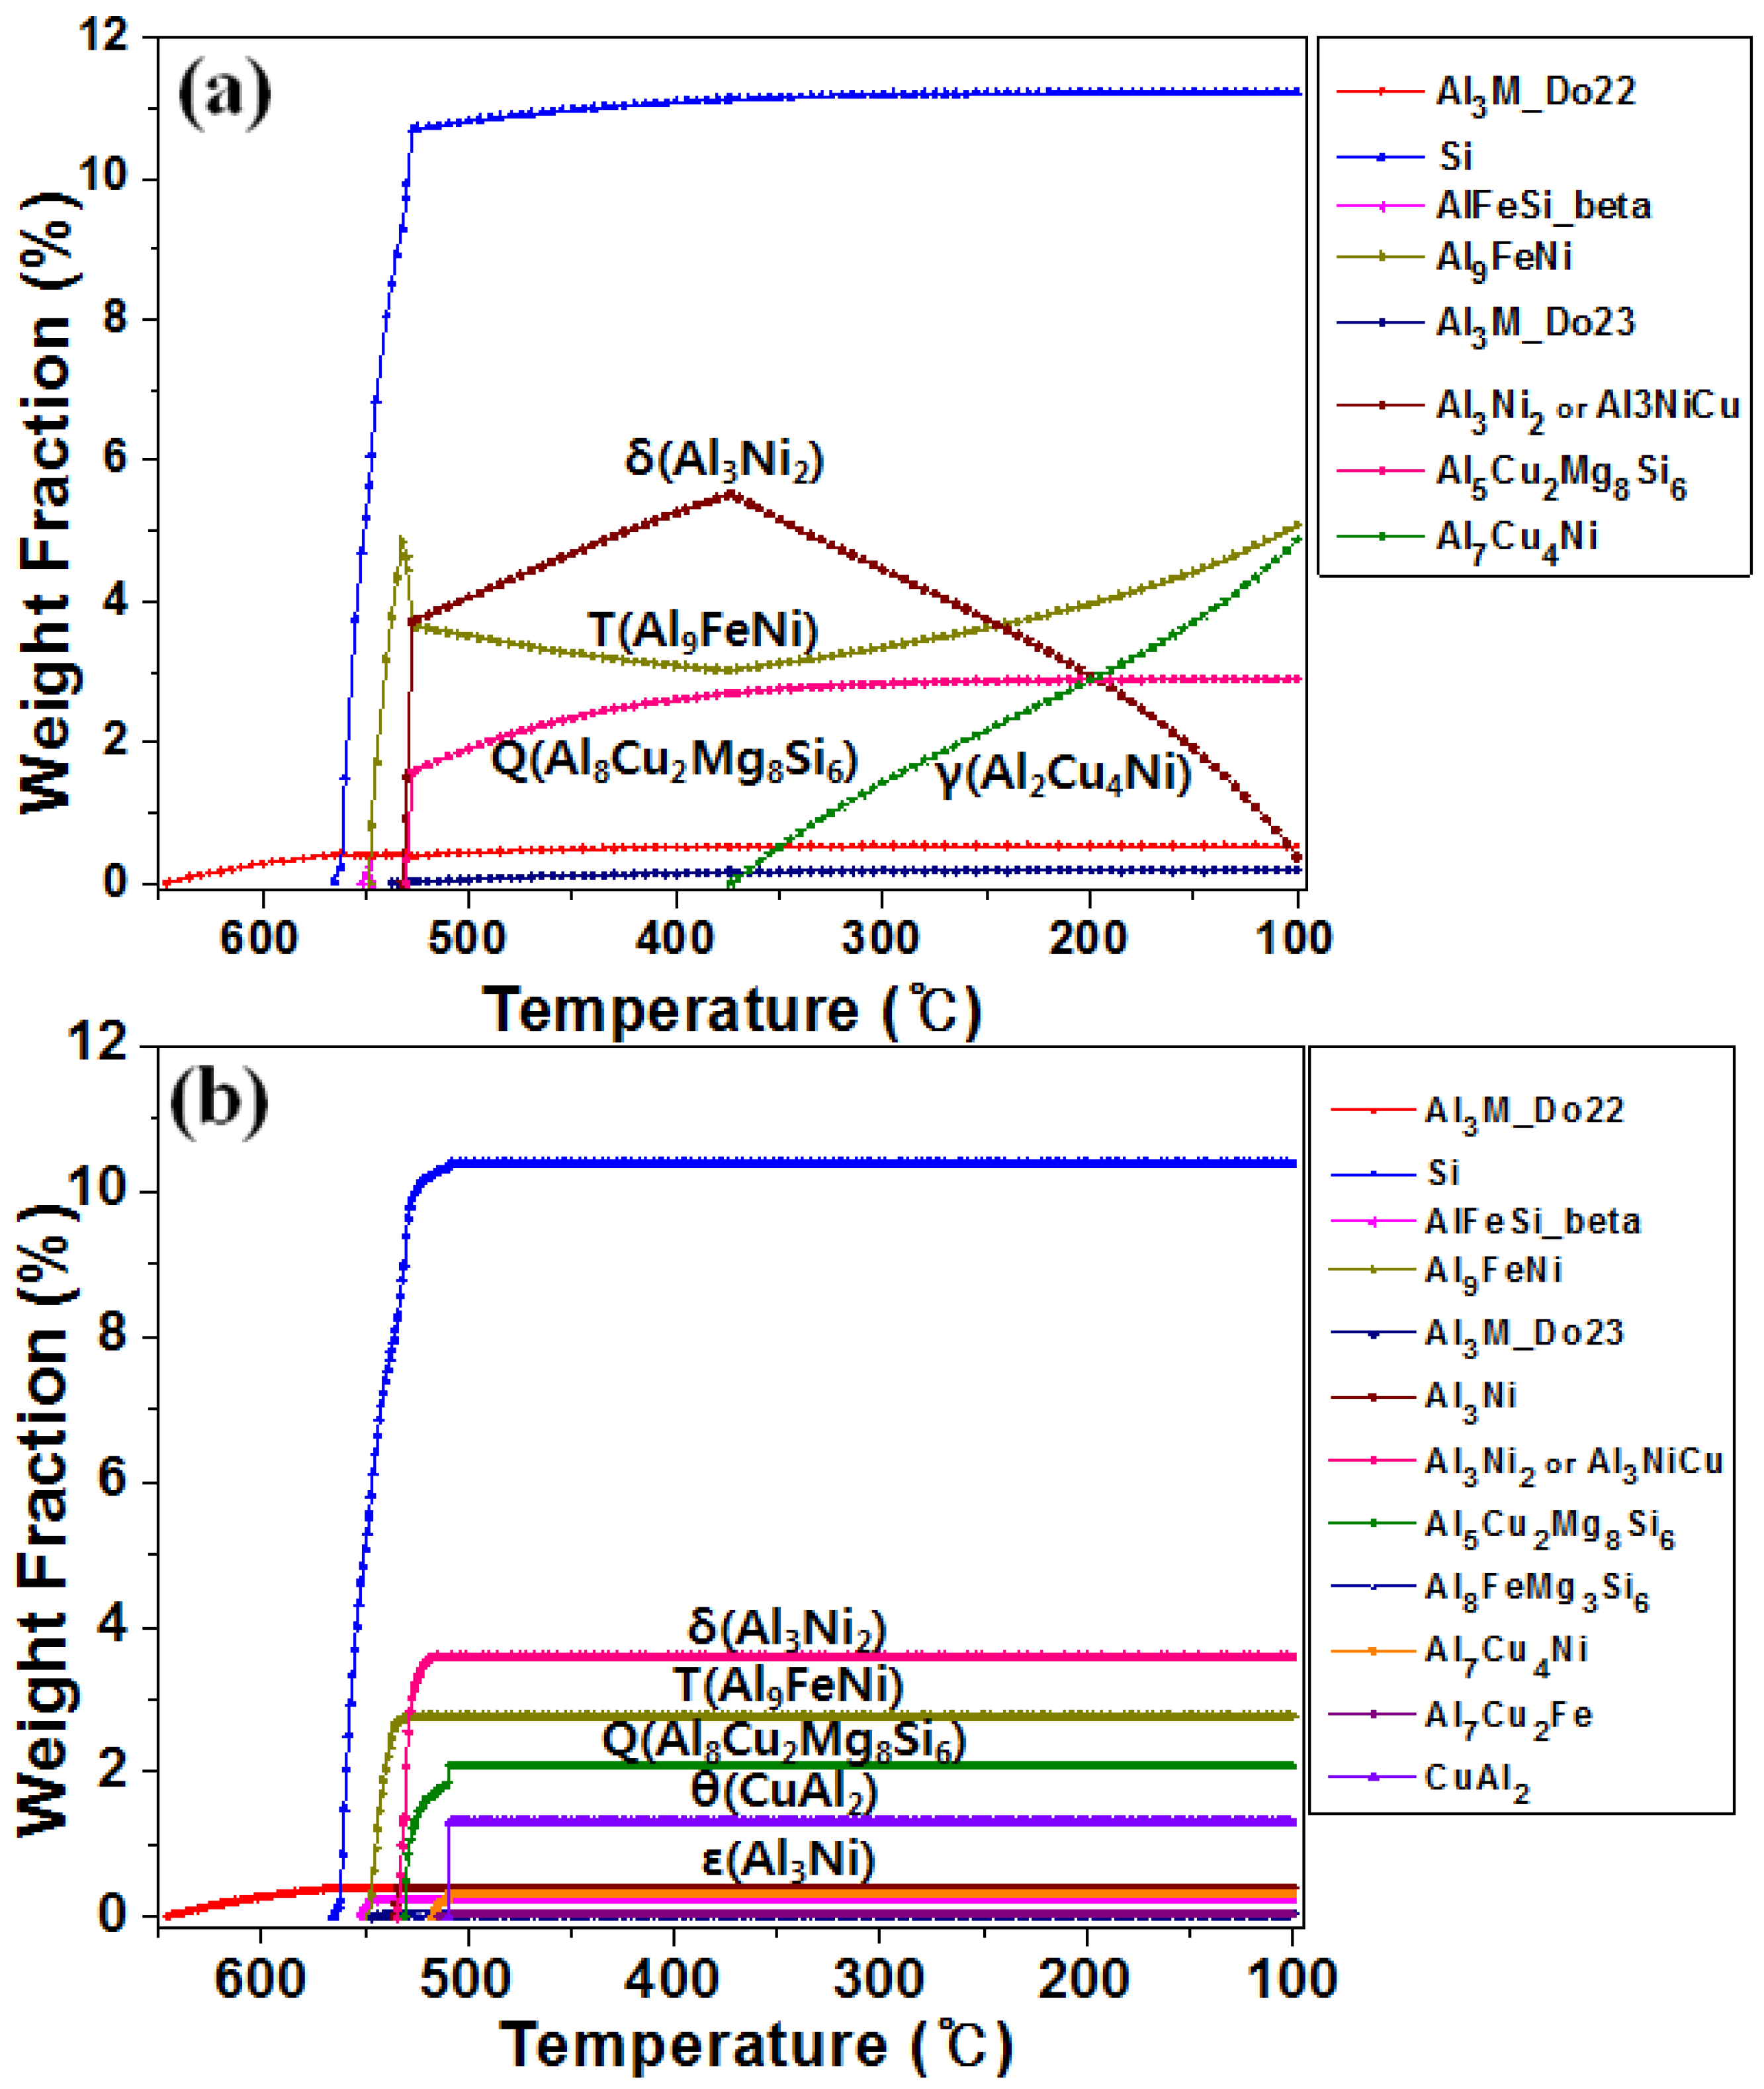
Figure 3 presents the JMatPro simulation data for the DM104 alloy, indicating the existing phases and their weight fraction during the solidification process. In the case of the equilibrium state (Figure 3a), eutectic Si and intermetallic T phase (Al9FeNi) solidify at 560 °C and 550 °C, respectively. As the temperature decreased to less than 532 °C, the weight fraction of the T phase decreased with the formation of the δ(Al3Ni2 or Al3NiCu) and Q(Al8Cu2Mg8Si6) phases. The weight fraction of the δ phase decreased with increasing formation of the T and γ(Al2Cu4Ni) phase under 375 °C. At the end of the solidification process, the Si phase comprised approximately 11% of the weight fraction and every intermetallic phase comprised less than 5% of the weight fraction. Although the solidification temperatures of the main phases appeared to be similar among the results in Figure 3a,b, the weight fraction of each phase in the non-equilibrium state (Figure 3b) maintained a specific value until the end of solidification. Figure 3b shows that the δ, T and Q phases have considerable weight fractions.
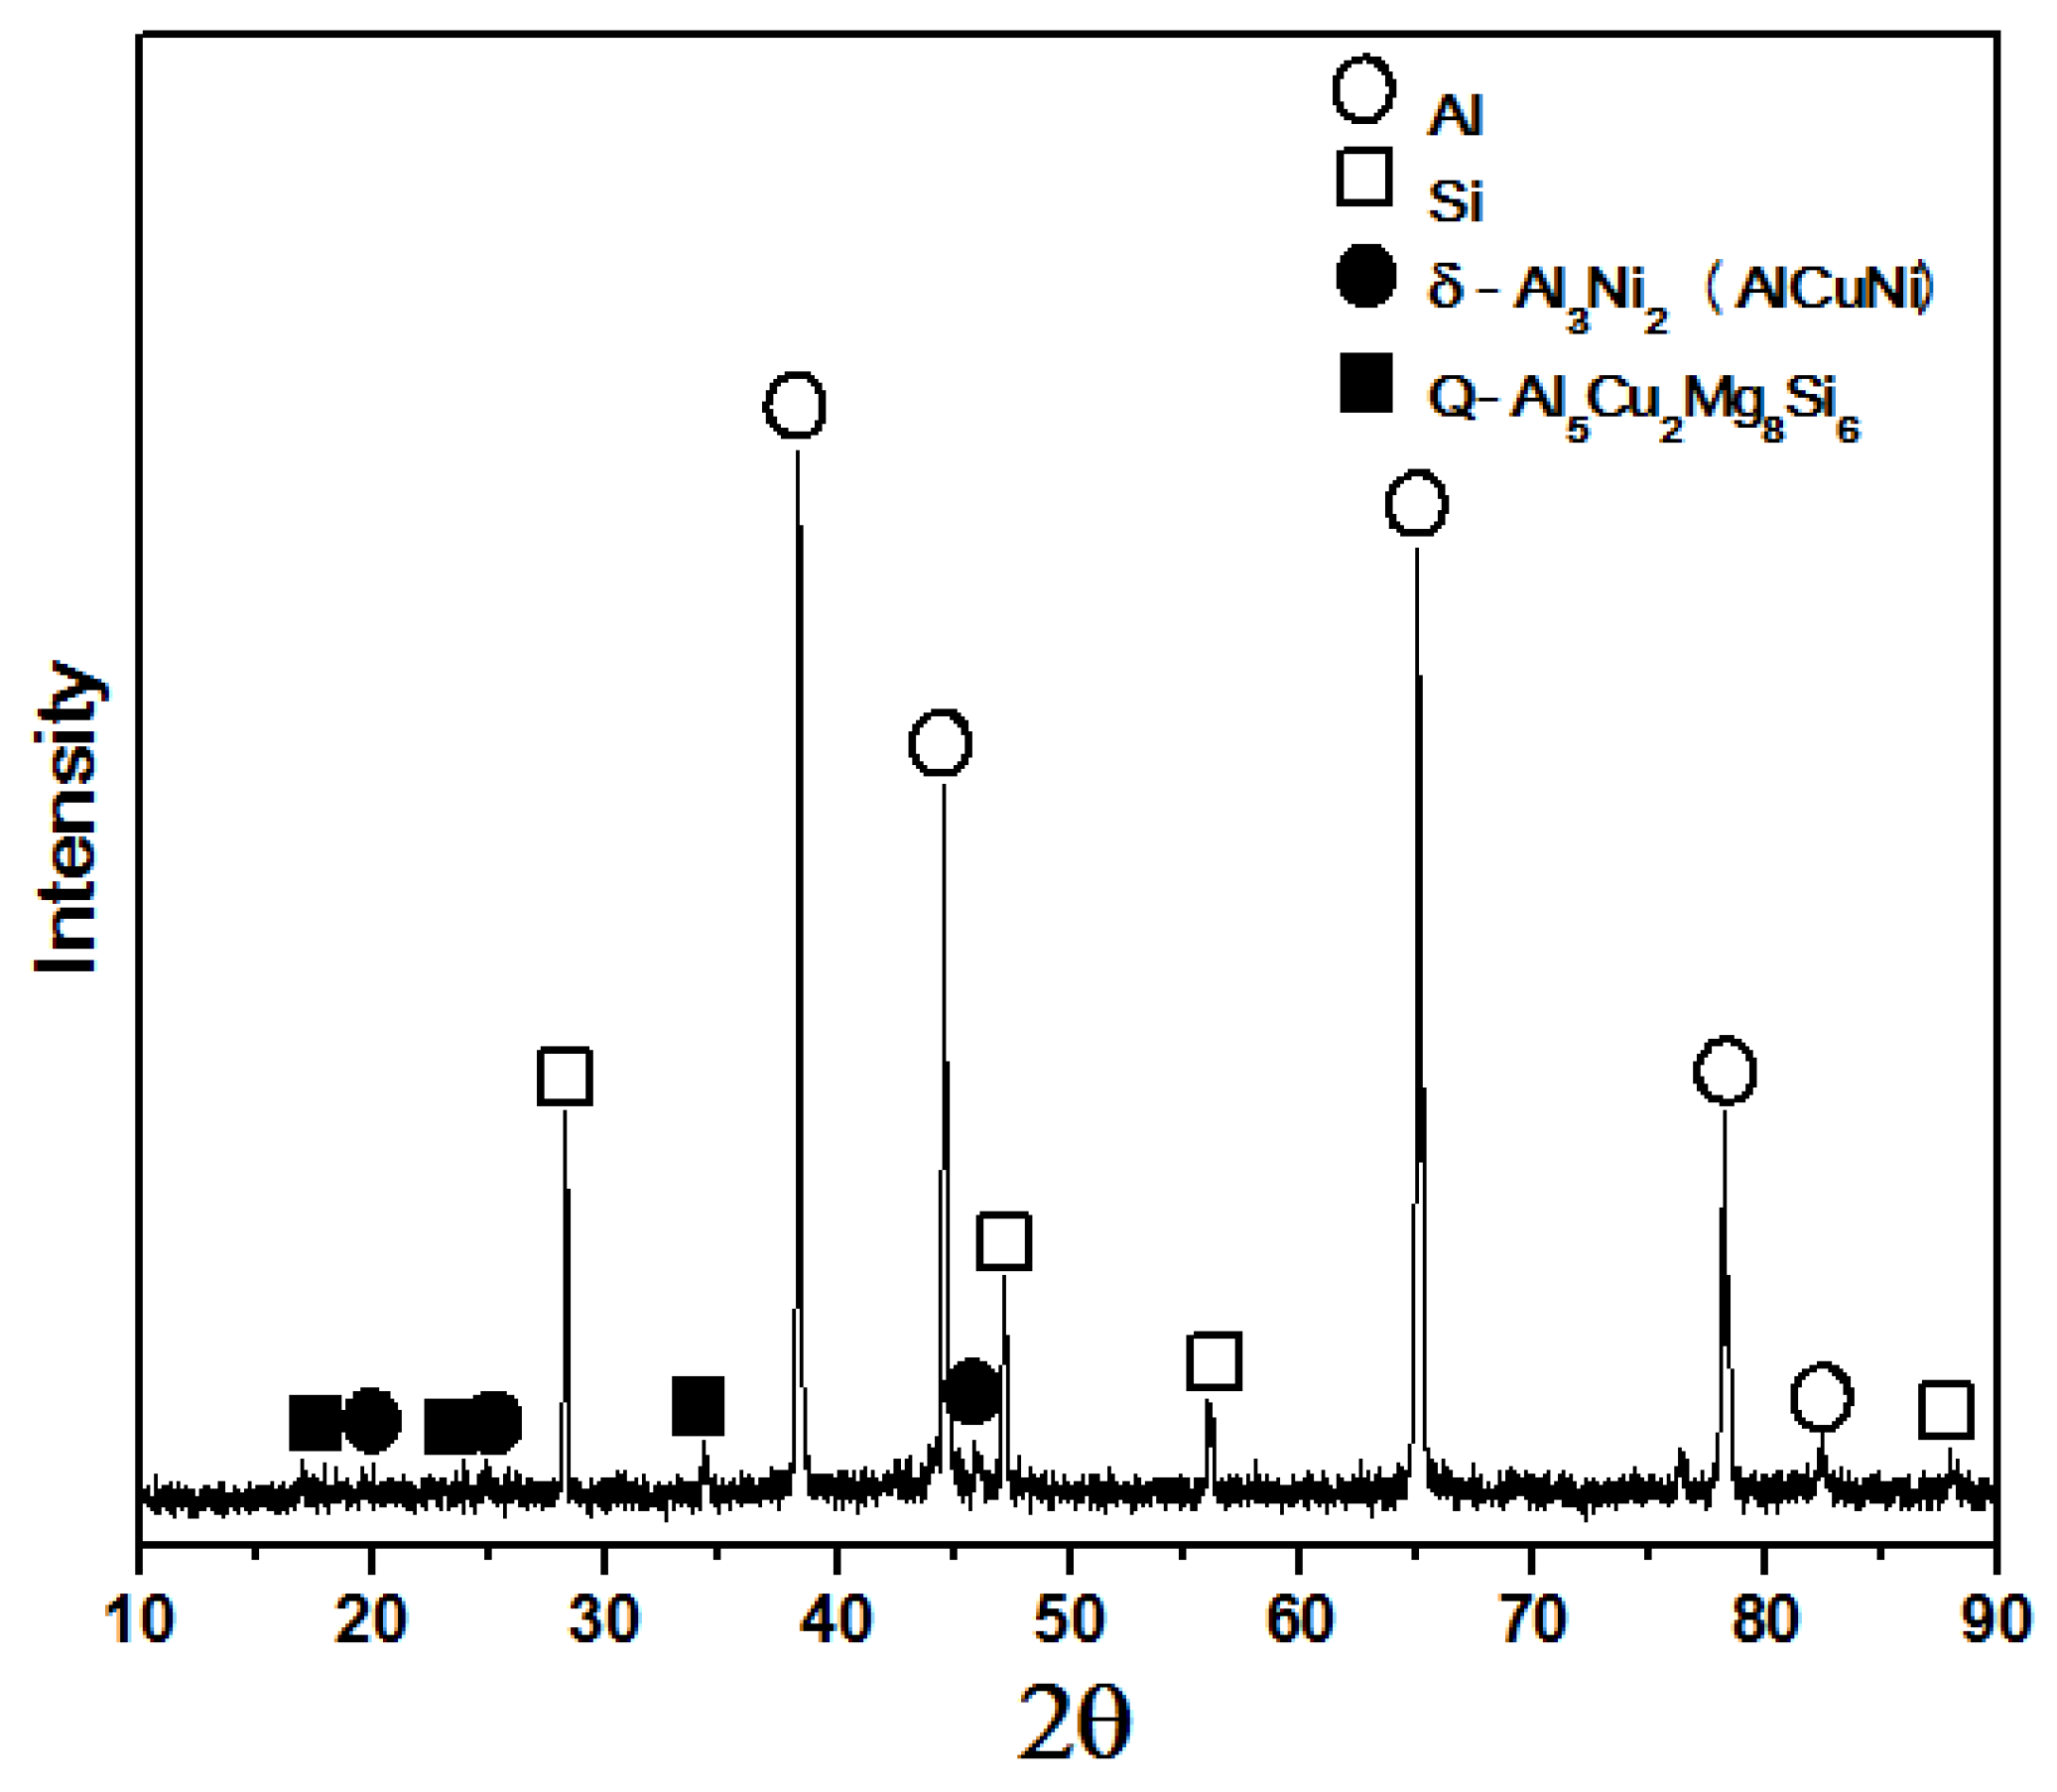
Figure 4 shows the XRD patterns of the as-received alloy, indicating the peaks of δ(Al3Ni2 or Al3NiCu) and Q(Al8Cu2Mg8Si6) phases in addition to the intensive peaks of Al and Si phases.
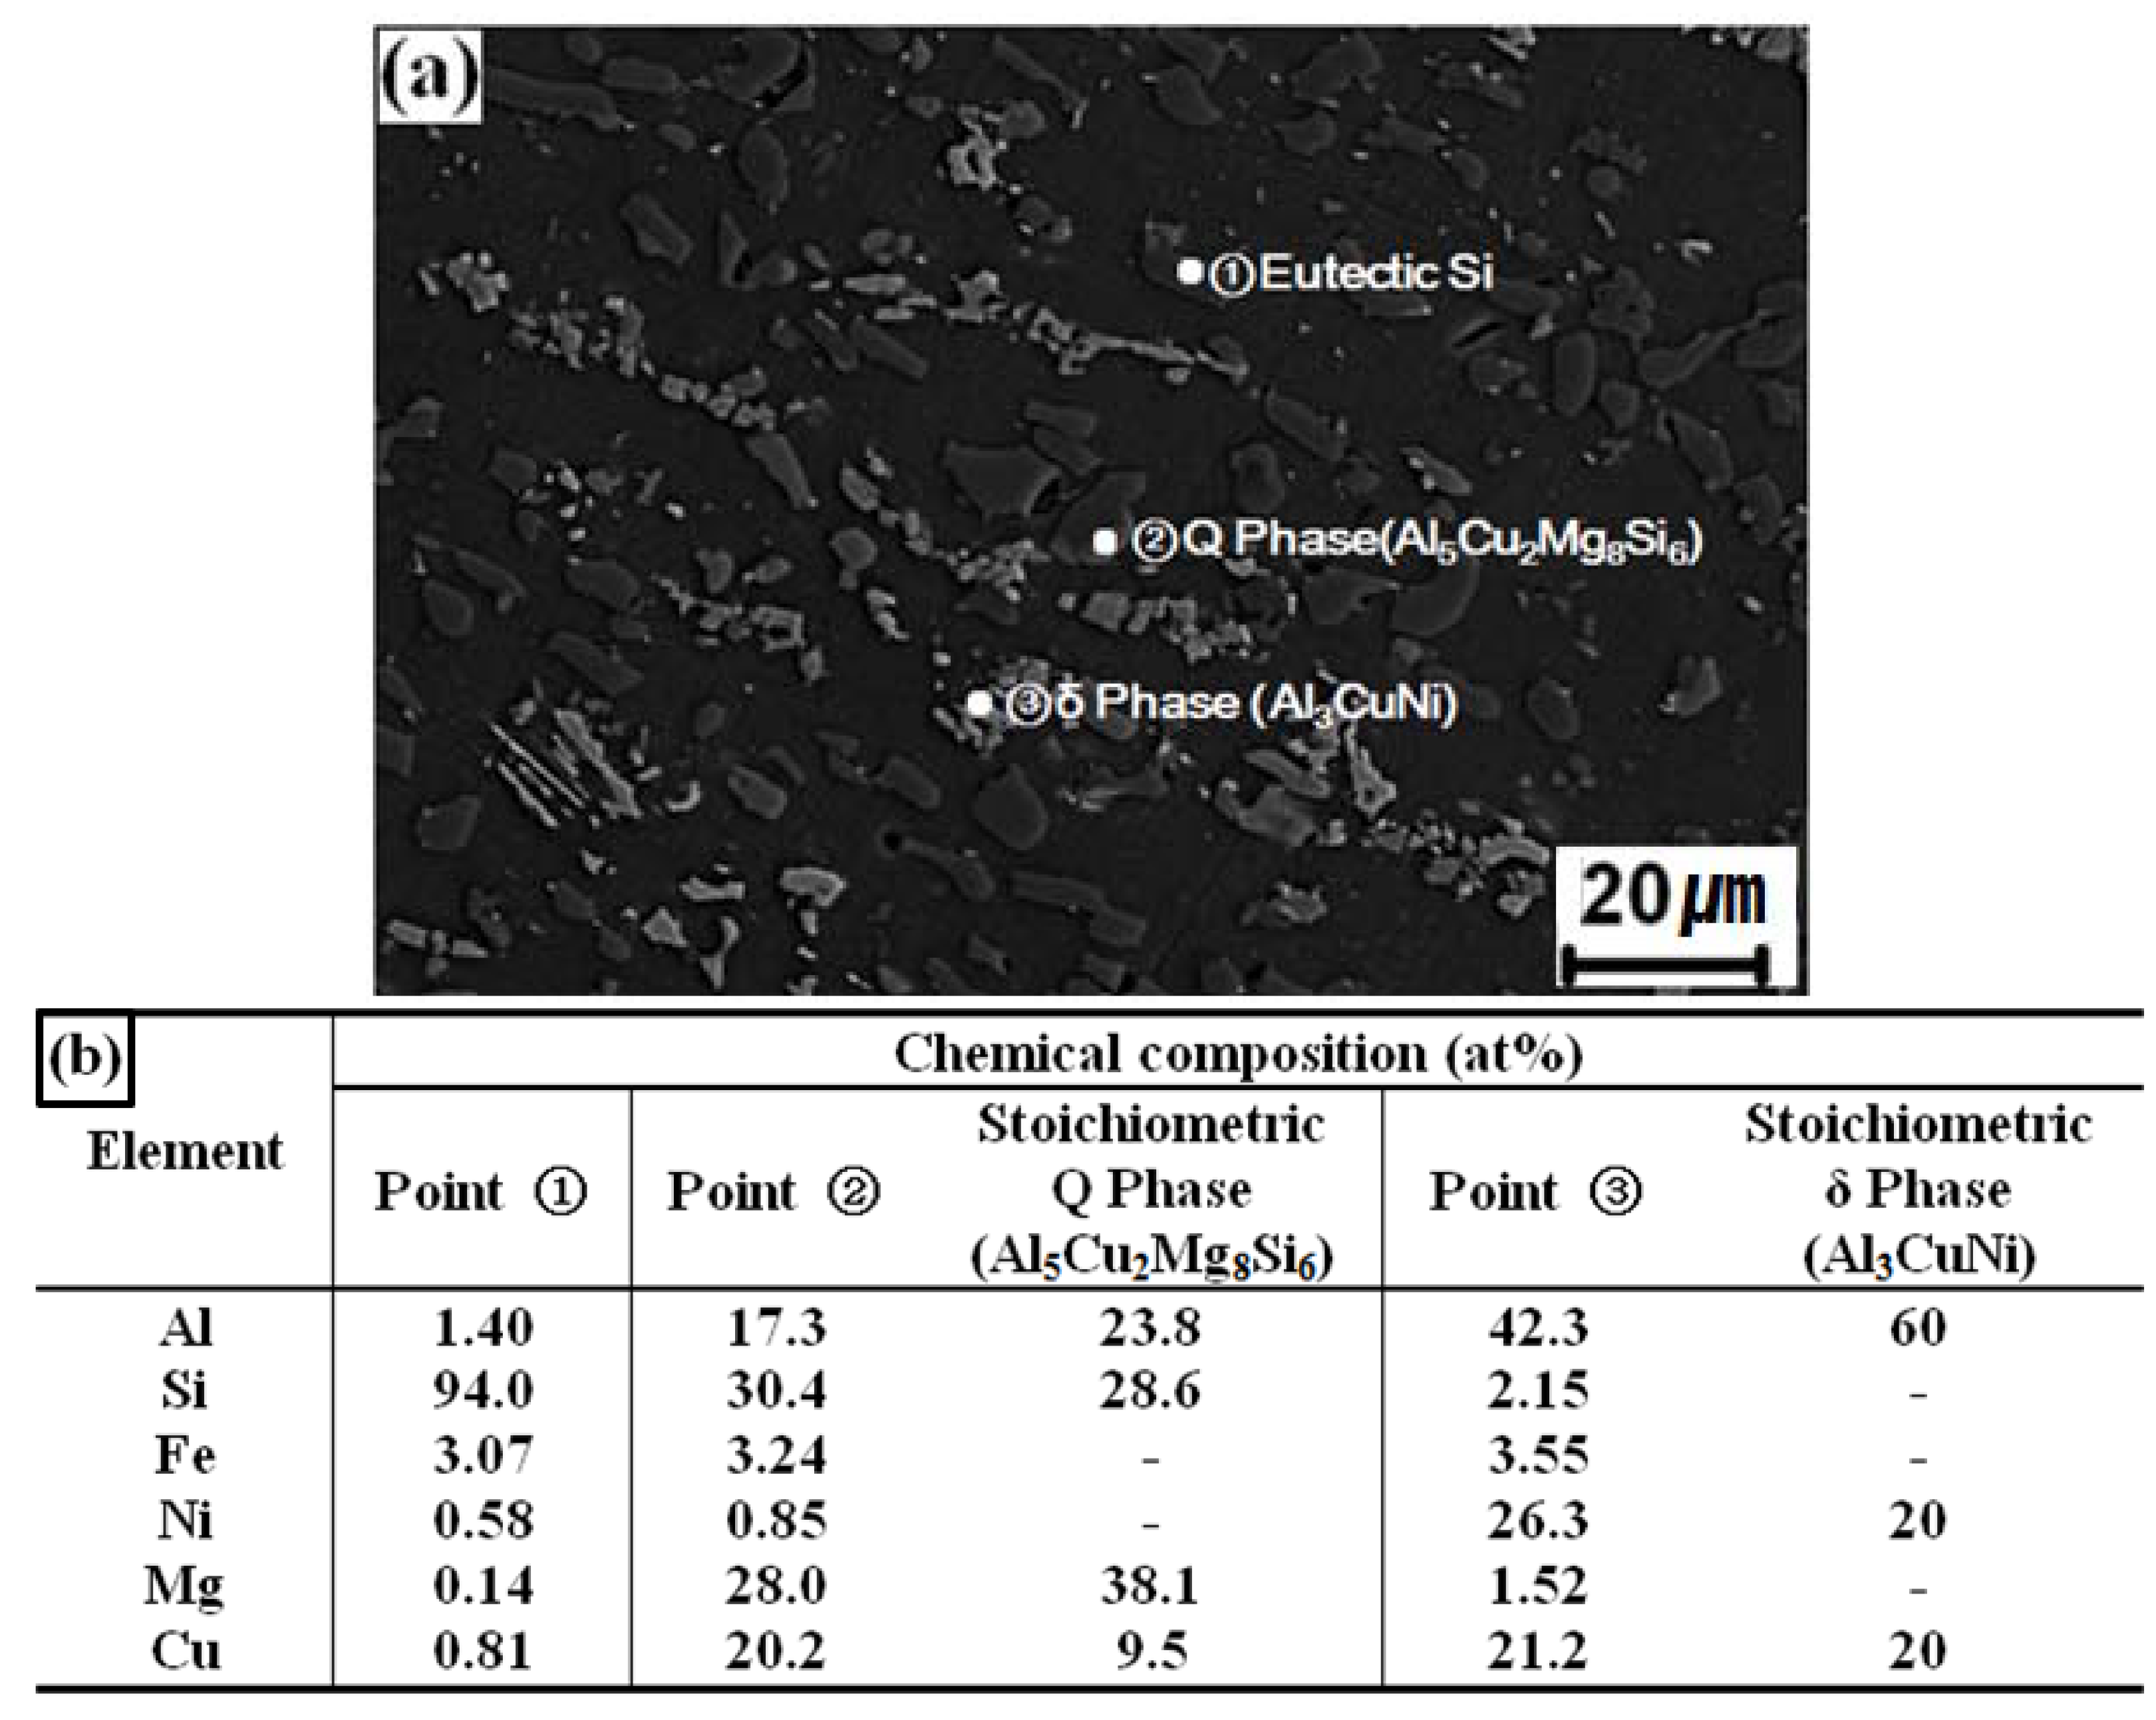
Figure 5a shows a SEM image of the alloy. The phases labeled in Figure 5a were identified by EDS, and their chemical compositions are given in Figure 5b. The chemical compositions of points ② and ③ appear to correspond to the stoichiometric composition of the Q(Al8Cu2Mg8Si6) and δ(Al3NiCu) phases, respectively. The δ and Q phases are frequently detected by SEM (Figure 5a), and these results are in accordance with both the XRD pattern in Figure 4 and the JMatPro simulation data in Figure 3.
Figure 3.
JMatPro simulation data of the as-received alloy for (a) equilibrium; (b) non-equilibrium state.
Figure 3.
JMatPro simulation data of the as-received alloy for (a) equilibrium; (b) non-equilibrium state.

Figure 4.
XRD result of the as-received alloy.

Figure 5.
(a) SEM image; (b) EDS analysis data of the as-received alloy.
3.3. Compressive Deformation
Figure 6 presents the true stress-true strain curves of the specimens compressive-tested at temperatures between 250 and 470 °C and strain rates between 0.001 and 1/s. The flow stress increased sharply with increasing strain at the initial stages of deformation. The flow stress then decreased and finally reached a steady-state with further increases in strain. The steady-state behavior was initiated at a lower strain range of deformation at a higher test temperature.
Figure 6.
True stress-true strain curves of the specimens compressed at various temperatures under a strain rate of (a) 0.001/s; (b) 0.0035/s; (c) 0.35/s; (d) 1/s.
Figure 6.
True stress-true strain curves of the specimens compressed at various temperatures under a strain rate of (a) 0.001/s; (b) 0.0035/s; (c) 0.35/s; (d) 1/s.
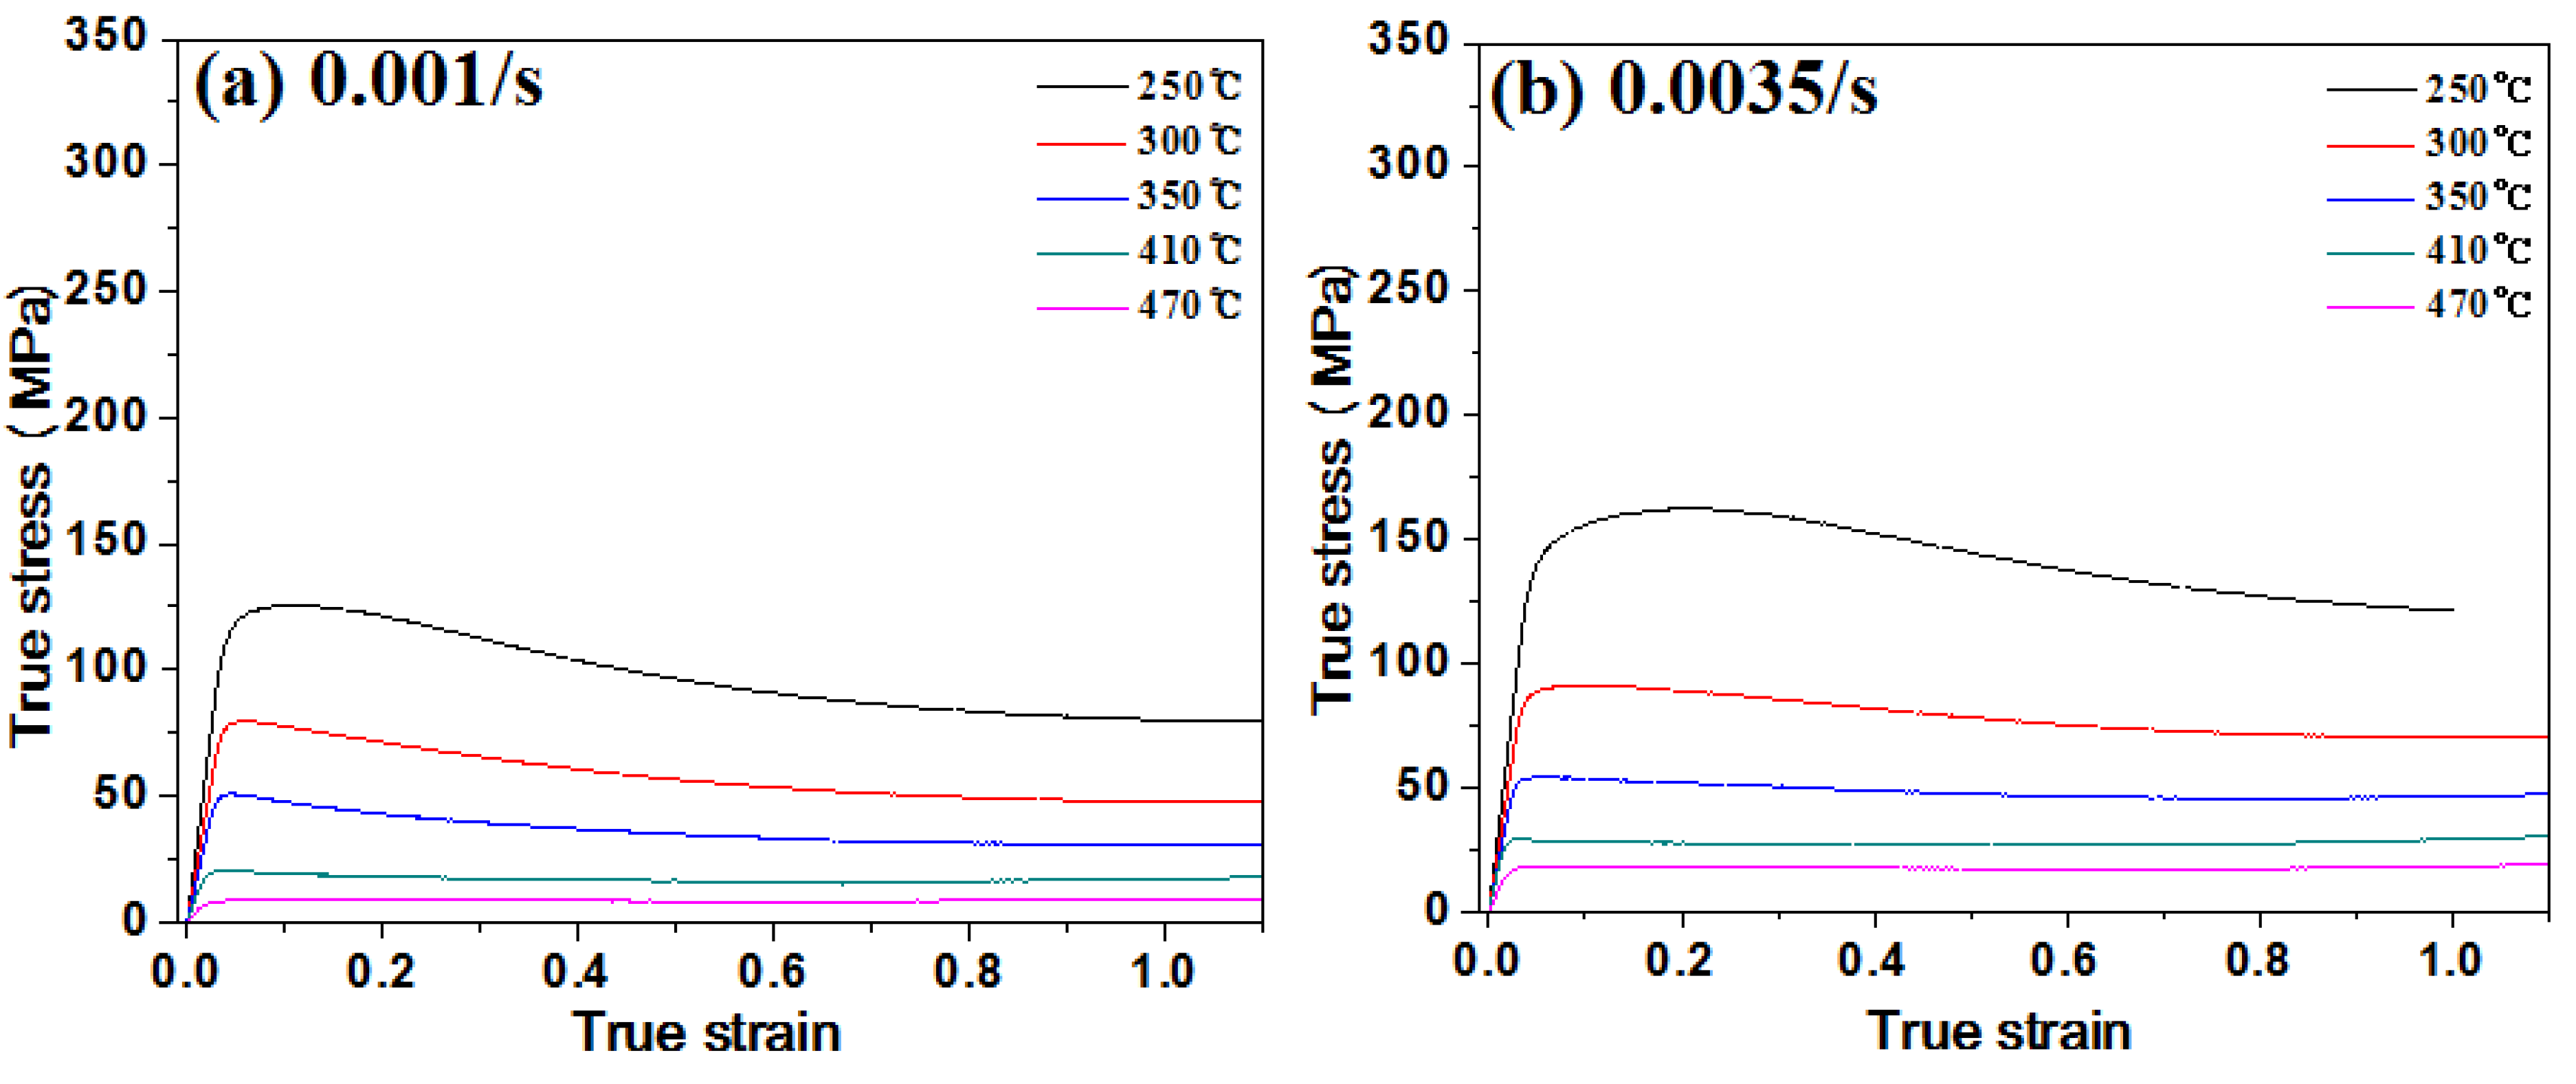
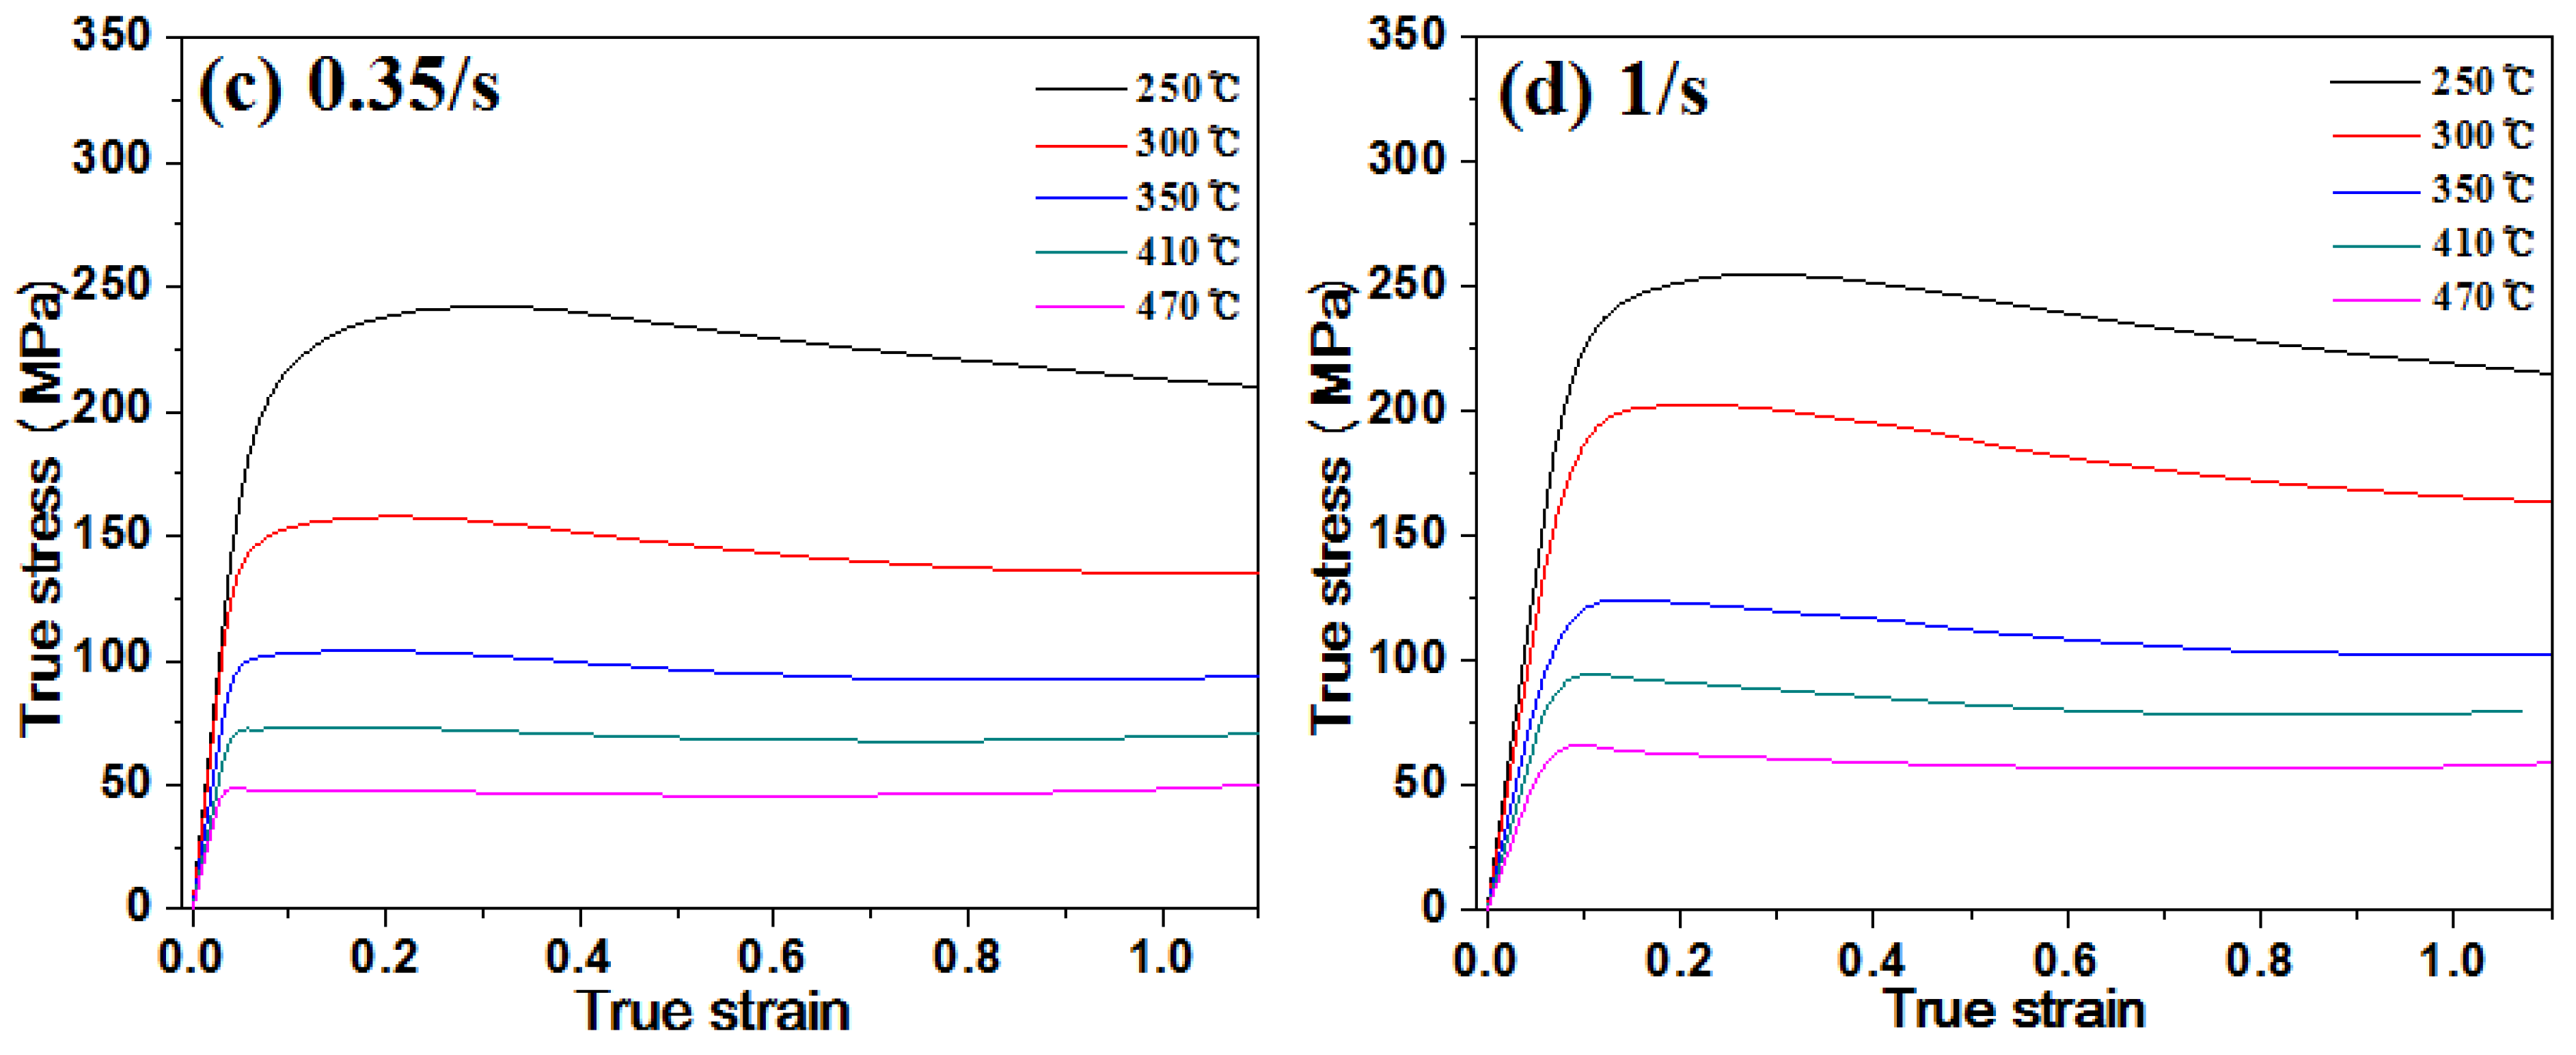
Figure 7 shows the temperature-dependence of the steady-state stress for different strain rates. At a given temperature, the steady-state stress increased with increasing strain rate, and at a given strain rate, the steady-state stress decreased with increasing temperature.
Figure 7.
Variation of the steady-state stress with temperature at different strain rates.
3.4. Constitutive Equations
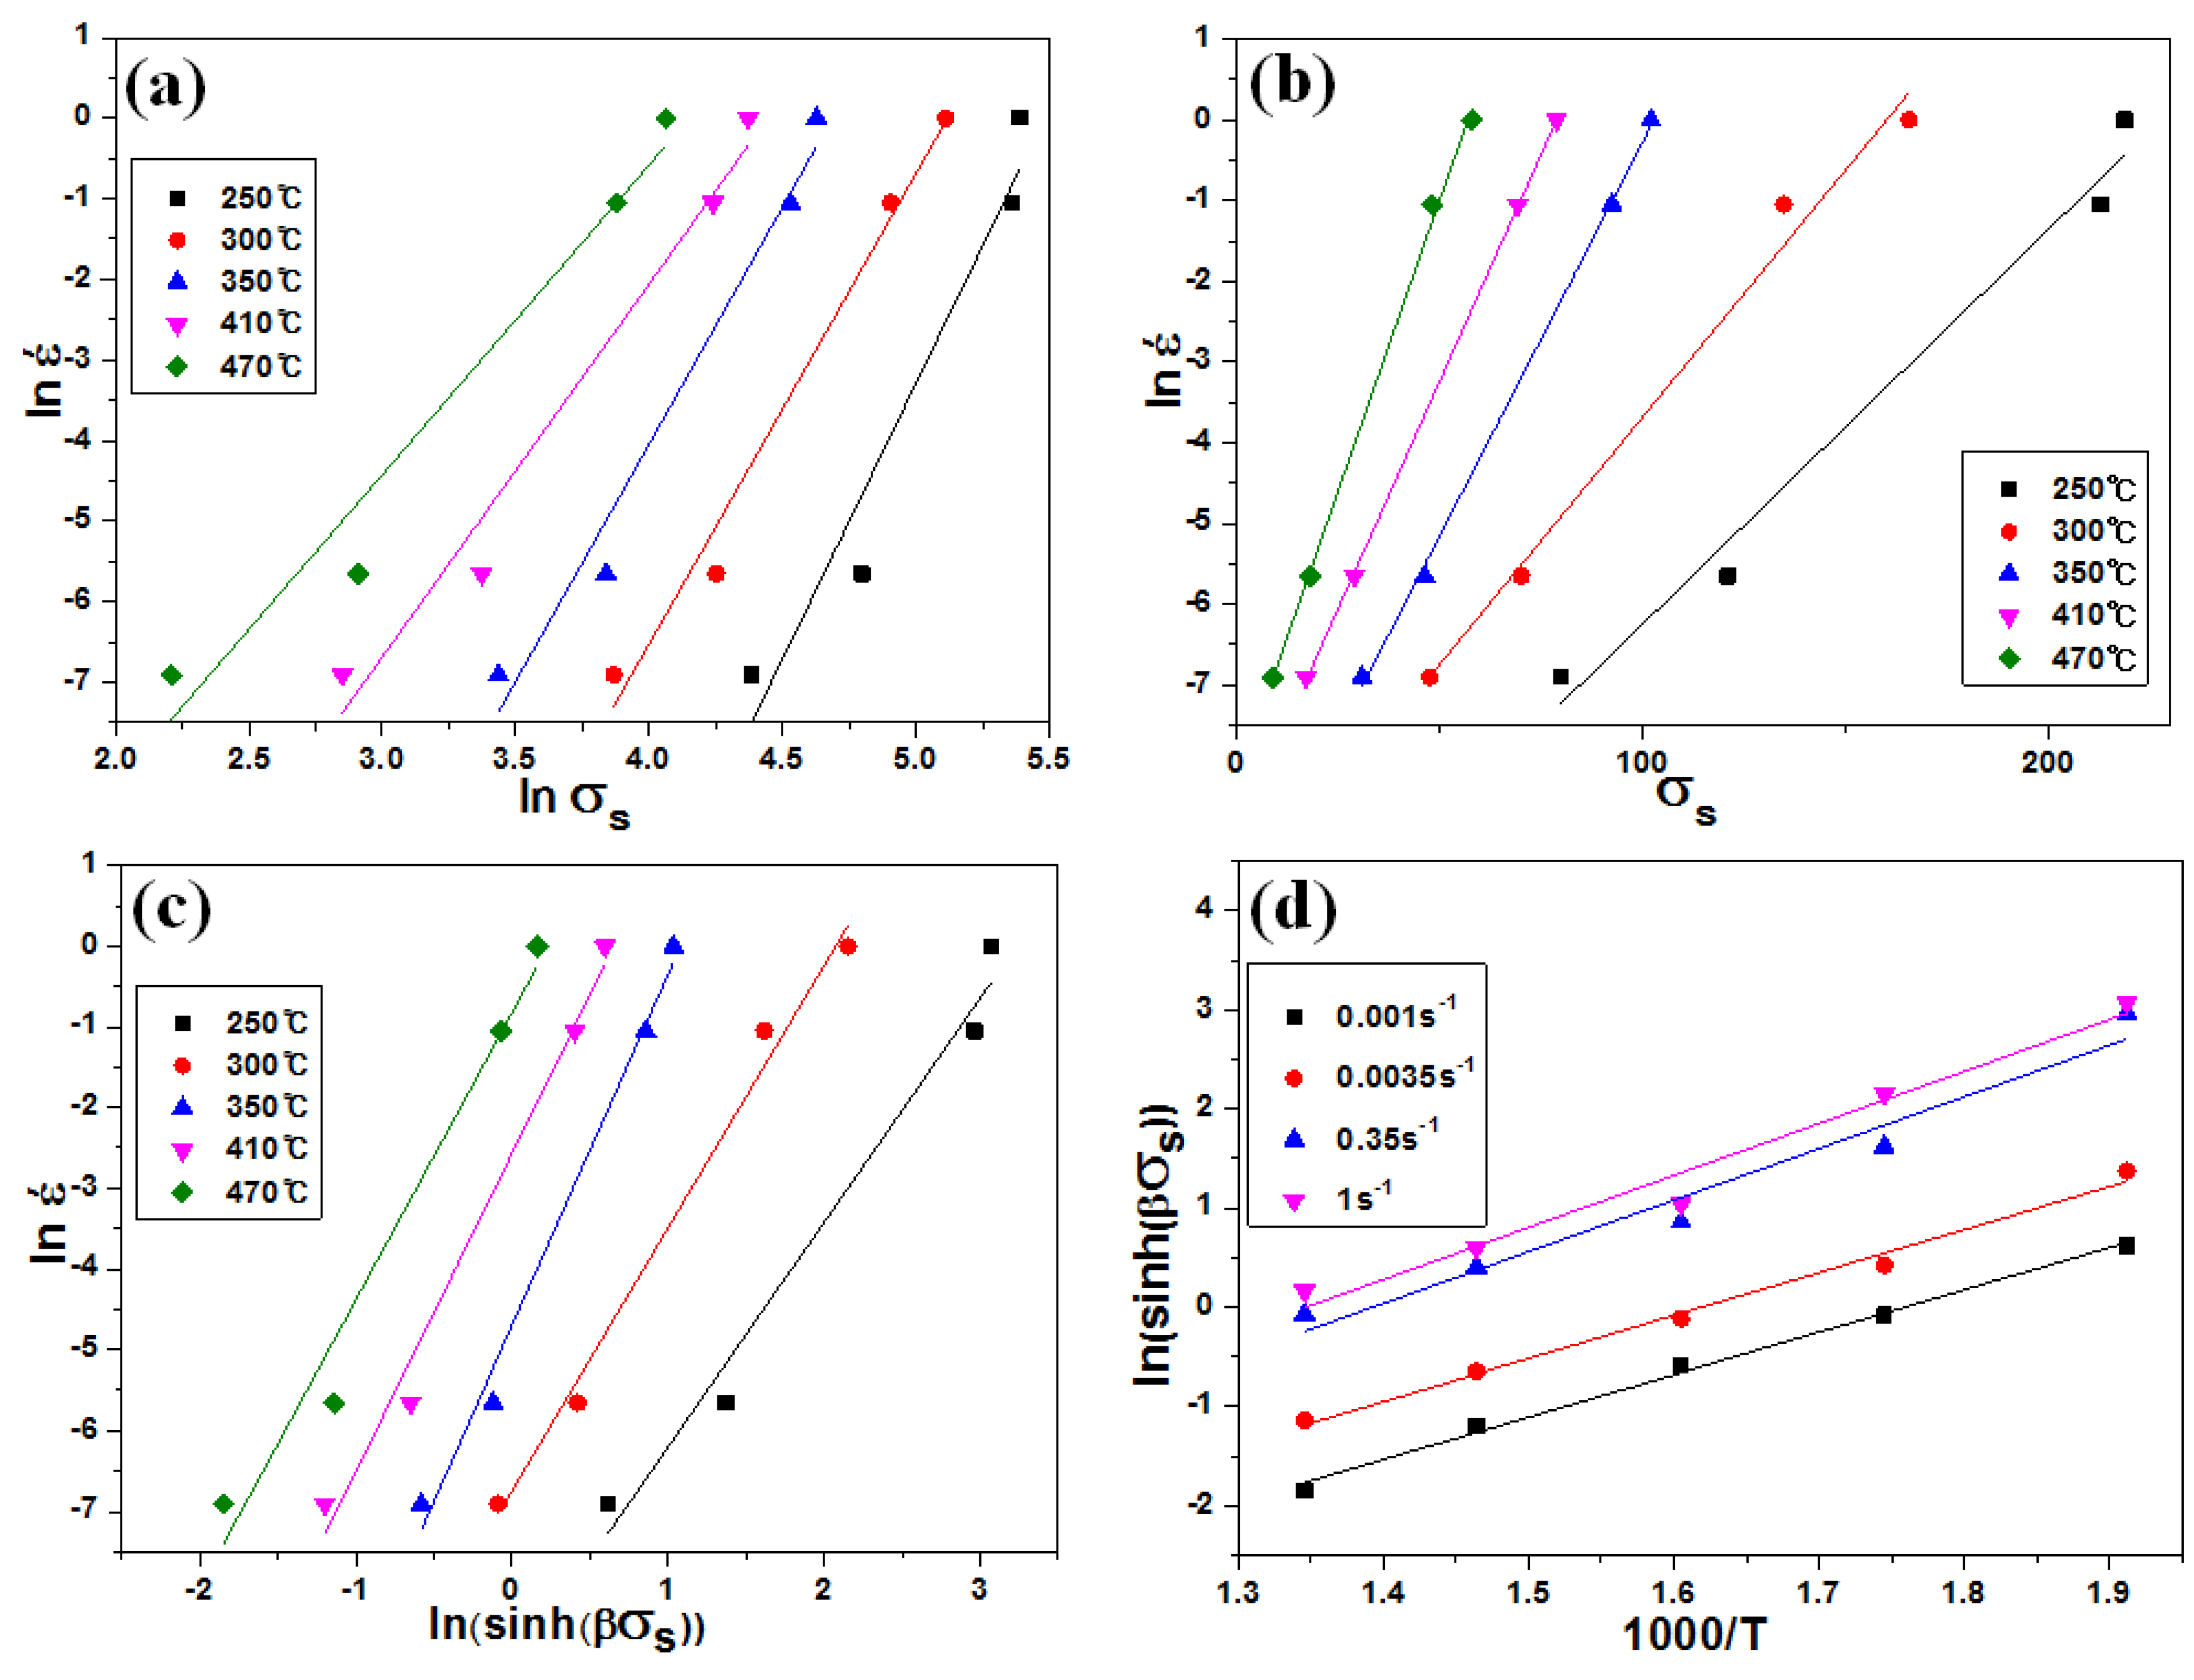
Constitutive equations, such as Equations (1)–(3), have been used to describe the relationship between the stress (σ), temperature (T) and strain rate (έ) during the high temperature deformation of an Al-based alloy [11,12,13]. A1, A2, A3, n, n’, α, and β (=α/n) are material constants. In the present study, constitutive equations were deduced using the steady-state stress values from Figure 6. The power law, Equation (1), and exponential law, Equation (2), break down at the higher and lower stress regions, respectively. In contrast, the hyperbolic sine law, Equation (3), is suitable for stresses over a wide range.
Figure 8a,b show linear plots of ln(έ)-ln(σ) and ln(έ)-σ for the deformed alloys, respectively. The average values of n and α were calculated from the slope in Figure 8a,b, respectively. The value of β (β = α/n) was applied to the hyperbolic sine law, Equation (3). Figure 8c,d present linear plots of ln(έ)-ln[sinh(ασ)] and ln[sinh(ασ)]-1000/T for the deformed alloys, respectively. The mean values of n’ and Q (activation energy) were calculated from the slope in Figure 8c,d, respectively. Table 2 presents the calculated constants from the above equations. As a result, the hyperbolic sine law of the alloy can be expressed as Equation (4).
Figure 8.
Relationship between steady-state stress, strain rate and temperature: (a) ln(έ) versus ln(σ); (b) ln(έ) versus σ; (c) ln(έ) versus ln[sinh(βσ)]; (d) ln[sinh(βσ)] versus 1000/T.
Figure 8.
Relationship between steady-state stress, strain rate and temperature: (a) ln(έ) versus ln(σ); (b) ln(έ) versus σ; (c) ln(έ) versus ln[sinh(βσ)]; (d) ln[sinh(βσ)] versus 1000/T.

| Constant | n | α | β | A3 (s−1) | n‘ | Q (kJ/mol) |
|---|---|---|---|---|---|---|
| Value | 5.41 | 0.093 | 0.017 | 5.3 × 10⁹ | 3.57 | 142 |
3.5. Zener-Hollomon Parameter
The deformation temperature and strain rate are incorporated into the Zener-Hollomon (Z) parameter, Equation (5).
Equation (6), which gives the relationship between sinh(βσ) and the Z parameter, can be obtained by combining Equation (4) with Equation (5).
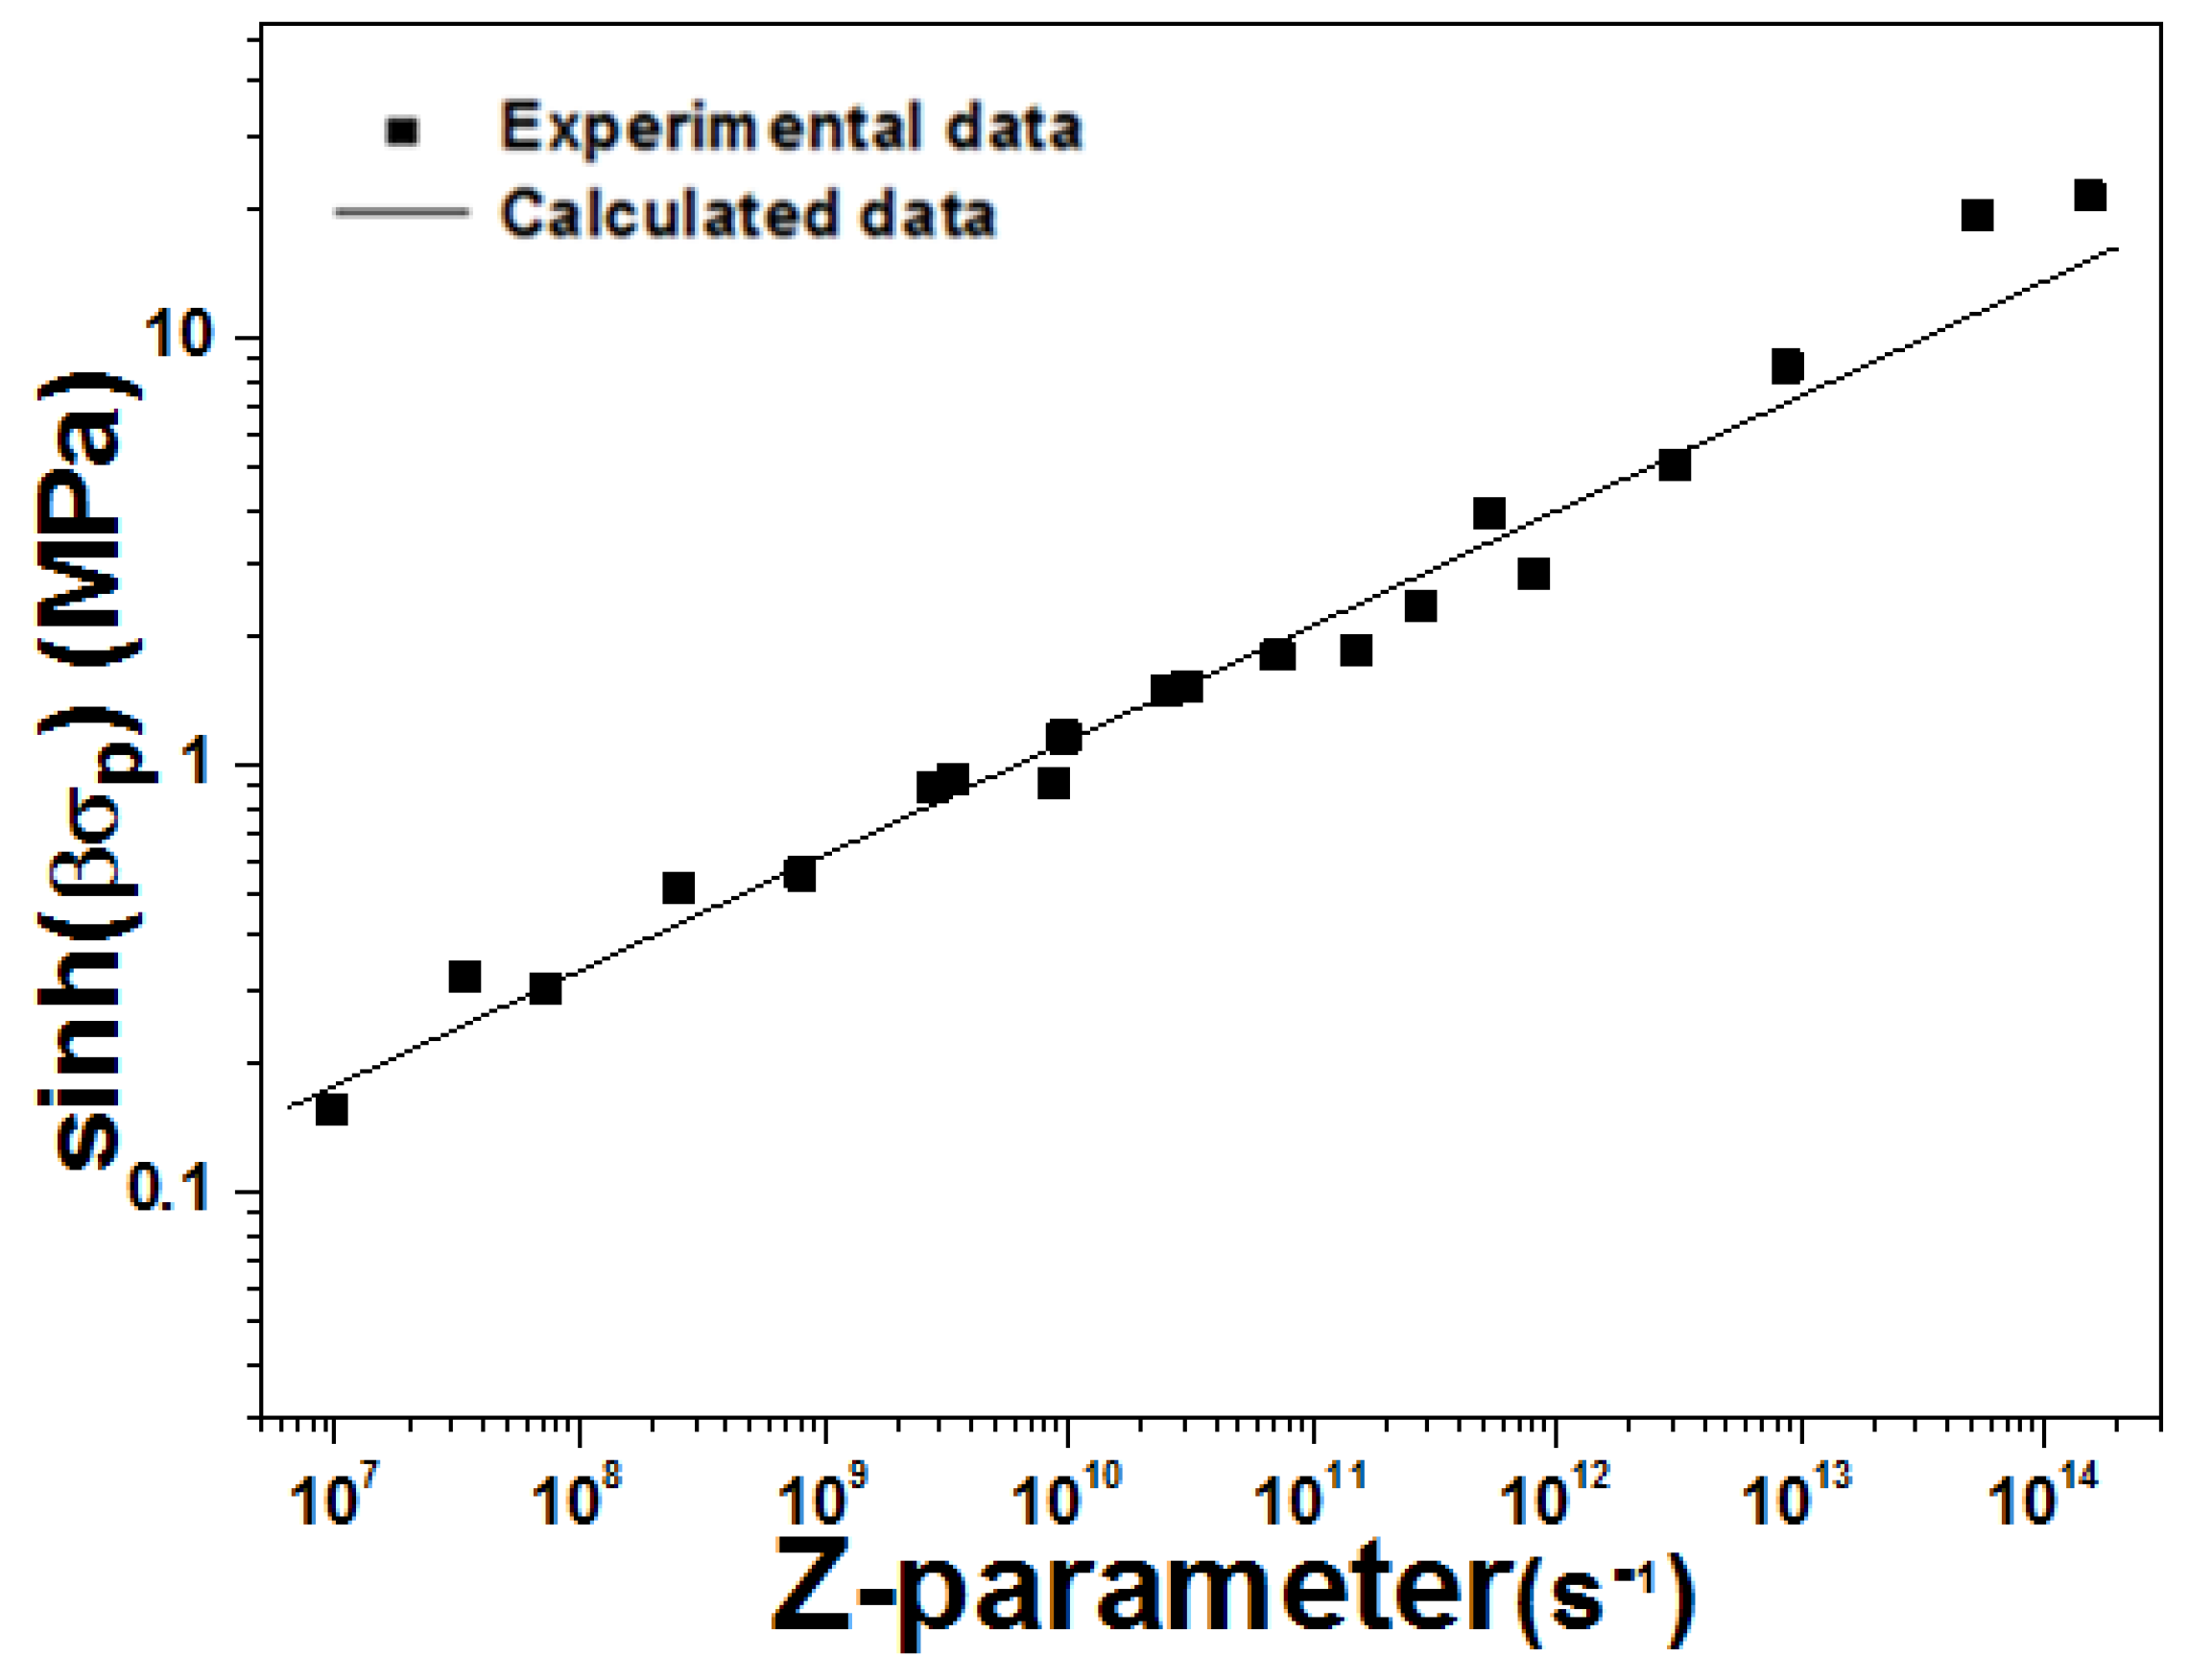
The values of sinh(βσ) calculated using Equation (6) are presented as a linear line in Figure 9. In this figure, the experimentally obtained sinh(βσ) values are also included. As shown in Figure 9, the comparison between the experimental and calculated data revealed high similarity between the two datasets. Therefore, the constitutive equation, Equation (6), is reasonable for explaining the high temperature deformation behavior of the present alloy.
Figure 9.
Comparison between the experimental and calculated data.

3.6. Microstructure of the Deformed Specimens
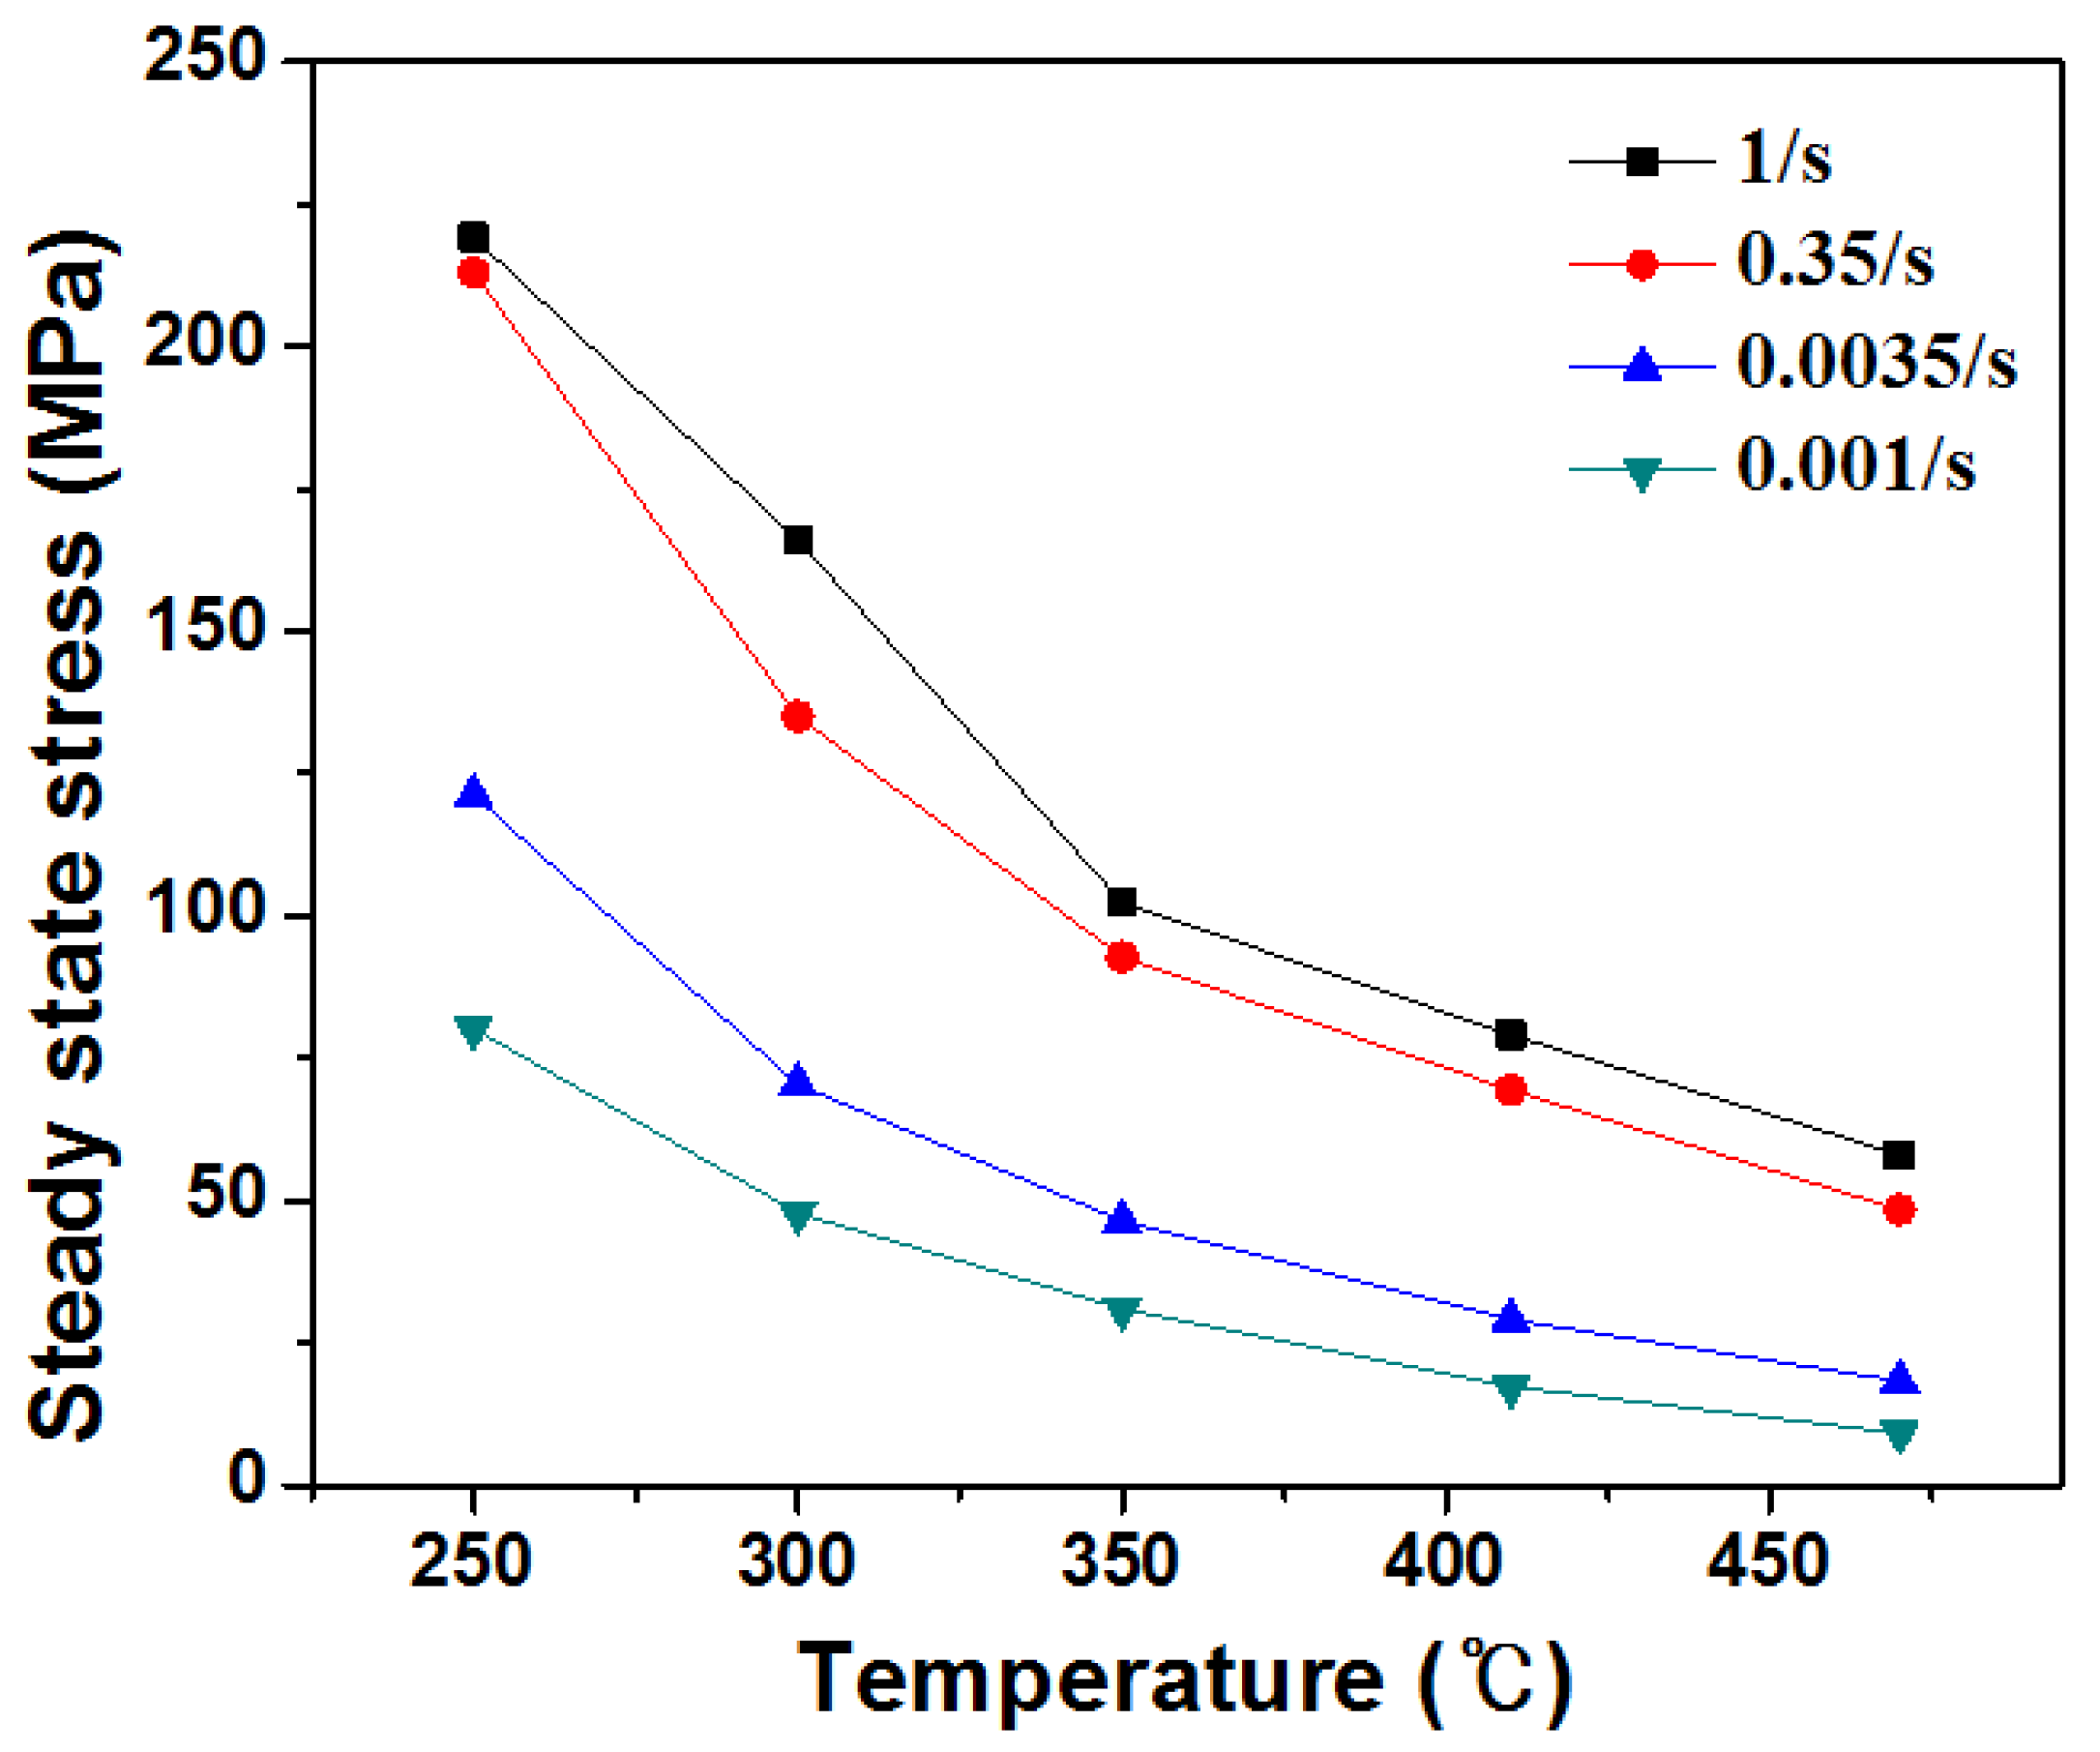
Figure 10 presents optical micrographs of the alloy deformed at a strain rate of 1/s and temperatures from 250 °C to 470 °C. Elongated grains were observed in the specimens deformed compressively at 250 °C (Figure 10a) and 300 °C (Figure 10b). In contrast, at 350 °C and above, equiaxed grains were visible near the eutectic Si particles and intermetallics, and the mean grain size of the equiaxed grains increased with increasing temperature. The large precipitates in Figure 10c–e were primary Si particles which may be generated by non-equilibrium solidification (hypereutectic solidification). Brittle primary Si particles were normally broken during the extrusion process, although some of them could remain after the extrusion.
Figure 10.
Optical micrographs of the deformed specimens at a strain rate of 1 /s at (a) 250 °C; (b) 300 °C; (c) 350 °C; (d) 410 °C; (e) 470 °C.
Figure 10.
Optical micrographs of the deformed specimens at a strain rate of 1 /s at (a) 250 °C; (b) 300 °C; (c) 350 °C; (d) 410 °C; (e) 470 °C.
Table 3 lists the mean grain size after deformation under different test conditions. The mean grain sizes were in the range between 2.9 and 7.2 μm.
| Strain Rate (/s) | Temperature (°C) | ||
|---|---|---|---|
| 350 | 410 | 470 | |
| 1 | 2.9 | 3.2 | 4.1 |
| 0.35 | 3.3 | 3.4 | 4.5 |
| 0.0035 | 4.8 | 5.9 | 6.7 |
| 0.001 | 5.1 | 5.7 | 7.2 |
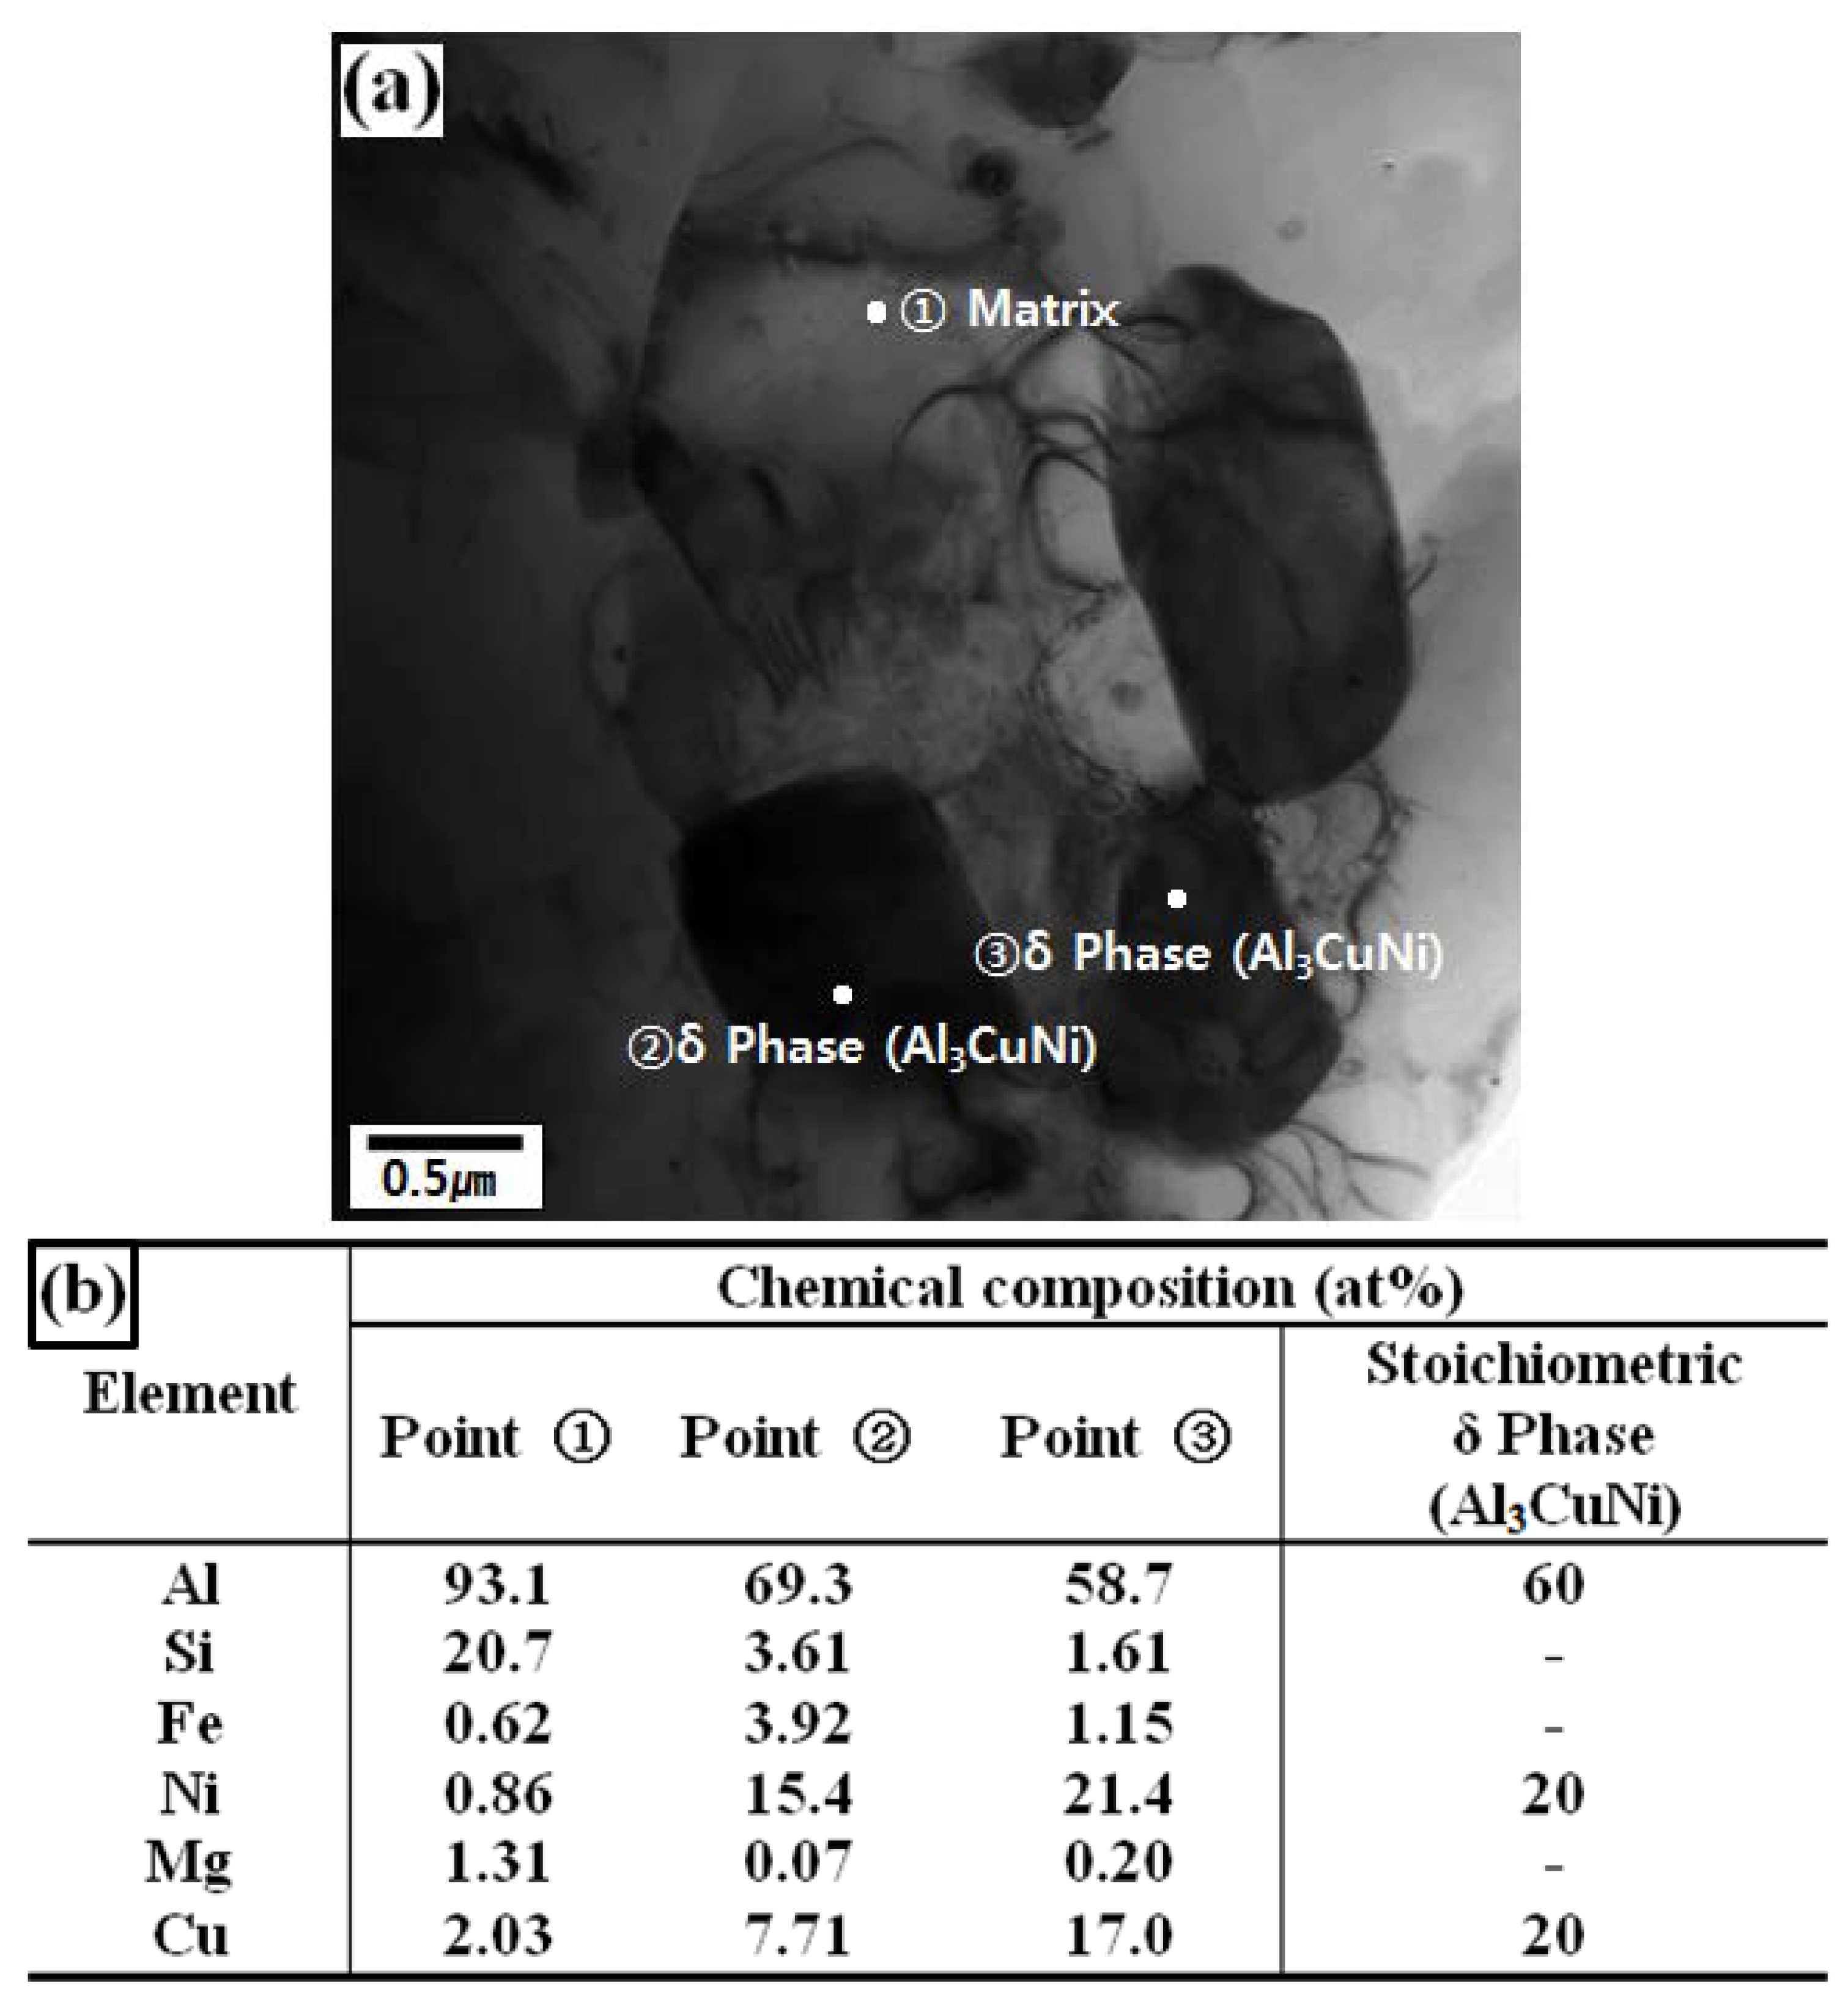
Figure 11a shows a TEM bright field image of the specimen deformed to 20% true-strain at 470 °C under a strain rate of 1/s. The 20% strain corresponds to a steady-state deformation region after reaching the peak stress (see Figure 6d). As shown in Figure 11a, fine dispersoids were distributed as indicated by points ② and ③. Figure 11b shows the EDS analysis data of points ② and ③, which appear to correspond to the stoichiometric composition of the δ(Al3NiCu) phase. Figure 11a shows the dislocations within the equiaxed grains. The existence of both equiaxed grains and a dislocation structure within the equiaxed grains indicates that dynamic recrystallization occurred during the course of high temperature deformation of the present alloy.
Figure 11.
(a) TEM image and (b) EDS data of the specimen deformed to 20% of true-strain at a strain rate of 1/s at 470 °C.
Figure 11.
(a) TEM image and (b) EDS data of the specimen deformed to 20% of true-strain at a strain rate of 1/s at 470 °C.

4. Conclusions
Compressive tests of the commercial Al-12Si-3Cu-2Ni-1Mg alloy (DM104™) fabricated by casting and subsequent extrusion were conducted over the temperature range, 250–470 °C, and strain rate range of 0.001–1/s. The following conclusions were obtained:
- The as-received alloy had equiaxed grains with a mean grain size of approximately 5 μm, spherical Si particles and fine intermetallic phases including δ(Al3NiCu) and Q(Al5Cu2Mg3Si6).
- EBSD analysis of the as-received alloy showed that the fraction of high-angle boundaries (HABs) was approximately 60%, and the low-angle boundaries (LABs) are distributed mostly as sub-grain boundaries within the HABs.
- The true stress-true strain curves obtained from the compressive tests exhibited steady-state flow after reaching the peak stress.
- The steady-state stress decreased with increasing temperature and decreasing strain rate. A close relationship was observed between the steady-state stress and a constitutive equation for high temperature deformation.
- Fine equiaxed grains and a dislocation structure within the equiaxed grains were observed in the deformed specimens, indicating the occurrence of dynamic recrystallization during high temperature deformation.
Acknowledgments
The authors gratefully acknowledge the financial supports from The Small & Medium Business Administration (Korea) through Grant No. S2317902, and Inha University Research Grant. The authors are also grateful to Dong Yang Piston Co., Ltd. for provision of alloy studied in this work.
Author Contributions
Study design: Mok-Soon Kim; Experimental work: Seung-Baek Yu; Results analysis & Manuscript preparation: All authors; Manuscript proof and Submission: All authors.
Conflicts of Interest
The authors declare no conflict of interest.
References
- Manasijevic, S.; Radisa, R.; Markovic, S.; Acimovic-Pavlovic, Z.; Raic, K. Thermal analysis and microscopic characterization of the piston alloy AlSi13Cu4Ni2Mg. Intermetallics 2011, 19, 486–492. [Google Scholar] [CrossRef]
- Chen, C.-L.; Thomson, R.C. The combined use of EBSD and EDX analyses for the identification of complex intermetallic phases in multicomponent Al-Si piston alloys. J. Alloys Compd. 2010, 490, 293–300. [Google Scholar] [CrossRef]
- Kim, J.; Jang, G.S.; Kim, M.S.; Lee, J.K. Microstructure and compressive deformation of hypereutectic Al-Si-Fe based P/M alloys fabricated by spark plasma sintering. Trans. Nonferrous Met. Soc. China 2014, 24, 2346–2351. [Google Scholar] [CrossRef]
- Park, S.-C.; Kim, M.-S.; Kim, K.-T.; Shin, S.-Y.; Lee, J.-K.; Ryu, K.-H. Compressive Deformation Behavior of Al-10Si-5Fe-1Zr Powder alloys Consolidated by Spark Plasma Sintering Precess. Korean J. Met. Mater. 2011, 49, 853–859. [Google Scholar]
- Sjölander, E.; Seigeddine, S. The heat treatment of Al-Si-Cu-Mg casting alloys. J. Mater. Processs. Technol. 2010, 210, 1249–1259. [Google Scholar] [CrossRef]
- Aguilera-luna, I.; Castro-Roman, M.J.; Escobedo-bocardo, J.C.; Garcia-Pastor, F.A.; Herrera-Trejo, M. Effect of cooling rate and Mg content on the Al-Si eutectic for Al-Si-Cu-Mg alloys. Mater. Charact. 2014, 95, 211–218. [Google Scholar] [CrossRef]
- Zamani, M.; Seifeddine, S.; Jarfors, A.E.W. High temperature tensile deformation behavior and failure mechanisms of an Al-Si-Cu-Mg cast alloy—The microstrcutural scale effect. Mater. Des. 2015, 86, 361–370. [Google Scholar]
- Cho, H.S.; Kim, M.S. High Temperature Deformation Behavior of Al-16Si-5Fe based alloys Produced from Rapidly Solidified Powders. J. Korean Inst. Met. Mater. 1999, 37, 1191–1197. [Google Scholar]
- Li, Y.; Yang, Y.; Wu, Y.; Wang, L.; Liu, X. Quantitative comparison of three Ni-containing phases to the elevated-temperature properties of Al-Si piston alloys. Mater. Sci. Eng. A 2010, 527, 7132–7137. [Google Scholar] [CrossRef]
- Wu, Y.; Liao, H.C.; Yang, J.; Zhou, K. Effect of Si content on Dynamic Recrystallization of Al-Si-Mg alloys During Hot Extrusion. J. Mater. Sci. Technol. 2014, 30, 1271–1277. [Google Scholar] [CrossRef]
- Hu, H.E.; Wang, X.; Deng, L. High temperature deformation behavior and optimal hot processing parameters of Al-Si eutectic alloy. Mater. Sci. Eng. 2013, 576, 45–51. [Google Scholar] [CrossRef]
- Zhang, H.; Li, L.; Yuan, D.; Peng, D. Hot deformation behavior of the new Al-Mg-Si-Cu aluminum alloy during compression at elevated temperatures. Mater. Charact. 2007, 58, 168–173. [Google Scholar] [CrossRef]
- Liao, H.; Wu, Y.; Zhou, K.; Yang, J. Hot deformation behavior and processing map of Al-Si-Mg alloys containing different amount of silicon based on Gleebe-3500 hot compression simulation. Mater. Des. 2015, 65, 1091–1099. [Google Scholar] [CrossRef]
© 2016 by the authors; licensee MDPI, Basel, Switzerland. This article is an open access article distributed under the terms and conditions of the Creative Commons by Attribution (CC-BY) license (http://creativecommons.org/licenses/by/4.0/).
Share and Cite
MDPI and ACS Style
Yu, S.-B.; Kim, M.-S. Microstructure and High Temperature Deformation of Extruded Al-12Si-3Cu-Based Alloy. Metals 2016, 6, 32. https://doi.org/10.3390/met6020032
AMA Style
Yu S-B, Kim M-S. Microstructure and High Temperature Deformation of Extruded Al-12Si-3Cu-Based Alloy. Metals. 2016; 6(2):32. https://doi.org/10.3390/met6020032
Chicago/Turabian StyleYu, Seung-Baek, and Mok-Soon Kim. 2016. "Microstructure and High Temperature Deformation of Extruded Al-12Si-3Cu-Based Alloy" Metals 6, no. 2: 32. https://doi.org/10.3390/met6020032
Note that from the first issue of 2016, this journal uses article numbers instead of page numbers. See further details here.