
Effect of Surface Texturing on Stresses during Rapid Changes in Temperature

Abstract
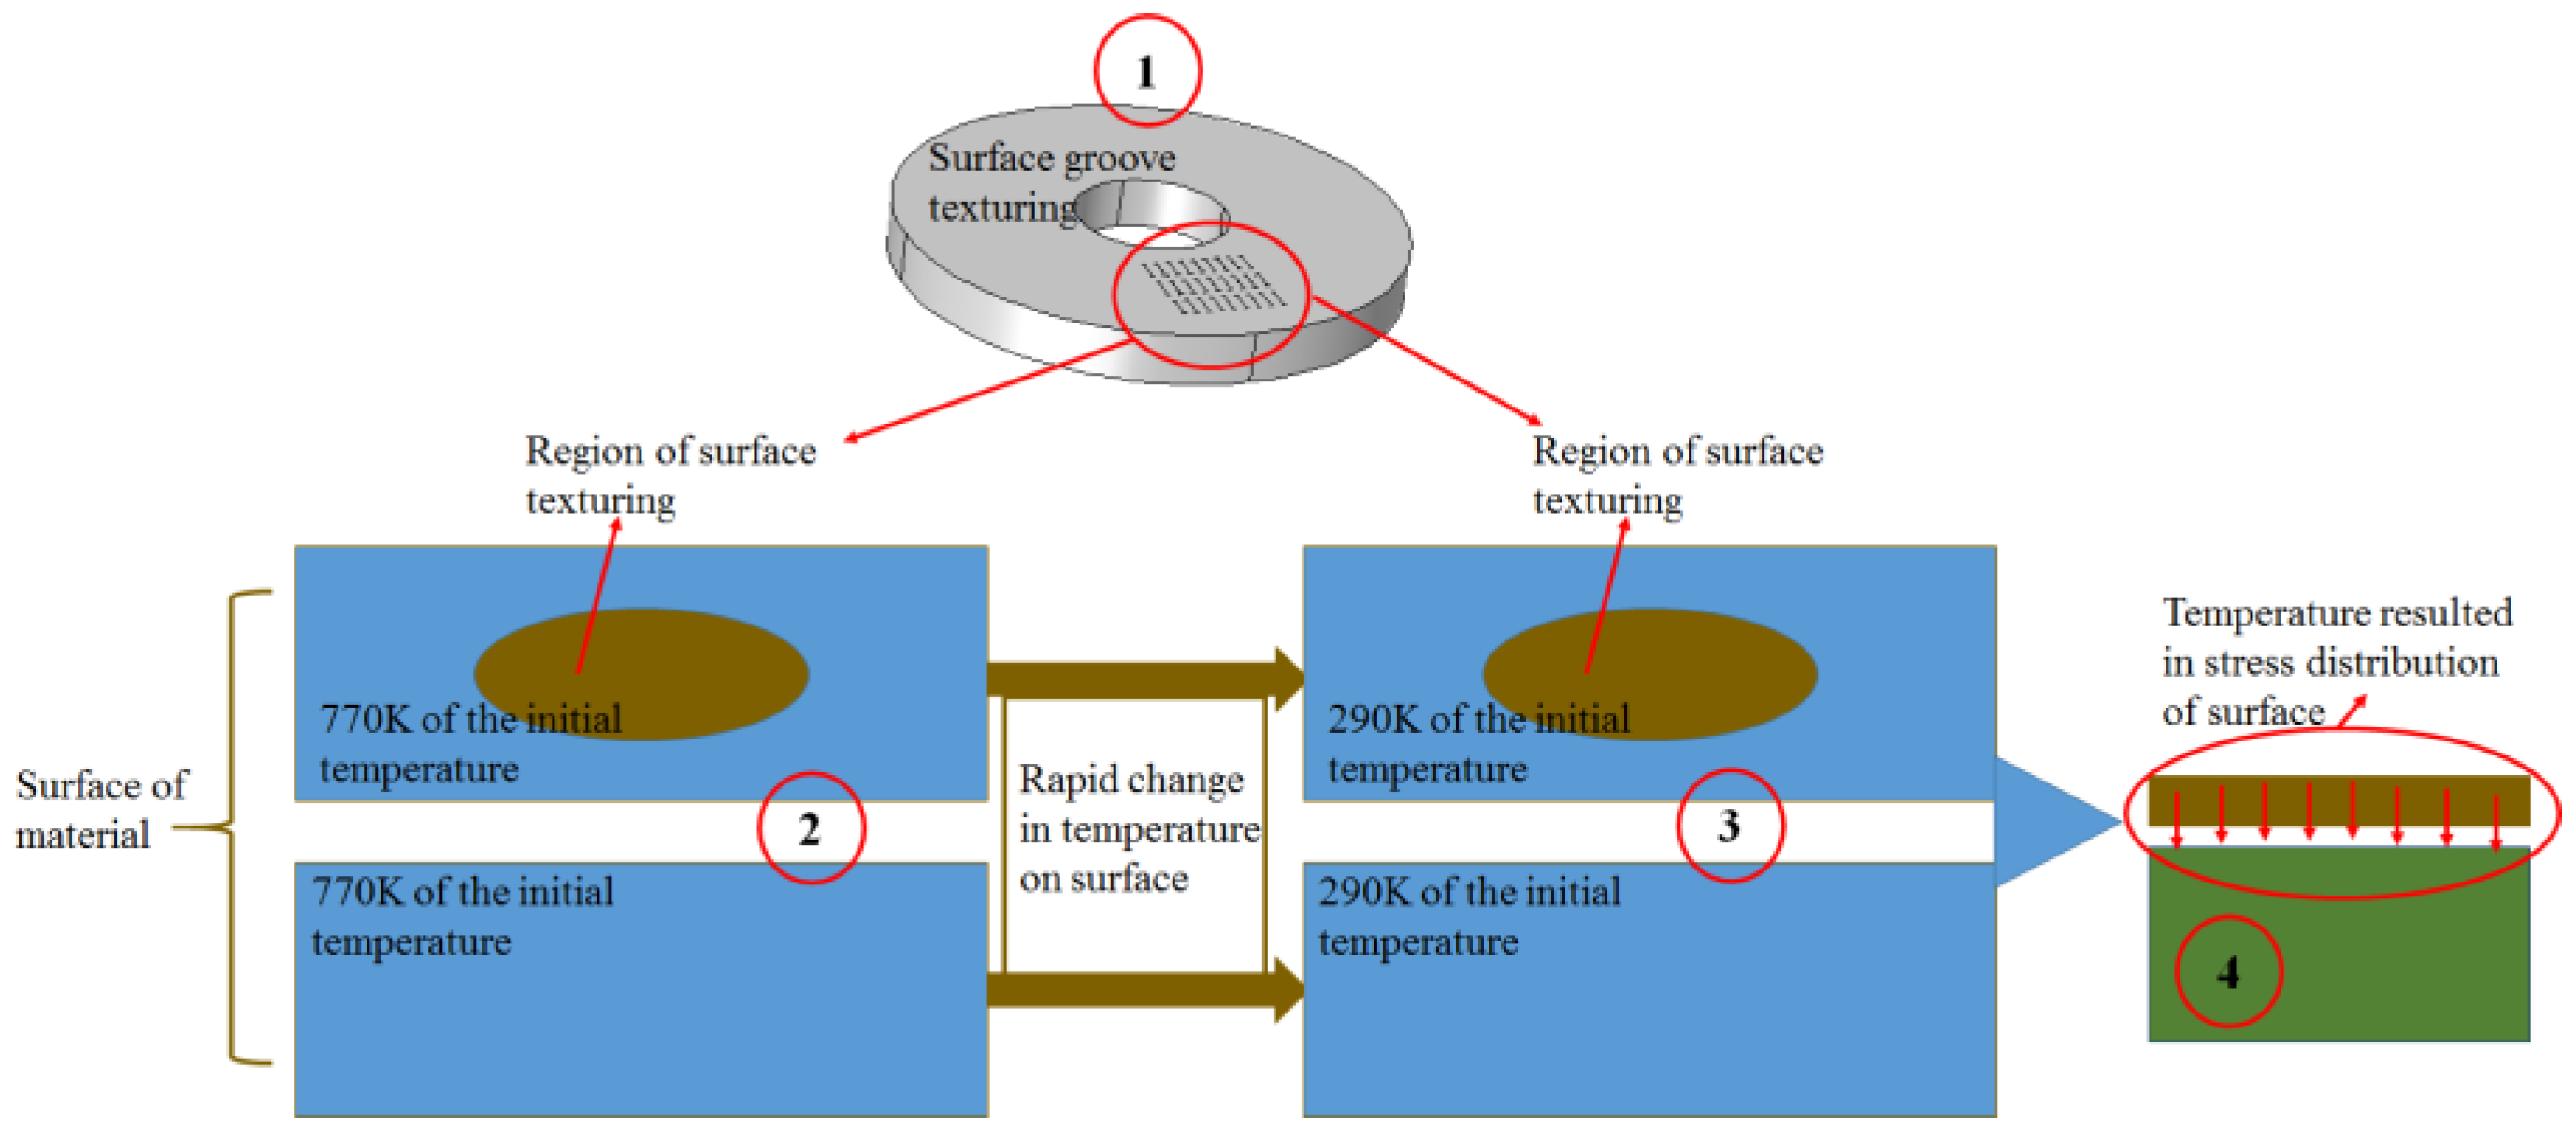
:1. Introduction
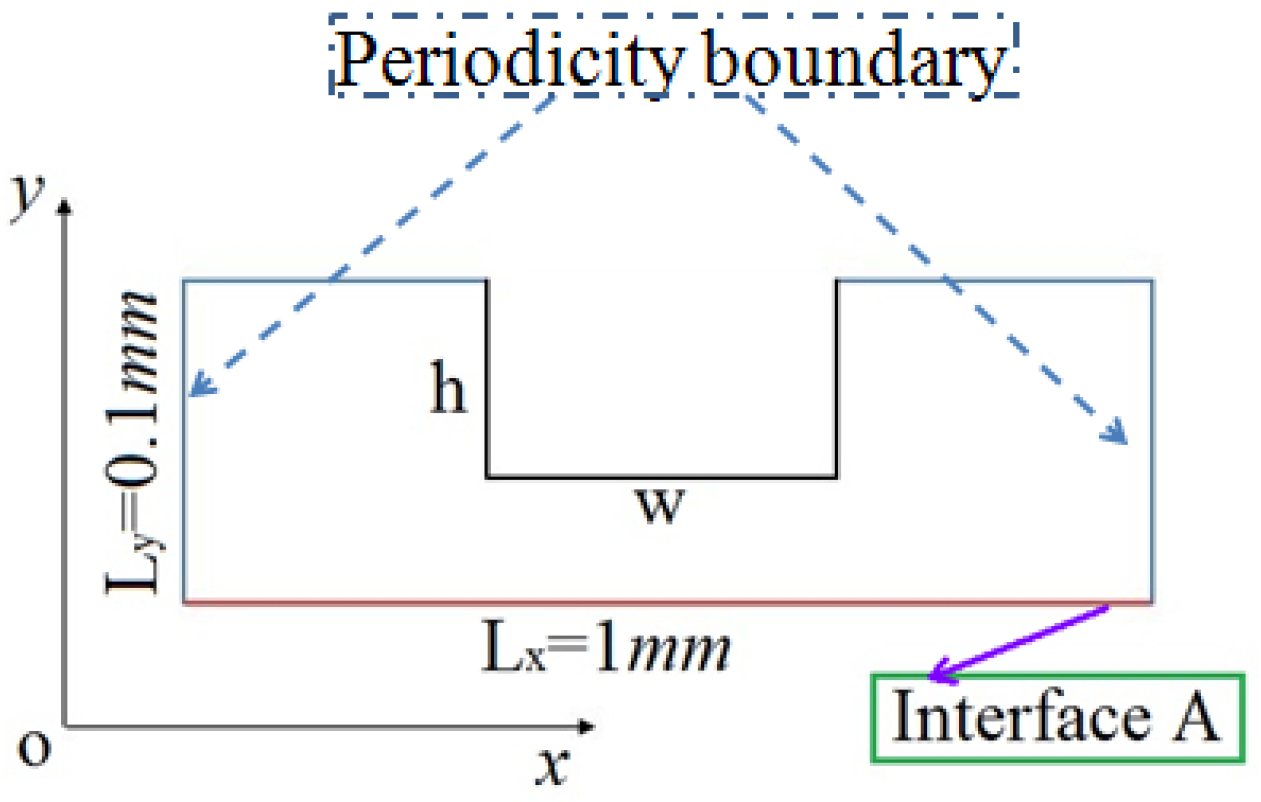
2. Geometry Model
3. Numerical Methods
3.1. Basic Governing Equations
3.2. Definition, Material Parameters and Model Validation
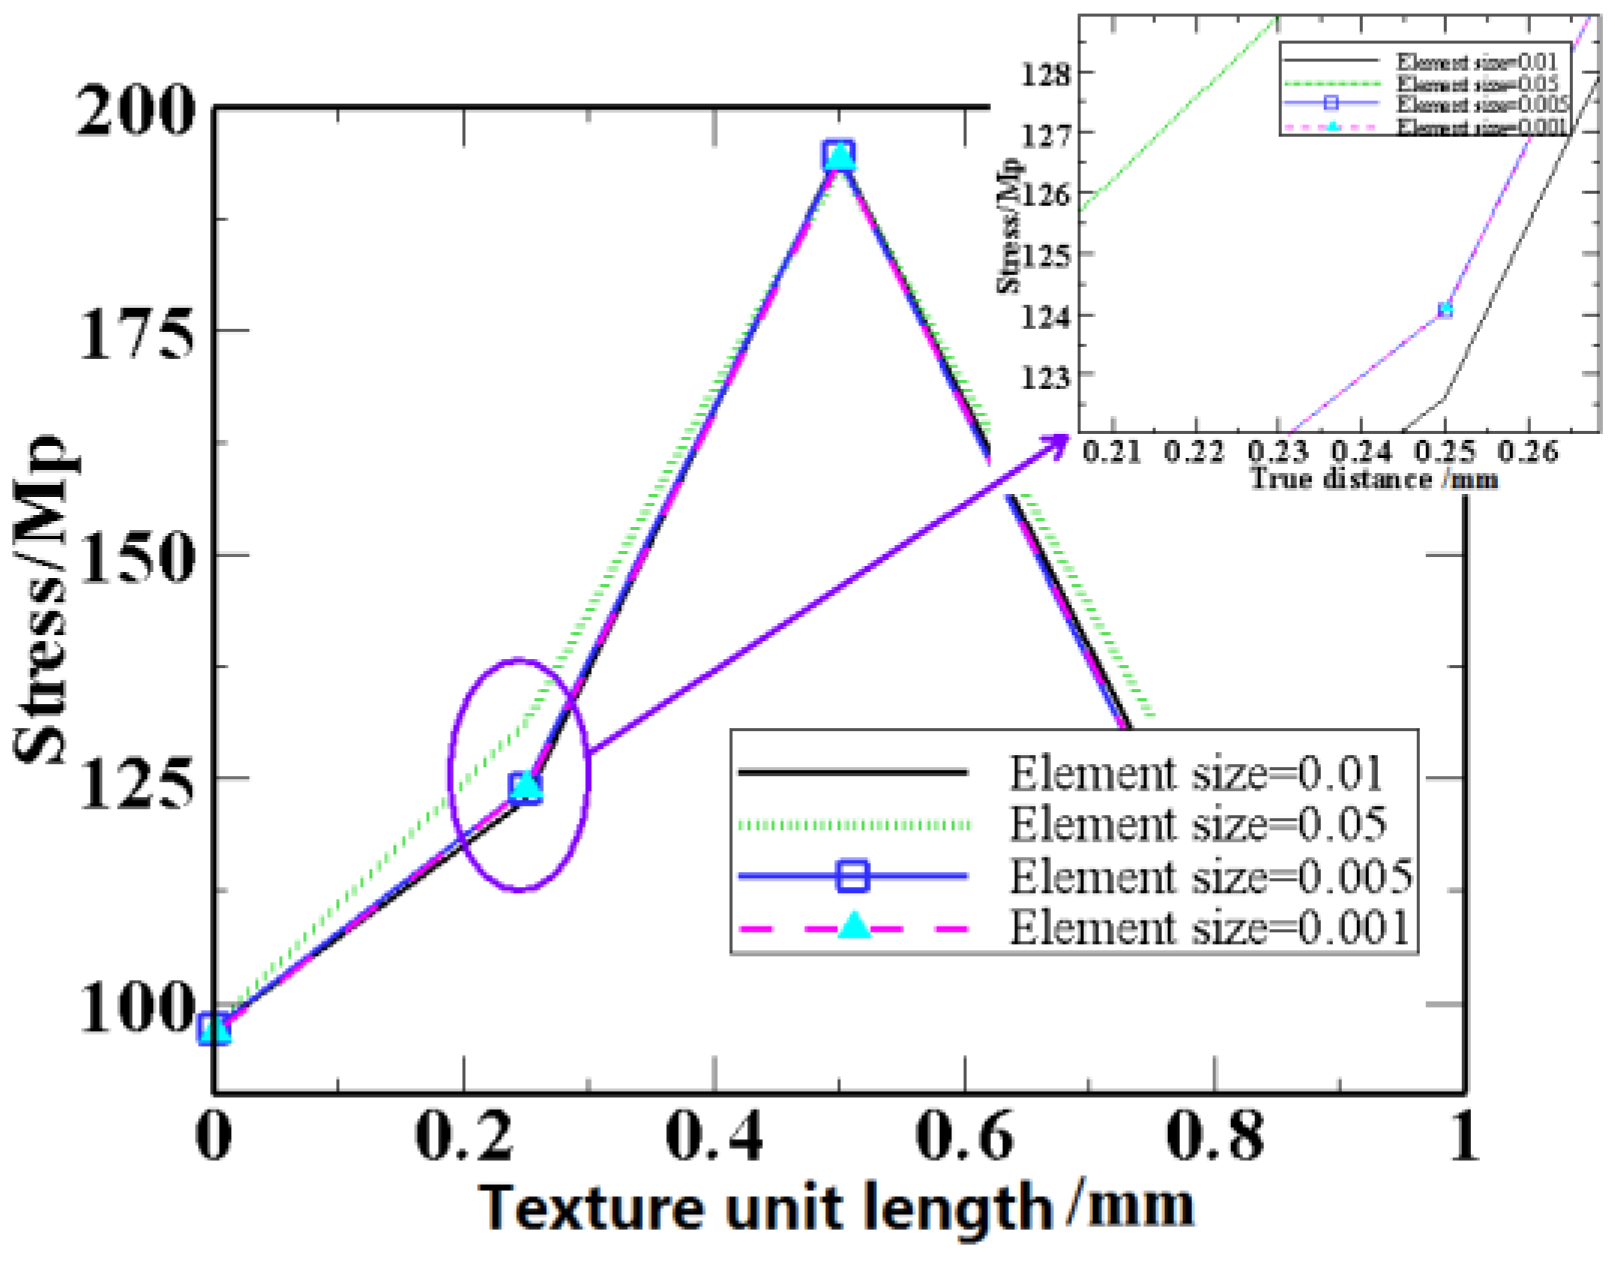
3.3. Boundary Condition and Mesh Information
4. Results and Discussion
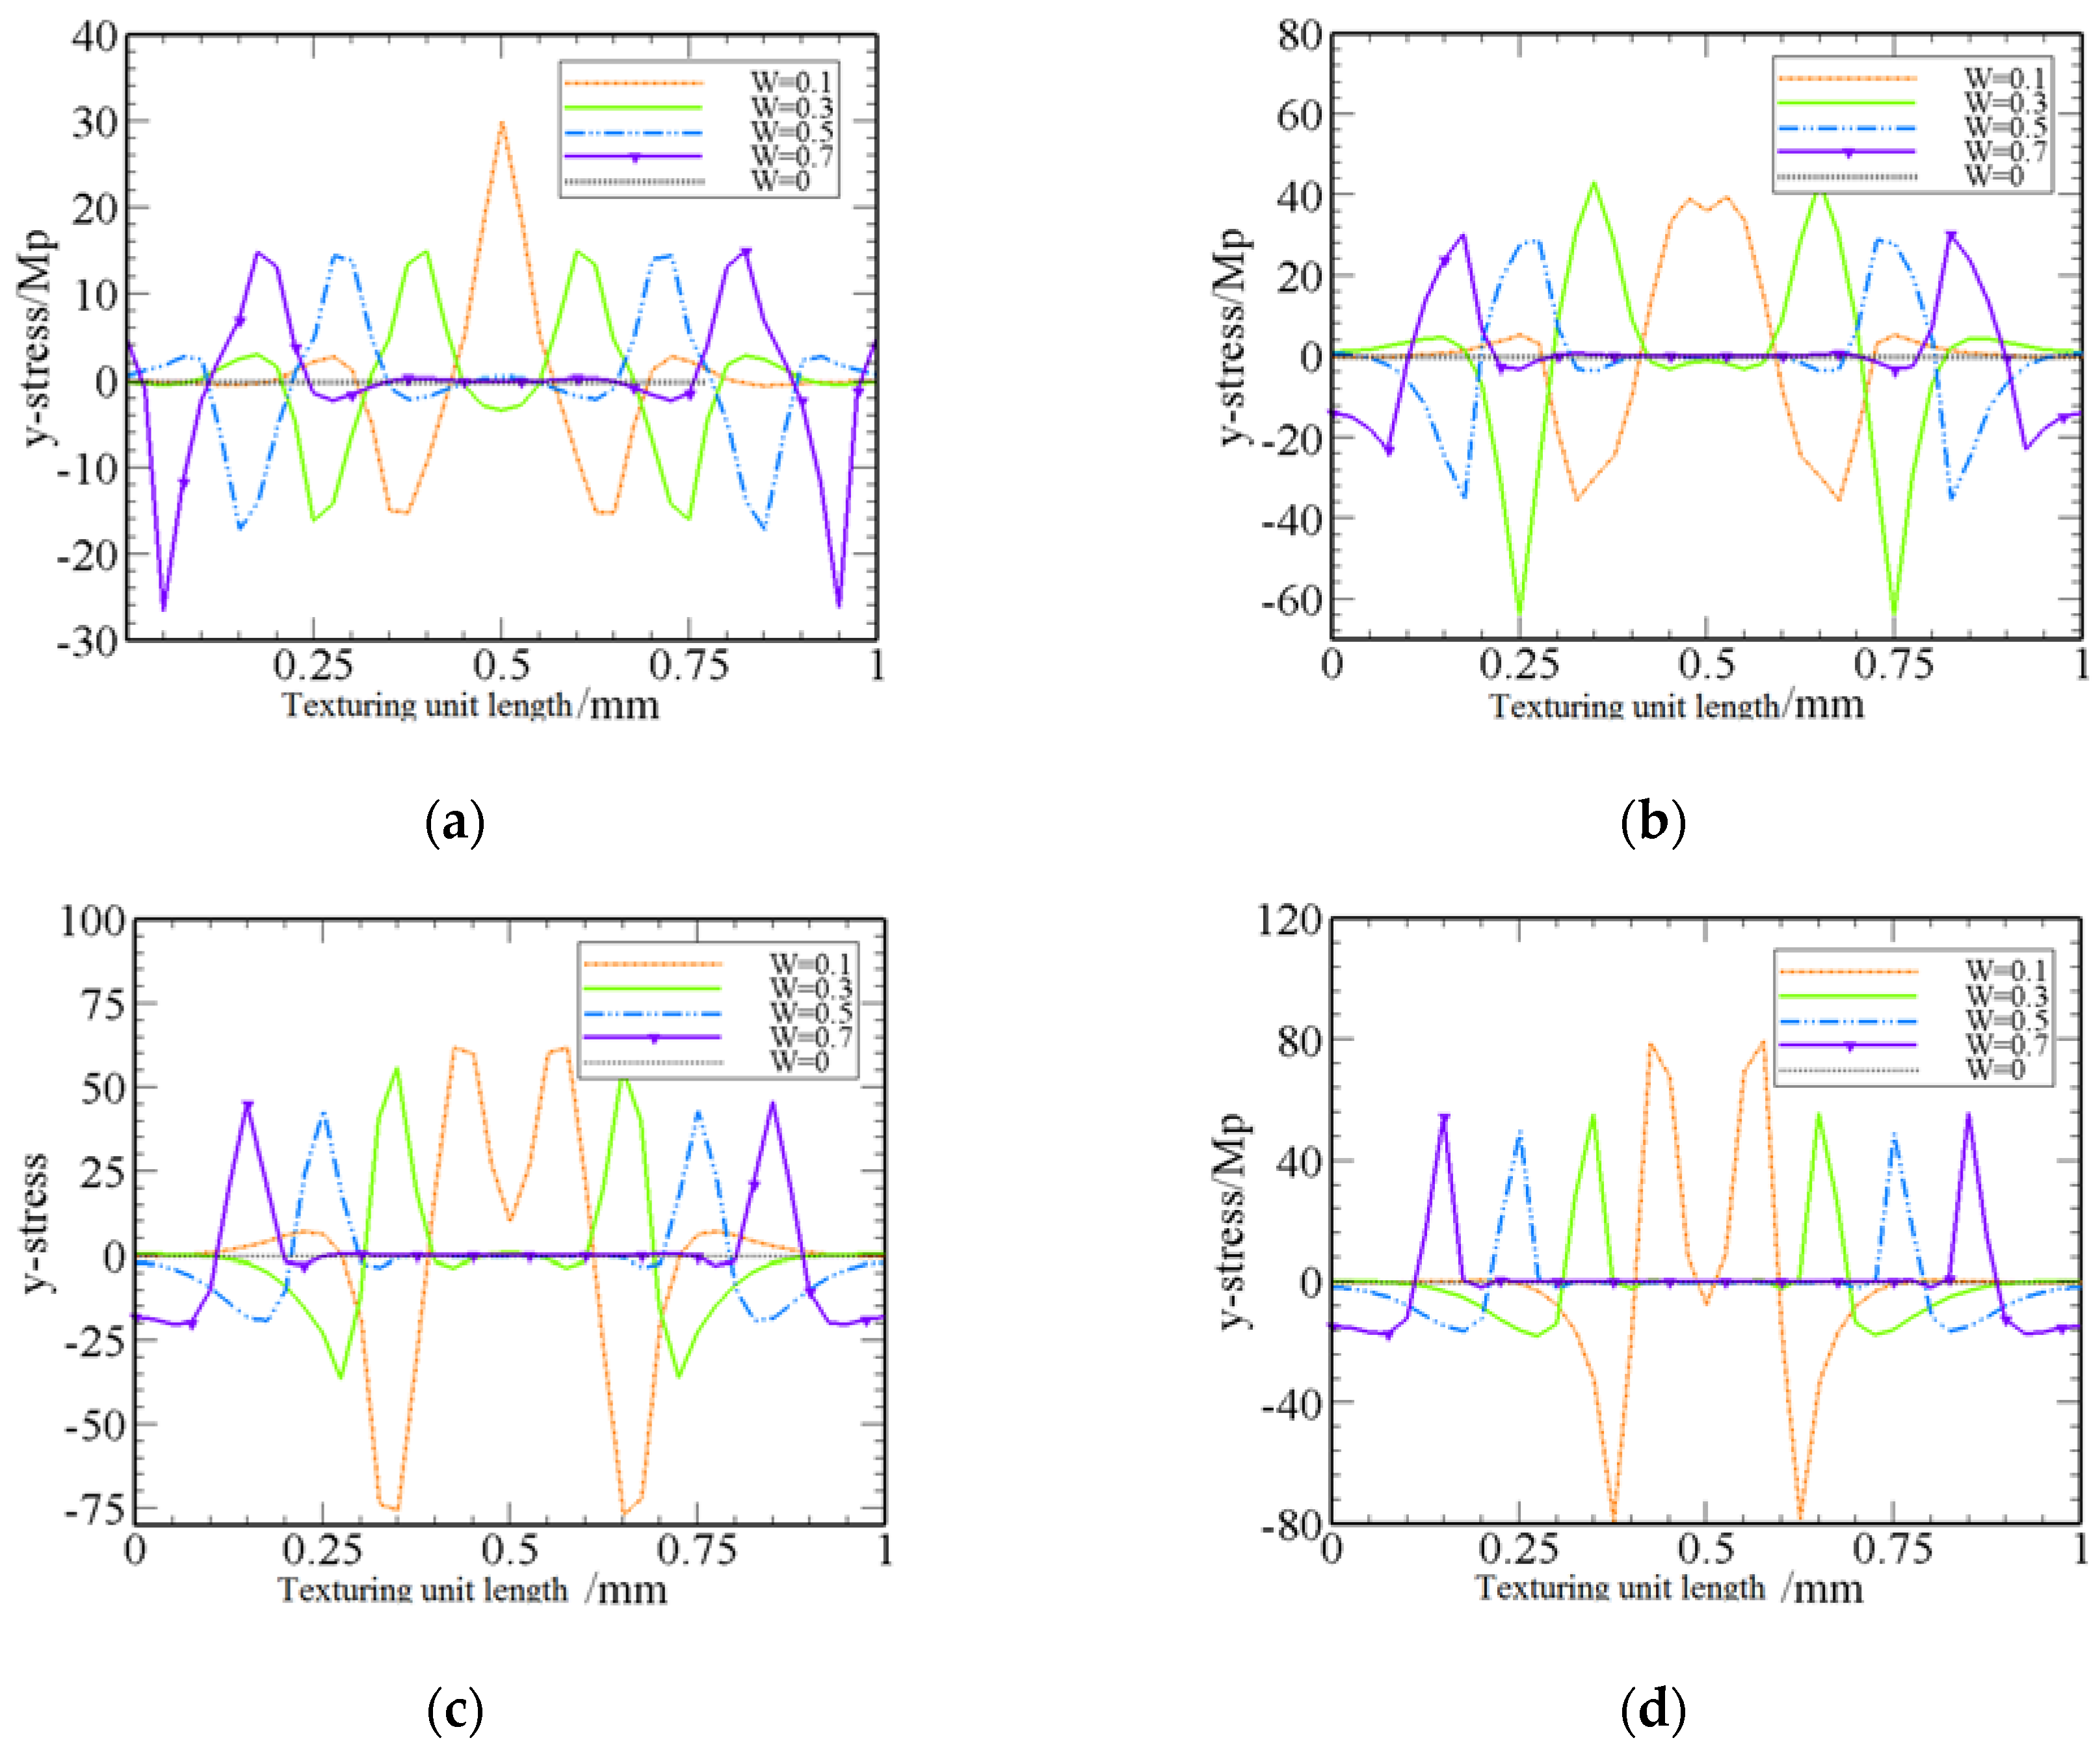
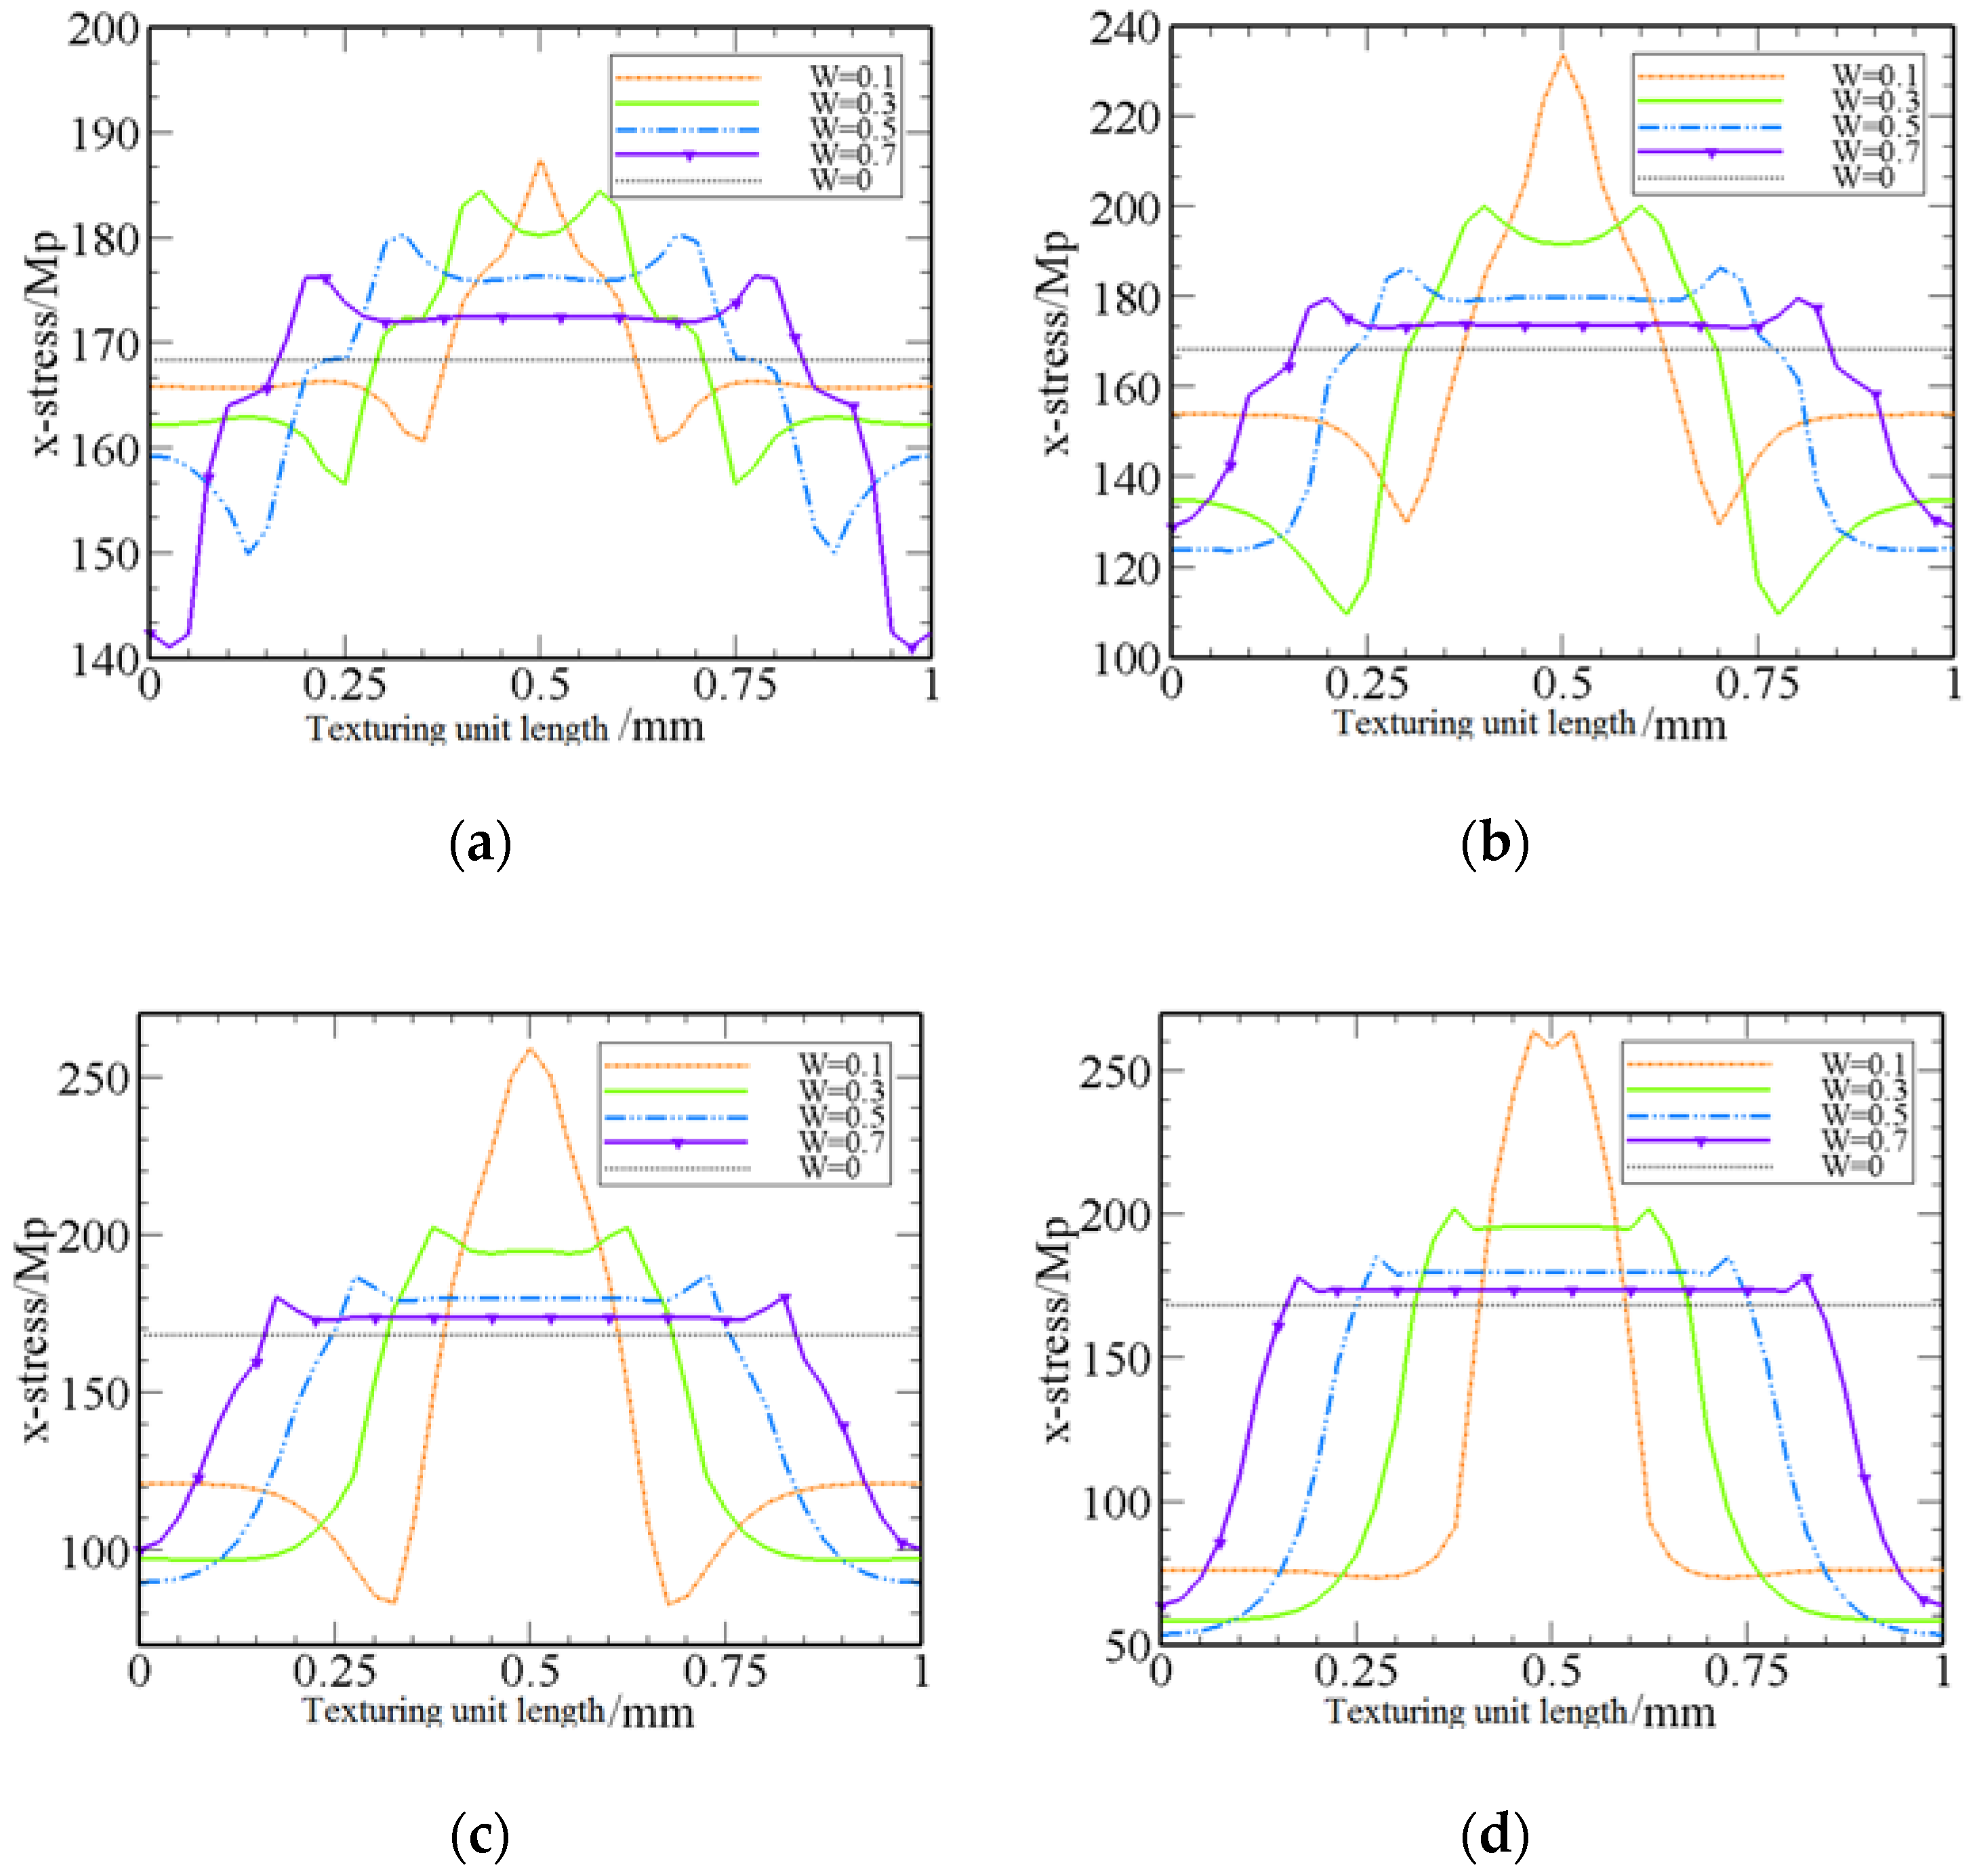
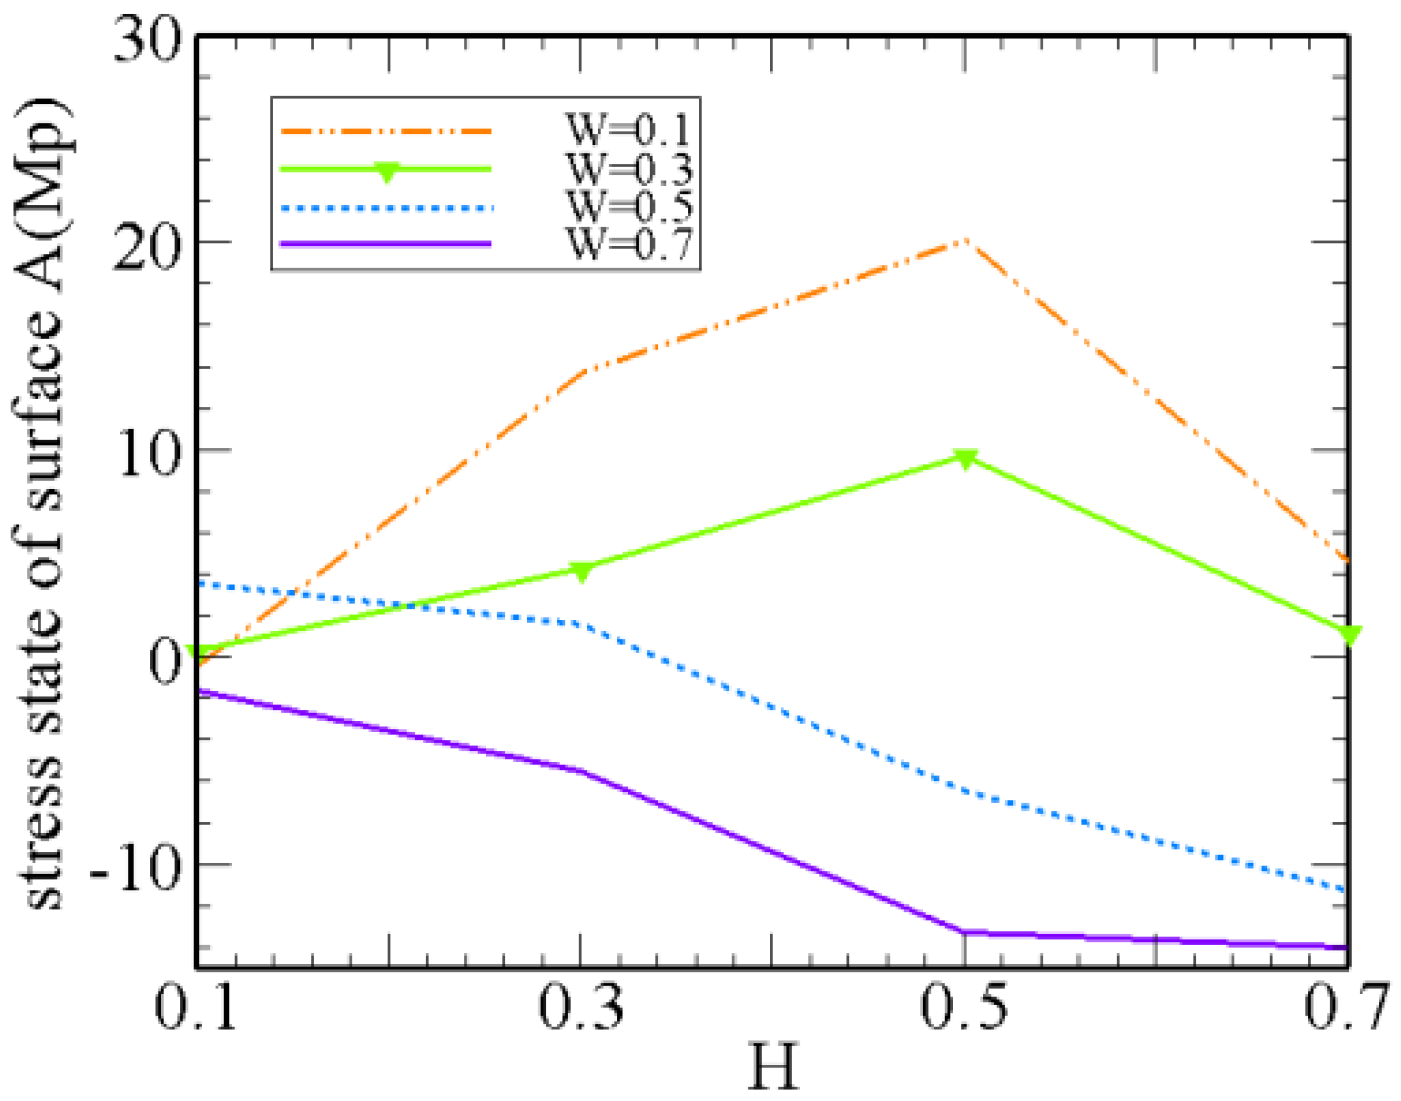
4.1. Effect of Texturing Width on Stress
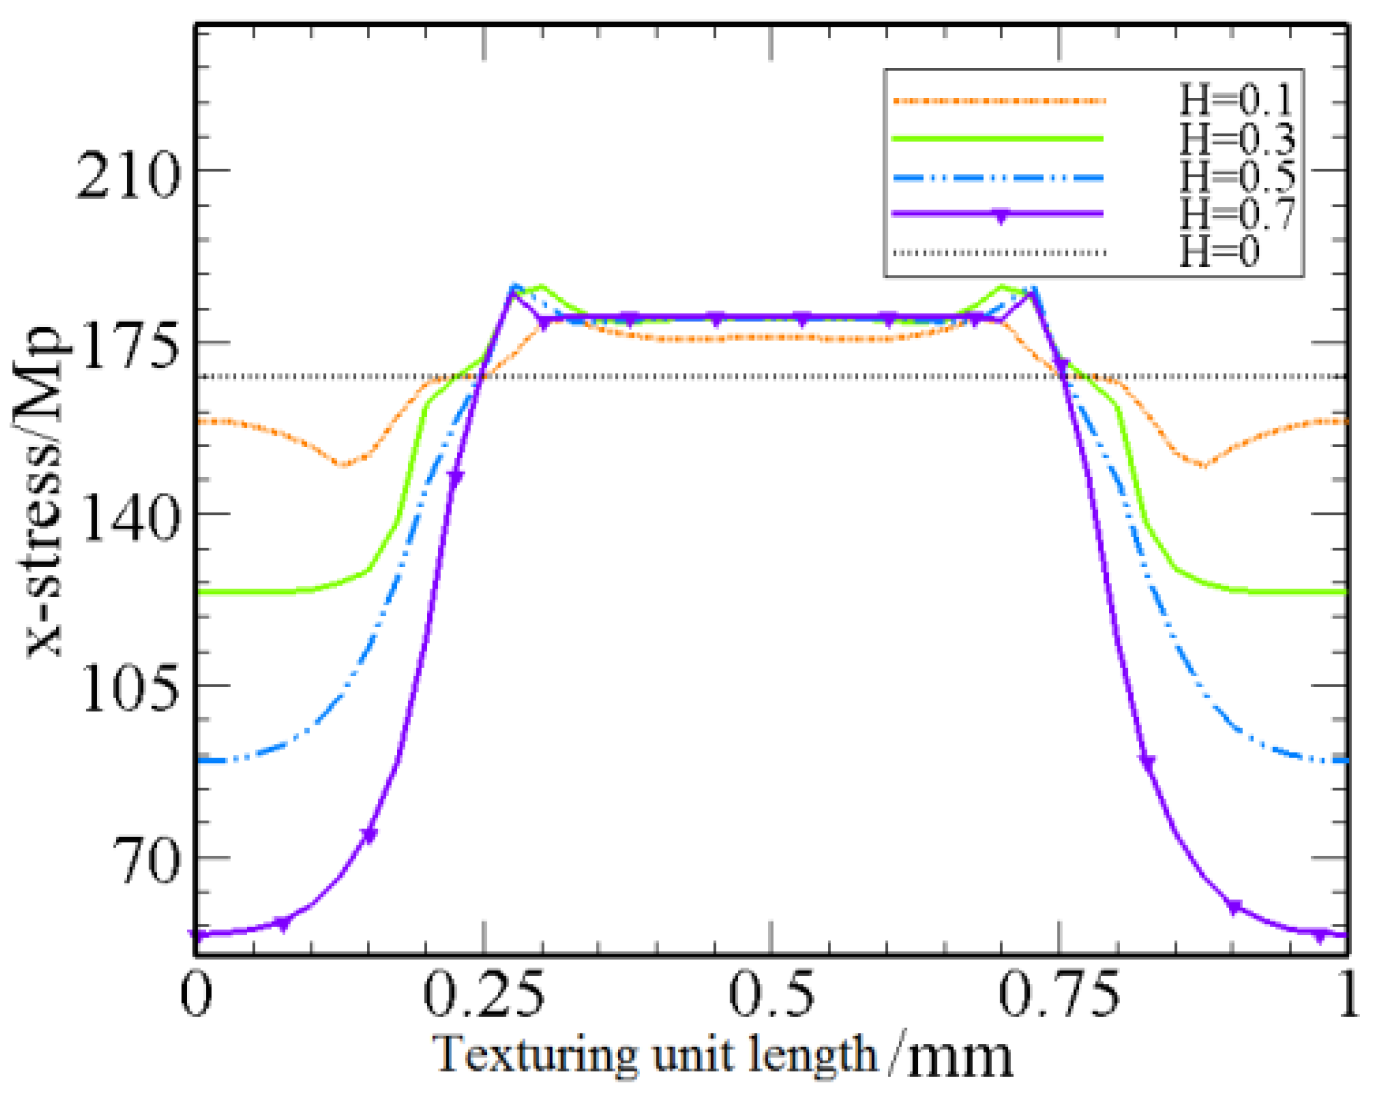
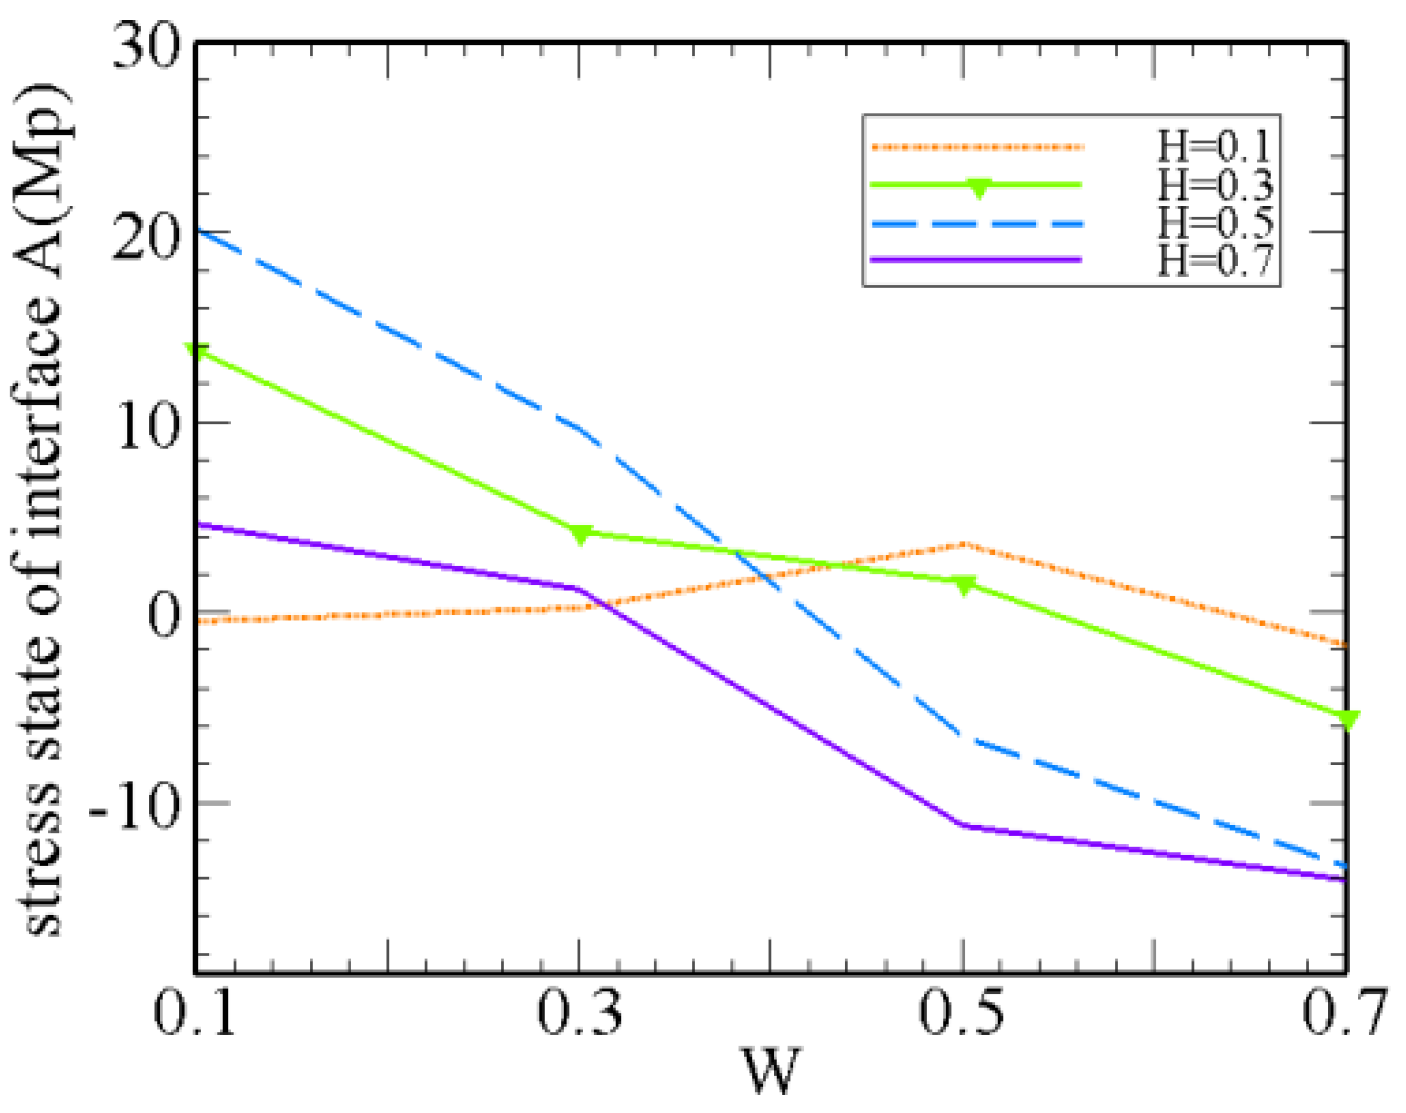
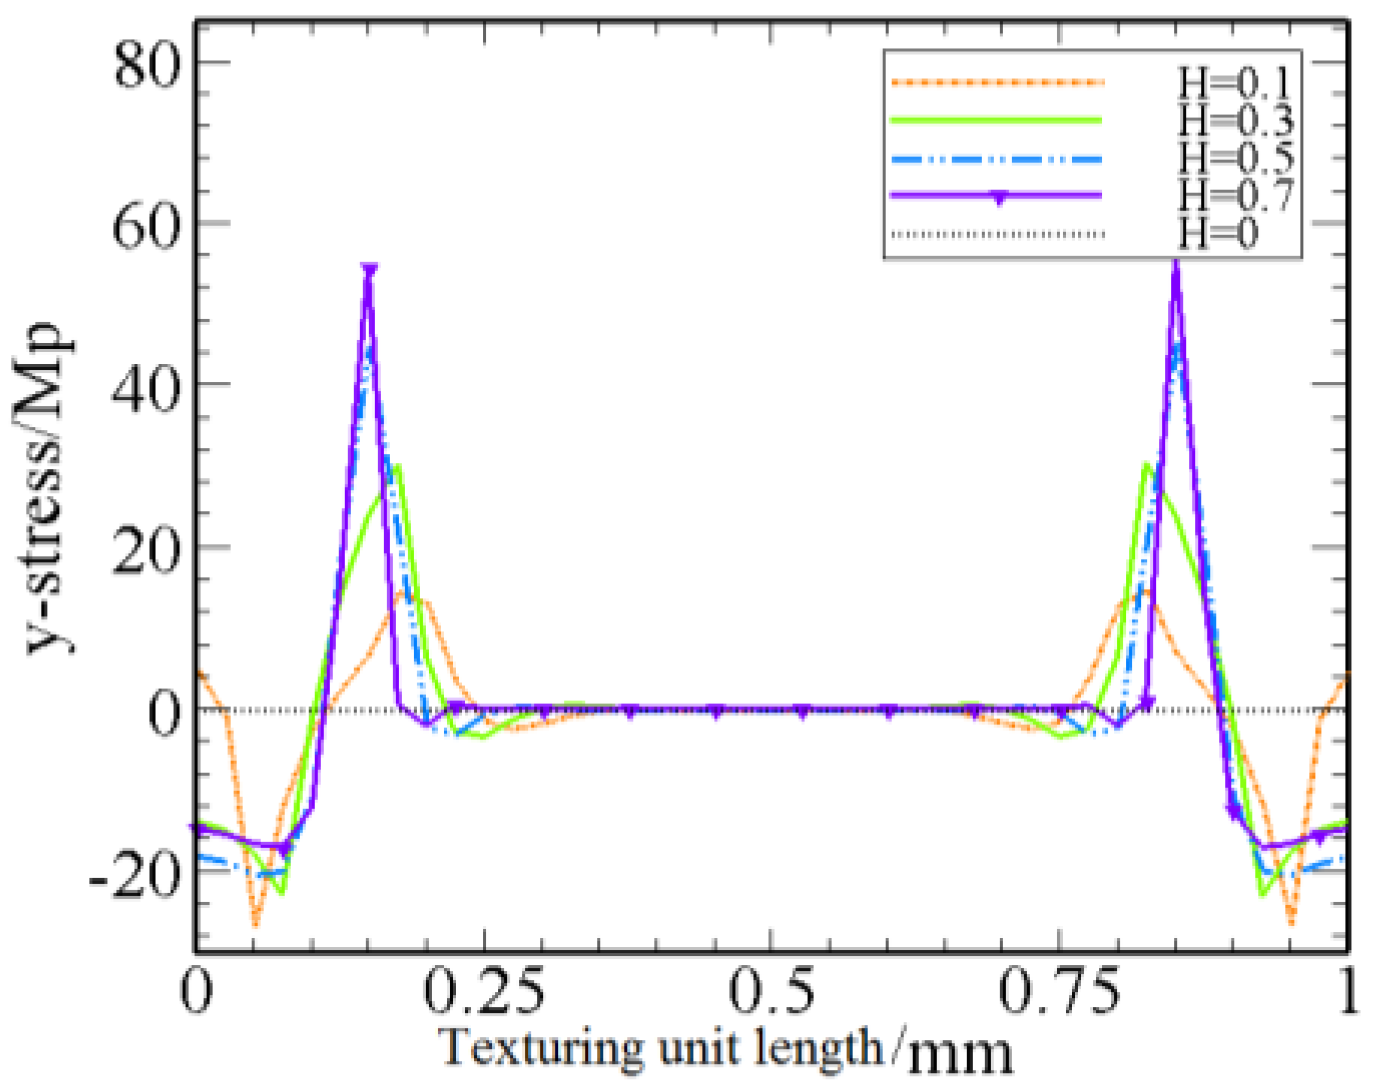
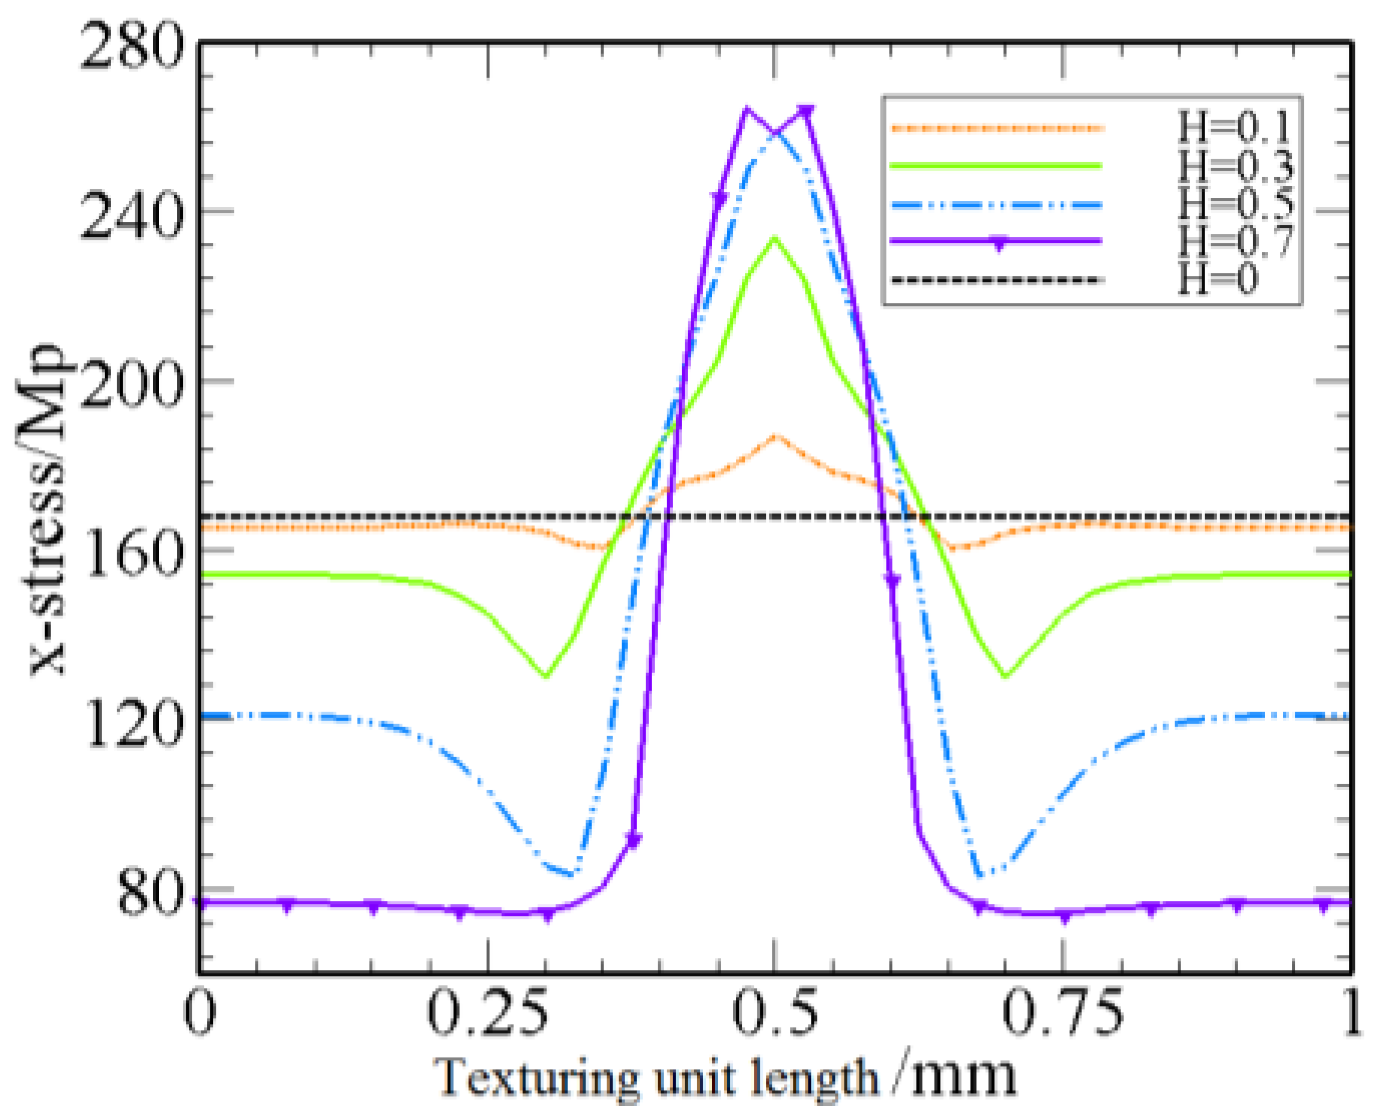
4.2. Effect of Texturing Depth on Stresses
5. Conclusions
- (1)
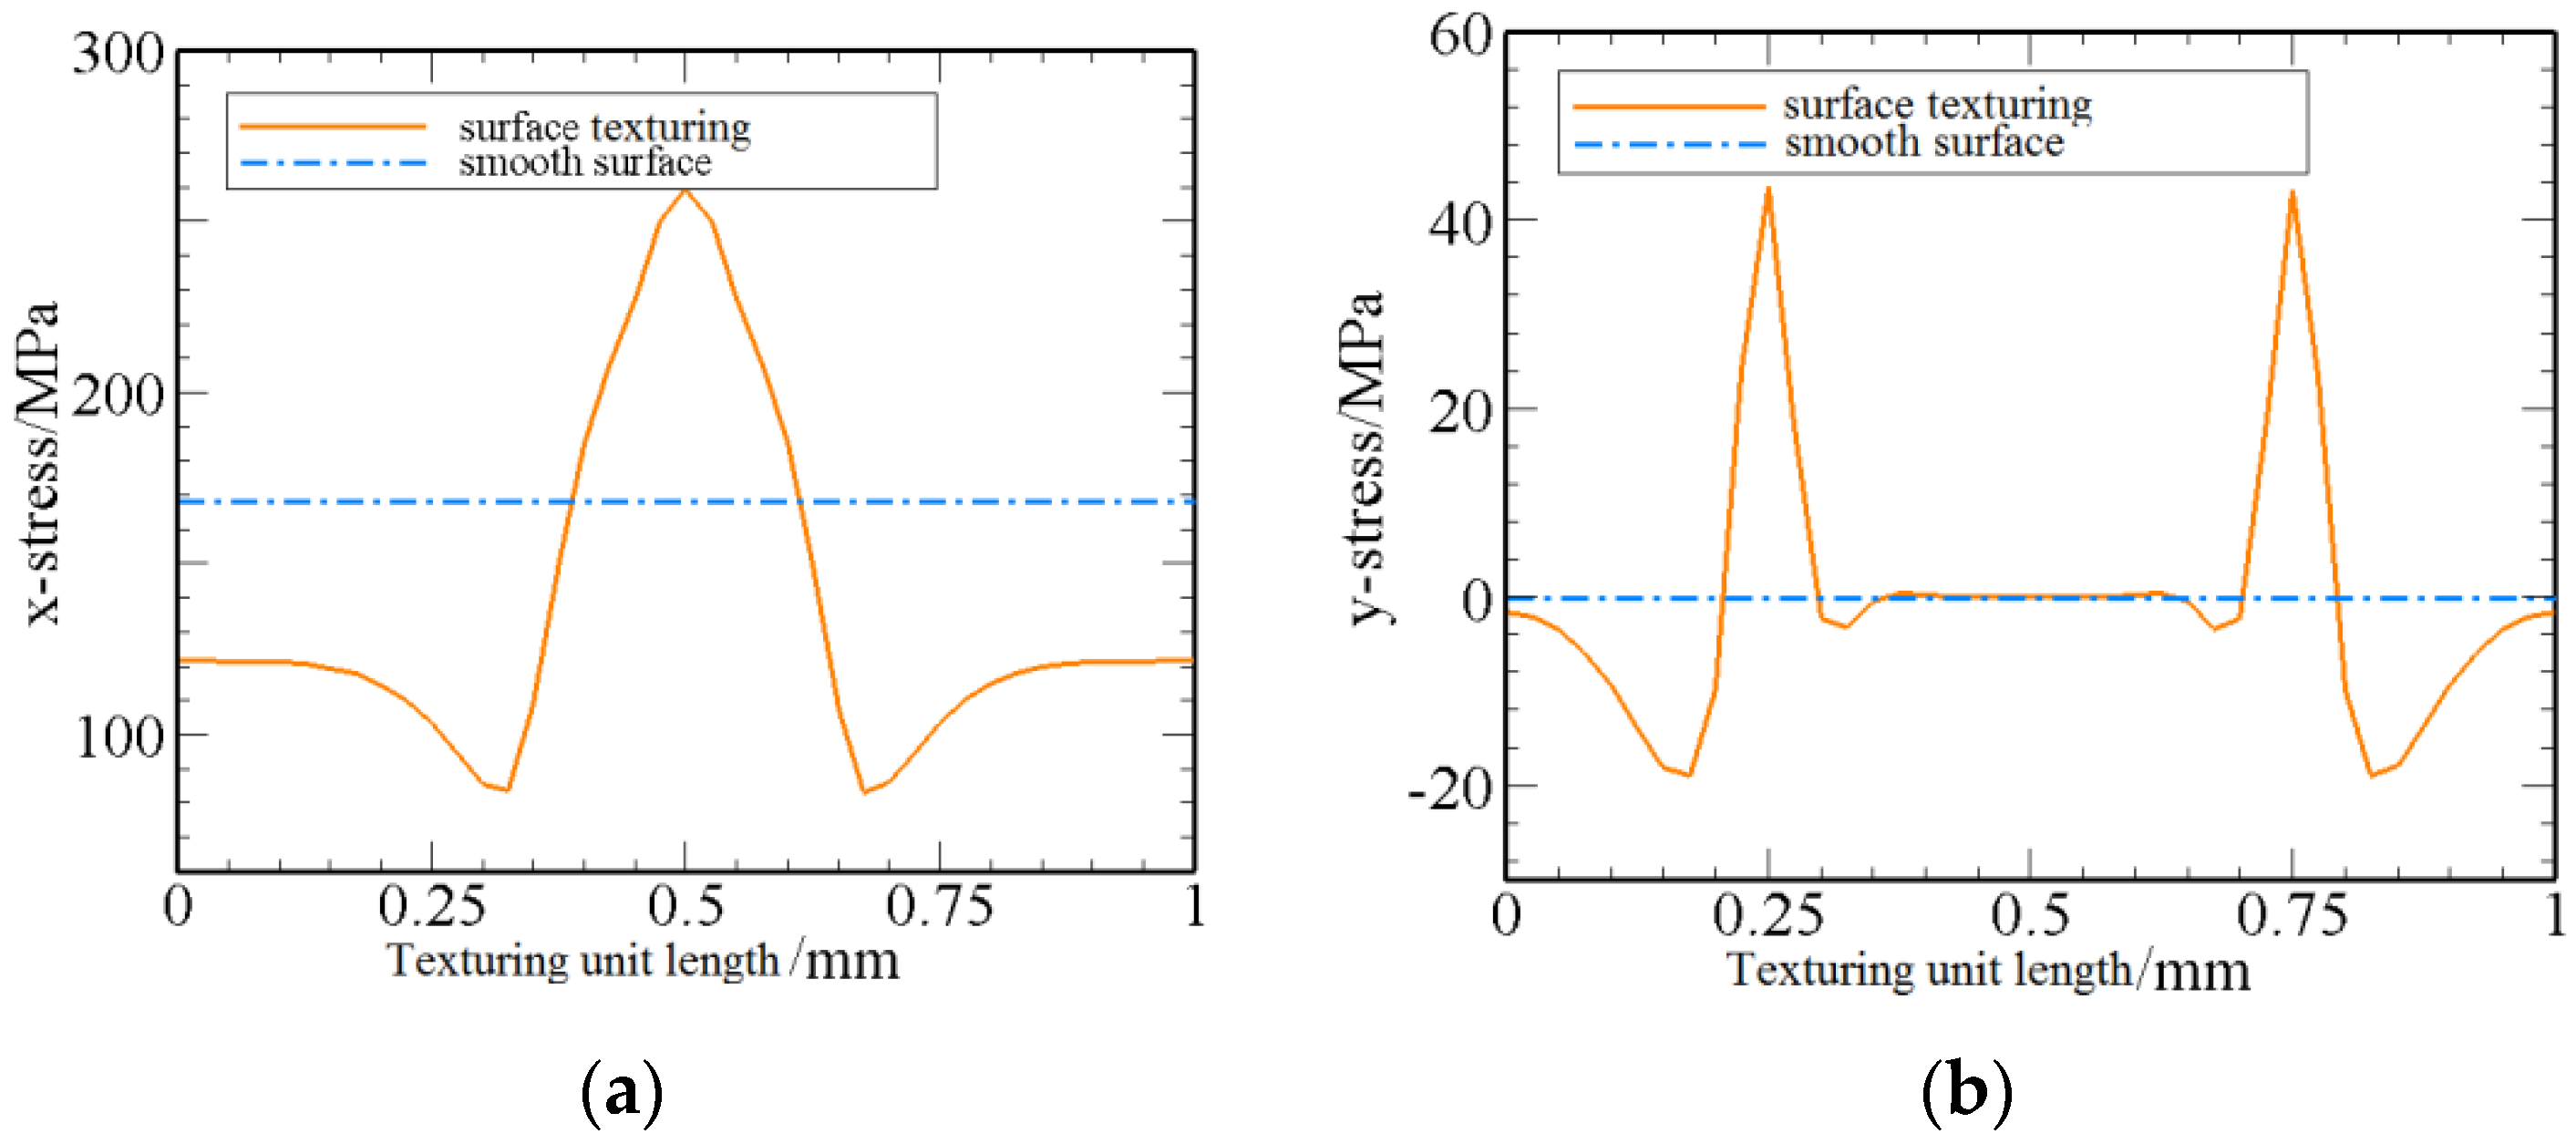
- Surface texturing can automatically generate a beneficial stress distribution in a surface layer when a material experiences rapid temperature changes.
- (2)
- There is an optimum design scale of texturing; the largest compressive stresses along the y–direction can be achieved when the texturing width and depth are W = 0.7 and H = 0.7, respectively.
- (3)
- When the material surface performance is more sensitive to the stresses of the x–direction, the optimum texturing width is W = 0.1 and the depth is H = 0.7.
- (4)
- When the material surface performance is more sensitive to the stresses of both the x–direction and the y–direction, the optimum texturing width is W = 0.5 and the depth is H = 0.7.
Acknowledgments
Author Contributions
Conflicts of Interest
References
- Etsion, I.; Kligerman, Y.; Halperin, G. Analytical and experimental investigation of Laser-textured mechanical seal face. Tribol. Trans. 1999, 42, 511–516. [Google Scholar] [CrossRef]
- Kovalchenko, A.; Ajayi, O.; Erdemir, A.; Fenske, G.; Etsion, I. The Effect of Laser Texturing of Steel Surfaces and Speed-Load Parameters on the Transition of Lubrication Regime from Boundary to Hydrodynamic. Tribol. Trans. 2004, 47, 299–307. [Google Scholar] [CrossRef]
- Zhao, Y.; Han, L. CFD-based on research on the load-bearing capacity of asymmetric texture with different Reynolds number. Surf. Rev. Lett. 2013, 20, 1–7. [Google Scholar] [CrossRef]
- Zhou, Y.; Zhu, H.; Tang, W.; Ma, C.; Zhang, W. Development of the theoretical model for the optimal design of surface texturing on cylinder liner. Tribol. Trans. 2012, 52, 1–6. [Google Scholar] [CrossRef]
- Lu, P.; Wood, R.; Gee, M.; Wang, L.; Pfleging, W. The Friction Reducing Effect of Square-Shaped Surface Textures under Lubricated Line-Contacts—An Experimental Study. Lubricants 2016, 4, 1–13. [Google Scholar] [CrossRef]
- Vandoni, L.; Demir, A.; Previtali, B.; Lecis, N.; Ugues, D. Wear Behavior of Fiber Laser Textured TiN Coatings in a Heavy Loaded Sliding Regime. Materials 2012, 5, 60–82. [Google Scholar] [CrossRef]
- Ahmmed, K.; Grambow, C.; Kietzig, A. Fabrication of Micro/Nano Structures on Metals by Femtosecond Laser Micromachining. Micromachines 2014, 5, 19–53. [Google Scholar] [CrossRef]
- Dumée, L.; She, F.; Duke, M.; Gray, S.; Hodgson, P.; Kong, L. Fabrication of Meso-Porous Sintered Metal Thin Films by Selective Etching of Silica Based Sacrificial Template. Nanomaterials 2014, 4, 86–99. [Google Scholar] [CrossRef]
- Shen, C.; Khonsari, M. Tribological and Sealing Performance of Laser Pocketed Piston Rings in a Diesel Engine. Tribol. Lett. 2016, 64, 1–9. [Google Scholar] [CrossRef]
- Usman, A.; Park, C. Optimizing the tribological performance of textured piston ring-liner contact for reduced frictional losses in SI engine: Warm operating conditions. Tribol. Int. 2016, 99, 24–36. [Google Scholar] [CrossRef]
- Ighil, N.; Fillon, M. A numerical investigation of both thermal and texturing surface effects on the journal bearings static characteristics. Tribol. Trans. 2015, 90, 28–39. [Google Scholar]
- Meng, F.; Zhang, L.; Liu, Y.; Li, T. Effect of compound dimple on tribological performances of journal bearing. Tribol. Int. 2015, 91, 99–110. [Google Scholar] [CrossRef]
- Kishimoto, A.; Morita, M.; Asaoka, H.; Hayashi, H. Using ion exchange to control the mechanical strength of Naβ-alumina ceramics. Solid State Ion. 2006, 177, 949–953. [Google Scholar] [CrossRef]
- Wagner, L.; Mhaede, M.; Wollmann, M.; Altenberger, I.; Sano, Y. Surface layer properties and fatigue behavior in Al 7075-T73 and Ti-6Al-4V: Comparing results after laser peening; shot peening and ball-burnishing. Int. J. Struct. Integr. 2011, 2, 185–199. [Google Scholar] [CrossRef]
- Ocana, J.L.; Correa, C.; García-Beltrán, A.; Porro, J.A.; Díaz, M.; Ruiz-de-Lara, L.; Peral, D. Laser Shock Processing of thin Al2024-T351 plates for induction of through-thickness compressive residual stresses fields. J. Mater. Process. Technol. 2015, 223, 8–15. [Google Scholar] [CrossRef]
- Aydıner, C.C.; Ustundag, E. Residual stresses in a bulk metallic glass cylinder induced by thermal tempering. Mech. Mater. 2005, 37, 201–212. [Google Scholar] [CrossRef]
- Hassani-Gangaraj, S.M.; Carboni, M.; Guagliano, M. Finite element approach toward an advanced understanding of deep rolling induced residual stresses, and an application to railway axles. Mater. Des. 2015, 83, 689–703. [Google Scholar] [CrossRef]
- Zhang, X.; Li, H.; Duan, S.W.; Yu, X.; Feng, J.; Wang, B.; Huang, Z. Modeling of residual stress field induced in Ti-6Al-4V alloy plate by two sided laser shock processing. Surf. Coat. Technol. 2015, 280, 163–173. [Google Scholar] [CrossRef]
- Aoki, S.; Nishimura, T.; Hiroi, T. Reduction method for residual stress of welded joint using random vibration. Nucl. Eng. Des. 2005, 235, 41–45. [Google Scholar] [CrossRef]
- Lu, A.L.; Tang, F.; Luo, X.J.; Mei, J.F.; Fang, H.Z. Research on residual-stress reduction by strong pulsed magnetic treatment. J. Mater. Process. Technol. 1998, 74, 259–262. [Google Scholar] [CrossRef]
- Jiang, W.; Zhang, Y.; Woo, W. Using heat sink technology to decrease residual stress in 316L stainless steel welding joint: Finite element simulation. Int. J. Press. Vessel. Pip. 2012, 92, 56–62. [Google Scholar] [CrossRef]
- Lu, L.; Sun, J.; Han, X.; Xiong, Q. Study on the Surface Integrity of a Thin-Walled Aluminum Alloy Structure after a Bilateral Slid Rolling Process. Metals 2016, 6, 1–12. [Google Scholar] [CrossRef]
- Ma, D.; Mostafa, A.; Kevorkov, D.; Jedrzejowski, P.; Pugh, M.; Medraj, M. Water Impingement Erosion of Deep-Rolled Ti64. Metals 2015, 5, 63–86. [Google Scholar] [CrossRef]
- Ramazani, A.; Mukherjee, K.; Abdurakhmanov, A.; Abbasi, M.; Prahl, U. Characterization of Microstructure and Mechanical Properties of Resistance Spot Welded DP600 Steel. Metals 2015, 5, 4–16. [Google Scholar] [CrossRef] [Green Version]
- Yang, D.; Kim, Y.; Hur, M.; Lee, H.; Kim, Y.; Lim, T.; Kim, K.; Yang, S. Control of the Nano-Particle Weight Ratio in Stainless Steel Micro and Nano Powders by Radio Frequency Plasma Treatment. Metals 2015, 5, 58–69. [Google Scholar] [CrossRef]
- Fichtner, T.; Wang, C.; Levin, A.; Kreiner, G.; Mejia, C.S.; Fabbrici, S.; Albertini, F.; Felser, C. Effects of Annealing on the Martensitic Transformation of Ni-Based Ferromagnetic Shape Memory Heusler Alloys and Nanoparticles. Metals 2015, 5, 484–503. [Google Scholar] [CrossRef]
- Natxiondo, A.; Suárez, R.; Sertucha, J.; Larrañaga, P. Graphite and Solid Fraction Evolutions during Solidification of Nodular Cast Irons. Metals 2015, 5, 239–255. [Google Scholar] [CrossRef]
- Zhou, W.; Zhang, R.; Ai, S.; Pei, Y.; Fang, D. Analytical modeling of thermal residual stresses and optimal design of ZrO2/(ZrO2 + Ni) sandwich ceramics. Ceram. Int. 2015, 41, 8142–8148. [Google Scholar] [CrossRef]
- Fialko, Y.; Sandwell, D.; Agnew, D.; Simons, M.; Shearer, P.; Minster, B. Deformation on Nearby Faults Induced by the 1999 Hector Mine Earthquake. Science 2002, 297, 1858–1862. [Google Scholar] [CrossRef] [PubMed]
- Yang, X.; Zhu, J.; Nong, Z.; Lai, Z.; He, D. FEM simulation of quenching process in A357 aluminum alloy cylindrical bars and reduction of quench residual stress through cold stretching process. Comput. Mater. Sci. 2013, 69, 396–413. [Google Scholar] [CrossRef]


| Texturing Parameters |
|---|
© 2016 by the authors; licensee MDPI, Basel, Switzerland. This article is an open access article distributed under the terms and conditions of the Creative Commons Attribution (CC-BY) license (http://creativecommons.org/licenses/by/4.0/).
Share and Cite
Han, L.; Wu, Y.; Gong, H.; Shi, W. Effect of Surface Texturing on Stresses during Rapid Changes in Temperature. Metals 2016, 6, 290. https://doi.org/10.3390/met6110290
Han L, Wu Y, Gong H, Shi W. Effect of Surface Texturing on Stresses during Rapid Changes in Temperature. Metals. 2016; 6(11):290. https://doi.org/10.3390/met6110290
Chicago/Turabian StyleHan, Lei, Yunxin Wu, Hai Gong, and Wenze Shi. 2016. "Effect of Surface Texturing on Stresses during Rapid Changes in Temperature" Metals 6, no. 11: 290. https://doi.org/10.3390/met6110290