Article

The Effect of Ultrafast Heating in Cold-Rolled Low Carbon Steel: Recrystallization and Texture Evolution

by
Felipe M. Castro Cerda
1,2,*,
Leo A. I. Kestens
1,3,
Alberto Monsalve
2 and
Roumen H. Petrov
1,3
1
Department of Materials Science and Engineering, Ghent University, Technologiepark 903, 9052 Gent, Belgium
2
Department of Metallurgical Engineering, Universidad de Santiago de Chile, Av. Lib. Bdo. O´Higgins 3363, Estación Central, 9170022 Santiago de Chile, Chile
3
Department of Materials Science and Engineering, Delft University of Technology, Mekelweg 2, 2628CD Delft, The Netherlands
*
Author to whom correspondence should be addressed.
Metals 2016, 6(11), 288; https://doi.org/10.3390/met6110288
Submission received: 4 October 2016 / Revised: 8 November 2016 / Accepted: 17 November 2016 / Published: 21 November 2016

Abstract

:
The microstructure and texture evolution of cold-rolled low carbon steel after ultrafast heating and quenching is investigated. Experiments were carried out at heating rates of 150 °C/s and 1500 °C/s. The recrystallization of ferrite is studied by scanning electron microscopy and electron backscattered diffraction techniques. The texture evolution of cold rolled steel during ultrafast heating was studied, making it possible to estimate the precise effect of heating rate on the orientations of newly formed grains. The experimental results showed that the recrystallization of ferrite was not completed before the full transformation of austenite. The noticeable increase in the fraction of recrystallized grains of diameter less than 1 µm, when the heating rate is increased from 150 °C/s to 1500 °C/s suggests that the increase of the heating rate enhances the nucleation of ferrite. The crystallographic orientations in recrystallized ferrite are strongly influenced by the heating rates. The effect of heating rate in the releasing of stored energy, carbon diffusion and spheroidization of cementite might explain some differences in textures observed in recrystallized ferrite.

1. Introduction

New processing routes for the production of third generation advanced high strength steels (AHSS) are currently under development [1,2,3,4,5]. The application of ultrafast heating (UFH) to cold-rolled low carbon steel is a growing research field which has recently gained considerable attention from both academic and industry communities. Recent studies [3,4,5,6,7,8] have revealed the potential of UFH for enhancing the mechanical properties of the standard low alloy steel grades. The advantage of applying UFH rates to cold-rolled low carbon steel stems from the great variety of microstructures and the properties that can be derived from them. However, the adaptability of UFH rates to conventional steel processing lines still remains an issue [9].
In the present study, the heating rates have been classified in the following ranges: conventional, (lower than 10 °C/s), fast (from 10 to 100 °C/s) and ultrafast (higher than 100 °C/s). The effect of UFH rates on the recrystallization of cold-rolled ultra-low carbon (ULC) steel during continuous heating (anisothermal conditions) was the subject of a number of studies in recent years [10,11,12,13,14,15]. Ferry et al. [11] and Muljono et al. [12] reported faster recrystallization kinetics when UFH rates are applied in comparison to conventional heating rates. However, increasing the heating rate decreases the recrystallized fraction of ferrite for a given temperature. The pinning effect of carbon atoms on the dislocation structure is claimed to play a significant role in slowing the recrystallization and decreasing the ferrite recrystallized fraction at the same heating temperatures. Similar findings are reported by Stockemer and Vanden Brande [14] and Senuma et al. [15]. It is also reported that the recrystallization is completed before the onset of austenite formation in low and very low carbon steels, as well as in interstitial free (IF) steel [16]. Results on the texture evolution during fast and ultrafast heating of ULC steel and low carbon steel heating have been published elsewhere [4,5,6,7,14,15,17,18]. The orientation measurements do not show significant deviations from {111}<uvw> ND fiber [19,20], suggesting that the recrystallization textures in ferrite are practically independent of the heating rate. In cold-rolled low carbon steel of ferrite-pearlite initial microstructure, the recrystallization is completely suppressed at heating rates above ~3000 °C/s [6]. Petrov et al. [6,7] explained the influence of UFH in the final textures as an effect of the stabilization of the recovered structure of the deformed ferrite due to very high heating rate and absence of isothermal soaking.
The microstructure of the carbon steels after ultrafast heating is strongly influenced by the chemical composition, the initial microstructure, and the heating rate. In the present study, the goal is to investigate the recrystallization and evolution of a 70% cold rolled steel with a ferrite-pearlite microstructure under two reheating conditions: (i) a heating rate of 150 °C/s and (ii) a heating rate of 1500 °C/s. In both cases, the steels were subsequently quenched practically without any isothermal soaking. The current analysis is mainly focused on the recrystallization of ferrite, whereas the formation of austenite is studied in a separate paper (Castro Cerda et al., The effect of ultrafast heating on cold-rolled low carbon steel: Formation and decomposition of austenite, submitted to Metals, 2016) The selected heating rates represent achievable intermediate and upper limit values under industrial conditions [9]. The obtained results are expected to be of significance for the potential application of fast heating cycles in newly designed production lines.

2. Materials and Methods

2.1. Steel and Heat Treatment

The chemical composition of the steel used in this work is shown in Table 1. The initial material was received in hot-rolled condition, and it was subsequently cold rolled to 70% reduction. Rectangular specimens for heat treatment were cut from cold rolled sheets with a long axis parallel to the rolling direction (RD) of the steel plate. The heating experiments were carried out in a DIL805AD Bähr Dilatometer (TA Instruments, New Castle, DE, USA) at a heating rate of 150 °C/s, and the UFH experiments in a Gleeble 3800 thermomechanical simulator (Dynamic Systems Inc., Poestenkill, NY, USA) at a rate of 1500 °C/s. The sizes of the dilatometry specimens were 10 × 5 × 1 mm³ and 60 × 10 × 1 mm3 for the Gleeble specimens. The temperature was controlled by an S-type thermocouple spot welded to the midsection of each test specimen. Peak annealing (also called “flash annealing”) experiments, i.e., heated up to a certain temperature and then quenched, after very brief isothermal soaking (less than 0.5 s) were carried out in the test specimens at several temperatures in the intercritical and fully austenitic range. A summary of the peak temperatures is shown in Table 2. Cooling (quenching) rates were around −160 °C/s for dilatometric and −2000 °C/s for Gleeble experiments.

2.2. Characterization

The calculated equilibrium temperatures for the studied steel were A1 = 674 °C and A3 = 834 °C. The microstructure evolution was analyzed by dilatometry experiments, optical microscopy (OM, Carl Zeiss Microscopy, Thornwood, NY, USA), scanning electron microscopy (SEM, FEI, Hillsboro, OR, USA) and electron backscatter diffraction (EBSD, EDAX Inc., Mahwah, NJ, USA). Specimens were cut from the middle of each test sample to avoid any effect of temperature gradients along the length (RD). The characterization was thus performed on the RD plane (the plane which is perpendicular to the sample rolling direction) at the center of the heat treated zone, where the thermocouple was placed. Metallographic samples were prepared according to the standard procedures by grinding and polishing to 1 μm diamond paste. The microstructure was revealed by etching with a solution of 4% HNO3 in ethanol (Nital 4%) for ~10 s at room temperature. EBSD measurements were performed after an additional 40 min mechanical polishing of the samples with colloidal silica with a particle size of 35 nm and 10 N force. The SEM images and the EBSD data collection were acquired in the transverse plane of the rolled samples i.e., in the plane perpendicular to the sample transverse direction (TD).
The EBSD data acquisition was carried out with a Hikari detector operated with the EDAX-TSL-OIM-Data Collection version 6 software. The measuring set-up was installed on a FEI Quanta™ 450-FEG-SEM (FEI, Hillsboro, OR, USA), which operated at 20 kV, beam current of ~2.4 nA corresponding to FEI spot size number 5 for an aperture of 30 µm and a working distance of 16 mm. The samples were 70° tilted towards the EBSD detector, and the EBSD patterns were acquired in a hexagonal scan grid with a step size of 60 nm. The textures are represented as orientation distribution functions (ODFs) using Bunge notation. They were calculated with series rank (L = 16), Gaussian half-width of 5° and orthotropic sample symmetry. Each texture calculation is based on a minimum area of ~6.400 μm2 and contains more than 5000 grains.

2.3. Data Post-Processing and Analysis

Phase quantification was performed on EBSD data with TSL-OIM Analysis V6.3 (EDAX Inc., Mahwah, NJ, USA). The raw EBSD data were post-processed (cleaned) to re-assign the dubiously indexed points using the grain confidence index standardization procedure. To distinguish between martensite and ferrite (both indexed as BCC phases), a plot of the grain area fraction was considered vs. the grain average image quality (GAIQ), following the procedure described in [21,22]. The grains were defined as the arrangement of at least 4 points with a misorientation angle higher than 5° and confidence index higher than 0.1. Grain diameter is estimated as the diameter of the circle with area equal to the area of the detected grain in the EBSD map under the above grain definition. The martensite fraction was associated with the low IQ part of the histogram, whereas the ferrite fraction corresponds to the part with high IQ values. The ferrite fraction is composed of recrystallized and non-recrystallized grains. However, the fraction of the recrystallized ferrite was difficult to obtain accurately from the IQ values. One reason for this is the high IQ of some unrecrystallized but recovered ferritic grains, which makes it difficult to separate them from completely recrystallized ones. To better distinguish between the recrystallized and recovered grains, the grain average misorientation (GAM) histogram was considered. In the present study, the approach of [23] was applied where the recrystallized grains were regarded as having a grain average misorientation less than 0.4°, while grains with a grain average misorientation larger than 0.4° were considered non-recrystallized.

3. Results

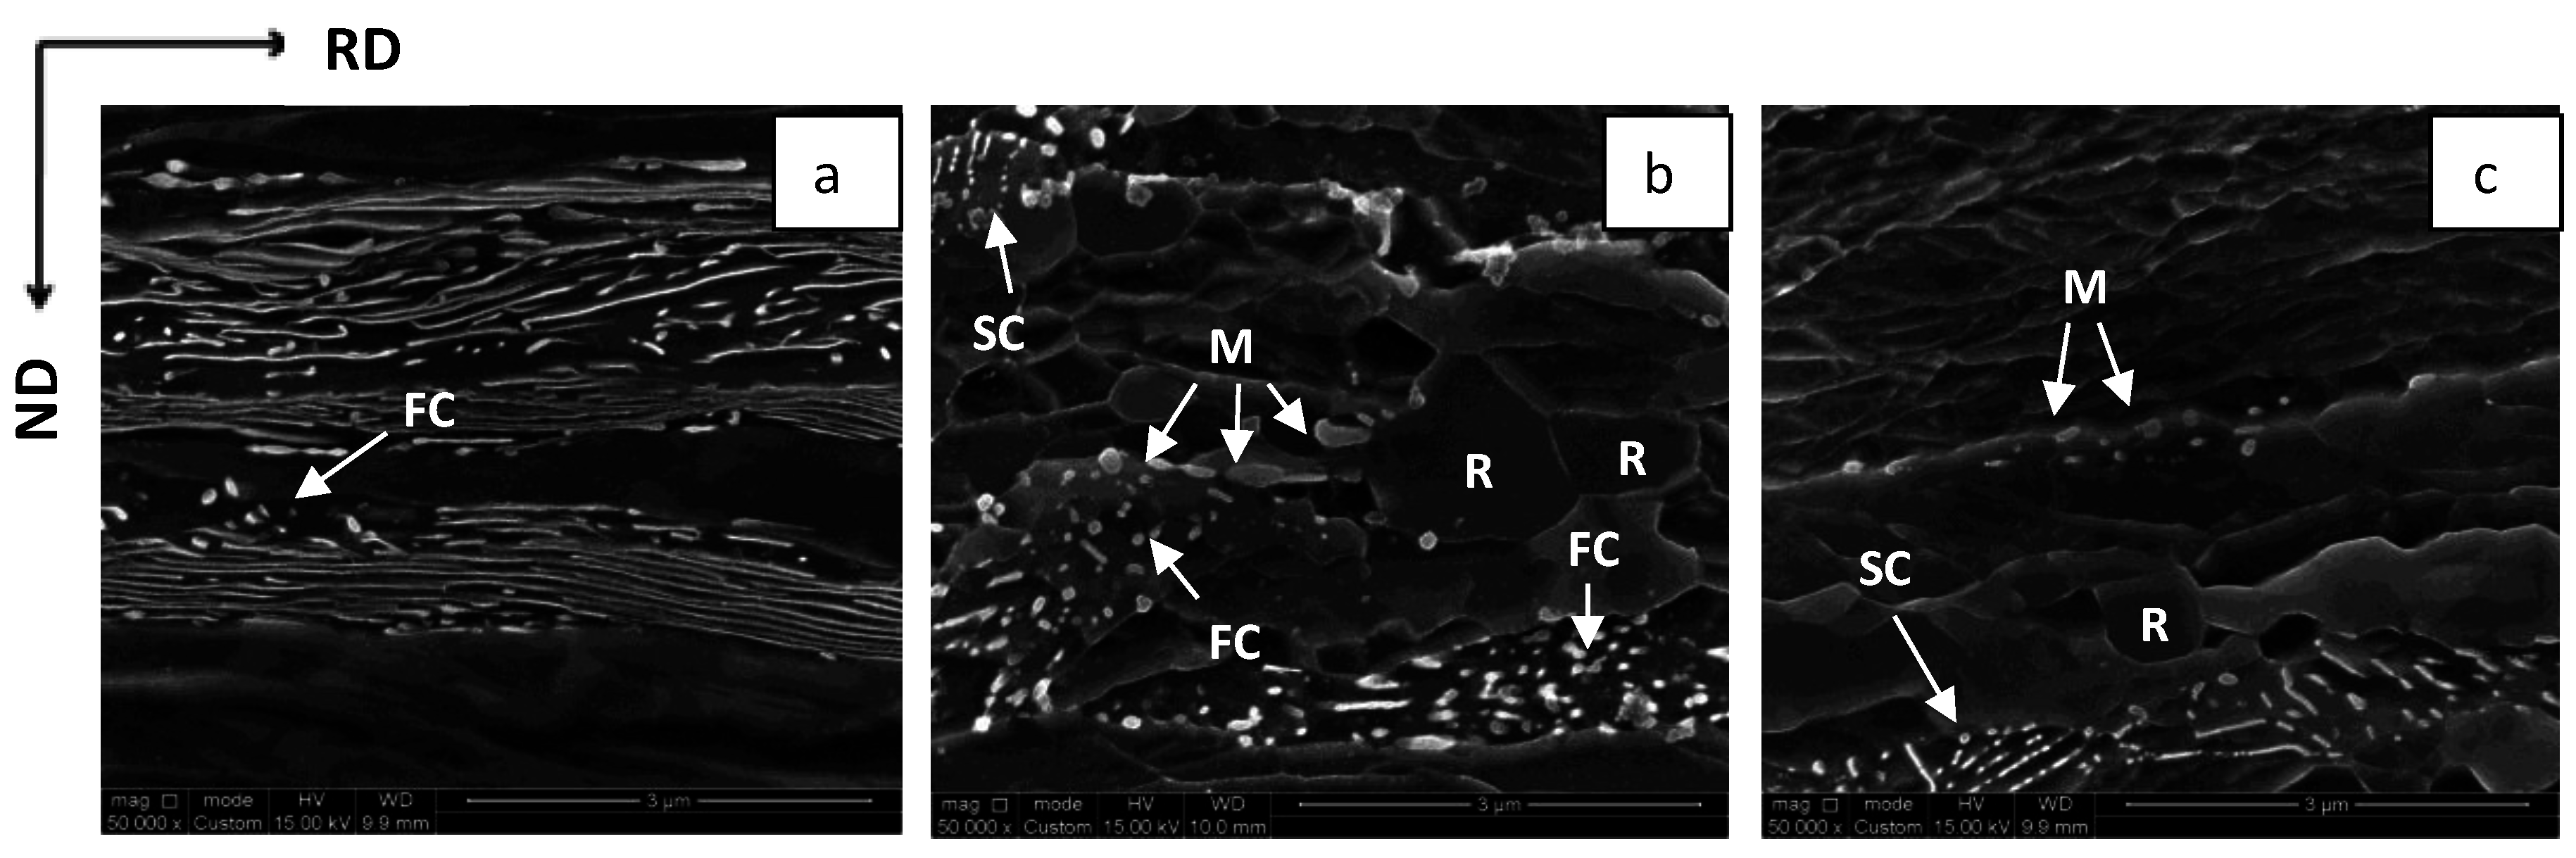
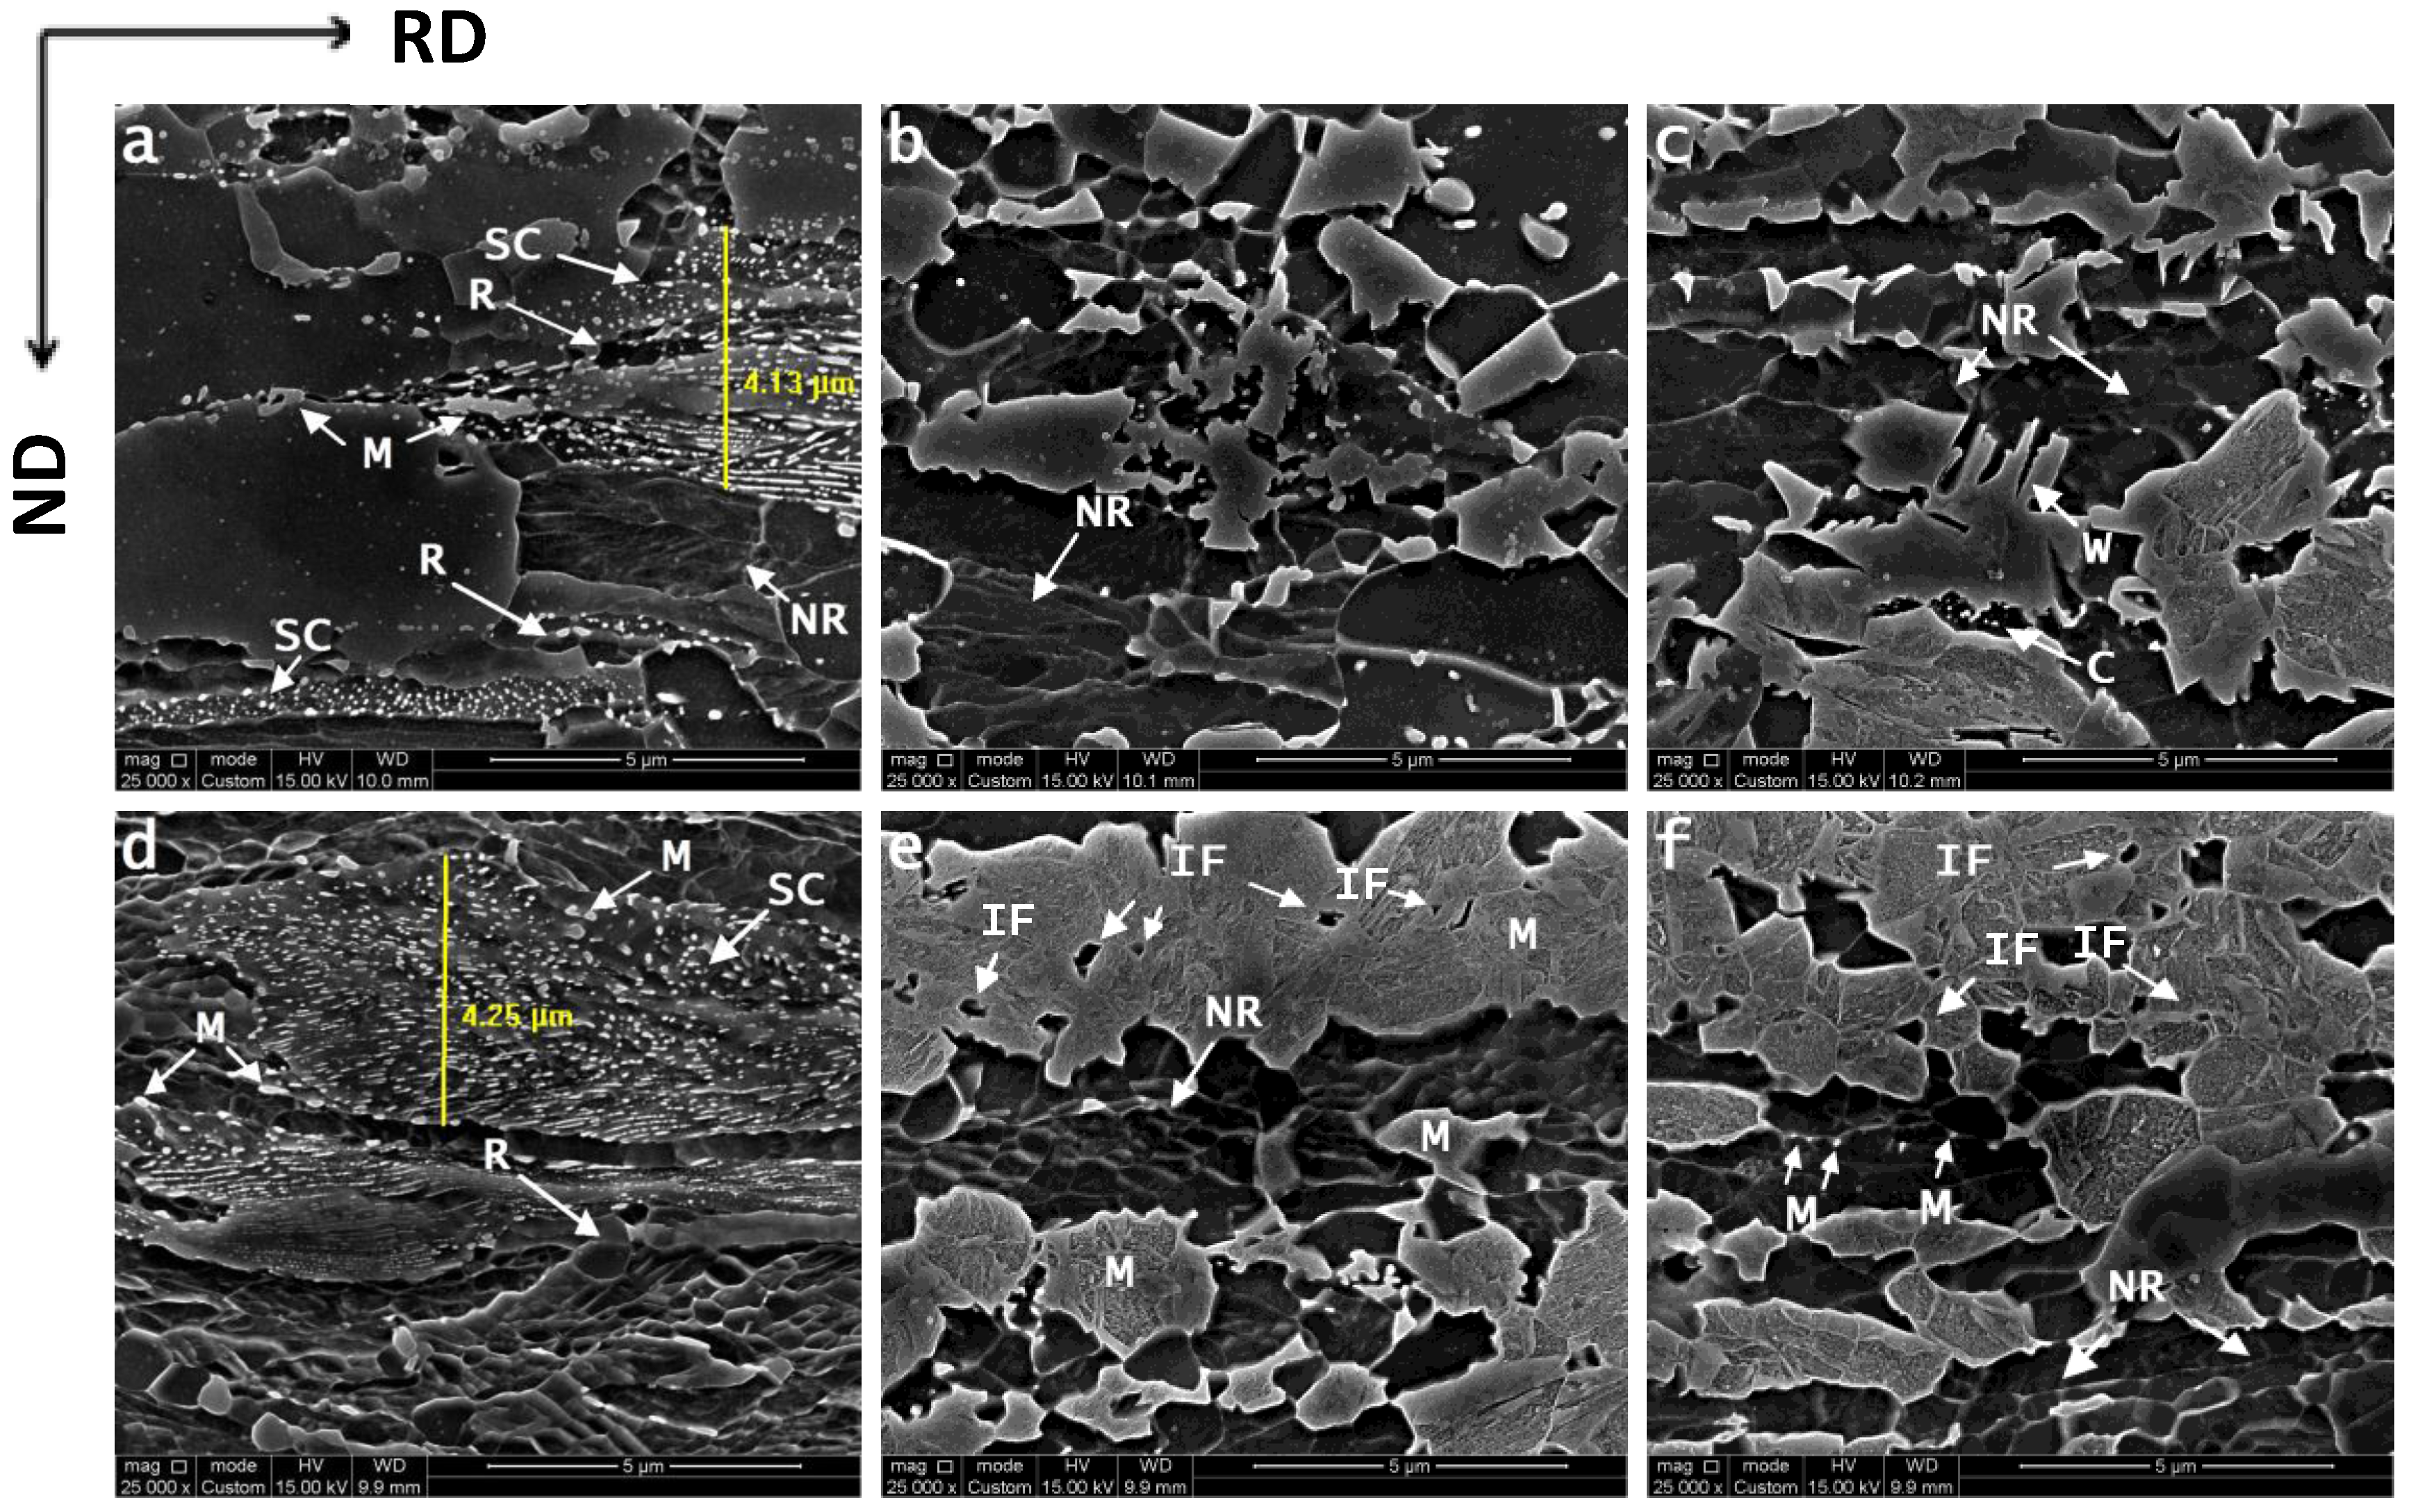
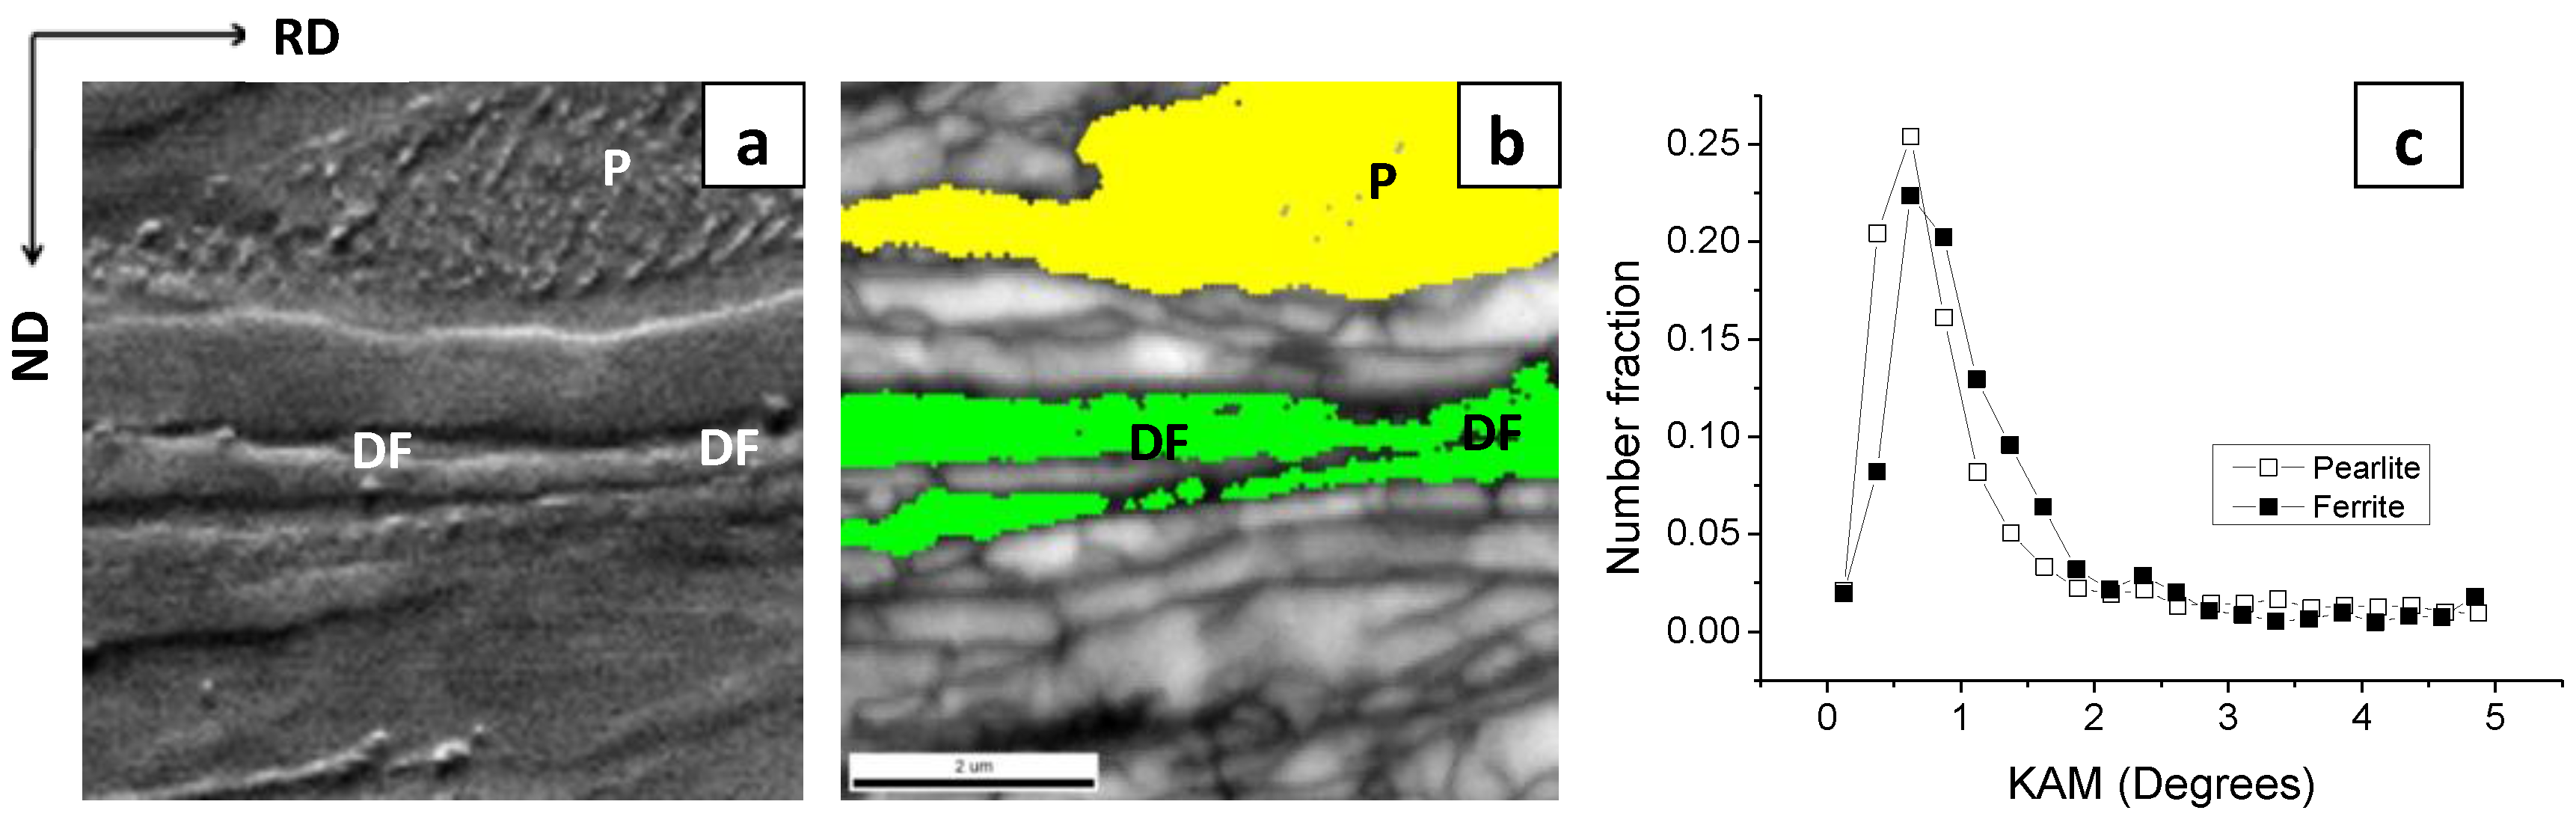
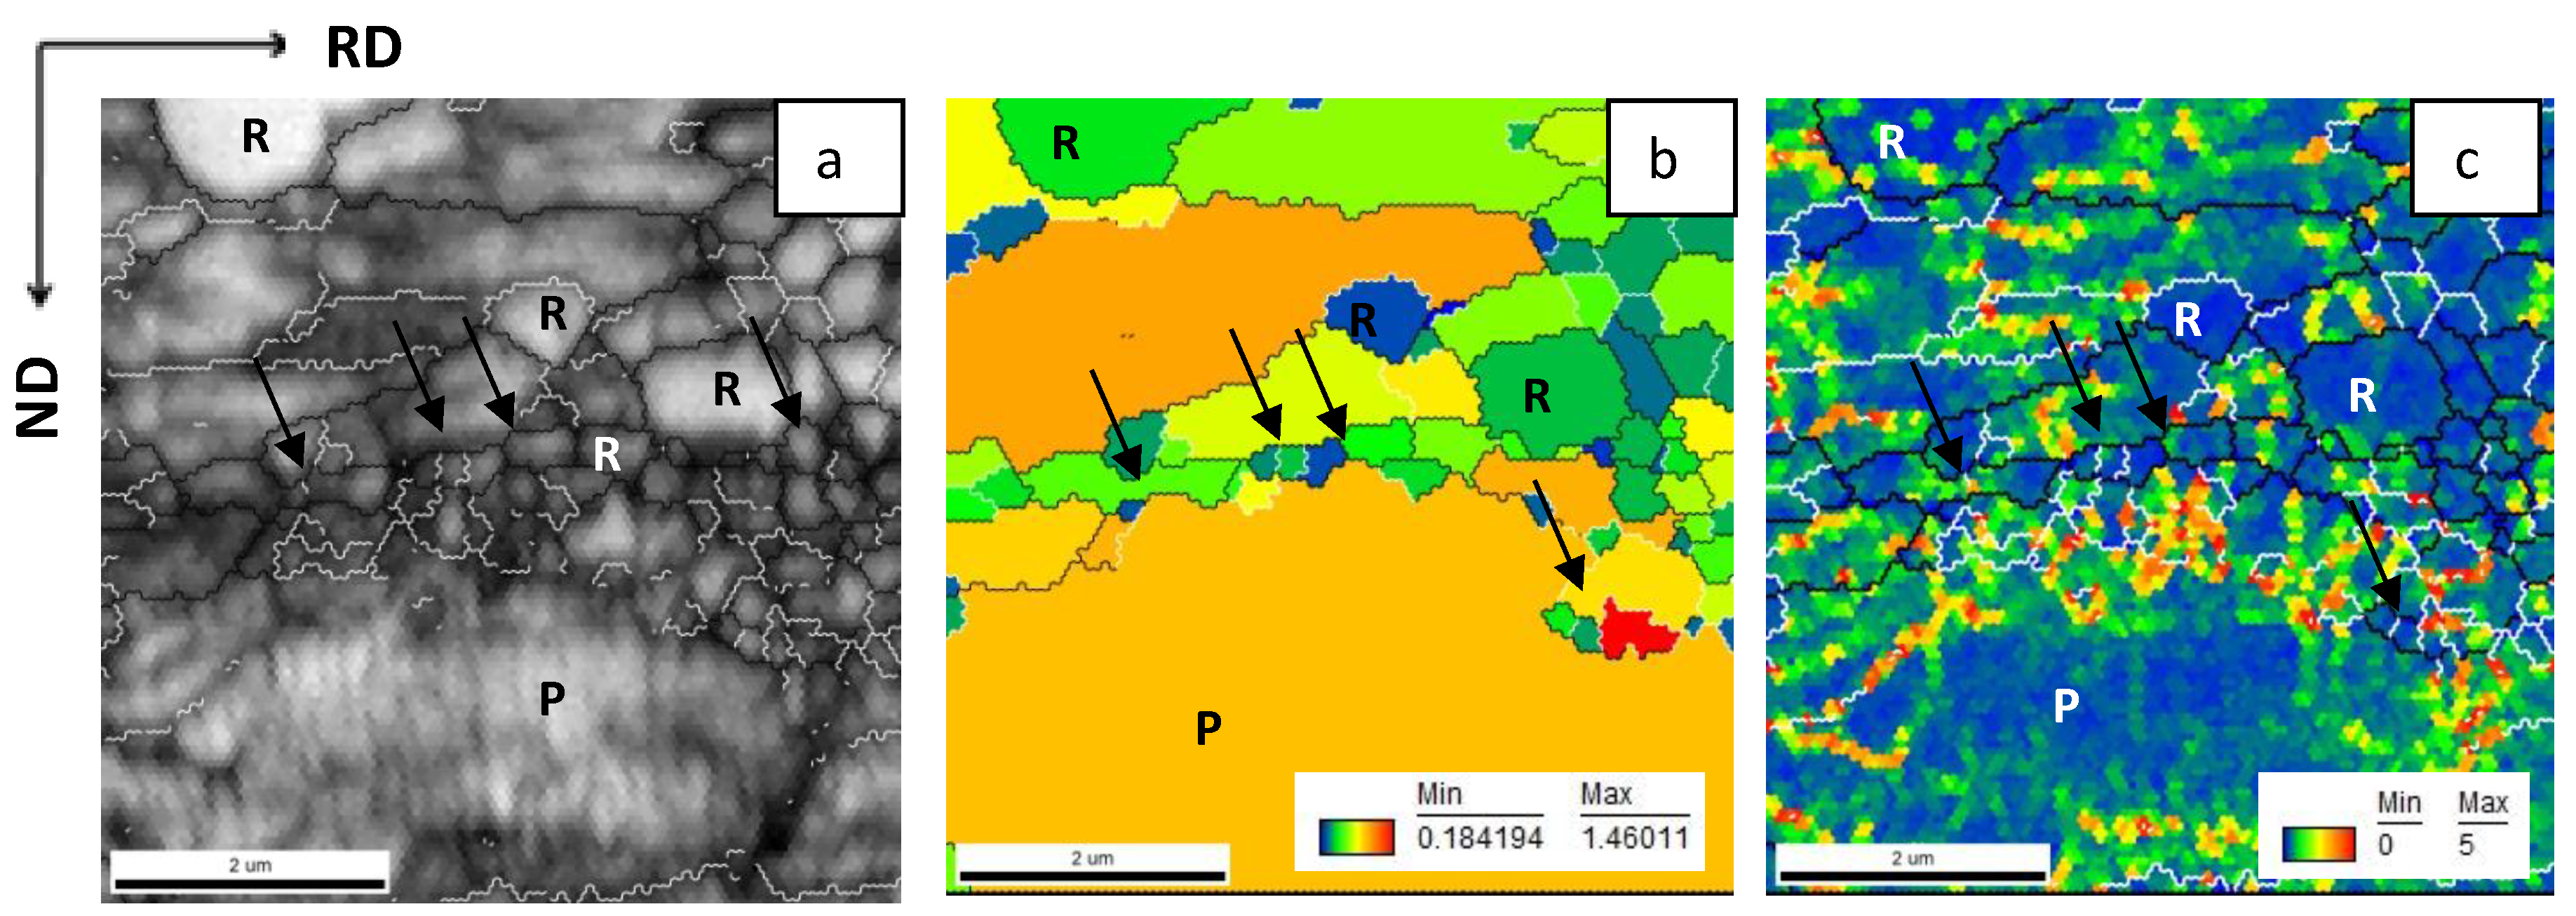
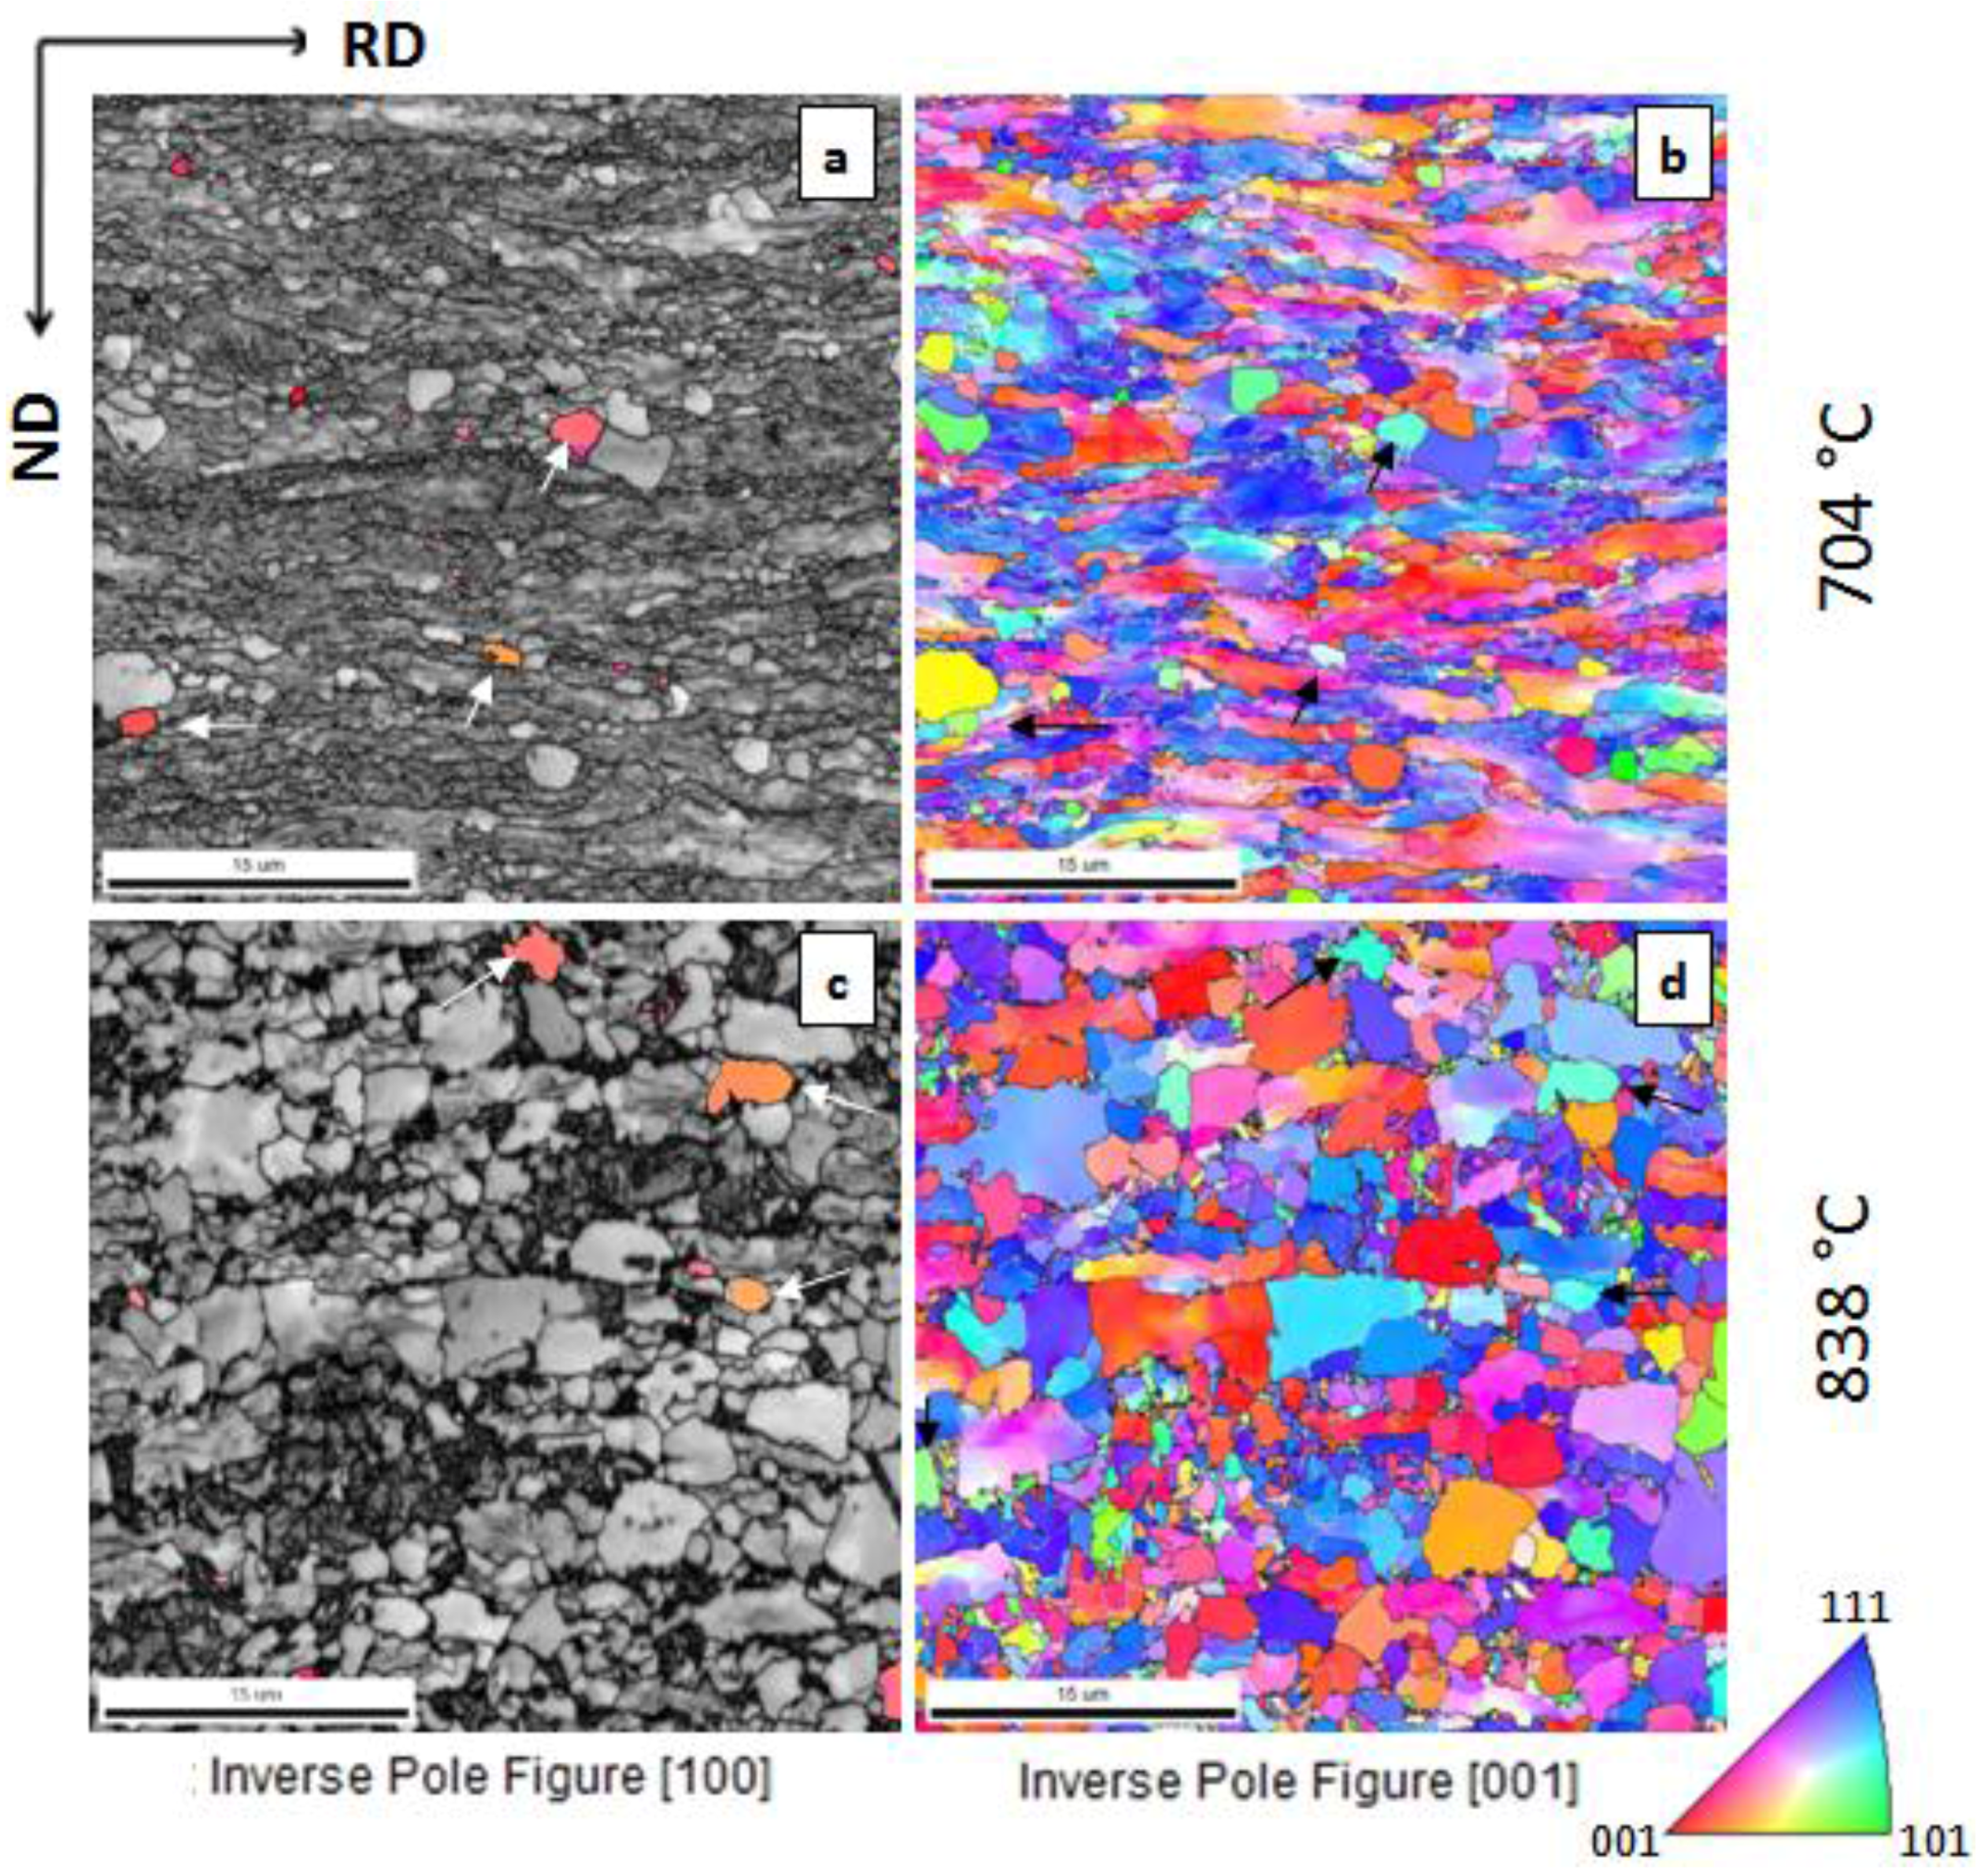
3.1. Microstructure after Cold-Rolling and Ultrafast Heating

The microstructures after different heating cycles are shown in Figure 1. All microstructures consist of a mixture of ferrite and martensite and, in some cases (Figure 1a,d), small fractions of spheroidized cementite are also resolved. The latter are products of partial spheroidization of pearlite. The martensite in SEM images is identified by its morphology and location in the microstructure. The recrystallization starts below 738 °C in samples annealed at 150 °C/s (cf. R in Figure 1a,d). The new (recrystallized) grains of ferrite were observed to grow from two different sites: in deformed ferrite grains and inside some former pearlitic colonies. The pearlitic cementite was spheroidized in the samples heated at 150 °C/s to 738 °C (cf. SC arrows in Figure 1a) and 1500 °C/s to 749 °C (SC arrow in Figure 1b). No recrystallized ferrite was observed to nucleate inside the lamellar or slightly spheroidized aggregates. The recrystallization is not complete below the A3 temperature for both heating rates. The arrows (NR) in Figure 1 indicate several non-recrystallized ferritic grains. Because of the specific cellular substructure, it is assumed that these grains are recovered [17]. Such grains will be referred to as recovered or deformed in the following sections, because they have the shape of the deformed grains and higher dislocation density than the recrystallized grains, as will be shown later.

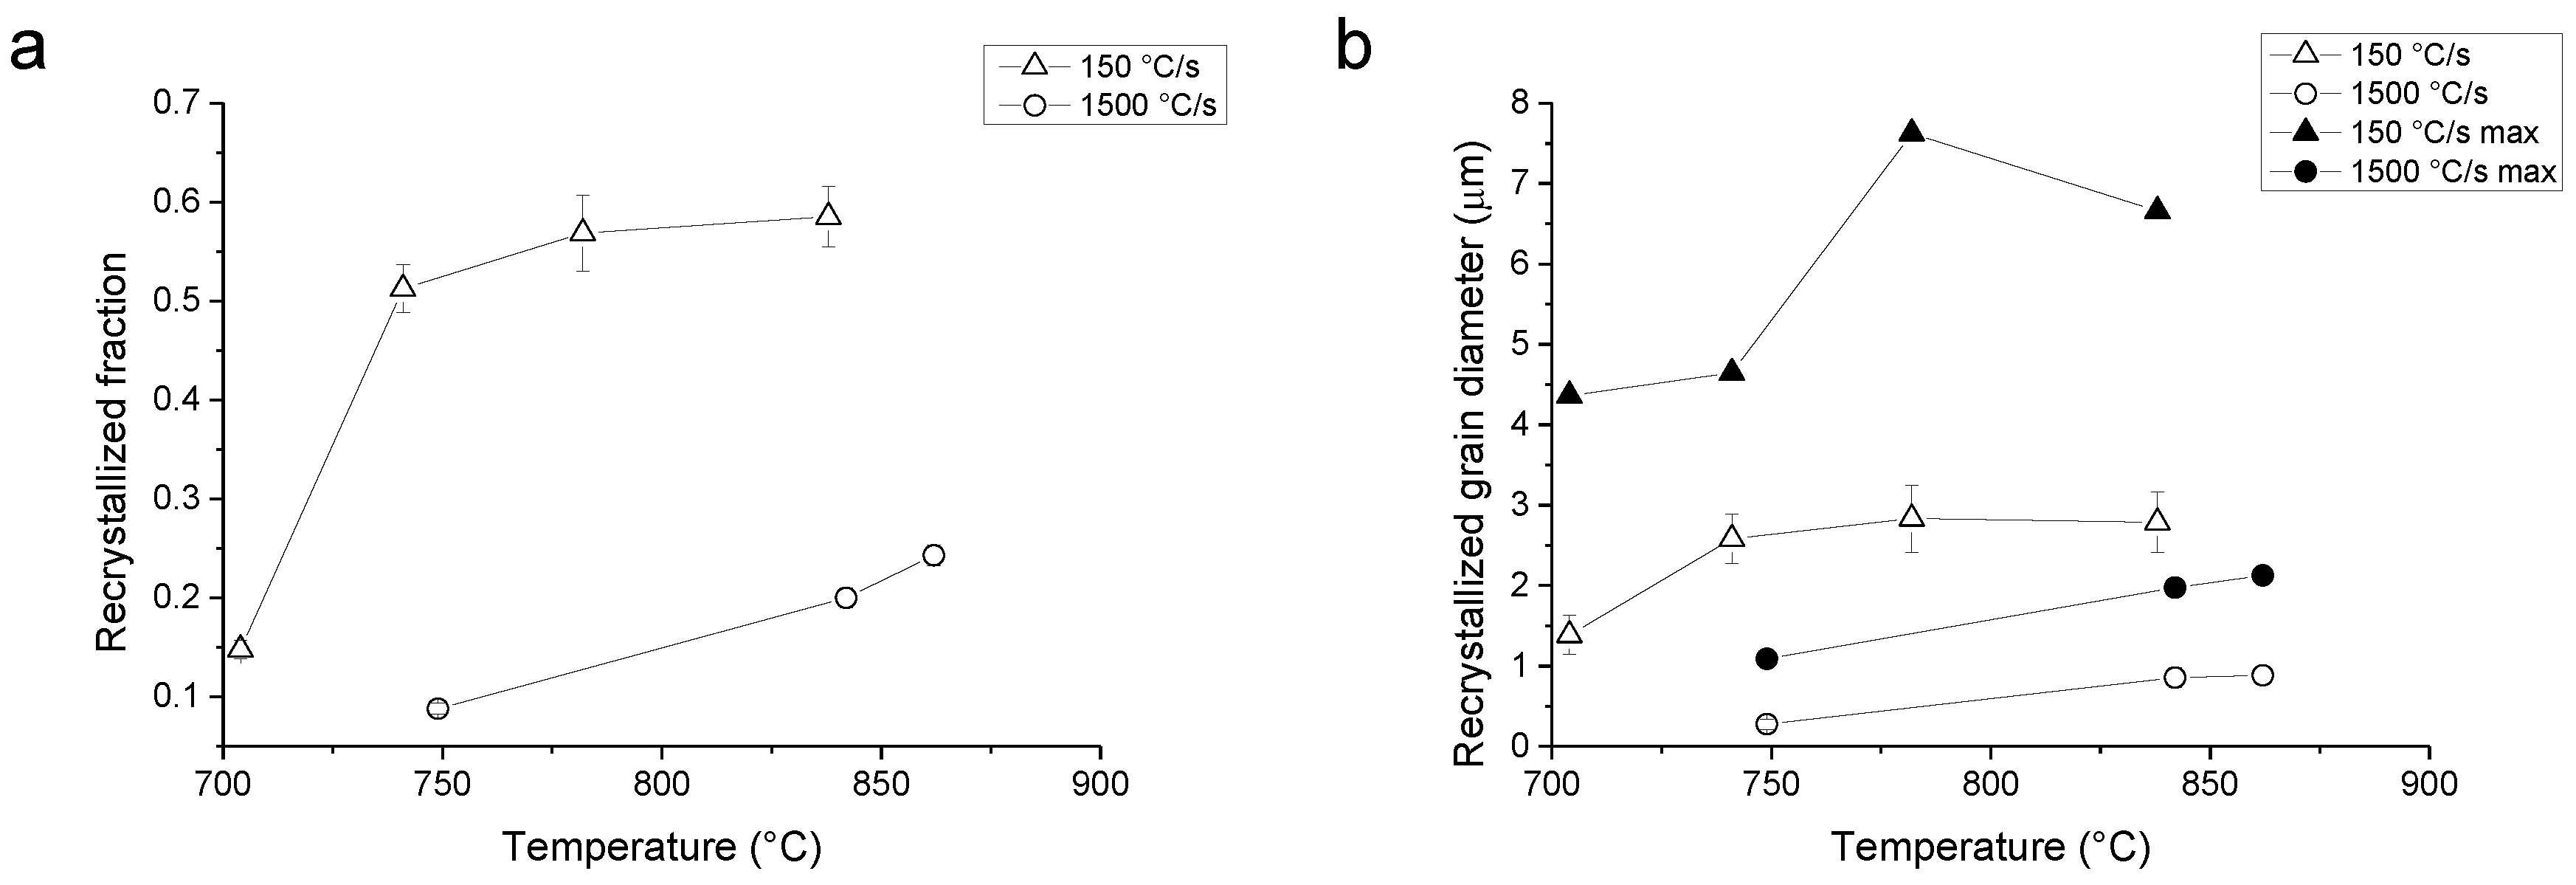
3.2. Anisothermal Recrystallization of Ferrite
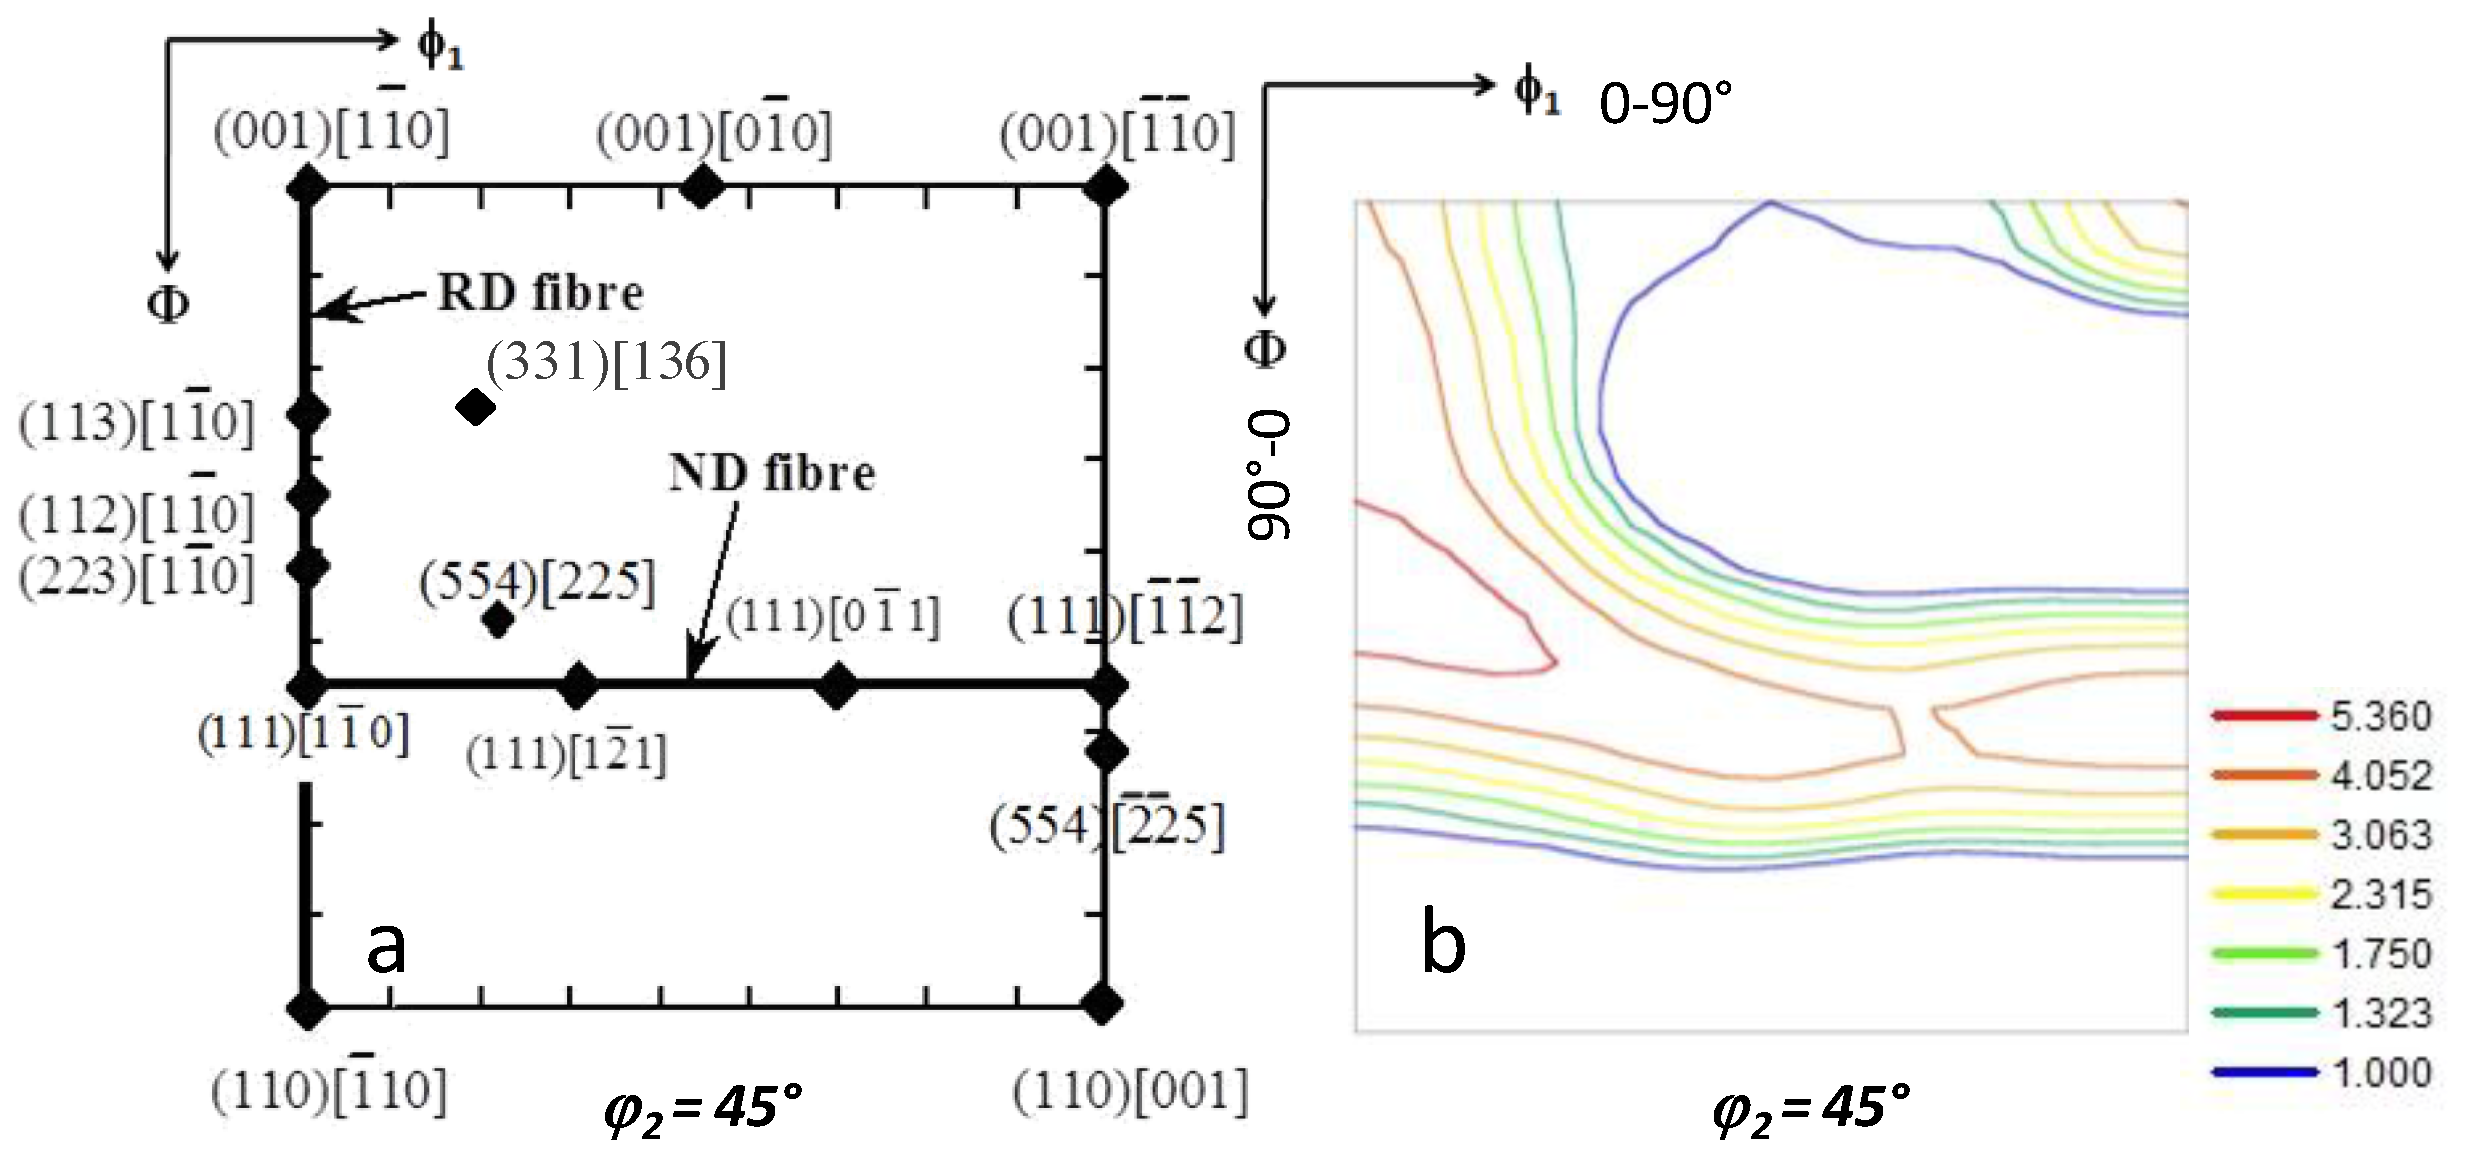
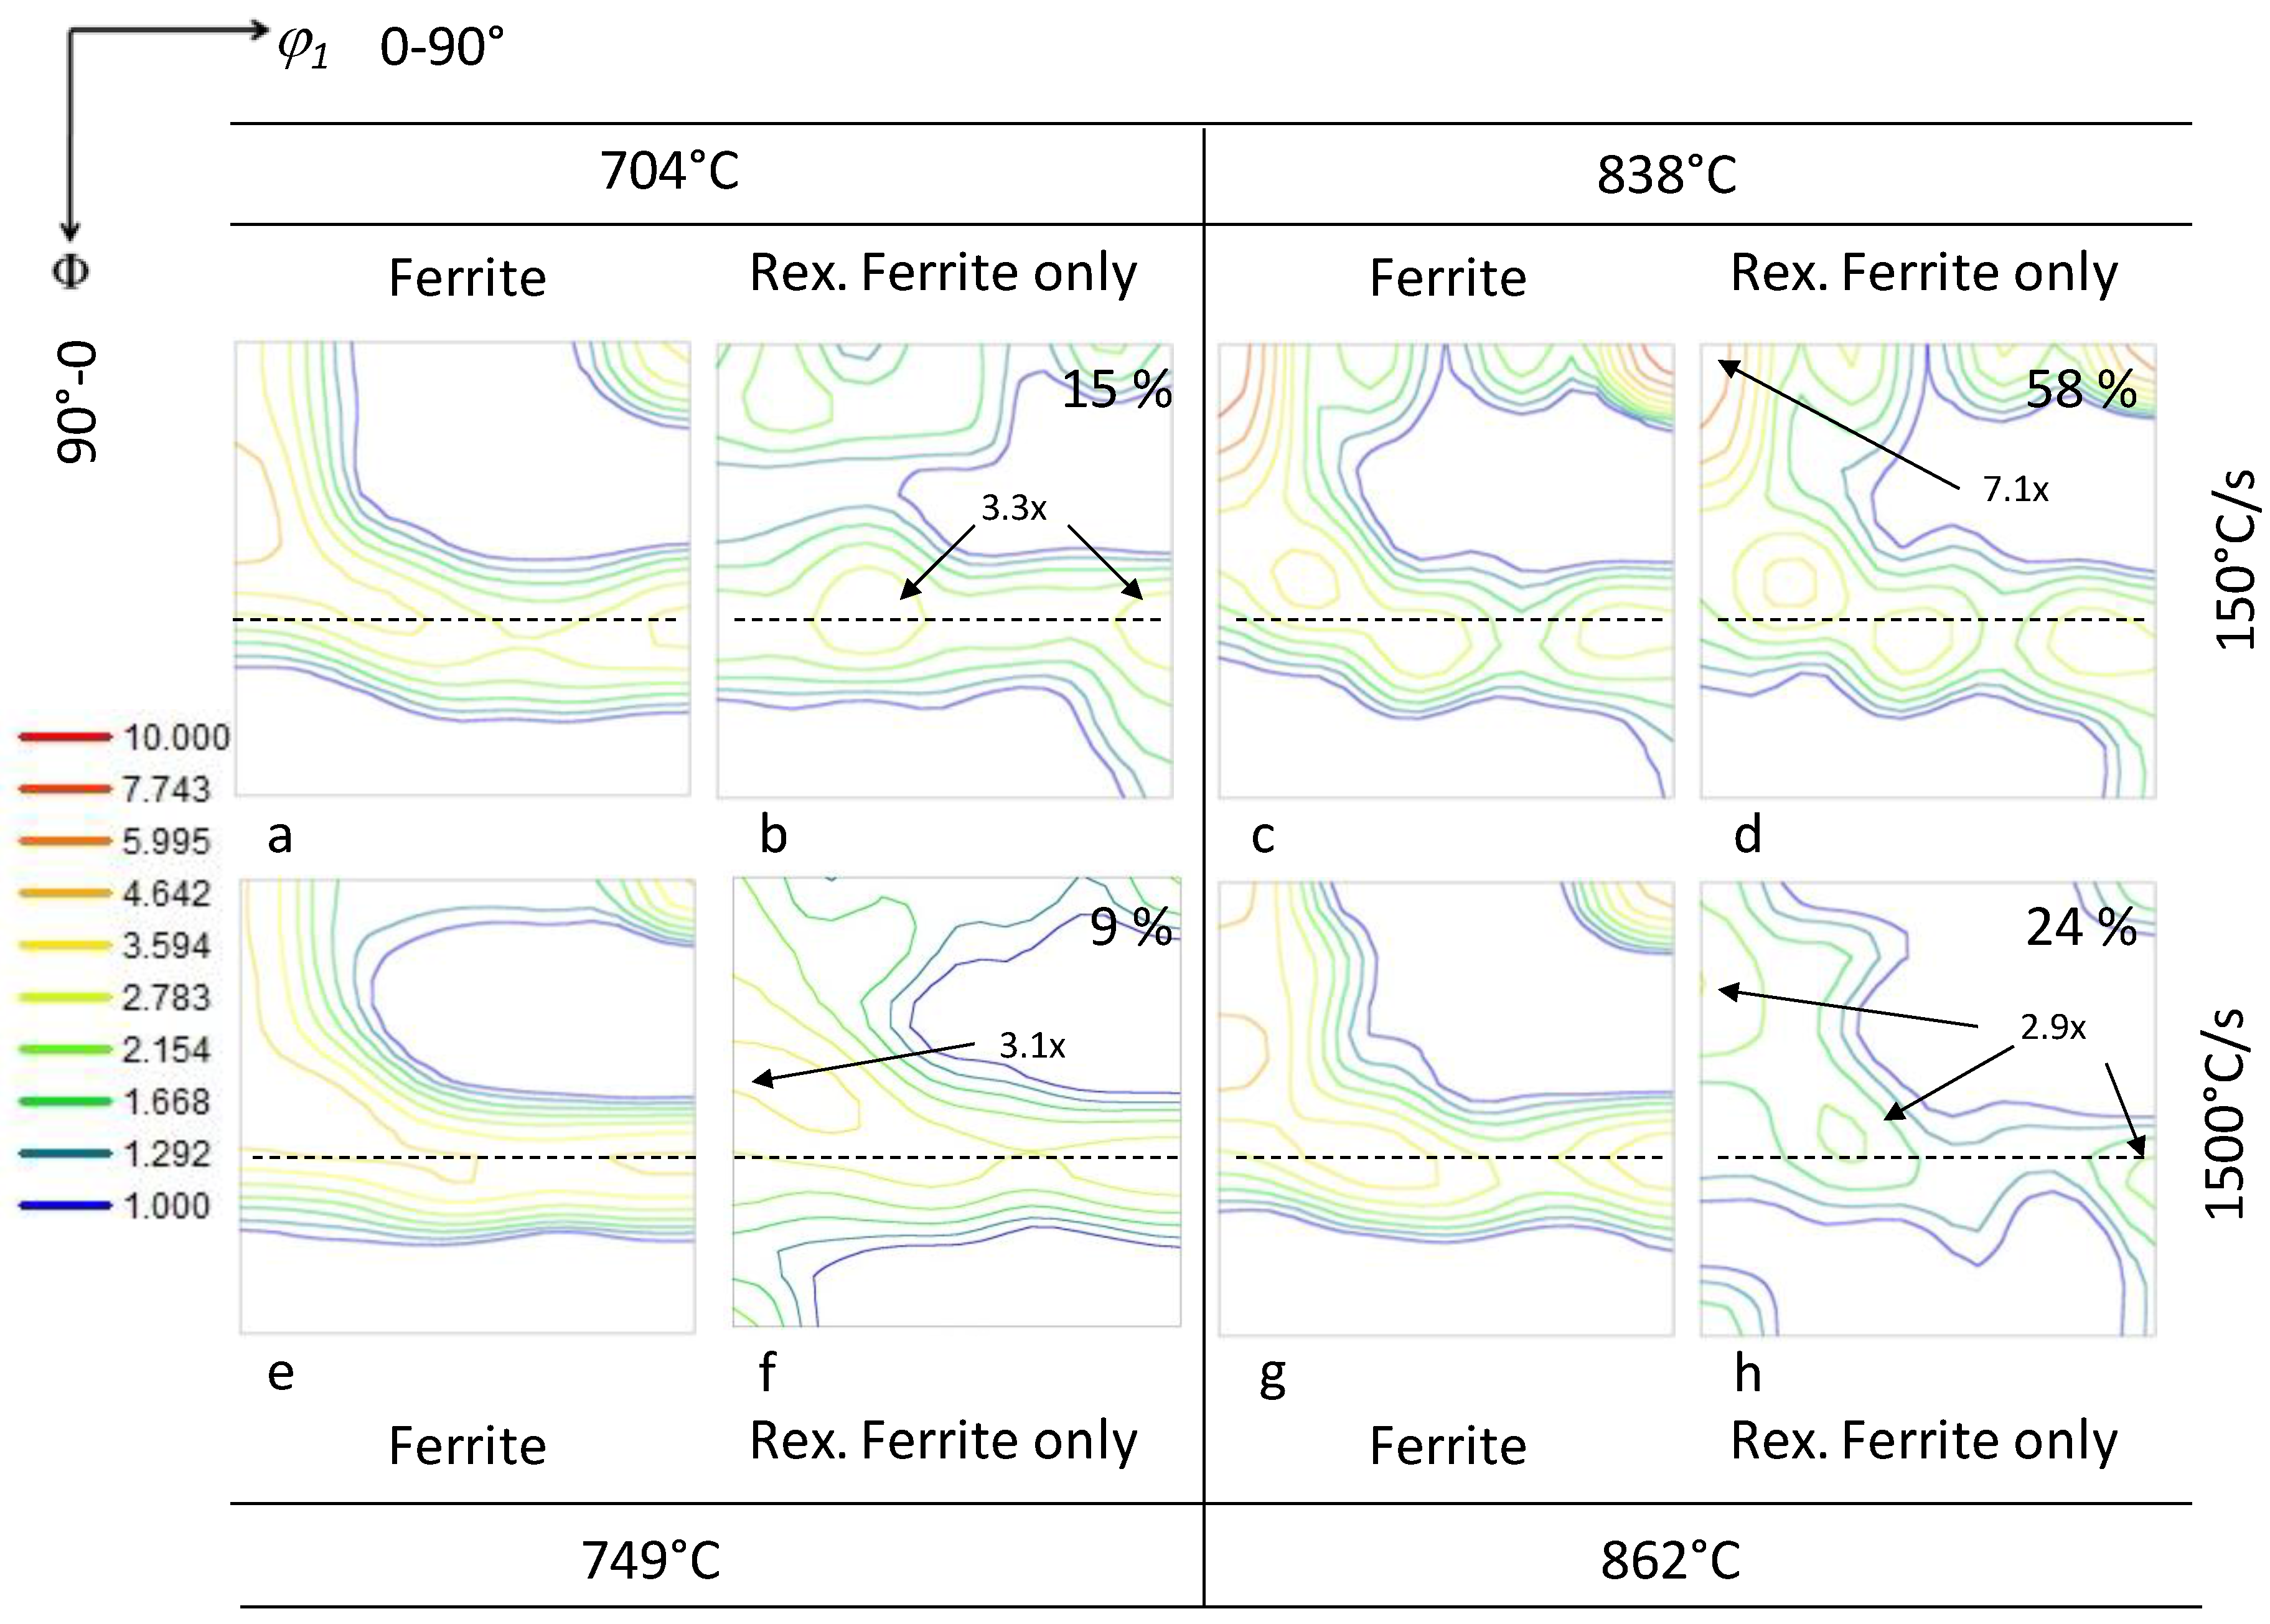
Figure 2a displays the fraction of recrystallized ferrite versus temperature, whereas Figure 2b shows the average (outlined) and the maximum (filled) calculated grain diameter of recrystallized ferrite versus temperature. Both plots were calculated from EBSD measurements as described in Section 2.3. The recrystallization of ferrite was not 100% complete in both sets of experiments, in concordance with SEM images, cf. Section 3.1. The recrystallization process estimated via the fraction of recrystallized ferrite is markedly displaced to higher temperatures when the heating rate is increased. The fraction of recrystallized ferrite in samples heated at 150 °C/s (cf. triangles in Figure 2a) is gradually approaching a maximum of around 60% at ~850 °C, which is related to the simultaneous formation of austenite, whereas at the same temperature the fraction of recrystallized ferrite in the samples heated at 1500 °C/s is ~20%.
The average grain diameter of recrystallized ferrite in samples heated at 150 °C/s (cf. outlined triangles in Figure 2b) displays a growing tendency up to ~741 °C and then it stabilizes around the value of ~3 µm. In samples heated at 1500 °C/s (cf. outlined circles in Figure 2b) the average grain diameter of recrystallized ferrite gradually approaches the value of ~1 µm. The marked difference between recrystallized grain sizes as a result of both heating rates is a consequence of the reduced time for grain growth as the heating rate is increased.

3.3. Textures

Figure 3a shows the key for the main BCC texture components in the ϕ2 = 45° section of Euler space and Figure 3b displays the orientation distribution function (ODF) of the 70% cold rolled initial material. Figure 3b shows typical rolling texture with ND {111}<uvw> and RD {hkl}<110> fibers with an intensity of ~4.5 multiples of random density (mrd) [24].
Figure 4 illustrates only the ferrite textures derived from the EBSD scans using GAIQ partitioning criteria, as described in Section 2.3. Figure 4a,c,e,g shows the ODFs of the full ferrite phase (including both recrystallized and non-recrystallized grains), whereas Figure 4b,d,f,h shows the ODFs of recrystallized ferrite grains only. The recrystallized ferritic grains were selected using the GAM criterion. The recrystallized ferrite grains in samples heated at 150 °C/s (cf. Figure 4b,d) show orientations close to {111}<uvw> ND fiber components. In samples heated at 150 °C/s to 704 °C, the recrystallized grains have an orientation in the vicinity of the {111}<112> texture components (Figure 4b), whereas the strongest intensity after heating to 838 °C at 150 °C/s is 7.1 mrd and belongs mainly to the {001}<110> components.
The ODF of ferrite in samples heated at 1500 °C/s to 749 °C (Figure 4e) is very similar to the ODF of the cold-rolled initial material (Figure 3b). Figure 4f shows the ODF of ferrite at a very early stage of recrystallization in a sample heated at 1500 °C/s. The maximum intensities of 3.1 mrd are close to {112}<110> texture component. The ODF of samples heated at 1500 °C/s to 862 °C (cf. Figure 4g) shows that the ferrite texture intensities are similar to the cold-rolled texture in the main components of ND {111}<uvw> and RD {hkl}<110> fibers. Recrystallized grains in the same sample show strong intensities on {112}<110> and {111}<112> components (cf. Figure 4h).
The appearance of the Goss {110}<001> texture component with intensity of ~1.7 mrd is observed after heat treatments at both heating rates (cf. Figure 4b,d,h). The Goss component is associated with oriented nucleation at shear bands in deformed ferrite [19]. The rotated Goss {110}<110> component appears in the recrystallized ferrite after UFH at 1500 °C/s (cf. Figure 4f,h). These components are claimed to originate along shear bands in deformed ferrite [19,25,26]. The {331}<136> components shown in recrystallized ferrite (cf. Figure 4b,d,f,h) have been proposed [27] to originate from specific deformation features, like intra-grain deformation bands in deformed ferrite of RD {hkl}<110> fiber.

4. Discussion

Recrystallization of Ferrite

Recrystallization begins in cold-rolled ferrite. No recrystallized grains were observed within lamellar pearlitic aggregates. One explanation for this is related to the energy stored in the different phases and constituents of the initial microstructure after cold-rolling. Homogeneous macroscopic deformation (as introduced in cold-rolling) distributes heterogeneously among the phases with very different properties on a microscopic level. The lower strength and higher ductility of proeutectoid ferrite, compared to pearlite, suggests that proeutectoid ferrite will accumulate more strain than the pearlitic structure during cold rolling. Pearlitic ferrite will bear the strain accommodation in pearlite, whereas cementite remains practically non-deformed (rotated and/or fractured) [28]. Experimental evidence of the strain accommodation in the different microconstituents was obtained from a representative deformed area shown in Figure 5. Figure 5a shows a SEM image corresponding to the same area of the EBSD scan (IQ map) in Figure 5b. In the upper right corner of Figure 5a, a pearlite colony (P) can be readily identified. Elongated ferrite grains (DF) are situated just below or above the pearlitic colony. The distribution of elongated ferrite below and above deformed pearlitic colonies shown in Figure 5a is commonly observed through the cold-rolled microstructure. Both constituents are highlighted in Figure 5b, pearlite in yellow and ferrite in green. Figure 5c illustrates the Kernel Average Misorientation (KAM) distribution of ferrite and pearlite, respectively. It can observed that the ferrite KAM distribution has slightly shifted to higher KAM values. The displacement of the curve is a clear indication that the BCC lattice of the proeutectoid ferrite is more distorted than the BCC lattice of the pearlitic ferrite.
Another possible explanation for the absence of recrystallization inside pearlite is due to the interlamellar spacing. A critical nucleus larger than the width of the pearlitic ferrite will not be able to form, in spite of the fact that highly strained regions of pearlitic ferrite may form between cementite plates. Local increases in carbon content of pearlitic ferrite [29] might also hinder recrystallization due to the dislocation-pinning effect of carbon.
The growth of the recrystallized ferrite nuclei is thermodynamically more favorable in the heavily deformed zones, due to the larger amount of defects and hence higher driving force. The metallographic observations of the recrystallized ferrite in cold-rolled ferrite described in Section 3.1 are consistent with the previous statement. Figure 6 illustrates the recovery and recrystallization of deformed ferrite (arrows) in a region adjacent to a pearlitic colony in material heated at 150 °C/s to 704 °C. The GAM map (Figure 6b) shows higher average misorientation values for pearlite (cf. P in Figure 6), compared to the ferrite just above (cf. arrows in Figure 6b) in the recovered and partially recrystallized structures. The EBSD data indicate that at this stage of recrystallization the proeutectoid ferrite is already recrystallized and hence its lattice is less distorted than the one of the pearlitic ferrite. The KAM map in Figure 6c shows large misorientation angles between points in ferrite above the pearlitic colony, which is also consistent with a highly deformed structure.
Figure 6 also shows the presence of small equiaxed grains separated by high angle grain boundaries (black lines, >15°) in the ferritic matrix above the pearlitic colony. These grains are recrystallized ones. The ferrite recrystallization at 704 °C is an ongoing process, as illustrated by the arrows in Figure 6b,c which point to the recrystallization nuclei. Recrystallized grains (cf. blue and dark green grains in Figure 6b) are outlined by high angle grain boundaries and are advancing into adjacent deformed grains (red grain in Figure 6b). The recrystallized grains have very low KAM (blue), as shown in Figure 6c. In contrast, the red grain shows areas of high KAM. The recrystallization of ferrite is not advancing into the pearlitic colony below, which also has a certain amount of distortion. Recrystallized ferritic grains (R) located next to pearlitic colonies are also shown in Figure 1a,d and Figure 6a.
Recrystallization in pearlitic ferrite was only observed in former colonies where cementite is spheroidized (cf. Figure 7b,c). The recovery and the recrystallization are thus developing together with spheroidization of the pearlitic cementite. Observations in the cold-deformed structure (Figure 7a) have shown that the fragmentation of cementite already occurs during cold rolling of the steel sheet. During heating, some cementite plates tend to decompose into aligned spheres (cf. SC in Figure 7b,c). Due to the short times involved in UFH experiments, it was possible to readily observe the difference between fragmented and spheroidized cementite. Fragmented cementite tends to cluster into bands and does not have a well-defined alignment, whereas spheroidized cementite grains have smaller sizes and are aligned resembling the previous cementite plate. It is clear that fragmented cementite will also undergo spheroidization during heating. Arrows show examples of both morphologies in Figure 1a,d and Figure 7b,c. A comparison of the mentioned figures suggests a somewhat lesser degree of spheroidization of cementite in samples heated at 1500 °C/s, compared to samples heated at 150 °C/s. However, the recrystallization has not begun in the pearlitic colonies that have kept the lamellar arrangement. The cementite plates might act as a barrier to the movement of the ferritic grain boundary. Therefore, new or existing grains cannot grow into the colony.
The advancing of the α/α interface is also hindered by spheroidized cementite particles, as long as the distance between them is small enough to interact effectively with the interface movement [30,31]. Similar pinning effect can be produced by austenite grains (cf. M in Figure 7b,c). Evidence of this is clearly shown in Figure 1a,d and Figure 7b,c. Small particles of cementite are blocking the advance of the recrystallized ferrite into pearlite, thus hindering the process at one side of the recrystallized grains. Otherwise, the recrystallization would progress into both deformed ferrite and pearlite as expected in the absence of growth barriers, such as low-angle grain boundaries with reduced mobility [31]. Instead, it has grown along ferrite bands and has stopped at cementite and pearlite areas. Note in Figure 6 that the boundary between recrystallized ferrite and pearlite has a misorientation angle between 15° and 63°, which predicts a higher mobility than in the case of low-angle grain boundaries [31]. The high-angle grain boundary between recrystallized ferrite and pearlite supports the effect of cementite particles as a barrier for the interface movement.
A mixture of recrystallized and non-recrystallized ferritic grains are observed at all temperatures above ~700 °C in samples treated at both heating rates until the formation of 100% austenite. Figure 8 shows the distributions of grain diameters in the recrystallized ferrite for different temperatures at both heating rates. At the beginning of recrystallization, the fraction of grains of diameter less than 1 µm is 53% in samples heated at 150 °C/s, and 99% in samples heated at 1500 °C/s. At later stages, the fraction of grains of diameter less than 1 µm is 14% in samples heated at 150 °C/s, and 66% in samples heated at 1500 °C/s. It can thus be concluded that the nucleation is a continuous process during heating at both heating rates.
The ferritic grain size grows until it reaches a maximum value, around the same order of magnitude of the deformed maximum pearlite band spacing (~3.4 μm). Evidence of this was obtained from measurements of average recrystallized ferrite grain sizes (Figure 2b), which supports the previous statement. However, the validity of this description is restricted to the early stages of austenite transformation. At some point during heating, the fraction of austenite becomes larger than the initial fraction of pearlite, and the austenite further grows into ferrite, which is a reasonable explanation for the decreasing of the maximum ferritic grain size measured at 838 °C in samples heated at 150 °C/s (Figure 2b). In samples heated at 1500 °C/s, the average ferritic grain size is lower than 1 μm in the temperature range below 862 °C. At the same temperature, the fraction of recrystallized grains is not larger than 24%. Such low fraction indicates that the recrystallization at 1500 °C/s is still in an early stage.
Although the complete recrystallization of ferrite under UFH experiments in the current material was not possible due to the unavoidable formation of austenite, it is clear that very fast heating rates affect both the starting and the finishing of recrystallization processes. The pearlite is interacting with the deformed ferritic structure during recrystallization and thereby hindering the movement of the α/α interface. The nucleation and growth of austenite can take place either towards deformed or recrystallized ferrite. Thus, the austenite growth will have an impact on the experimentally observed fractions and size of recrystallized ferrite, as shown indirectly in Figure 2.

Textures in Recrystallized Ferrite

Texture measurements have shown that the first recrystallized grains of ferrite in samples treated at 150 °C/s to 704 °C are mainly oriented around the {111}<112> components (cf. Figure 4b). It is well known that such orientations are the most frequently occurring recrystallization components in cold-rolled low carbon steel [25,32]. Grains oriented close to {001}<110> are also present, which might be due to nucleation at low stored energy grains [33] at the beginning of recrystallization. Grains with Goss {110}<001> texture component have nucleated and grown in samples heated at 150 °C/s (cf. Figure 4b).
Figure 9 and Figure 10 display EBSD maps of the samples heated at 150 °C/s and 1500 °C/s, respectively, to different temperatures. RD-Inverse Pole Figure (IPF) maps are plotted on top of IQ maps in Figure 9a,c and Figure 10a,c. In these maps only the grains oriented close to the Goss {110}[001] (Figure 9a,c and Figure 10c) and rotated Goss {110}[110] (Figure 10a) components with a tolerance of 10° from the ideal orientations are highlighted on the IQ maps. Figure 9b,d and Figure 10b,d show the corresponding ND-IPF maps for each IQ map on the left-hand side. With the aim of the color coded RD-IPF maps, grains oriented close to the Goss texture component can be identified in the microstructure as the reddish grains in Figure 9a,c and Figure 10c and greenish in Figure 9b,d and Figure 10d. Grains oriented close to the rotated Goss component can be identified in the microstructure as greenish grains in Figure 10a,c and light blue in Figure 10b,d. Arrows indicate grains with Goss orientation and dashed circles the grains with Rotated Goss orientation in Figure 9 and Figure 10.
Figure 9a,b shows the recrystallized ferritic grains oriented close to the Goss {110}<001> component in a sample heated at 150 °C/s to 704 °C. The grains are aligned with other recrystallized grains at an angle of ~45° with RD (arrows). One could thus infer that grains oriented close to the Goss {110}<001> in samples heated at 150 °C/s are likely to originate from shear bands. Recrystallized ferritic grains oriented close to the Goss {110}<001> component are not observed in samples heated at 1500 °C/s to 749 °C. However, Figure 10c,d display grains oriented close to the Goss {110}<001> with similar alignments as in Figure 9a,b. It can, therefore, be suggested that nucleation of ferrite at shear bands is delayed to higher temperatures in samples heated to 1500 °C/s, compared to samples heated at 150 °C/s.
The diffusion of carbon might be playing a role in the nucleation of grains oriented in the vicinity of the Goss {110}<001> component in samples heated at 150 °C/s (cf. Figure 4b) and at higher temperatures in samples heated at 1500 °C/s (cf. Figure 4h). It has been claimed [34] that carbon dissolved in the cold-rolled ferrite strengthens the Goss {110}<001> component in recrystallized ferrite. The longer annealing times involved in samples heated at 150 °C/s, compared to samples heated at 1500 °C/s, can produce significant diffusion of carbon in ferrite and thus enhance the early appearance of Goss orientation in samples heated at 150 °C/s. Consequently, grains with Goss orientation nucleate at higher temperatures in samples heated at 1500 °C/s, possibly influenced by the carbon diffusion into ferrite.
In the sample heated at 1500 °C/s to 749 °C (cf. Figure 4f), the highest intensity in the ODF is located in the vicinity of the {112}<110> component. However, considerable intensities are present at Φ in the range from 0° to 90° for ϕ1 = 0, and for the {111}<uvw> ND fiber components. It is suggested that the nucleation of the previously mentioned components is related to the stored energy in cold-rolled ferrite. Under ultrafast heating, the time for the recovery in the cold-rolled material is drastically reduced. The release of energy during the recovery is also reduced, and thus high stored energy components can nucleate. In cold-rolled ferrite, the amount of energy that a component can store increases as Φ increases from 0° to 90° for ϕ1 = 0 [34]. The maximum strain energy is accommodated by the rotated Goss {110}<110> component, which is present in the recrystallization textures of samples heated at 1500 °C/s (cf. Figure 4f). The recrystallized ferrite from the sample heated at 150 °C/s to 704 °C (cf. Figure 4b) does not exhibit high stored energy components (Φ 90° for ϕ1 = 0). It is believed to be a consequence of the larger time for recovery, compared to samples heated at 1500 °C/s. The texture changes at 1500 °C/s are consistent with data on ULC steel under ultrafast heating rates [23].
Figure 4h shows that grains oriented close to the rotated Goss component are still present in samples heated at 1500 °C/s to 704 °C and 862 °C. The circles in Figure 10a,c indicate that such grains nucleated at grain boundaries. In contrast, moderated intensities are also observed in the sample heated at 1500 °C/s to 862 °C (cf. Figure 4f) in components close to {001}<110> and {113}<110>. These components were very weak at 749 °C, which indicates that nucleation in some low stored energy {hkl}<001> RD fiber components is taking place at high temperatures. The appearance of similar low stored energy {hkl}<001> RD fiber components of recrystallized ferrite are observed in samples heated at 150 °C/s to 838 °C (cf. Figure 4d). These observations are consistent with the data in Figure 8, which show that nucleation accounts for a considerable fraction of the recrystallized ferrite in samples heated at 150 °C/s and 1500 °C/s.

5. Conclusions

Ultrafast heating experiments at 150 °C/s and 1500 °C/s to different peak temperatures have been conducted on a cold-rolled low carbon steel. The ferrite recrystallization and the texture evolution were studied via detailed microstructural characterization. The main conclusions of the present study can be summarized as follows:
  • The recrystallization was not 100% complete before the complete formation of austenite for both heating rates.
  • The shear band nucleation of ferrite took place at higher temperatures in samples heated at 1500 °C/s, compared to samples heated at 150 °C/s. The effect of heating rate in carbon diffusion can justify the observed nucleation of recrystallized ferritic grains and thus the appearance of recrystallized grains in the vicinity of the rotated Goss {110}<110> component.
  • The continuous nucleation of recrystallized ferrite is enhanced by applying ultrafast heating rates.
  • The texture of ferrite in early stages of recrystallization in samples heated at 1500 °C/s is taking place close to ND {111}<uvw> fiber components as well as in the vicinity of {110}<110> high stored energy components. When the time for the release of stored energy is comparatively longer (as in the case of samples heated at 150 °C/s), the orientations in recrystallized ferrite are mainly close to ND {111}<uvw> and RD {hkl}<011> fiber components.
  • Cementite plates and spheres might act as a barrier for the advance of the α/α interface during recrystallization.

Acknowledgments

The authors are thankful for the experimental facilities for Gleeble tests kindly provided by W. J. Kaluba from University of Littoral, France. F. Castro Cerda gratefully acknowledges the support of CONICYT in the form of the CONICYT-PCHA/Doctorado Nacional/2013 Ph.D. grant.

Author Contributions

R. H. Petrov. and A. Monsalve conceived and designed the experiments; F. M. Castro Cerda, R. H. Petrov, and W. J. Kaluba performed the experiments; F. M. Castro Cerda and L. A. I. Kestens post-processed and analyzed the data; F. M. Castro Cerda wrote the paper.

Conflicts of Interest

The authors declare no conflict of interest.

References

  1. Lolla, T.; Cola, G.; Narayanan, B.; Alexandrov, B.; Babu, S.S. Development of rapid heating and cooling (flash processing) process to produce advanced high strength steel microstructures. Mater. Sci. Technol. 2011, 27, 863–875. [Google Scholar] [CrossRef]
  2. Meng, Q.; Li, J.; Zheng, H. High-efficiency fast-heating annealing of a cold-rolled dual-phase steel. Mater. Des. 2014, 58, 194–197. [Google Scholar] [CrossRef]
  3. De Knijf, D.; Puype, A.; Föjer, C.; Petrov, R. The influence of ultra-fast annealing prior to quenching and partitioning on the microstructure and mechanical properties. Mater. Sci. Eng. A 2015, 627, 182–190. [Google Scholar] [CrossRef]
  4. Puype, A. Developing of Advanced High Strength Steel via Ultrafast Annealing. Master’s Thesis, Ghent University, Gent, Belgium, July 2013. [Google Scholar]
  5. Kestens, L.; Reis, A.C.C.; Kaluba, W.J.; Houbaert, Y. Grain Refinement and Texture Change in Interstitial Free Steels after Severe Rolling and Ultra-Short Annealing. Mater. Sci. Forum 2004, 467–470, 287–292. [Google Scholar] [CrossRef]
  6. Petrov, R.; Sidor, J.; Kaluba, W.J.; Kestens, L. Grain Refinement of a Cold Rolled TRIP Assisted Steel after Ultra Short Annealing. Mater. Sci. Forum 2012, 715–716, 661–666. [Google Scholar] [CrossRef]
  7. Petrov, R.H.; Puype, A.; De Knijf, D.; Kestens, L. Ultrafast Heating of Advanced High Strength Steels. In Proceedings of the International Conference on Solid-Solid Phase Transformations in Inorganic Materials 2015, Whistler, BC, Canada, 2015; pp. 1157–1158.
  8. Castro Cerda, F.M.; Goulas, C.; Sabirov, I.; Papaefthymiou, S.; Monsalve, A.; Petrov, R.H. Microstructure, texture and mechanical properties in a low carbon steel after ultrafast heating. Mater. Sci. Eng. A 2016, 672, 108–120. [Google Scholar] [CrossRef]
  9. Griffay, G.; Anderhuber, M.; Klinkenberg, P.; Tusset, V. New Continuous Annealing Technology with High-Speed Induction Heating Followed by Ultra-Fast Cooling; ECSC steel publications: Brussels, Belgium, 2002. [Google Scholar]
  10. Atkinson, M. Bifurcation of thermal restoration processes in deformed iron and steel. Mater. Sci. Eng. A 1999, 262, 33–38. [Google Scholar] [CrossRef]
  11. Ferry, M.; Muljono, D.; Dunne, D.P. Recrystallization Kinetics of Low and Ultra Low Carbon Steels during High-rate Annealing. ISIJ Int. 2001, 41, 1053–1060. [Google Scholar] [CrossRef]
  12. Muljono, D.; Ferry, M.; Dunne, D.P. Influence of heating rate on anisothermal recrystallization in low and ultra-low carbon steels. Mater. Sci. Eng. A 2001, 303, 90–99. [Google Scholar] [CrossRef]
  13. Atkinson, M. On the credibility of ultra rapid annealing. Mater. Sci. Eng. A 2003, 354, 40–47. [Google Scholar] [CrossRef]
  14. Stockemer, J.; Brande, P. Vanden Recrystallization of a cold-rolled low-carbon steel by cold-plasma-discharge rapid annealing. Metall. Mater. Trans. A 2003, 34, 1341–1348. [Google Scholar] [CrossRef]
  15. Senuma, T.; Kawasaki, K.; Takemoto, Y. Recrystallization Behavior and Texture Formation of Rapidly Annealed Cold-Rolled Extralow Carbon Steel Sheets. Mater. Trans. 2006, 47, 1769–1775. [Google Scholar] [CrossRef]
  16. Yoshinaga, N.; Kestens, L.; De Cooman, B.C. α → γ → α Transformation Texture Formation at Cold-Rolled Ultra Low Carbon Steel Surfaces. Mater. Sci. Forum 2005, 495–497, 1267–1272. [Google Scholar] [CrossRef]
  17. Petrov, R.; Kestens, L.; Houbaert, Y. Recrystallization of a Cold Rolled Trip-assisted Steel during Reheating for Intercritical Annealling. ISIJ Int. 2001, 41, 883–890. [Google Scholar] [CrossRef]
  18. Petrov, R.; Kestens, L.; Kaluba, W.J.; Houbaert, Y. Recrystallization and austenite formation in a cold rolled TRIP steel during ultra fast heating. Steel Grips 2003, 1, 289–293. [Google Scholar]
  19. Ray, R.K.; Jonas, J.J.; Hook, R.E. Cold rolling and annealing textures in low carbon and extra low carbon steels. Int. Mater. Rev. 1994, 39, 129–172. [Google Scholar] [CrossRef]
  20. Ray, R.K.; Jonas, J.J. Transformation Textures in Steels. Int. Mater. Rev. 1990, 35, 1–36. [Google Scholar] [CrossRef]
  21. Petrov, R.H.; Kestens, L.A.I. Advanced High-Strength Steels: Electron Backscatter Diffraction (EBSD). In Encyclopedia of Iron, Steel, and Their Alloys; CRC Press: Boca Ratón, FL, USA, 2016; pp. 46–69. [Google Scholar]
  22. Pinard, P.T.; Schwedt, A.; Ramazani, A.; Prahl, U.; Richter, S. Characterization of Dual-Phase Steel Microstructure by Combined Submicrometer EBSD and EPMA Carbon Measurements. Microsc. Microanal. 2013, 19, 996–1006. [Google Scholar] [CrossRef] [PubMed]
  23. Cerda, F.M.C.; Vercruysse, F.; Minh, T.N.; Kestens, L.A.I.; Petrov, R.H. The Effect of Heating Rate on the Recrystallization Behavior in Cold Rolled Ultra Low Carbon Steel. Steel Res. Int. 2016. [Google Scholar] [CrossRef]
  24. Kang, J.Y.; Bacroix, B.; Réglé, H.; Oh, K.H.; Lee, H.C. Effect of deformation mode and grain orientation on misorientation development in a body-centered cubic steel. Acta Mater. 2007, 55, 4935–4946. [Google Scholar] [CrossRef]
  25. Hutchinson, W.B. Development and control of annealing textures in low-carbon steels. Int. Met. Rev. 1984, 29, 25–42. [Google Scholar] [CrossRef]
  26. Minh, T.N.; Sidor, J.J.; Petrov, R.H.; Kestens, L.A.I. Occurrence of shear bands in rotated Goss ({110}<110>) orientations of metals with bcc crystal structure. Scr. Mater. 2012, 67, 935–938. [Google Scholar] [CrossRef]
  27. Gobernado, P.; Petrov, R.H.; Kestens, L.A.I. Recrystallized {311}<136> orientation in ferrite steels. Scr. Mater. 2012, 66, 623–626. [Google Scholar] [CrossRef]
  28. Wang, X.; Zurob, H.S.; Xu, G.; Ye, Q.; Bouaziz, O.; Embury, D. Influence of Microstructural Length Scale on the Strength and Annealing Behavior of Pearlite, Bainite, and Martensite. Metall. Mater. Trans. A 2013, 44, 1454–1461. [Google Scholar] [CrossRef]
  29. Hono, K.; Ohnuma, M.; Murayama, M.; Nishida, S.; Yoshie, A.; Takahashi, T. Cementite decomposition in heavily drawn pearlite steel wire. Scr. Mater. 2001, 44, 977–983. [Google Scholar] [CrossRef]
  30. Humphreys, F.J.; Hatherly, M. Recrystallization and Related Annealing Phenomena; Elsevier: Oxford, UK, 2004. [Google Scholar]
  31. Smith, C.S. Grains, Phases, and Interfaces—An Interpretation of Microstructure. Trans. AIME 1948, 175, 15–51. [Google Scholar]
  32. Kang, J.Y.; Kim, D.I.; Lee, H.C. Texture development in low carbon sheet steels for automotive application. In Microstructure and Texture in Steels: And Other Materials; Springer: London, UK, 2009; pp. 85–101. [Google Scholar]
  33. Dillamore, I.L.; Morris, P.L.; Smith, C.J.E.; Hutchinson, W.B. Transition Bands and Recrystallization in Metals. Proc. R. Soc. Lond. Ser. A 1972, 329, 405–420. [Google Scholar] [CrossRef]
  34. Ushioda, K.; Hutchinson, W.B.; Ågren, J.; von Schlippenbach, U. Investigation of structure and texture development during annealing of low-carbon steel. Mater. Sci. Technol. 1986, 2, 807–815. [Google Scholar] [CrossRef]
Figure 1. SEM images of samples heated at 150 °C/s to: 738 °C (a); 782 °C (b) and 838 °C (c); and at 1500 °C/s to: 749 °C (d); 842 °C (e) and 862 °C (f). Arrows point to cementite (C), martensite (M), non-recrystallized ferrite (NR), recrystallized ferrite (R), spheroidized cementite (SC), intragranular ferrite (IF) and Widmanstätten ferrite (W). Scale bar for all images is 5 µm.
Metals 06 00288 g001
Figure 2. (a) Fraction of recrystallized ferrite and (b) average ferritic grain size (outlined) and maximum ferritic grain size (filled) versus annealing temperature. In both plots, triangles and circles represent samples annealed with 150 °C/s and 1500 °C/s respectively.
Metals 06 00288 g002
Figure 3. (a) Ideal positions of the most important BCC texture components in the ϕ2 = 45° section of Euler space and (b) plot of ODF of the cold rolled steel used in this work.
Metals 06 00288 g003
Figure 4. ODF of ferrite at ϕ2 = 45° from samples heated at 150 °C/s (ad) and 1500 °C/s (eh). (a,b) correspond to peak temperature of 704 °C; (c,d) to 838 °C; (e,f) to 749 °C and (g,h) to 862 °C. (a,c,e,g) correspond to recrystallized and non-recrystallized ferrite, whereas (b,d,f,h) correspond to recrystallized ferrite. Numbers in (b,d,f,h) indicate the recrystallized ferrite fraction. Dashed line indicates the ideal position of {111}<uvw> ND fiber. For color images please see the online version of the paper.
Metals 06 00288 g004
Figure 5. (a) SEM image; (b) IQ map and (c) KAM versus number fraction for 70% cold-rolled material. Letters in arrows are P for pearlite; and DF for deformed ferrite. Step size 50 nm.
Metals 06 00288 g005
Figure 6. (a) Gray scale IQ map; (b) GAM map; and (c) KAM map (1st neighbor 5° max) for the sample heated at 150 °C/s to 704 °C and quenched. Letters in arrows are P for pearlite; and R for recrystallized ferrite. Grain boundary misorientation between 5° and 15° are outlined in white, whereas grain boundary misorientation between 15° and 63° are black. Step size 80 nm.
Metals 06 00288 g006
Figure 7. (a) SEM image of 70% cold-rolled material; (b) SEM of the sample heated at 150 °C/s to 704 °C and quenched and (c) SEM sample heated at 1500 °C/s to 749 °C and quenched (etched with 4% Nital). Letters in arrows are FC for fragmented cementite, M for martensite SC for spheroidized cementite, and R for recrystallized ferrite. The scale bar in three micrographs is 3 µm.
Metals 06 00288 g007
Figure 8. Grain diameter versus area fraction of recrystallized ferritic grains from samples heated at 150 °C/s (a) and 1500 °C/s (b). Outlined and filled triangles show data of samples heated at 704 °C and 838 °C, whereas outlined and filled circles show data from samples heated at 749 °C and 862 °C, respectively. The data were obtained from EBSD measurements as described in Section 2.3.
Metals 06 00288 g008
Figure 9. Microstructure of samples heated at 150 °C/s to 704 °C (a,b); and to 838 °C (c,d). The microstructure consists of a mixture of ferrite and martensite. Arrows indicate grains oriented close to the Goss {110}<001> (with a tolerance of 10°). (c,d). (a,c) correspond to IQ maps in which the recrystallized grains of ferrite are highlighted by a [100] RD Inverse Pole Figure (IPF) map. (b,d) are [001] ND IPF maps.
Metals 06 00288 g009
Figure 10. Microstructure of samples heated at 1500 °C/s to 749 °C (a,b), and to 862 °C (c,d). The microstructure consists of a mixture of ferrite and martensite. Arrows indicate grains oriented close to the Goss {110}<001> (c,d), and circles the rotated Goss {110}<011> (a,b) components. (a,c) correspond to IQ maps in which the recrystallized grains of ferrite are highlighted by a [100] RD Inverse Pole Figure (IPF) map. (b,d) are [001] ND IPF maps.
Metals 06 00288 g010
Table 1. Chemical composition of the steel (in mass %).
CMnSiSPFe
0.142.051.200.0010.012Rest
Table 2. Summary of measured peak temperatures.
Heating Rate, °C/sPeak Temperature, °C
1507047417828381000
150074984286210001050

