Article

Characterization of Deformation Behavior of Individual Grains in Polycrystalline Cu-Al-Mn Superelastic Alloy Using White X-ray Microbeam Diffraction

1
Convergence Components & Agricultural Machinery Application Group, Korea Institute of Industrial Technology, Gimje 54325, Korea
2
Graduate School of Science and Engineering, Ibaraki University, Hitachi 316-8511, Japan
3
Institute of Multidisciplinary Research for Advanced Materials, Tohoku University, Sendai 980-8577, Japan
4
Department of Materials Science, Graduate School of Engineering, Tohoku University, Sendai 980-8579, Japan
5
Japan Synchrotron Radiation Research Institute, SPring-8, Hyogo 679-5198, Japan
*
Authors to whom correspondence should be addressed.
Metals 2015, 5(4), 1845-1856; https://doi.org/10.3390/met5041845
Submission received: 3 September 2015 / Revised: 19 September 2015 / Accepted: 29 September 2015 / Published: 9 October 2015
(This article belongs to the Special Issue Metals Challenged by Neutron and Synchrotron Radiation)

Abstract

:
White X-ray microbeam diffraction was applied to investigate the microscopic deformation behavior of individual grains in a Cu-Al-Mn superelastic alloy. Strain/stresses were measured in situ at different positions in several grains having different orientations during a tensile test. The results indicated inhomogeneous stress distribution, both at the granular and intragranular scale. Strain/stress evolution showed reversible phenomena during the superelastic behavior of the tensile sample, probably because of the reversible martensitic transformation. However, strain recovery of the sample was incomplete due to the residual martensite, which results in the formation of local compressive residual stresses at grain boundary regions.

Graphical Abstract

1. Introduction

Characterization of the microscopic deformation behavior in individual grains and their interactions are important for understanding the overall deformation behavior and mechanical properties of polycrystalline materials. In particular, microstructural characterization would be important for shape memory and superelastic alloys, as their unique functional properties originate from microstructural changes caused by reversible martensitic transformation. Deformation induced martensitic transformation upon loading, and subsequent reverse transformation upon unloading give rise to the phenomenon of superelasticity. For example, Cu-Al-Mn shape memory alloys that undergo a β1 (bcc) ↔ β1ʹ (monoclinic) martensitic transformation exhibit superelasticity. Their recoverable strain is significantly improved when microstructural parameters, such as crystallographic orientation, grain size, and constituent phases, are optimized [1,2]. For example, Sutou et al. reported that superelastic strain was enhanced with increasing grain size relative to specimen thickness, and >5% superelastic strain was obtained in coarse grain samples, even in the absence of texture [3].
In order to understand the relationship between the microstructure and macroscopic properties of superelastic alloys, experiments have recently focused on measuring deformation behavior at the microscopic level using modern experimental tools such as X-ray diffraction based on synchrotron radiation. Berveiller et al. used the synchrotron diffraction technique to investigate microscopic deformation behavior in individual grains of Cu-based superelastic alloys [4]. It was found that deformation of the alloy was accompanied by lattice rotation in grains and splitting of grains into sub-domains, which were attributed to formation of the martensite phase during tensile loading. Upon unloading, the initial lattice orientation was recovered and the sub-domains merged, indicating that the lattice rotation and sub-domain formation are reversible phenomena. In our previous investigation on an Fe-Mn-Si-Cr shape memory alloy [5], white X-ray microbeam diffraction was employed to examine microscopic stress evolution in individual austenite grains during shape memory behavior. A recently developed imaging technique and its combined use with an energy dispersive detector at the BL28B2 beamline of SPring-8 allowed us to measure strain/stress on the local area of interest. It was found that after tensile deformation of the alloy, large compressive stress developed due to the formation of martensite. When subsequent recovery annealing was performed, it almost disappeared due to reverse martensitic transformation. In addition, the magnitude of compressive stress depended on the grain orientation, as the martensitic transformation depended strongly on orientation. These experimental findings suggest that internal stress is an important factor that determines the shape memory effect. This is in good agreement with the study by Tomota et al., which demonstrated that internal stress plays an important role in promoting the reversible motion of Shockley partial dislocation, thereby improving the shape memory effect [6]. Microscopic stress analysis of superelastic alloys may also help us to expand our understanding of their macroscopic deformation behavior. Although there have been many microstructural analyses on Cu-based superelastic alloys, to the best of our knowledge, microscopic stress evolution of the alloys has not yet been reported.
In the present work, we performed the first in situ observation of microstructure and strain/stress evolution during tensile deformation of superelastic Cu-Al-Mn alloys using white X-ray microbeam diffraction. The strain/stress measurements were performed at different positions within a single grain and in several grains having different orientations to investigate the heterogeneous deformation behavior and orientation dependence of stress evolution.

2. Experimental Section
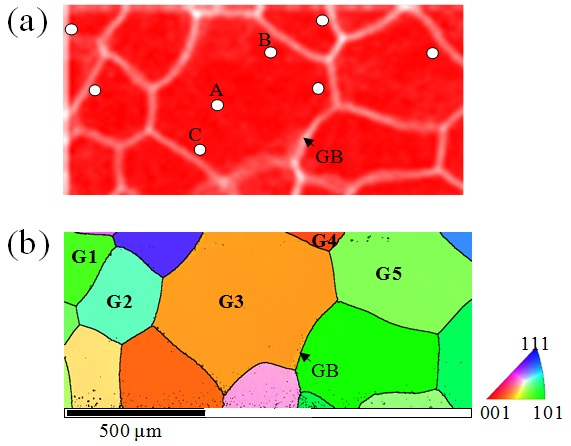
2.1. Materials

The materials used in this study were polycrystalline Cu-18% Al-11.5% Mn (atomic%) alloy sheets. A sample with a very large average grain size of about 400 μm was used, in which the size was obtained by controlling the solution-heat treatment temperature and time [3]. For the tensile test, a small tensile sample with a gauge size of 3 mm length and 1 mm width was prepared. To use the sample in white X-ray microbeam diffraction experiments, the thickness (t) was reduced to about 200 μm by electropolishing in a solution consisting of 20% H2SO4, 47% H3PO4, and 33% distilled water at room temperature. Such thickness is much lower than the average grain size (400 μm), thus preventing the overlap of diffraction patterns generated from multiple grains. Figure 1 shows the strain-stress curve obtained during the superelastic behavior of the sample. When the sample is subjected to tensile loading by 8% strain and subsequent unloading, it shows good superelastic strain (εSE) of 5.8% and residual strain (εR) of 0.4%. White X-ray microbeam diffraction experiments were performed during a tensile cycle, i.e., before loading → loading to 8% strain → unloading.
Figure 1. Stress-strain curve of a Cu-Al-Mn tensile sample.
Metals 05 01845 g001

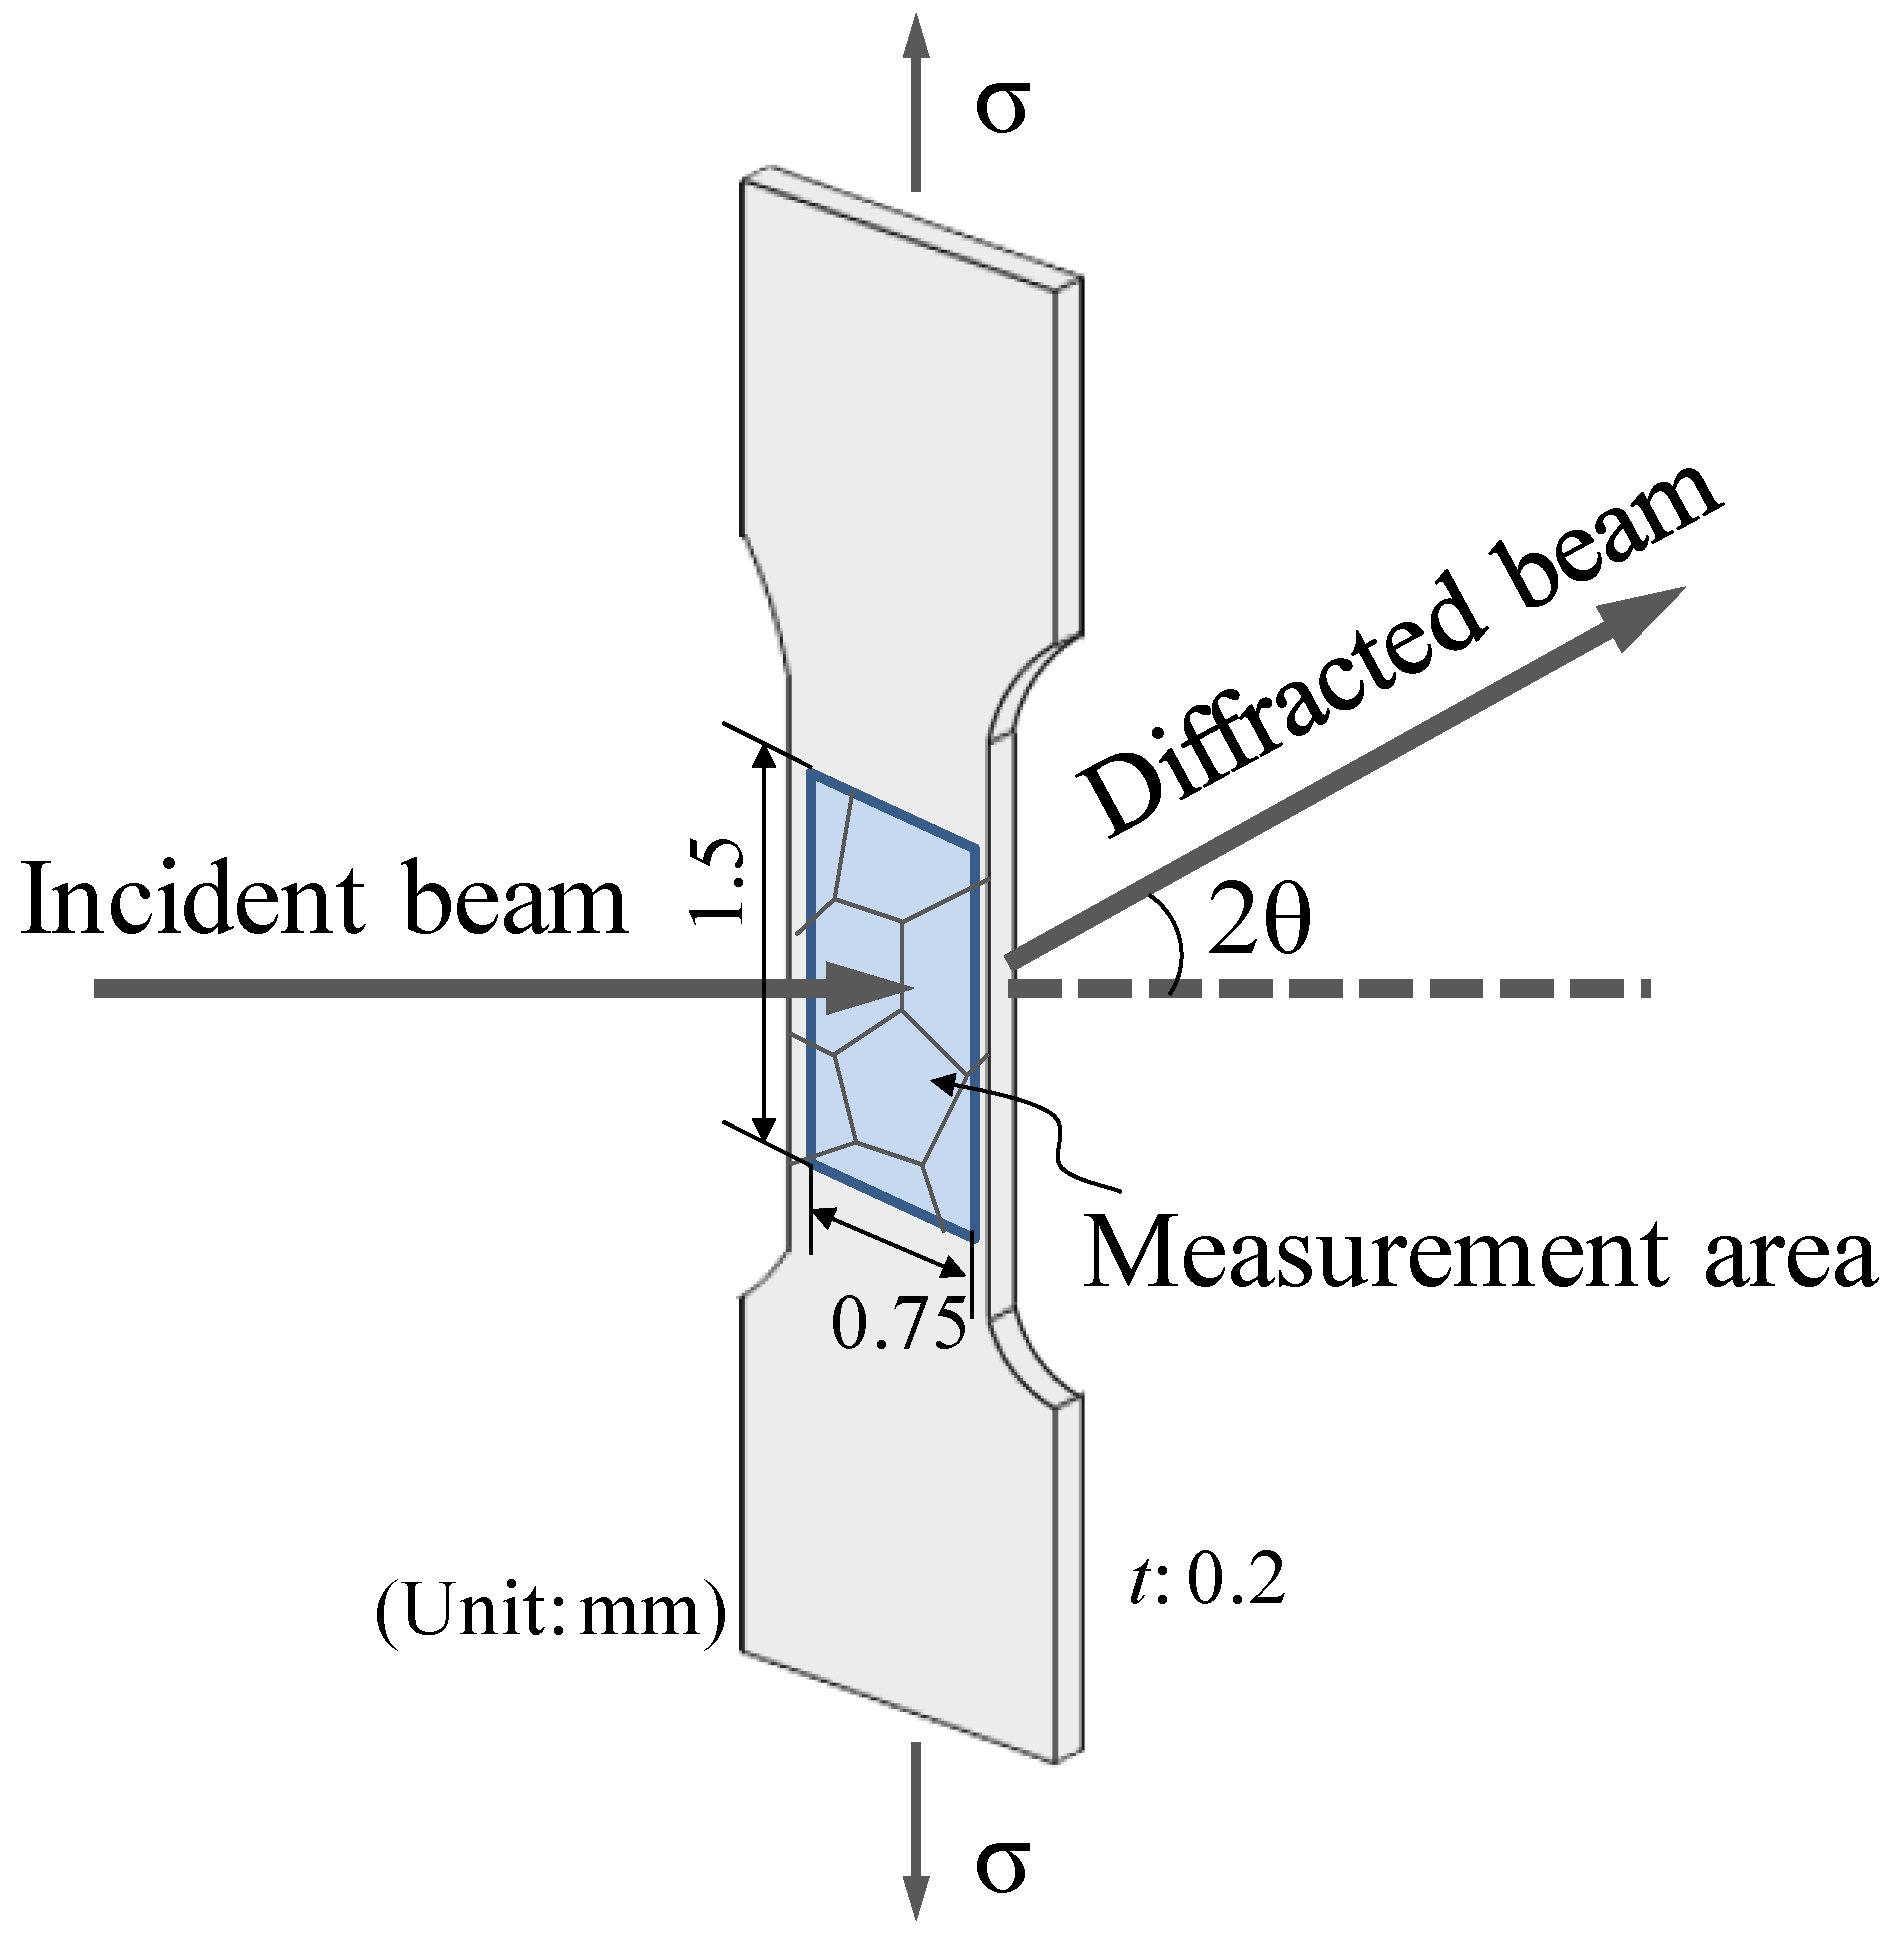
2.2. White X-ray Microbeam Diffraction Experiments

White X-ray diffraction experiments were conducted at SPring-8 on the beamline BL28B2 (Japan Synchrotron Radiation Research Institute: JASRI, Hyogo, Japan), where a high-energy white X-ray microbeam was available. Figure 2 shows a schematic diagram of the tensile sample used for X-ray microbeam diffraction experiments. The diffraction experiments were carried out on a measurement area of 1.5 mm × 0.75 mm in the sample gauge region. The beam size was controlled to 15 μm × 15 μm using the incident slit to illuminate a local area within the respective grains.
Figure 2. Schematic of tensile sample used for X-ray microbeam diffraction experiments.
Metals 05 01845 g002
Prior to the strain/stress measurements, the grain image of the sample was obtained by performing X-ray microbeam diffraction experiments in scanning mode. Details of the visualization method are given in [7]. Then, the measurement positions were chosen using the obtained grain image. Figure 3a shows the grain image of the undeformed gauge region of the tensile sample, which clearly depicts the presence of grain boundaries (GB) that appear as a bright contrast in the microstructure. Stress-induced martensite (SM) formed in the deformed microstructure also appears as a bright contrast, as will be discussed in the next section. It should be noted that the grain image highly resembles the orientation image (Figure 3b) obtained by electron backscattered diffraction (EBSD) in terms of the GB structure. The EBSD image shows the grain orientation in loading direction. The combined microstructural analysis and EBSD orientation image enabled us to measure strain/stress on the grains with known orientation. The strain/stress measurements were performed on several positions in some grains, as denoted by the white dots in Figure 3a.
To examine the stress evolution behavior in the grains with different orientations, the stresses were measured in five grains labeled as G1–G5 in the EBSD image of Figure 3b. These grains have specific crystallographic orientations, which are marked in the inverse pole figure of Figure 4a. They have different Schmid factor values for the martensitic transformation, as shown in Figure 4b. Note that the Schmid factor is much higher in the G3 and G4 grains than in the others. We therefore expect the martensitic transformation to be favored in the G3 and G4 grains. The transformation strain (%) induced by the martensitic transformation is shown in the stereo-triangle of Figure 4c [1]. The transformation strain is the largest in the (104) orientation, meaning that tensile deformation along the (104) direction would result in greater elongation than that obtained by deformation along the other directions. The G3 and G4 orient close to (104), and therefore would elongate largely by tensile deformation due to the favored martensitic transformation.
Figure 3. Images showing the microstructure of Cu-Al-Mn alloy. The measurement area shown in Figure 2 was imaged by (a) white X-ray microbeam diffraction and (b) electron backscattered diffraction (EBSD). White dots in (a) denote strain/stress measurement points. GB indicates grain boundary.
Metals 05 01845 g003
Figure 4. (a) EBSD inverse pole figure showing the orientation of the grains in the loading direction, which is indicated by G1, G2, G3, G4, and G5 in the EBSD image of Figure 3b; (b) Stereo-triangle showing the Schmid factor of the respective grains; (c) Stereo-triangle showing the transformation strain (%) of the respective grains.
Metals 05 01845 g004
Laue patterns diffracted from a tensile sample in the transmission (Laue) geometry were recorded in situ using a flat panel detector during the tensile test. Tensile strain applied on the sample was determined by the displacement of grips on a tensile stage. X-ray energy spectra for several Laue reflection regions were measured using a solid-state detector. The obtained energy spectra were used to calculate the lattice spacing of the (hkl) planes, dhkl [8]. Laue patterns of deformed superelastic alloys would be composed of many spots that are generated from both the parent phase and SM. In this study, however, measurable Laue spots of SM were hardly obtained due to low intensity, and therefore strain/stresses were measured only for the parent phase. Parent and martensitic phases have the following orientation relationship: [001]β1//[010]β1ʹ and [110]β1//[001]β1ʹ [9].
Lattice strain in the (hkl) planes, εhkl, was calculated from the change in dhkl with respect to the initial lattice spacing before deformation, d0. The stress was calculated assuming a two-dimensional stress state using Equation (1) [10].
ε h k l = A h k l σ x + B h k l τ x y + C h k l σ y
where σx and σy are the normal stresses in the tensile direction (x) and the transverse direction (y), respectively, and τxy is the shear stress. A, B, and C are constant values determined by the elastic compliance, crystal coordinate system (X), diffraction plane coordinate system (or laboratory coordinate system (L)), and specimen coordinate system (P). For the elastic compliance, the elastic constants (C11 = 142 GPa, C12 = 124 GPa, and C44 = 95 GPa) of a Cu-Al-Ni single crystal were considered [11].
From the σx, σy, and τxy obtained, the principal stresses (σ1 and σ2) and the principal stress direction (θp) can be calculated directly. The principal stress direction defines an angle at which the shear stress becomes zero. Principal stresses were calculated using Equation (2) below.
σ 1 , 2 = σ x + σ y 2 ± ( σ x σ y 2 ) 2 + τ x y 2

3. Results and Discussion

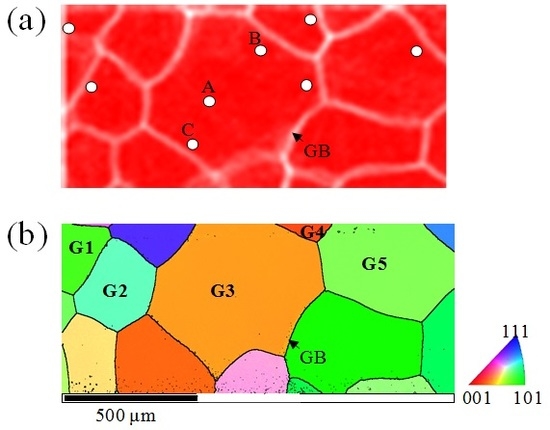
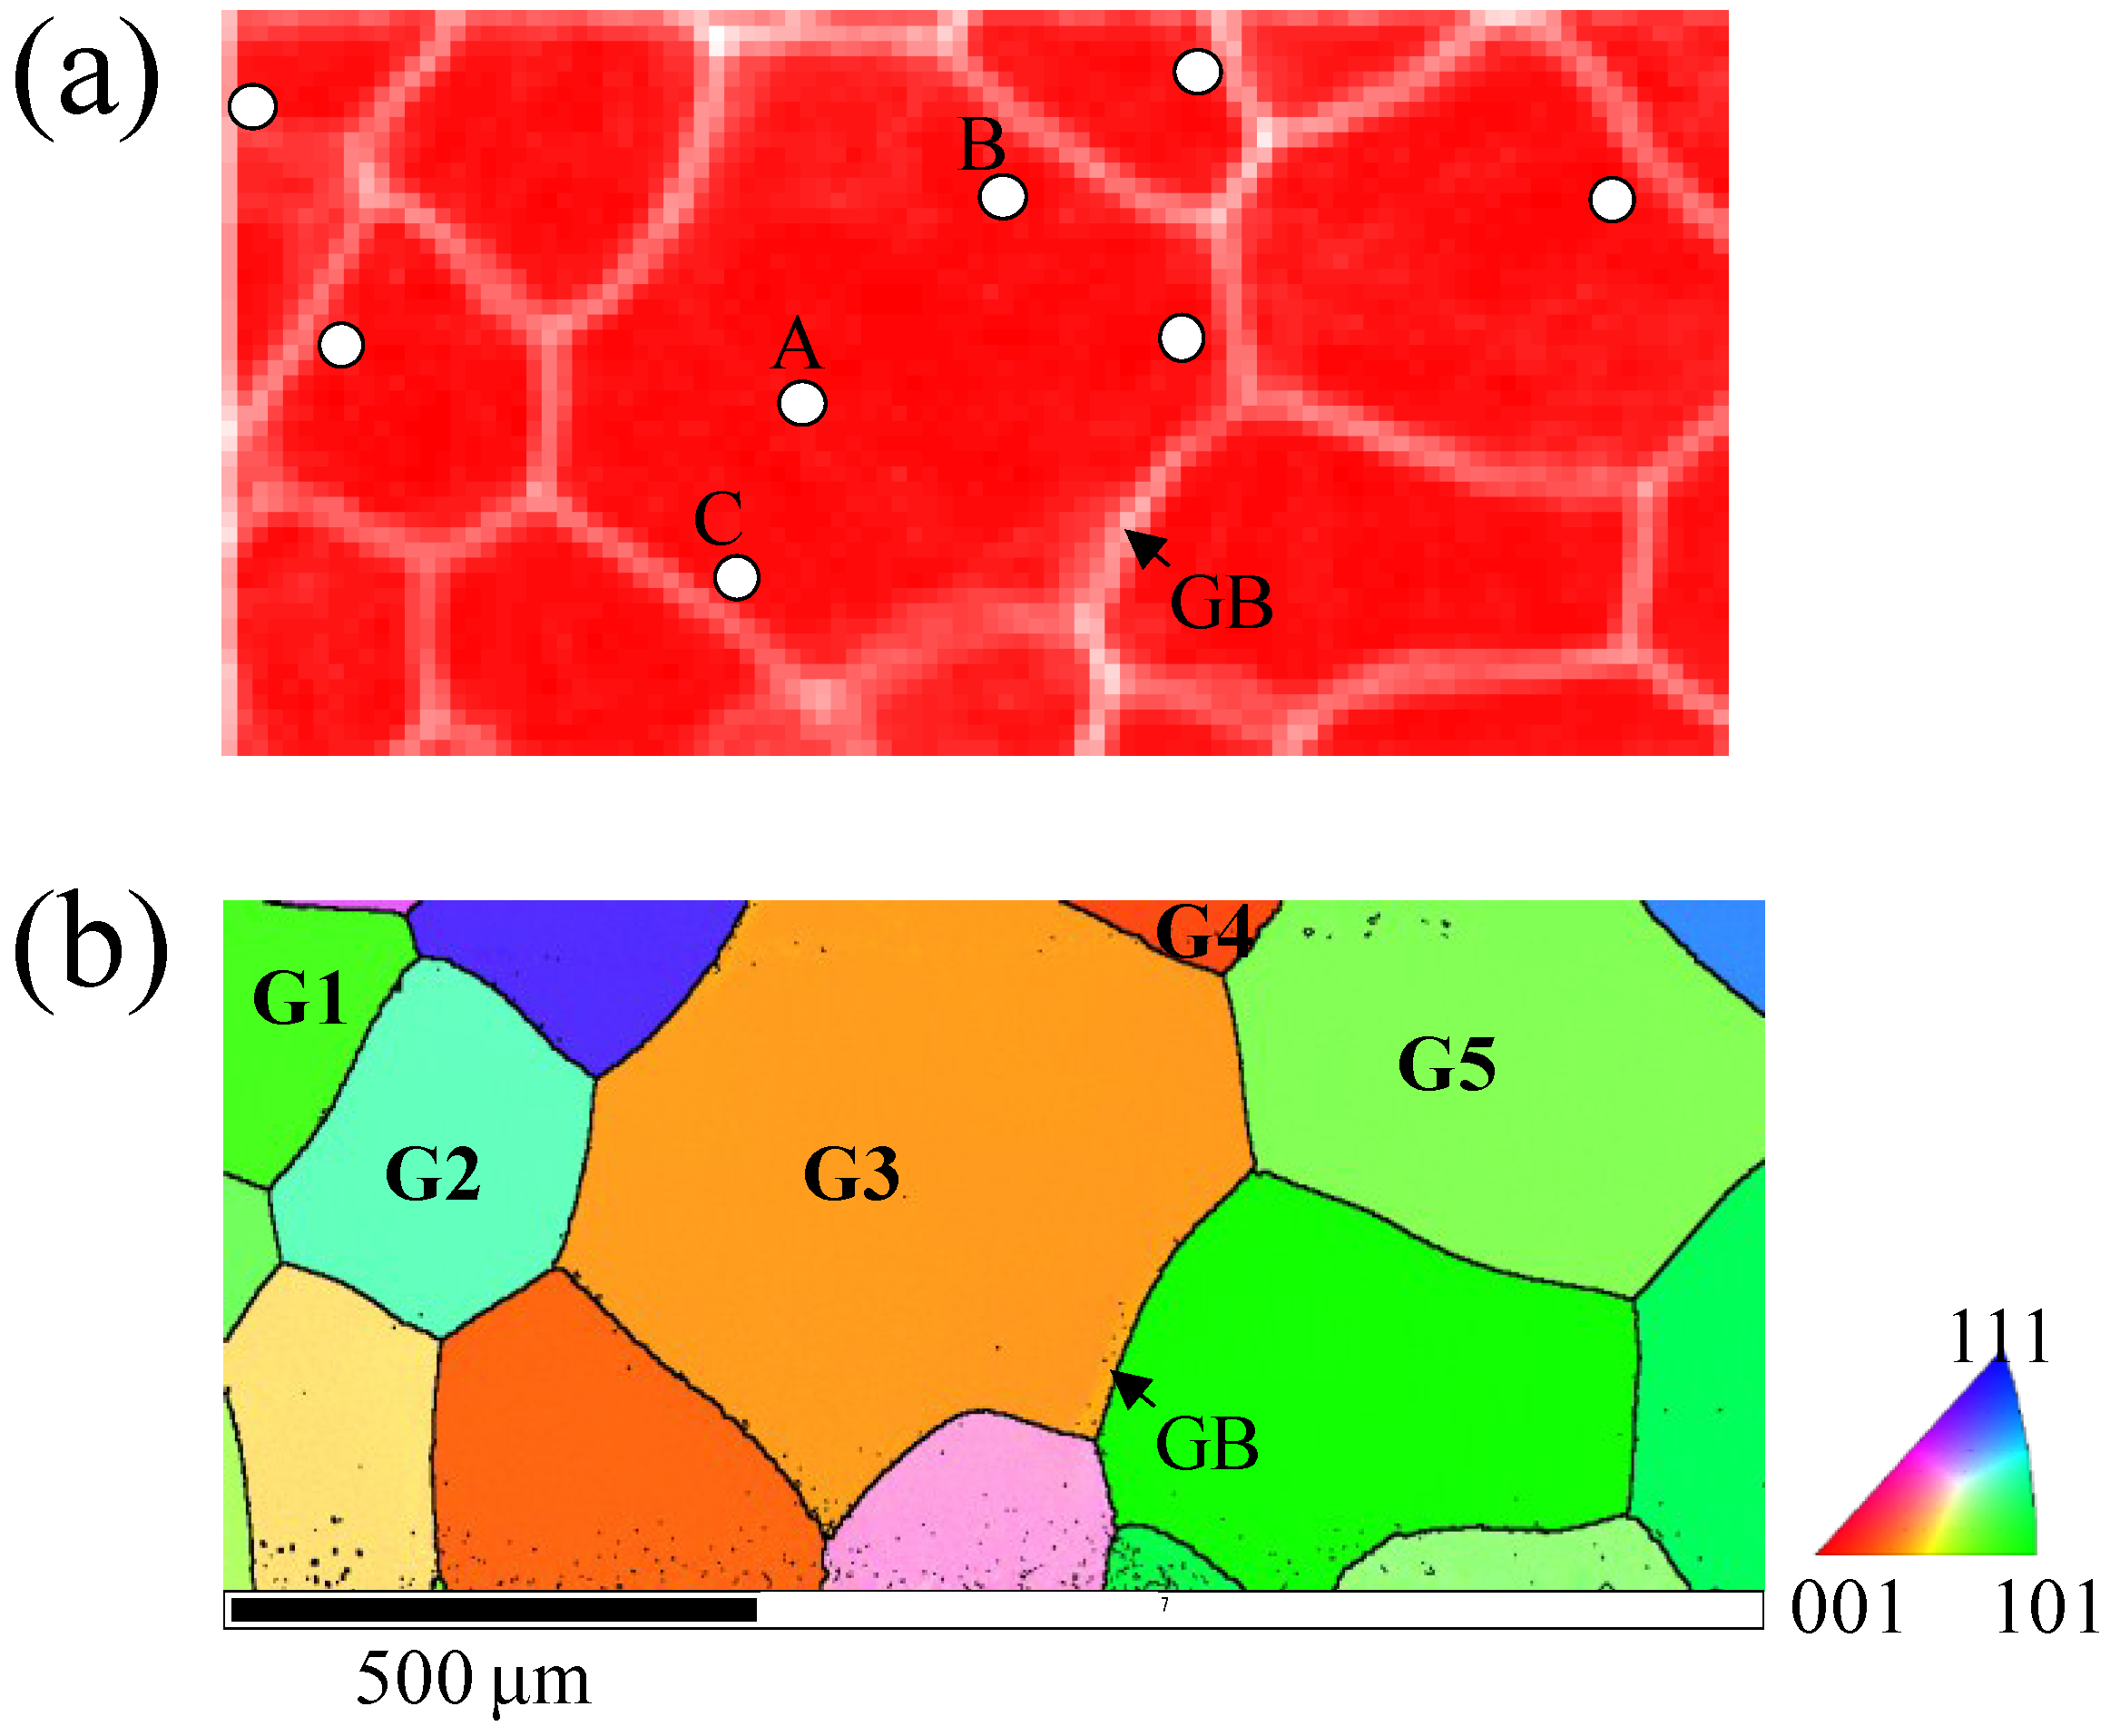
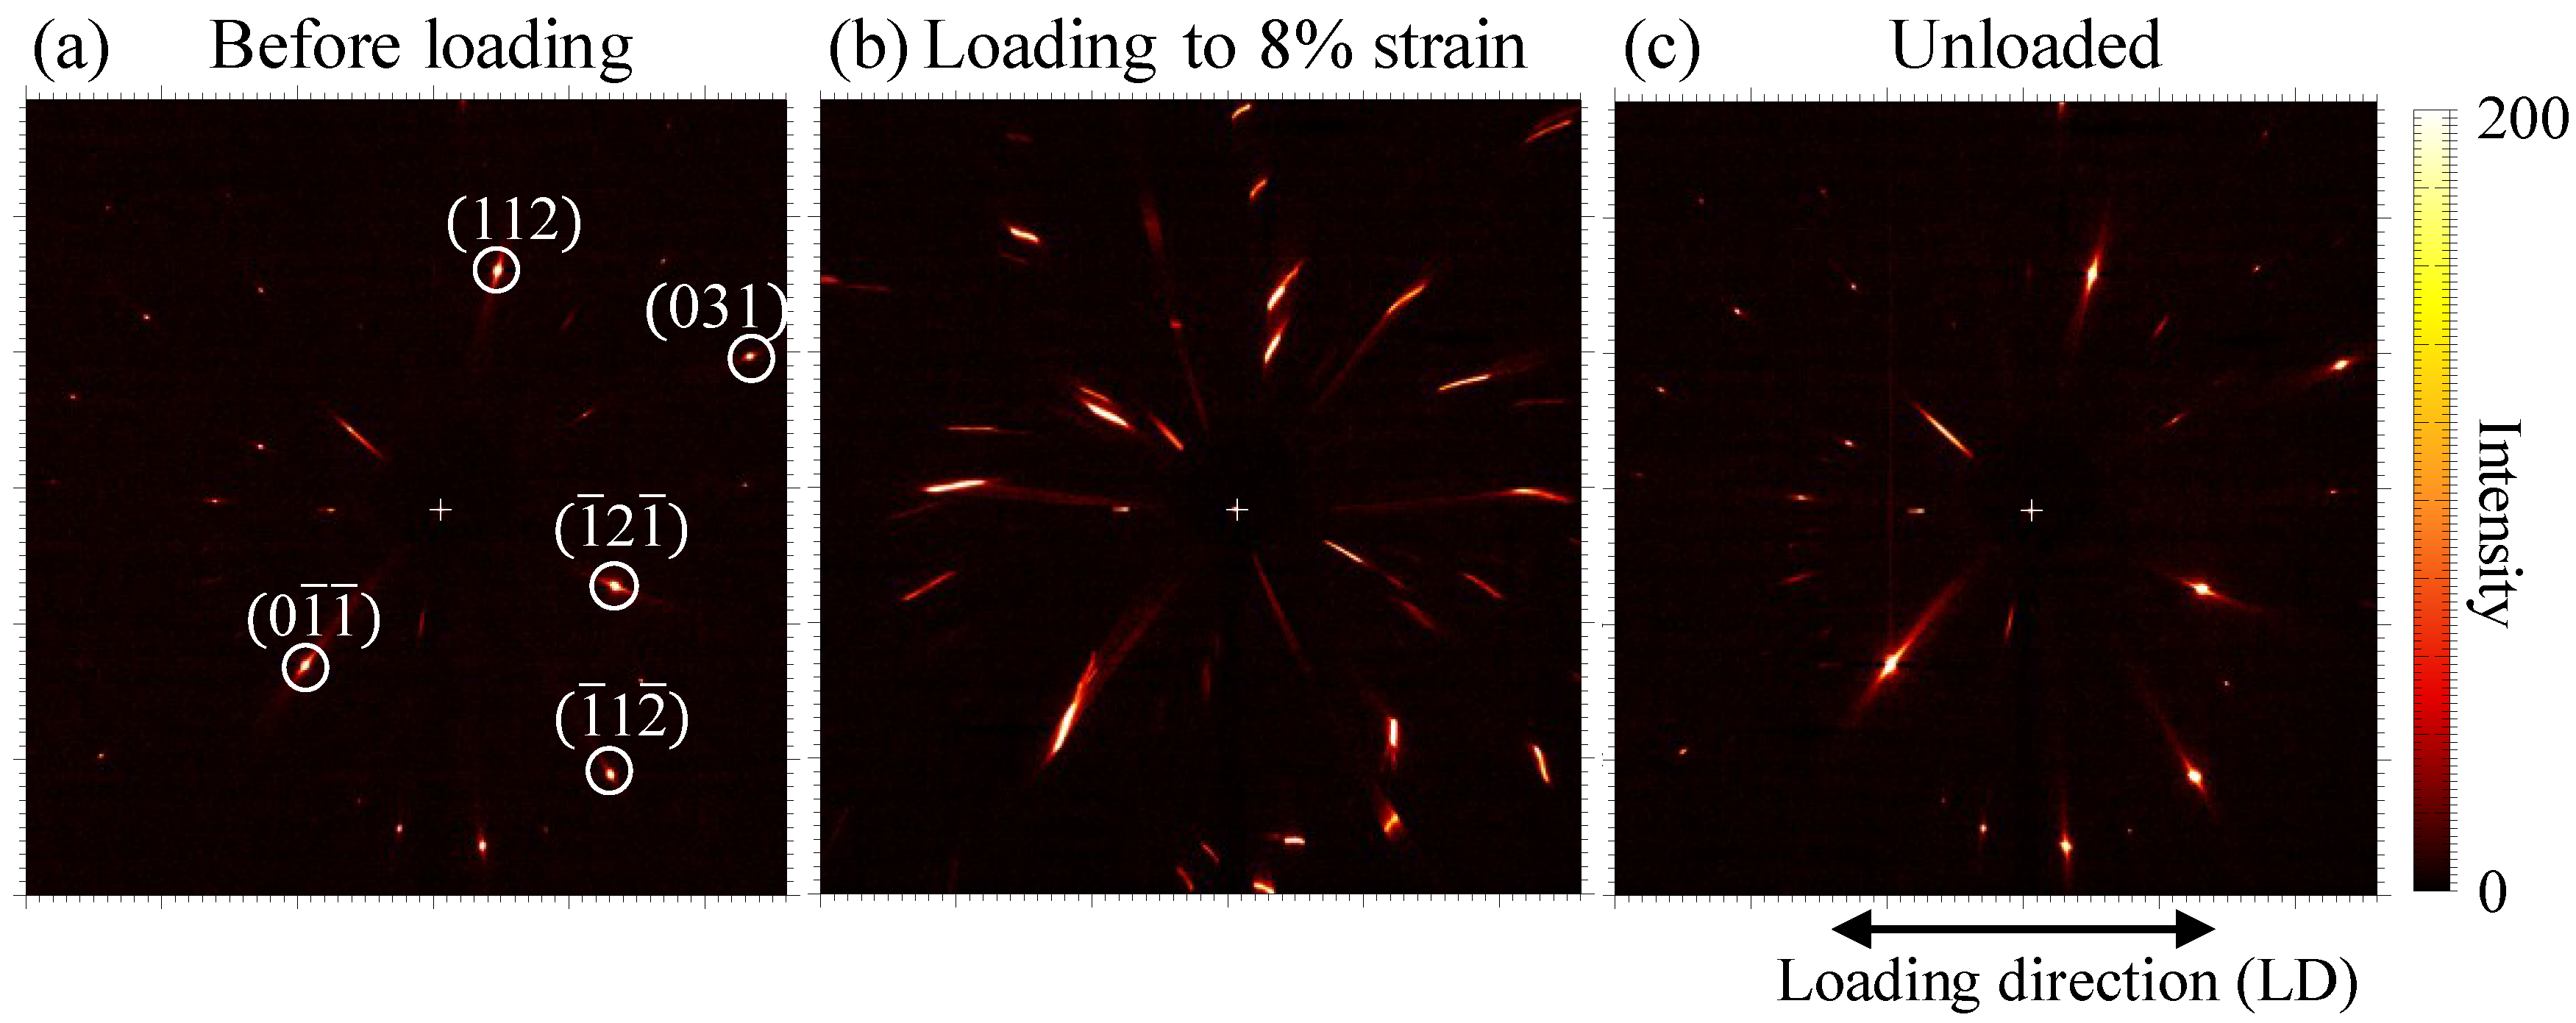
3.1. Variation of Laue Patterns during Superelastic Behavior

An analysis of the Laue patterns provides insight into the deformation characteristics, as the shape of the Laue spots is sensitive to the orientation deviation caused by deformation. In situ observation of Laue patterns was performed during the tensile loading cycle to obtain information on the evolution of strain/stress and orientation deviation caused by elastic or plastic deformation. Figure 5 shows the examples of serial Laue patterns obtained from the A point in the G3 grain. Laue spots under the tensile load show pronounced streaking and shifting in the radial direction of the Laue pattern. When the applied load is removed, the Laue spots almost recover the initial shape observed before loading, although the original shape is not fully restored. The streaked Laue pattern indicates that rotation of the crystallographic orientation has occurred in the parent phase, which is attributed to stress-induced martensitic transformation, resulting in the formation of sub-domains in the deformed grains [4]. The parent phase recovers its original orientation due to the reverse martensitic transformation after removal of the load. It is thought that the reverse martensitic transformation and the resulting orientation recovery are the origin of the characteristic reversible Laue pattern change. The reversible Laue pattern change is also observable during the shape memory behavior of shape memory alloys [5]. Apparently, the reversible behavior of the Laue pattern demonstrates the excellent superelasticity of the Cu-Al-Mn alloy, which is in accordance with the stress-strain curve shown in Figure 1. However, the strain recovery is incomplete; some residual strain (0.4%) remains after unloading. The residual strain may result from internal stresses and/or the presence of residual martensite [4].
Figure 5. Laue patterns obtained from a point marked by A in Figure 3a (a) before loading; (b) under a load (8% strain); and (c) after unloading. Laue spots were indexed based on their lattice spacing values.
Metals 05 01845 g005

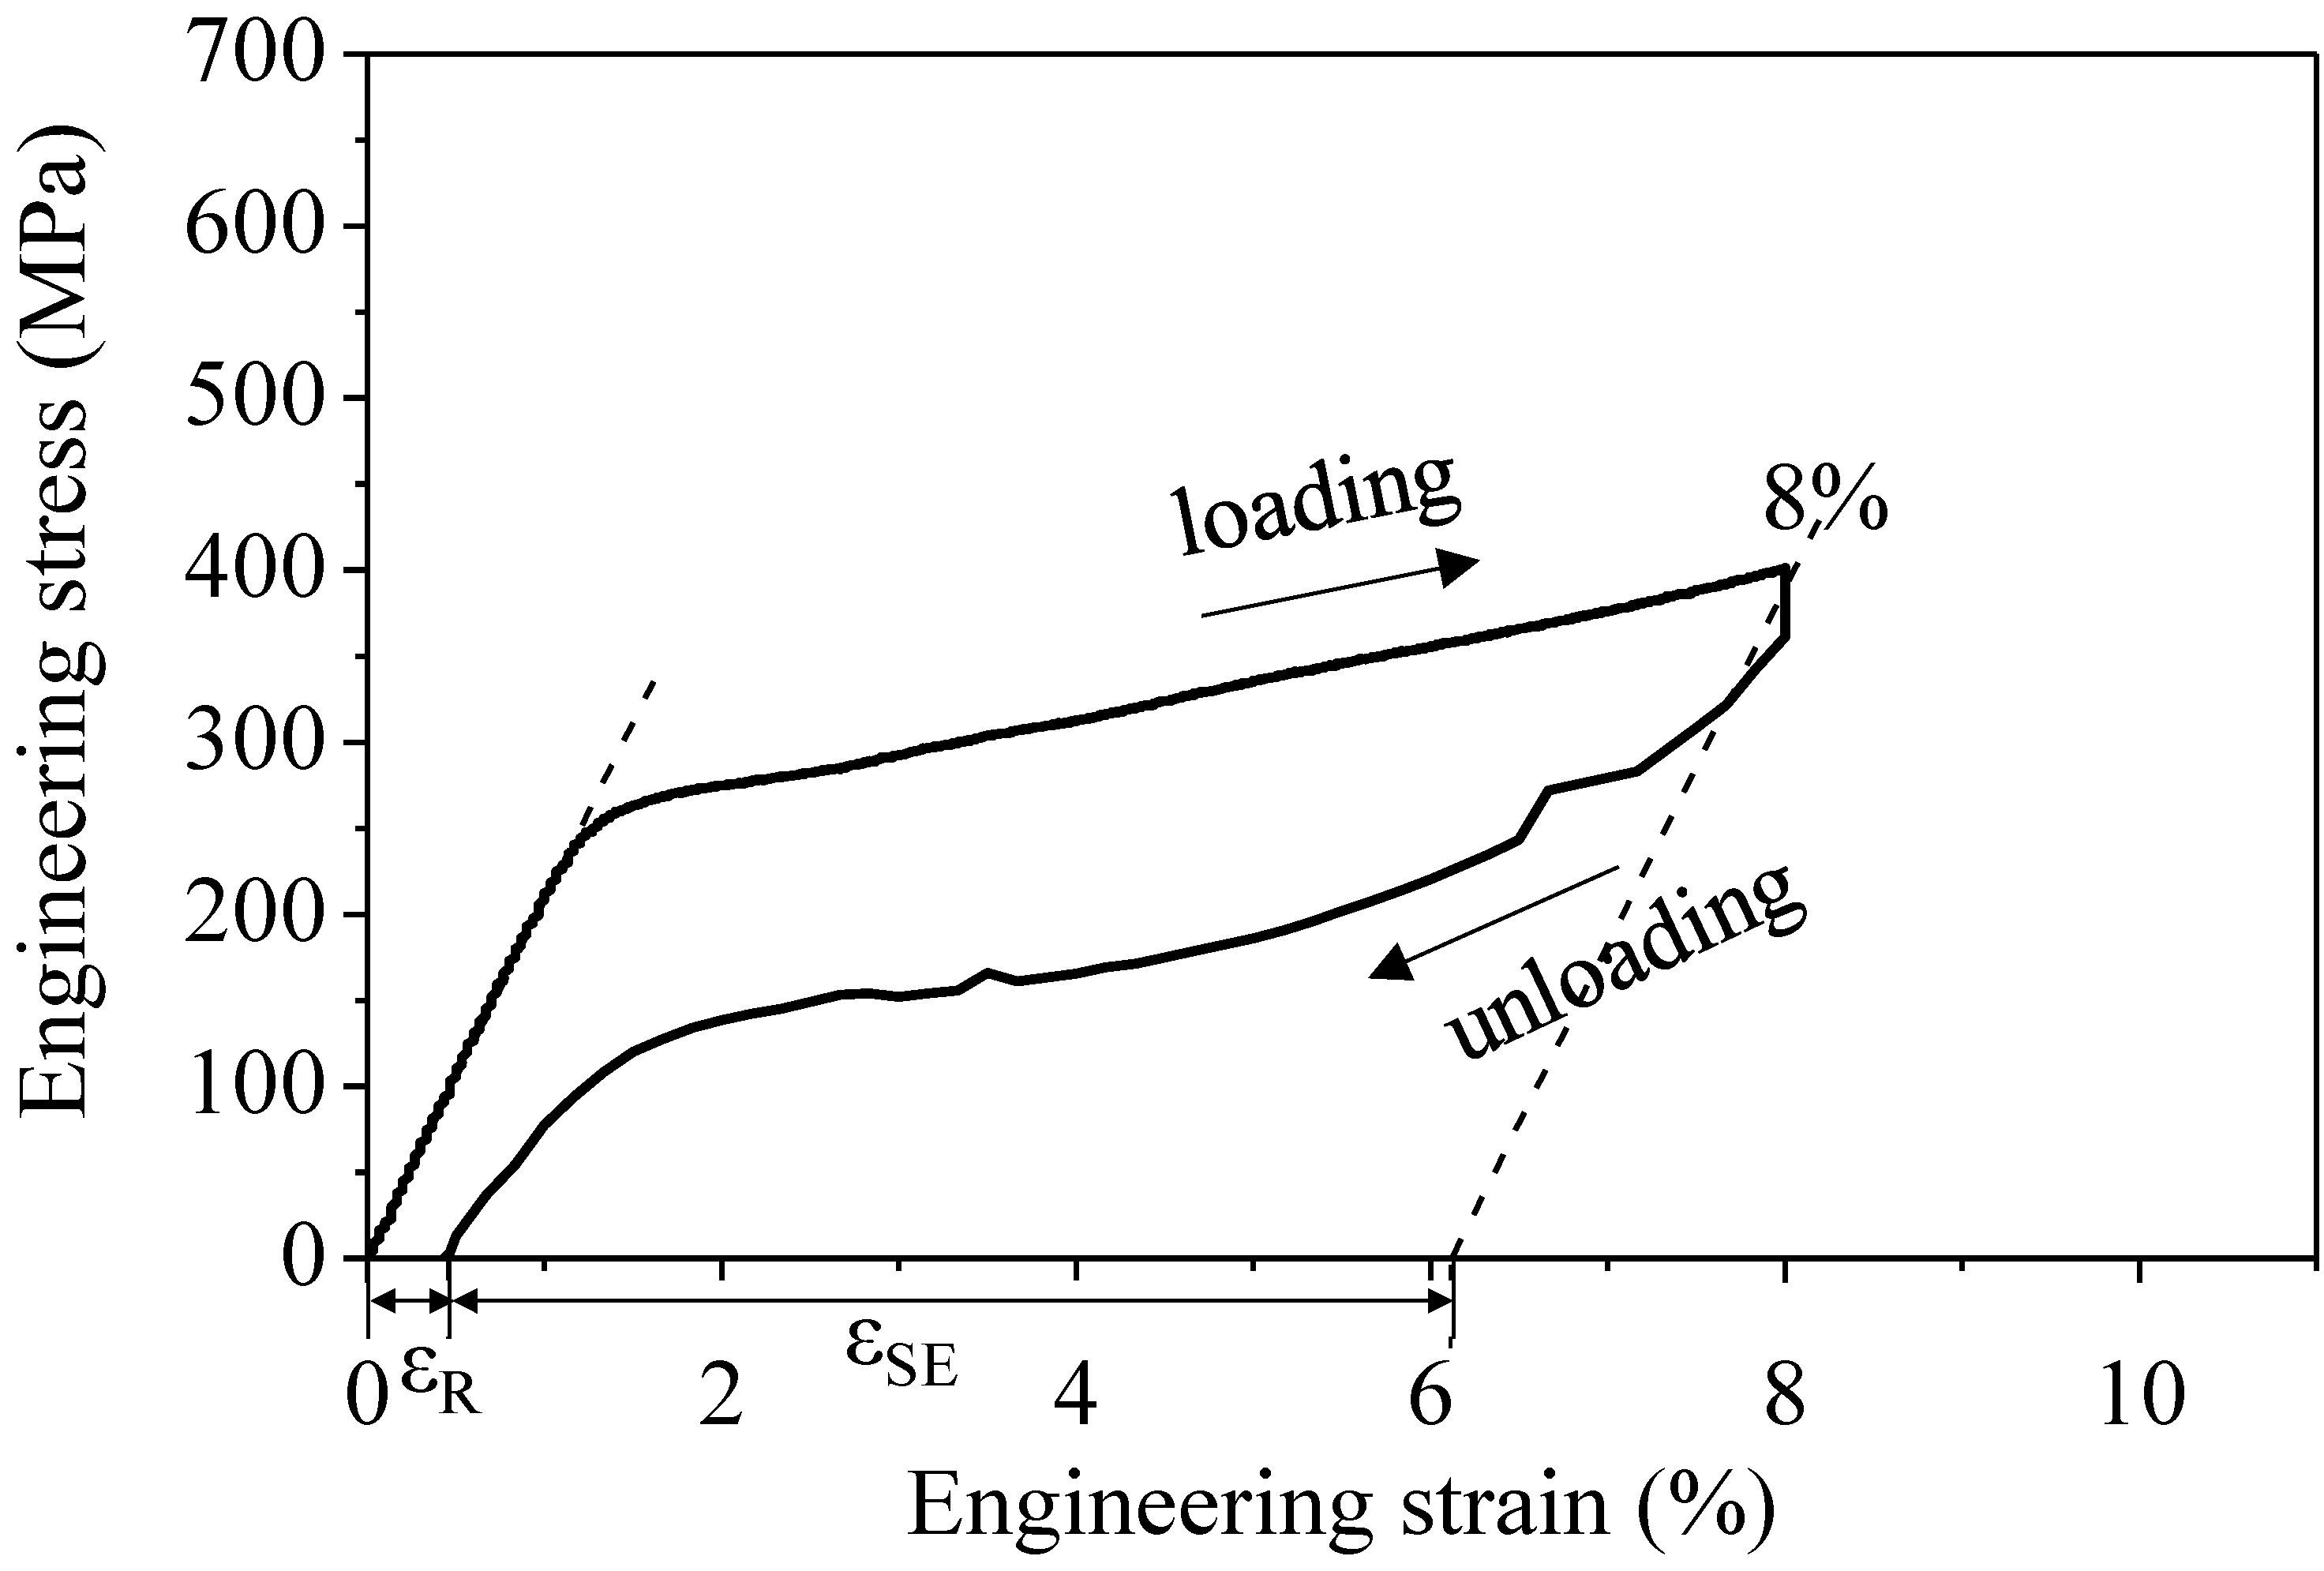
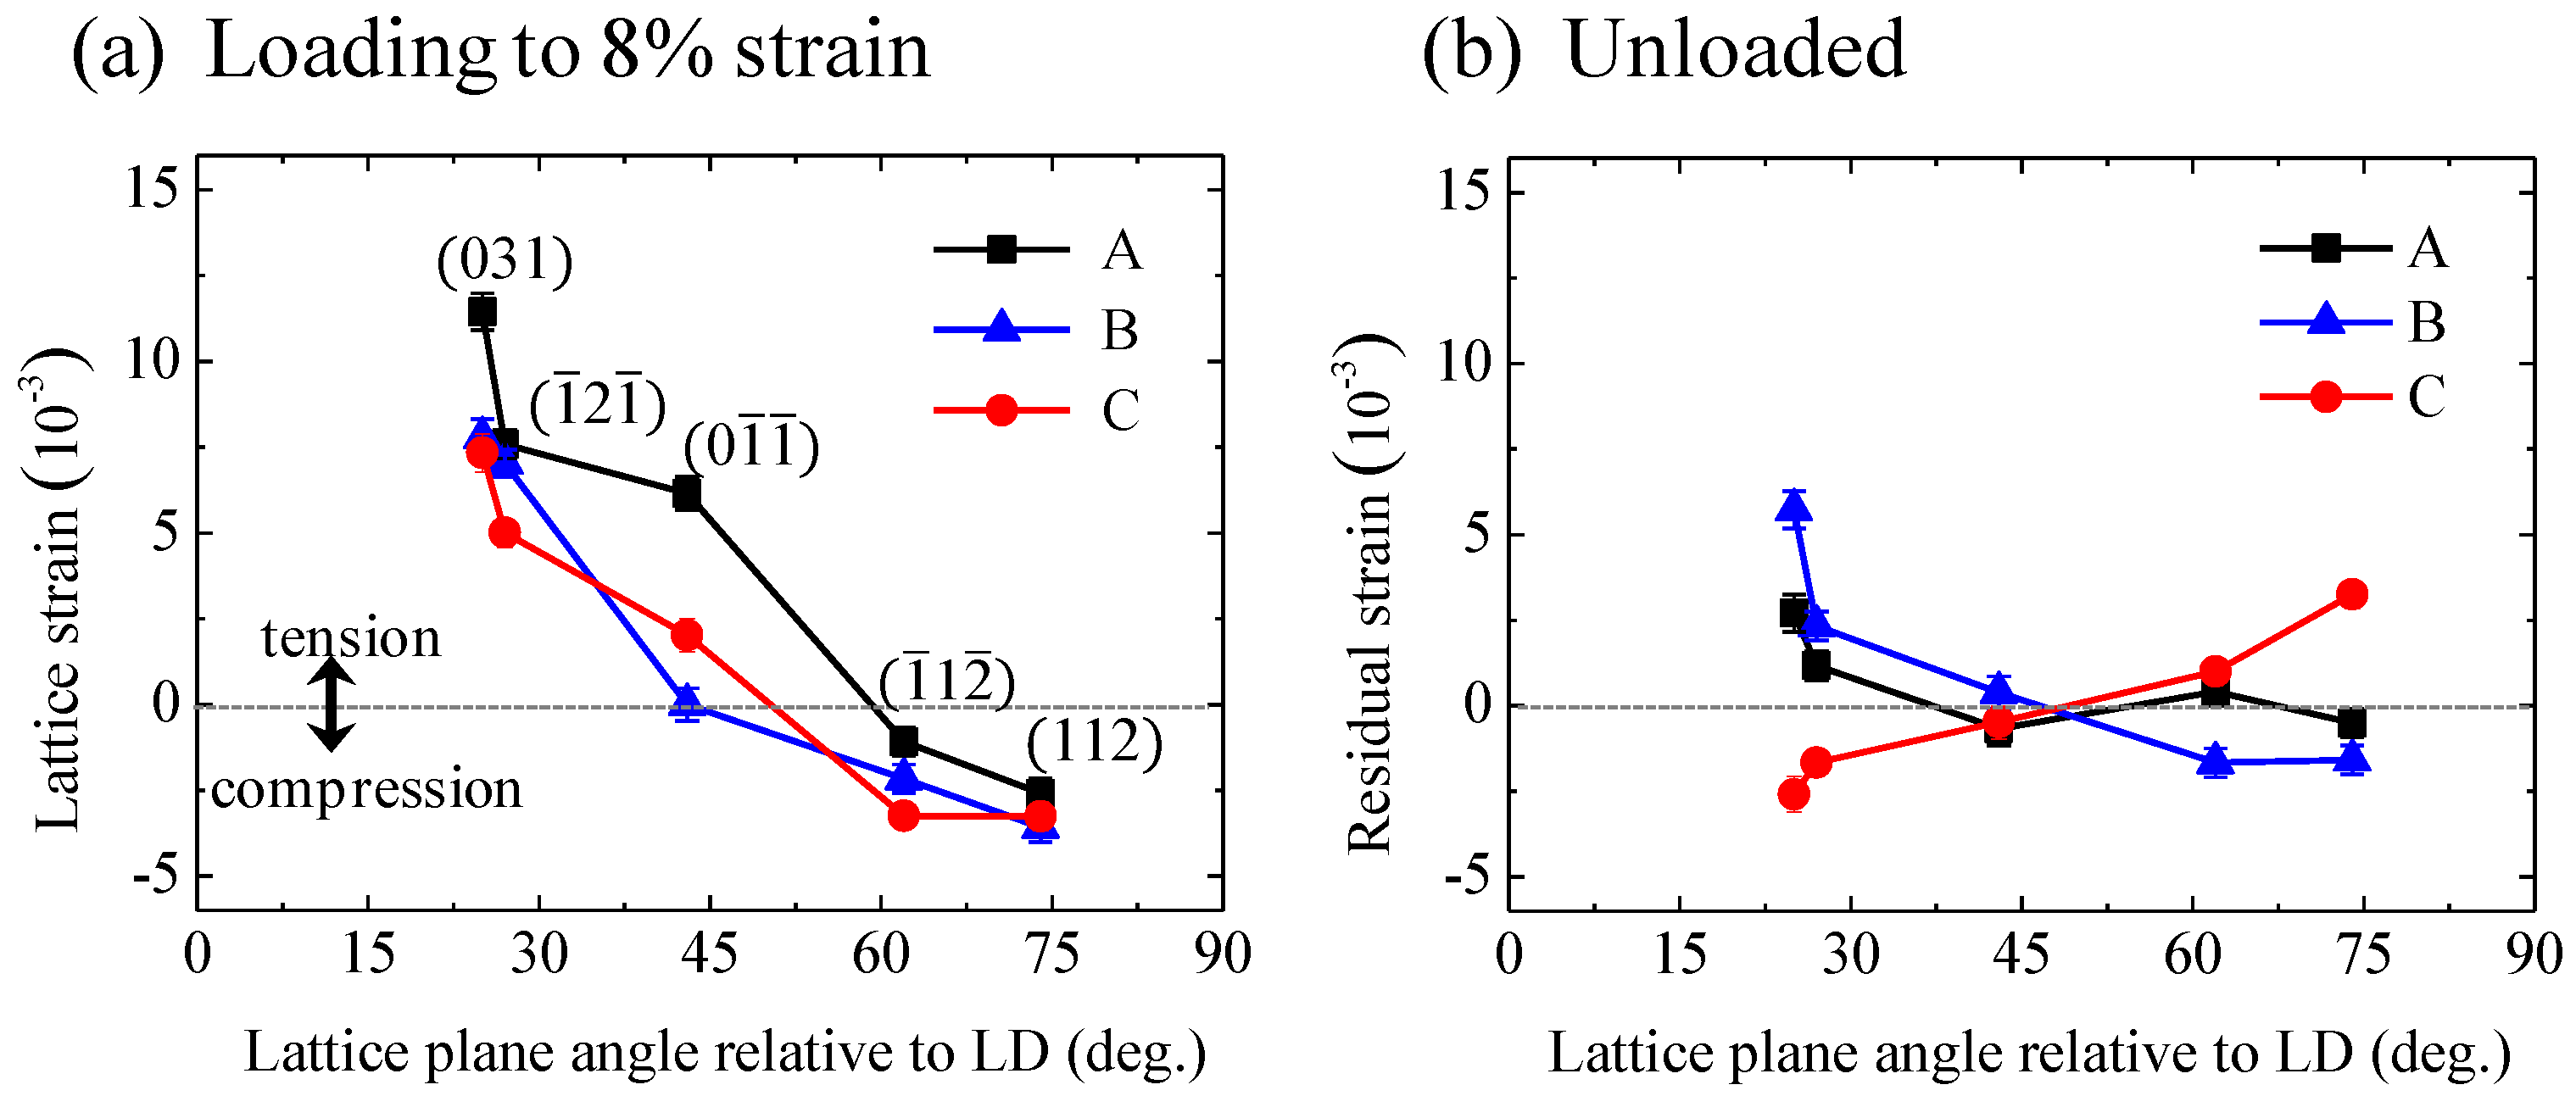
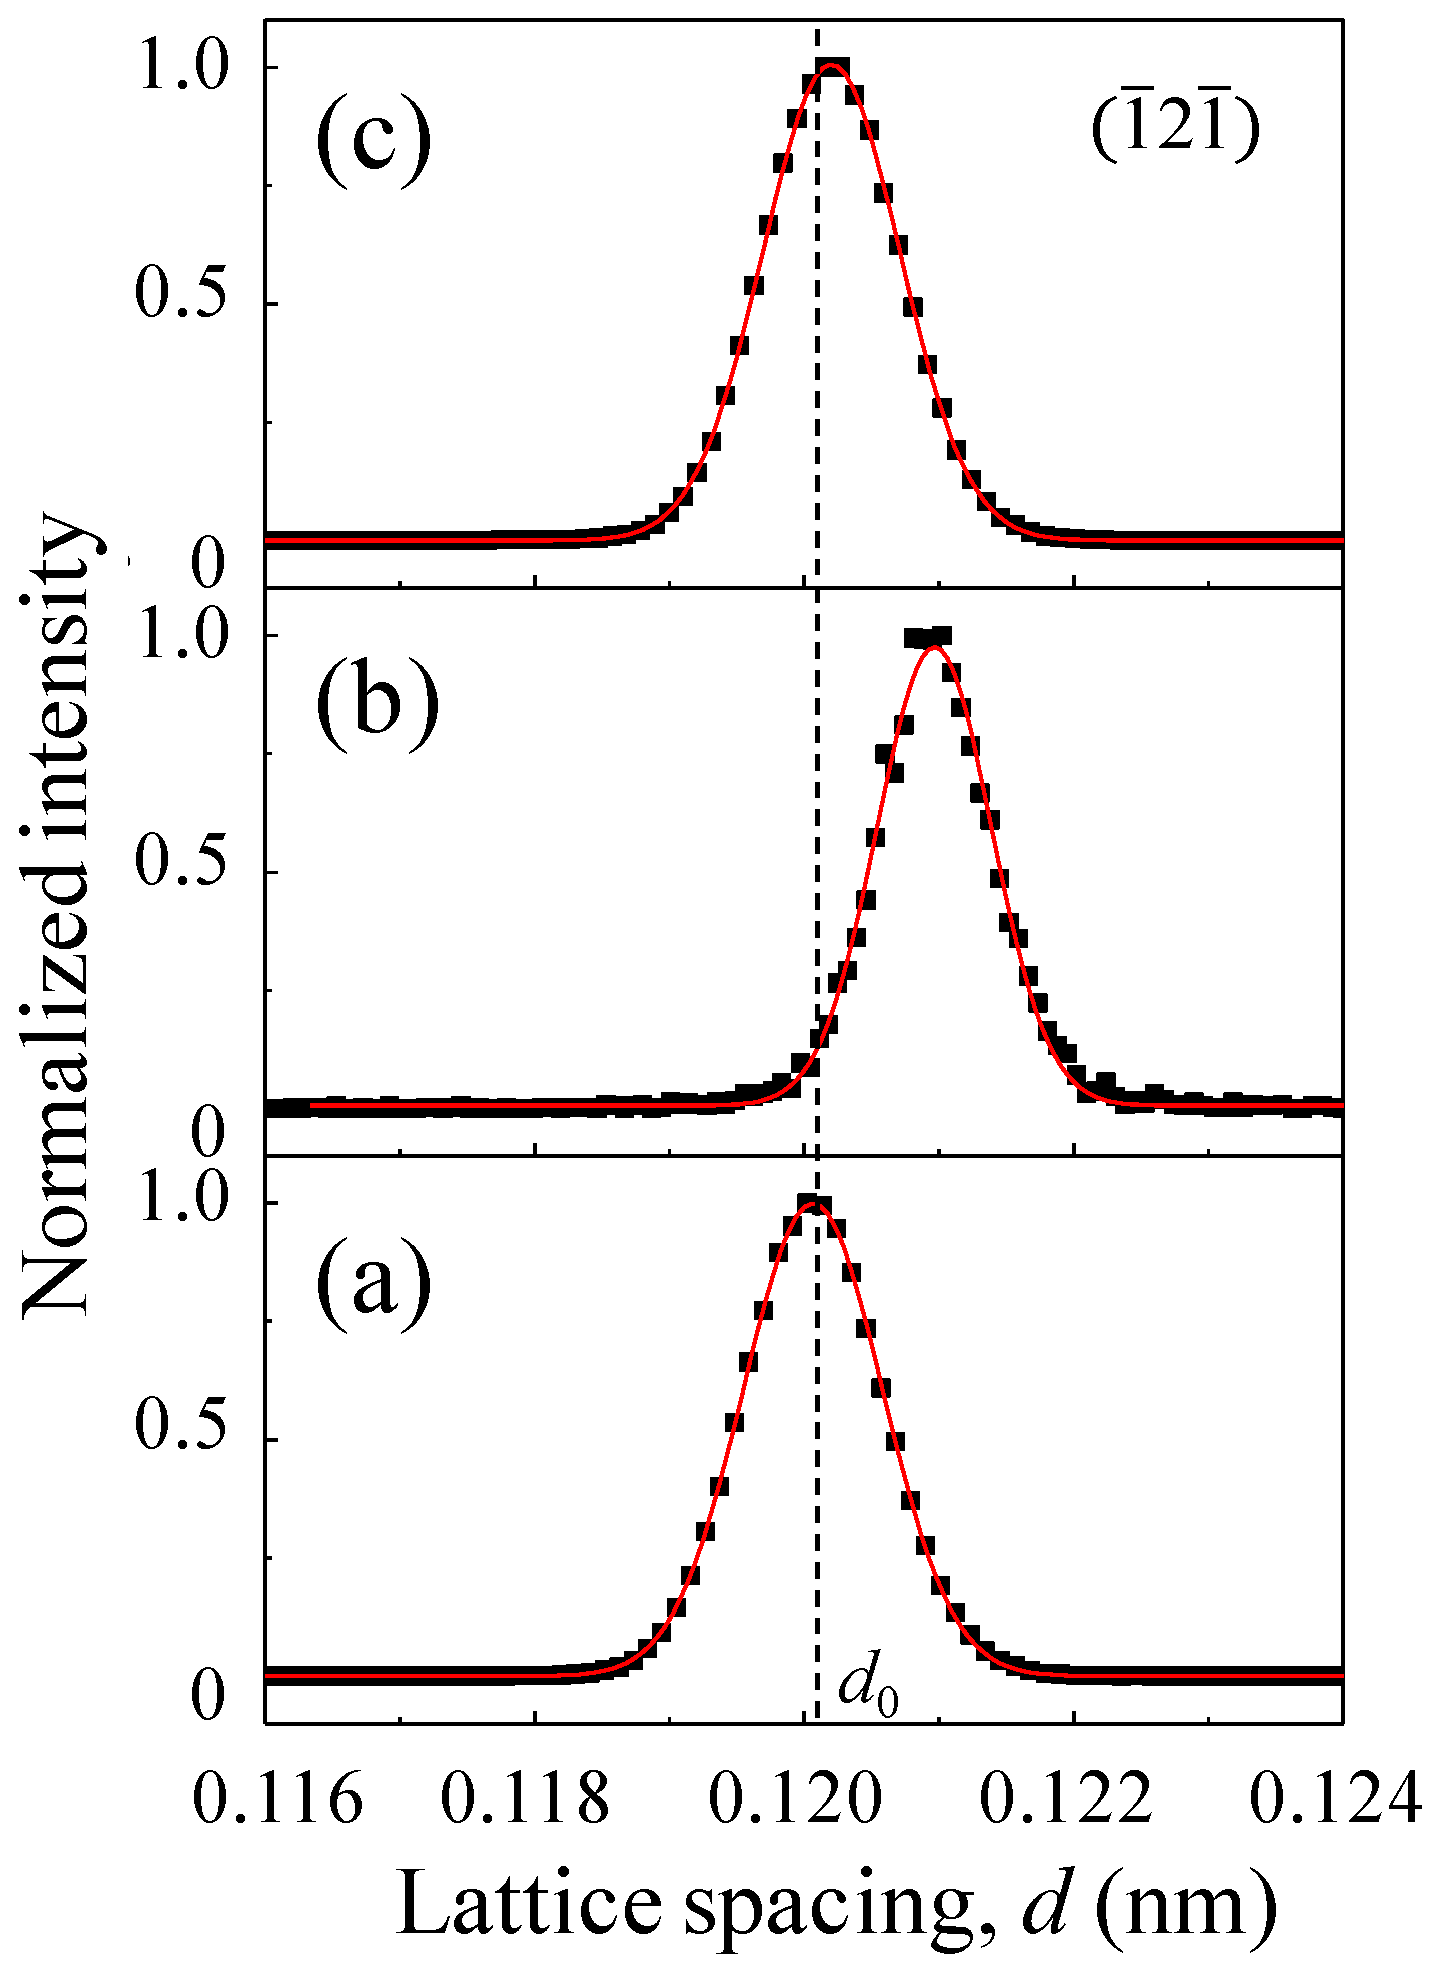
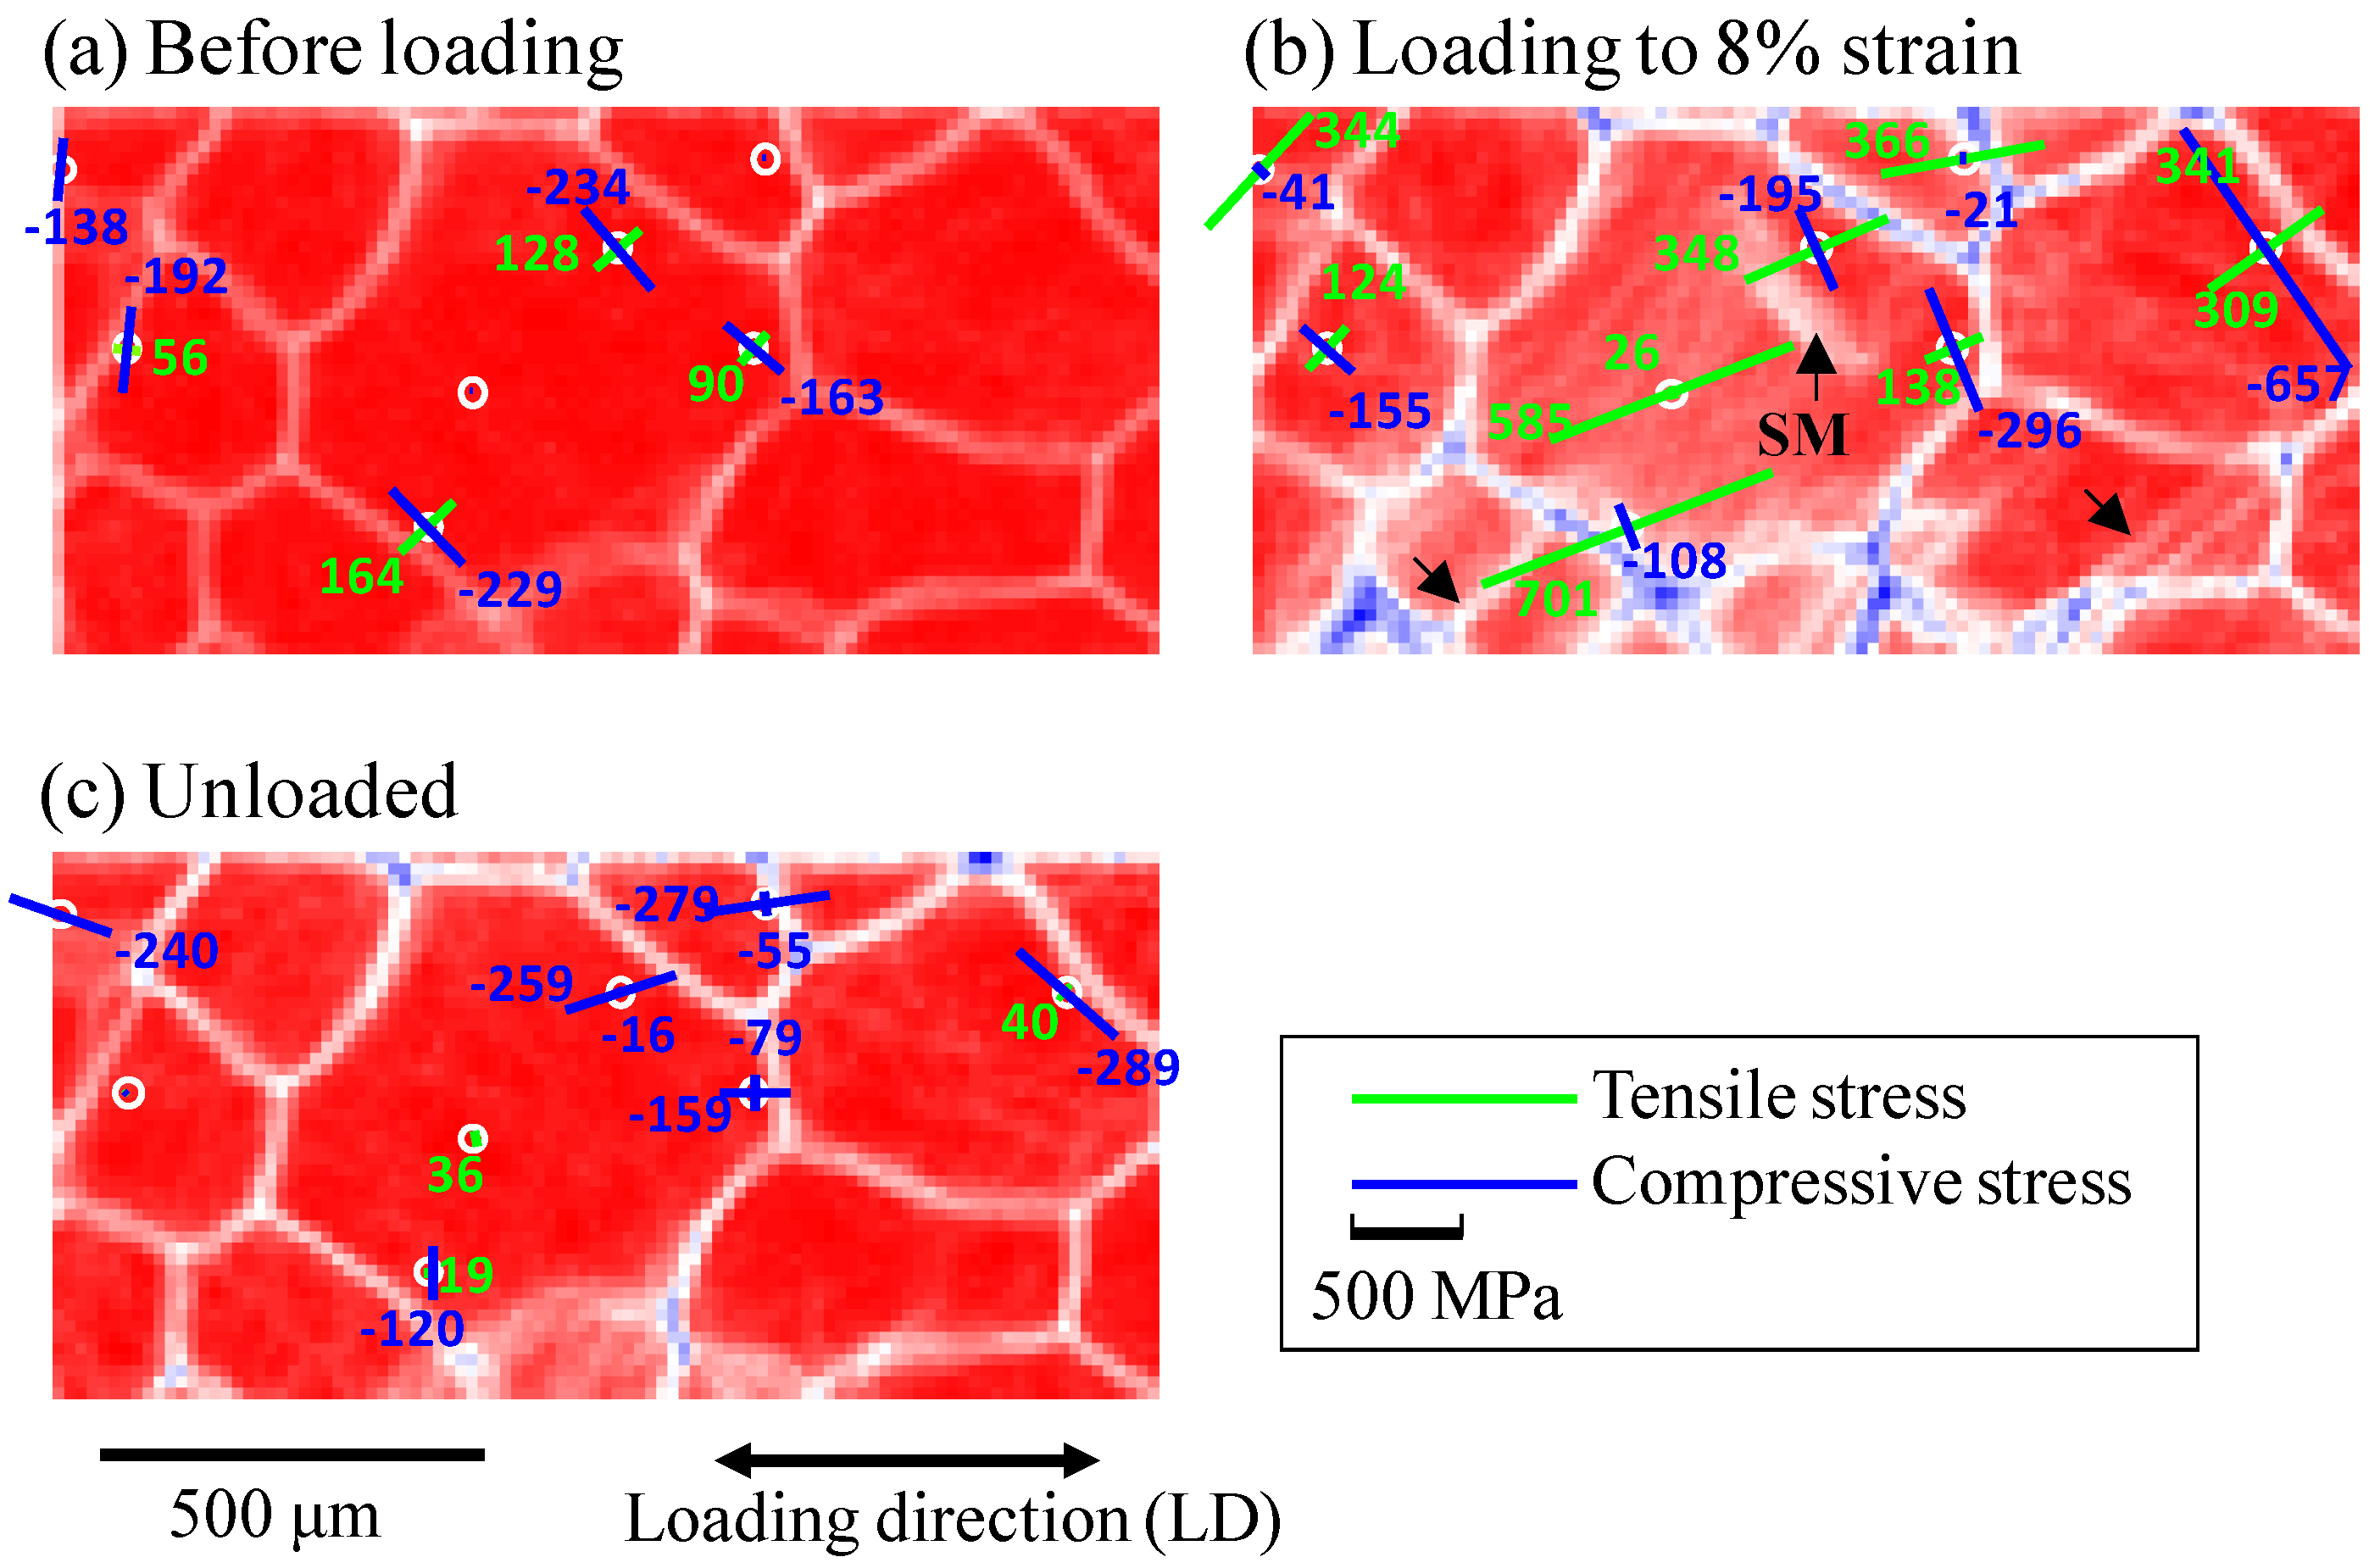
3.2. Strain and Stress Evolution during Superelastic Behavior
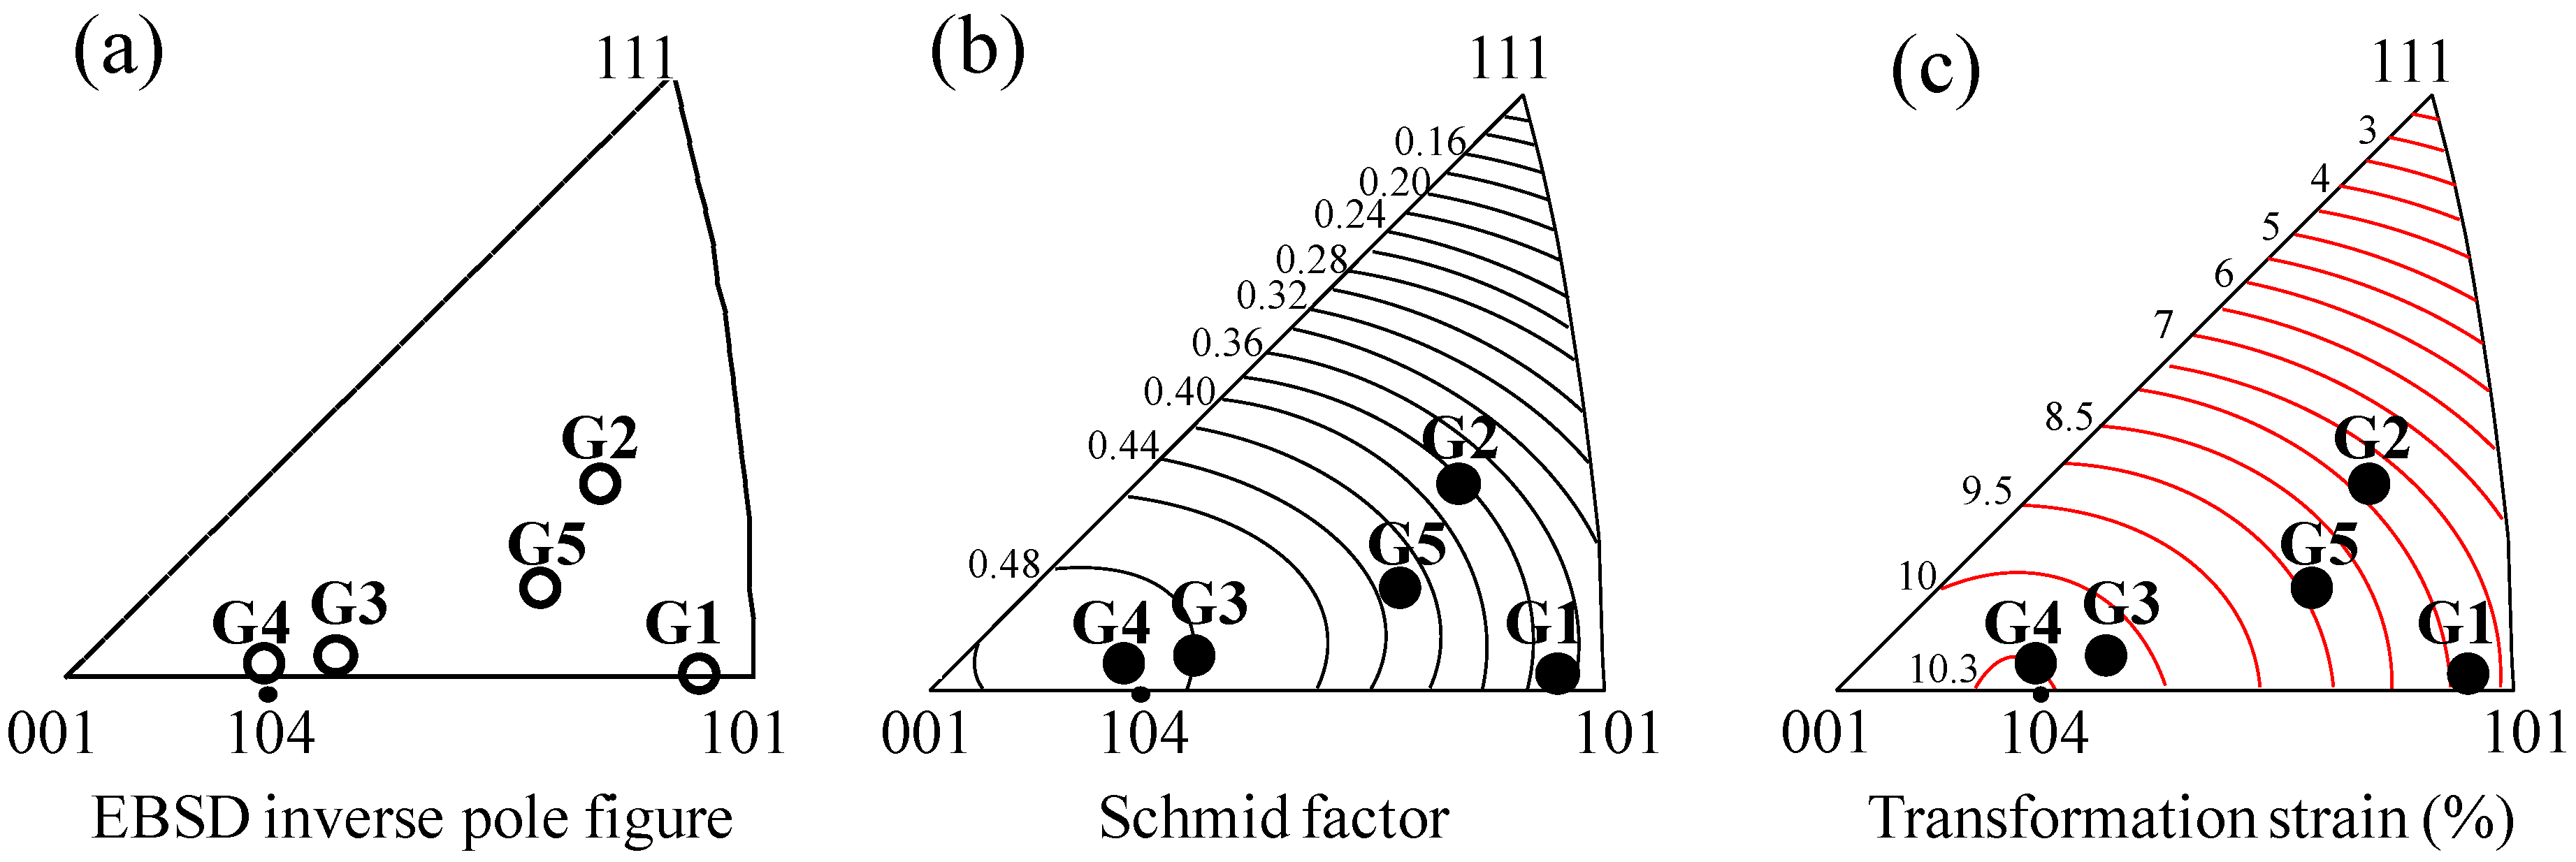
The evolution behavior of the lattice and residual strains in the (hkl) planes can be experimentally verified by observing the variation of dhkl during loading and unloading, as exemplified in the data of the ( 1 ¯ 2 1 ¯ ) plane shown in Figure 6. When the sample is tensile loaded to 8% strain, the peak position of the curve at 0% strain, d0, shifts to a higher d value, indicating the evolution of tensile lattice strain. The d value at 8% strain then decreases upon unloading and reverts to near the initial value before loading. The imperfect recovery of d indicates the evolution of residual strain.
Strain evolution behavior was evaluated for five lattice planes (i.e., (112), (031), ( 1 ¯ 2 1 ¯ ) , ( 1 ¯ 1 2 ¯ ) , and ( 0 1 ¯ 1 ¯ ) ) and the results are shown in Figure 7. The strains measured at three positions (i.e., A, B, and C) on a single grain are compared to examine the inhomogeneous deformation behavior. The lattice plane angle relative to the loading direction (LD) was measured by analyzing the EBSD pole figures. The lattice strain under the tensile load presents either positive (tensile strain) or negative values (compressive strain), depending on the lattice plane angles relative to the LD due to the Poisson effect. As shown in Figure 7, the magnitude of strain in the respective lattice planes varies according to the measurement position, indicating inhomogeneous strain evolution. At the region near the grain center (A), a relatively high tensile strain is observed in some lattice planes compared to those measured at the regions near the GB (B and C). The behavior of the strain release upon unloading also differs according to the position. While upon unloading, most of the lattice strain measured at the grain center region is released, a high amount of residual strain persists at most of the lattice planes measured at the GB regions.
Figure 6. Lattice spacing (d) of the ( 1 ¯ 2 1 ¯ ) plane as a function of applied strain (a) 0% (before loading); (b) 8% (under a load); and (c) 0% (unloaded). For comparison, the initial value at d0, the state before deformation, is indicated by the vertical dotted line. The d value was determined from a peak position of Gaussian fit (red lines).
Metals 05 01845 g006
Figure 7. (a) Lattice strain at 8% strain and (b) residual strain after unloading, measured at three different positions (A, B, and C) in a grain.
Metals 05 01845 g007
The origin of the inhomogeneous strain evolution may be related to the GB constraint. In fact, the deformation of polycrystalline materials is inhomogeneous because a grain embedded within the materials deforms upon contact with neighboring grains, resulting in the geometric grain constraint effect. The GB region could exhibit large residual strain because some permanent constraint strain could be imposed by interactions with neighboring grains during deformation. On the other hand, the lattice strain applied at the grain center region could be easily released upon unloading due to a reduced grain constraint effect, thereby resulting in low residual lattice strain.
Figure 8 shows the variation of principal stresses at several points during the tensile cycle. Green and blue bars indicate tensile stress and compressive stress, respectively. The magnitude of the stresses is presented by the length of the bar. The stress data is considered to contain measurement errors of about ±50 MPa, considering experimental strain resolution of about ±0.05%. There are very low stresses before deformation, which might be induced during the preparation of the tensile sample and/or the production process of the alloy. After the sample is deformed to 8% strain, significant stresses are observed at all points. Upon unloading, the stresses are almost released. It is thought that the reversible stress evolution is a typical phenomenon that results from reversible martensitic transformation in superelastic and shape memory alloys [5].
Figure 8. Principal stresses measured at several points (a) before loading; (b) during loading to 8% strain; and (c) after unloading. Arrows in (b) indicate stress-induced martensite (SM).
Metals 05 01845 g008
Figure 8b, for the condition with a tensile load, indicates the distribution of the principal stresses within the microstructure. Note that the stresses in each grain have a different magnitude and direction, indicating an inhomogeneous stress distribution at the grain scale. In Table 1, the measured stresses are listed for each grain, together with their Schmid factor and transformation strain. There is apparently no definite relationship between the magnitude of the stresses and the grain orientation (i.e., Schmid factor and transformation strain). In fact, the stresses within a grain are inhomogeneous, and therefore determination of the stresses of a particular grain is reasonably difficult. Indeed, the stresses measured at four different positions within the G3 grain exhibit large variations in magnitude, ranging from a tensile stress of 701 MPa and a compressive stress of −296 MPa. This result indicates the intragranular heterogeneity of the stress distribution.
The stress incompatibility between grains may be attributed to the different deformation properties of the respective grains due to their different orientations. Different grains will be more or less compliant to the applied load, depending on their orientations, which in turn leads to geometric constraint between grains. The constraint may affect the stress evolution in a grain.
Table 1. Principal stresses (σ1,2) measured at the grains of G1, G2, G3, G4, and G5 during loading to 8% strain.
GrainsSchmid FactorTransformation Strain (%)σ1 (MPa)σ2 (MPa)
G10.377.8344−41
G20.387.8124−155
G30.4810.2348−195
0.4810.258526
0.4810.2701−108
0.4810.2138−296
G40.4910.3366−21
G50.438.8309−657
The dependence of the martensitic transformation on the grain orientation can be verified by observing the grain images showing the formation of SM during deformation. The grain images of Figure 8 show that upon loading to 8% strain, the white contrast corresponding to SM (marked by arrows) is newly formed, which then disappears after unloading, indicating the reversible martensitic transformation. Considering the extent of the white contrast, the formation of SM appears to be favored in the G3 grain with a high Schmid factor of 0.48 compared with the G2 grain with a lower Schmid factor of 0.38. This experimental result agrees with the assumption based on the Schmid factor described in Figure 4.
Figure 9. Schematic illustrating the microscopic deformation behavior of the Cu-Al-Mn sample (a) during loading to 8% strain and (b) after unloading.
Metals 05 01845 g009
It is also worthwhile mentioning that large compressive residual stresses form around the GB regions after unloading, as shown in Figure 8c. This may be explained by the formation of residual martensite, as illustrated schematically in Figure 9. As described in Figure 8, the SM is formed within grains after loading to 8% strain. The distribution of SM is considered inhomogeneous, as the strain/stress evolution is inhomogeneous. Upon unloading, the SM is reverse-transformed to the parent phase, but some residual martensite remains around the GB, probably due to the occurrence of geometric constraint near the GB, resulting in the formation of local compressive residual stress. As shown in the optical micrograph of Figure 10, the residual martensite, which is mostly in contact with the GB, is indeed present after unloading of the tensile sample. The residual martensite would lead to incomplete strain recovery of the tensile sample (Figure 1). According to the modeling study by Ueland et al., the GB regions undergo severe grain constraint during deformation, which yields a high stress concentration, and therefore the GB area must be reduced for designing high-performing superelastic alloys [12].
Figure 10. Optical micrograph showing residual martensite formed around grain boundaries after unloading.
Metals 05 01845 g010

4. Conclusions

In situ white X-ray microbeam diffraction experiments were conducted to investigate microscopic deformation behavior of a Cu-Al-Mn superelastic alloy during tensile testing. Evolution of Laue patterns and strain/stress showed reversible phenomena during the superelastic behavior of the tensile sample, probably because of the reversible martensitic transformation. Strain recovery of the sample was incomplete due to the residual martensite, resulting in the formation of local compressive residual stresses at GB regions. Stress data measured at different positions in several grains with different orientations verified the inhomogeneous stress distribution, both at the grain scale and the intragranular scale. The inhomogeneous deformation behavior may be attributed to the orientation dependence of the martensitic transformation as well as to the geometric GB constraint.

Acknowledgments

This study was financially supported in part by a Grant-in-Aid for Scientific Research Fund from the Japan Society for the Promotion of Science (JSPS) and research project from Korea Institute of Industrial Technology. The synchrotron radiation experiments were performed on the beamline BL28B2 at SPring-8 with the approval of the Japan Synchrotron Radiation Research Institute.

Author Contributions

E.P.K. wrote the manuscript; S.S. (Shigeo Sato), S.F., and K.S. helped with data collection and analysis; R.K. prepared the materials; K.K. and M.S. helped with the diffraction experiments. S.S. (Shigeru Suzuki) supervised the research. All authors contributed to the interpretation of the data.

Conflicts of Interest

The authors declare no conflict of interest.

References

  1. Sutou, Y.; Omori, T.; Kainuma, R.; Ono, N.; Ishida, K. Enhancement of superelasticity in Cu-Al-Mn-Ni shape memory alloys by texture control. Metall. Mater. Trans. 2002, 33A, 2817–2824. [Google Scholar] [CrossRef]
  2. Sutou, Y.; Omori, T.; Yamauchi, K.; Ono, N.; Kainuma, R.; Ishida, K. Effect of grain size and texture on pseudoelasticity in Cu-Al-Mn-based shape memory wire. Acta Mater. 2005, 53, 4121–4133. [Google Scholar] [CrossRef]
  3. Sutou, Y.; Omori, T.; Wang, J.J.; Kainuma, R.; Ishida, K. Effect of grain size and texture on superelasticity of Cu-AI-Mn-based shape memory alloys. J. Phys. IV 2003, 112, 511–514. [Google Scholar] [CrossRef]
  4. Berveiller, S.; Malard, B.; Wright, J.; Patoor, E.; Geandier, G. In situ synchrotron analysis of lattice rotations in individual grains during stress-induced martensitic transformations in a polycrystalline Cu-Al-Be shape memory alloy. Acta Mater. 2011, 59, 3636–3645. [Google Scholar] [CrossRef]
  5. Kwon, E.P.; Sato, S.; Fujieda, S.; Shinoda, K.; Kajiwara, K.; Sato, M.; Suzuki, S. Microscopic residual stress evolution during deformation process of an Fe-Mn-Si-Cr shape memory alloy investigated using white X-ray microbeam diffraction. Mater. Sci. Eng. 2013, 570, 43–50. [Google Scholar] [CrossRef]
  6. Tomota, Y.; Harjo, S.; Lukas, P.; Neov, D.; Sittner, P. In-situ neutron diffraction during shape-memory behavior in Fe-Mn-Si-Cr. JOM 2000, 52, 32–34. [Google Scholar] [CrossRef]
  7. Kajiwara, K.; Sato, M.; Hashimoto, T.; Hirosawa, I.; Yamada, T.; Terachi, T.; Fukumura, T.; Arioka, K. Development of visualization method of grain boundaries in stainless steel by using white X-ray micro-beam and image detector. Phys. Status Solidi 2009, 206, 1838–1841. [Google Scholar] [CrossRef]
  8. Pyzalla, A. Methods and feasibility of residual stress analysis by high-energy synchrotron radiation in transmission geometry using a white beam. J. Nondestruct. Eval. 2000, 19, 21–31. [Google Scholar] [CrossRef]
  9. Dutkiewicz, J.; Kato, H.; Miura, S.; Messerschmidt, U.; Bartsch, M. Structure changes during pseudoelastic deformation of Cu-Al-Mn single crystals. Acta Mater. 1996, 44, 4597–4609. [Google Scholar] [CrossRef]
  10. Tanaka, K.; Suzuki, K.; Akiniwa, Y. Evaluation of Residual Stress by X-ray Diffraction, Fundamentals and Application; Yokendo: Tokyo, Japan, 2006; pp. 38–357. [Google Scholar]
  11. Sedlak, P.; Seiner, H.; Landa, M.; Novak, V.; Sittner, P.; Manosa, L. Elastic constants of bcc austenite and 2H orthorhombic martensite in Cu-Al-Ni shape memory alloy. Acta Mater. 2005, 53, 3643–3661. [Google Scholar] [CrossRef]
  12. Ueland, S.M.; Schuh, C.A. Grain boundary and triple junction constraints during martensitic transformation in shape memory alloys. J. Appl. Phys. 2013, 114, 053503. [Google Scholar] [CrossRef]

