3.1. Thermal Characterization of Cast Irons and Quenching Process
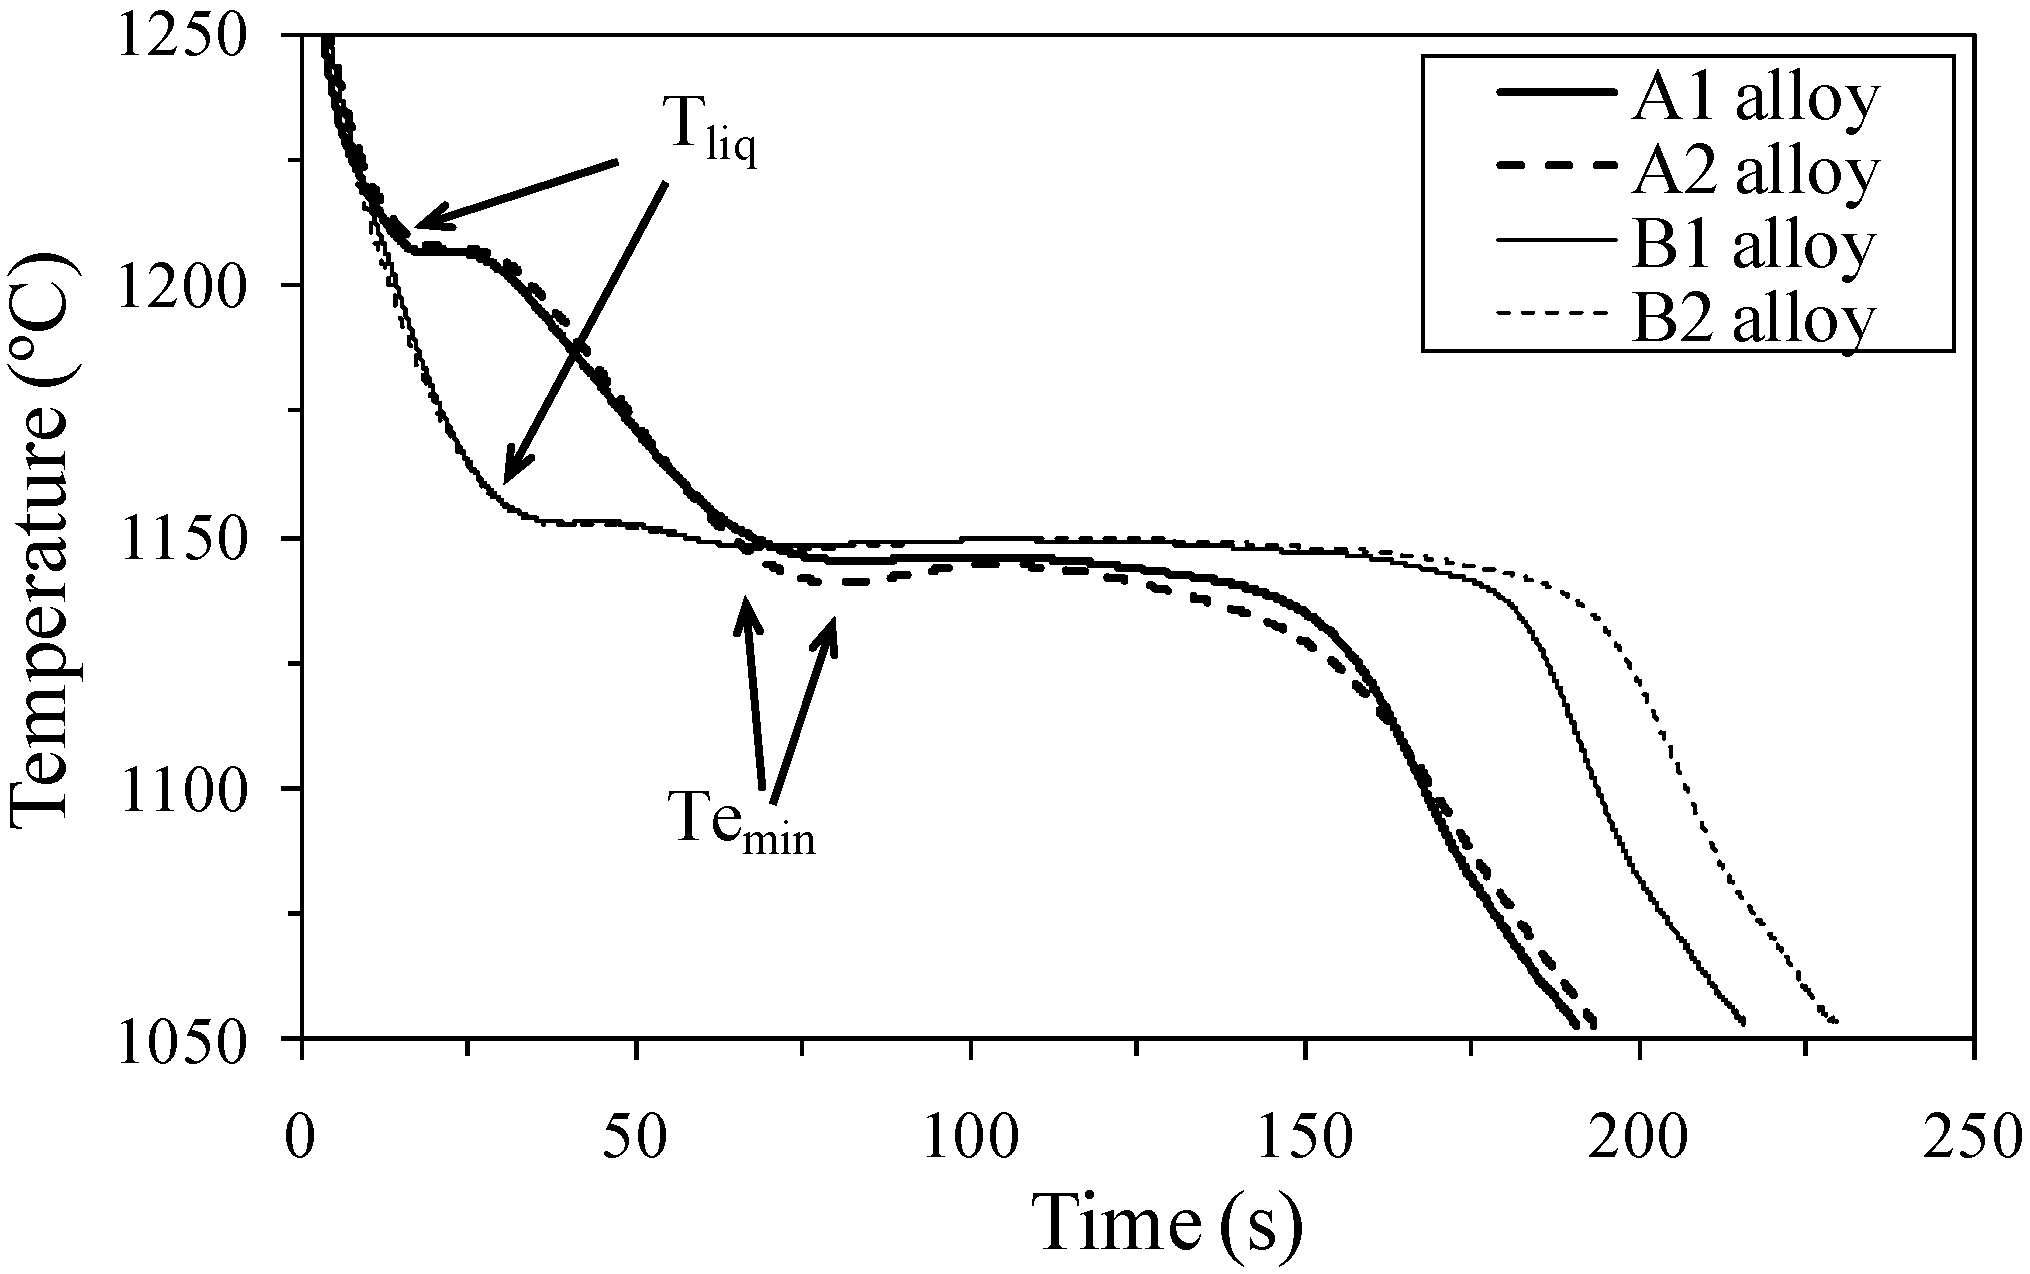
Thermal characterization made on the two cast iron alloys led to the record of the four cooling curves plotted in
Figure 2. These records correspond to the non-quenched samples with and without inoculant addition in the TA cup for each composition. The most relevant data obtained from the recorded cooling curves are included in
Table 2 according to reference [
2]. It can be observed that solidification starts at higher temperatures for the A cast irons than for the B ones, which can be easily recognized by higher liquidus temperature values (
Tliq). While A alloy shows a clear hypo-eutectic behavior, B alloys, considered as hyper-eutectic by chemical composition, show a slightly hypo-eutectic behavior according to their solidification model.
Figure 2.
Cooling curves recorded from inoculated and non-inoculated samples.
Table 2.
Thermal analysis (TA) parameters obtained from the cooling curves plotted in Figure 2.
| Alloy | Inoculation | Tliq (°C) | Temin (°C) | Rc (°C) | Tsol (°C) | CAT (%) |
|---|
| A1 | yes | 1206.4 | 1145.3 | 0.9 | 1102.4 | 3.20 |
| A2 | no | 1207.5 | 1140.9 | 3.6 | 1097.5 |
| B1 | yes | 1152.8 | 1148.0 | 1.5 | 1107.6 | 3.52 |
| B2 | no | 1152.4 | 1147.7 | 2.1 | 1102.1 |
Bulk eutectic reaction, where the massive austenite-graphite precipitation and growth take place, starts at lower temperatures for the A alloys, assessed by lower minimum eutectic temperature (
Te
min). Inoculation effects only seem to be observed on the bulk eutectic areas as the graphite nodule precipitation must be accelerated from the beginning of this period and consequently lower recalescence (
Rc = Te
max −
Te
min) values are detected. Additionally inoculation effects become less relevant for the A cast irons due to the nucleation promoter effect of high carbon and silicon contents in these alloys. These results are in good agreement with the ones previously reported by the authors for ductile irons [
7] and for gray cast irons [
13].
Figure 3 shows the different time steps when quenching experiments were primarily carried out for each of the four alloys studied in this work. Note that quenching effectiveness strongly depends on the fast cooling applied to each sample so that deviations between the steps illustrated in
Figure 3 and by the corresponding f
S values, metallographically obtained, are possible. On the other hand it is necessary here to draw to attention that the A22, A24, B21 and B22 samples were discharged due to the appearance of pearlite in the metallic matrix after quenching which is associated to lack of achievement of sufficient cooling rate during the experiment. Although the quenching process is quite useful, unfortunately its methodology is not similarly efficient in all fields of a given sample. Moreover low quenching efficiencies are expected to be more important in those fields that are less exposed to quenching media,
i.e., #1 to #6 or the internal ones (see
Figure 1). As a consequence it becomes very convenient here to analyze the quenching method effectiveness by means of f
S evolution with all fields present in each sample.
Figure 3.
Quenching experiments made for each cast iron alloy. (a) A1 Alloy; (b) B1 Alloy. (c) A2 Alloy; (d) B2 Alloy.
3.2. Solid Fraction and Graphite Area Fraction Evolution during Solidification
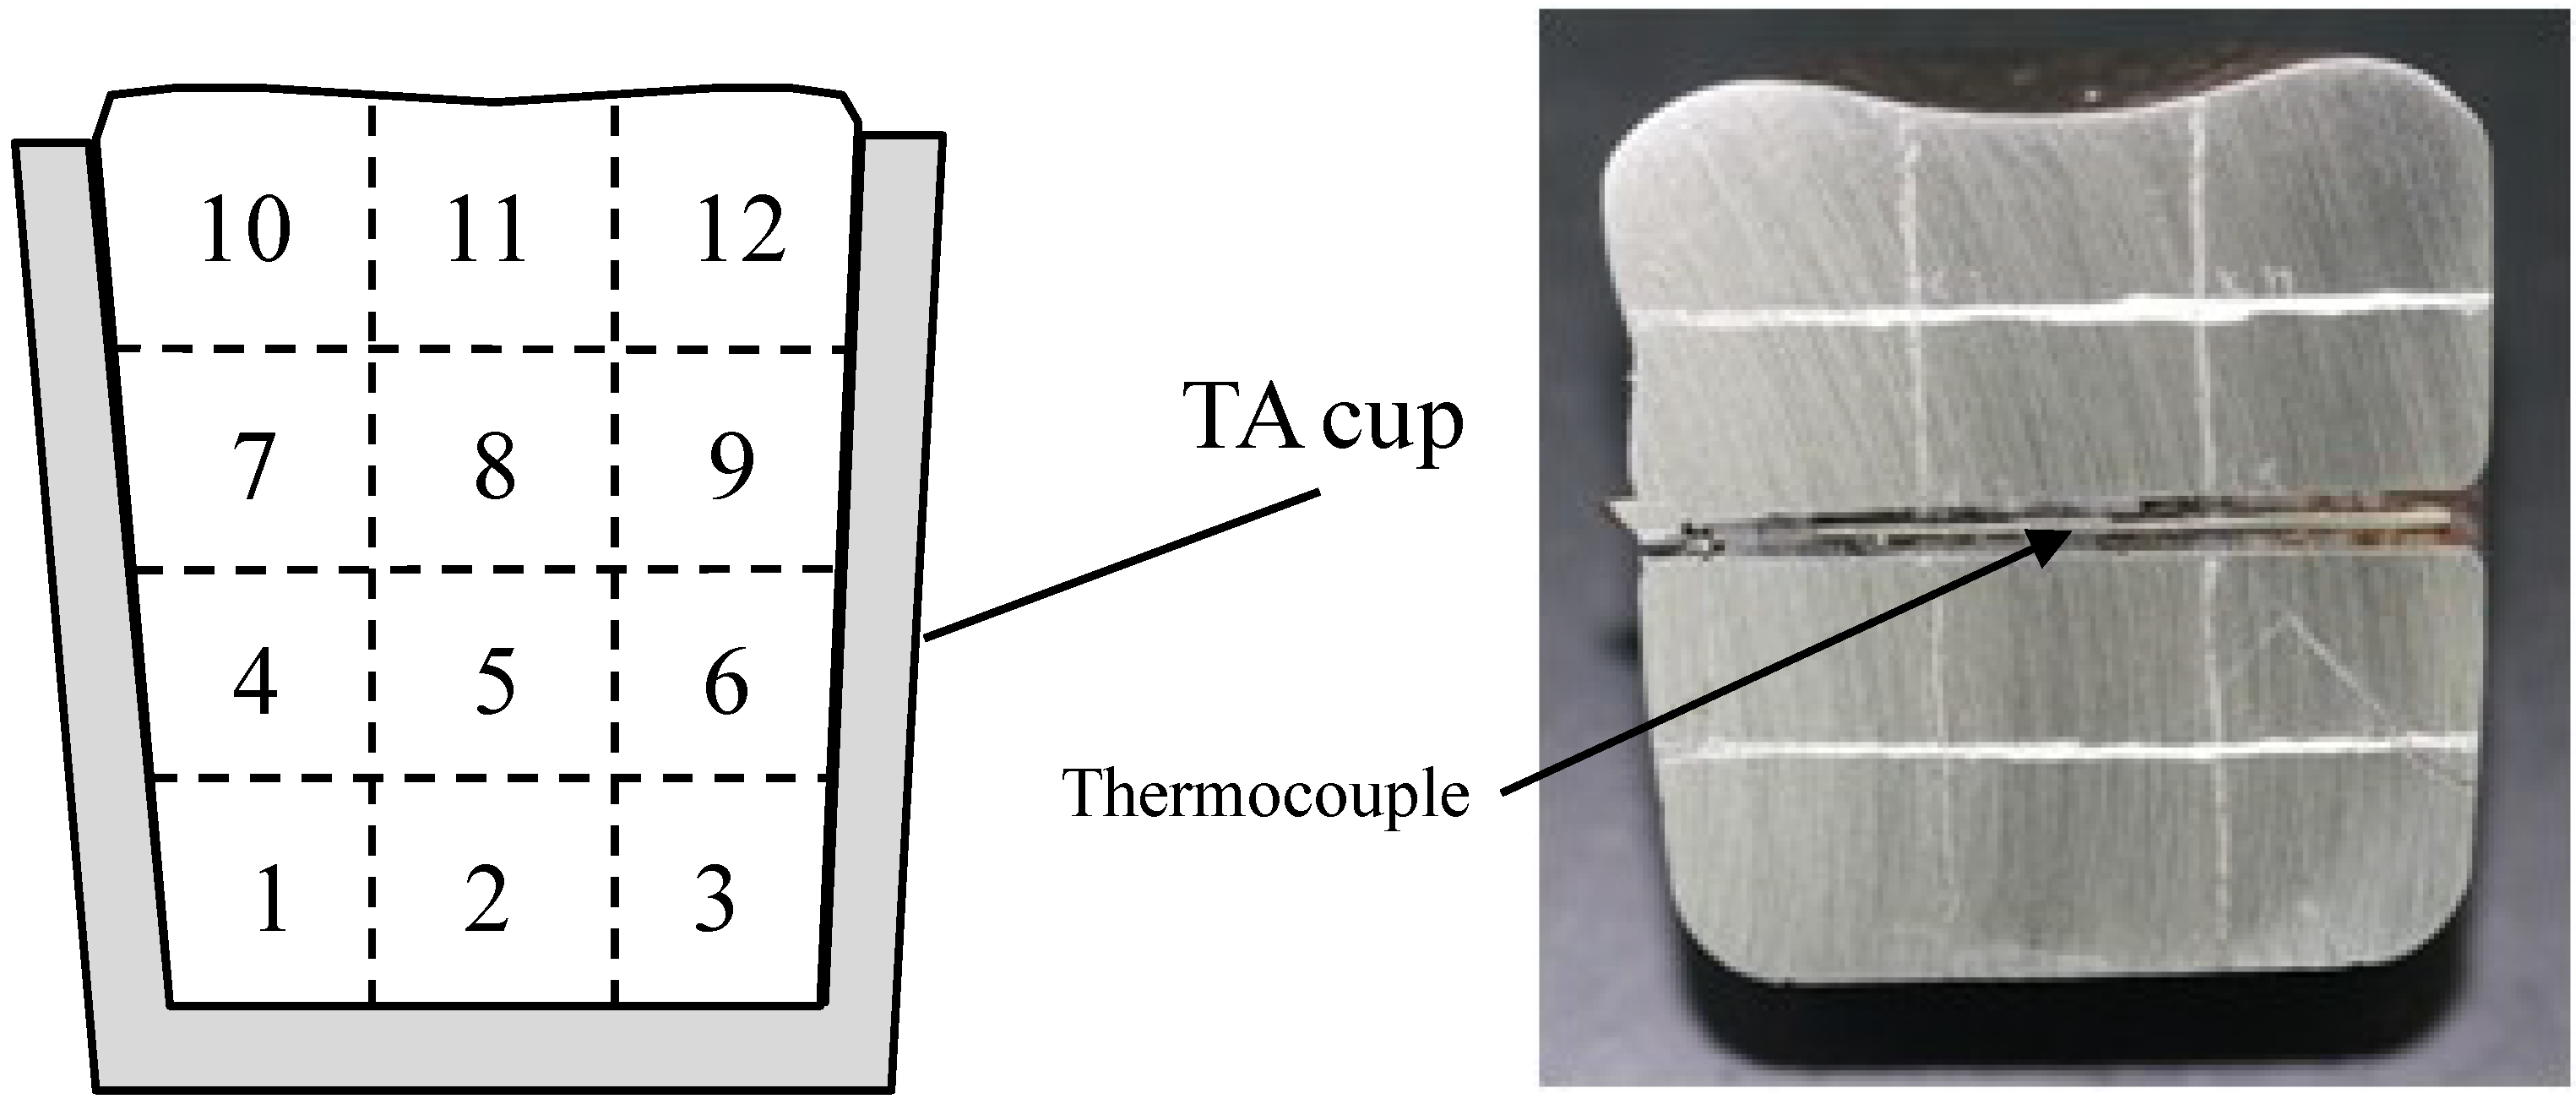
Quenching experiments performed in such a casting size show some difficulties associated to heat release from the sample. At the same time, the top part is in direct contact with the quenching bath, which assures sufficient cooling rate to succeed in freezing the structure, the bottom part has more difficulty to release the heat and so higher f
S are expected in those areas. For this reason, in the same sample, different f
S and graphite precipitation can arise from the quenching process. As the main aim of this work was to correlate graphite amount evolution and f
S, it was considered convenient to analyze the 12 different fields described in
Figure 1. Solid fraction evolutions of both inoculated A and B alloys in field No. 11,
i.e., the most sensible to quenching, are shown in
Figure 4 and
Figure 5 respectively.
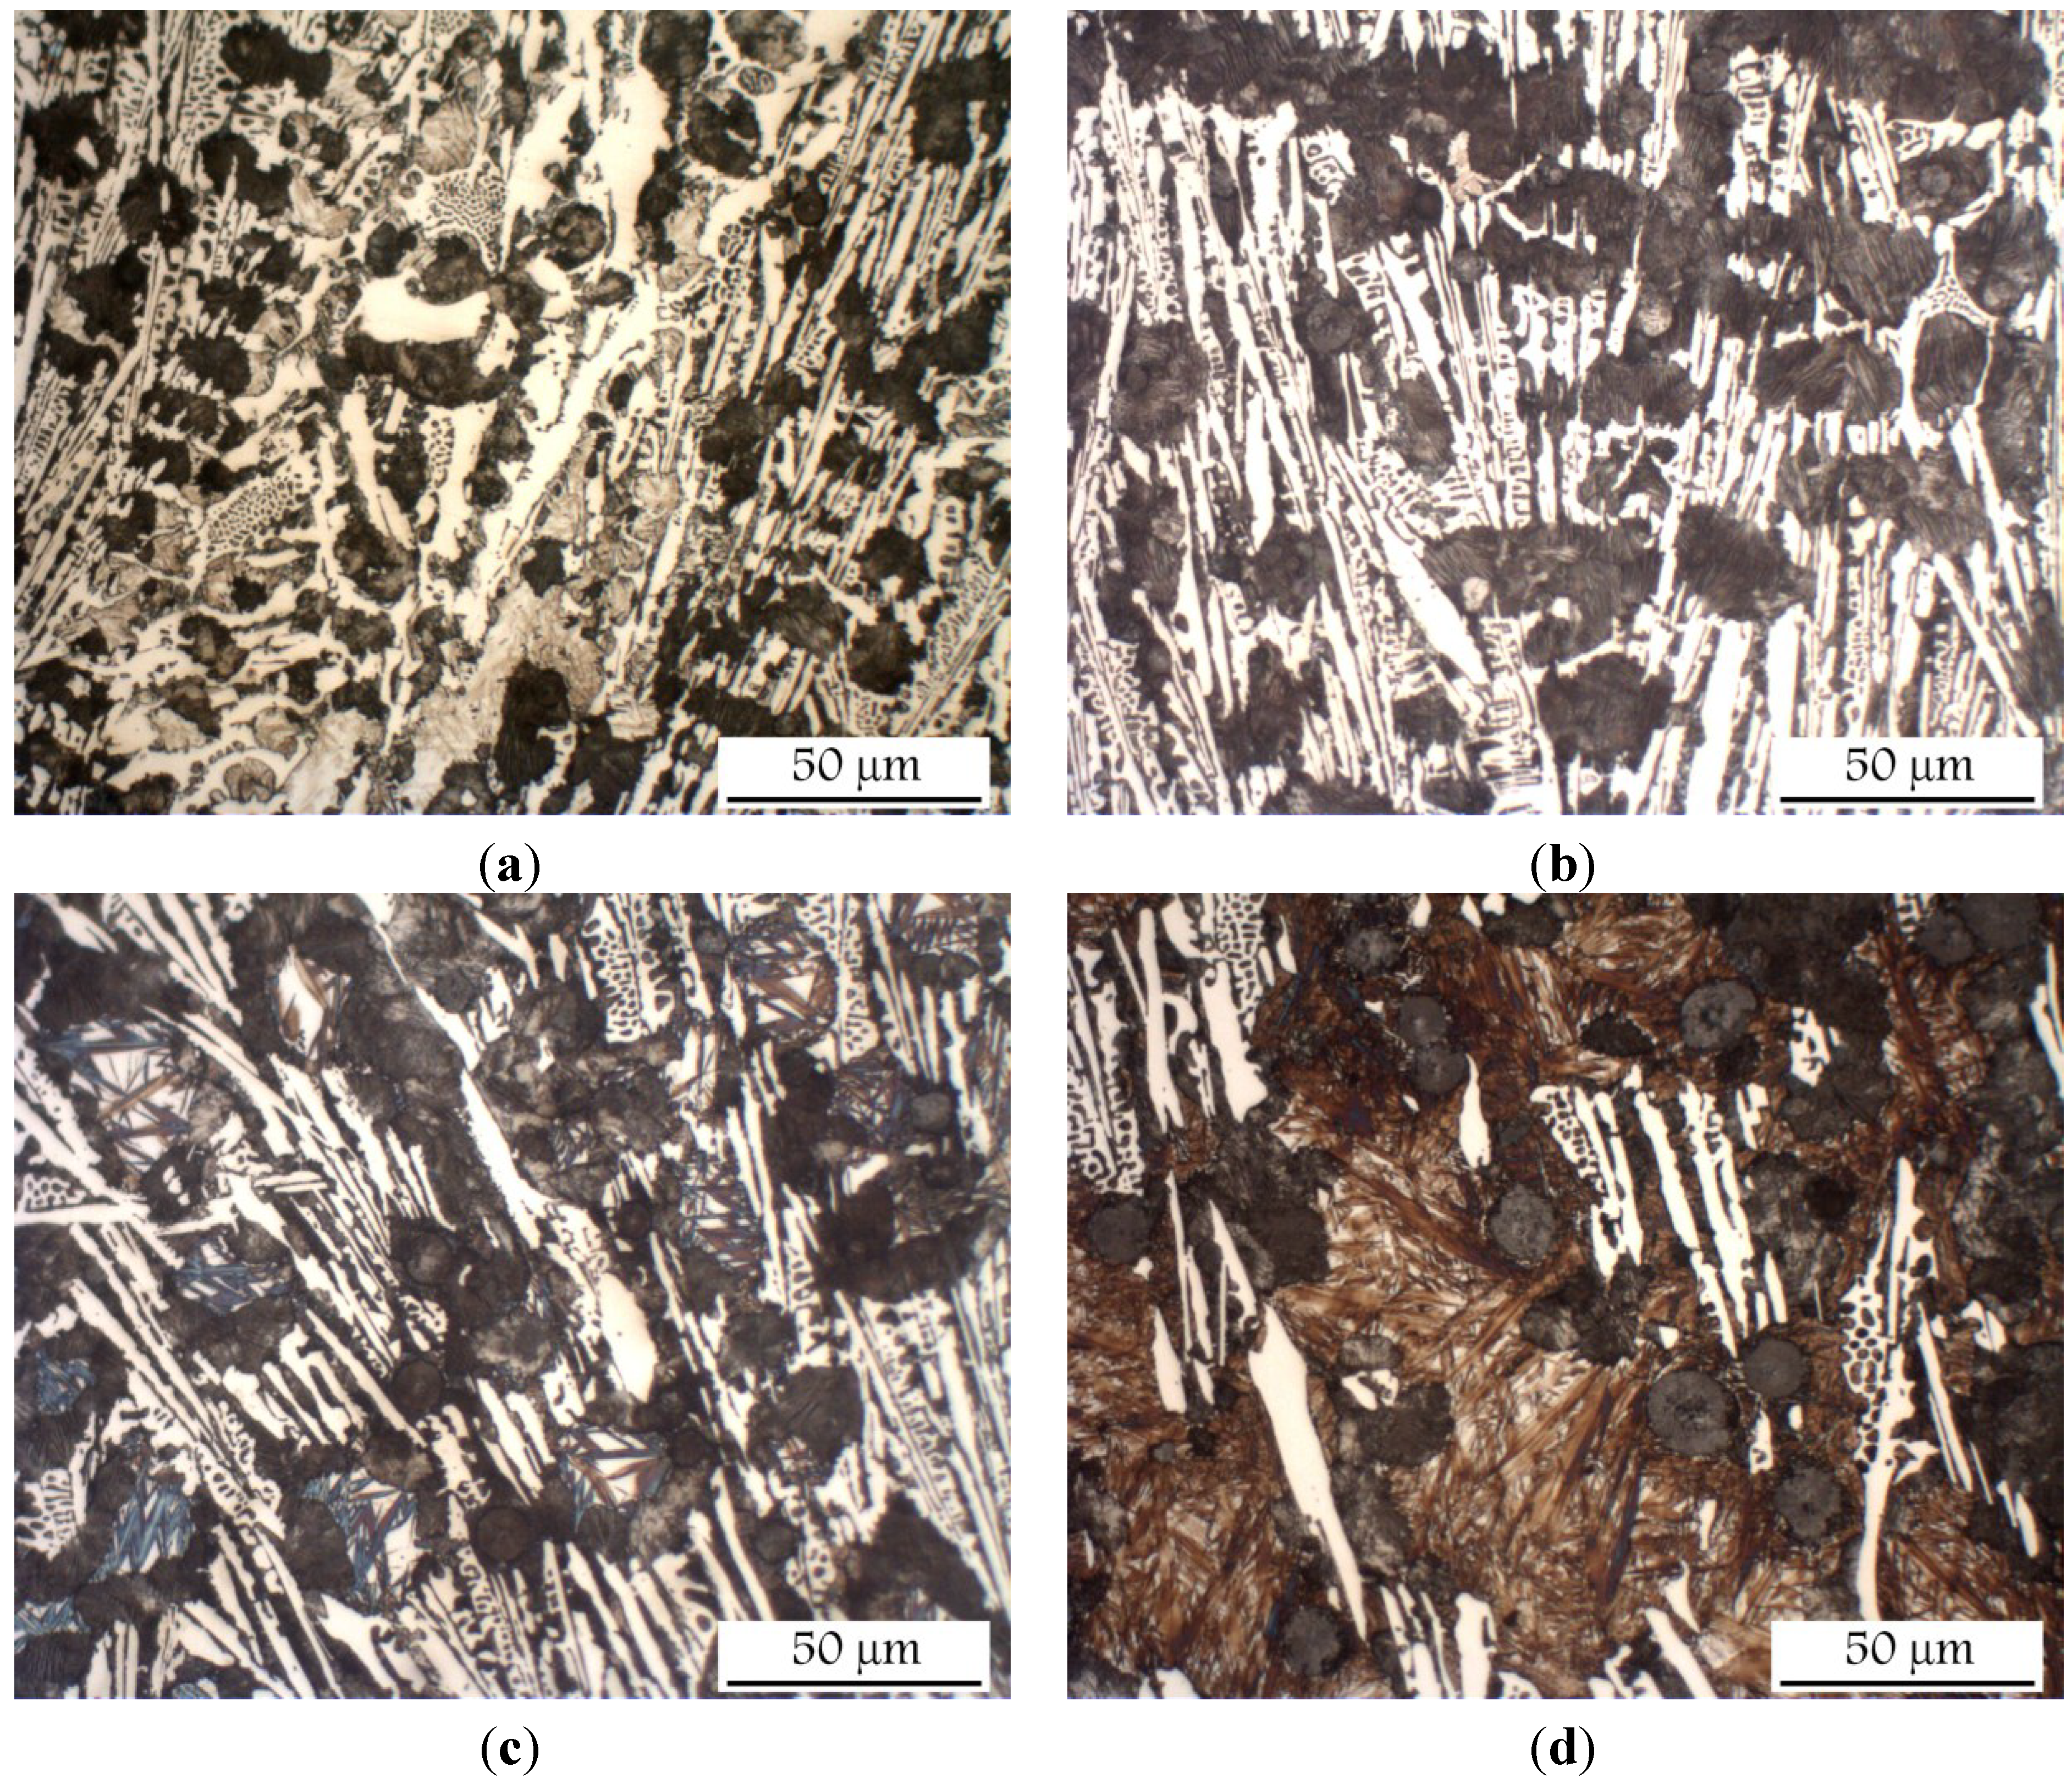
Metallographic analyses on inoculated A samples show dendrites growing from the liquid while graphite nodules precipitate close to the austenite-liquid interface. This observation agrees with the hypo-eutectic solidification model showed in
Figure 2. In the case of inoculated B alloy, solidification starts with the graphite nodules surrounded by small austenite shells together with some isolated dendrites that also exhibit some nodules in contact with them. These last characteristics are usually found in ductile cast irons with a near eutectic solidification [
7].
Figure 4.
Solid fraction evolution of A1 samples. (a) A11 Sample; (b) A12 Sample; (c) A13 Sample; (d) A14 Sample.
When comparing A and B alloys higher f
S and graphite area fraction (f
GA) values are observed in the later one than in the first one. This result is more evident in case of the more sensitive fields to quenching process,
i.e. #10 to #12. This behaviour, besides to higher carbon content, must be mainly related to the higher ability to precipitate graphite directly from the liquid in the B alloy which might increase additionally the corresponding austenite precipitation in contact with graphite. Although the non inoculated alloys have shown a similar behaviour to the inoculated ones regarding the effect of CE, inoculation seems to affect more the number of precipitating sites than to f
S evolution in the sample fields (
Figure 6). It can be observed in this figure that inoculation promotes high nodule counts at the very beginning of the eutectic reaction, which confirms the differences observed in their respective cooling curves.
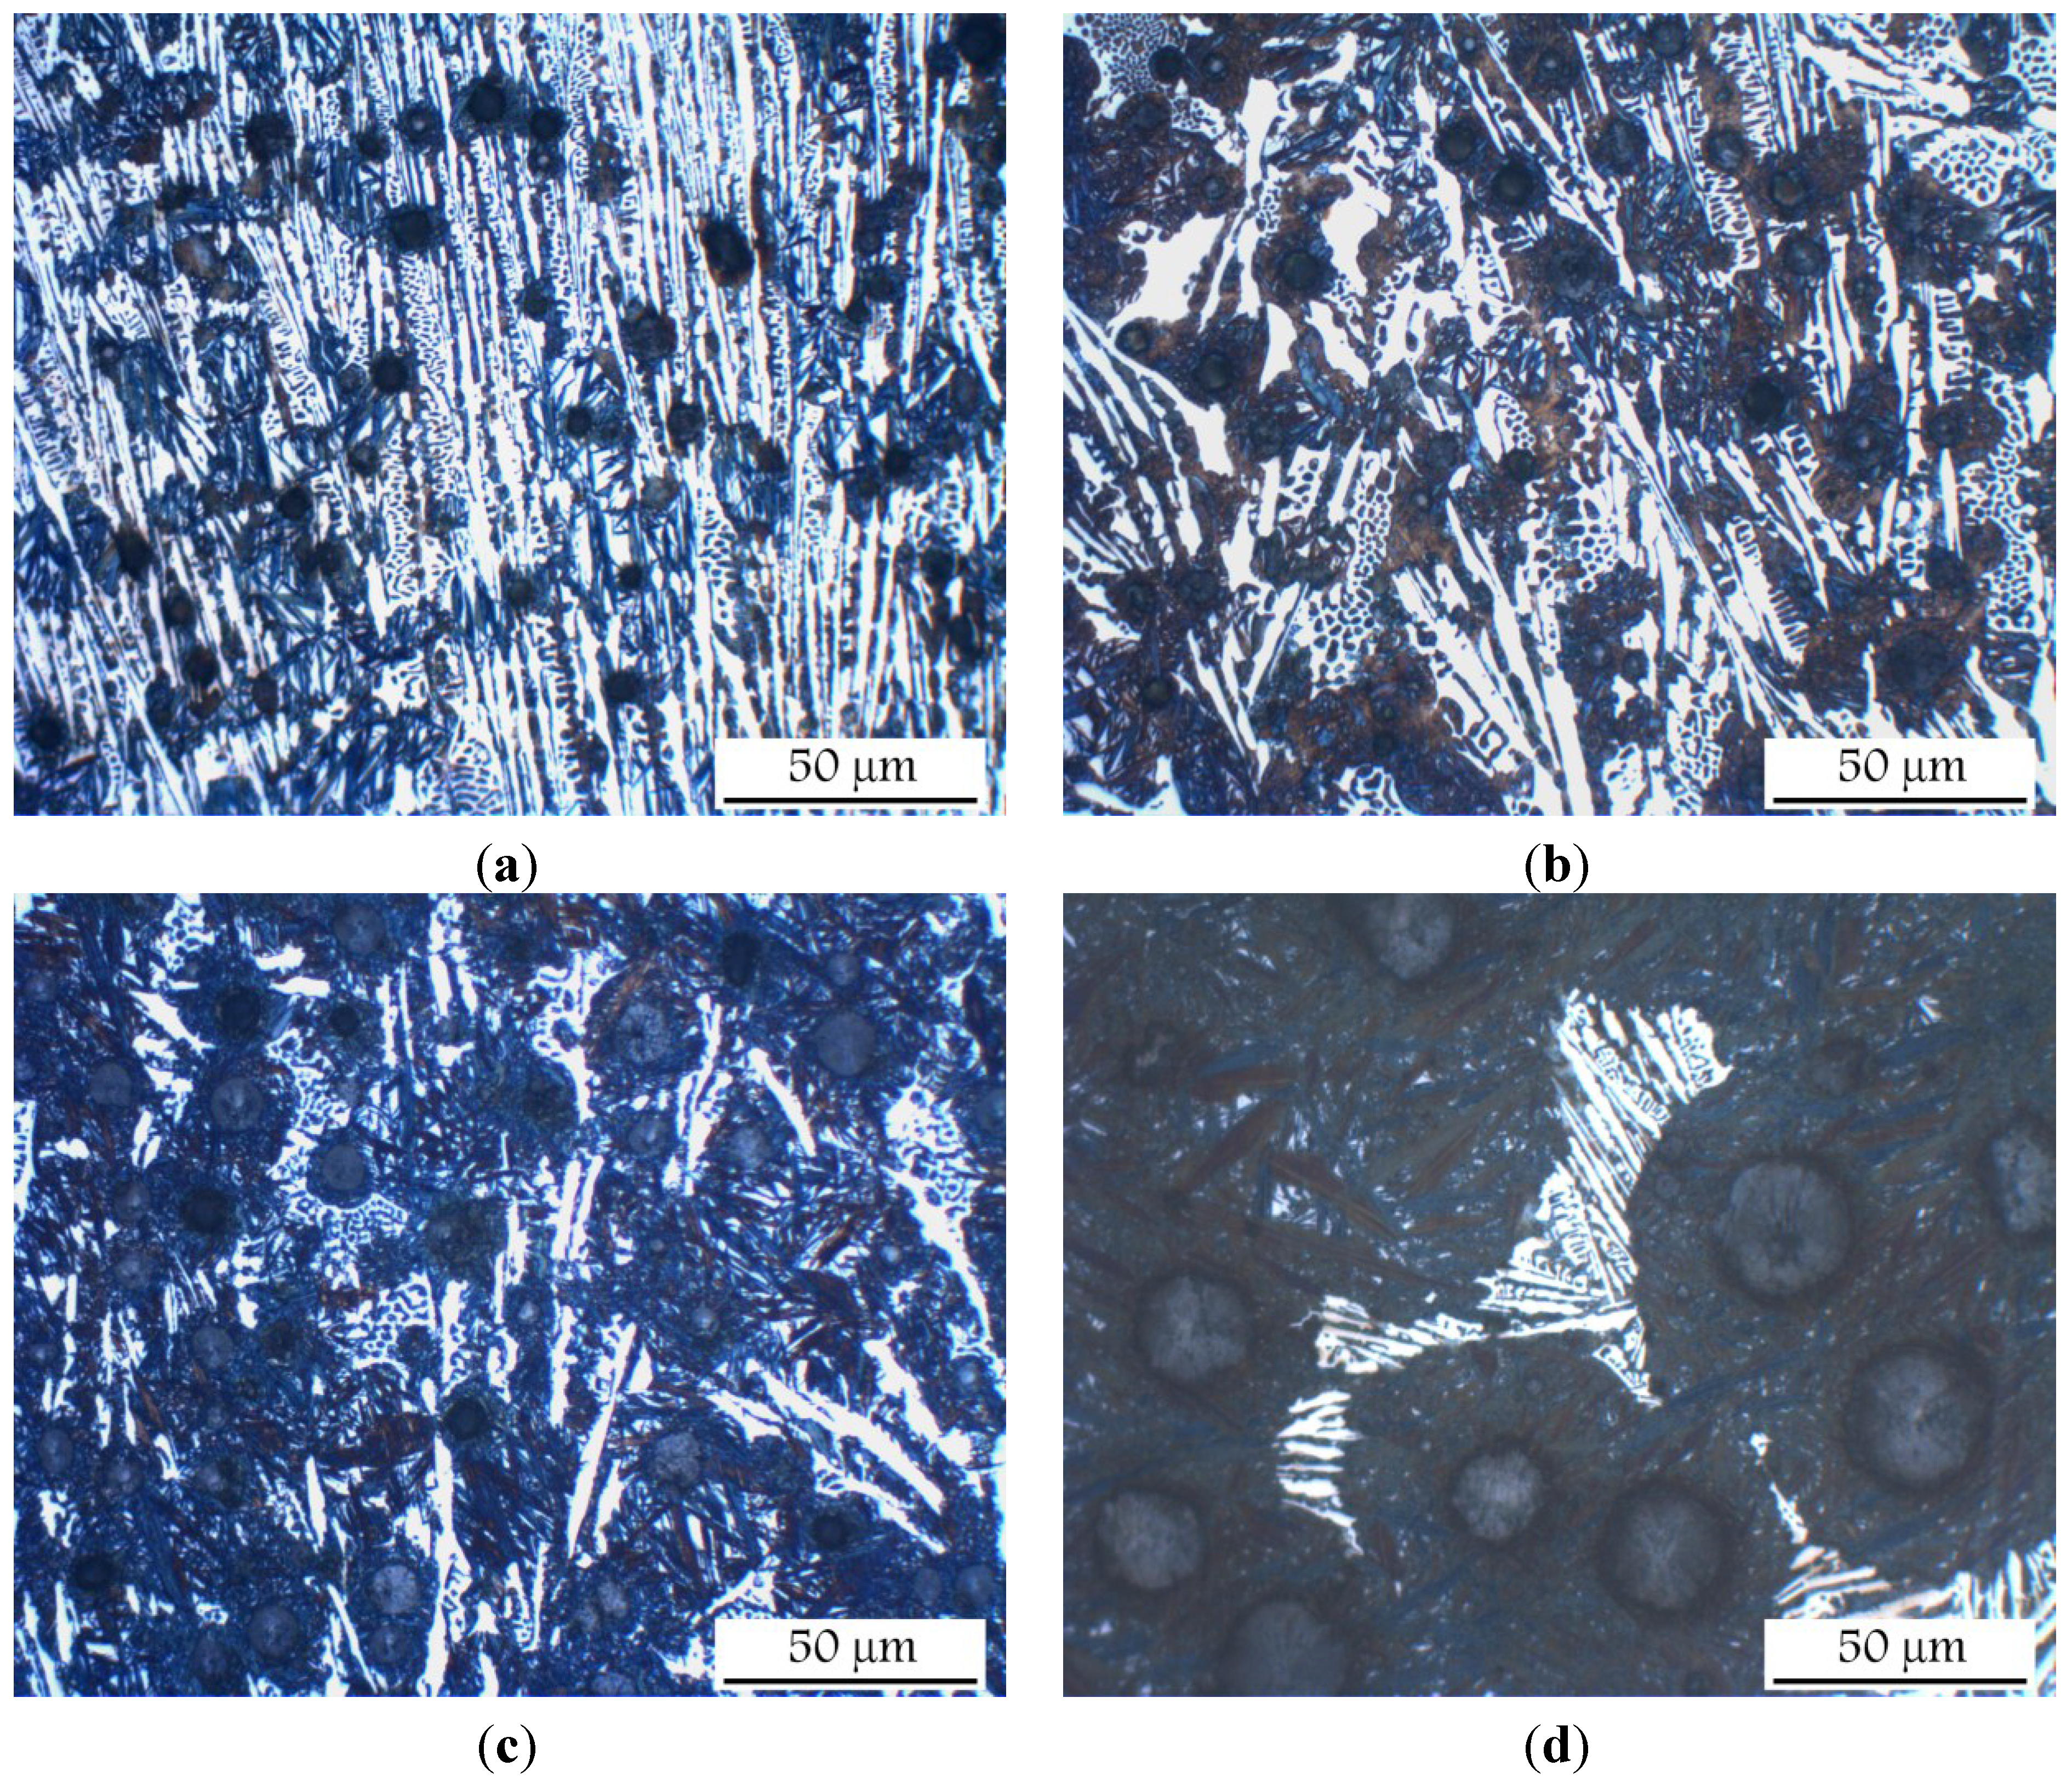
Figure 5.
Solid fraction evolution of B1 samples. (a) B11 Sample; (b) B12 Sample; (c) B13 Sample; (d) B14 Sample.
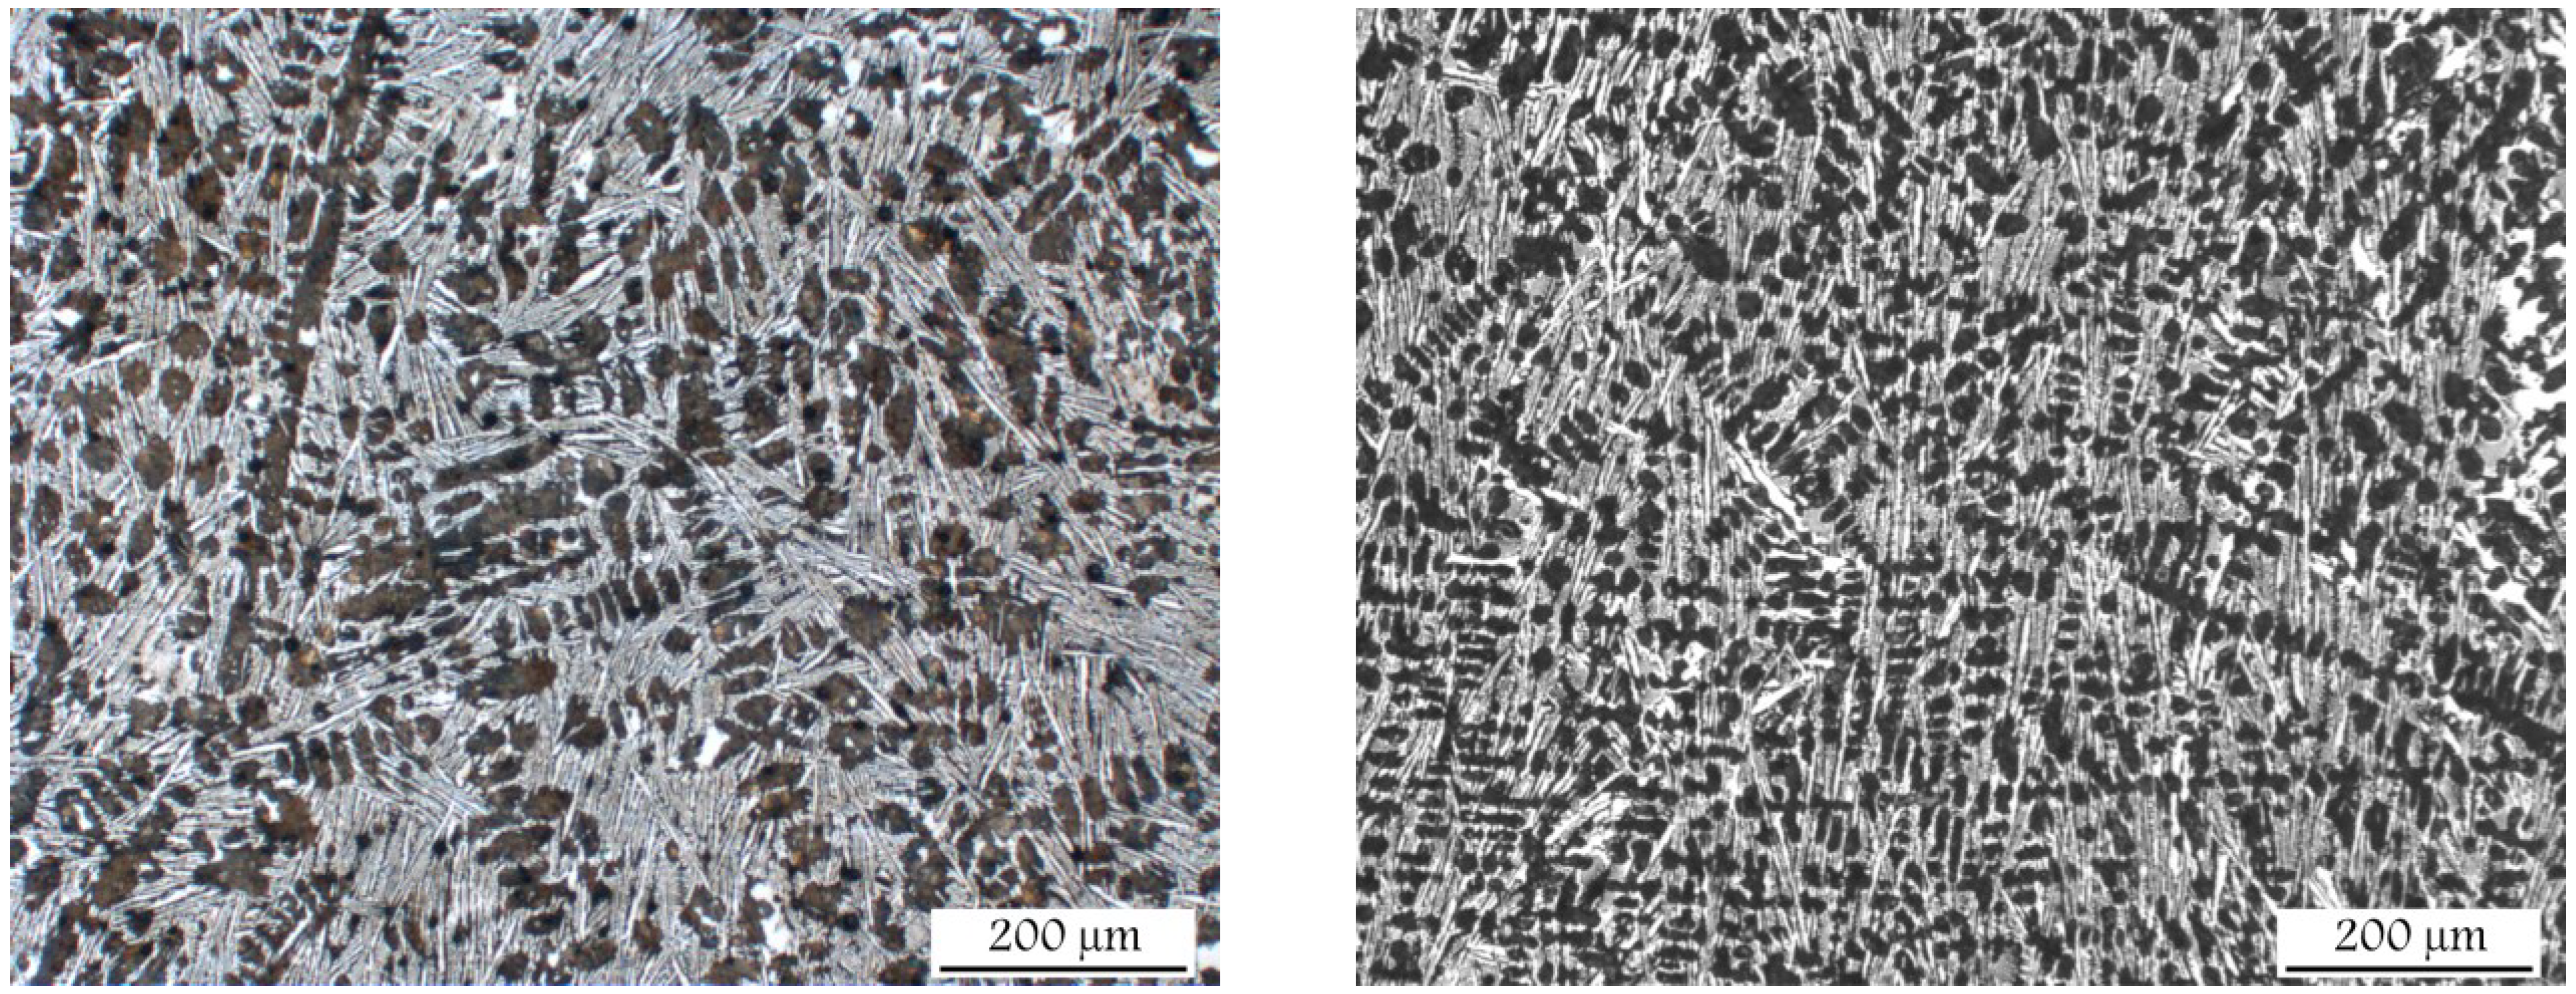
Figure 6.
Coarser structure of A alloy in non-inoculated sample (left); compared to the inoculated one (right) for similar solid fraction (0.53 and 0.49 respectively).
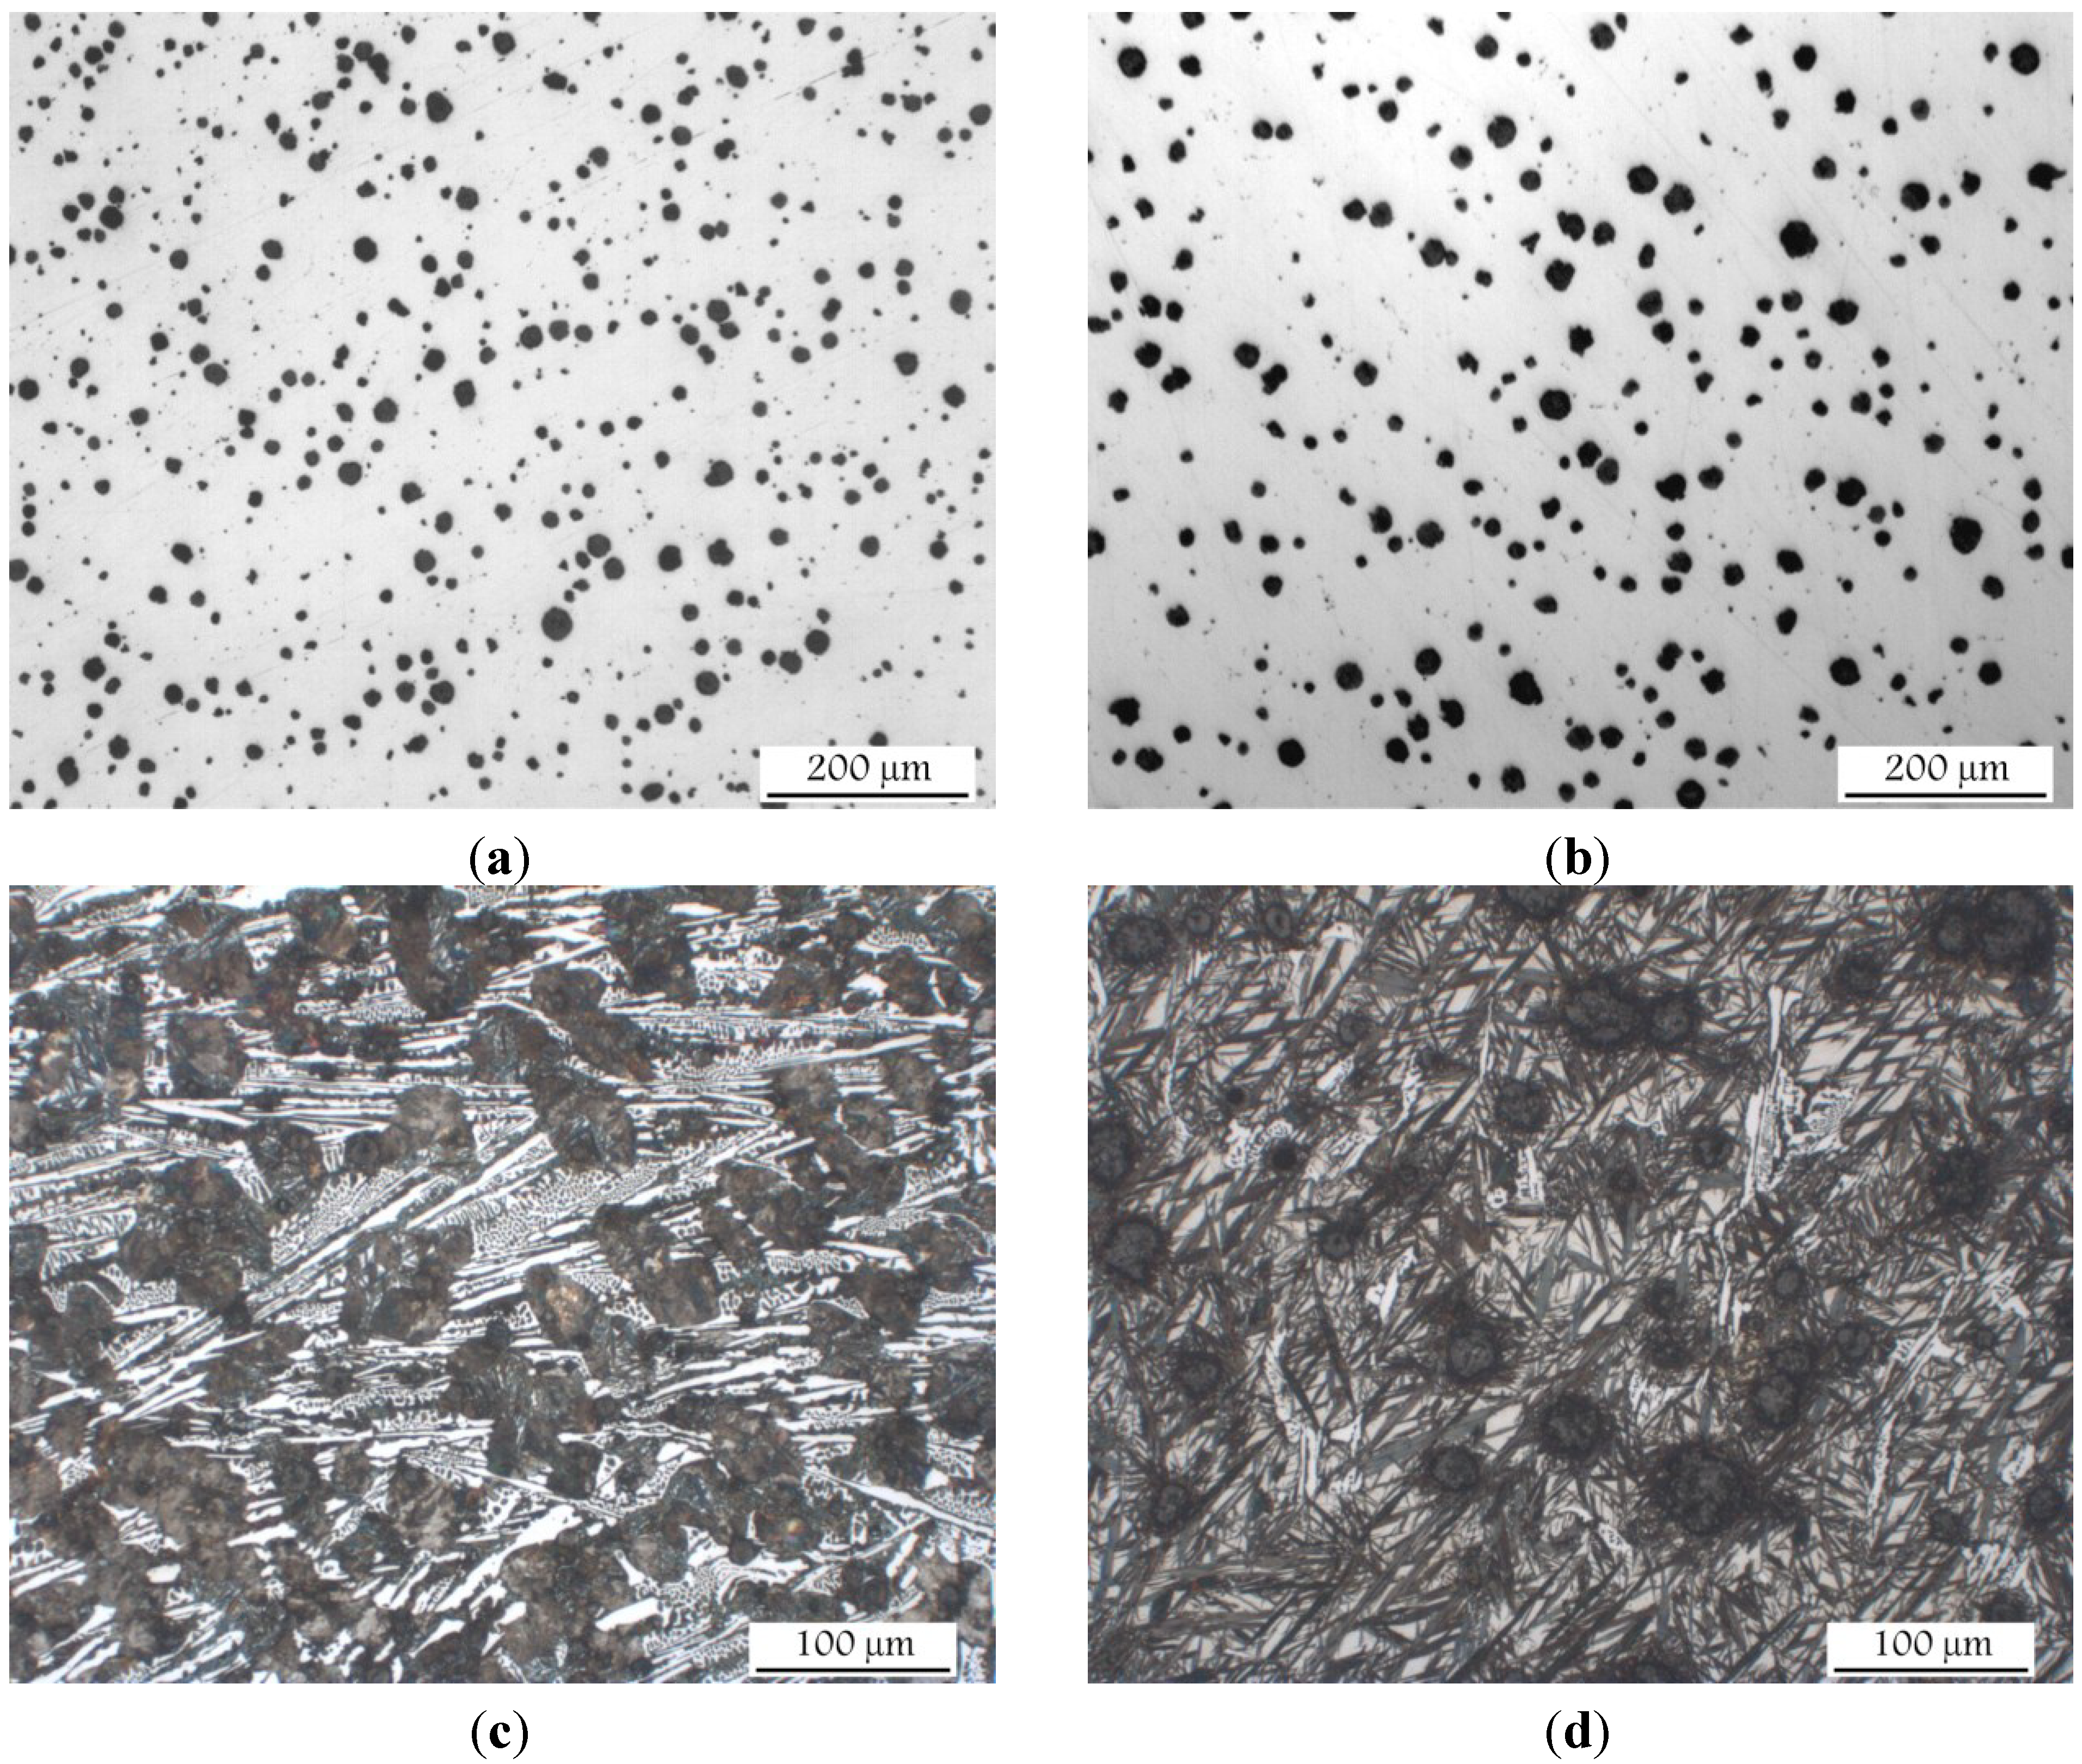
Surprisingly f
GA values found during solidification of the non-inoculated samples are even higher than those detected on the inoculated ones. This observation can be a consequence of the different conception between the number of graphite nodules and their size,
i.e., a specific f
GA value can be obtained from both a big number of small nodules and/or from a low amount of big ones.
Figure 7 shows an example of such a possibility for two different samples analyzed in the present work. However the graphite area fraction values at the end of solidification become slightly lower in the non-inoculated samples than in the inoculated ones. This result is related to lower nodule count, which enlarges the distances that carbon has to go through by diffusion. Thus a less overall final precipitated graphite amount and a more carbon saturated austenite are obtained for the same solidification time. This effect agrees with the common observation where non-inoculated samples show a higher tendency to shrinkage defect and carbide appearance than inoculated ones for a given composition. Further discussion on this issue will be approached in Chapter 3.3 when studying the nodule count evolution during solidification of the prepared alloys.
Figure 7.
Different fields for different samples with the same fGA value (6.1%). (a) Field #5 of A11 sample. N = 527 mm−2; (b) Field #2 of A23 sample. N = 218 mm−2; (c) Field #5 of A11 sample. fS = 0.44; (d) Field #2 of A23 sample. fS = 0.90.
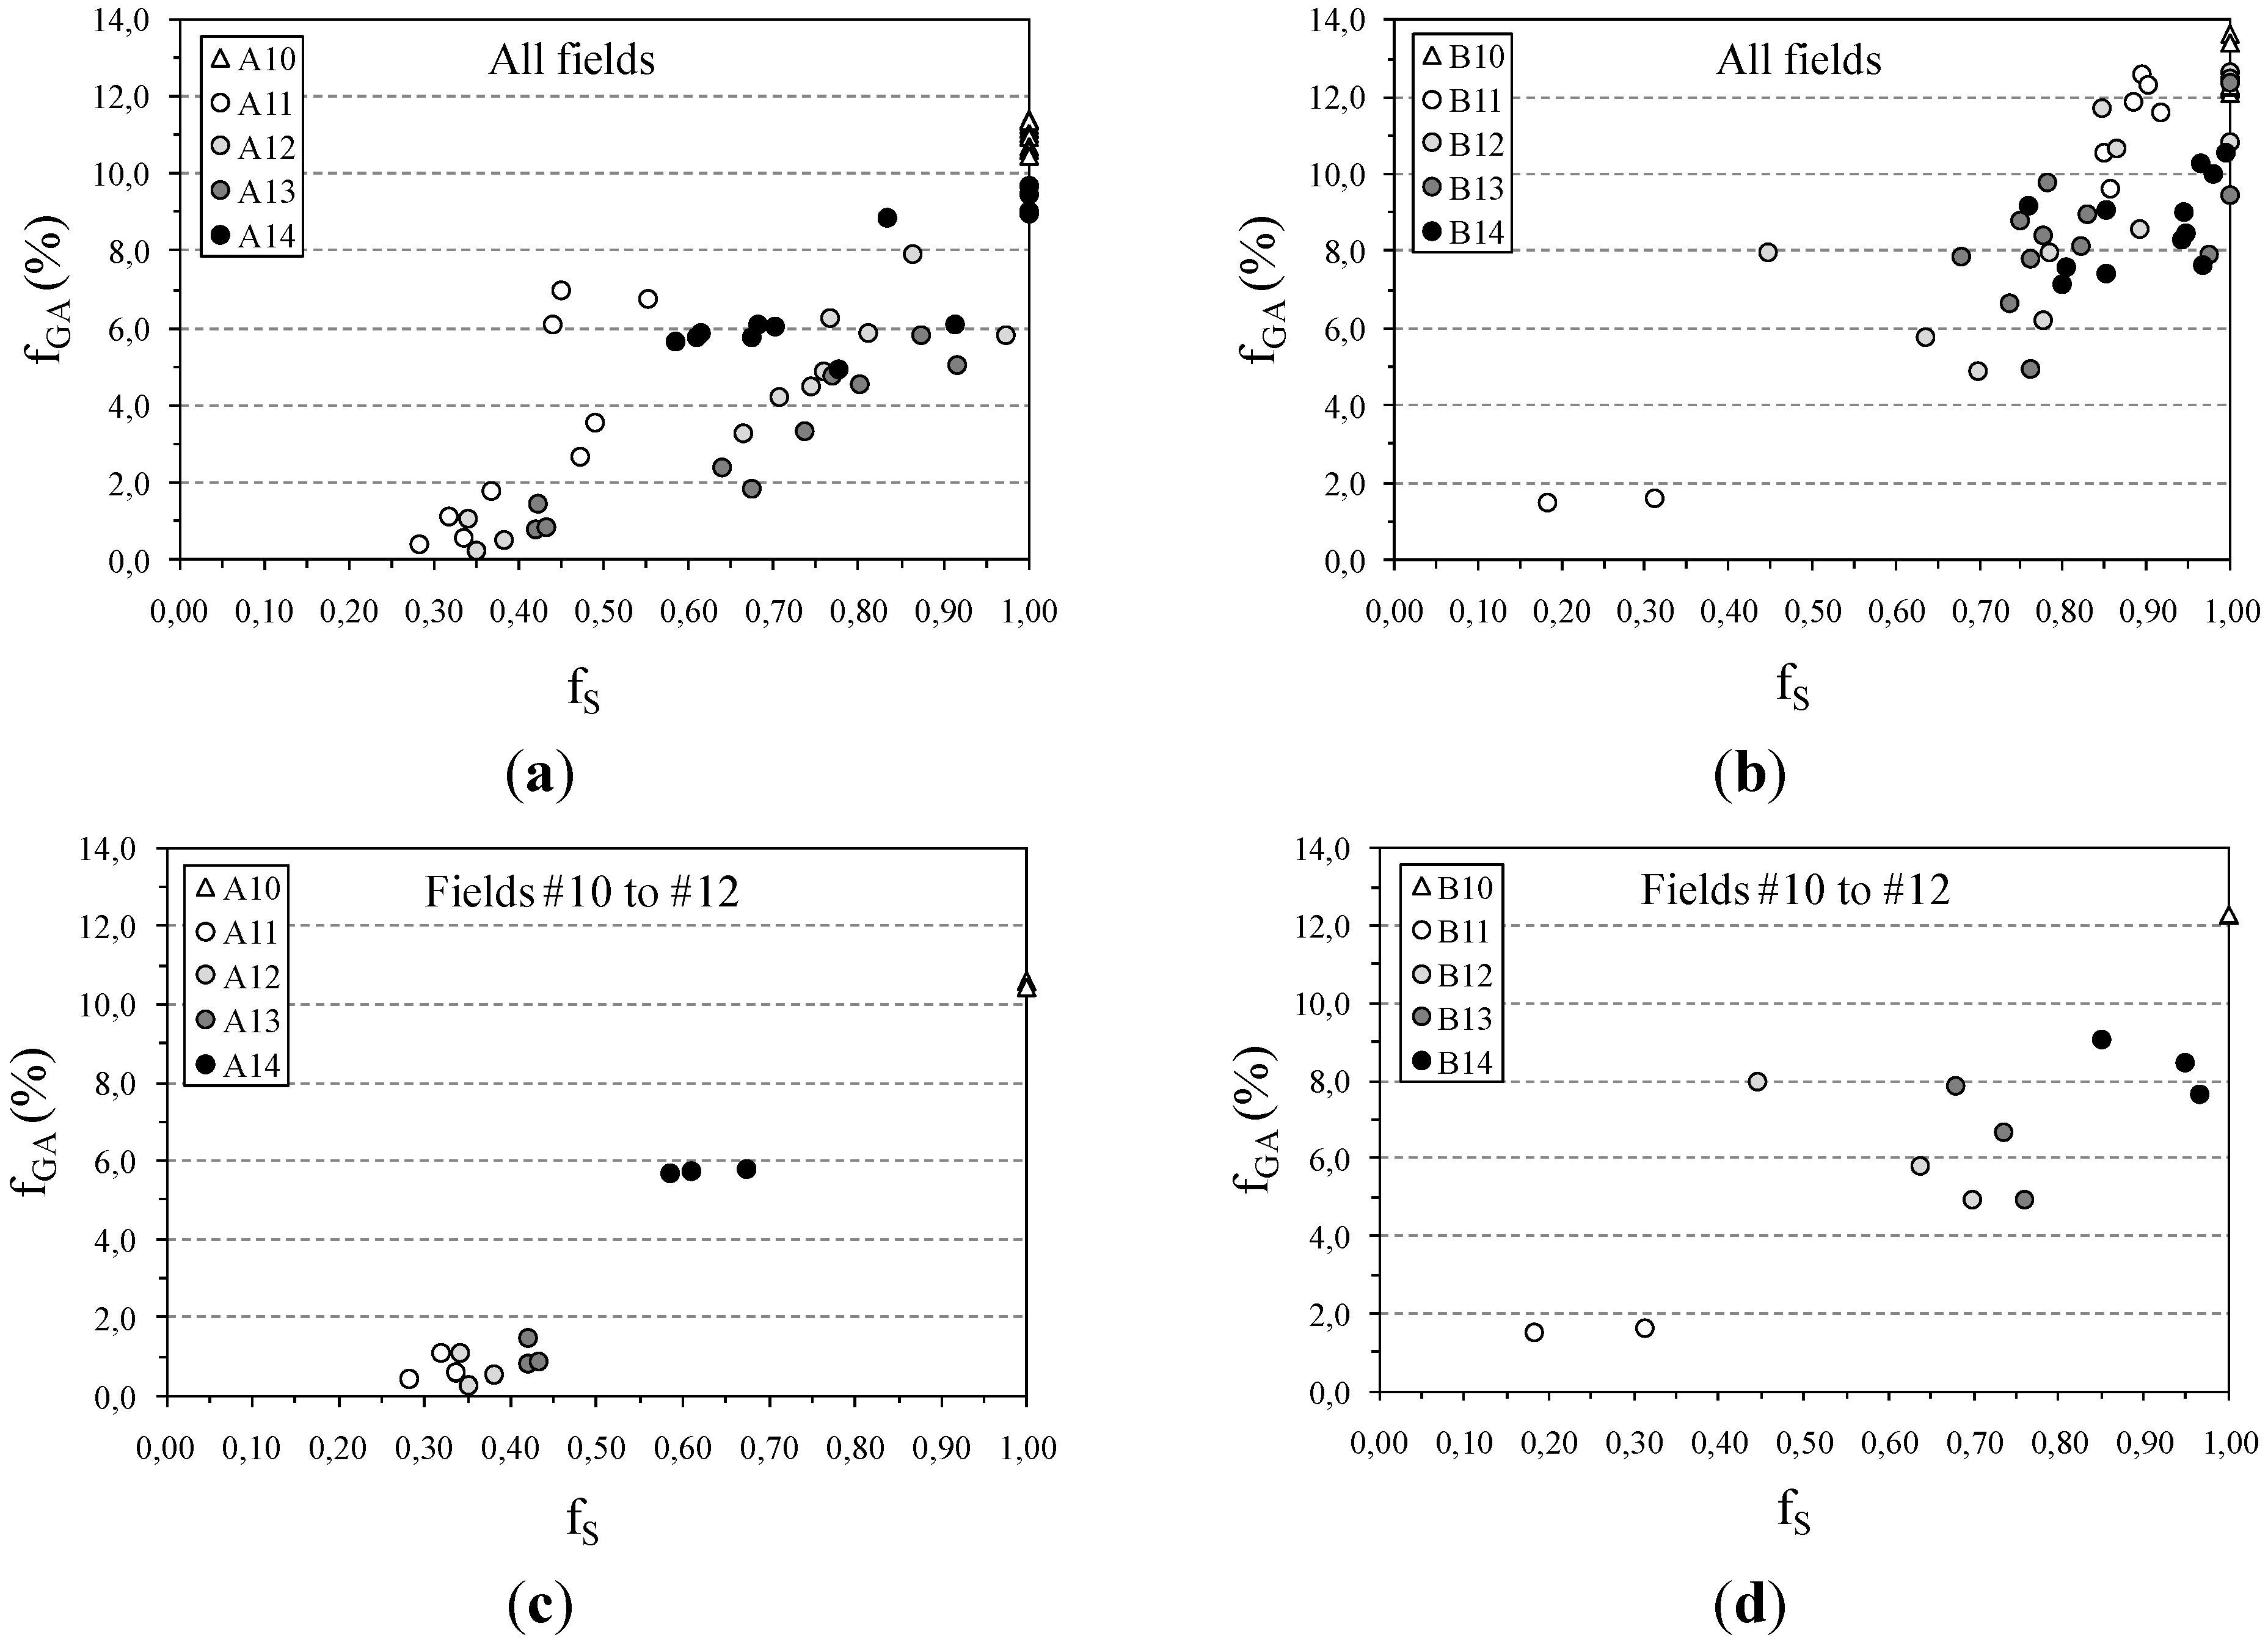
Figure 8 illustrates the correlation between f
S and f
GA for the two inoculated ductile iron alloys. As expected [
6] this last parameter increases when solidification progresses (represented here by the means of f
S). Scattering of data in the two graphs situated in the top level of
Figure 8 is high likely due to the different quenching degrees present in each field. Therefore only the most sensitive fields,
i.e., #10 to #12, were selected for plotting the same correlation (bottom level of
Figure 8). This fact is effective for the A alloy samples but it is only partially useful for the B alloy ones probably due to the high graphite nucleation ability present in the latter that stresses the quenching variability. This effect is also supported by the low scattering found in the A2 samples (all metallographic fields considered) when compared to the A1 samples.
Again composition effect on f
GA is observed here as B alloy samples lead to the highest values of this parameter (right side of
Figure 8). Additionally this increment of the graphite area fraction appears during the whole solidification period and interestingly the primary graphite areas start to form at early f
S values for the A alloy case. Thus early graphite nucleation should be expected when increasing CE in ductile iron alloys which must be found when analyzing the nodule count evolution during solidification (see Chapter 3.3). Once again f
GA evolution during solidification of the non-inoculated samples can be estimated as comparable to the inoculated ones but with lower scattering.
Figure 8.
fS vs. fGA correlations for the two inoculated cast irons. (a) all fields for A1 series; (b) all fields for B1 series; (c) Fields #10 to #12 for A1 series; (d) Fields #10 to #12 for B1 series.
3.3. Nodule Count Evolution during Solidification
Basically, it seems to be worthwhile here to determine comparatively the constituents present in the most sensitive fields when quenching (#10 to #12) where f
S values are the lowest.
Table 3 shows the f
S, f
GA, and
N average values distributed by size. B21 is not considered due to pearlite appearance as mentioned above.
Table 3.
Solid fraction and nodule count average values around the liquidus arrest in fields #10 to #12.
| Sample | fS | fGA (%) | N < 0.015 mm (mm−2) |
|---|
| A11 | 0.31 | 0.7 | 146 |
| A21 | 0.33 | 0.8 | 163 |
| B11 | 0.25 | 1.6 | 344 |
As expected in this early step of solidification both intermediate- and big-sized graphite nodules were not found. Thus the f
GA values included in
Table 3 only correspond to the small range of nodules. The comparative analysis of data shows the composition effect on the liquidus reaction,
i.e., both f
GA and
N are much higher for the B11 sample than for the A11 one (both alloys are inoculated) even though f
S is higher in the last case than in the former one. Thus graphite nucleation is strongly favored by increasing CE.
However a comparison between A11 and A21 samples leads to the idea that the inoculation effect is not the expected one at the beginning of the solidification. Data obtained from the most sensitive part of these two samples indicate that quite similar f
GA and
N values are obtained when adding inoculant to the A alloy. This result is different to the effect found in a previous work [
7] where a near eutectic ductile iron alloy increased the nodule count (from 40–67 mm
−2) at the beginning of the liquidus arrest (f
S = 0.06) when adding inoculant. A possible reason for this lack of agreement could be the quite lower Te
min value of such non inoculated alloy (1133.3 °C) in contrast to alloy A2 (1140.9 °C) as this parameter has been successfully related to the graphite nucleation potential of solidifying melts [
2]. Unfortunately the B21 sample was discarded in this work so this item will now be a subject for further investigations.
Quenching variability on the different fields of samples was studied in the previous chapters so it is interesting to approach a similar analysis here. Apart from the graphite nucleation potential exhibited by melts, nodule count is affected by cooling conditions. Thus N parameter can be increased by accelerating the cooling process. However it will become very low if the cooling rate is too fast as in quenching experiments. In spite of admitting that some nucleation and growth may occur due to the quenching method, it must be taken into account that the time for this to happen is limited, so the final graphite amount is the sum of both effects. In any case, the obtained results should be considered as comparable in order to determine the effect of the chemical composition and inoculation process.
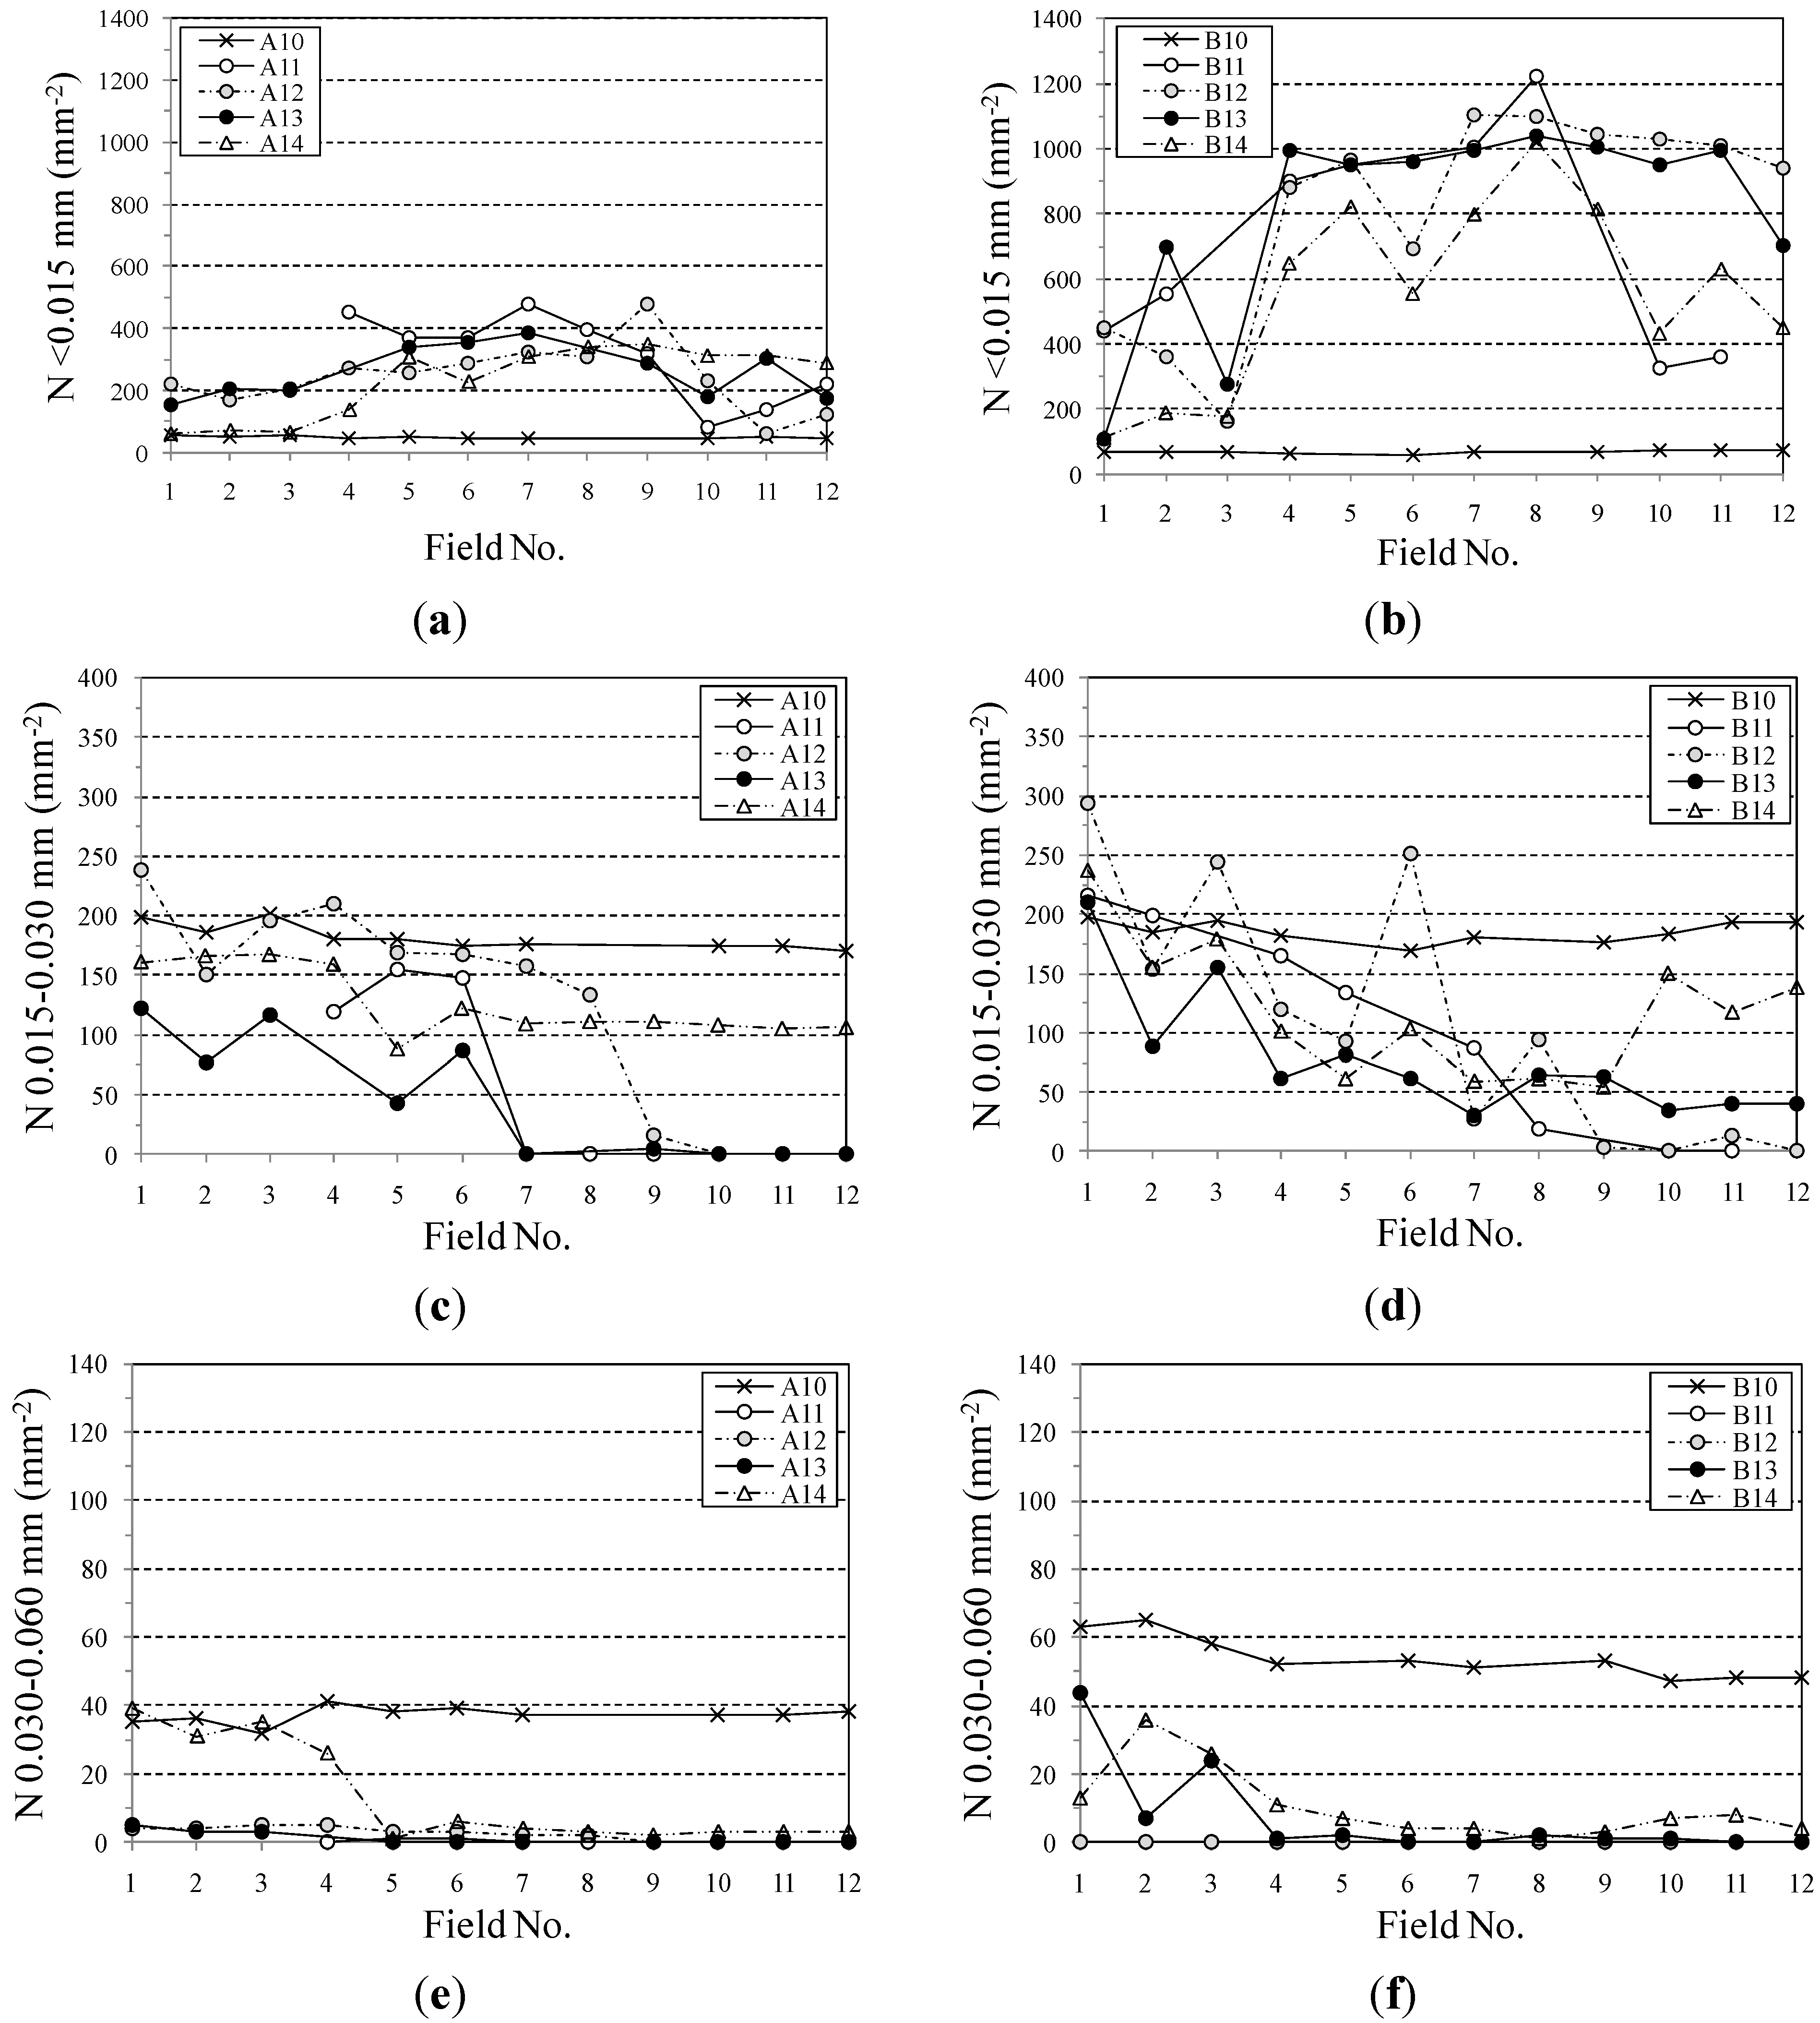
It was observed in this work that the distribution of nodule count strongly depends on nodule size. A comparison between the three different nodule sizes found in this work is illustrated in
Figure 9 where the two inoculated ductile iron alloys only are included. Thus the central fields (#4 to #9) contain the highest small nodule count during solidification while the bottom part of the samples (fields #1 to #3) shows the highest amount of nodules 0.015–0.030 mm and 0.030–0.060 mm in size. Note also that
N values at the end of solidification are quite low for the smallest size (50–60 mm
−2) while they almost achieve the maximum value of the two other big sizes.
Figure 9.
Nodule count distribution in all fields for the inoculated samples. (a) Nodule count for the smallest nodule size (<0.015 mm) of A1 series; (b) Nodule count for the smallest nodule size (<0.015 mm) of B1 series; (c) Nodule count for the nodule size 0.015–0.030 mm of A1 series; (d) Nodule count for the nodule size 0.015–0.030 mm of B1 series; (e) Nodule count for the nodule size 0.030–0.060 mm of A1 series; (f) Nodule count for the nodule size 0.030–0.060 mm of B1 series.
When avoiding inoculation on samples included in
Figure 9, nodule count values during solidification become significantly lower than in the inoculated samples. However the affected fields and the shape of such distributions are quite similar to the inoculated cases. After completing the solidification period the non-inoculated samples also show a very low nodule count for the smallest nodule size (similar to the one detected for the inoculated samples) but
N is significantly lower for the two other sizes when compared to the corresponding inoculated samples.
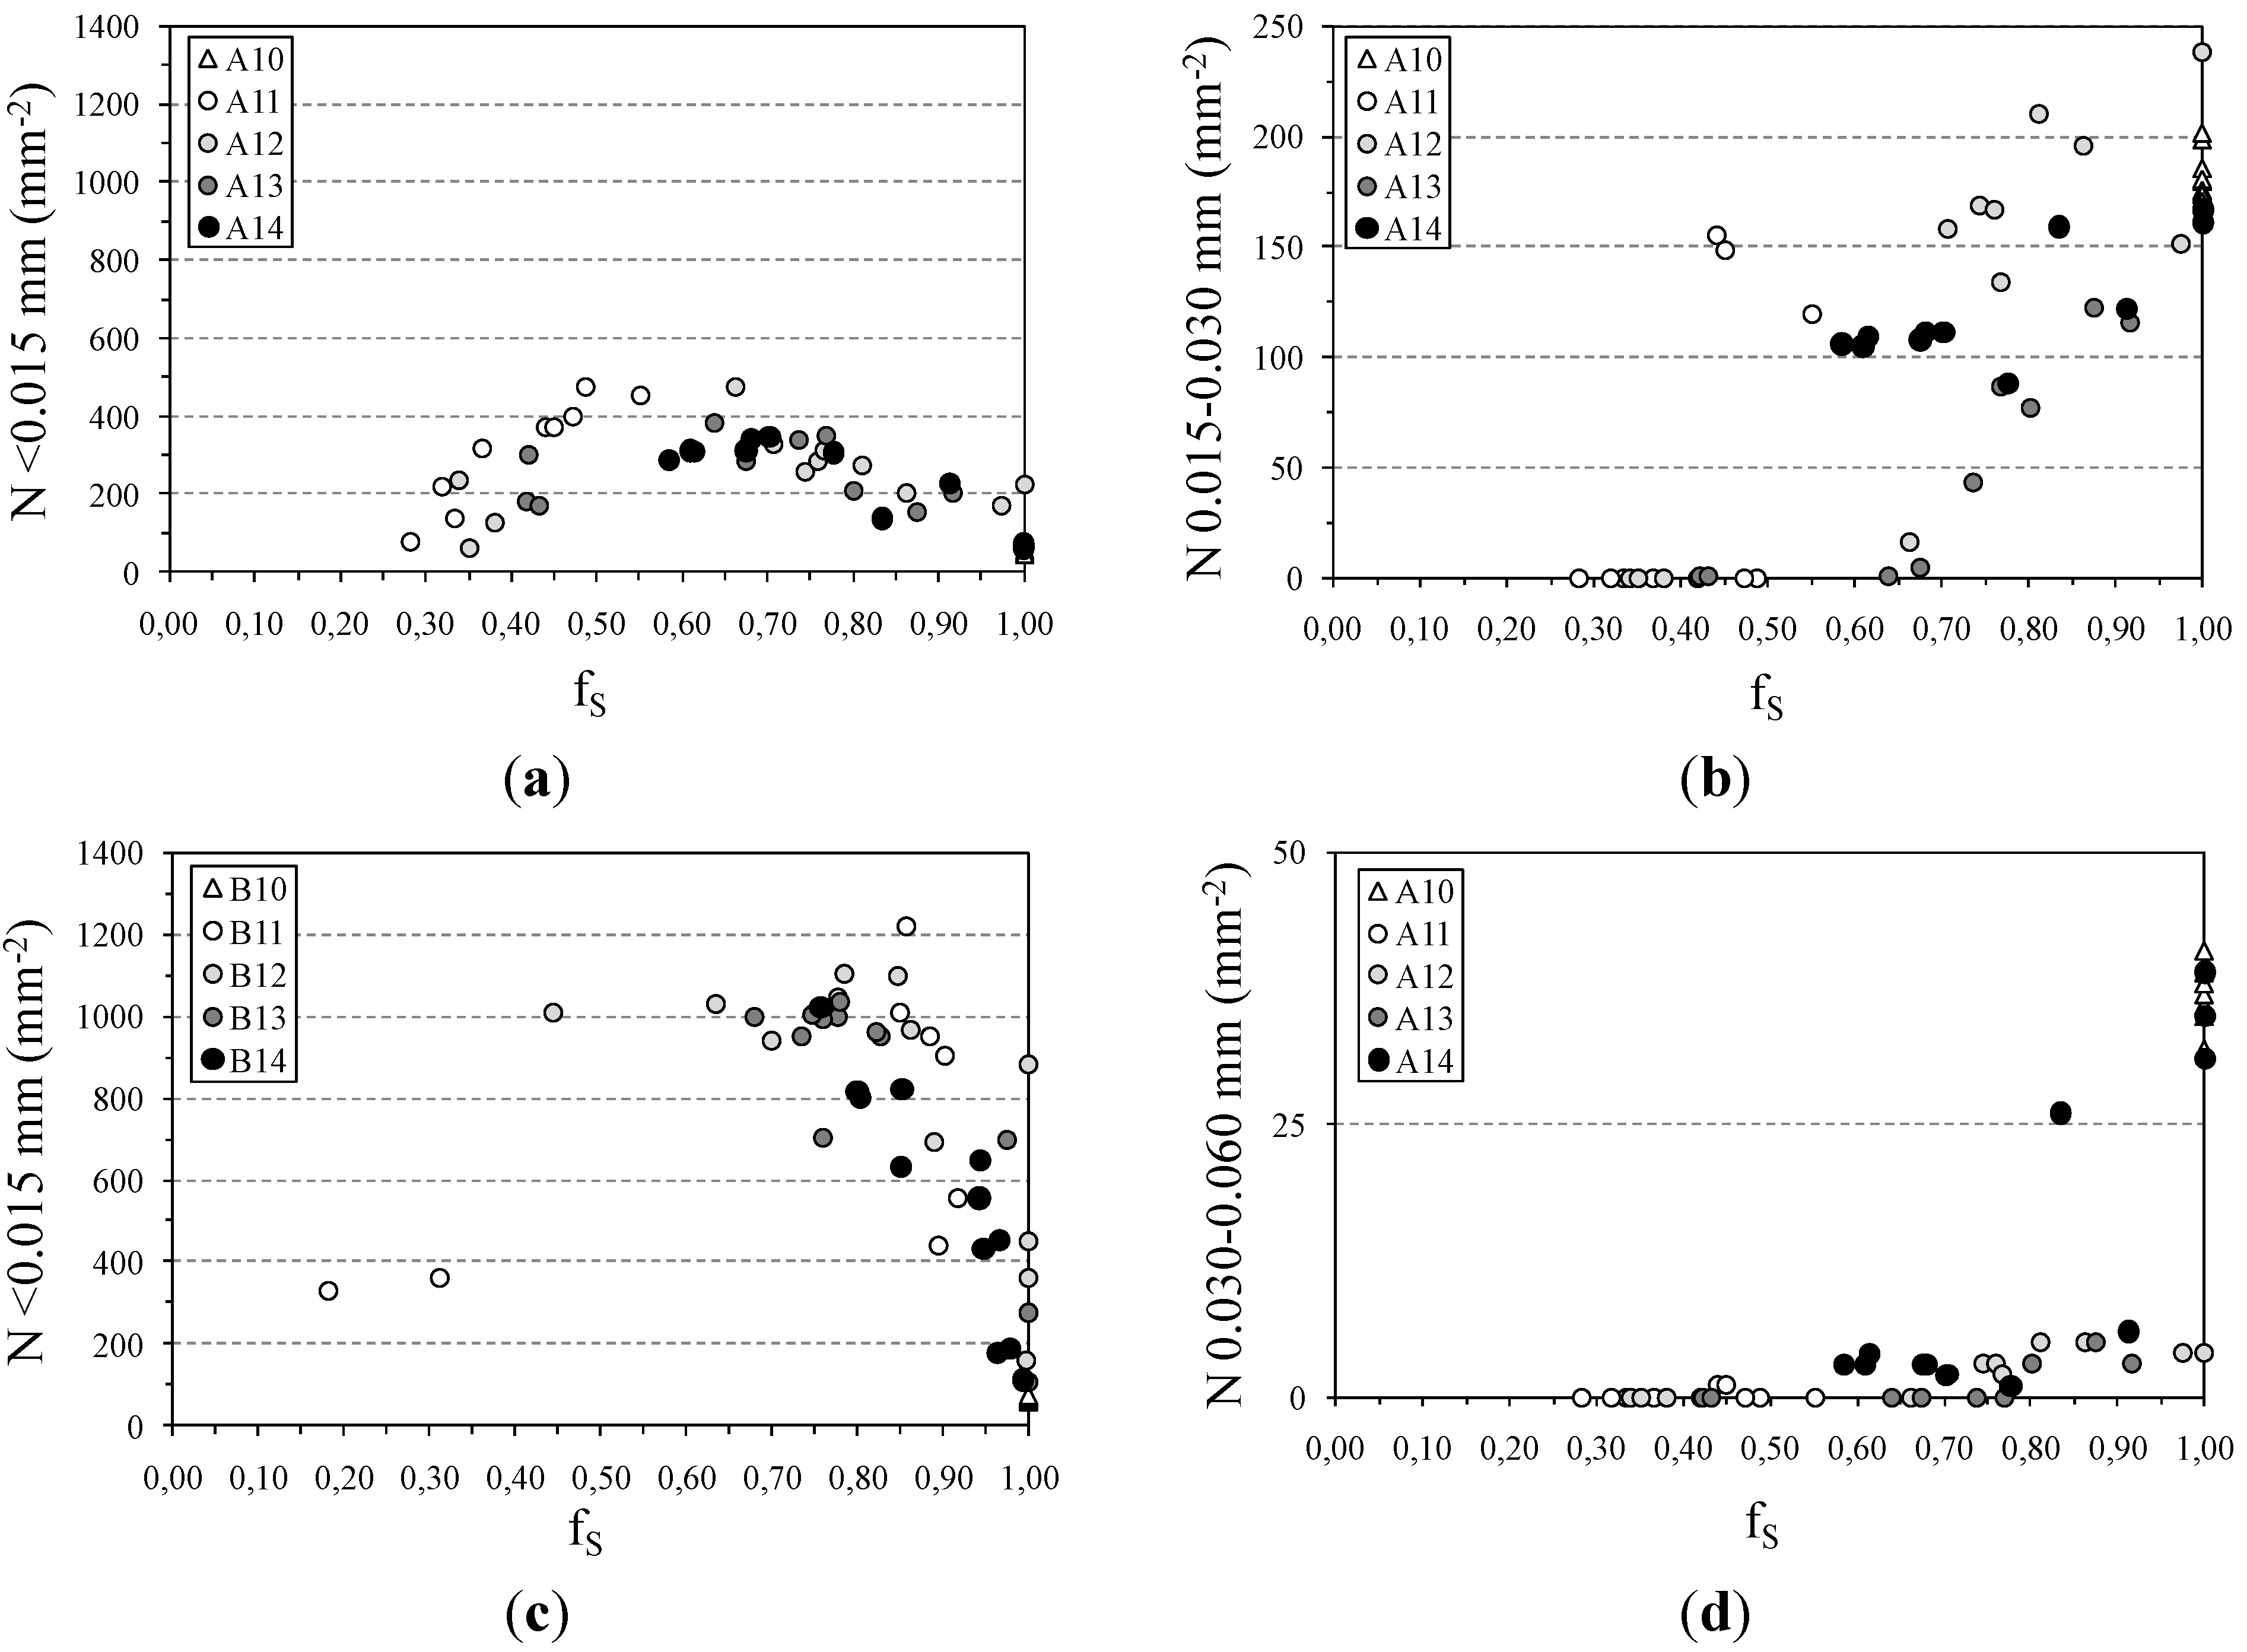
In order to see the evolution of the different nodule sizes during the solidification in a more proper way, it seems to be necessary to include the f
S parameter in this chapter.
Figure 10 illustrates these
N evolutions for both the A1 alloy and the B1 one (only the smallest nodule size distribution has been included in the last alloy for comparison). As it has been previously stated the smallest graphite nodules apparently start to form from the liquid alloy in the very early solidification steps (f
S = 0.05–0.20) as it was previously reported [
6,
8,
12]. Then a maximum
N value is reached in the 0.50–0.70 solid fraction range for the A1 samples while this range becomes 0.50–0.80 for the B1 ones. Finally
N values decrease at the end of liquid-solid transformation. On the other hand the two big nodule sizes show an increasing evolution during the solidification process (see right side plots in
Figure 10) until achieving the maximum
N value at the end of this transformation. Note that
N scales are different in two of the four graphs included in this figure.
Figure 10.
Nodule count evolution during solidification process (all fields are included). (a) Smallest nodule count evolution vs. fs for A1 series; (b) 0.030–0.060 mm nodule count evolution vs. fs for A1 series; (c) Smallest nodule count evolution vs. fs for B1 series; (d) 0.030–0.060 mm nodule count evolution vs. fs for A1 series.
When increasing CE in the alloy it is observed that all
N evolution shapes are comparable to the A alloy case though the nodule count values strongly increase (see the two graphs on the left side of
Figure 10). Note here, that the smallest nodule count also decreases (50–70 mm
−2) at the end of solidification, even for the B alloy samples.
Regarding the inoculation effect on N, no relevant changes on these evolution shapes due to the lack of inoculation have been detected in this study. On the other hand it was confirmed that comparatively minor increments on nodule count values are obtained due to inoculant addition over the whole range of solidification,
i.e., the composition effect becomes the most powerful one. However the weak but clear increase of
N due to inoculation observed here can be more potent in those alloys that exhibit a low graphite nucleation potential before adding an inoculant, as already detected in a previous work [
7]. The most important increment of
N due to inoculation affects the graphite nodules 0.030–0.060 mm in size,
i.e., the biggest ones. These nodules are also called “primary nodules” because they nucleate at the very beginning of the solidification. Therefore it is possible to assume that inoculation promotes the early precipitation of graphite particles. This result should support the unusually high graphite nucleation potential of A2 alloy as being the main cause of the apparent negligible inoculation effect on A21 sample with respect to the A11 one (see
Table 3).
Correlations between N and fGA are similar to those obtained when using the solid fraction as the parameter for analyzing the solidification progression. However scattering of data is high for the first case (especially when analyzing hyper-eutectic samples). This fact should be related to the uncertain balance among fGA, nodule count and the size of nodules as was mentioned in Chapter 3.2.
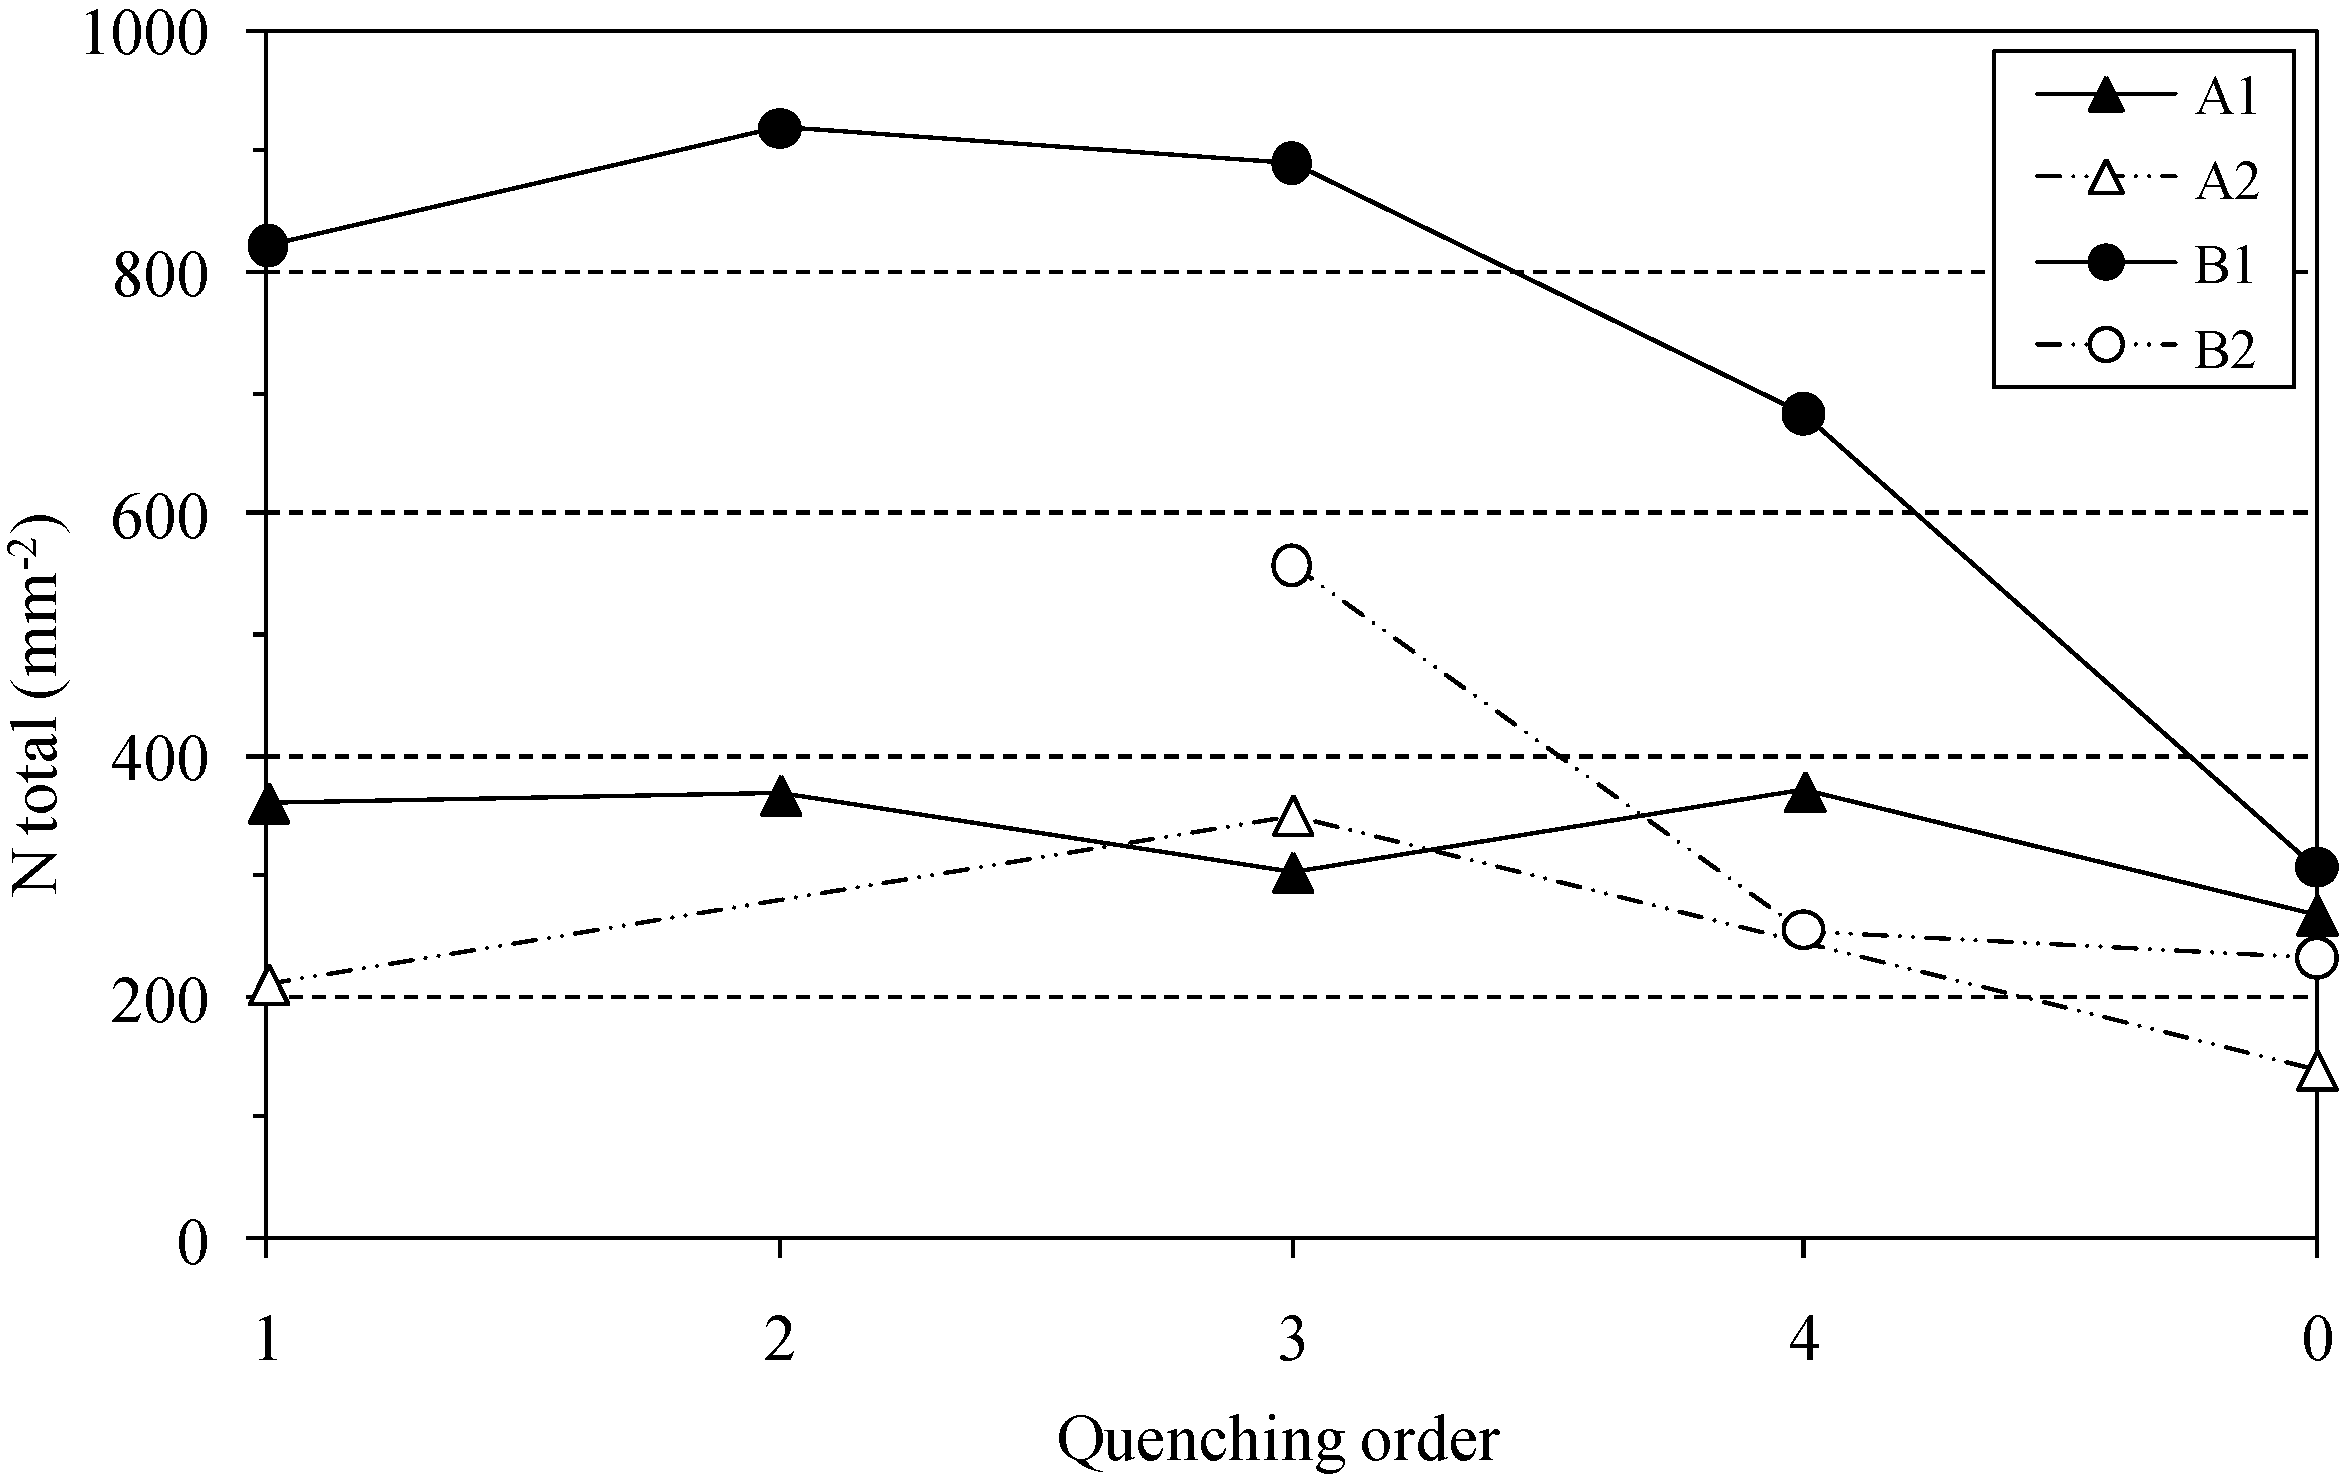
Figure 11 shows the evolution of total nodule count values obtained from the quenched samples and from the non-quenched one for all ductile irons prepared in this work. The downward evolutions found in the two B alloys are a consequence of the observed strong contribution coming from the small-sized graphite nodule evolution during solidification. On the contrary A alloys show much more stable tendencies though they can also be considered as descending ones.
Figure 11.
Total nodule count evolution with all quenched samples.
It has been already stated up to now that an increase of the graphite area fraction at the end of solidification is obtained when increasing the CE content of the alloy (see
Figure 8). However this result has to be combined with two other observed phenomena: an important reduction of the smallest nodule count and an increase of the big-sized nodules. Two different explanations were considered in the present work to tackle this difficulty. One of them pre-supposes that the smallest-sized graphite nodules mainly found in the central areas of samples with maximum nodule count values, detected in f
S = 0.50–0.80, are formed due to the quenching process. Thus these observations must not be found when samples solidify under normal cooling conditions. It is assumed that some undercooling can be expected before freezing the resulting matrix structure due to quenching. Thus the alloy in contact with the quenching media should freeze almost immediately so very low extra undercooling would be expected on it. Thus the former solidified layer makes the heat release from the inner zones more difficult in such a case, slowing down the very high cooling rate expected from quenching, and slightly increasing undercooling before the quenching effect reaches these internal zones. Such phenomena would lead to obtaining sufficient time for small graphite particles to be precipitated. This effect would be more noticeable on increasing the distance from the quenching media and would explain the f
S and nodule count distributions showed in the top level of
Figure 9. According to this explanation, the quenching methodology used in the present study would change the observed solidification development although, at the same time, it would mean that the conditions to form these phases already existed at this particular time.
Another way to explain the small-sized nodule count evolution during solidification is to assume that the quenching process is fully effective although some cooling variability is present in the whole of the samples. Thus a true precipitation of small graphite nodules would occur in the way shown in
Figure 9 and
Figure 10. This fact means that some of the nodules do not achieve the required size that would allow further growth on the nodules, so they become less stable and disappear. According to this assumption, coarse graphite nodules would grow by carbon diffusion, also coming from these small graphite nodules which would be disappearing during the last period of the solidification process. Furthermore, it implies that not every nodule is formed at the very beginning of the solidification but rather nucleation development occurs during all the transitions. The high smallest nodule count values found in the center of the fields of many samples, with a solid fraction in the range 0.70–1.00, could be explained by means of this second postulation.
From a general point of view high CE contents would lead to formation of a huge amount of small-sized graphite nodules. Some of them nucleate and grow from the liquid by carbon atom buildup, meanwhile others grow probably by accepting carbon atoms which come from other nodules by diffusion. Thus these last nodules would progressively disappear and the total nodule count would decrease during solidification until achieving the final value once fS becomes 1.00. Inoculation would show a similar effect to the one described for CE.
Unfortunately neither of these two possible explanations was verified in the present work and therefore will be approached in further investigations. However quenching experiments must be useful for comparing the different results obtained when varying processing parameters as CE and inoculation. Thus the downward trends found in all four alloys (
Figure 11) contrast with some others previously reported in the literature for ductile irons [
7]. In such a work FGE1i denotes a hyper-eutectic and inoculated alloy that showed a similar trend to the one found for B1 alloy (
Figure 11). In the same study the nodule count evolutions for FGE1ni (hyper-eutectic and non-inoculated alloy), FGE2i, and FGE2ni (both near eutectic alloys which are inoculated and non-inoculated respectively) are, however, upward while the opposite trends are found for the B2, A1, and A2 alloys.
These different behaviors mean that another important aspect is acting on
N evolution in addition to CE and inoculation. Once again the graphite nucleation potential of melts should play an important role in this way. In fact the
Te
min values for FGE2i (1144.8 °C) and for FGE2ni (1133.3 °C) alloys are lower than the ones obtained for A1 and A2 (see
Table 2). Thus a high nucleation potential would also increase the obtained number of graphite nodules at the beginning of solidification and tendencies like the ones plotted in
Figure 11 become downward for a given CE and inoculation condition. The authors already correlated this aspect with
N and the shrinkage tendency of ductile irons [
2] although only final nodule count values were considered in this previous work.


