1. Introduction
Shock compression is accompanied by an entropy rise due to viscosity and thermal conductivity, which induces a large temperature increase across the shock front. In practice, shock pressure is usually applied for a very short time, then the material is released to ambient pressure by an unloading wave. Because this release wave spreads during its propagation, it is usually assumed to be isentropic (as a succession of infinitesimal, hence reversible, but fast, hence adiabatic variations). Actually, a solid sample subjected to intense shock loading can melt, partially or fully, either on compression or upon release from the shocked state. Both cases are illustrated for tin in
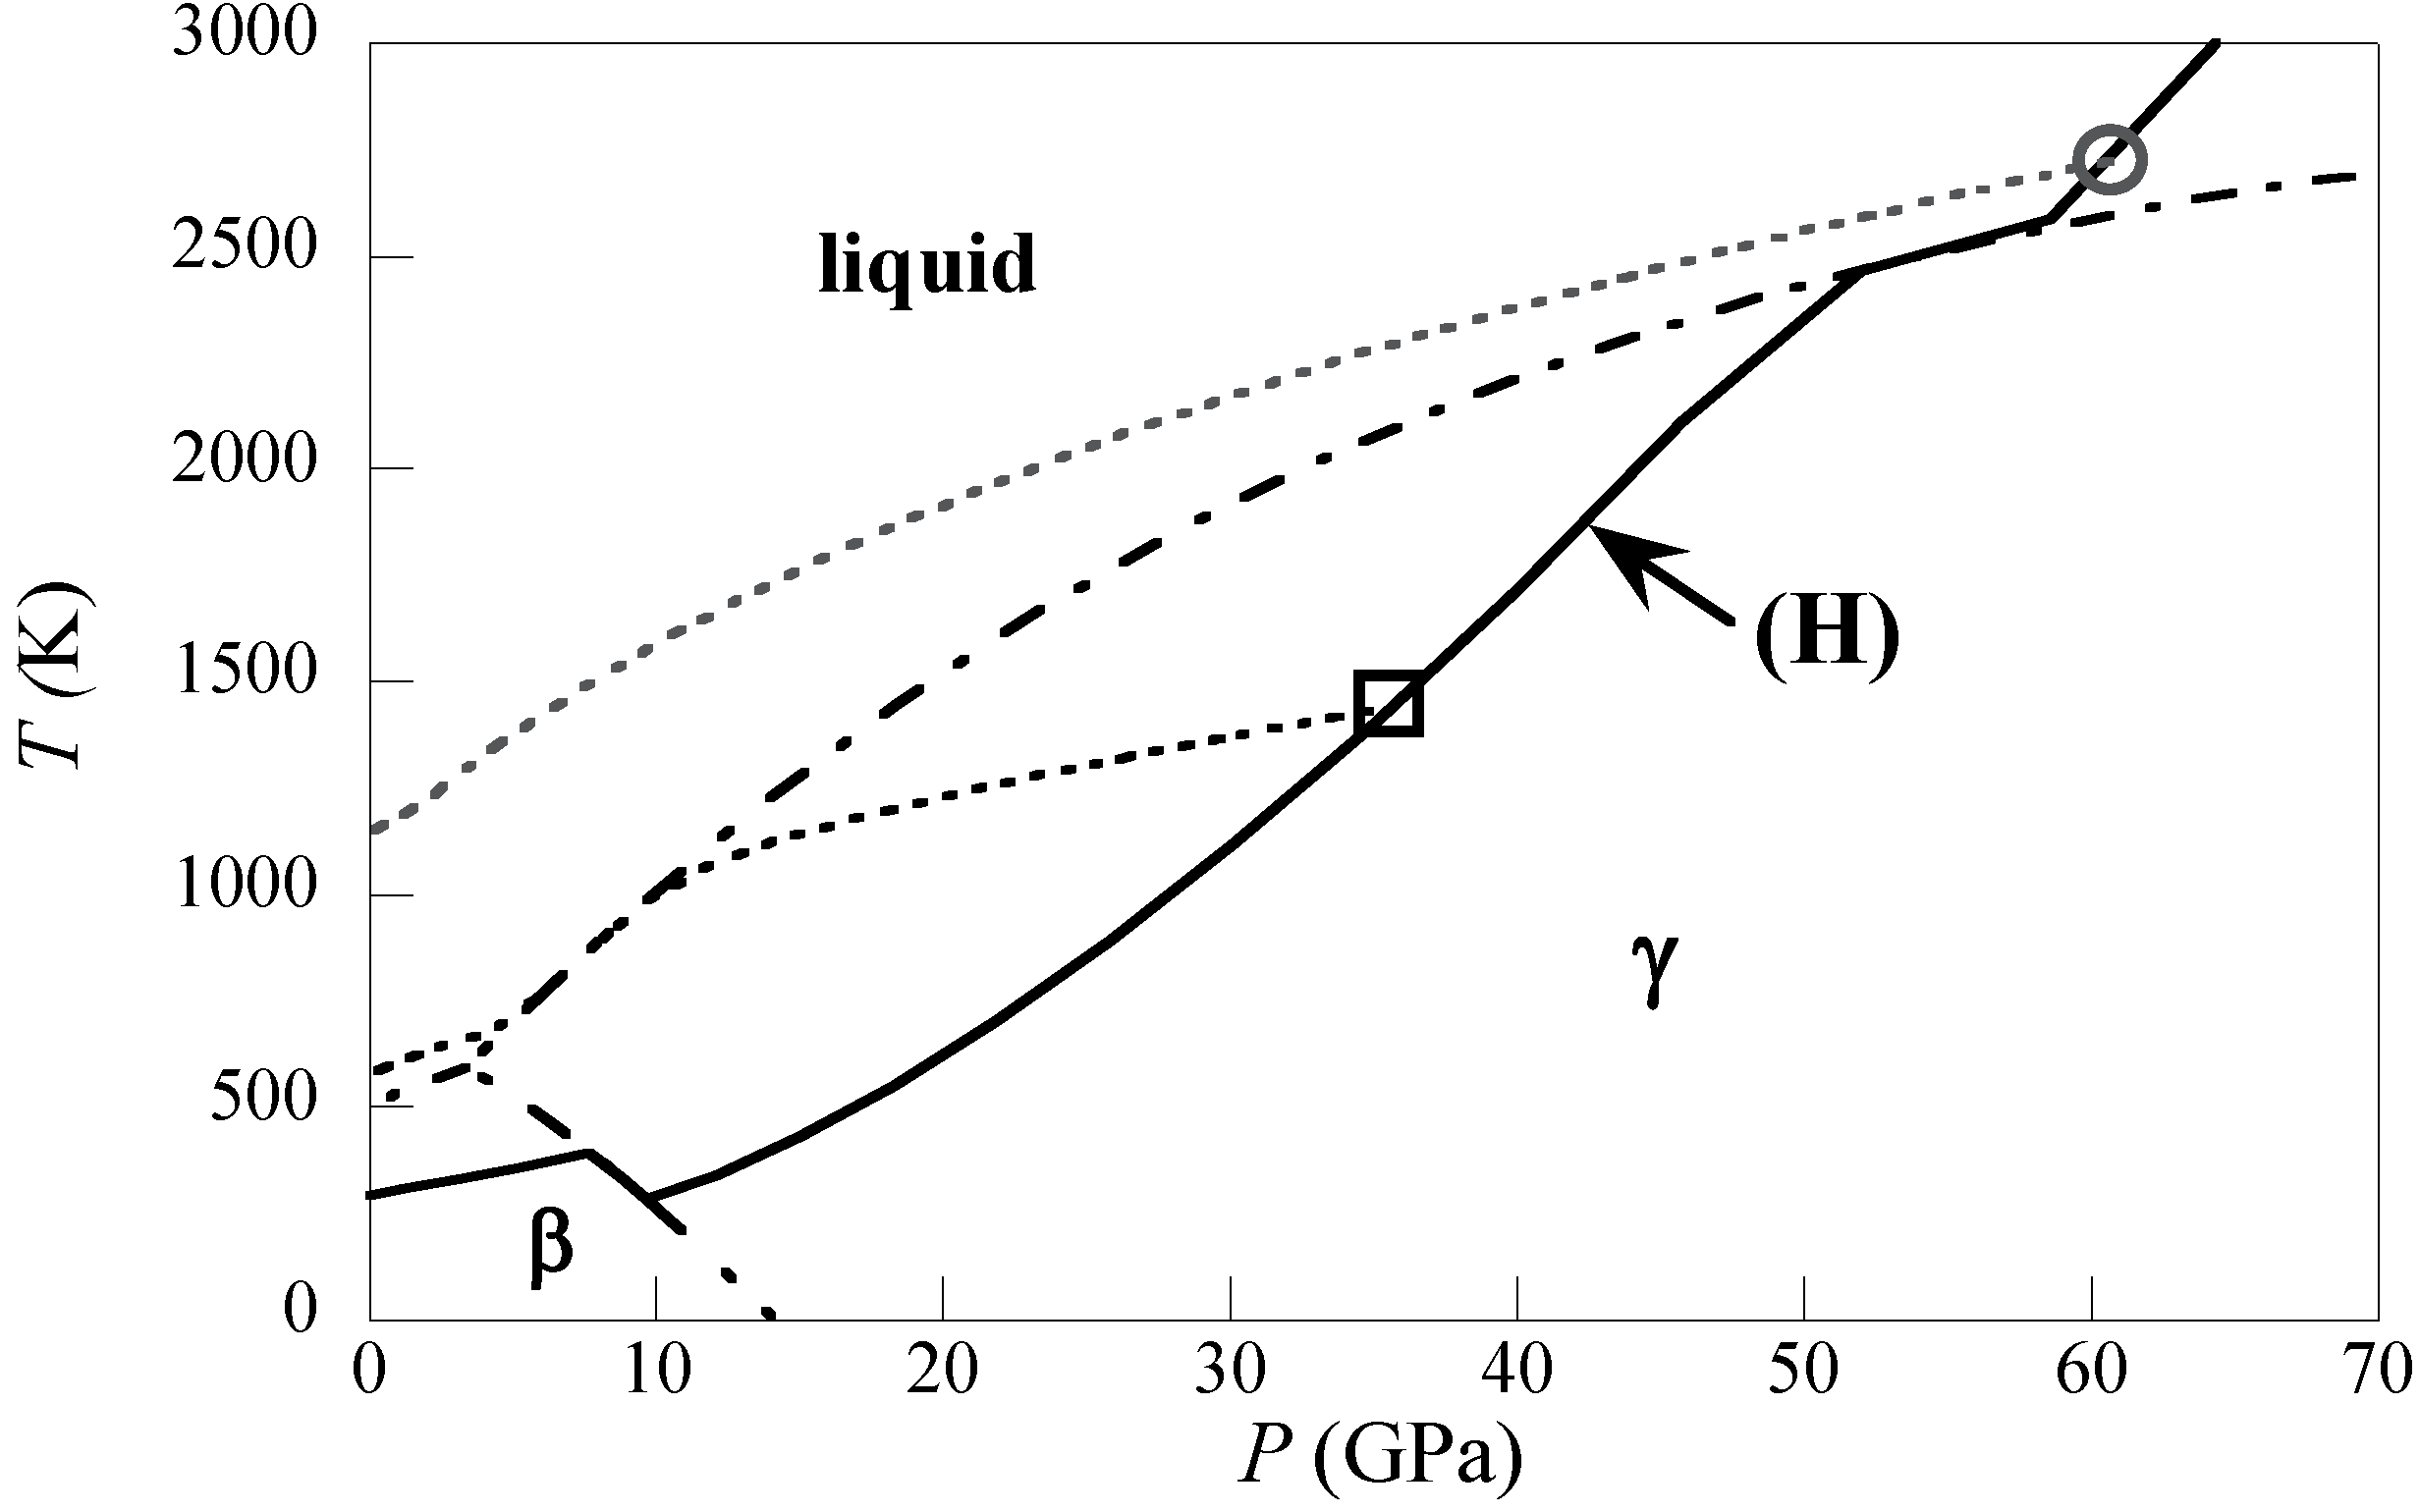
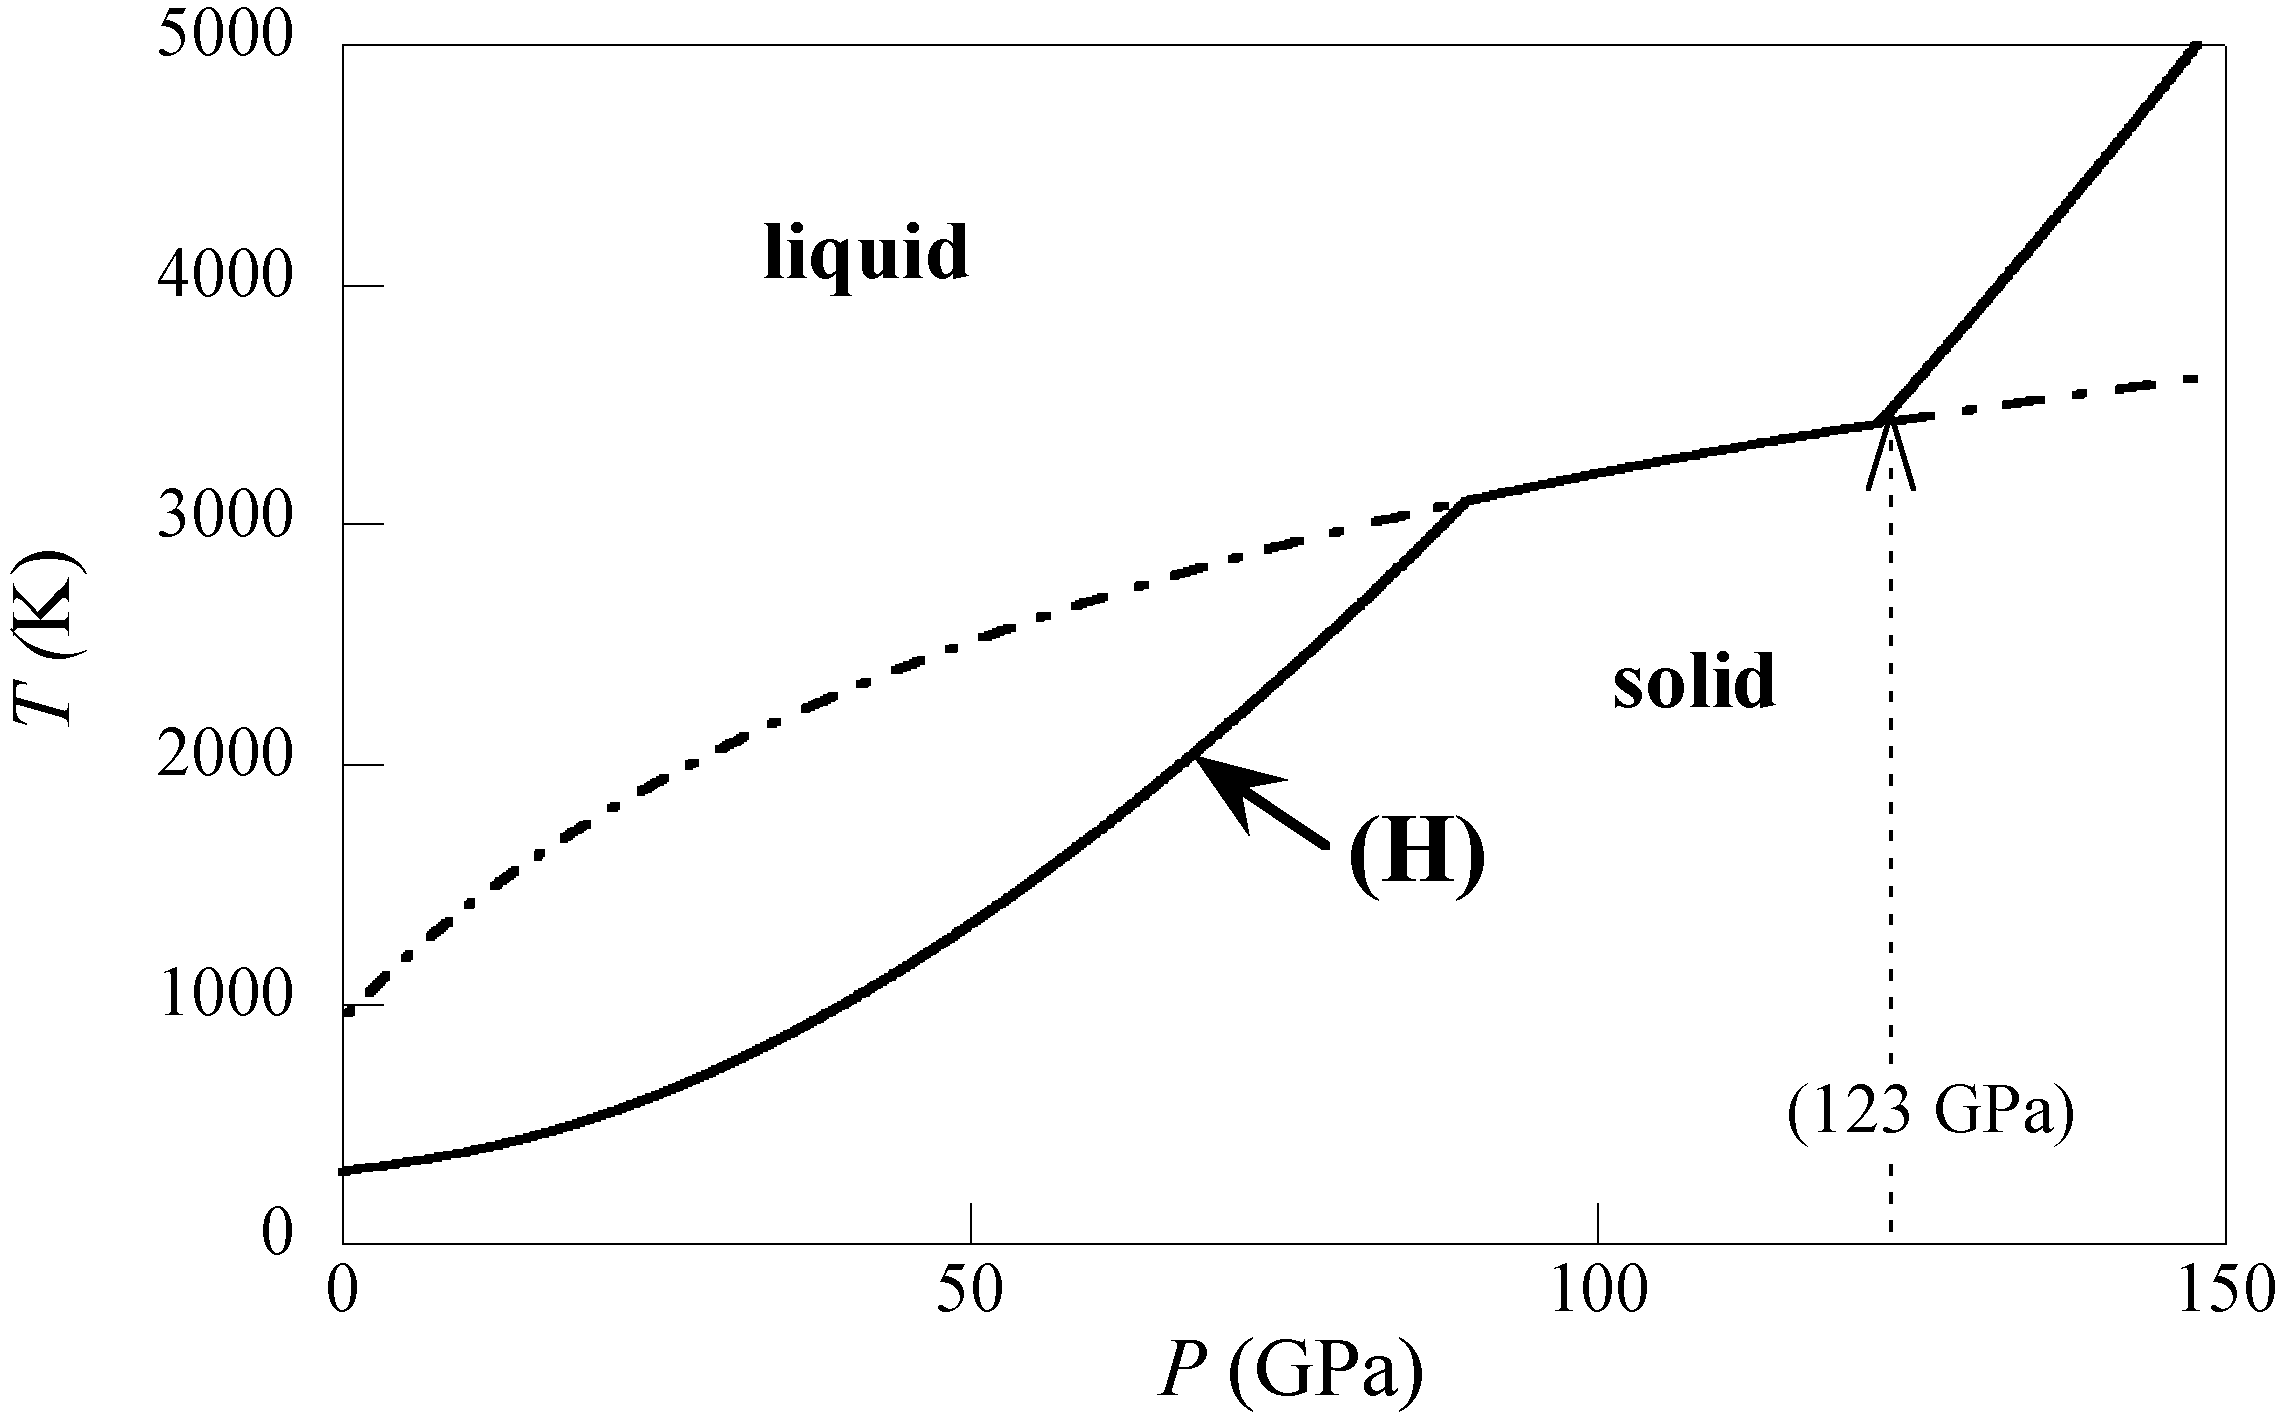
Figure 1. The Hugoniot curve (H), locus of the states that can be reached by shock compression from ambient conditions, is plotted in a pressure-temperature diagram showing equilibrium phase boundaries (mixed lines) between β-tin (tetragonal), γ-tin (bct) and liquid tin. For shock pressures above about 60 GPa, tin melts on compression (
i.e., the upper part of the Hugoniot curve lies in the liquid region). Over a range of lower loading pressures, the compressed material remains solid, but the isentropic release path from the shocked state (dotted lines) crosses the melting curve, so that tin melts upon release.
High pressure melting of metals in dynamic conditions is an issue of considerable interest for both engineering applications (where it drastically affects the response of materials to pulsed solicitation such as hypervelocity impact or explosive loading) and geophysics (where the state of matter inside planetary cores is a key question). However, determining experimentally whether a shocked sample undergoes melting, or not, is not straightforward. In this paper, we illustrate how laser driven shock loading can be used to investigate the melting of metals in unusual, extreme conditions of high pressure and temperature at very high strain rates. In particular, we show that dynamic fragmentation after shock loading evolves from a well-known process called spall fracture in a solid sample to a different one referred to as micro-spallation in a partially or fully melted sample. The transition between both regimes leads to drastic changes in tensile strength, fragment size, distribution, and fragment shapes, which can be used as indirect evidence of melting.
Figure 1.
Illustration of shock-induced melting in tin. The Hugoniot curve (H) is plotted in the solid line, in a pressure-temperature (P-T) diagram showing equilibrium phase boundaries (mixed lines). Two examples illustrate respectively melting under compression (circle) or upon release (square). Dotted lines are the isentropic release paths from both shocked states.
2. Laser Shock Experiments
Laser driven shocks are well suited to investigate the dynamic behavior of condensed matter over small spatial (~µm to mm-order) and temporal (~ps to ~ns order) scales, at extremely high strain rates of the order of 10
7 s
−1 or more [
1]. Most of the experiments reported in this paper were performed in the “nano2000” facility of the
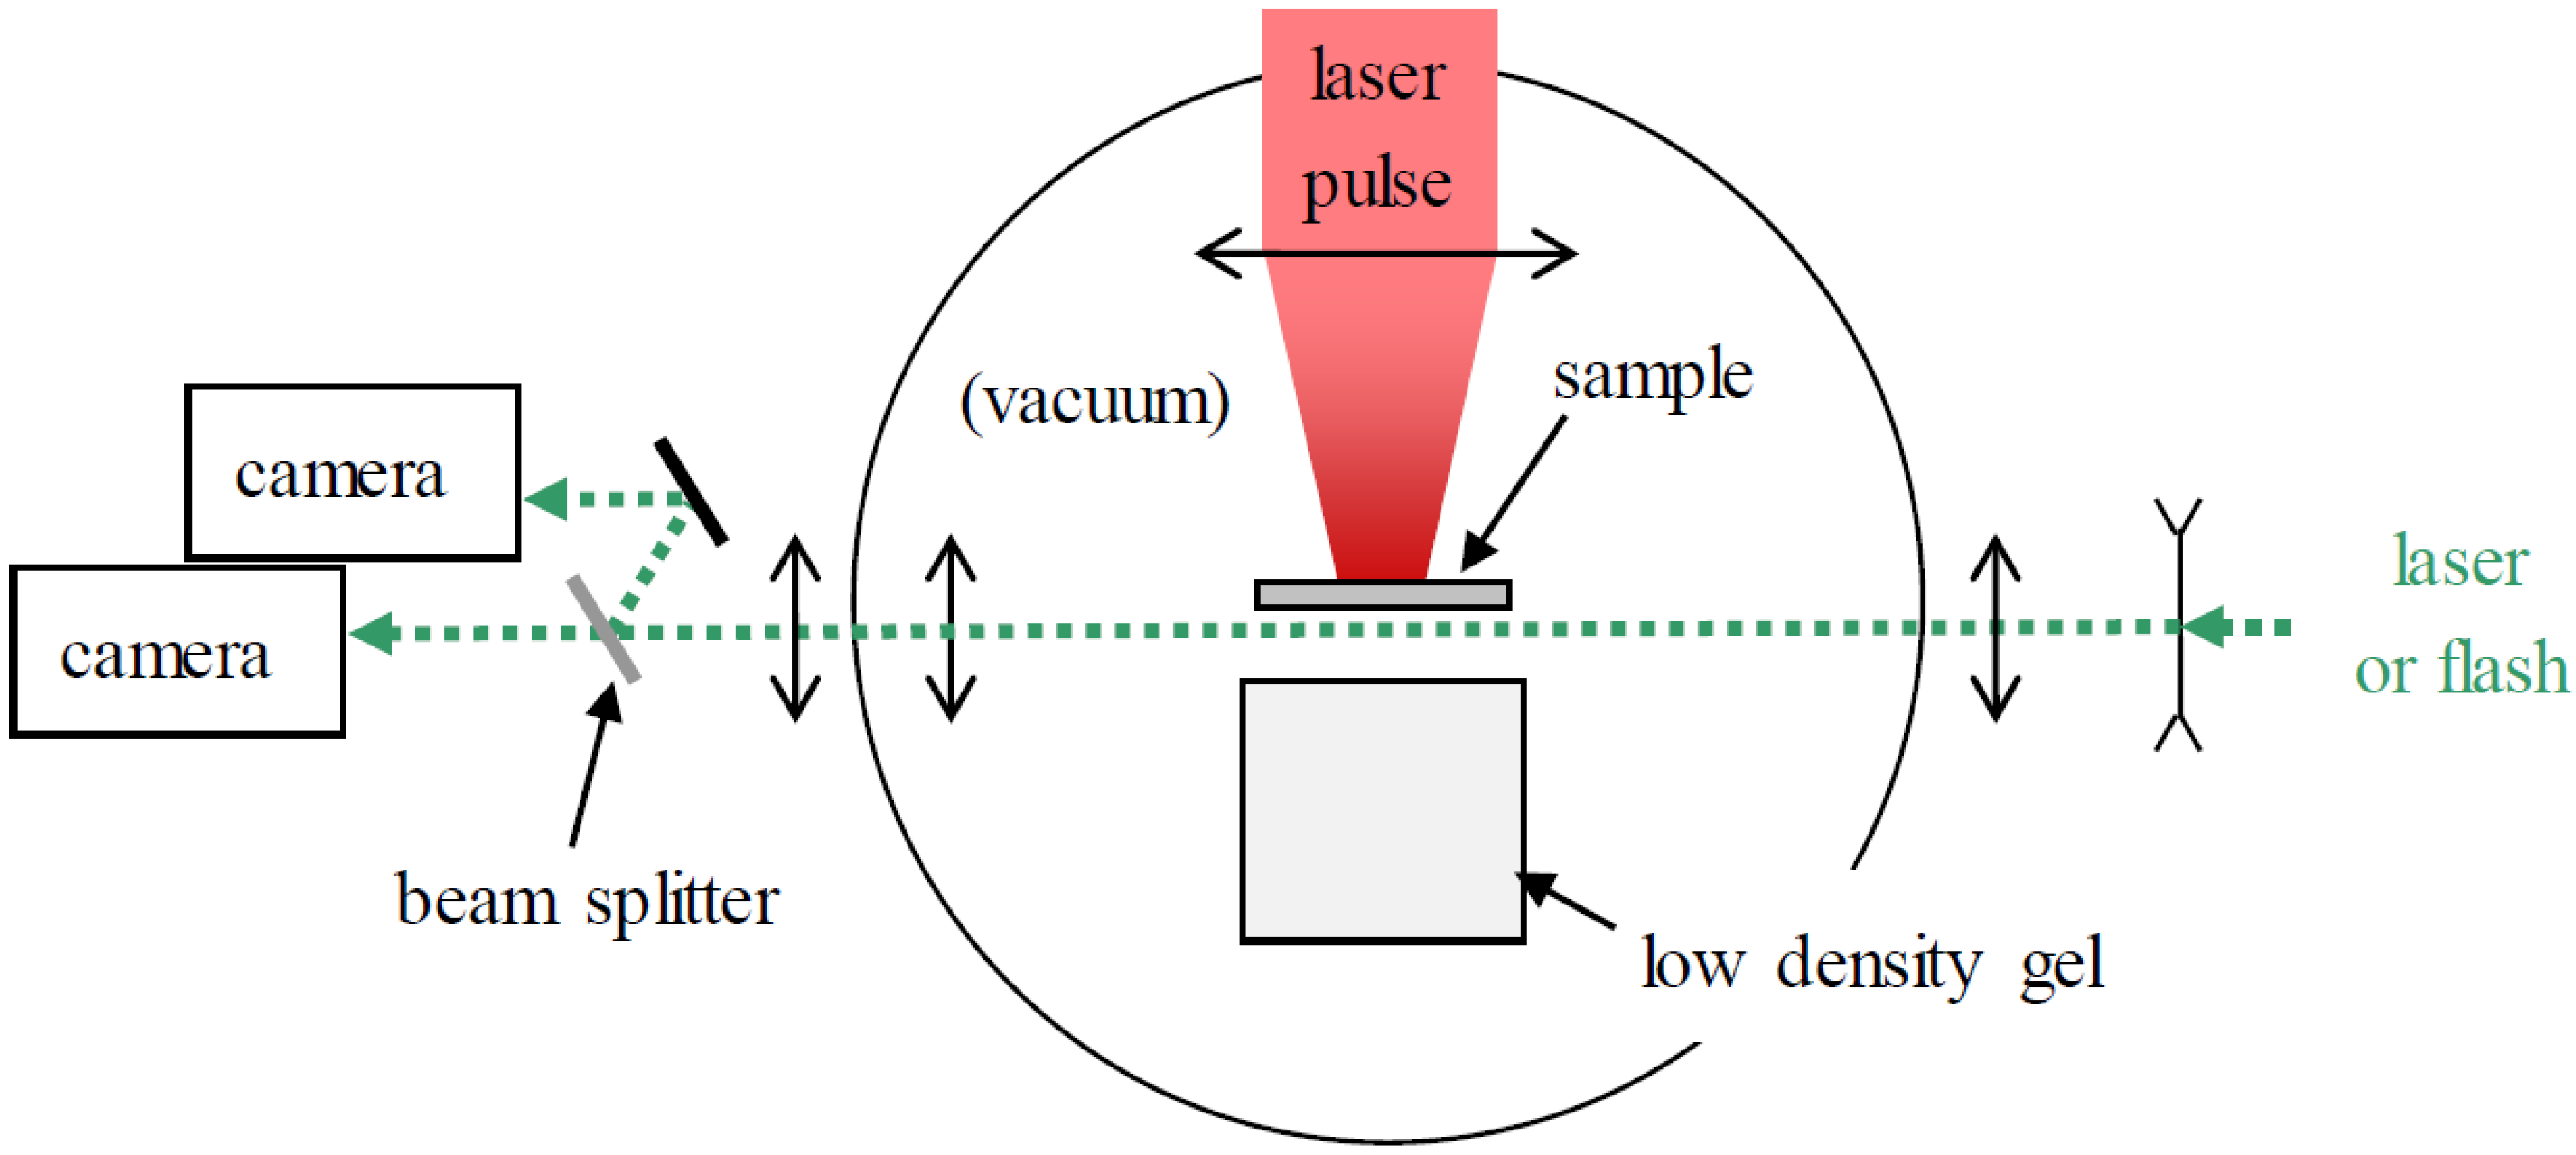
Laboratoire pour l’Utilisation des Lasers Intenses (LULI, UMR CNRS 7605, Palaiseau, France). The setup is schematically represented in
Figure 2. Square samples of about 12 mm × 12 mm were cut from 50–250 µm-thick, high purity metallic foils. A single high power laser pulse of 1.06 µm-wavelength, about 3 to 5 ns-duration and 1000 J-maximum energy, is focused onto a spot of ~2 to 4 mm-diameter in the sample surface, set in a secondary vacuum (about 10
−5 mbar) to avoid laser breakdown in air. The resulting laser intensity ranges from about 2–8 TW/cm
2. A thin layer of metal, a few µm-deep beneath the irradiated surface, is ablated into a plasma cloud. Heat conduction from this plasma only affects a ~µm-depth within the very short times involved in such experiments, and thermal radiation transport by the soft X-rays generated at such moderate laser intensities is negligible. The expansion of the plasma cloud toward the laser source drives by reaction a short compressive pulse onto the solid sample. The amplitude and temporal shape of this loading pressure pulse are inferred from one-dimensional (1D) simulation of laser-matter interaction, using the measured profile of laser intensity as an input boundary condition. During propagation from the loaded surface, the compression front steepens and the release wave spreads, so that the pressure pulse becomes approximately triangular, consisting of a shock followed by gradual unloading, and peak pressure decays with increasing propagation depth. Because the energy distribution in the laser beam is approximated to be spatially uniform, and because the diameter of the irradiated spot is much larger than the sample thickness, wave propagation is assumed to be 1D.
At the back side of the sample, opposite to the irradiated spot, the free surface can be monitored with various, complementary diagnostics. In this paper, transverse optical shadowgraphy provides quasi-instantaneous images of the debris ejection in vacuum at controlled delay times after the laser shot [
2,
3]. Illumination is supplied either by a flash lamp (incoherent white light) or a 527 nm-wavelength, 1 W-power continuous laser, depending on the experiments, divided by a beamsplitter, and successive images are recorded by two high speed cameras with different delay times (
Figure 2), which allows us to reduce, adapt and control the interframe time in each sequence. Typical magnification and field of view are 3–10 µm/pixel and ~8 mm × 6 mm, respectively. The short exposure time of 5 ns minimizes motion blur, typically 10 µm for a particle ejected at 2 km/s. Since laser shock loading is much less destructive than more conventional shock generators involving plate impacts or explosives, partial recovery of both fragmented sample and ejected debris can usually be achieved. Post-shot examination of such recovered material provides useful, complementary data. Here, soft recovery of the debris ejected from the sample is performed, using a low density (0.9 g/cm
2), transparent gel set a few mm away from the sample [
2].
4. Shock-Induced Melting of Aluminum
One of the early motivations of this work was related to the context of inertial confinement fusion (ICF), which is the goal of current experiments performed in very large scale laser facilities (National Ignition Facility, Livermore, CA, USA and
Laser MegaJoule, Le Barp, France). In these experiments, complex targets of small dimensions are irradiated by a large number of high power laser beams, in order to drive an implosion process up to the ignition of a thermonuclear burn [
15]. The impact of high velocity, solid or liquid metallic fragments generated from these targets can severely damage vacuum chambers, optical or measurement devices. To assess and reduce such risks of damage, the fragment size and ejection velocity must be efficiently predicted by models based on experimental data, for all metals involved in the target holder and nearby equipment, in particular Al.
Examples of shadowgraphs recorded behind Al samples subjected to two laser shocks of different intensities are shown in
Figure 3. The left picture is typical of spall fracture in the solid state, resulting in the ejection of a spalled layer, at 656 m/s, followed by slower, secondary fragments generated from the periphery of the shocked area. The curvature of the spall is mostly due to the non-uniformity of the laser energy over the irradiated spot in this shot. In the right picture, the peak pressure applied onto the loaded surface is calculated as 158 GPa, and shock breakout pressure after pulse decay during propagation throughout the 100 µm thick sample is 123 GPa. According to a multiphase model [
14] based on the Birch formulation and fitted to match the Bushman-Lomonosov-Fortov (BLF) equation of state [
16], the whole sample is expected to melt in this experiment (
Figure 4). Subsequent fragmentation in the liquid state leads to the expansion of a dense cloud of fine droplets (micro-spall) with a wide, continuous range of ejection velocities up to about 8.7 km/s (
Figure 3b).
Figure 3.
Optical shadowgraphs recorded behind Al samples subjected to laser shocks of 0.47 TW/cm2 (a) and 8.2 TW/cm2 (b) applied at time t0 onto the left surface (not shown). In the lower intensity shot, where peak pressure at shock breakout is about 10 GPa, a main spalled layer is followed by distinct fragments. At higher intensity, where peak pressure at shock breakout is about 123 GPa, a dense cloud of fine droplets expands from the free surface, with a peak velocity of about 8.7 km/s. ((a): t0 + 1.64 μs; (b): t0 + 0.44 μs).
Figure 5 shows optical micrographs of the fragments recovered behind 200 µm-thick Al samples subjected to laser shocks of different intensities. In the low intensity shot, the peak loading pressure is 50 GPa and the pressure at shock breakout beneath the free surface is 20.5 GPa. The corresponding sample remains in the solid state, and the recovered ejecta consist of a large spalled layer that has penetrated deep into the gel, followed by smaller, secondary fragments. In the shot at 7.6 TW/cm
2, calculated peak pressures on the loaded surface and near the free surface are 166 GPa and 72 GPa, respectively. In that case, shock-induced melting occurs (see
Figure 4) and subsequent micro-spallation leads to a dense distribution of tiny debris inside the gel. Another example of ejecta recovery after micro-spallation in Al is illustrated in
Figure 6, with a closer view inside the gel showing particles of spherical shape, which indicates that they have formed in the molten metal, turned into spherical drops under the action of surface tension, then at least partially resolidified before penetrating the gel. In order to reconstruct the 3D fragment population, characterize their size distribution and try to correlate their penetration depth to their ejection velocity, X-ray micro-tomography was performed, as will be reported in a forthcoming paper.
Figure 4.
Computed phase diagram of Al, showing the melting curve (mixed line) and the Hugoniot curve (solid line). The dotted arrow shows that the 123 GPa shock breakout pressure, calculated in the experiment of
Figure 3b, implies shock-induced melting throughout the sample.
Figure 5.
Optical micrographs of the fragments collected in a transparent gel (penetration from left to right) after ejection from 200 µm-thick Al samples subjected to laser shocks of intensity 1.54 TW/cm2 (a) and 7.6 TW/cm2 (b).
Figure 6.
Optical micrograph of the fragments collected in a gel behind a 50 µm-thick Al sample subjected to a laser shock of 7.1 TW/cm2 intensity, and closer view of the black frame (inset to the right), showing spherical Al particles indicative of melting.
5. Incipient Melting of Laser Shock-Loaded Iron
The ultrahigh-pressure behavior of Fe remains a controversial topic, with important implications for understanding the constitution of the Earth’s core [
17]. In this section we investigate to what extent the change in dynamic fragmentation reported in
Section 3 provides insight into laser-induced shock melting processes.
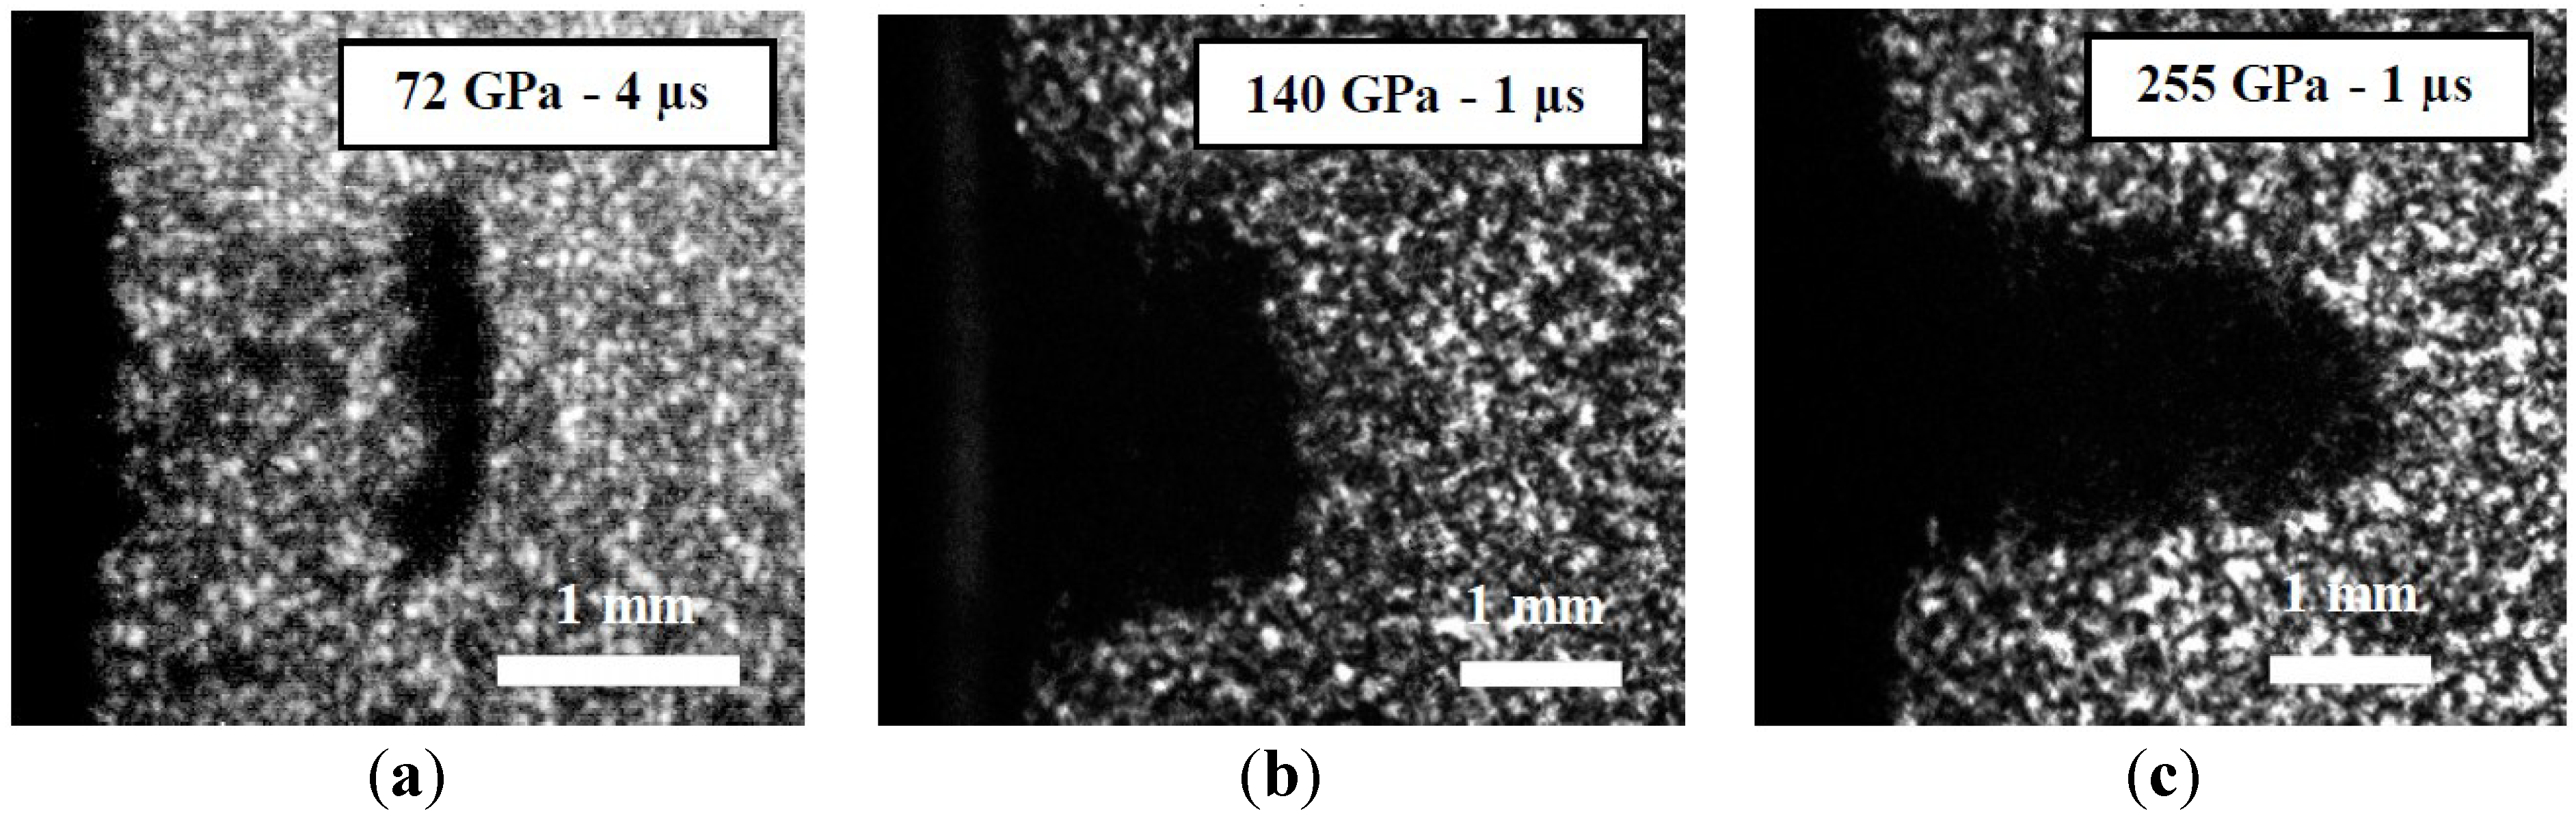
Shadowgraphs behind laser shock-loaded Fe samples are shown in
Figure 7. In these experiments, a speckle pattern resulting from the transverse illumination produced a noisy background which degrades image quality (and which was finally removed in our later experiments). Still, despite this parasitic background, the pictures illustrate the evolution of the fragmentation process with increasing loading pressure, from the separation of a well-defined spalled layer of about 410 m/s mean velocity (
Figure 7a) to the expansion of a continuous debris cloud with peak ejection velocities of about 3 km/s (
Figure 7c). Such thick cloud would be consistent with an evolution toward a micro-spall process, which would be associated with shock-induced melting. The intermediate case (
Figure 7b) shows a dark cloud too, but it is very likely to comprise distinct, solid debris, similar to those in
Figure 3a, not resolved because of poor image quality.
Figure 7.
Optical shadowgraphs recorded behind the free surface of Fe targets of thickness 150 µm (a): or 100 µm (b) and (c), subjected to laser shocks of increasing intensity.
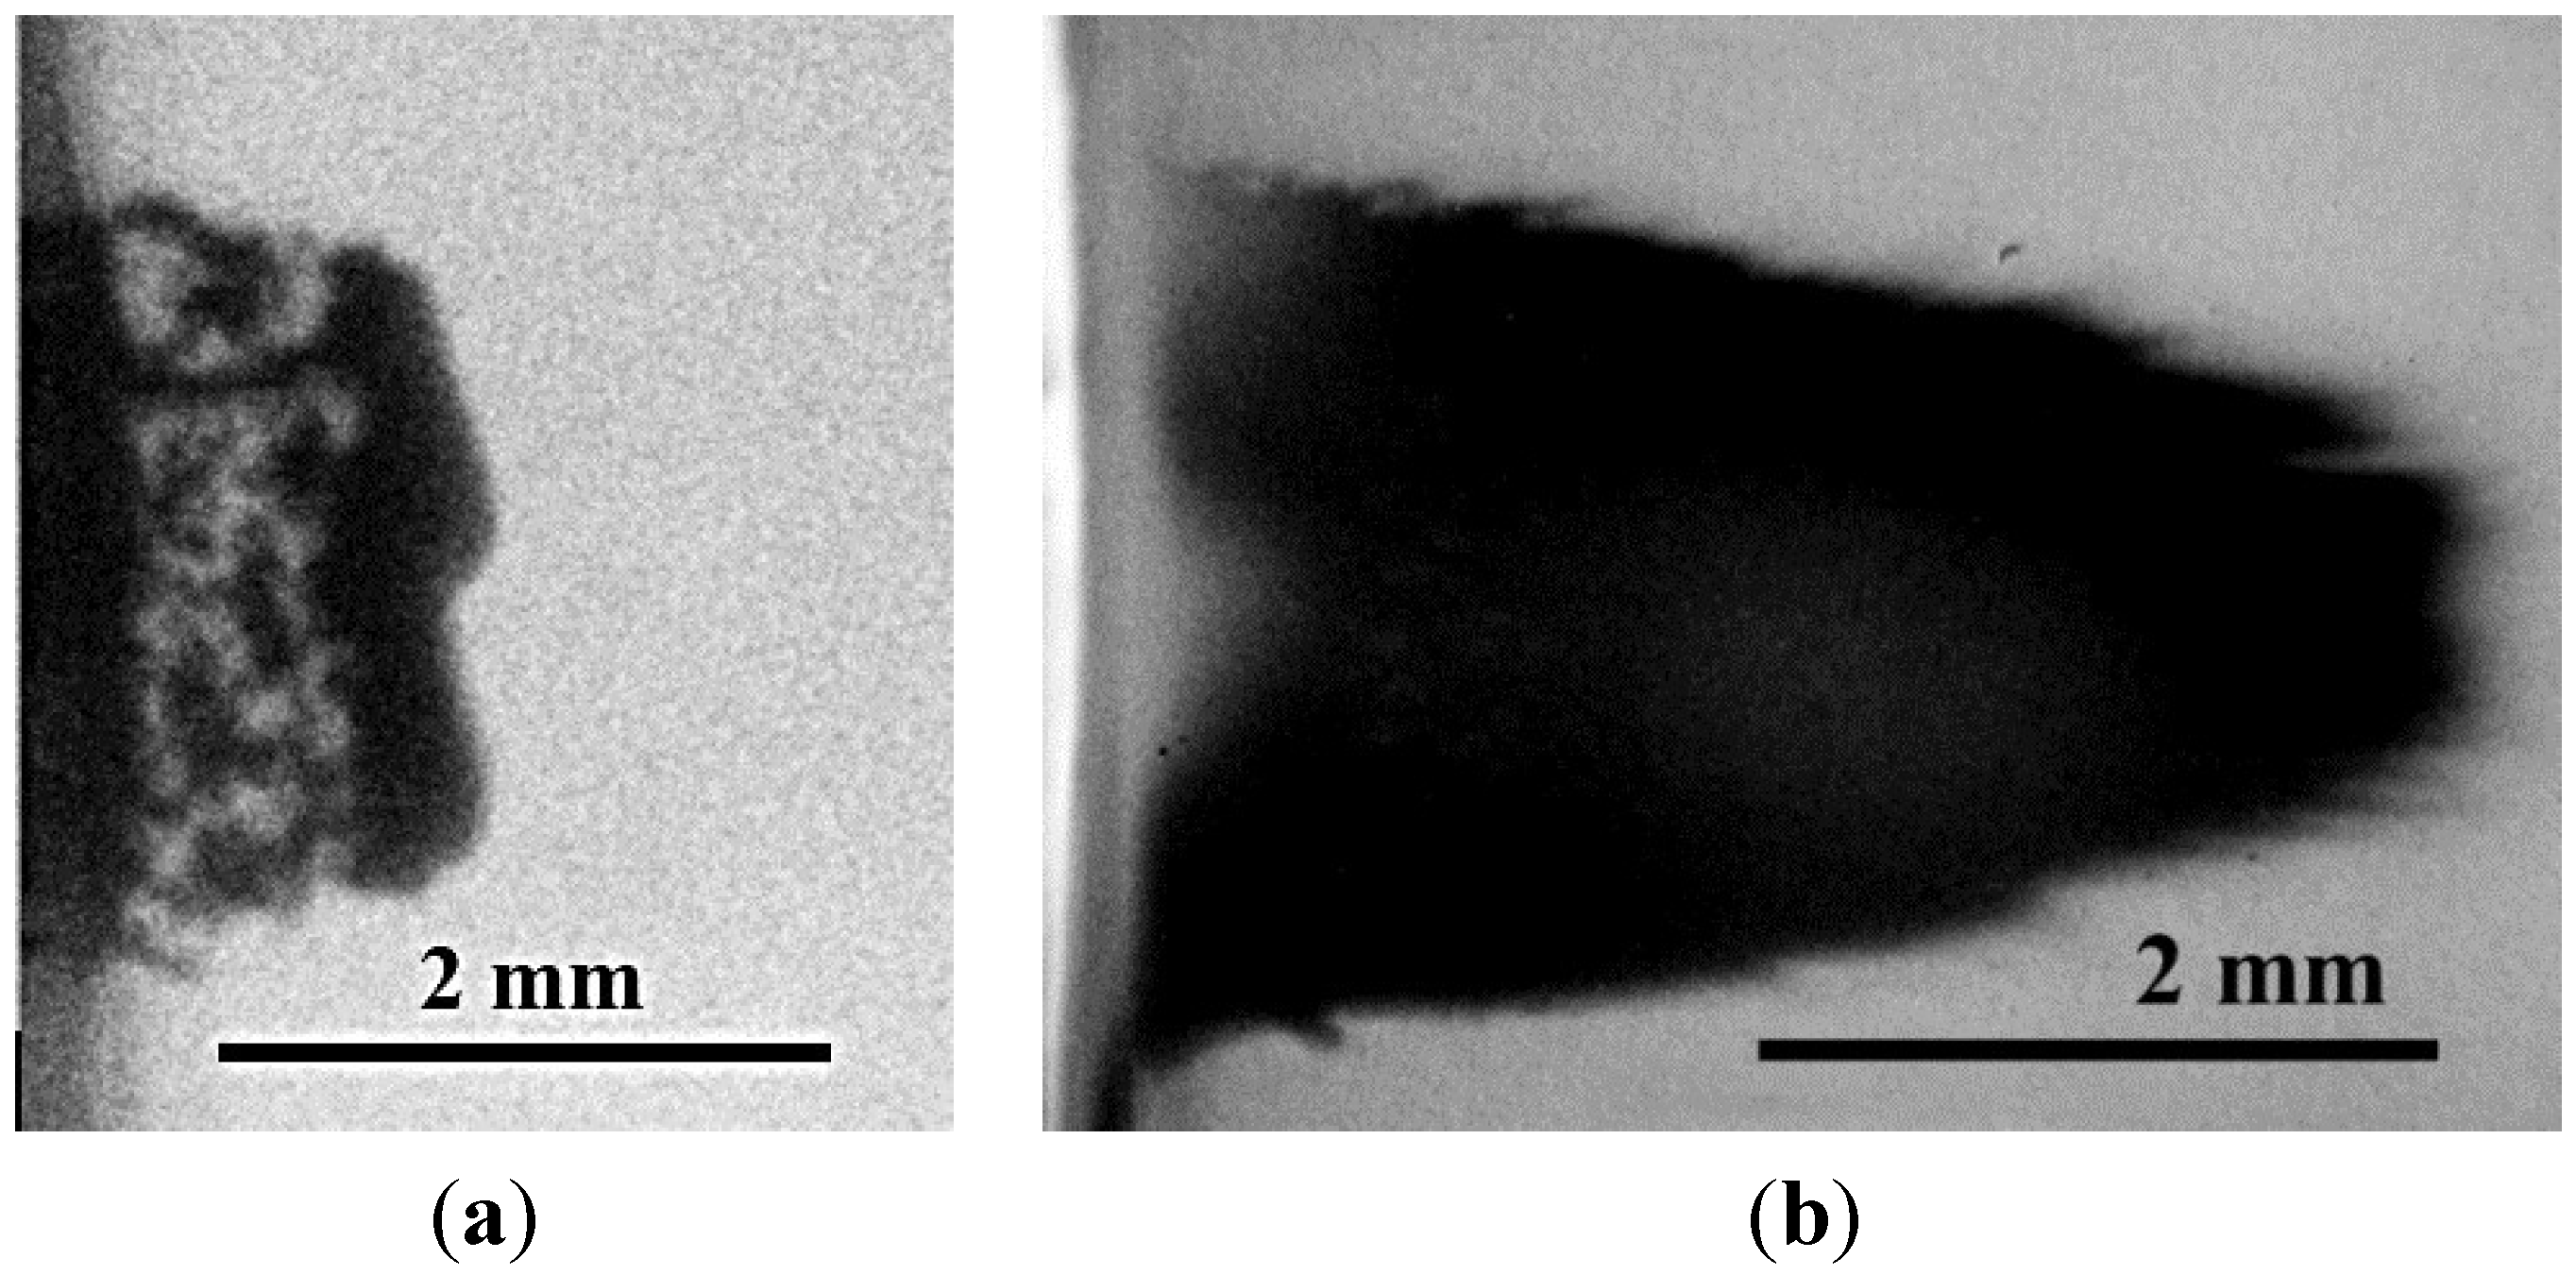
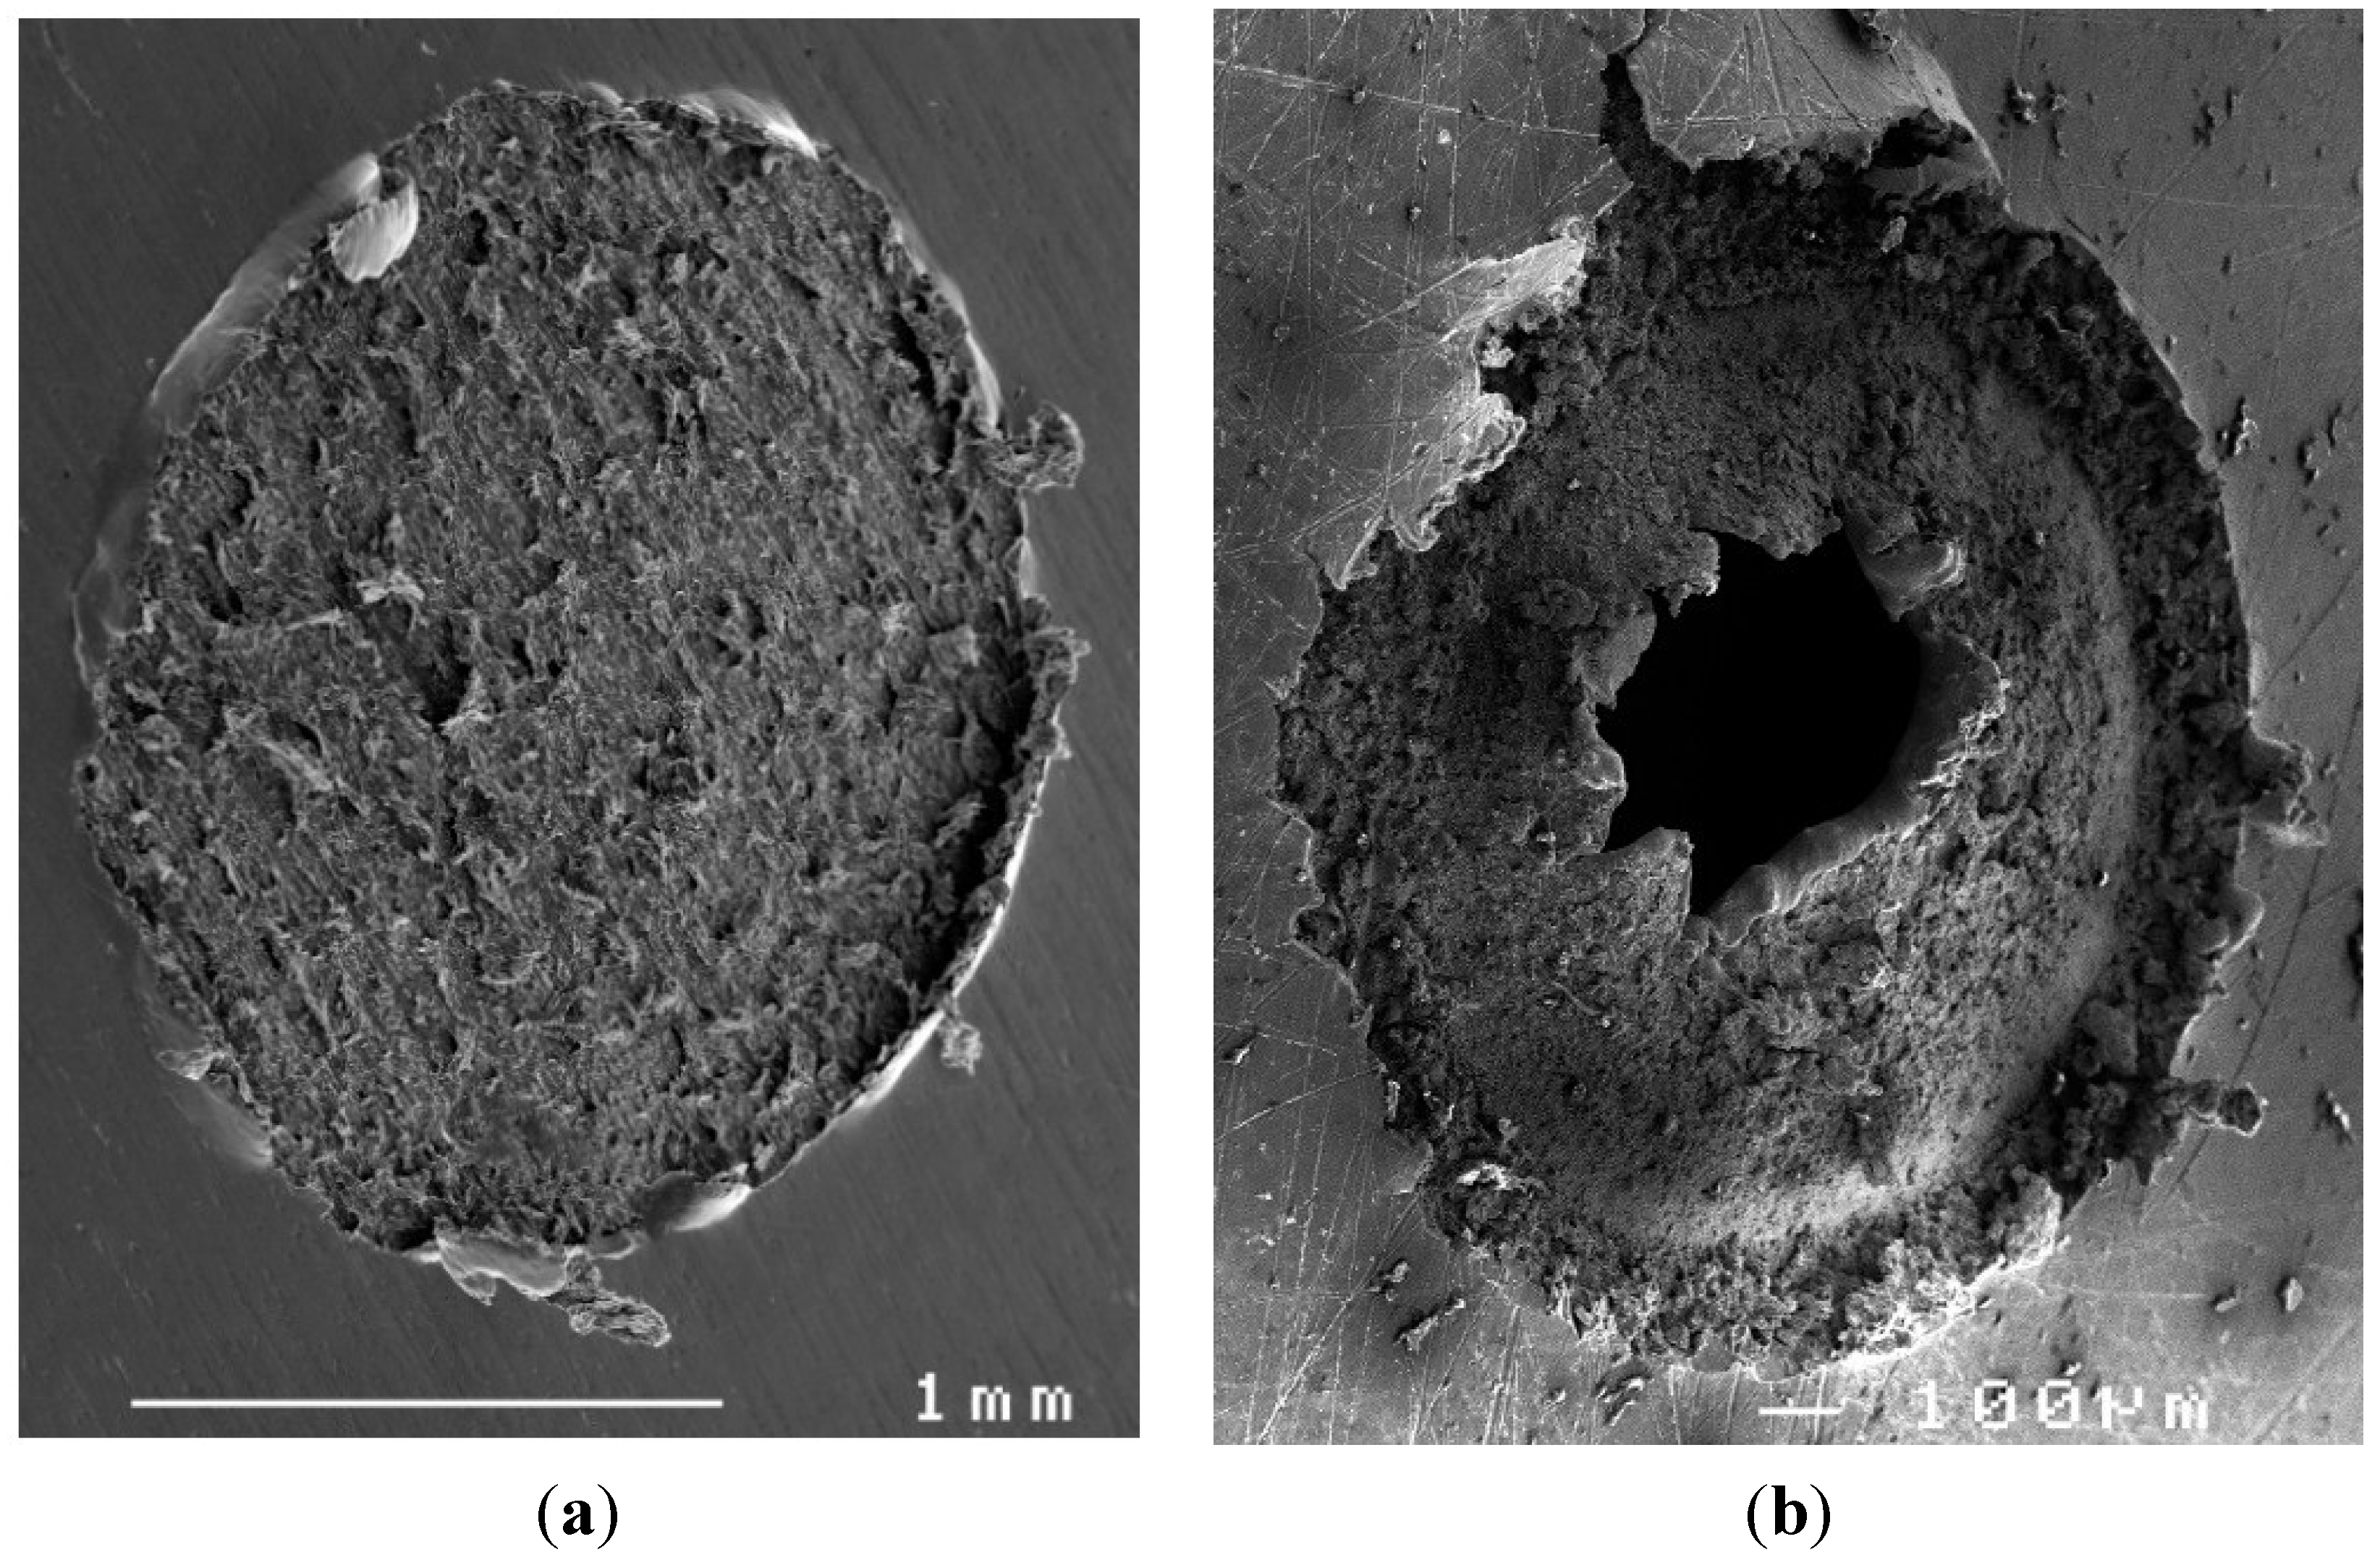
Figure 8 shows scanning electron micrographs of the recovered samples. In the 150 µm-thick sample subjected to a 72 GPa peak loading pressure, the ejection of a spall (see
Figure 7a) results in a crater opposite to the loaded spot (
Figure 8a), with a rough fracture surface typical of the brittle behavior of Fe at ambient temperature. In a 250 µm-thick sample subjected to a laser shot of 15 TW/cm
2 intensity, corresponding to a 330 GPa loading pressure and a 139 GPa breakout pressure after pulse decay, this fracture surface becomes smoother and a hole appears in the center of the crater (
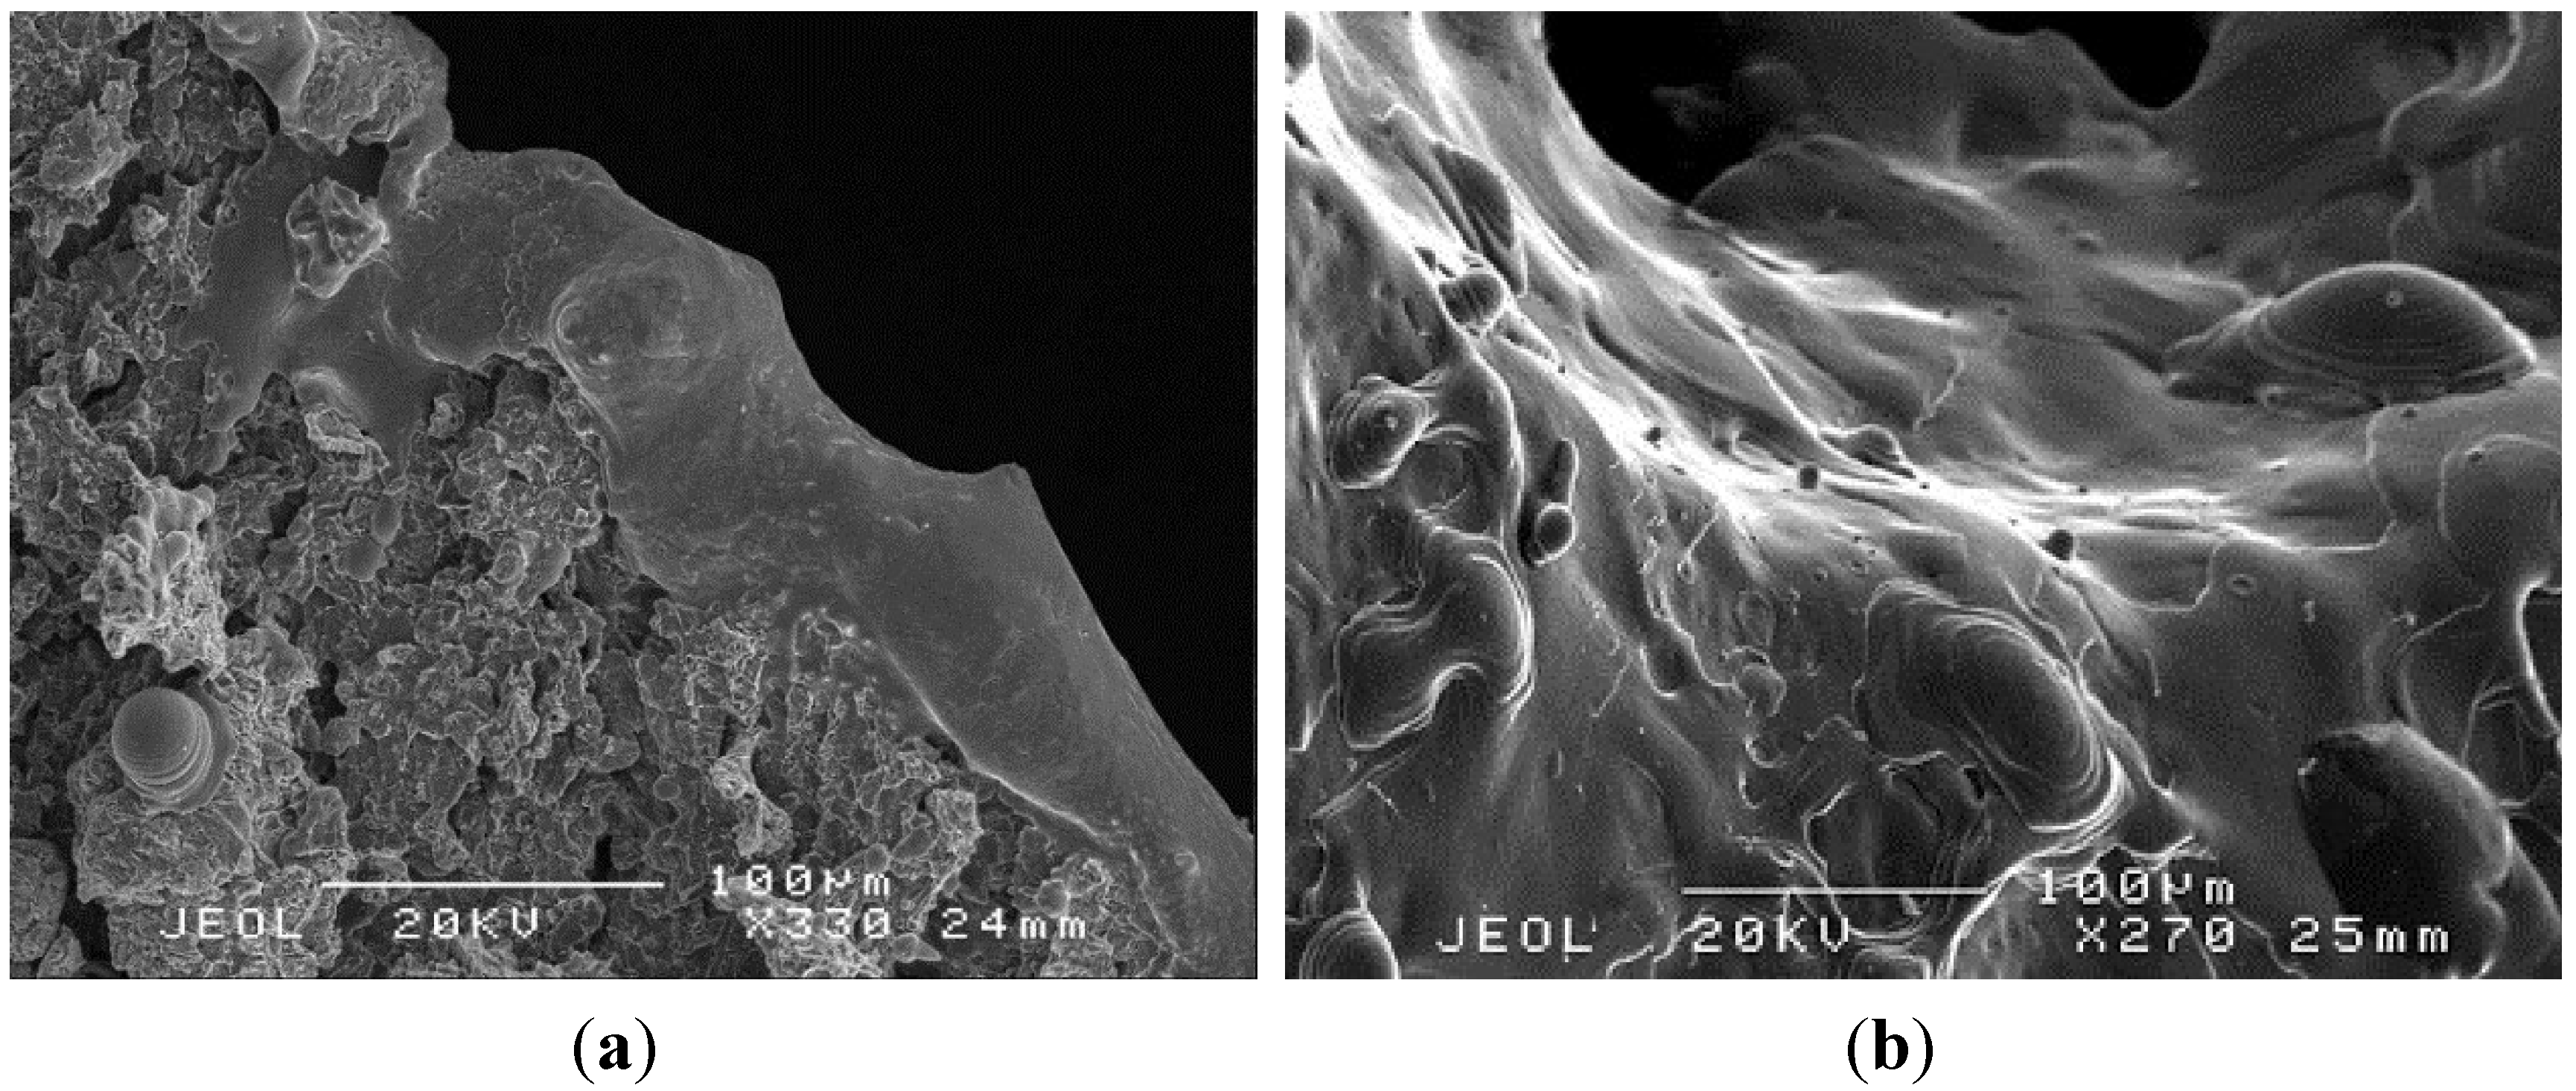
Figure 8b). The edges of this hole strongly suggest bulk melting before resolidification (
Figure 9). Shock-induced melting would be more extensive in the central region because of inhomogeneous distribution of laser intensity.
Figure 8.
Scanning electron micrographs (from a ~30° tilt angle) of the spall craters observed in the free surface of Fe samples recovered after laser shock loading to peak pressures of 72 GPa (a) or 330 GPa (b).
Figure 9.
Scanning electron micrographs of a 250 µm-thick Fe target recovered after a laser shock of 330 GPa loading pressure (same sample as in
Figure 8b) : close view near the central hole in the spall crater (
a), and edge of the same hole on the opposite (loaded) surface (
b).
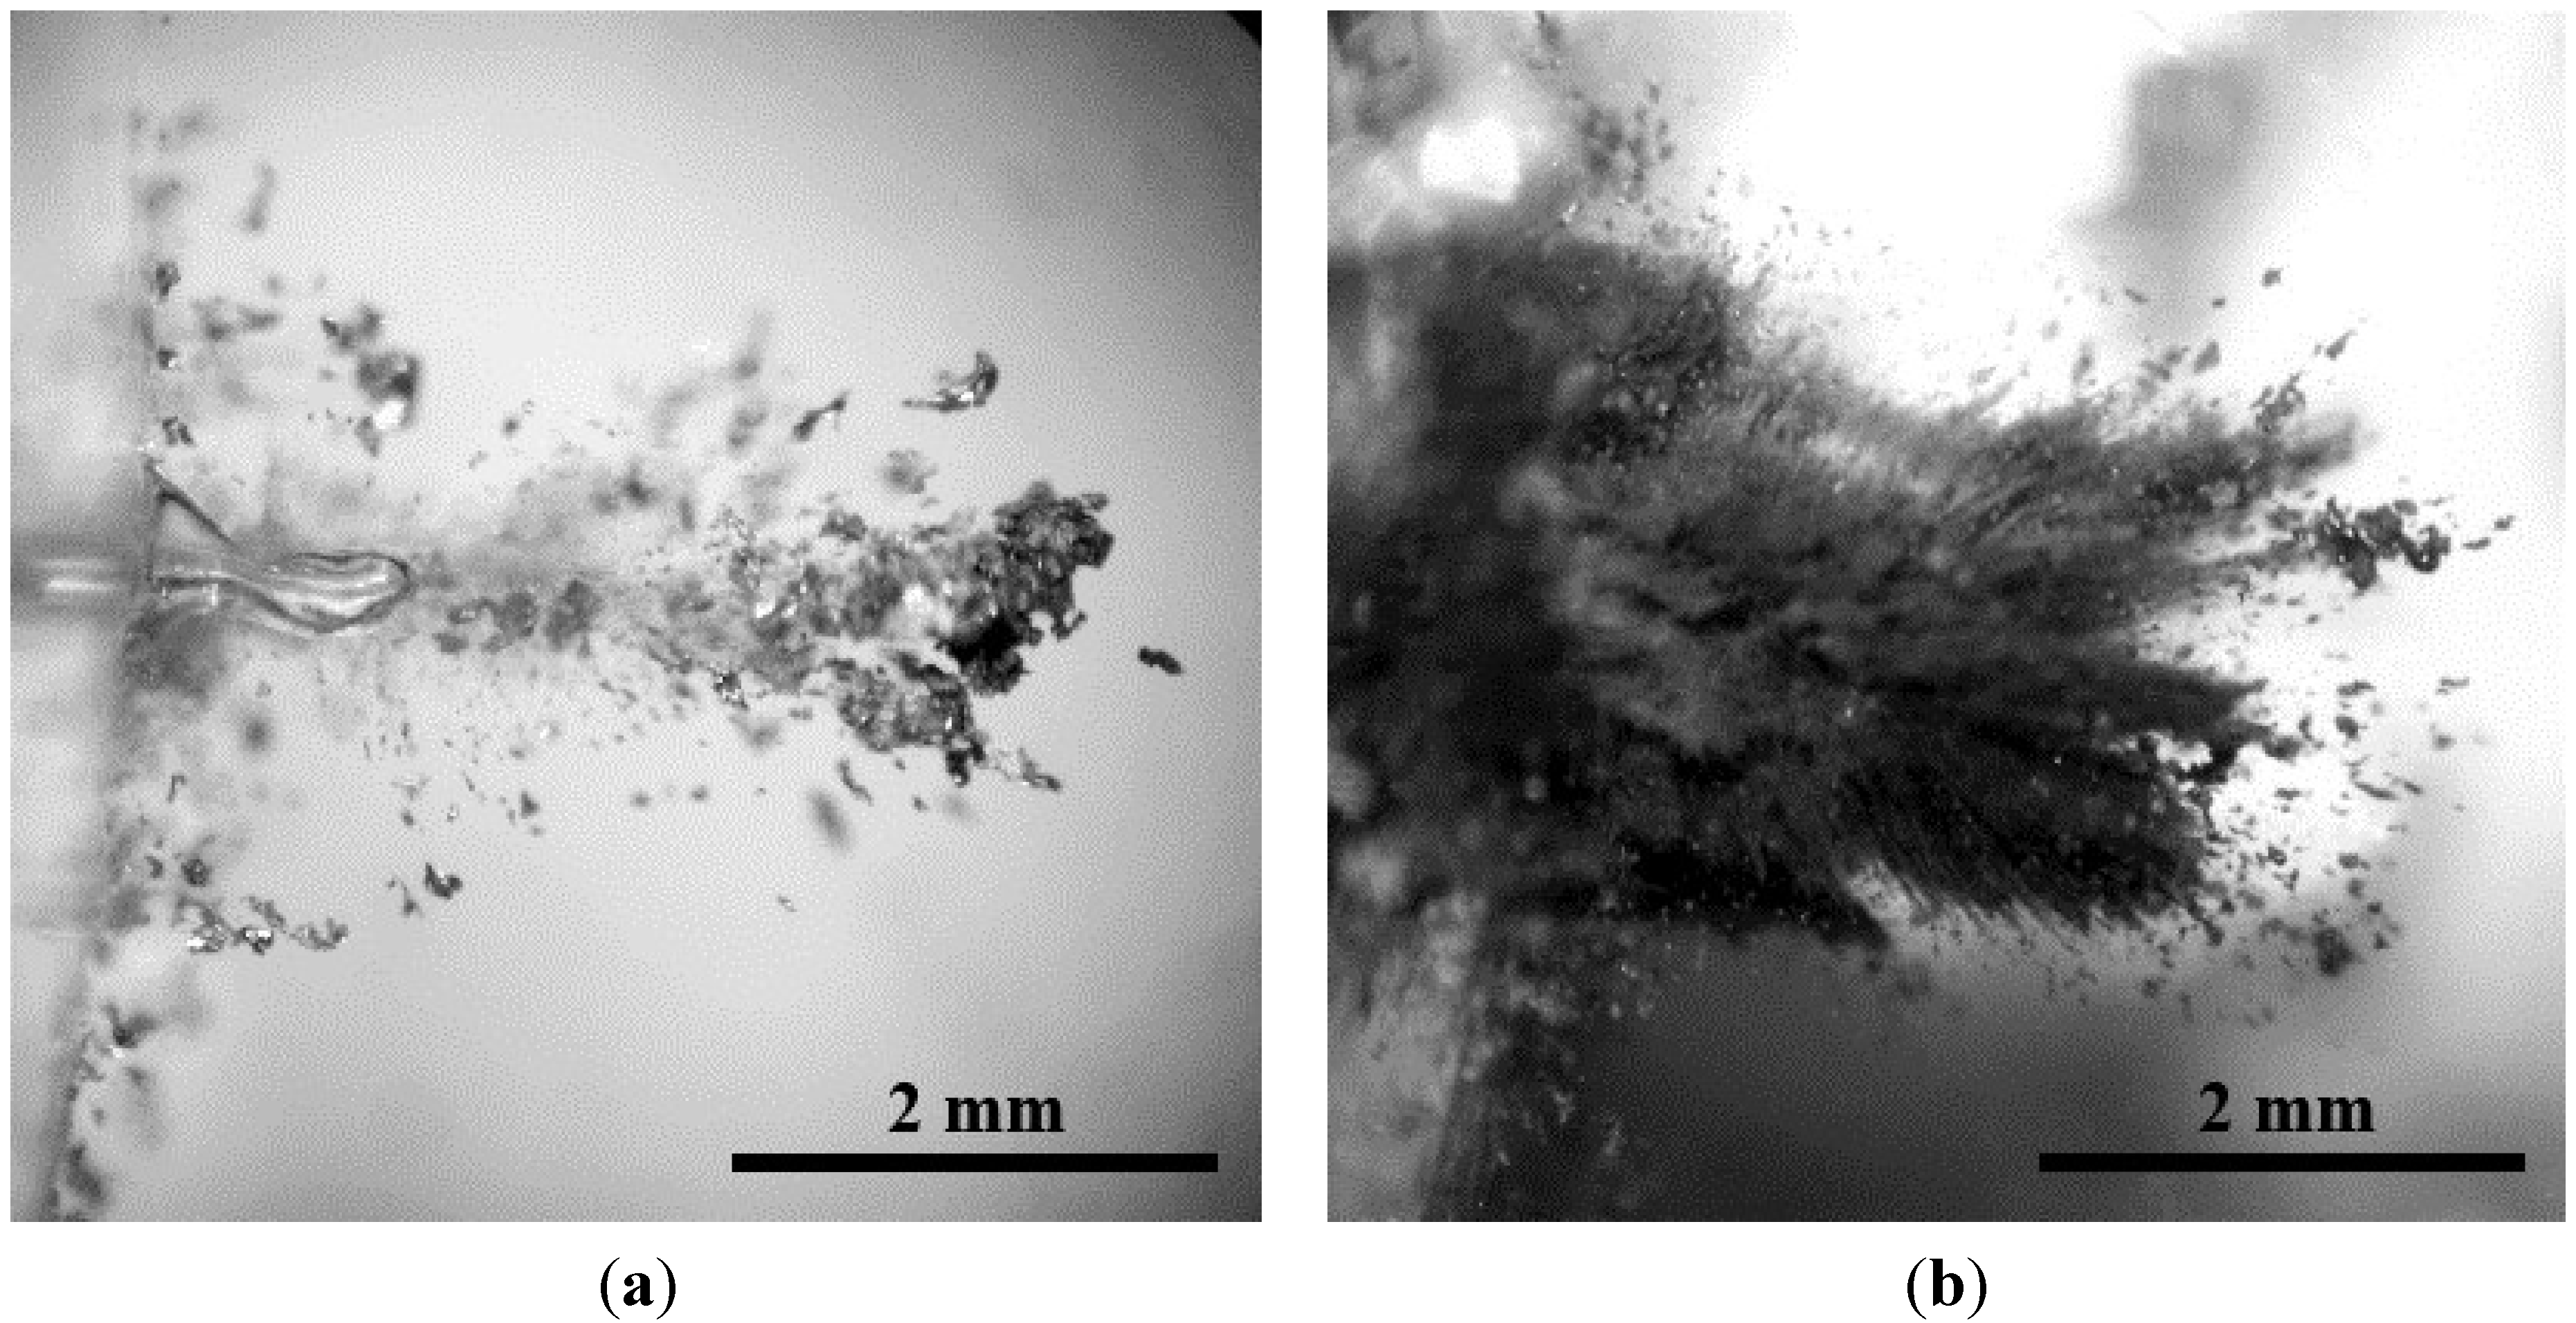
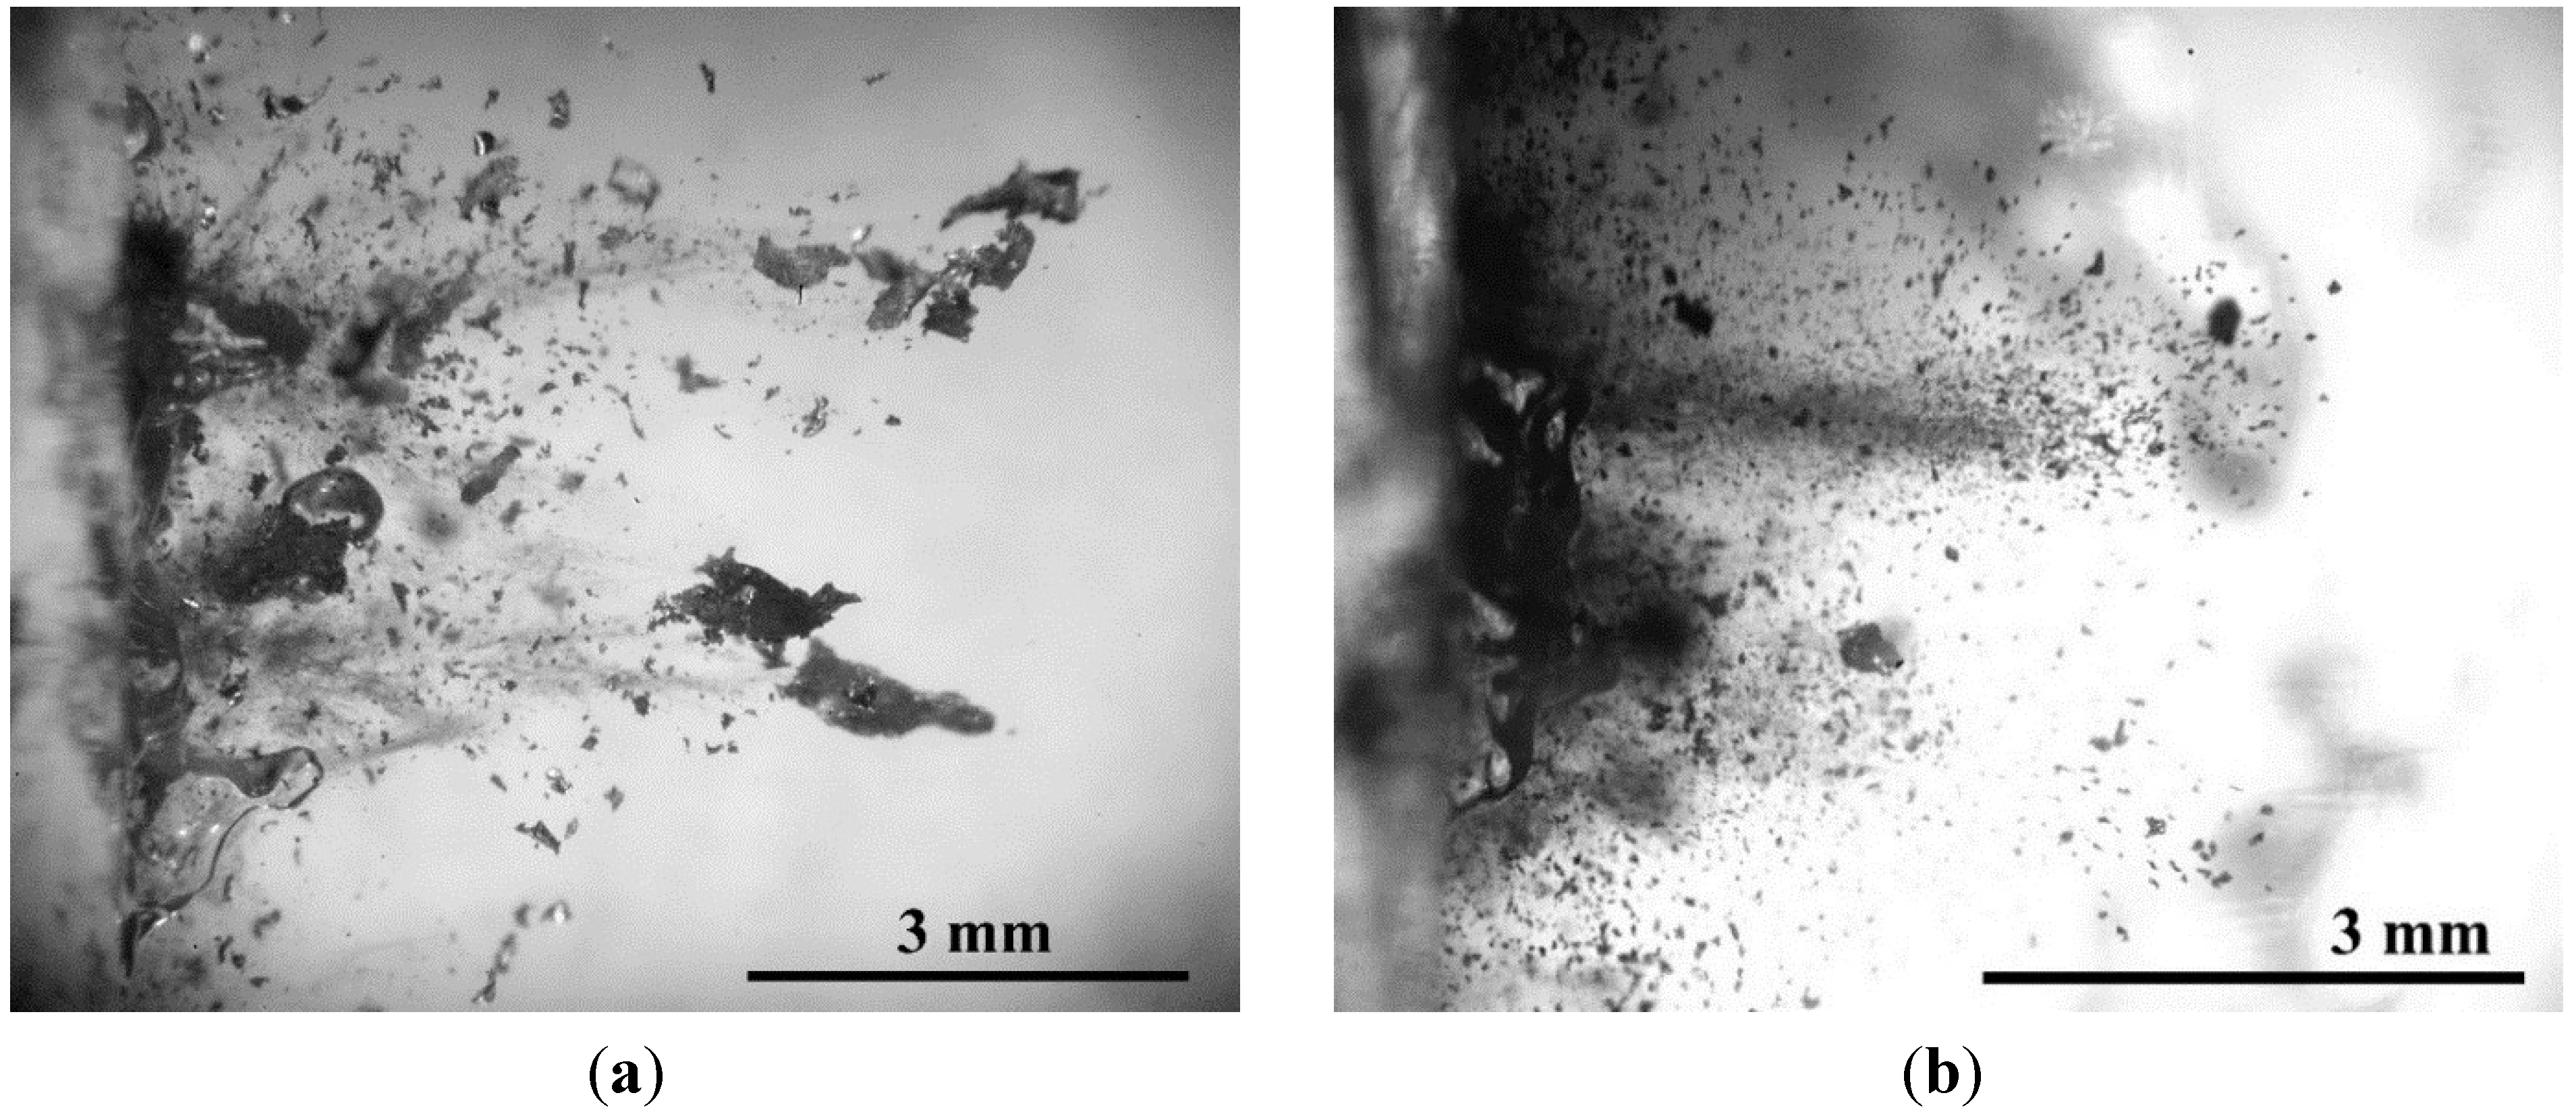
Figure 10.
Optical micrographs of fragments recovered in a transparent gel set 6 mm behind 100 µm-thick Fe samples subjected to laser shocks of 140 GPa (a) or 255 GPa (b).
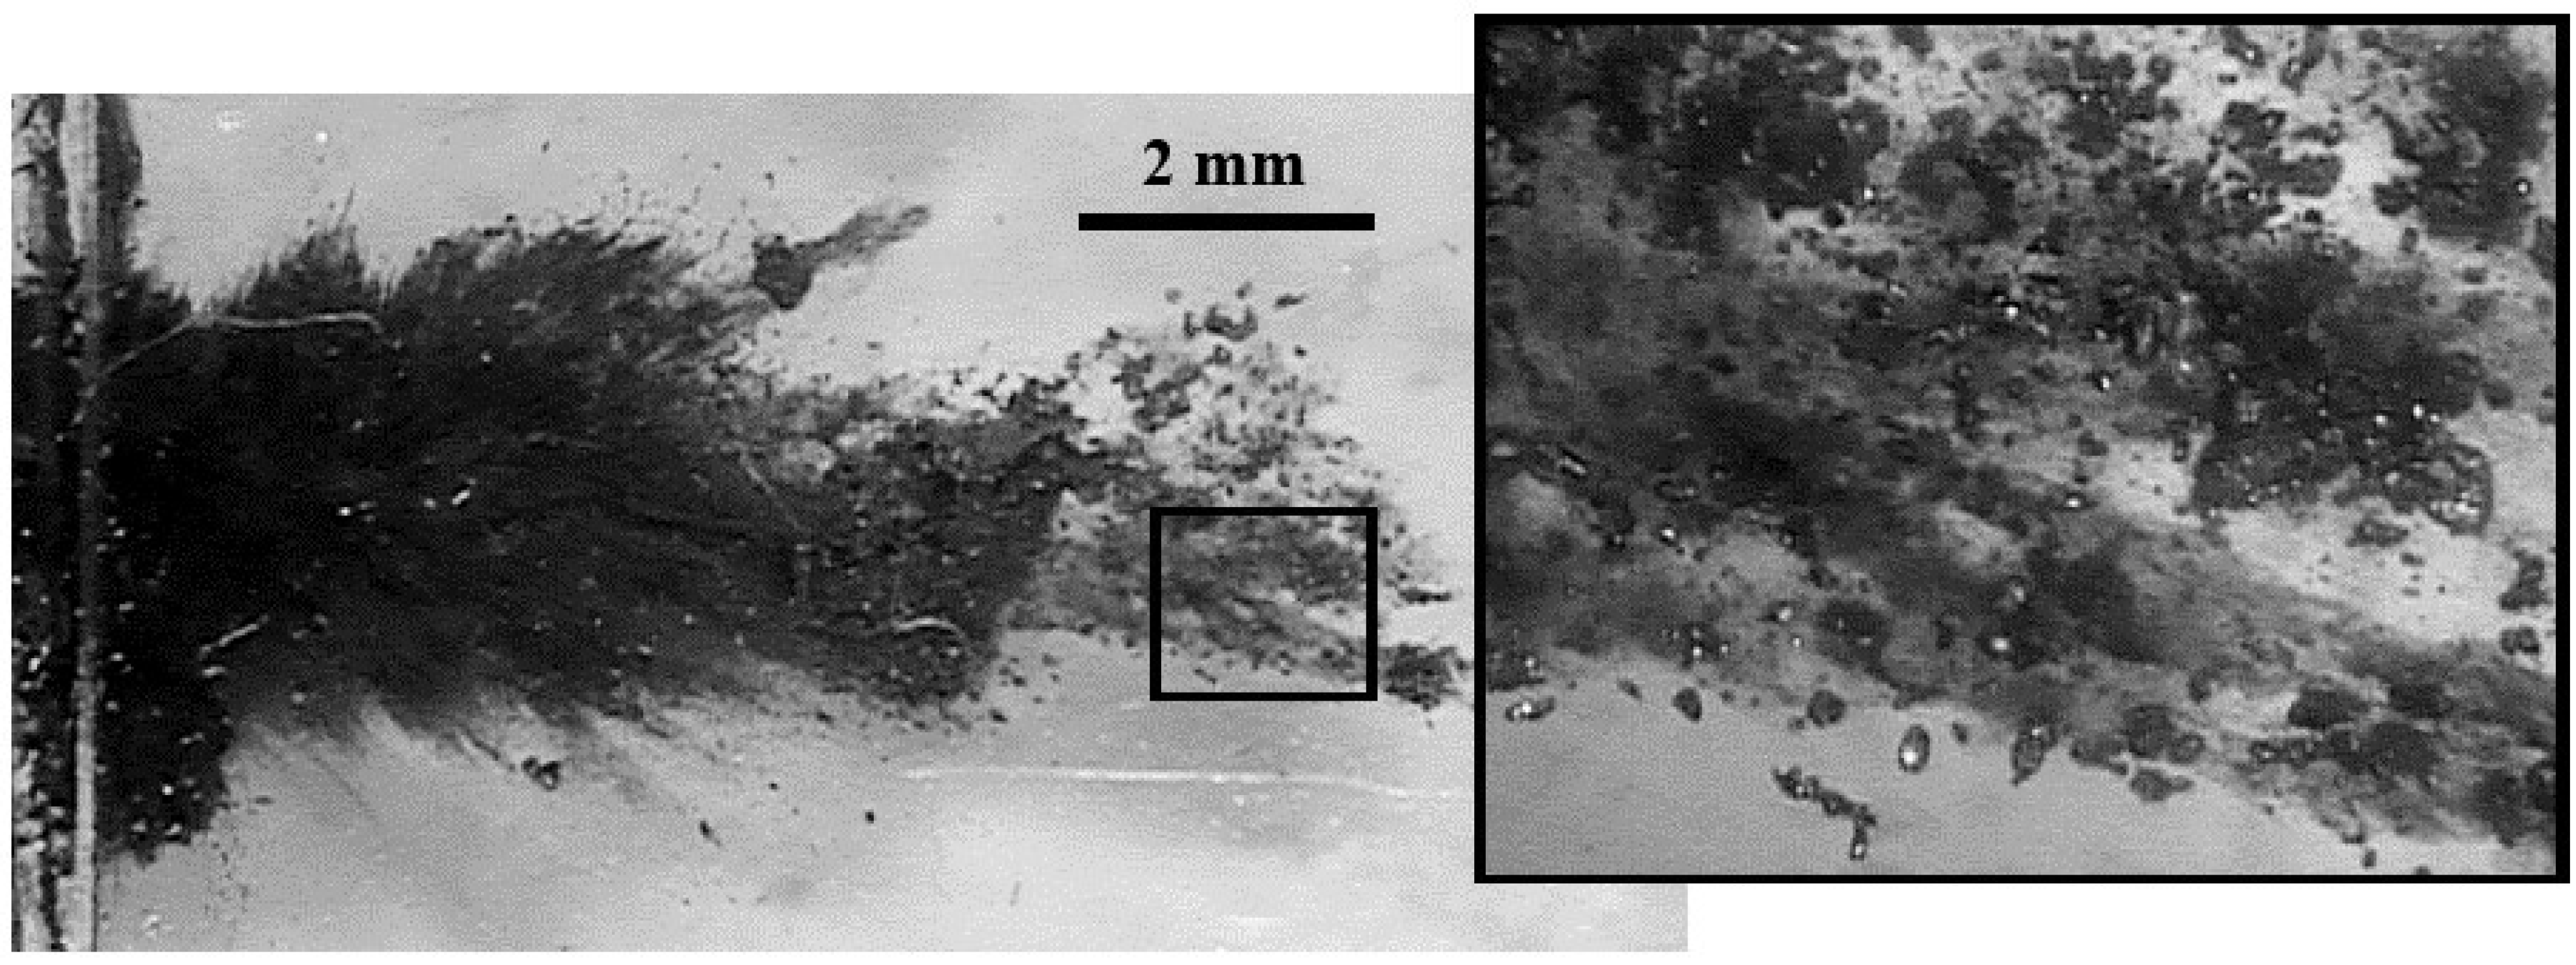
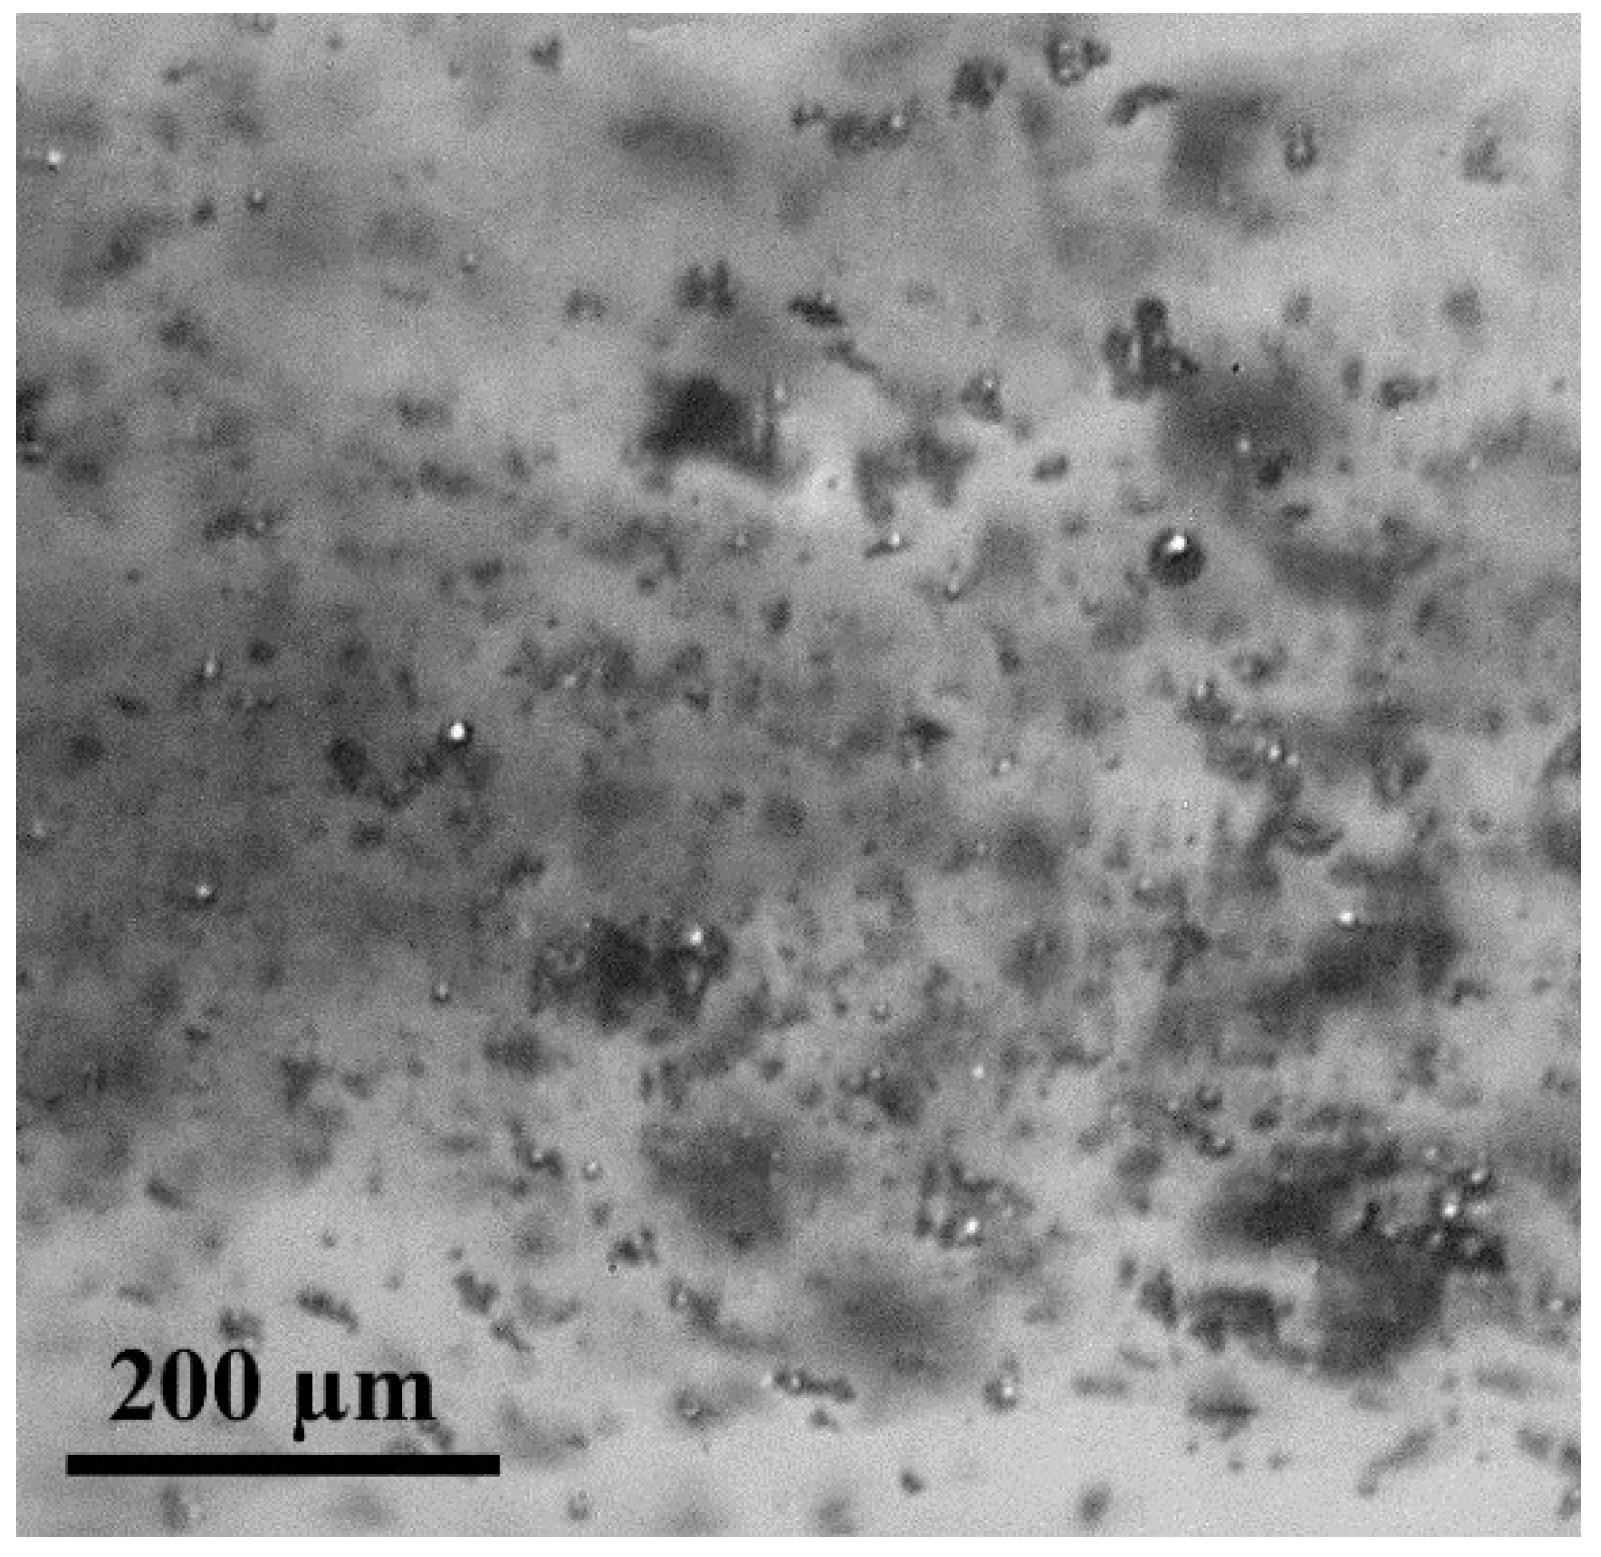
Figure 11.
Closer view of the Fe fragments recovered in the gel presented in
Figure 10b, after a 255 GPa laser shock, showing a mixture of solid debris of irregular shapes and perfectly spherical particles.
To help interpret the observations reported above, 1D computations of our experiments were performed with the hydrocode CHIC from the
Centre Lasers Intenses et Applications (CELIA, UMR 5107, Talence, France), Using the BLF multiphase equation of phase for Fe [
16,
17]. According to these calculations, which account for laser-matter interaction, heat conduction from the laser and plasma should affect a 10–18 µm-thick layer below the irradiated surface, for laser shocks of 255 GPa or 330 GPa, respectively. Further deep, melting of Fe is expected either on shock compression above 280 GPa or on isentropic release from shocked states between 280 and ~200 GPa. In the experiments above (
Figure 7,
Figure 8,
Figure 9,
Figure 10 and
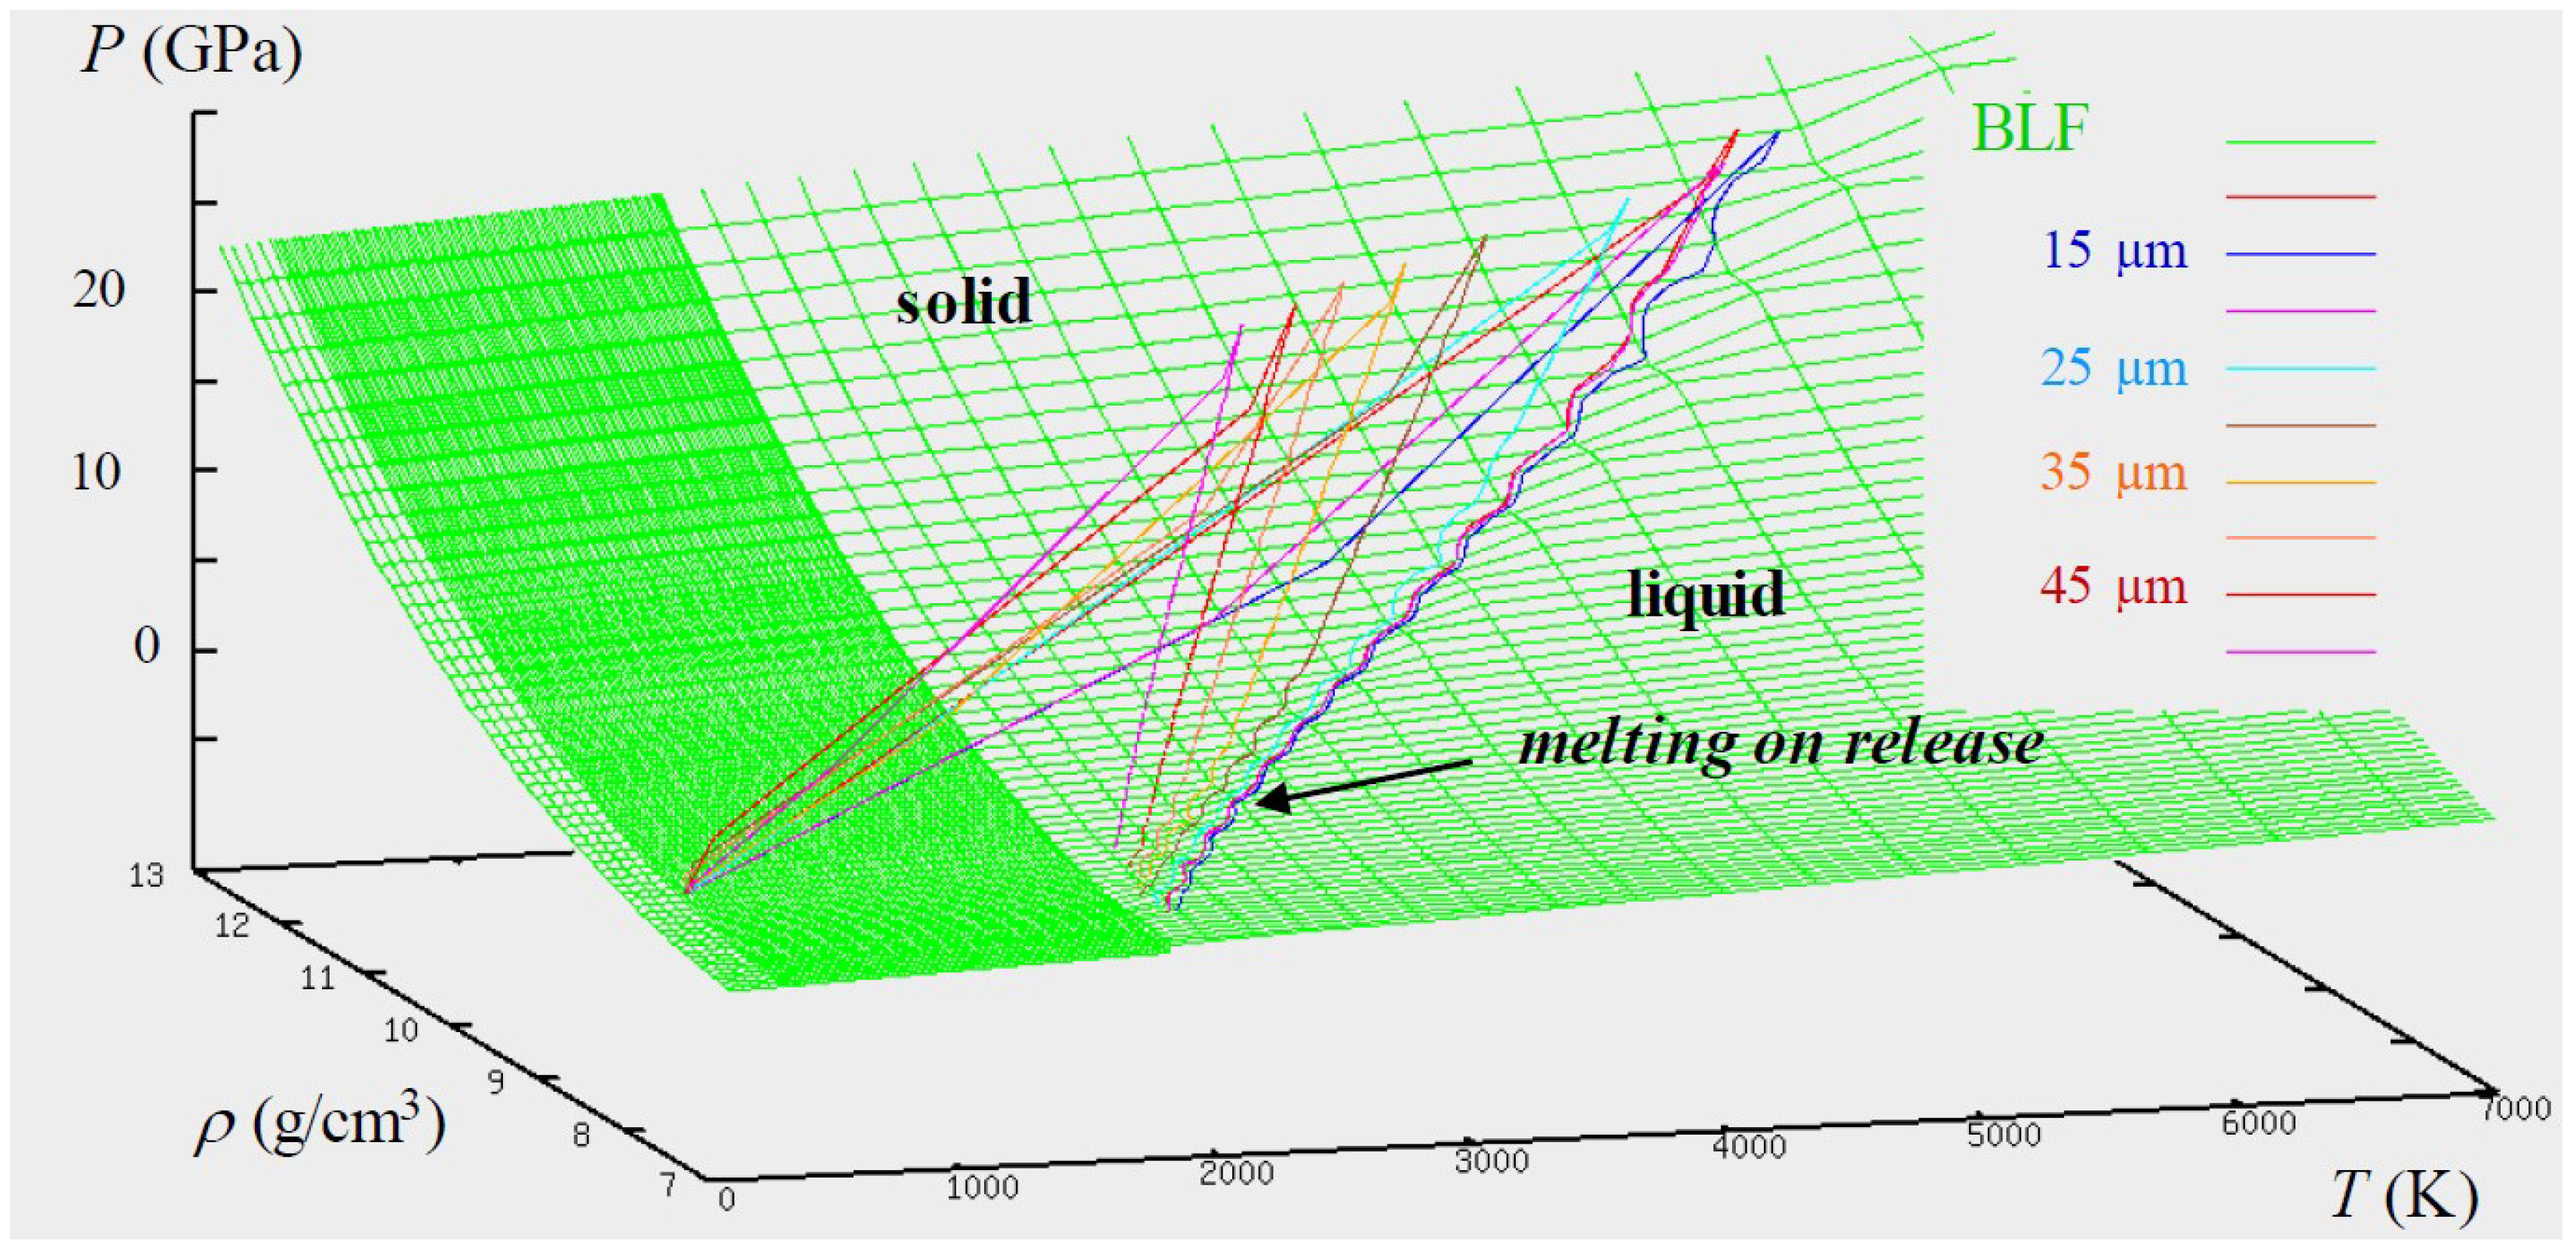
Figure 11), such melting would occur over a 40 µm depth in the 100 µm-thick sample subjected to the 255 GPa laser shock (
Figure 12), and over about 130 µm in the 250 µm-thick sample loaded to 330 GPa. Thus, in both cases, a large proportion of the target would melt, but tensile stresses generated near the free surface would be induced in solid Fe, so that the micro-spallation regime would not be reached. Solid spalled layers would be ejected first then deeper volumes of molten Fe might separate into liquid fragments of lower velocities (
Figure 13). This is qualitatively consistent with the observations within the gel (
Figure 11) and in the recovered sample (
Figure 14). Still, the assumption of spatially homogeneous laser irradiation underlying 1D calculations, seems rough (see
Figure 8b), and probably leads to an underestimation of the loading pressure in the central region,
i.e., the overall depth of shock-melted material.
Figure 12.
Simulation of the response of a 100 µm-thick Fe sample to a 255 GPa laser shock. The green grid is the tabulated Bushman-Lomonosov-Fortov (BLF) equation of state, where progressive melting appears as a smooth step between the solid and liquid surfaces in the pressure-temperature-density space. The coloured lines are the time histories of the states computed at increasing depths below the loaded surface, every 5 µm. They start with a sharp jump (2 or 3 points) up to the shocked state, then they follow an isentropic release back to ambient pressure. The shocked state always lies on the solid surface, but for the first 40 µm, the release path ends up in the mixed (solid-liquid) region. In other words, partial melting on release occurs over a 40 µm-thick layer below the loaded surface.
Figure 13.
Schematic interpretation of partial melting, subsequent spall fracture and debris ejection in laser shock-loaded Fe. Pale grey represents molten metal. Numbers in the last picture refer to
Figure 14.
Figure 14.
Scanning electron micrographs of an Fe sample recovered after a 255 GPa laser shock, consistent with the scenario depicted in
Figure 13: signs of extensive melting on the loaded side (
1); edge of the spall crater indicative of strain and fracture in the solid state (
2); relatively large molten volumes still attached to the sample (
3).
6. Conclusions
Because it involves a temperature increase, shock loading can induce melting in metals, either on compression or on release. Such melting affects subsequent fragmentation, which evolves from spall fracture in the solid state to micro-spallation in the liquid state. Laser driven shock experiments are well suited to investigate this transition, because they relatively easily attain high loading pressures, typically in the Mbar range (1 Mbar = 100 GPa), required for shock-induced melting, and because they allow partial recovery of both shocked samples and ejected debris. Data obtained from tin and aluminum provide unambiguous evidence of shock-induced melting and micro-spallation. In the case of iron, preliminary results presented here show significant melting in high intensity shots, but such melting is limited to a relatively thin depth below the loaded surface, as inferred from simulations based on a multiphase equation of state, so that fragmentation near the opposite free surface is still governed by solid-state spallation.
