A Social Network Analysis of the Impact of a Teacher and Student Community on Academic Motivation in a Science Classroom


1
Department of Psychology, University of Louisiana at Lafayette, Lafayette, LA 70504, USA
2
Department of Curriculum and Instruction, University of Louisiana at Lafayette, Lafayette, LA 70504, USA
*
Author to whom correspondence should be addressed.
Societies 2018, 8(3), 68; https://doi.org/10.3390/soc8030068
Submission received: 31 July 2018
/
Revised: 20 August 2018
/
Accepted: 21 August 2018
/
Published: 23 August 2018
(This article belongs to the Special Issue Community Participation and Action as A Remedy For Social Problems and A Catalyst for Human Development: A Global Perspective)
Abstract
:(1) Background: The Teacher and student community plays an important role in students’ academic development. Previous studies showed that students’ academic success is influenced by their social relations in school. This study extended to use a mix of social network analysis and survey methodology to understand how eighth-grade students’ network and perceived teacher’s support relate to their academic motivation. (2) Methods: A total of 95 eighth graders with the same teacher in a middle school in the southeastern United States were recruited. (3) Results: Results showed that the number of friendship nominations received (i.e., in-degree), degree centrality and betweenness centrality significantly correlated with higher academic motivation. In addition, a regression model analysis showed that perceived teacher’s support, together with more friendship nominations, predicted higher academic motivation.
1. Introduction
Social relations play a significant role in students’ academic success [1,2]. As the bioecological model states [3], children’s immediate context greatly influences their mental development. In the context of middle school students, the teacher and student community is particularly important in motivating students to achieve [4], as students spend most of their time interacting with people in the school community, including their classmates and their teachers. Therefore, the purpose of this study was to understand how a supportive (or non-supportive) teacher-student community was related to academic motivation using a mix of survey and social network analysis design.
1.1. Social Relations, Teacher’s Support and Academic Motivations
Previous research generally supported the relations between positive school environment and academic motivation [5,6]. For example, in a longitudinal study over a 10-week period [7], children who were rejected by peers were found to have more difficult adjustment issues, were more likely to avoid school and engaged less in classroom participation. The reason behind this relation was probably that students who were rejected might also receive more maltreatment, such as bullying. These negative experiences then kept these rejected students from engaging in learning. In other words, a negative school environment and negative relations greatly reduced student victims’ motivation to come to school and learn. On the other hand, in a study looking at sixth-grade students, peer acceptance was found to be positively related to academic achievement [8]. Specifically, students who were accepted (i.e., high in reciprocated friendship and peer acceptance) were found to experience more positive emotions (i.e., less distress), and lower level of distress was related to higher GPA. This study showed that higher academic achievement could be a result of good social relations experienced in the classroom.
Looking at belongingness instead of merely social relations, in a one-year follow-up longitudinal study [9], fifth-grade students’ school belongingness was found to relate to their achievement goal orientation. In a similar study, college students’ social relations and attachment to the school were also found to relate to academic motivation [10]. Focusing on social competence (a measure of social relations), a longitudinal study found that second-grade students’ social competence, rated by peer, predicted their academic achievement in the third grade [11]. In other words, when students felt accepted as members of the school community, their motivation to succeed increased.
Similarly, a teacher’s support was also found to play an essential role in students’ academic motivation [12]. For example, looking at third to fifth-grade students, a study found that teacher’s autonomy support (i.e., support that is not controlling) across a school year predicted children’s motivation and experiences in learning in the classroom [13]. In another study looking at older students (around 14–19 years old), autonomy support from teachers was significantly related to students’ intrinsic academic motivation [14].
This study extended previous findings to look at the relations between middle school students’ academic motivation and support received from their immediate classroom community, that is, classmates and their teacher. A mixed of social network and survey approaches was adopted to test the relations between such support and academic motivation. To eliminate confounding and to set a boundary for the size of the social network, this study focused on a specific middle school science classroom where all eighth-grade students were taught by the same science teacher.
1.2. Social Network Indices, Classroom Community and Academic Motivation
Social network methodology allows researchers to examine the role of popularity in a certain network (e.g., how often a student was nominated by other students as the best friends) in human behaviors. A typical classroom social network strategy involves asking students to nominate their best friends. In a directed social network model, the friendship that a student nominates is referred to as an outgoing link, while the friendship nominations the student receives from other students are called the incoming links. By using these incoming and outgoing links to compute various social network indices, students’ level of positive interactions or supports experienced in the classroom can be measured.
In this study, we employed six commonly used social network indices to examine how students’ social relations in the classroom relates to their academic motivation. These include in-degree, out-degree, degree centrality, betweenness centrality, closeness centrality and PageRank centrality. In-degree is the number of incoming links, i.e., friendship nominations a student receives. It indicates how popular the student is. Out-degree is the number of outgoing links, i.e., friendship nominations a student makes. Degree centrality takes into account both in-degree and out-degree and provides an estimate of how central or how important a node (i.e., a student) is in the network [15]. In-degree, out-degree and degree centrality examines a node’s local influences in their immediate relations (i.e., a student immediate friends’ circle), other centrality looks at a node’s influence in the whole network. For example, betweenness centrality examines how many times a node appears on the shortest paths in a network [16]. In other words, how often a person acts as a bridge connecting people in the network. Similarly, closeness centrality takes into account a node’s distance to all other nodes in the network [16]. In other words, closeness centrality in this study is the sum of the number of relationships it takes for a student to connect with other students in the class. Finally, PageRank, or Google’s PageRank, is an algorithm that takes into account both the number and quality of incoming links (i.e., the links’ connections) [17,18], instead of just counting the number of incoming links of the nodes. Among these indices, in-degree and PageRank centrality take into accounts incoming links only, while the other measures take into both incoming and outgoing links.
All these social network indices point to how much support a student received from their classroom community. As mentioned earlier, previous research found that perceived social support related to students’ academic motivation. Similarly, it was hypothesized that these social network indices would positively correlate with students’ academic motivation (hypothesis 1).
In addition, it was hypothesized that students’ support from classmates (indicated by in-degree or number of nominations from other classmates) and perceived teacher’s support would predict students’ academic motivation (hypothesis 2). Only one social network index was selected because the social network indices are usually highly correlated, and in-degree (number of classmate nominations) is one of the most representative of immediate, first-degree support received from classmates. Perceived teacher’s support (i.e., survey instrument) was chosen instead of a social network methodology, as it is difficult, if not impossible, to study a student-teacher social network. Therefore, it is more feasible to ask students their perception of support received from their teacher (e.g., how much they think their teacher cares about them). It is thus hypothesized that in a classroom, the support students received from their classmates (indicated by the in-degree computed through social network analysis) and perceived teacher’s support would positively predict their academic motivation (hypothesis 2).
2. Materials and Methods
2.1. Sample and Procedure
Data were collected from eighth-grade science classroom in a middle school located in the southern United States. All the students were taught by the same teacher. Parental consent of all participants was obtained before the survey. Students then participated through an in-class online survey. The study was conducted in accordance with the Declaration of Helsinki, and the protocol was approved by the Ethics Committee of University of Louisiana at Lafayette (FA17-28 EDCI).
A total of 95 students from five different sessions was recruited to participate an in-class online survey. One student was eliminated because of incomplete data. Among the remaining sample, 41 were female (43.6%), and 50 were male (53.2%). Three of them did not state their gender. Most of the participants were Caucasian (n = 52, 55.3%), followed by African American (n = 34, 36.2%), multiethnic (n = 5, 5.3%), Asians (n = 2, 2.1%) and Hispanic (n = 1, 1.1%). Most of the students identified their family as middle class/sufficient family (n = 74, 78.7%) and upper class/wealthy (n = 10, 85.1%). Two students (2.1%) reported that their family socioeconomic status was lower class/poverty and eight other students (8.5%) did not report their family socioeconomic status.
2.2. Measures
2.2.1. Social Network Measurement
Students were asked to nominate five students who were their best friends. They were then provided a space to write. Most students listed five students; however, some listed none and several others listed six students. Students nominated 122 students. Among them, 27 students were not participants of the survey. Those data were counted as incoming links in the social network analysis. However, since they did not take part in the study, they were not taken into accounts in the hypothesis testing.
2.2.2. Academic Motivation
Academic motivation was measured using a shortened version of an academic motivation scale used in a previous study [10]. The measurement consisted of three items. Sample items include, “I put much effort into the classes I take at school”, and “I’m really excited about the classes I am taking now at school.” Students then rated the item on a scale from 1 (strongly disagree) to 5 (strongly agree). Scores were averaged to form a mean. Cronbach’s alpha for the scale is 0.55. Although the alpha value was less satisfactory, previous studies showed that values above 0.50 or close to 0.60 showed acceptable reliability in social science research [19,20].
2.2.3. Perceived Social Support from the Class Teacher
Perceived social support from the class teachers was measured by the subscale of the Children and Adolescents Social Support Scale Level 2 (CASSS-2) [21]. The 6-item scale was validated to measure perceived support of adolescents from 6th to 12th grade. Sample items were “My teacher cared about me when I needed it,” “my teacher understood me,” and “my teacher helped me solve problems when I needed it.” Participants rated these items based on how much they agree with these statements from 1 (strongly disagree) to 5 (strongly agree). Cronbach’s alpha of the scale was 0.88, which was similar to previous studies [21]. Scores were averaged to form a mean score.
3. Results
3.1. Social Network Analysis
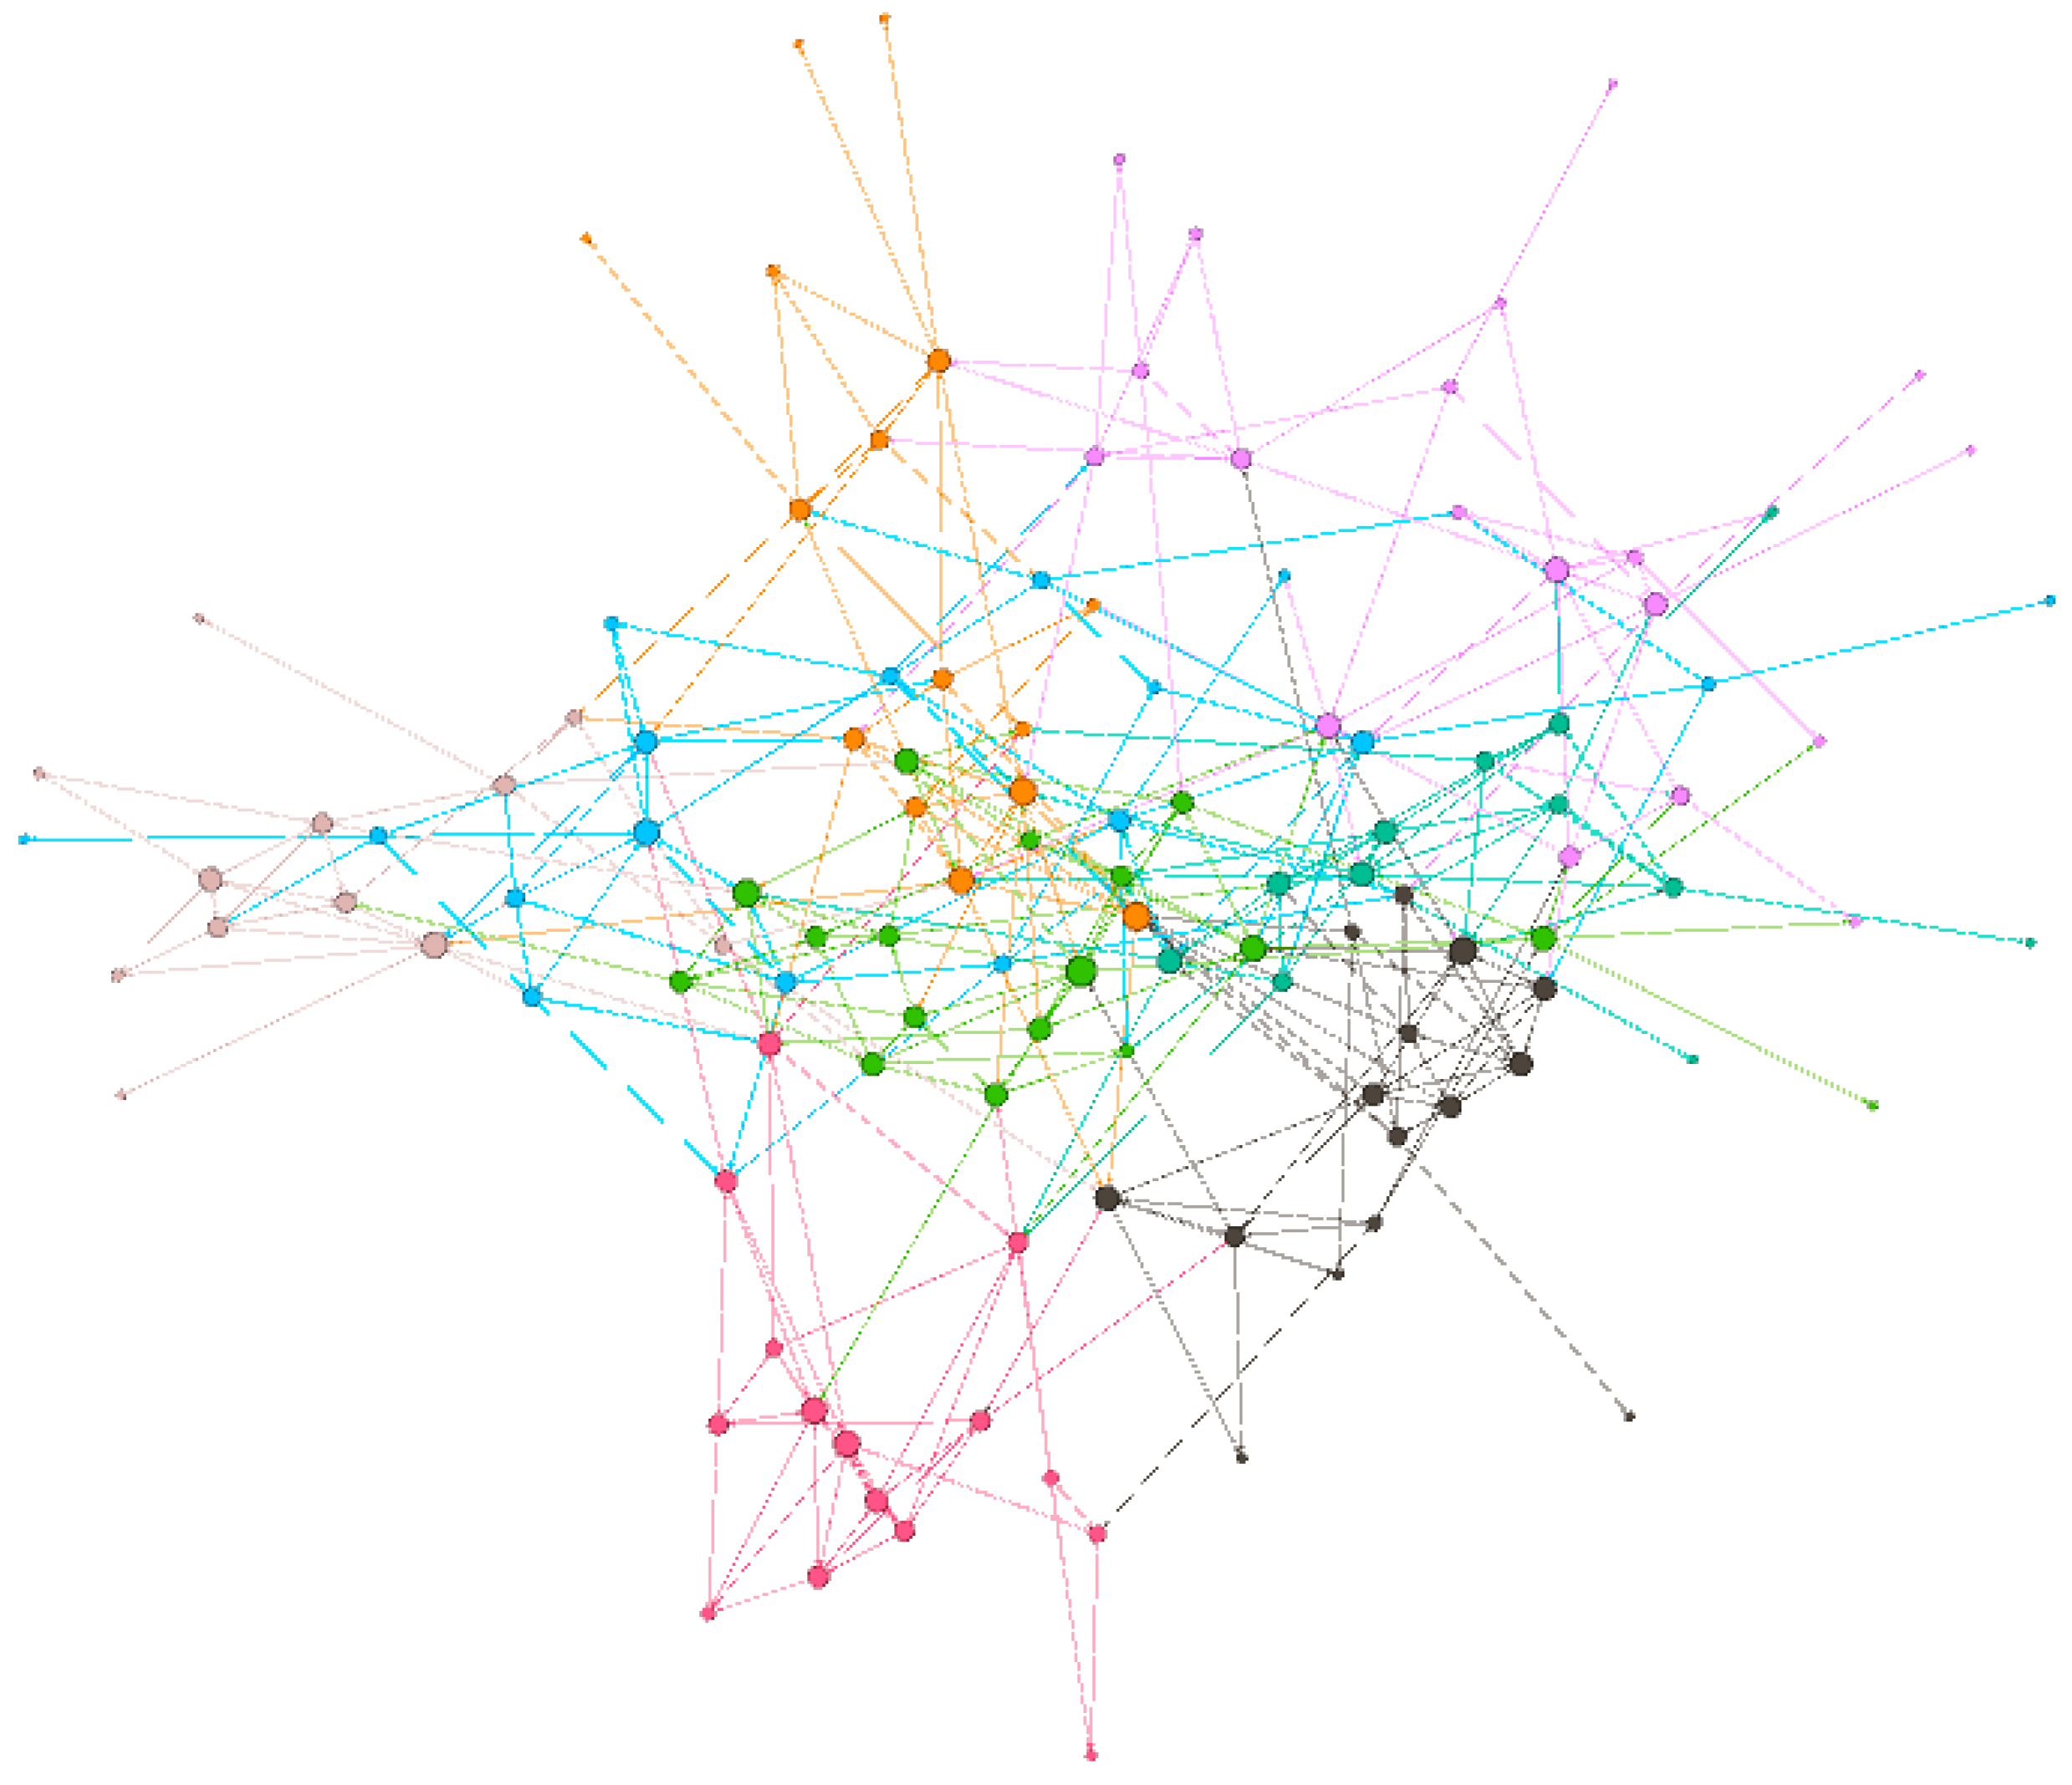
First, the sample’s social network was analyzed using Gephi 0.9.2 [22], an open-source software developed initially by University of Technology of Compiègne, France and managed by Gephi Consortium (https://gephi.org). The average degree of the network was 3.42, indicating that there were, on average, more than three friendships per student. Average in-degree of the network was 3.72, indicating that students, on average, were nominated by less than four other students. Average out-degree of the network was close to 5.00, as students were asked to nominate five of their best friends. The network diameter was 9.00, indicating that the farthest points were separated by nine relationships in between. The average path length was 4.18, indicating that the average distance between a node and their most distant nodes was about four links. The graph density was 0.03, indicating that the network was far from complete. In other words, not all possible edges were connected. Students did not seem to be all connected to one another. Modularity, an algorithm of detecting community network, was computed using resolution 1.0 and randomization [23,24]. Seven communities were identified, as shown by the different colors of edges in Figure 1. Each community had 11–22 members. The communities were not significantly different in academic motivation or perceived teacher’s support. The average clustering coefficients were 0.19.
3.2. Relations between Social Network Indices and Academic Motivation
To test hypothesis 1, the social network indices (in-degree, out-degree, degree centrality, closeness centrality, betweenness centrality and PageRank centrality) were computed for each participant using Gephi 0.9.2 [22]. The correlations between the indices and academic motivation were reported in Table 1. In addition, correlations between these variables and demographic variables (gender, race and socioeconomic status), and between social network indices and perceived social support from the class teacher were computed. However, none of the relationships were significant. For simplicity, the correlation coefficients were not included in Table 1.
As shown in Table 1, academic motivation was significantly related to indices that measure incoming links, that is, in-degree and PageRank centrality (marginal). Specifically, the more nominations a student got, the higher the student’s academic motivation was. Degree centrality, which takes into accounts both number of incoming and outgoing connections, was also significantly and positively related to students’ academic motivation. In addition, betweenness centrality was also found to relate positively to academic motivation. This means that the more frequently a student appears on other students’ shortest paths (i.e., serving as a bridge to connect other students in the network), the higher their academic motivation. The results generally supported our hypothesis that higher popularity (i.e., more student community support) was associated with higher motivation to achieve academically.
3.3. Testing the Hypothesized Model (Hypothesis 2)
Before the regression model analysis, Pearson’s correlation coefficients were computed for all the tested variables, as shown in Table 2. As expected, perceived teacher’s support was not related to classmate nominations (in-degree). Academic motivation was related to both classmate nominations (in-degree) and perceived teacher’s support. The demographic variables (gender, race and socioeconomic status) was not related to any of the tested variables.
A linear regression analysis using bootstrapping method (r = 5000) was performed to test whether students’ school community, represented by their classmate nominations and perceived teacher’s support in a science classroom, predicted their academic motivation (hypothesis 2). R 3.5.0 [25] and the package boot [26] were used to perform the analysis. As hypothesized and as shown in Table 3, the number of classmate nominations or in-degree (B = 0.08, S.E. = 0.03, t = 3.02, p = 0.003, 95% CI [0.03, 0.14]) and perceived teacher’s support (B = 0.50, S.E. = 0.08, t = 5.96, p < 0.001, 95% CI [30, 0.68]) positively predicted academic motivation. In other words, the more popular a student was in the science class, the higher the self-report academic motivation. Similarly, higher perceived teacher’s support predicted higher academic motivation. R2 of the regression model was 0.39, showing that these variables explained almost 40% of the variance of academic motivation. Model with only the two school community variables (students’ support and teacher’s support) accounted for 32% of the total variance of academic motivation. This result indicated that these two school community variables, a social network in students’ school community and perceived teacher’s support, are important predictors of students’ academic motivation.
4. Discussion
Our results showed that three out of six social network indices were positively associated with eighth-grade students’ academic motivation in a science classroom. Specifically, in-degree and degree centrality, which represented students’ immediate friendship network, were found to relate to higher academic motivation. In other words, the number of students’ friendship nominations was positively associated with students’ academic motivation. In addition, betweenness centrality, which represented students’ importance in connecting the whole classroom network, was also found to relate to students’ academic motivation positively. Therefore, our social network analysis showed significant relations between academic motivations and students’ friendship network in the class. Students who seemed to be more popular (and thus supported) in the classroom were found to have higher academic motivation. The result is consistent with other similar studies [27,28,29]. However, an earlier study found that neglected students (i.e., those that have less or no friendship nominations) had better grades than average students did [1], in a sample of sixth and seventh graders. The discrepancy may be due to the differences between academic motivation and actual grades. Popular students may feel more motivated to go to school and participate in the classroom, but they may, at the same time, participate in many other friendship activities and may not necessarily have time to study for tests. However, this is a speculation that requires further studies. Future studies can examine the relationship among academic motivation, grades, and moderating factors, such as the number of extracurricular activities and time spent on studying.
In addition to the social network indices, we also examined the role of the whole classroom community (i.e., classmates and teacher’s support) on students’ academic motivation. Our results showed that the number of students’ friendship nominations and perceived teacher support together predicted students’ academic motivation, after controlling for gender, race and socioeconomic status. The two variables explained almost one-third of the variance of students’ academic motivation, showing that the two variables are important predictors of students’ academic motivation. The other social network indices were not included, as the indices were highly correlated and could cause multicollinearity problems. Therefore, only one of the most representative index, in-degree (number of students’ nominations), was included in the regression model. Despite the inability to include all the indices, our results showed that students’ popularity and perceived teacher’s support both played significant roles in motivating students to learn.
The study was not without limitations. First, to simplify the survey for middle school students, we were not able to include more in-depth survey instruments. The social network prompt was also designed to be brief. Therefore, we only asked students to name five of their best friends in class. Although previous studies showed that students nominate a similar number of friends [28], some other studies found that students could name about 10 friends from a class [29]. The advantage of limiting students to name a small number of friends is that students will name students that are the closest to them. In the context of this study, limiting students to five friends allows us to know who their closest friends are. However, the disadvantage is that researchers are not able to understand the complete friendship network. Second, to limit our investigation in a specific science classroom in a middle school, we only examined one grade taught by one teacher. Therefore, we were not able to look at the student-teacher social network. Instead, we only asked students to report their perceived teacher’s support. Future studies may look at a bigger network with multiple students and teachers’ relationships. Third, our sample size is not sufficiently large. Therefore, this study should only be considered as preliminary. Future studies should increase sample size and make use of mixed method studies (e.g., interview and focus groups) to replicate the findings.
Despite the limitations, our study successfully extended previous studies to look at how social network indices and friendship nominations (instead of self-report social relations scale) are related to eighth-grade students’ academic life. In addition, a teacher’s support appeared to be another important factor in motivating students to learn. Therefore, schools may pay more attention to the development of positive social relations among students, as well as improving teacher-student relationships.
Author Contributions
Conceptualization, M.L. and H.S.; Investigation, M.L. and H.S.; Methodology, M.L. and H.S.; Formal Analysis, M.L.; Data curation, M.L.; Writing-Original Draft Preparation, M.L.; Writing-Review & Editing, M.L. and H.S.; Visualization, M.L.; Project Administration, H.S.
Funding
This research received no external funding.
Conflicts of Interest
The authors declare no conflict of interest.
References
- Wentzel, K.R.; Asher, S.R. The Academic Lives of Neglected, Rejected, Popular, and Controversial Children. Child Dev. 1995, 66, 754–763. [Google Scholar] [CrossRef] [PubMed]
- Song, J.; Bong, M.; Lee, K.; Kim, S. Longitudinal investigation into the role of perceived social support in adolescents’ academic motivation and achievement. J. Educ. Psychol. 2015, 107, 821–841. [Google Scholar] [CrossRef]
- Bronfenbrenner, U. Developmental ecology through space and time: A future perspective. In Examining Lives in Context: Perspectives on the Ecology of Human Development; American Psychological Association: Washington, DC, USA, 1995; pp. 619–647. [Google Scholar]
- Ryan, R.M.; Stiller, J.D.; Lynch, J.H. Representations of Relationships to Teachers, Parents, and Friends as Predictors of Academic Motivation and Self-Esteem. J. Early Adolesc. 1994, 14, 226–249. [Google Scholar] [CrossRef]
- Wentzel, K.R. Social Relationships and Motivation in Middle School: The Role of Parents, Teachers, and Peers. J. Educ. Psychol. 1998, 90, 202–209. [Google Scholar] [CrossRef]
- Ricard, N.C.; Pelletier, L.G. Dropping out of high school: The role of parent and teacher self-determination support, reciprocal friendships and academic motivation. Contemp. Educ. Psychol. 2016, 44–45, 32–40. [Google Scholar] [CrossRef]
- Buhs, E.S.; Buhs, E.S.; Ladd, G.W. Peer Rejection as an Antecedent of Young Children’s School Adjustment: An Examination of Mediating Processes. Dev. Psychol. 2001, 37, 550–560. [Google Scholar] [CrossRef] [PubMed]
- Wentzel, K.R.; Caldwell, K. Friendships, Peer Acceptance, and Group Membership: Realtions to Academic Achievement in Middle School. Child Dev. 1997, 68, 1198–1209. [Google Scholar] [CrossRef] [PubMed]
- Anderman, L.H.; Anderman, E.M. Social Predictors of Changes in Students’ Achievement Goal Orientations. Contemp. Educ. Psychol. 1999, 24, 21–37. [Google Scholar] [CrossRef] [PubMed]
- Li, M.; Frieze, I.H.; Nokes-Malach, T.J.; Cheong, J. Do friends always help your studies? Mediating processes between social relations and academic motivation. Soc. Psychol. Educ. 2013, 16, 129–149. [Google Scholar] [CrossRef]
- Welsh, M.; Parke, R.D.; Widaman, K.; O’neil, R. Linkages Between Children’s Social and Academic Competence: A Longitudinal Analysis. J. Sch. Psychol. Bur-Suck Asher 2001, 39, 463–481. [Google Scholar] [CrossRef]
- McDermott, R. Social Relations as Contexts for Learning in School. Harv. Educ. Rev. 1977, 47, 198–213. [Google Scholar] [CrossRef]
- Skinner, E.A.; Belmont, M.J. Motivation in the Classroom: Reciprocal Effects of Teacher Behavior and Student Engagement Across the School Year. J. Educ. Psychol. 1993, 85, 571–581. [Google Scholar] [CrossRef]
- Chirkov, V.I.; Ryan, R.M. Parent and teacher autonomy support in Russian and U.S. adolescents: Common effects on well-being and academic motivation. J. Cross Cult. Psychol. 2001, 32, 618–635. [Google Scholar] [CrossRef]
- Albert, R.; Barabási, A.-L. Statistical mechanics of complex networks. Rev. Mod. Phys. 2002, 74, 47–97. [Google Scholar] [CrossRef] [Green Version]
- Brandes, U. A Faster Algorithm for Betweenness Centrality. J. Math. Sociol. 2001, 25, 163–177. [Google Scholar] [CrossRef]
- Kwak, H.; Lee, C.; Park, H.; Moon, S. What is Twitter, a Social Network or a News Media? In Proceedings of the 19th International Conference on World wide web, Raleigh, NC, USA, 26–30 April 2010; pp. 591–600. [Google Scholar]
- Page, L.; Brin, S.; Motwani, R.; Winograd, T. The PageRank Citation Ranking: Bringing Order to the Web; Stanford InfoLab: Stanford, CA, USA, 1999. [Google Scholar]
- Hinton, P.R.; Brownlow, C.; McMurrary, I.; Cozens, B. SPSS Explained; Routledge: London, UK; New York, NY, USA, 2004. [Google Scholar]
- Moss, S.C.; Prosser, H.; Costello, H.; Hatton, C. Reliability and validity of the PAS-ADD Checklist for detecting psychiatric disorders in adults with intellectual disability. J. Intellect. Disabil. Res. 1998, 42, 173–183. [Google Scholar] [CrossRef] [PubMed]
- Malecki, C.; Demaray, M. Kilpatrick Measuring perceived social support: Development of the child and adolescent social support scale (CASSS). Psychol. Sch. 2002, 39, 1–18. [Google Scholar] [CrossRef]
- Bastian, M.; Heymann, S.; Jacomy, M. Gephi: An Open Source Software for Exploring and Manipulating Networks. Int. AAAI Conf. Weblogs Soc. Media 2009, 8, 361–368. [Google Scholar]
- Lambiotte, R.; Delvenne, J.-C.; Barahona, M. Laplacian dynamics and multiscale modular structure in networks. IEEE Trans. Netw. Sci. Eng. 2009, 1, 76–90. [Google Scholar] [CrossRef]
- Blondel, V.D.; Guillaume, J.-L.; Lambiotte, R.; Lefebvre, E. Fast unfolding of communities in large networks. J. Stat. Mech. Theory Exp. 2008, 10, P1000. [Google Scholar] [CrossRef]
- R Core Team. R: A Language and Environment for Statistical Computing. Available online: https://www.r-project.org/ (accessed on 1 May 2018).
- Canty, A.; Ripley, B. boot: Bootstrap R (S-Plus) Functions. R Packag. version 1.3-18. 2016. Available online: https://www.researchgate.net/publication/311467889_boot_Bootstrap_R_S-Plus_Functions (accessed on 1 May 2018).
- Shin, H. Examining Peer Selection and Influence Processes on Early Adolescents’ Academic Adjustment with Longitudinal Social Network Analysis. Ph.D. Thesis, University of Michigan, Ann Arbor, MI, USA, 2014. [Google Scholar]
- Shin, H.; Ryan, A.M. Early adolescent friendships and academic adjustment: Examining selection and influence processes with longitudinal social network analysis. Dev. Psychol. 2014, 50, 2462–2472. [Google Scholar] [CrossRef] [PubMed]
- Ryan, A.M. The Peer Group as a Context for the Development of Young Adolescent Motivation and Achievement. Child Dev. 2001, 72, 1135–1150. [Google Scholar] [CrossRef] [PubMed]
Figure 1.
Friendship network of the sampled middle school students. The colors of the edges (lines) indicated the modularity of the nodes, i.e., the community. The size of the nodes indicated the in-degree of the nodes, i.e., how often a node (a student) was being nominated as friends of another node (student).


Table 1.
Pearson’s correlation coefficients of the tested variables (# p < 0.10, * p < 0.05, ** p < 0.01, *** p < 0.001), N = 94.
Table 1.
Pearson’s correlation coefficients of the tested variables (# p < 0.10, * p < 0.05, ** p < 0.01, *** p < 0.001), N = 94.
| 1 | 2 | 3 | 4 | 5 | 6 | |
|---|---|---|---|---|---|---|
| 1. In-degree | - | |||||
| 2. Out-degree | 0.22 * | - | ||||
| 3. Degree centrality | 0.87 *** | 0.67 *** | - | |||
| 4. Betweenness centrality | 0.70 *** | 0.40 *** | 0.73 *** | - | ||
| 5. Closeness centrality | 0.17 | 0.90 *** | 0.59 *** | 0.43 *** | - | |
| 6. PageRank centrality | 0.90 *** | 0.23 * | 0.80 *** | 0.69 *** | 0.19 | - |
| 7. Academic motivation | 0.27 ** | 04 | 0.22 * | 0.25 * | 0.07 | 0.17 # |
Table 2.
Pearson’s correlation coefficients of the tested variables (# p < 0.10, * p < 0.05, *** p < 0.001). Race/ethnicity was recoded as White vs. non-White. Socioeconomic status measured students’ perceived family social class. It is a 3-step measure that includes lower class/poor, middle-class/sufficient, and upper class/wealthy.
| N | 1 | 2 | 3 | 4 | 5 | |
|---|---|---|---|---|---|---|
| 1. Academic motivation | 94 | - | ||||
| 2. Classmate nominations (In-degree) | 94 | 0.25 * | - | |||
| 3. Perceived teacher’s support | 93 | 0.36 *** | 0.02 | |||
| 4. Gender [Male] | 91 | −0.16 | 0.02 | 0.10 | ||
| 5. Race [White] | 94 | 0.06 | 0.14 | −0.04 | −0.07 | - |
| 6. Socioeconomic status (3-step) | 86 | 0.13 | 0.09 | −0.19 # | −0.19 | −0.03 |
Table 3.
Linear regression model results using bootstrapped method (r = 5000). The reference group of students’ perceived family socioeconomic status was lower class.
Table 3.
Linear regression model results using bootstrapped method (r = 5000). The reference group of students’ perceived family socioeconomic status was lower class.
| B | S.E. | t | p | Bootstrapped (r = 5000) 95% CI | |
|---|---|---|---|---|---|
| 1. Classmate nominations (In-degree) | 0.08 | 0.03 | 3.02 | 0.003 | [0.03, 0.14] |
| 2. Perceived teacher’s support | 0.50 | 0.08 | 5.96 | <0.001 | [0.30, 0.68] |
| 3. Gender [Male] | −0.02 | 0.12 | −0.24 | 0.812 | [−0.26, 0.22] |
| 4. Race [White] | −0.18 | 0.12 | −1.49 | 0.134 | [−0.39, 0.05] |
| 5. Socioeconomic status [Middle class] | −0.96 | 0.39 | −2.44 | 0.017 | [−2.01, 0.01] |
| 6. Socioeconomic status [Upper class] | −0.85 | 0.43 | −1.97 | 0.052 | [−1.97, 0.27] |
| R2 | 0.39 |
© 2018 by the authors. Licensee MDPI, Basel, Switzerland. This article is an open access article distributed under the terms and conditions of the Creative Commons Attribution (CC BY) license (http://creativecommons.org/licenses/by/4.0/).
Share and Cite
MDPI and ACS Style
Li, M.; Stone, H.N. A Social Network Analysis of the Impact of a Teacher and Student Community on Academic Motivation in a Science Classroom. Societies 2018, 8, 68. https://doi.org/10.3390/soc8030068
AMA Style
Li M, Stone HN. A Social Network Analysis of the Impact of a Teacher and Student Community on Academic Motivation in a Science Classroom. Societies. 2018; 8(3):68. https://doi.org/10.3390/soc8030068
Chicago/Turabian StyleLi, Manyu, and Heather Nicole Stone. 2018. "A Social Network Analysis of the Impact of a Teacher and Student Community on Academic Motivation in a Science Classroom" Societies 8, no. 3: 68. https://doi.org/10.3390/soc8030068
Note that from the first issue of 2016, this journal uses article numbers instead of page numbers. See further details here.