Confirmatory Factor Analysis of Assets That Influence Informal Garment Workers’ Livelihood Security in Laos


1
Center for Research on Plurality in the Mekong Region (CERP), 1st Floor, HS.02 Building, Faculty of Humanities and Social Sciences, Khon Kaen University, 123 Mittapap Rd., Muang District, Khon Kaen 40002, Thailand
2
Department of Social Development, Faculty of Humanities and Social Science, Khon Kaen University, 123 Mittapap Rd., Muang District, Khon Kaen 40002, Thailand
*
Author to whom correspondence should be addressed.
Societies 2018, 8(3), 45; https://doi.org/10.3390/soc8030045
Submission received: 19 May 2018
/
Revised: 14 June 2018
/
Accepted: 18 June 2018
/
Published: 21 June 2018
Abstract
:Laos is a socialist transition economy that has continued to increase its household characteristics, social assets, and human assets, all of which significantly influence livelihood security. The study sample generated 333 responses with confirmatory factor analysis (CFA) conducted using the LISREL software 9.30 for Window. The statistical model showed good fit with χ2/df = 62, CFI (comparative fit index) = 0.968, GFI (goodness-of-fit index) = 0.969, and RMSEA (root-mean-square error of approximation) = 0.0358, respectively. The findings confirmed that the standardized coefficients for household characteristics (β = 0.429, p < 0.01), social assets (β = 0.505, p < 0.01), and financial assets (β = 0.423, p < 0.01) positively influenced livelihood security. The implication of the current findings regarding the model will be discussed.
1. Introduction
Laos has been concerned with the ongoing and gradual implementation of the new economic mechanism since 1986, when the country transitioned from a socialist economy into a more market-oriented economy [1,2]. The primary aim of new economic mechanism was to reform the agriculture sector (agriculture production to self-reliance), state-owned enterprises (public-sector investment), increase industrialization (promoting foreign direct investment), and support the economic growth (by increasing manufacturing production). Along with the public enterprise mechanism, major steps towards the socialist transition economies are now scheduled for privatization. The private sectors played a significant role in the national economy, contributing 40% of gross domestic product (GDP), and having created 1.3 million jobs in Laos [3].
Laos is one of the socialist transition economies that has had to confront its informal economy, an issue that 85% in the ASEAN Economic Community (AEC) countries have also dealt with. According to the National Human Development Report [4], informal workers continued to rise from 70.1% in 2005 to 79.4% in 2010, and then to 85% in 2015. These informal workers are categorized into several segments: 49% employed in household sectors, 43% employed in contemporary work, and only 8% were in the outsourcing of manufacturing production. With regard to the skill level of laborers, these workers were 85.2% unskilled, 8.5% skilled workers, and only 6.3% professional skilled. In 2010, the industrial sectors in Laos were downsized in order to reduce the exploitation of workers in informal economies. Regarding the overall exploitation of laborers, more than 10,000 in 2010 were exploited, which then increased to 12,000 in 2015, and is expected to increase to over 15,000 workers in 2020 [5,6].
The structure of employment in Laos changed during the transition from the formal to the informal economy. According to Bourdet [7], informal workers were unprotected by existing labor law, especially regarding social security, labor protection, welfare, and health care. The underlying impetus for the change was linked to employment conditions that have not reverted back to their earlier employment in the formal sectors. These workers were highly skilled laborers, but they cannot access employment opportunities, they face risk in subcontracting, and are vulnerable to context. Dickerson and Green [8] explained that the informal economies are more available to workers, but they must battle against employment insecurity, uncertain incomes, and poor working conditions and livelihoods. A large informal economy, characterized by poor livelihoods due to its access to jobs, faced the potential for productivity shock, seasonal employment, and vulnerability contexts [9].
These findings are extended by Rahman et al. [10] who point out that informal economy workers used their assets for seeking new employment opportunities. In addition, the sustainable livelihood (SL) framework investigated the relationship between assets in suitable livelihood strategies [11,12,13,14,15]. For example, their assets may be sequentially related, and the workers generated social assets (trust, support, participation, and relationship) to create their employment opportunity, which may increase their financial assets (incomes, saving, and debt). These collectively comprised their livelihood security. Indeed, Arun et al. [16] identified that assets are transformed into social asset accumulation, which motivate the human assets and may increase the financial assets.
Despite the theoretical rigor in the existing literature and the methodological robustness of the data analysis, no previous studies have confirmed that the assets positively and significantly influence livelihood security. However, Kawaguchi et al. [17] hypothesized that social trust, social interaction, social relation, and social participation are positively correlated with their incomes. This study highlighted that social asset accumulates to build the trust of workers and results in creating employment activities [18]. As Giza et al. [19] found, high levels of social assets have a strong positive effect on informal workers’ financial assets. Emerson [20] and Chen et al. [21] demonstrated that social assets have a significant positive effect on income returns and results in worker wellbeing. Creed and Watson [22] and Bardasi and Francesconi [23] suggest that social assets in typical employment would be associated with the benefits of wellbeing.
The objective of this study is to examine how CFA of informal worker assets influence livelihood securities. First, the study measured the household characteristics of workers in the informal garment sectors. Second, the study examined the social assets associated with contributions to livelihood security. Third, the study specified financial assets as most important for workers’ livelihoods.
The remainder of this paper is structured as follows. It introduces the informal economy worker assets of Laos in Section 1. The literature and hypothesis development are in Section 2. We describe the experimental data and the methods used to fit the data in Section 3, followed by the results in Section 4. The results are discussed in Section 5. Section 6 provides a brief conclusion.
2. Literature and Hypothesis Development
2.1. Household Characteristics
Household characteristics have most often been used as units of analysis with variables such as age, gender, marriage, education, and family size [24]. Previous authors [25,26] have explained the basic household living standard chosen is socioeconomic status, which includes occupation, education, household size, and age. Further strong factors measure gender, age, average skill levels of workers, and family sizes [27]. For example, higher-wealth households are indexed using incomes, saving, consumption, and employment status [28]. Some authors [29] used occupation levels, education, number of workers, and family sizes. These studies illustrate the influence of socio-demographics using gender, marriage status, and young workers [30,31].
2.2. Social Assets
The existing empirical literature examining social assets [32,33] also included informal economy workers to create a measure for the trust of workers and employment relationships. Crudelia [34] identifies that social assets are based on community support and participation to create neighboring relationships. In the collective-good view of social capital, Uzzi [35] finds that family support, interaction, and relationship feed into higher levels of generalized trust among workers employed in household sectors. Brisson et al. [36] and Woolcock et al. [37] demonstrated the importance of the adoption the workers’ trust domain of social assets to create employment activities. As observed by Villalonga-Olive et al. [38] and Leventhal et al. [39], analytical explanations for the accumulation of social capital are based on the measure of long-established employment wellbeing of informal economy workers.
2.3. Financial Assets
The factor structure of financial assets is divided into three main ideas: incomes (income and sources), accumulation (savings), and consumption (debt and loan) [40]. Reviewing this issue, Ribeiro et al. [41] found that employment activities create financial assets (income, wage-employment, and savings). It identified the financial items as wages (income) that can be accumulated (savings) to generate benefits comprising livelihood security [42,43]. Chi [44] illustrated that employment activities, like skilled labor to produce high-income earners, accumulates assets as a means of livelihood. Morales et al. [45] used employment as the basis of workers’ incomes and livelihoods. These factors are used in Stikeleather [46], who found benefits from offering workers a financial reward like earning income, wages, working hours, and the ability to earn based on piece-rate.
2.4. Livelihood Security as Wellbeing
Livelihood security as a form of wellbeing was not adequately studied in the past, which was empirically defined to measure household wellbeing [21,47,48]. Bardasi and Francesconi [23] in their study provided an illustration of the influence of employment wellbeing on livelihood security. Similarly, Mokhtar and Husniyah [49] determined stress, knowledge, and behavior was significantly associated with financial wellbeing. Some studies also highlight the importance of asset building, which could otherwise aid worker incomes and employment wellbeing [21,22,39]. Promphakping [50] identified these factors in the choice of workers regarding how to earn a living and therefore shape their wellbeing.
2.5. Study Hypothesis
In order to address hypotheses, development of the variables must be done to apply CFA. We hypothesized that household characteristics results found in the literature [24,25,26,27,28,29,30,31] are applicable. Thus, this study hypothesized that social assets positively influence livelihood security [32,33,34,35,36,37]. In addition, we assumed that finical assets positively influence livelihood security [40,41,42,43,44,45,46]. The following three hypotheses were tested with CFA:
Hypothesis 1.
Household characteristics positively influence informal garment workers’ livelihood security in Laos.
Hypothesis 2.
Social assets positively influence informal garment workers’ livelihood security in Laos.
Hypothesis 3.
Financial assets positively influence informal garment workers’ livelihood security in Laos.
3. Methods
3.1. Data Collection
Data were obtained from January 2017 to January 2018 among garment workers in Xaythany, Vientiane, Laos. The study recruited participants from three groups, including kinship workers, local workers, and female post-industrial workers who are currently employed in family garment entrepreneurial sectors. The criteria for selecting the participants were: (i) registration account; (ii) occupational groups; (iii) current employed in family garment entrepreneurial; and (iv) lived in Xaythany, Vientiane. All procedures were approved by the Khon Kaen University Ethics Committee for human research of social and anthropology studies based on the Declaration of Helsinki (No. HE593008). To ensure the validity of the structural schedule interview, the authors selected three experts for testing the pilot.
3.2. Sample Size
The population sample generated 333 responses to the structural schedule interview. The descriptive analysis of sample size indicated that 91.9% were female and 8.1% were male. Respondents’ ages ranged from 19 to 29 years (78.9%), and 30 to 39 years (21.1%). Marital status results were: married (68.4%), single (25.4%), and separated (6.2%). Family size ranged from four to six persons (76.3%), and one to three persons (23.7%). Completed education levels included primary school (79%) and high school (21%).
3.3. Measurement
The manifest variables in this study were household characteristics (age and gender), social assets (trust workers, community support, community participations, neighboring relationship, employment relationship, household interaction, household relationship), and financial assets (income sources and incomes). The latent variable of the study was livelihood security, which is designed to measure household wellbeing and employment. These items were used as the observed variable loading in the latent variable of livelihood security. All of the items were graded by five options: 1 (very poor) to 5 (very good) [51]. A dummy variable was assigned the number “1” to indicate the presence of attribute and “0” the absence of attribute. From the sample, we pre-tested 30 participants for internal consistency, which was excellent for the total scale (α = 0.924), providing an acceptable correlation between items [52].
3.4. Statistical Analysis
The statistical analyses were performed in LISREL software 9.30 for Window of Scientific Software International, Inc., Lincolnwood, IL, USA [53]. Before doing CFA, we conducted the Kaiser-Meyer-Olkin test with a resulting value of 0.798 > 0.50 and Bartlett’s test of sphericity (p = 0.001) for sampling adequacy. In developing the initial model, Bentler [54] compared the standardized coefficients (β), along with the standardized solution, and the t > 1.96, which means * p < 0.05; t > 2.58 means ** p < 0.01. According to Pesaran and Smith [55], the criteria of R2 scores were greater than value 0.75, which was accepted in the testing of the CFA model. The validity of the model was tested for initial fitness and is shown in Table 1.
4. Results
We analyzed the factors, 12 manifest variables, and 2 latent variables within a CFA conducted using the LISREL 9.30 software. Table 2 shows the descriptive statistics for the average scale of the items included in the analysis. Factor 1 included two items, factor 2 included eight items, factor 3 included two items, and the latent included two items.
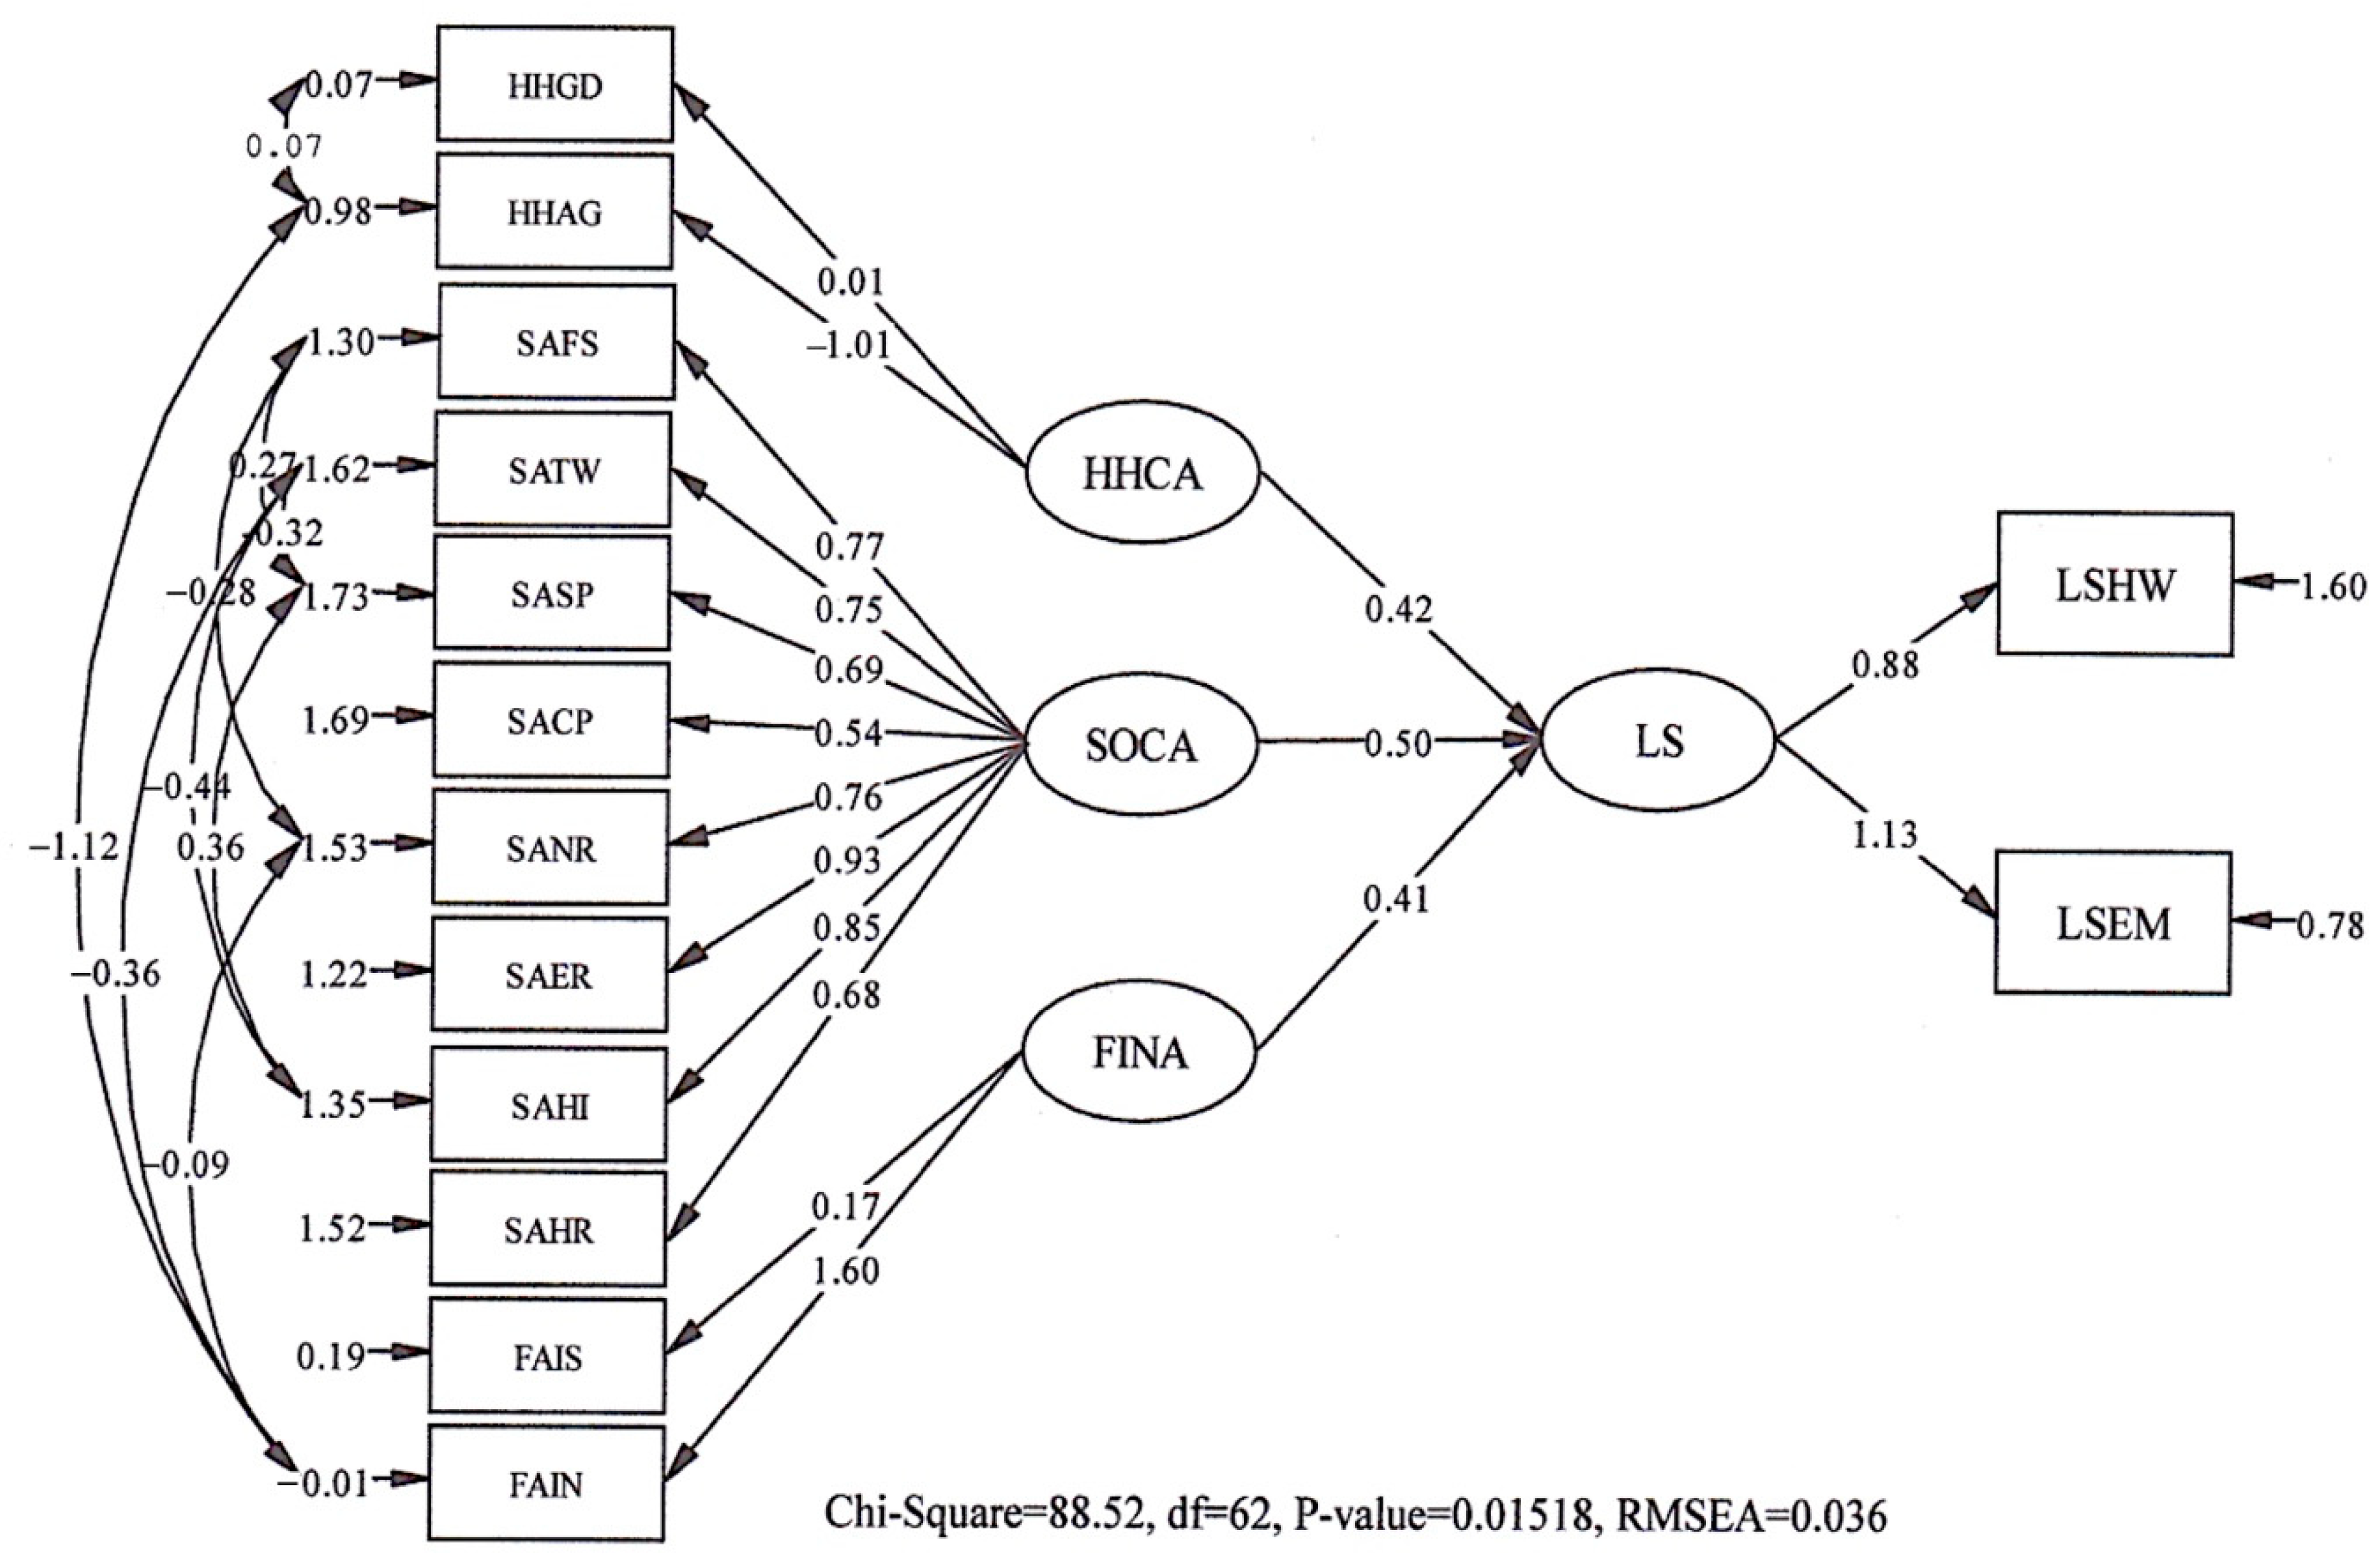
Overall, the findings in this study have data with a goodness of fit. The CFA showed that χ2/df = 62, CFI = 0.968, GFI = 0.969, and RMSEA = 0.0358, respectively. The squared correlation 88% (R2 = 0.880) showed that there was a positive influence on livelihood security. Table 3 shows the factor correlation between assets and livelihood security. The household characteristic score was (0.297, p < 0.01), social assets (0.829, p < 0.01), and financial assets (0.198, p < 0.01). The main total standardized effect is interpreted in Table 4.
We further investigated the hypothesis that assets positively influence livelihood security. The findings confirmed that the household characteristics (β = 0.429, p < 0.01), of which direct effects accounted for 0.371, positively influenced livelihood security; therefore, (H1) was fully supported. Regarding social assets (β = 0.505, p < 0.01) of which direct effects account for 0.436; therefore, (H2) was fully supported. Lastly, the financial assets (β = 0.423, p < 0.01) with a direct effect of 0.365, means that (H3) was fully supported. The final CFA model is summarized in Figure 1 and Table 5.
5. Discussion
The aim of this research was to examine via CFA how the factor structure of assets positively influenced livelihood security. The overall results of the model fit the data well, and all factors are significant at p < 0.01, and have a squared correlation of 88% (R2 = 0.880). The findings supported the original three structure factors (household characteristic, social assets, and financial assets) that influenced livelihood security and then comprised wellbeing [21,23,32,47,48,50]. We confirmed the findings of previous explanatory research [56,57,58] and a summary is discussed subsequently. The results showed that the assets are mostly positively related to each other in various countries (see also References [49,56,59,60,61,62,63]). Schinckus [57] found that higher social asset accumulation is influenced by employment status and may increase cash holding returns to the incomes comprising their livelihoods.
First, findings indicated that the social assets were significantly higher among informal economy workers that reported increased levels of livelihoods in Laos. It did not, thereby, complement similar evidence in other studies [58,64,65,66,67] that found that social assets (trust, support, participation, interaction, and relationship) were correlated with employment activities. In a survey by Parizeau [52], it was found that informal workers in Argentina relied on social assets for holding their incomes to enhance the livelihoods. This finding recognizes that social assets are a complex of its workers and yields significant economic returns. Therefore, it could be argued that the relationship of employment social assets was not a function of trust workers; rather, it is more reflective of the context and structure of employment.
As argued by Bebbington and Perreault [68], social assets can be organized and transformed, which are important for workers producing the livelihoods. The evidence also pointed to social asset allocation as another important factor affecting the informal economy workers in Africa. Indeed, following Lyons and Snoxell [69], social assets have long-established the opportunity for building relationships of trust in places of employment, which enables them to ensure livelihoods. Social assets played a central role in the creation of informal economy workers’ livelihoods. Lyon [70] criticized the assertion that social assets create trust between workers in active participation and employers, which is an increasingly important factor of employment activities.
Second, results indicated that the financial assets were the most important factors that directly affected livelihood security, supporting the findings of previous studies [40,42,46]. This was consistent with Brown and Taylor [71] and Daovisan et al. [72], who indicated that financial assets have a positive impact because of the saving-to-incomes from selling labor in the form of employment activities. Dunn and Holtz-Eakin [73] found that financial assets are a relied-on resource to produce incomes from wage-and-salary exchanges into livelihood security. According to Bruno et al. [42], incomes directly support workers by giving employment wellbeing. However, as illustrated by Erenstein et al. [74], financial assets can be stored, accumulated, exchanged, and allocated to enhance the quality of life.
Despite the positive findings and insights described above, this study contains limitations. Not all assets in the study could be measured. In an informal economy, worker assets may be difficult to define and measure precisely. Writing on livelihoods in Laos, Mclean [75] suggests that the assets are multifaceted factors, which misses all-encompassing power relations. This highlights that there is a need to recognize that measuring assets is often highly contextualized because the specific indicators of informal economies will vary between contexts. In a situation of informal employment, some assets are permanently destroyed; it is a form of assets not fully encompassed by the ‘capital’ outlines in the sustainable livelihood model [76].
A drawback of this approach is that it did not measurably include the human assets, physical assets, and natural assets. We found a different, but interesting, result in presenting the five types of capital assets, which were social, human, financial, physical, and natural [32,77,78]. However, Su et al. [79] argued that informal workers reliance on employment activities differ across their assets did not comprise the livelihoods. Barua at al. [80] noted that the loss of physical assets may increase social assets with higher financial assets. According to Daovisan et al. [72], the natural assets in a socialist country were controlled by public authority.
6. Conclusions
The findings of CFA confirmed that three factors (household characteristics, social assets, and financial assets) positively influenced livelihood security in Laos. These results were also linked most strongly with social assets via employment activities and may increase financial assets that comprised the livelihood security [32,34,40,44]. Also, consistent with Guiso et al. [19], Emerson [20], and Chen et al. [21], the current study confirmed that social assets are an essential resource to build employment belonging with a significant positive effect on income returns to the workers’ wellbeing. It is also important that the CFA model requires further investigation regarding the strength of assets in socialist transition economies. Future research should explore the assets (human, physical, and natural) as an additional factor with the potential to be used in model analysis. More research is needed, however, to be grounded within the qualitative and quantitative forms to diminish the gap between theoretical and empirical investigations.
Author Contributions
Hanvedes Daovisan and Thanapauge Chamaratana provided equal contribution to this study.
Funding
The research was made possible by the financial support from the Center for Research on Plurality in the Mekong Region (CERP), Faculty of Humanities and Social Sciences, Khon Kaen University, 40002, Thailand.
Conflicts of Interest
The authors declare no conflict of interest.
References
- John, R.B. End of the beginning: Economic reform in Cambodia, Laos, and Vietnam. Contemp. Southeast Asia 1997, 19, 172–189. [Google Scholar] [CrossRef]
- Carment, D.; Landry, J.; Samy, Y.; Shaw, S. Towards a theory of fragile state transitions: Evidence from Yemen, Bangladesh and Laos. Third World Q. 2015, 36, 1316–1332. [Google Scholar] [CrossRef]
- Sondergaard, L.M. Lao Development Report; World Bank Group: Washington, DC, USA, 2014. [Google Scholar]
- National Human Development Report. Employment and Livelihoods Lao PDR; Ministry of Planning and Investment and UNDP Lao PDR: Vientiane, Laos, 2009; Available online: http://hdr.undp.org/sites/default/files/lao_nhdr_2009_en.pdf (accessed on 17 May 2018).
- Phouxay, K.; Tollefsen, A. Rural–urban migration, economic transition, and status of female industrial workers in Lao PDR. Popul. Space Place 2011, 17, 421–434. [Google Scholar] [CrossRef]
- Lao Statistics Bureau. Lao Population and Housing Census. 2015. Available online: http://lao.unfpa.org/sites/default/files/pub-pdf/Final%20report-editting-English1.pdf (accessed on 17 May 2018).
- Bourdet, Y. The dynamics of regional disparities in Laos: The poor and the rich. Asian Surv. 1998, 38, 629–652. [Google Scholar] [CrossRef]
- Dickerson, A.; Green, F. Fears and realisations of employment insecurity. Labour Econ. 2012, 19, 98–210. [Google Scholar] [CrossRef]
- Devereux, S. Livelihood insecurity and social protection: A re-emerging issue in rural development. Dev. Policy Rev. 2001, 19, 507–519. [Google Scholar] [CrossRef]
- Rahman, H.M.T.; Robinson, B.E.; Ford, J.D.; Hickey, G.M. How do capital asset interactions affect livelihood sensitivity to climatic stresses? Insights from the Northeastern floodplains of Bangladesh. Ecol. Econ. 2018, 150, 165–176. [Google Scholar] [CrossRef]
- Rakodi, C. A capital assets framework for analysing household livelihood strategies: Implications for policy. Dev. Policy Rev. 1999, 17, 315–342. [Google Scholar] [CrossRef]
- Singh, P.K.; Hiremath, B.N. Sustainable livelihood security index in a developing country: A tool for development planning. Ecol. Indic. 2010, 10, 442–451. [Google Scholar] [CrossRef]
- Fang, Y.; Fan, J.; Shen, M.; Song, M. Sensitivity of livelihood strategy to livelihood capital in mountain areas: Empirical analysis based on different settlements in the upper reaches of the Minjiang River, China. Ecol. Indic. 2014, 38, 225–235. [Google Scholar] [CrossRef]
- Hua, X.; Yan, J.; Zhang, Y. Evaluating the role of livelihood assets in suitable livelihood strategies: Protocol for anti-poverty policy in the Eastern Tibetan Plateau, China. Ecol. Indic. 2017, 78, 62–74. [Google Scholar] [CrossRef]
- You, H.; Zhang, X. Sustainable livelihoods and rural sustainability in China: Ecologically secure, economically efficient or socially equitable? Resour. Conserv. Recycl. 2017, 120, 1–13. [Google Scholar] [CrossRef]
- Arun, S.; Arun, T.; Devi, U. Transforming livelihoods and assets through participatory approaches: The Kudumbashree in Kerala, India. Int. J. Public Adm. 2011, 34, 171–179. [Google Scholar] [CrossRef]
- Kawaguchi, D. Human capital accumulation of salaried and self-employed workers. Labour Econ. 2003, 10, 55–71. [Google Scholar] [CrossRef] [Green Version]
- Print, M.; Coleman, D. Towards Understanding of Social Capital and Citizenship Education. Camb. J. Educ. 2003, 33, 123–149. [Google Scholar] [CrossRef]
- Guiso, L.; Sapienza, P.; Zingales, L. The role of social capital in financial development. Am. Econ. Rev. 2004, 94, 526–556. [Google Scholar] [CrossRef]
- Emerson, J. The blended value proposition: Integrating social and financial returns. Calif. Manag. Rev. 2003, 45, 35–51. [Google Scholar] [CrossRef]
- Amanda, K.; Williams, N.; Thomas, M.; Hill, E.L. Self-reported mood, general health, wellbeing and employment status in adult with suspected DCD. Res. Dev. Dis. 2013, 34, 1357–1364. [Google Scholar] [CrossRef]
- Creed, P.A.; Watson, T. Age, gender, psychological wellbeing and the impact of losing the latent and manifest benefits of employment in unemployed people. Aust. J. Psychol. 2003, 55, 95–103. [Google Scholar] [CrossRef]
- Bardasi, E.; Francesconi, M. The impact of atypical employment on individual wellbeing: Evidence from a panel of British workers. Soc. Sci. Med. 2004, 58, 1671–1688. [Google Scholar] [CrossRef]
- Borrella, C.; Muntanerb, C.; Benachc, J.; Artazcoza, L. Social class and self-reported health status among men and women: What is the role of work organisation, household material standards and household labour? Soc. Sci. Med. 2004, 58, 1869–1887. [Google Scholar] [CrossRef]
- Montgomery, M.R.; Gragnolati, M.; Burke, K.A.; Paredes, E. Measuring living standards with proxy variables. Demography 2000, 37, 155–174. [Google Scholar] [CrossRef] [PubMed]
- Zhang, A.C.; Fang, J.; Jacobsen, B.; Marshall, B.R. Peer effects, personal characteristics and asset allocation. J. Bank Financ. 2018, 90, 76–95. [Google Scholar] [CrossRef]
- Guenard, C.; Mesple-Somps, S. Measuring inequalities: Do household surveys paint a realistic picture? Rev. Income Wealth 2010, 56, 519–538. [Google Scholar] [CrossRef]
- Yohanis, Y.G.; Mondol, J.D.; Wright, A.; Norton, B. Real-life energy use in the UK: How occupancy and dwelling characteristics affect domestic electricity use. Energy Build. 2008, 40, 1053–10591. [Google Scholar] [CrossRef]
- Lang, T.; Ramírez, R. Building new social capital with scenario planning. Technol. Forecast. Soc. Chang. 2007, 124, 51–65. [Google Scholar] [CrossRef]
- Gerhard, P.; Gladstone, J.J.; Hoffmann, A.O.I. Psychological characteristics and household savings behavior: The importance of accounting for latent heterogeneity. J. Econ. Behav. Organ. 2018, 148, 66–82. [Google Scholar] [CrossRef]
- Kleinjans, K.J. The man of the house—How the use of household head characteristics may lead to omitted variable bias. Econ. Lett. 2013, 119, 133–135. [Google Scholar] [CrossRef]
- Portes, A. The two meanings of social capital. Sociol. Forum 2000, 15, 1–12. [Google Scholar] [CrossRef]
- Granberry, P.J.; Torres, M.I. Social capital accumulation among Puerto Rican mothers in urban neighborhoods. Societies 2017, 7, 1–12. [Google Scholar] [CrossRef]
- Uzzi, B. The sources and consequences of embeddedness for the economic performance of organizations: The network effect. Am. Soc. Rev. 1996, 61, 674–698. [Google Scholar] [CrossRef]
- Crudelia, L. Social capital and economic opportunities. J. Socio-Econ. 2006, 35, 913–927. [Google Scholar] [CrossRef]
- Brisson, D.S.; Usher, C.L. Bonding social capital in low-income neighborhoods. Fam. Relat. 2005, 54, 644–653. [Google Scholar] [CrossRef]
- Woolcock, W.; Narayan, D. Social capital: Implications for development theory, research, and policy. World Bank Res. Obs. 2000, 15, 225–249. [Google Scholar] [CrossRef]
- Villalonga-Olive, E.; Kawachi, I. The measurement of social capital. Gac. Sanit. 2015, 29, 62–64. [Google Scholar] [CrossRef] [PubMed]
- Leventhal, K.S.; Gillham, J.; DeMaria, L.; Andrew, G.; Peabody, J.; Leventhal, S. Building psychosocial assets and wellbeing among adolescent girls: A randomized controlled trial. J. Adolesc. 2015, 45, 284–295. [Google Scholar] [CrossRef] [PubMed]
- Winters, P.; David, B.; Carletto, G.; Covarrubias, K.; Quiñones, E.J.; Zezza, A.; Azzarri, C.; Stamoulis, K. Assets, activities and rural income generation: Evidence from a Multicountry Analysis. World Dev. 2009, 37, 1435–1452. [Google Scholar] [CrossRef]
- Ribeiro, R.S.M.; Palludeto, A.W.A. A neo-Kaleckian model of capital accumulation, income distribution and financial fragility. EconomiA 2016, 17, 279–290. [Google Scholar] [CrossRef]
- Bruno, G.; Bonis, R.D.; Silvestrini, A. Do financial systems converge? New evidence from financial assets in OECD countries. J. Comp. Econ. 2012, 40, 141–155. [Google Scholar] [CrossRef]
- Kaewanuchit, C. A cross-sectional study on occupational stress of using Thai-JCQ among Thai immigrant employees in Bangkok: A path diagram. Pertan. J. Soc. Sci. Hum. 2017, 25, 189–204. [Google Scholar]
- Chi, W. Capital income and income inequality: Evidence from urban China. J. Comp. Econ. 2012, 40, 228–239. [Google Scholar] [CrossRef] [Green Version]
- Morales, M.C.; Morales, O.; Menchaca, A.C.; Sebastian, A. The Mexican drug war and the consequent population Exodus: Transnational movement at the U.S.-Mexican border. Societies 2013, 3, 80–103. [Google Scholar] [CrossRef]
- Stikeleather, B.R. When do employers benefit from offering workers a financial reward for reporting internal misconduct? Acc. Org. Soc. 2016, 52, 1–14. [Google Scholar] [CrossRef]
- Erbaugh, J.T.; Oldekop, J.A. Forest landscape restoration for livelihoods and well-being. Curr. Opin. Environ. Sustain. 2018, 32, 76–83. [Google Scholar] [CrossRef]
- Gautam, Y.; Andersen, P. Rural livelihood diversification and household well-being: Insights from Humla, Nepal. J. Rural Stud. 2016, 44, 239–249. [Google Scholar] [CrossRef]
- Rupasingha, A.; Goetz, S.; Freshwater, D. The production of social capital in US counties. J. Socio-Econ. 2006, 35, 83–101. [Google Scholar] [CrossRef]
- Promphakping, B. Weil-being of returning migrants in the rural northeast of Thailand: Process oriented methodology. Hist. Soc. Res. 2017, 42, 289–305. [Google Scholar] [CrossRef]
- Lubiano, M.A.; Salas, A.; Carleos, C.; Sáa, S.R.; Gil, M.A. Hypothesis testing-based comparative analysis between rating scales for intrinsically imprecise data. Int. J. Approx. Reason. 2017, 88, 128–147. [Google Scholar] [CrossRef]
- Boag, S. Personality assessment, ‘construct validity’, and the significance of theory. Pers. Indiv. Differ. 2015, 84, 36–44. [Google Scholar] [CrossRef]
- Mels, G. LISREL for Windows: Getting Started Guide; Scientific Software International, Inc.: Lincolnwood, IL, USA, 2006. [Google Scholar]
- Bentler, P.M. Comparative fit indexes in structural models. Psychol. Bull. 1990, 107, 238–246. [Google Scholar] [CrossRef] [PubMed]
- Pesaran, M.H.; Smith, R.J. A generalized R2 criterion for regression models estimated by the instrumental variables method. Econometrica 1994, 62, 705–710. [Google Scholar] [CrossRef]
- Pham, T.; Talavera, O. Discrimination, social capital, and financial constraints: The case of Viet Nam. World Dev. 2018, 102, 228–242. [Google Scholar] [CrossRef]
- Schinckus, C. Financial innovation as a potential force for a positive social change: The challenging future of social impact bonds. Res. Int. Bus. Financ. 2017, 39, 727–736. [Google Scholar] [CrossRef]
- Kaye, L.K.; Kowert, R.; Quinn, S. The role of social identity and online social capital on psychosocial outcomes in MMO players. Comput. Hum. Behav. 2017, 74, 215–222. [Google Scholar] [CrossRef]
- Xue, J.; Gao, W.; Guo, L. Informal employment and its effect on the income distribution in urban China. China Econ. Rev. 2014, 31, 84–93. [Google Scholar] [CrossRef]
- Teng, L.S.; Jayasingam, S.; Zain, K.N.M. Debunking the myth of money as motivator in a multigenerational workforce. Pertanika J. Soc. Sci. Hum. 2018, 26, 29–148. [Google Scholar]
- Cegarra-Navarro, J.; Reverte, C.; Gomez-Melero, E.; Wensley, A.K.P. Linking social and economic responsibilities with financial performance: The role of innovation. Eur. Manag. J. 2016, 34, 530–539. [Google Scholar] [CrossRef]
- Mokhtar, N.; Husniyah, A.R. Determinants of financial well-being among public employees in Putrajaya, Malaysia. Pertanika J. Soc. Sci. Hum. 2017, 25, 1241–1260. [Google Scholar]
- Lei, J.; Qiu, J.; Wan, C. Asset tangibility, cash holdings, and financial development. J. Corp. Financ. 2018, 50, 223–242. [Google Scholar] [CrossRef]
- Holtkamp, C.R.; Weaver, R.G. Quantifying the relationship between social capital and economic conditions in Appalachia. Appl. Geogr. 2018, 90, 175–186. [Google Scholar] [CrossRef]
- Binder, J.F.; Sutcliffe, A.G. The best of both worlds? Online ties and the alternating use of social network sites in the context of migration. Societies 2014, 4, 753–769. [Google Scholar] [CrossRef]
- Myroniuk, T.W.; Vearey, J. Social capital and livelihoods in Johannesburg: Differential advantages and unexpected outcomes among foreign-born migrants, internal migrants, and long-term South African residents. Int. Migr. Rev. 2014, 48, 243–273. [Google Scholar] [CrossRef]
- Yaméogo, T.B.; Fonta, W.M.; Wünscher, T. Can social capital influence smallholder farmers’ climate-change adaptation secisions? Evidence from three semi-arid communities in Burkina Faso, West Africa. Soc. Sci. 2018, 7, 1–20. [Google Scholar] [CrossRef]
- Bebbington, A.; Perreault, T. Social capital, development, and access to resources in highland Ecuador. Econ. Geogr. 1999, 75, 395–418. [Google Scholar] [CrossRef]
- Lyons, M.; Snoxell, S. Sustainable Urban Livelihoods and Marketplace Social Capital: Crisis and Strategy in Petty Trade. Urban Stud. 2005, 42, 1301–1320. [Google Scholar] [CrossRef]
- Lyon, F. Trust, networks and norms: The creation of social capital in agricultural economies in Ghana. World Dev. 2000, 28, 663–681. [Google Scholar] [CrossRef]
- Brown, S.; Taylor, K. Household debt and financial assets: Evidence from Germany, Great Britain and the USA. J. R. Stat. Soc. Ser. A 2008, 171, 615–643. [Google Scholar] [CrossRef]
- Daovisan, H.; Promphakping, B.; Chamaratana, T. Selling labour-domain livelihood assets: A qualitative approach to non-subcontracting home-based garment workers in the Lao PDR. Kasetsart J. Soc. Sci. 2018, 1–7. [Google Scholar] [CrossRef]
- Dunn, T.; Holtz-Eakin, D. Financial capital, human capital, and the transition to self-employment: Evidence from intergenerational links. J. Labor Econ. 2000, 18, 282–305. [Google Scholar] [CrossRef]
- Erenstein, O.; Hellin, J.; Chandna, P. Poverty mapping based on livelihood assets: A meso-level application in the Indo-Gangetic Plains, India. Appl. Geogr. 2010, 30, 112–125. [Google Scholar] [CrossRef]
- McLean, J.E. Beyond the pentagon prison of sustainable livelihood approaches and towards livelihood trajectories approaches. Asia Pac. Viewp. 2015, 56, 380–391. [Google Scholar] [CrossRef]
- Scoones, I. Livelihoods perspectives and rural development. J. Peasant Stud. 2009, 36, 171–196. [Google Scholar] [CrossRef] [Green Version]
- Becker, G.S. Investment in human capital: A theoretical analysis. J. Polit. Econ. 1962, 70, 9–49. [Google Scholar] [CrossRef]
- Costanza, R.; Daly, H.E. Natural capital and sustainable development. Conserv. Biol. 1992, 6, 37–46. [Google Scholar] [CrossRef]
- Su, F.; Shang, H.Y. Relationship analysis between livelihood assets and livelihood strategies: A Heihe river basin example. Sci. Cold Arid Reg. 2012, 4, 0265–0274. [Google Scholar] [CrossRef]
- Barua, A.; Katyaini, S.; Mili, B.; Gooch, P. Climate change and poverty: Building resilience of rural mountain communities in South Sikkim, Eastern Himalaya, India. Reg. Environ. Chang. 2014, 14, 267–280. [Google Scholar] [CrossRef]
Figure 1.
Structural equation results model. Figure key: χ2 = 88.52, df = 62, p = 0.01518, NFI = 0.950, CFI = 0.968, GFI = 0.969, AGFI = 0.947, RMSEA = 0.0358 results from LISREL 9.30.
Figure 1.
Structural equation results model. Figure key: χ2 = 88.52, df = 62, p = 0.01518, NFI = 0.950, CFI = 0.968, GFI = 0.969, AGFI = 0.947, RMSEA = 0.0358 results from LISREL 9.30.

Table 1.
Identifying the fitness of the model.
| Index | Acceptable Values | Initial Model | Fitness Model | ||
|---|---|---|---|---|---|
| Value | Acceptability | Value | Acceptability | ||
| χ2 | χ2/df < 5.00 | 71 | – | 62 | + |
| NFI | >0.90 | 0.809 | – | 0.950 | + |
| CFI | >0.90 | 0.873 | – | 0.968 | + |
| GFI | >0.90 | 0.928 | – | 0.969 | + |
| AGFI | >0.90 | 0.894 | – | 0.947 | + |
| SRMR | <0.08 | 0.0807 | – | 0.0422 | + |
| RMSEA | <0.05 | 0.0673 | Mis | 0.0358 | + |
Abbreviations used: Chi-square (χ2), degree of freedom (df), normed fit index (NFI), comparative fit index CFI, goodness-of-fit index (GFI), adjusted GFI (AGFI), standardised root means square residual (SRMR), root-mean-square error of approximation (RMSEA). + = positive results, – = indicated outcome not measured.
Table 2.
Descriptive statistics of factors included in the analysis.
| Factor | Variable | Mean | Std. Dev. | Min | Max | N |
|---|---|---|---|---|---|---|
| 1 | 1 | 0.081 | 0.273 | 0.000 | 1.000 | 333 |
| 2 | 2.997 | 1.424 | 1.000 | 5.000 | 333 | |
| 2 | 3 | 2.892 | 1.378 | 1.000 | 5.000 | 333 |
| 4 | 2.991 | 1.432 | 1.000 | 5.000 | 333 | |
| 5 | 3.009 | 1.409 | 1.000 | 5.000 | 333 | |
| 6 | 2.925 | 1.480 | 1.000 | 5.000 | 333 | |
| 7 | 3.135 | 1.402 | 1.000 | 5.000 | 333 | |
| 8 | 2.904 | 1.449 | 1.000 | 5.000 | 333 | |
| 9 | 3.039 | 1.471 | 1.000 | 5.000 | 333 | |
| 10 | 3.105 | 1.443 | 1.000 | 5.000 | 333 | |
| 3 | 11 | 3.312 | 1.423 | 1.000 | 5.000 | 333 |
| 12 | 3.081 | 1.423 | 1.000 | 5.000 | 333 | |
| 4 | 13 | 3.492 | 1.530 | 1.000 | 5.000 | 333 |
| 14 | 3.492 | 1.420 | 1.000 | 5.000 | 333 |
Source: This table gives the descriptive statistics result from LISREL 9.30. Factor 1 = household characteristics; 2 = social assets; 3 financial assets; 4 = livelihood security. Variable 1 = gender; 2 = age; 3 = family support; 4 = trust worker; 5 = community support; 6 = community participations; 7 = neighboring relationship; 8 = employment relationship; 9 = household interaction; 10 = household relationship; 11 = income sources; 12 = incomes; 13 = household wellbeing; 14 = employment wellbeing.
Table 3.
Factor correlation between assets and livelihood security.
| Factor | 1 | 2 | 3 | 4 |
|---|---|---|---|---|
| 1 | 1.000 | |||
| 2 | 0.297 ** | 1.000 | ||
| 3 | 0.829 ** | 0.486 ** | 1.000 | |
| 4 | 0.198 ** | −0.880 | 0.311 ** | 1.000 |
Table key: Factor 1 = livelihood security; 2 = household characteristics; 3 = social assets; 4 = financial assets. This table shows the total standardized effects result from LISREL 9.30. ** p < 0.01.
Table 4.
Total standardized effect included in the analysis.
| Factor | 1 | 2 | 3 |
|---|---|---|---|
| 1 | 0.371 | 0.436 | 0.365 |
| (0.047) | (0.054) | (0.044) | |
| 7.968 | 8.069 | 8.255 | |
| 2 | 0.475 | 0.559 | 0.468 |
| (0.066) | (0.064) | (0.062) | |
| 7.167 | 8.695 | 7.606 |
Source: For the rows, 1= household wellbeing; 2 = employment wellbeing. For the columns, 1 = household characteristics; 2 = social assets; 3 = financial assets. This table shows, which are the total standardized effect results from LISREL 9.30. All standardized effects are significant at ** p < 0.01.
Table 5.
The fitness model included in the SEM results.
| Factor | Variable | β | SS | t-Value | p |
|---|---|---|---|---|---|
| 1 | 1 | 0.014 | 0.051 | 0.89 | ** |
| 2 | −1.014 | −0.715 | −17.25 | ||
| 2 | 3 | 0.770 | 0.560 | 13.83 | ** |
| 4 | 0.753 | 0.509 | 14.62 | ** | |
| 5 | 0.690 | 0.465 | 11.34 | ** | |
| 6 | 0.544 | 0.386 | 11.68 | ** | |
| 7 | 0.758 | 0.523 | 9.52 | ** | |
| 8 | 0.931 | 0.644 | 13.33 | ** | |
| 9 | 0.847 | 0.589 | 12.22 | ** | |
| 10 | 0.677 | 0.481 | 16.09 | ** | |
| 3 | 11 | 0.169 | 0.366 | 7.14 | ** |
| 12 | 1.596 | 1.001 | 8.89 | ** | |
| 4 | 13 | 0.884 | 0.564 | 14.55 | ** |
| 14 | 1.134 | 0.782 | 18.54 | ** |
Table key: Factor 1 = household characteristics; 2 = social assets; 3 financial assets; 4 = livelihood security. Variable 1 = gender; 2 = age; 3 = family support; 4 = trust worker; 5 = community support; 6 = community participations; 7 = neighboring relationship; 8 = employment relationship; 9 = household interaction; 10 = household relationship; 11 = income sources; 12 = incomes; 13 = household wellbeing; 14 = employment wellbeing. Standardized solution (S.S.); standardized coefficients (β); t-value (t > 2.58 means ** p < 0.01). Results are from LISREL 9.30.
© 2018 by the authors. Licensee MDPI, Basel, Switzerland. This article is an open access article distributed under the terms and conditions of the Creative Commons Attribution (CC BY) license (http://creativecommons.org/licenses/by/4.0/).
Share and Cite
MDPI and ACS Style
Daovisan, H.; Chamaratana, T. Confirmatory Factor Analysis of Assets That Influence Informal Garment Workers’ Livelihood Security in Laos. Societies 2018, 8, 45. https://doi.org/10.3390/soc8030045
AMA Style
Daovisan H, Chamaratana T. Confirmatory Factor Analysis of Assets That Influence Informal Garment Workers’ Livelihood Security in Laos. Societies. 2018; 8(3):45. https://doi.org/10.3390/soc8030045
Chicago/Turabian StyleDaovisan, Hanvedes, and Thanapauge Chamaratana. 2018. "Confirmatory Factor Analysis of Assets That Influence Informal Garment Workers’ Livelihood Security in Laos" Societies 8, no. 3: 45. https://doi.org/10.3390/soc8030045
Note that from the first issue of 2016, this journal uses article numbers instead of page numbers. See further details here.