Comparative Analysis of Load Profile between Small-Sided Games and Official Matches in Youth Soccer Players
by
 , , and
Carlos David Gómez-Carmona
1,2,* ,
,
José Martín Gamonales
1 ,
,
José Pino-Ortega
2 and
and
Sergio José Ibáñez
1
1
Optimization of Training and Sports Performance Research Group (GOERD), Department of Didactics of Music, Plastic and Body Expression, Sports Science Faculty, University of Extremadura, 10004 Caceres, Spain
2
Department of Physical Activity and Sport Science, Sport Science Faculty, University of Murcia, 30720 San Javier, Spain
*
Author to whom correspondence should be addressed.
Sports 2018, 6(4), 173; https://doi.org/10.3390/sports6040173
Submission received: 30 October 2018
/
Revised: 3 December 2018
/
Accepted: 10 December 2018
/
Published: 12 December 2018
(This article belongs to the Special Issue Training Process in Soccer Players)
Abstract
:The purposes of the present study are: (a) to characterize the external (eTL) and internal load (iTL) of official matches and small-sided games (SSGs) in relation to their objective, (b) to compare demands between SSG, and (c) to analyze the SSG requirements in relation to official matches during a one-month competition period. Twenty under-18 national-level soccer players were recorded using WIMUTM inertial devices (RealTrack Systems, Almeria, Spain) during four official matches and 12 training sessions where four SSGs with different objectives were performed: (SSG1) keeping the ball; (SSG2) keeping the ball and progressing; (SSG3) keeping the ball, progressing and ending in mini-goals; and (SSG4) keeping the ball, progressing and ending in an official goal with a goalkeeper. Statistical analysis included Kruskall-Wallis’ H and Mann-Whitney’s U with Cohen’s d effect size. The SSGs presented walking and jogging intensity movements (0.7–7 to 7–14 km/h), with a 5-to-8 %HIA (high intensity activity, >16 km/h), where low intensity accelerations, decelerations and impacts were predominant (1–2.5 m/s2; 5–7 G), and %HRMAX (maximum heart rate percentage) was between 70–90%. Only SSG4 presented similar demands to competition, finding differences between SSGs (p < 0.05; d = 1.40 − 0.36). In conclusion, the objective of the SSGs directly influenced the demands on the players in training sessions. For this reason, it is important to monitor demands for designing specific training sessions.
1. Introduction
Soccer is a team sport with high-intensity intermittent actions, where performance depends on different technical, tactical, biomechanical, psychological and physiological aspects [1]. Currently, training methodology is one of the most studied aspects [2,3] with the aim of designing more specific training sessions, where small-sided games (SSGs) are one of the most commonly used tasks [4,5]. SSGs are training tasks with a similar structure to the real game, that are performed in small areas of the pitch with adapted rules and a reduced number of players compared to official games [6,7]. Besides, these situations reproduce similar aerobic demands to competition [8].
To design the SSGs, a number of variables have been studied such as: (a) the players’ area [9], (b) the size of the pitch [8,10], (c) the field orientation [11,12], (d) the number of players [5,13], (e) the type of defense, (man-to-man or zone) [14], (f) the work-rest ratio [10,15], (g) the specific objectives, ending or ball possession [16,17], (h) the modification of the game rules [18], (i) play with or without a goalkeeper [19], (j) the presence of wildcard players [20] and (k) the feedback of the coach [8,21], among others. All of these are modified with the aim of reproducing the specific demands of the game [10], as they are effective independently of age, sex, experience and competitive level [22,23].
Thanks to the technological advances of the last several years, new inertial measurement units (IMUs) composed of many sensors for time-motion analysis (accelerometers, gyroscopes or magnetometers) and tracking location in indoor (Local Position Measurement, LPM; Ultra-Wide Band, UWB) [24,25] and outdoor conditions (Global Navigation Satellite Systems, GNSS) [26,27] have been developed to analyze movements, velocity, distance covered, number of accelerations and decelerations [28,29,30], to know the specific requirements of soccer [31]. Different publications have analyzed the internal load imposed by soccer through objective methods such as heart rate (HR) and subjective methods such as rating perceived exertion (RPE) [10,32,33].
SSGs do not exactly reproduce the real game context [10,33,34]. In addition, these game-based tasks can exceed the ratio of changes of speed and could increase injury risk [7]. For this reason, it is hypothesized that the demands of the SSGs are not related to competition demands and the modification of the objective in game-based tasks will have an influence on their requirements. Therefore, this investigation was proposed due to the lack of research in relation to the comparison between SSGs and official match demands and the analysis of requirements in youth soccer players. The aims of the present study are: (a) to characterize the external (eTL) and internal load (iTL) of official matches and small-sided games in relation to their objective, (b) to compare demands between SSGs, and (c) to analyze SSG requirements in relation to official match load during a one-month competition period in youth national-level soccer players.
2. Materials and Methods
2.1. Design
The research is based on a cross-sectional study with natural groups [35]. The investigation characterizes the external and internal load of official matches and small-sided games and compares their demands in youth soccer players during a one-month competition period.
2.2. Participants
Twenty under-18 national-level soccer players (age: 17.32 ± 0.87 years; body mass: 67.27 ± 5.78 kg; height: 1.72 ± 0.08 m; Body Mass Index (BMI): 21.83 ± 1.89 kg/m2) who play in a semi-professional club participated voluntarily in the research. The participants in the present study presented the following inclusion criteria: (1) no physical limitations or musculoskeletal injuries that could affect testing, (2) participating up to 70-min of total duration in official matches, and (3) goalkeepers were not included in the study because their physical load differs from all other field players. Finally, only 16 players were analyzed, two goalkeepers and two players being excluded. Participants were informed about the research procedures and provided written informed consent. The testing protocol was approved by the University ethics committee (register number 67/2017).
2.3. Sample
A total of 229 statistical analysis units were recorded during the research, composed of 37 recordings in competition (10 field players in four official matches, without the goalkeeper) and 192 recordings during training sessions (four SSGs repeated in four training sessions, one per week, performed by 12 players that were distributed in two teams), only being recorded the day that SSGs were performed.
2.4. Equipment
WIMUTM inertial devices (RealTrack Systems, Almeria, Spain) were utilized for data acquisition. This device is composed of different sensors (four accelerometers with different full scale: ± 16 g, ± 16 g, ± 32 g and ± 400 g; a gyroscope with a full scale of 2000 degrees/second; a magnetometer, GPS chipset, among others) for movement analysis and to track location in outdoor conditions [27] showing a high degree of accuracy (≈ 50 cm) [24]. External load demands were recorded: (a) tracking data by GPS with a sample frequency of 10 Hz, and (b) movement data through the IMU accelerometers with a sample frequency of 100 Hz. Heart rate (HR) was utilized to record internal load demands with a GARMINTM HR band (Garmin Ltd., Olathe, KS, USA), that sent data to the inertial device through Ant+ technology [36]. During the present study, all data were recorded in the 8 GB internal memory of each device. During the session, the selections of activity time in each small-sided game or match halves were carried out in real-time by SVIVOTM software (version 807, RealTrack Systems, Almeria, Spain). Finally, all devices and the activity marks were imported in a computer and analyzed by SPROTM (RealTrack Systems, Almeria, Spain).
2.5. Variables
The present study analyzed the following independent and dependent variables shown in Table 1 and Table 2. The external load variables were divided into two groups: (a) kinematical and (b) neuromuscular [37]. The kinematical variables analyzed were: (i) total relative distance covered and at different speeds, (ii) high-intensity activity (HIA), (iii) speed average, (iv) accelerations, (v) decelerations, and (vi) metabolic power. The speed thresholds for relative distance and high-intensity activity are similar to those employed in previous time–motion studies [38,39,40]. The intensity of accelerations and decelerations were classified according to [41]. Metabolic power was calculated following [42]. In relation to neuromuscular load, the recorded variables were PlayerLoadTM and impacts at different ranges. PlayerLoadTM was calculated following [43] and impacts were classified according to [44]. Finally, to quantify internal load, heart rate (HR) variable at all intensities was recorded. Maximum HR (HRMAX) of each player was selected individually through the highest value recorded in official matches, the different intensities being classified according to [45].
2.6. Procedures
The present study was performed during the competitive period of the 2017–2018 season, between January and February 2018. The one-month competitive period was composed of three training sessions that were classified in relation to Match Day (MD) (Monday: MD + 2, Wednesday: MD − 3, and Friday: MD − 1) and an official match per week. The training sessions always started at 21:00 h and had a total average duration of 114 ± 7 min. The SSGs were played at MD − 3 on an artificial grass pitch (regular field surface) with dimensions of 25 m length and 40 m width, related to the short narrow pitch described by Casamichana et al. (2018) [46]. These dimensions were selected as it is a common game-based task used in soccer called “double-area” and classified by Rampinini et al. (2007) as small field dimensions [8]. Each SSG was performed twice, where ball possession was exclusively for one team, thus, if the defending team stole the ball, it was given back to the attacking team. Besides, additional balls were distributed around the edge of the pitch to maximize effective playing time, and were passed to the attacking team [47]. In SSG1, the ball was passed to any attacking player, while, in SSG2, SSG3 and SSG4 the ball was passed to the attacking player who was nearest to the attacking start line. The duration of each repetition was 5 min with a 2-min rest interval between SSGs. The participants were distributed in two teams of six players, without specific roles, except in SSG4 where seven players took part in the defending team (6 players plus a goalkeeper). During the SSGs, the coach did not give feedback to the players. Regarding the official matches, these lasted 90 min (two halves of 45 min) and they were played on the same surface as the SSGs so as not to contaminate the research.
To place the devices on the players, they were cited 15-min before the training sessions and 60-min before the official matches. Firstly, before placing the device on each athlete, it was calibrated through an internal process during auto-starting following the manufacturer’s recommendations: (i) to switch on the devices in a flat zone and without contact with other magnetic devices, (ii) and for them to remain still for approximately 30 s after switching them on, (iii) once the operating system of the device was initialized, a button was pressed in order to start recording. Then, the devices were placed on every player using a specific anatomical harness.
2.7. Statistical Analysis
Firstly, a descriptive analysis was performed showing the data as mean and standard deviation (mean ± SD) to describe the internal and external load demands of small-sided games, in relation to their aims, and the official matches analyzed during a four-week period. Then, an exploratory analysis was done for criteria assumption [48]. Table 3 shows the results of the Kolmogorov-Smirnov test for Normality and the Levene test for Homoscedasticity that were performed to establish the correct model for hypothesis contrast 3.
Finally, an inferential analysis was done to compare the internal and external load demands between official matches and small-sided games designed in relation to the objective. Kruskall-Wallis’ H and Mann-Whitney’s U for pairwise comparison were used. Significance level was established at p < 0.05 [48]. Additionally, Cohen’s d was calculated to obtain the magnitude of differences through the effect size calculator for non-parametric tests (www.psychometrica.de/effect_size.html), classifying them as very low (0–0.2), low (0.2–0.6), moderate (0.6–1.2), high (1.2–2.0) and very high (>2.0) [49]. The Statistical Package of Social Science (version 24.0; SPSS Inc., Chicago, IL, USA) was used for the statistical analysis and GraphPad Prism (version 7; GraphPad Software, La Jolla, CA, USA) to design the plots.
3. Results
Table 4 shows the descriptive analysis of external and internal load variables recorded in the investigation in relation to the small-sided games and official matches. The small-sided games demand profile is characterized by movements performed at walking and jogging intensity (0.7–7 km/h and 7–14 km/h), at 5-to-7 km/h average speed, with a 5-to-8 %HIA, and where the low intensity accelerations, decelerations and impacts were predominant (1–2.5 m/s2; 5–7 G). With respect to internal load, the average heart rate was 155-to-167 bpm, for this reason, the percentage of HRMAX was between 70–90%.
In the comparison analysis in relation to the objective of the SSGs, statistical differences were found in all the variables recorded (p < 0.05; d = 1.40 − 0.36) with a moderate-to-high effect size, except in [8–10 G] Imp/min, [>10 G] Imp/min, [50–60%] HRMAX, and [95–100%] HRMAX. SSG1 and SSG4 presented the highest demands in external and internal training load variables; while SSG3 obtained the lowest demands.
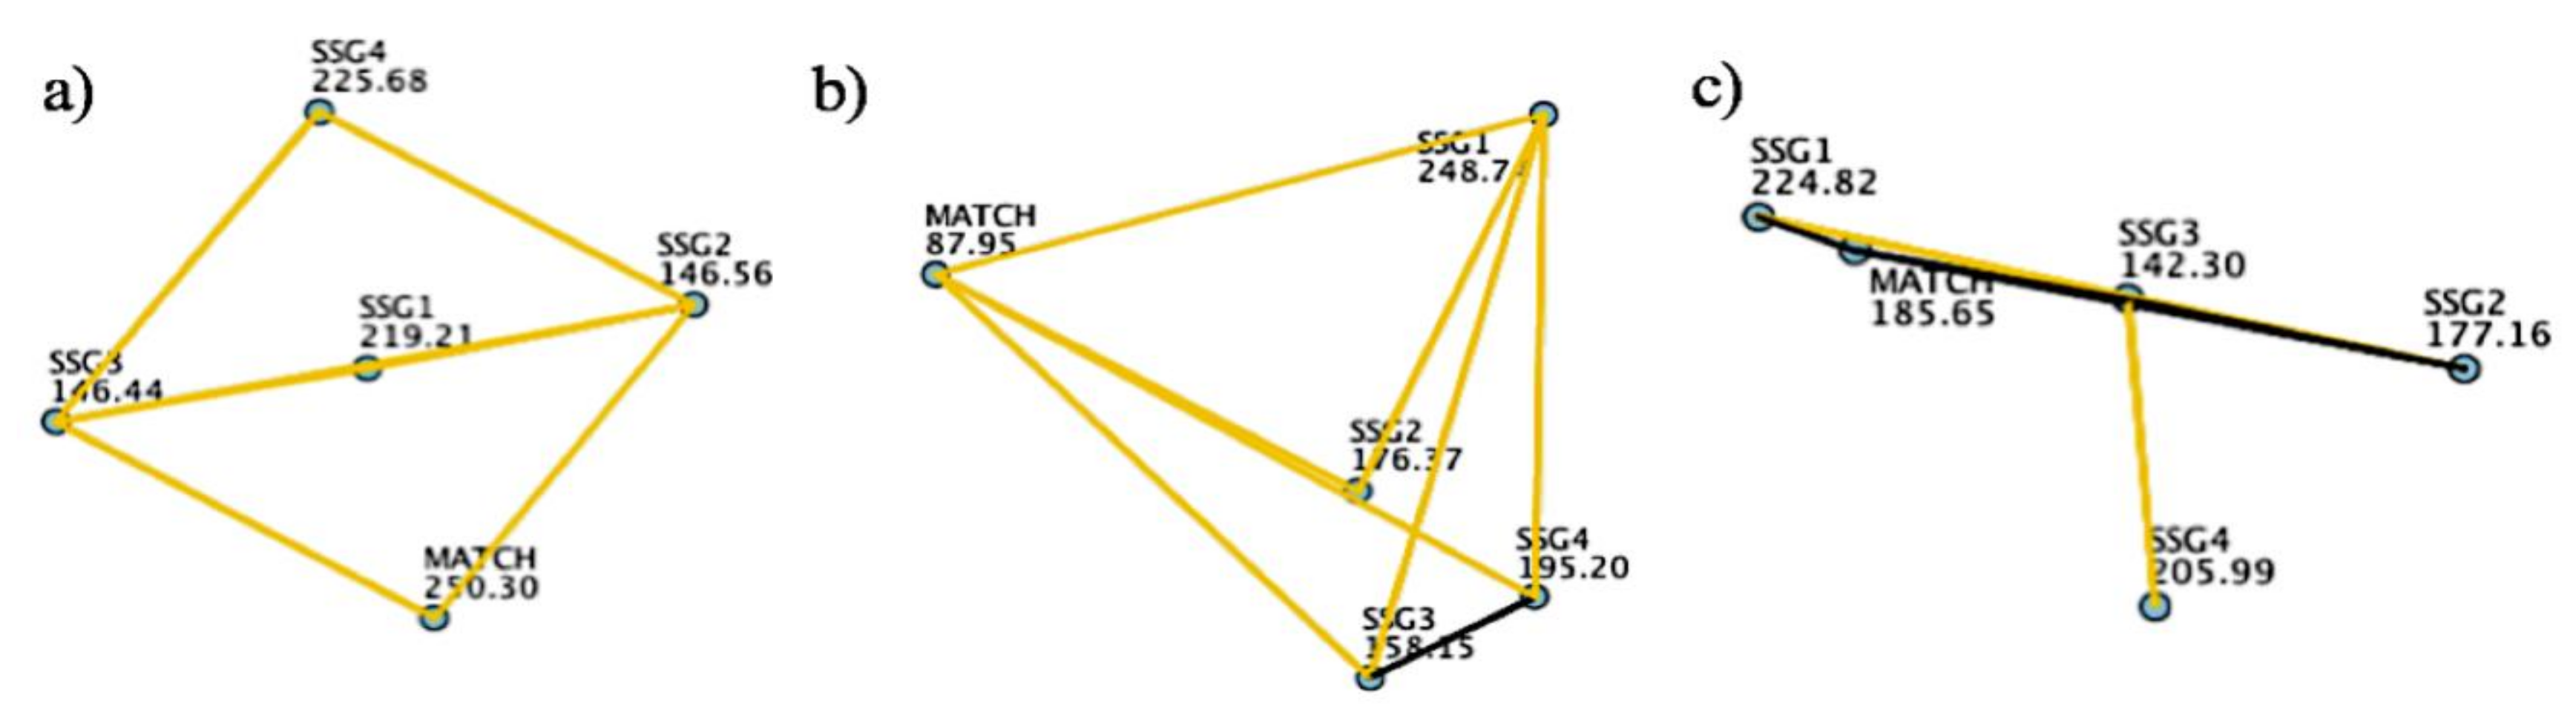
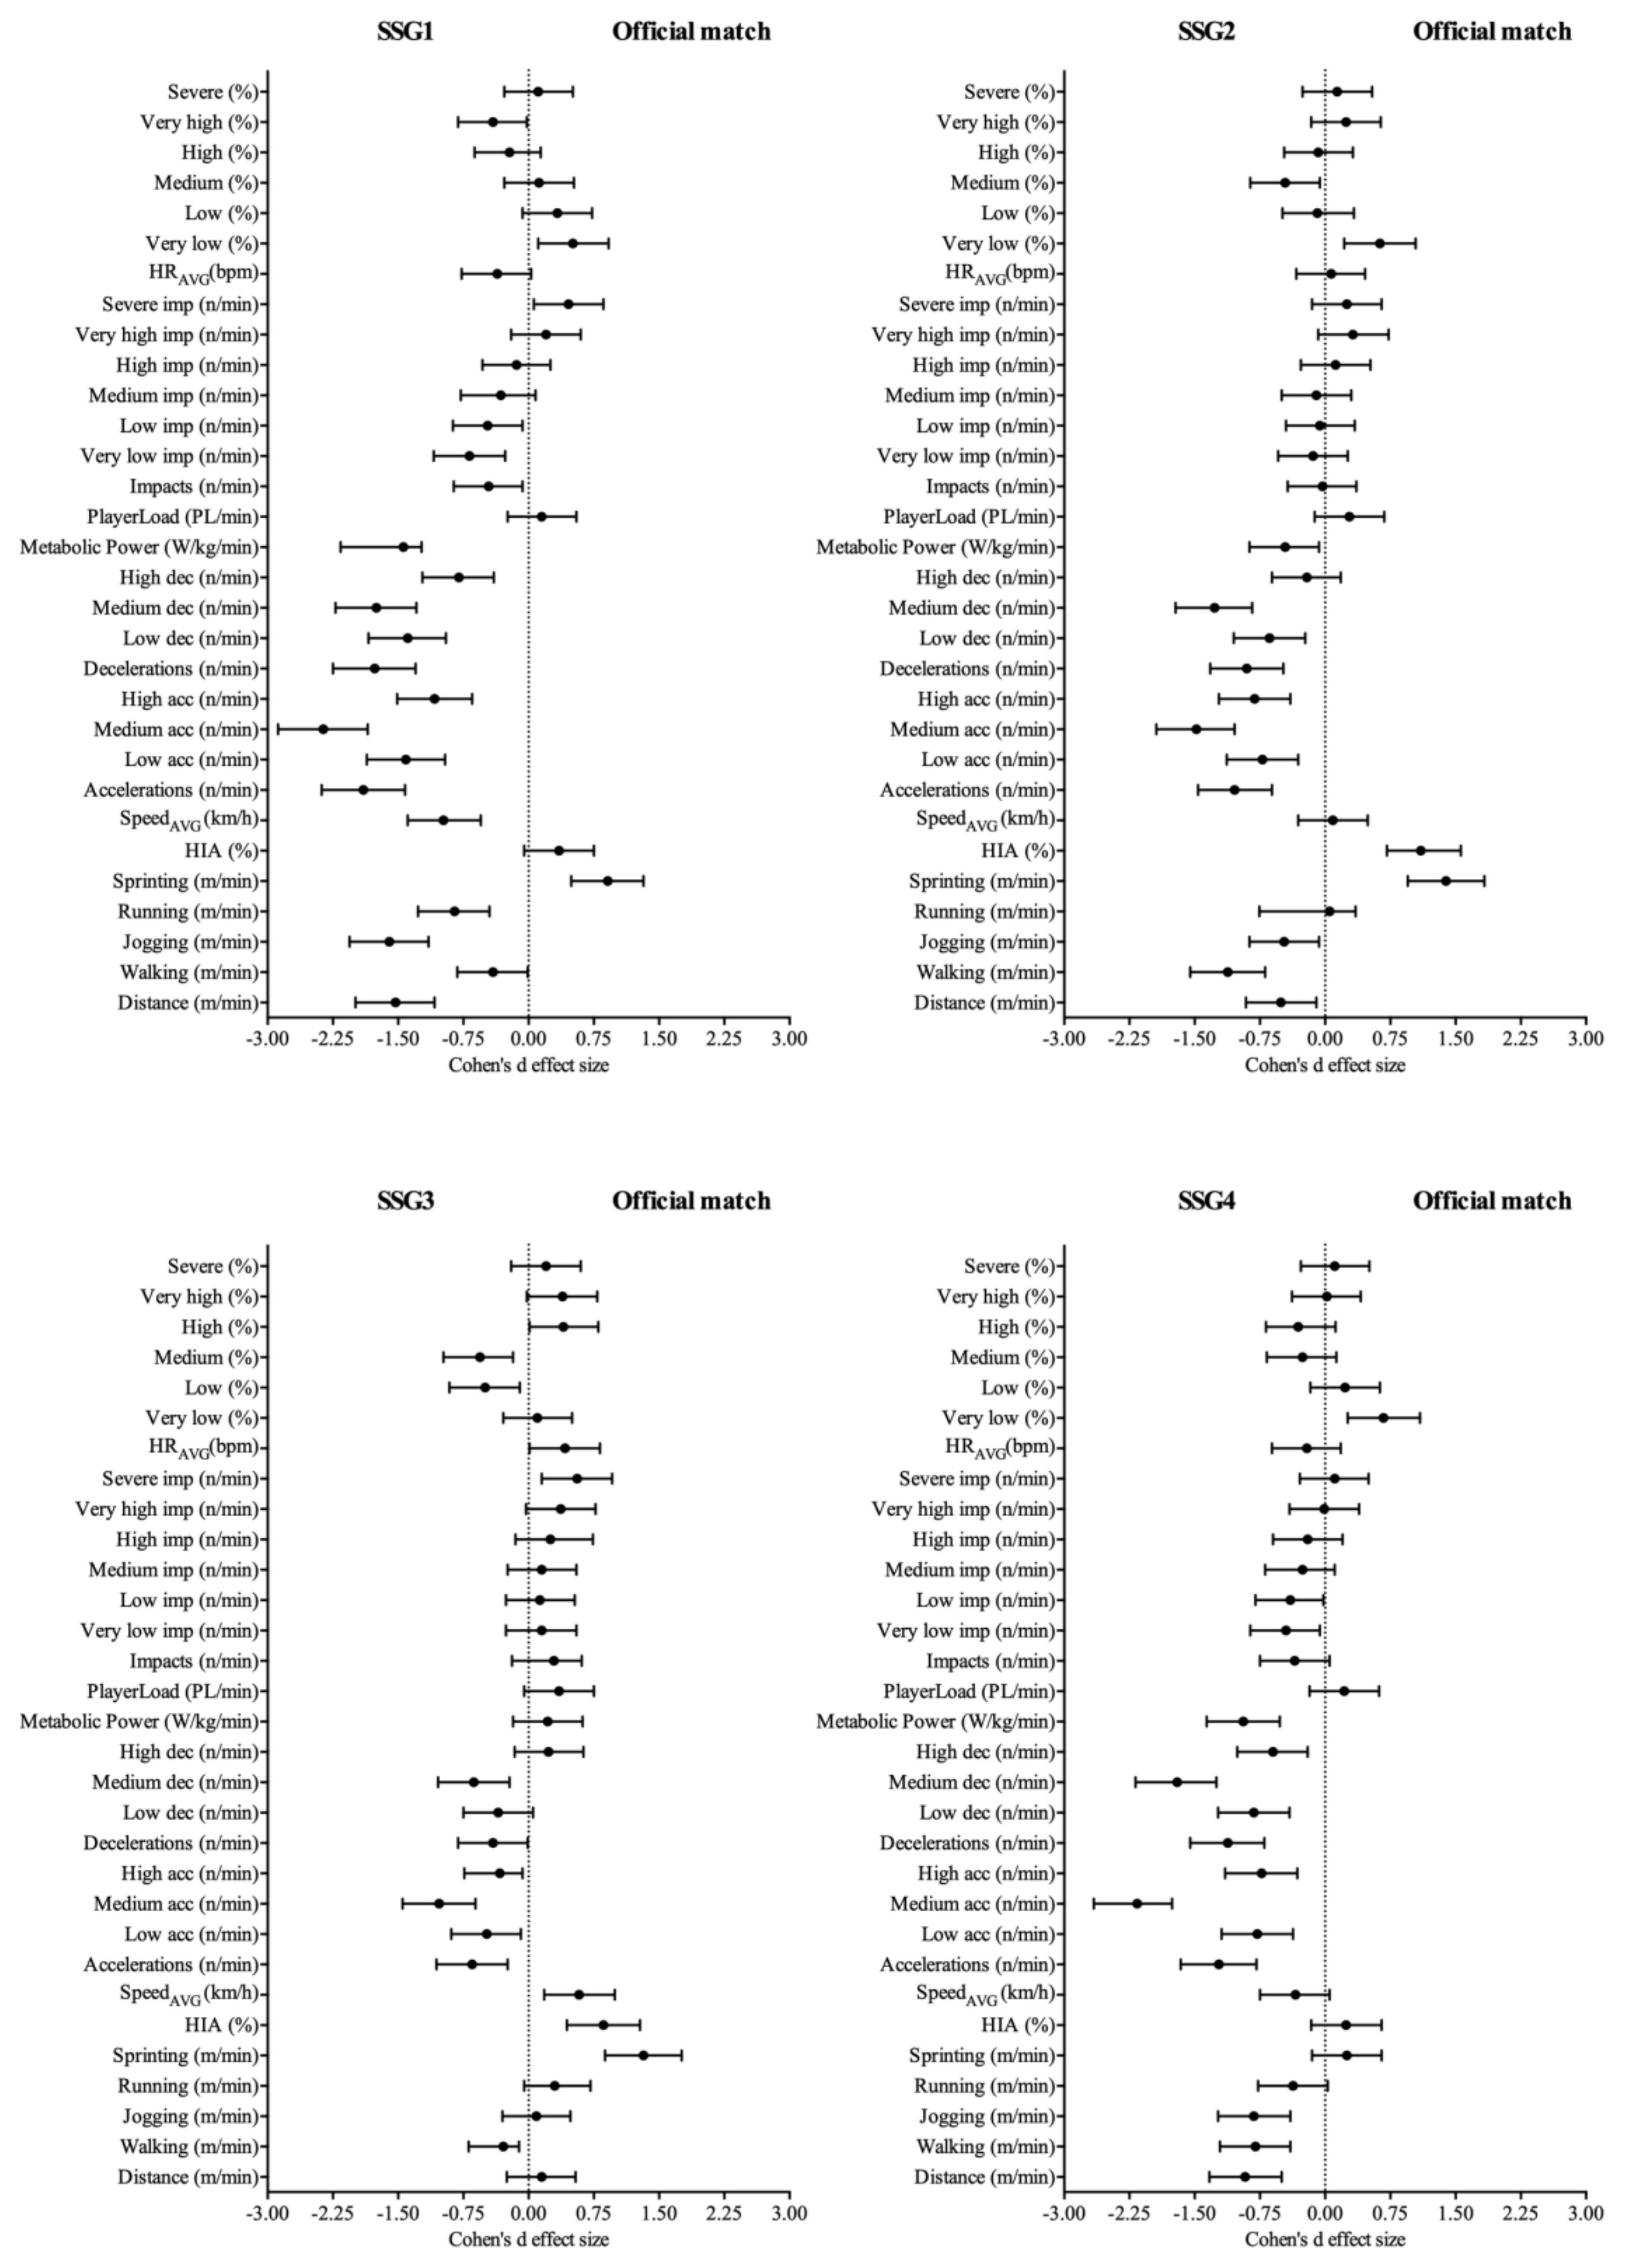
Finally, in relation to match demands profile, the U-18 soccer players covered 98.30 ± 21.94 m/min at an average speed of 5.95 ± 0.94 and with a 9.74 ± 4.21% of HIA. Besides, the players performed 12.42 ± 2.28 Acc/min, 10.85 ± 2.26 Dec/min, 6.24 ± 1.31 W/kg/min, 1.80 ± 2.95 PL/min and 10.46 ± 6.62 Imp/min, with an average HR of 161 ± 15 bpm. With respect to the official match demands mentioned before, the SSG depending on the objective presented a different load profile, as shown in Figure 1 and Figure 2. Common to all SSGs, the average changes of velocity demands (accelerations and deceleration) and at all intensities presented were greater compared to official matches (p < 0.05; d = 2.25 − 0.71). However, in the SSGs, the players did not experience the same demands at high intensity activity (>16 km/h) and sprinting (>21 km/h), except SSG4.
4. Discussion
The aim of the present research was to ascertain the external (eTL) and internal (iTL) training load of different SSGs designed by a coach, to compare the demands between SSGs in relation to their objective and to analyze these demands in relation to official matches during one month in the competition period of a youth national-level soccer team. The main differences between official matches and the proposal SSGs are in relation to the analyzed variables with a moderate-to-high effect size. Besides, SSG1 (maintaining possession of the ball) and SSG4 (maintaining possession, progressing and ending in a goal with a goalkeeper) presented the highest demands in internal and external load. In contrast, SSG3 presented the lowest demands. In sport science, there are many investigations related with SSGs and official matches in elite-level soccer players. However, a lack of research in youth soccer players has been found, particularly using inertial measurement units to record the data.
4.1. SSGs Load Profile
In relation to the first objective, in the analyzed SSGs efforts predominate where the HRMAX is between 80–90%, where movements are performed at low intensity (<14 km/h) and the neuromuscular load is obtained by low impacts (5–6 G). In the internal load analysis, many investigations found moderate-to-high intensity heart rates (80–88% HRMAX) in 6 vs. 6 situations [8,20,50], these values being similar to those obtained in this study. Referring to external load analysis, in time-motion variables, different authors have shown that the intensity of displacements is low (<16 km/h) due to the reduced game area, with the meters traveled at high intensity representing 15–20% of the total performed and sprinting (>21 km/h) a residual value lower than 5% [5,20,29]. Finally, the neuromuscular load analyzed through the impacts is similar to the results obtained by Abade et al. (2014) in training using SSGs in U-15, U-17 and U-19 soccer teams. Therefore, thanks to the results obtained in the present study and the reviewed research in the sport science area, it is possible to establish a specific demands profile of SSGs in situations of equality (6 vs. 6), in a small-sided pitch commonly used by soccer professionals (≈800 m2), and where the players’ area is reduced in relation to official games (≈65 m2 vs. ≈300 m2).
4.2. Comparative Analysis between SSG Objectives
Then, in the comparison among the SSGs, SSG1 and SSG4 presented the highest demands. In these tasks, the greater demands were found at high intensity (>16 km/h) and sprinting (>21 km/h), in high-to-very high impacts (>8 G) and in high-intensity heart rate zones (>80% HRMAX). SSG3 presented the lowest demands, with requirements in the low intensity zone in all variables. In the comparison between progressing (SSG2) and ending in two mini-goals (SSG3), Halouani et al. (2017) found that SSG2 presented higher demands than SSG3, this data being similar to the present research. This behavior is due to the need to defend a smaller area in SSG3 (zone of mini-goals vs. entire goal line). In the tasks with or without a goalkeeper (SSG4 vs. SSG3), the presence of a goalkeeper and ending in an official goal provoked a higher load, a result that coincides with previous research [1,5], but other investigations found opposite results [17,19]. The disparity of results in this comparison (SSG3 vs. SSG4) is due to the motivation aroused by the presence/absence of the goalkeeper in the game (Dellal et al., 2011). Finally, regarding the comparison between SSG1 (maintaining possession) with respect to the rest of the proposed SSGs, no research has been found that analyzes this aspect. Since with the objective of maintaining possession of the ball there are no specific roles or clear goals for progression, less organization and an incorrect distribution was evident in relation to official games, aspects that are related to greater demands, desynchronization, and worse results [51,52]. Therefore, the objective of the SSGs has an enormous influence on internal and external load demands and should be considered for the correct planning of training sessions, the tactical complex of tasks not being a direct influence on their demands.
4.3. Comparative Analysis among SSGs and Official Matches
In relation to SSGs versus official matches, there are significant differences among SSG1, SSG2 and SSG3 and competition demands. Specifically, SSG2 and SSG3 presented lower demands, while SSG1 produced higher demands than competition. Although, the SSGs were designed to reproduce the specific demands of a soccer game [50], the results show that there is overtraining of the changes of speed, as a consequence of the reduced dimensions of the game area [8,10,33]. Moreover, exceeding the training load can cause injuries [7]. Finally, the SSG4-vs-match comparison in internal load recorded using HR produced similar demands to official games, representing an efficient stimulus for training the aerobic adaptations required in soccer [33]. Therefore, the recommendation is to design the specific objective of training tasks [18] as they influence demands, should be motivating for players [42], and have external feedback [8] as well as producing significant adaptations in a real game context, maintaining distribution and avoiding small areas and reduced numbers of players [3,33].
While the results of this study have provided information regarding the influence of the objective in the internal and external load demands during small-sided games and their relationship with competition load, some limitations to the study must be acknowledged. One of the limitations in this study concerns the sample studied; it would be interesting to extend this study to include more participants, different categories and levels. It would also be interesting for futures studies to analyze the influence of coach feedback, pitch dimensions and orientation, number of players per team and the presence of wildcard players on the small-sided games with the objectives proposed in this research
5. Conclusions
From the results obtained, we can propose three considerations about the use of small-sided games (SSG) during training sessions:
- SSG are a training methodology where low-intensity movements (<14 km/h), low-intensity impacts (<6 G) and medium-high intensity heart rate demands (80–90% HRMAX) are predominant.
- These game-based tasks produced overtraining in changes of speed and reduced demands in high intensity movements compared to official matches.
- The objective of the SSGs directly influenced the internal and external load demands of the soccer players.
Finally, it is recommended to monitor SSGs during training sessions to obtain objective data about the specific load of each task. From these data, the correct application of SSGs in relation to the objective during the training process will achieve performance enhancement both in the soccer players and team behavior. Therefore, more research in this area is necessary for a better understanding of their effects on technical, tactical, psychological and physiological aspects.
Author Contributions
J.P.O. conceived the experiment. C.D.G.C. and J.M.G. designed and conducted the experiment. C.D.G.C., J.M.G. and S.J.I. analyzed the data and performed statistical analysis. S.J.I. and J.P.O. had primary responsibility for the final content. All authors have read and approved the manuscript.
Funding
The author Carlos D. Gómez Carmona was supported by a grant from the Spanish Ministry of Education, Culture and Sport (FPU17/00407). This study was co-funded by the Regional Department of Economy and Infrastructure of the Government of Extremadura (Spain) and the European Social Fund (dossier number: GR15122).
Conflicts of Interest
The authors declare no conflict of interest. The fund providers had no role in the design of the study; in the collection, analyses, or interpretation of data; in the writing of the manuscript, or in the decision to publish the results.
References
- Stølen, T.; Chamari, K.; Castagna, C.; Wisløff, U. Physiology of soccer: An update. Sports Med. 2005, 35, 501–536. [Google Scholar] [CrossRef] [PubMed]
- Clemente, F.M.; Martins, F.M.; Mendes, R.S. Developing Aerobic and Anaerobic Fitness Using Small-Sided Soccer Games: Methodological Proposals. Strength Cond. J. 2014, 36, 76–87. [Google Scholar] [CrossRef]
- Nevado-Garrosa, F.; Suárez-Arrones, L. Comparison of physical demands in small sided games and competition in football players under 13. Cultura Ciencia y Deporte 2015, 10, 235–243. [Google Scholar] [CrossRef] [Green Version]
- Clemente, F.M.; Wong, D.P.; Martins, F.M.L.; Mendes, R.S. Acute Effects of the Number of Players and Scoring Method on Physiological, Physical, and Technical Performance in Small-sided Soccer Games. Res. Sports Med. 2014, 22, 380–397. [Google Scholar] [CrossRef] [PubMed]
- Dellal, A.; Hill-Haas, S.; Lago-Penas, C.; Chamari, K. Small-sided games in soccer: Amateur vs. professional players’ physiological responses, physical, and technical activities. J. Strength Cond. Res. 2011, 25, 2371–2381. [Google Scholar] [CrossRef] [PubMed]
- Halouani, J.; Chtourou, H.; Dellal, A.; Chaouachi, A.; Chamari, K. Soccer small-sided games in young players: Rule modification to induce higher physiological responses. Biol. Sport 2017, 2, 163–168. [Google Scholar] [CrossRef]
- Hill-Haas, S.V.; Dawson, B.; Impellizzeri, F.M.; Coutts, A.J. Physiology of small-sided games training in football. Sports Med. 2011, 41, 199–220. [Google Scholar] [CrossRef]
- Rampinini, E.; Impellizzeri, F.M.; Castagna, C.; Abt, G.; Chamari, K.; Sassi, A.; Marcora, S.M. Factors influencing physiological responses to small-sided soccer games. J. Sports Sci. 2007, 25, 659–666. [Google Scholar] [CrossRef]
- Muñoz, J.; Castillo, D.; Yanci, J. Análisis de la percepción subjetiva del esfuerzo diferenciado y de la fatiga en distintos formatos de juegos reducidos en fútbol. Revista Iberoamericana de Ciencias de la Actividad Física y el Deporte 2018, 7, 14–28. [Google Scholar] [CrossRef]
- Casamichana, D.; Castellano, J. The Relationship Between Intensity Indicators in Small-Sided Soccer Games. J. Hum. Kinet. 2015, 46. [Google Scholar] [CrossRef]
- Casamichana, D.; Castellano, J.; González-Morán, A.; García-Cueto, H.; García-López, J. Demanda fisiológica en juegos reducidos de fútbol con diferente orientación del espacio. (Physiological demand in small-sided games on soccer with different orientation of space). RICYDE Revista Internacional de Ciencias del Deporte 2011, 7, 141–154. [Google Scholar] [CrossRef]
- Sassi, R.; Reilly, T.; Impellizzeri, F.M. A comparison of small-side games and interval training in elite professional soccer players. In Science and Football; Routledge: Oxon, UK, 2005; Volume V, pp. 352–354. [Google Scholar]
- Brandes, M.; Heitmann, A.; Müller, L. Physical responses of different small-sided game formats in elite youth soccer players. J. Strength Cond. Res. 2012, 26, 1353–1360. [Google Scholar] [CrossRef] [PubMed]
- Ngo, J.K.; Tsui, M.-C.; Smith, A.W.; Carling, C.; Chan, G.-S. The effects of man-marking on work intensity in small-sided soccer games. J. Sports Sci. Med. 2012, 11, 109–114. [Google Scholar] [PubMed]
- Christopher, J.; Beato, M.; Hulton, A.T. Manipulation of exercise to rest ratio within set duration on physical and technical outcomes during small-sided games in elite youth soccer players. Hum. Mov. Sci. 2016, 48, 1–6. [Google Scholar] [CrossRef] [PubMed] [Green Version]
- Gaudino, P.; Alberti, G.; Iaia, F.M. Estimated metabolic and mechanical demands during different small-sided games in elite soccer players. Hum. Mov. Sci. 2014, 36, 123–133. [Google Scholar] [CrossRef]
- Koklu, Y.; Sert, O.; Alemdaroglu, U.; Arslan, Y. Comparison of the physiological responses and time-motion characteristics of young soccer players in small-sided games: The effect of goalkeeper. J. Strength Cond. Res. 2015, 29, 964–971. [Google Scholar] [CrossRef]
- Clemente, F.; Couceiro, M.S.; Martins, F.M.L.; Mendes, R. The usefulness of small-sided games on soccer training. J. Phys. Educ. Sport 2013, 12, 93–102. [Google Scholar]
- Mallo, J.; Navarro, E. Physical load imposed on soccer players during small-sided training games. J. Sports Med. Phys. Fit. 2008, 48, 166–171. [Google Scholar]
- Hill-Haas, S.V.; Coutts, A.J.; Dawson, B.T.; Rowsell, G.J. Time-motion characteristics and physiological responses of small-sided games in elite youth players: The influence of player number and rule changes. J. Strength Cond. Res. 2010, 24, 2149–2156. [Google Scholar] [CrossRef]
- Aguiar, M.V.D.; Botelho, G.M.A.; Gonçalves, B.S.V.; Sampaio, J.E. Physiological Responses and Activity Profiles of Football Small-Sided Games. J. Strength Cond. Res. 2013, 27, 1287–1294. [Google Scholar] [CrossRef]
- Chamari, K.; Hachana, Y.; Kaouech, F.; Jeddi, R.; Moussa-Chamari, I.; Wisløff, U. Endurance training and testing with the ball in young elite soccer players. Br. J. Sports Med. 2005, 39, 24–28. [Google Scholar] [CrossRef] [PubMed] [Green Version]
- Hill-Haas, S.V.; Dawson, B.T.; Coutts, A.J.; Rowsell, G.J. Physiological responses and time–motion characteristics of various small-sided soccer games in youth players. J. Sports Sci. 2009, 27, 1–8. [Google Scholar] [CrossRef]
- Bastida Castillo, A.; Gómez Carmona, C.D.; De la Cruz Sánchez, E.; Pino Ortega, J. Accuracy, intra- and inter-unit reliability, and comparison between GPS and UWB-based position-tracking systems used for time–motion analyses in soccer. Eur. J. Sport Sci. 2018, 18, 450–457. [Google Scholar] [CrossRef] [PubMed]
- Ogris, G.; Leser, R.; Horsak, B.; Kornfeind, P.; Heller, M.; Baca, A. Accuracy of the LPM tracking system considering dynamic position changes. J. Sports Sci. 2012, 30, 1503–1511. [Google Scholar] [CrossRef] [PubMed]
- Aughey, R.J.; Falloon, C. Real-time versus post-game GPS data in team sports. J. Sci. Med. Sport 2010, 13, 348–349. [Google Scholar] [CrossRef] [PubMed]
- Muñoz-López, A.; Granero-Gil, P.; Pino-Ortega, J.; De Hoyo, M. The validity and reliability of a 5-hz GPS device for quantifying athletes’ sprints and movement demands specific to team sports. J. Hum. Sport Exerc. 2017, 12. [Google Scholar] [CrossRef] [Green Version]
- Cummins, C.; Orr, R.; O’Connor, H.; West, C. Global Positioning Systems (GPS) and Microtechnology Sensors in Team Sports: A Systematic Review. Sports Med. 2013, 43, 1025–1042. [Google Scholar] [CrossRef] [PubMed]
- Malone, J.J.; Lovell, R.; Varley, M.C.; Coutts, A.J. Unpacking the Black Box: Applications and Considerations for Using GPS Devices in Sport. Int. J. Sports Physiol. Perform. 2017, 12 (Suppl. 2), S2–S18. [Google Scholar] [CrossRef]
- Waldron, M.; Worsfold, P.; Twist, C.; Lamb, K. Concurrent validity and test–retest reliability of a global positioning system (GPS) and timing gates to assess sprint performance variables. J. Sports Sci. 2011, 29, 1613–1619. [Google Scholar] [CrossRef] [PubMed]
- Abade, E.A.; Gonçalves, B.V.; Leite, N.M.; Sampaio, J.E. Time-Motion and Physiological Profile of Football Training Sessions Performed by Under-15, Under-17, and Under-19 Elite Portuguese Players. Int. J. Sports Physiol. Perform. 2014, 9, 463–470. [Google Scholar] [CrossRef] [PubMed]
- Fanchini, M.; Azzalin, A.; Castagna, C.; Schena, F.; Mccall, A.; Impellizzeri, F.M. Effect of Bout Duration on Exercise Intensity and Technical Performance of Small-Sided Games in Soccer. J. Strength Cond. Res. 2011, 25, 453–458. [Google Scholar] [CrossRef] [PubMed]
- Halouani, J.; Chtourou, H.; Gabbett, T.; Chaouachi, A.; Chamari, K. Small-Sided Games in Team Sports Training: A Brief Review. J. Strength Cond. Res. 2014, 28, 3594–3618. [Google Scholar] [CrossRef] [PubMed]
- Owen, A.; Twist, C.; Ford, P. Small-sided games: The physiological and technical effect of altering pitch size and player numbers. Insight 2004, 7, 50–53. [Google Scholar]
- Ato, M.; López-García, J.J.; Benavente, A. Un sistema de clasificación de los diseños de investigación en psicología. Anales de Psicología 2013, 29, 1038–1059. [Google Scholar] [CrossRef]
- Molina-Carmona, I.; Gomez-Carmona, C.D.; Bastida Castillo, A.; Pino-Ortega, J. Validez del dispositivo inercial WIMU PROTM para el registro de la frecuencia cardíaca en un test de campo. Sportk Revista Euroamericana de Ciencias del Deporte 2018, 7, 81–86. [Google Scholar] [CrossRef]
- Buchheit, M.; Lacome, M.; Cholley, Y.; Simpson, B.M. Neuromuscular Responses to Conditioned Soccer Sessions Assessed via GPS-Embedded Accelerometers: Insights into Tactical Periodization. Int. J. Sports Physiol. Perform. 2018, 13, 577–583. [Google Scholar] [CrossRef] [PubMed]
- Di Salvo, V.; Gregson, W.; Atkinson, G.; Tordoff, P.; Drust, B. Analysis of High Intensity Activity in Premier League Soccer. Int. J. Sports Med. 2009, 30, 205–212. [Google Scholar] [CrossRef]
- Bradley, P.S.; Di Mascio, M.; Peart, D.; Olsen, P.; Sheldon, B. High-Intensity Activity Profiles of Elite Soccer Players at Different Performance Levels. J. Strength Cond. Res. 2010, 24, 2343–2351. [Google Scholar] [CrossRef]
- Bradley, P.S.; Carling, C.; Archer, D.; Roberts, J.; Dodds, A.; Di Mascio, M.; Paul, D.; Gomez Diaz, A.; Peart, D.; Krustrup, P. The effect of playing formation on high-intensity running and technical profiles in English FA Premier League soccer matches. J. Sports Sci. 2011, 29, 821–830. [Google Scholar] [CrossRef]
- Akenhead, R.; Hayes, P.R.; Thompson, K.G.; French, D. Diminutions of acceleration and deceleration output during professional football match play. J. Sci. Med. Sport 2013, 16, 556–561. [Google Scholar] [CrossRef]
- Osgnach, C.; Poser, S.; Bernardini, R.; Rinaldo, R.; Di Prampero, P.E. Energy Cost and Metabolic Power in Elite Soccer: A New Match Analysis Approach. Med. Sci. Sports Exerc. 2010, 42, 170–178. [Google Scholar] [CrossRef] [PubMed]
- Boyd, L.J.; Ball, K.; Aughey, R.J. The Reliability of MinimaxX Accelerometers for Measuring Physical Activity in Australian Football. Int. J. Sports Physiol. Perform. 2011, 6, 311–321. [Google Scholar] [CrossRef] [PubMed]
- Cunniffe, B.; Proctor, W.; Baker, J.S.; Davies, B. An evaluation of the physiological demands of elite rugby union using global positioning system tracking software. J. Strength Cond. Res. 2009, 23, 1195–1203. [Google Scholar] [CrossRef] [PubMed]
- Jeong, T.-S.; Reilly, T.; Morton, J.; Bae, S.-W.; Drust, B. Quantification of the physiological loading of one week of “pre-season” and one week of “in-season” training in professional soccer players. J. Sports Sci. 2011, 29, 1161–1166. [Google Scholar] [CrossRef] [PubMed]
- Casamichana, D.; Bradley, P.S.; Castellano, J. Influence of the Varied Pitch Shape on Soccer Players Physiological Responses and Time-Motion Characteristics During Small-Sided Games. J. Hum. Kinet. 2018, 64, 171–180. [Google Scholar] [CrossRef] [PubMed]
- Casamichana, D.; Castellano, J. Time–motion, heart rate, perceptual and motor behaviour demands in small-sides soccer games: Effects of pitch size. J. Sports Sci. 2010, 28, 1615–1623. [Google Scholar] [CrossRef]
- Field, A. Discovering Statistics Using IBM SPSS Statistics, 4th ed.; SAGE: London, UK, 2013; ISBN 978-1-4462-4917-8. [Google Scholar]
- Hopkins, W.G.; Marshall, S.W.; Batterham, A.M.; Hanin, J. Progressive Statistics for Studies in Sports Medicine and Exercise Science. Med. Sci. Sports Exerc. 2009, 41, 3–13. [Google Scholar] [CrossRef] [Green Version]
- Little, T.; Williams, A.G. Measures of exercise intensity during soccer training drills with professional soccer players. J. Strength Cond. Res. 2007, 21, 367–371. [Google Scholar] [CrossRef]
- Memmert, D.; Lemmink, K.A.P.M.; Sampaio, J. Current Approaches to Tactical Performance Analyses in Soccer Using Position Data. Sports Med. 2017, 47, 1–10. [Google Scholar] [CrossRef]
- Miñano-Espin, J.; Casáis, L.; Lago-Peñas, C.; Gómez-Ruano, M.Á. High Speed Running and Sprinting Profiles of Elite Soccer Players. J. Hum. Kinet. 2017, 58, 169–176. [Google Scholar] [CrossRef] [Green Version]
Figure 1.
Pairwise comparison in (a) %HIA, (b) Acc/min, and (c) HRAVG in relation to small-sided games and official matches analyzed. The yellow line represents significant differences among groups (p < 0.05), while the black line represents non-significant differences among groups (p > 0.05).
Figure 1.
Pairwise comparison in (a) %HIA, (b) Acc/min, and (c) HRAVG in relation to small-sided games and official matches analyzed. The yellow line represents significant differences among groups (p < 0.05), while the black line represents non-significant differences among groups (p > 0.05).

Figure 2.
Dot plot to represent the pairwise comparison between SSG and official match demands in the external and internal load variables analyzed in the present research by Cohen’s d effect size with 95% CI.
Figure 2.
Dot plot to represent the pairwise comparison between SSG and official match demands in the external and internal load variables analyzed in the present research by Cohen’s d effect size with 95% CI.


Table 1.
Independent variables recorded in the investigation.
| Activity | Variable | Objective | Situation | Figure |
|---|---|---|---|---|
| Small-sided games (25 × 40 m) | SSG1 | Maintain possession of the ball | 6 vs. 6 |  |
| SSG2 | Maintain possession of the ball and progress to the goal line of the opposing team. | 6 vs. 6 |  | |
| SSG3 | Maintain possession, progress to the goal-line of the opponent and try to score a goal in two 2-m mini-goals located in the pitch corners. | 6 vs. 6 |  | |
| SSG4 | Maintain possession, progress to the goal line of the opponent and try to score a goal in an official goal defended by a goalkeeper (gk) | (6 + gk) vs. 6 |  | |
| Official matches | Total match | Total demands of the match (Playing system: 4-2-3-1) | 11 vs. 11 |
Table 2.
Dependent external and internal load variables recorded in the investigation.
| Load | Type | Variable | Sub-Variable | Acronym | Description |
|---|---|---|---|---|---|
| External load (eTL) | Kinematical | Relative distance (m/min) | Total | m/min | Total distance covered per minute |
| Walking | [0.7–7 km/h] m/min | Total distance covered between 0–7 km/h per minute | |||
| Jogging | [7–14 km/h] m/min | Total distance covered between 7–14 km/h per minute | |||
| Running | [14–21 km/h] m/min | Total distance covered between 14–21 km/h per minute | |||
| Sprinting | [>21 km/h] m/min | Total distance covered between >21 km/h per minute | |||
| HIA (%) | %HIA | Percentage of total distance traveled up to 16 km/h | |||
| Speed (km/h) | SpeedAVG | Average speed | |||
| Accelerations (n/min) | Total | Acc/min | Total positive speed changes per minute | ||
| Low | [1–2.5 m/s2] n/min | Total positive speed changes between 1–2.5 m/s2 per minute | |||
| Medium | [2.5–4 m/s2] n/min | Total positive speed changes between 2.5–4 m/s2 per minute | |||
| High | [>4 m/s2] n/min | Total positive speed changes between >4 m/s2 per minute | |||
| Decelerations (n/min) | Total | Dec/min | Total negative speed changes per minute | ||
| Low | −[1–2.5 m/s2] n/min | Total negative speed changes between 1–2.5 m/s2 per minute | |||
| Medium | −[2.5–4 m/s2] n/min | Total negative speed changes between 2.5–4 m/s2 per minute | |||
| High | −[>4 m/s2] n/min | Total negative speed changes between >4 m/s2 per minute | |||
| Metabolic power (W/kg/min) | MP/min | Energy expended by the player per minute per kg | |||
| Neuromuscular | PlayerLoad (a.u./min) | PL/min | Vector sum of device accelerations in the 3-axes per minute | ||
| Impacts (Imp/min) | Total | Imp/min | Total impacts recorded per minute | ||
| Very low | [5–6 G] Imp/min | Total impacts recorded between 5–6 G per minute | |||
| Low | [6–6.5 G] Imp/min | Total impacts recorded between 6–6.5 G per minute | |||
| Medium | [6.5–7 G] Imp/min | Total impacts recorded between 6.5–7 G per minute | |||
| High | [7–8 G] Imp/min | Total impacts recorded between 7–8 G per minute | |||
| Very high | [8–10 G] Imp/min | Total impacts recorded between 8–10 G per minute | |||
| Severe | [>10 G] Imp/min | Total impacts recorded >10 G per minute | |||
| Internal load (iTL) | Heart rate (bpm) | Total (bpm) | HRAVG | Total average beats-per-minute | |
| Very low | [50–60%] HRMAX | Percentage of heart rate between 50–60% in relation to HRMAX | |||
| Low | [60–70%] HRMAX | Percentage of heart rate between 60–70% in relation to HRMAX | |||
| Medium | [70–80%] HRMAX | Percentage of heart rate between 70–80% in relation to HRMAX | |||
| High | [80–90%] HRMAX | Percentage of heart rate between 80–90% in relation to HRMAX | |||
| Very high | [90–95%] HRMAX | Percentage of heart rate between 90–95% in relation to HRMAX | |||
| Maximum | [95–100%] HRMAX | Percentage of heart rate between 95–100% in relation to HRMAX |
Table 3.
Results of exploratory analysis of dependent variables in the present research.
| Variables | Kolmogorov-Smirnov | Levene | |||||
|---|---|---|---|---|---|---|---|
| SSG1 | SSG2 | SSG3 | SSG4 | OM | F | p | |
| Relative distance (m/min) | 0.12 | 0.12 | 0.01 * | 0.20 | 0.02 * | 24.13 | 0.00 † |
| Walking (m/min) | 0.05 * | 0.17 | 0.20 | 0.20 | 0.20 | 1.82 | 0.12 |
| Jogging (m/min) | 0.08 | 0.20 | 0.00 * | 0.12 | 0.20 | 8.09 | 0.00 † |
| Running (m/min) | 0.20 | 0.06 | 0.00 * | 0.20 | 0.06 | 7.48 | 0.00 † |
| Sprinting (m/min) | 0.00 * | 0.00 * | 0.00 * | 0.00 * | 0.00 * | 16.41 | 0.00 † |
| HIA (%) | 0.01 * | 0.03 * | 0.00 * | 0.20 | 0.14 | 6.58 | 0.00 † |
| SpeedAVG (km/h) | 0.02 * | 0.20 | 0.00 * | 0.20 | 0.00 * | 24.02 | 0.00 † |
| Relative accelerations (n/min) | 0.02 * | 0.06 | 0.03 * | 0.20 | 0.20 | 2.68 | 0.03 † |
| Low acc (n/min) | 0.09 | 0.09 | 0.07 | 0.20 | 0.20 | 3.02 | 0.01 † |
| Medium acc (n/min) | 0.16 | 0.02 * | 0.10 | 0.20 | 0.00 * | 2.59 | 0.03 † |
| High acc (n/min) | 0.03 * | 0.00 * | 0.00 * | 0.00 * | 0.00 * | 1.28 | 0.27 |
| Relative decelerations (n/min) | 0.03 * | 0.20 | 0.03 * | 0.20 | 0.20 | 5.35 | 0.00 † |
| Low dec (n/min) | 0.16 | 0.03 * | 0.00 * | 0.20 | 0.20 | 3.84 | 0.00 † |
| Medium dec (n/min) | 0.01 * | 0.04 * | 0.20 | 0.00 * | 0.00 * | 2.91 | 0.02 † |
| High dec (n/min) | 0.07 | 0.00 * | 0.00 * | 0.07 | 0.00 * | 5.60 | 0.00 † |
| Metabolic Power (W/kg/min) | 0.20 | 0.20 | 0.02 * | 0.15 | 0.00 * | 26.29 | 0.00 † |
| PlayerLoad (PL/min) | 0.20 | 0.20 | 0.00 * | 0.05 * | 0.00 * | 11.73 | 0.00 † |
| Relative impacts (n/min) | 0.00 * | 0.00 * | 0.00 * | 0.02 * | 0.05 * | 0.51 | 0.72 |
| Very low imp (n/min) | 0.05 * | 0.02 * | 0.00 * | 0.20 | 0.20 | 0.93 | 0.44 |
| Low imp (n/min) | 0.00 * | 0.00 * | 0.00 * | 0.00 * | 0.00 * | 1.80 | 0.13 |
| Medium imp (n/min) | 0.00 * | 0.00 * | 0.00 * | 0.00 * | 0.00 * | 1.44 | 0.22 |
| High imp (n/min) | 0.00 * | 0.00 * | 0.00 * | 0.00 * | 0.00 * | 1.13 | 0.34 |
| Very high imp (n/min) | 0.00 * | 0.00 * | 0.00 * | 0.00 * | 0.00 * | 1.77 | 0.13 |
| Severe imp (n/min) | 0.00 * | 0.00 * | 0.00 * | 0.00 * | 0.11 | 1.06 | 0.38 |
| HRAVG (bpm) | 0.09 | 0.20 | 0.20 | 0.20 | 0.20 | 4.35 | 0.00 † |
| Very low (%) | 0.00 * | 0.00 * | 0.00 * | 0.00 * | 0.00 * | 9.48 | 0.00 † |
| Low (%) | 0.00 * | 0.00 * | 0.00 * | 0.00 * | 0.00 * | 14.79 | 0.00 † |
| Medium (%) | 0.00 * | 0.00 * | 0.00 * | 0.00 * | 0.20 | 5.57 | 0.00 † |
| High (%) | 0.00 * | 0.11 | 0.00 * | 0.20 | 0.20 | 2.87 | 0.02 † |
| Very high (%) | 0.00 * | 0.00 * | 0.00 * | 0.00 * | 0.20 | 4.70 | 0.00 † |
| Severe (%) | 0.00 * | 0.00 * | 0.00 * | 0.00 * | 0.00 * | 0.56 | 0.68 |
Note. SSG: Small-sided game; OM: Official match; HIA: High-intensity activity; Acc: Accelerations; Dec: Decelerations; Imp: Impacts; HR: Heart rate; F: F-value of Levene test; p: p-value. * p < 0.05 reject null hypothesis. The sample is non-normal. † p < 0.05 reject null hypothesis. There is no homogeneity of variables.
Table 4.
Descriptive and comparative analysis of small-sided games and official matches in the external and internal load variables registered in the investigation.
Table 4.
Descriptive and comparative analysis of small-sided games and official matches in the external and internal load variables registered in the investigation.
| Variable | SSG1 | SSG2 | SSG3 | SSG4 | Official Match | Diff | ES |
|---|---|---|---|---|---|---|---|
| M ± SD | M ± SD | M ± SD | M ± SD | M ± SD | |||
| Distance (m/min) | 127.38 ± 15.35 | 109.26 ± 21.29 | 94.08 ± 34.69 | 117.52 ± 20.04 | 98.30 ± 21.94 | A, C, F | 1.24–0.53 |
| Walking (m/min) | 48.50 ± 6.89 | 53.77 ± 7.61 | 48.05 ± 9.24 | 51.71 ± 8.27 | 45.67 ± 6.80 | A, D | 0.73–0.42 |
| Jogging (m/min) | 58.44 ± 14.94 | 43.74 ± 18.22 | 34.55 ± 23.29 | 47.75 ± 15.25 | 36.36 ± 12.49 | A, B, C, F | 1.22–0.44 |
| Running (m/min) | 19.36 ± 7.61 | 11.27 ± 7.50 | 10.96 ± 11.00 | 16.04 ± 7.30 | 13.62 ± 5.70 | A, C, E, F | 1.07–0.45 |
| Sprinting (m/min) | 1.07 ± 1.51 | 0.48 ± 1.03 | 0.52 ± 1.19 | 2.03 ± 2.89 | 2.65 ± 1.95 | A, B, E, F | 0.71–0.40 |
| HIA (%) | 8.26 ± 4.32 | 5.12 ± 3.88 | 5.43 ± 5.68 | 8.67 ± 4.65 | 9.74 ± 4.21 | A, B, E, F | 0.83–0.56 |
| SpeedAVG (km/h) | 6.75 ± 0.68 | 5.86 ± 1.05 | 5.19 ± 1.57 | 6.26 ± 0.85 | 5.95 ± 0.94 | A, B, C, F | 1.29–0.42 |
| Accelerations (n/min) | 18.47 ± 3.88 | 15.60 ± 3.70 | 14.94 ± 4.97 | 16.20 ± 3.73 | 12.42 ± 2.28 | A, B, C | 0.79–0.60 |
| Low acc (n/min) | 14.39 ± 3.39 | 12.40 ± 3.24 | 12.12 ± 4.41 | 12.53 ± 3.18 | 10.45 ± 2.03 | A, B | 0.60–0.57 |
| Medium acc (n/min) | 3.45 ± 0.97 | 2.69 ± 0.87 | 2.40 ± 0.92 | 3.15 ± 0.86 | 1.65 ± 0.47 | A, B, F | 1.11–0.53 |
| High acc (n/min) | 0.63 ± 0.38 | 0.51 ± 0.30 | 0.41 ± 0.35 | 0.52 ± 0.36 | 0.32 ± 0.14 | B | 0.60 |
| Decelerations (n/min) | 16.22 ± 3.63 | 13.40 ± 3.33 | 12.44 ± 5.05 | 14.15 ± 3.49 | 10.85 ± 2.26 | A, B | 0.86–0.58 |
| Low dec (n/min) | 13.00 ± 3.41 | 10.72 ± 2.93 | 10.31 ± 4.38 | 11.30 ± 3.19 | 9.14 ± 1.95 | A, B | 0.72–0.51 |
| Medium dec (n/min) | 2.55 ± 0.93 | 2.18 ± 0.90 | 1.76 ± 0.98 | 2.26 ± 0.69 | 1.28 ± 0.43 | A, B | 0.83–0.40 |
| High dec (n/min) | 0.67 ± 0.36 | 0.50 ± 0.35 | 0.37 ± 0.38 | 0.60 ± 0.33 | 0.44 ± 0.18 | B, F | 0.81–0.48 |
| Metabolic Power (W/kg/min) | 8.13 ± 0.88 | 6.86 ± 1.34 | 5.85 ± 2.12 | 7.44 ± 1.23 | 6.24 ± 1.31 | A, B, F | 1.40–0.45 |
| PlayerLoad (PL/min) | 1.47 ± 0.25 | 1.21 ± 0.33 | 1.06 ± 0.43 | 1.34 ± 0.28 | 1.80 ± 2.95 | A, B, F | 1.17–0.42 |
| Impacts (n/min) | 13.93 ± 8.32 | 10.71 ± 7.28 | 8.91 ± 8.21 | 13.11 ± 8.42 | 10.46 ± 6.62 | B, F | 0.61–0.41 |
| Very low imp (n/min) | 8.42 ± 4.41 | 6.29 ± 4.25 | 5.21 ± 4.49 | 7.39 ± 3.81 | 5.78 ± 3.26 | A, B, F | 0.72–0.49 |
| Low imp (n/min) | 2.10 ± 1.50 | 1.56 ± 1.13 | 1.33 ± 1.42 | 2.06 ± 1.71 | 1.50 ± 0.99 | B, F | 0.53–0.41 |
| Medium imp (n/min) | 1.37 ± 1.23 | 1.13 ± 0.98 | 0.89 ± 1.16 | 1.32 ± 1.13 | 1.04 ± 0.76 | B, F | 0.40–0.38 |
| High imp (n/min) | 1.31 ± 1.23 | 1.03 ± 0.99 | 0.89 ± 1.08 | 1.38 ± 1.28 | 1.15 ± 1.00 | B, F | 0.41–0.36 |
| Very high imp (n/min) | 0.59 ± 0.75 | 0.51 ± 0.65 | 0.47 ± 0.69 | 0.76 ± 1.07 | 0.75 ± 0.81 | ||
| Severe imp (n/min) | 0.14 ± 0.23 | 0.18 ± 0.28 | 0.12 ± 0.23 | 0.21 ± 0.34 | 0.24 ± 0.20 | ||
| HRAVG (bpm) | 167.05 ± 12.33 | 161.14 ± 14.19 | 155.07 ± 17.71 | 164.88 ± 12.68 | 161.48 ± 15.10 | A, B, F | 0.79–0.44 |
| Very low (%) | 2.82 ± 5.29 | 2.21 ± 3.58 | 5.61 ± 11.78 | 1.88 ± 3.85 | 6.76 ± 9.47 | ||
| Low (%) | 7.07 ± 9.96 | 12.58 ± 15.17 | 19.77 ± 19.47 | 8.21 ± 10.87 | 11.15 ± 14.34 | A, F | 0.82–0.41 |
| Medium (%) | 18.78 ± 19.64 | 28.32 ± 22.49 | 31.18 ± 24.79 | 24.83 ± 21.87 | 20.21 ± 10.68 | A, B | 0.55–0.45 |
| High (%) | 40.76 ± 23.41 | 37.69 ± 25.69 | 26.80 ± 26.26 | 41.73 ± 22.69 | 36.00 ± 18.14 | B, D, F | 0.61–0.42 |
| Very high (%) | 22.02 ± 21.46 | 11.48 ± 18.11 | 9.49 ± 17.12 | 14.77 ± 17.06 | 15.03 ± 10.48 | A, B | 0.65–0.53 |
| Severe (%) | 6.45 ± 14.88 | 5.82 ± 17.75 | 5.26 ± 14.85 | 6.50 ± 14.93 | 8.12 ± 13.97 |
Diff: Pairwise comparison; ES: Effect size; SSG: Small-sided game; OM: Official match; HIA: High-intensity activity; Acc: Accelerations; Dec: Decelerations; Imp: Impacts; HR: Heart rate. A: Differences between SSG1 and SSG2 (p < 0.05); B: Differences between SSG1 and SSG3 (p < 0.05); C: Differences between SSG1 and SSG4 (p < 0.05); D: Differences between SSG2 and SSG3 (p < 0.05); E: Differences between SSG2 and SSG4 (p < 0.05); F: Differences between SSG3 and SSG4 (p < 0.05).
© 2018 by the authors. Licensee MDPI, Basel, Switzerland. This article is an open access article distributed under the terms and conditions of the Creative Commons Attribution (CC BY) license (http://creativecommons.org/licenses/by/4.0/).
Share and Cite
MDPI and ACS Style
Gómez-Carmona, C.D.; Gamonales, J.M.; Pino-Ortega, J.; Ibáñez, S.J. Comparative Analysis of Load Profile between Small-Sided Games and Official Matches in Youth Soccer Players. Sports 2018, 6, 173. https://doi.org/10.3390/sports6040173
AMA Style
Gómez-Carmona CD, Gamonales JM, Pino-Ortega J, Ibáñez SJ. Comparative Analysis of Load Profile between Small-Sided Games and Official Matches in Youth Soccer Players. Sports. 2018; 6(4):173. https://doi.org/10.3390/sports6040173
Chicago/Turabian StyleGómez-Carmona, Carlos David, José Martín Gamonales, José Pino-Ortega, and Sergio José Ibáñez. 2018. "Comparative Analysis of Load Profile between Small-Sided Games and Official Matches in Youth Soccer Players" Sports 6, no. 4: 173. https://doi.org/10.3390/sports6040173
Note that from the first issue of 2016, this journal uses article numbers instead of page numbers. See further details here.