The Role of Visual Feedback on Power Output During Intermittent Wingate Testing in Ice Hockey Players

 , , , , and
Abstract
:1. Introduction
2. Materials and Methods
2.1. Experimental Approach to the Problem
2.2. Subjects
2.3. Procedures
2.4. Anthropometry
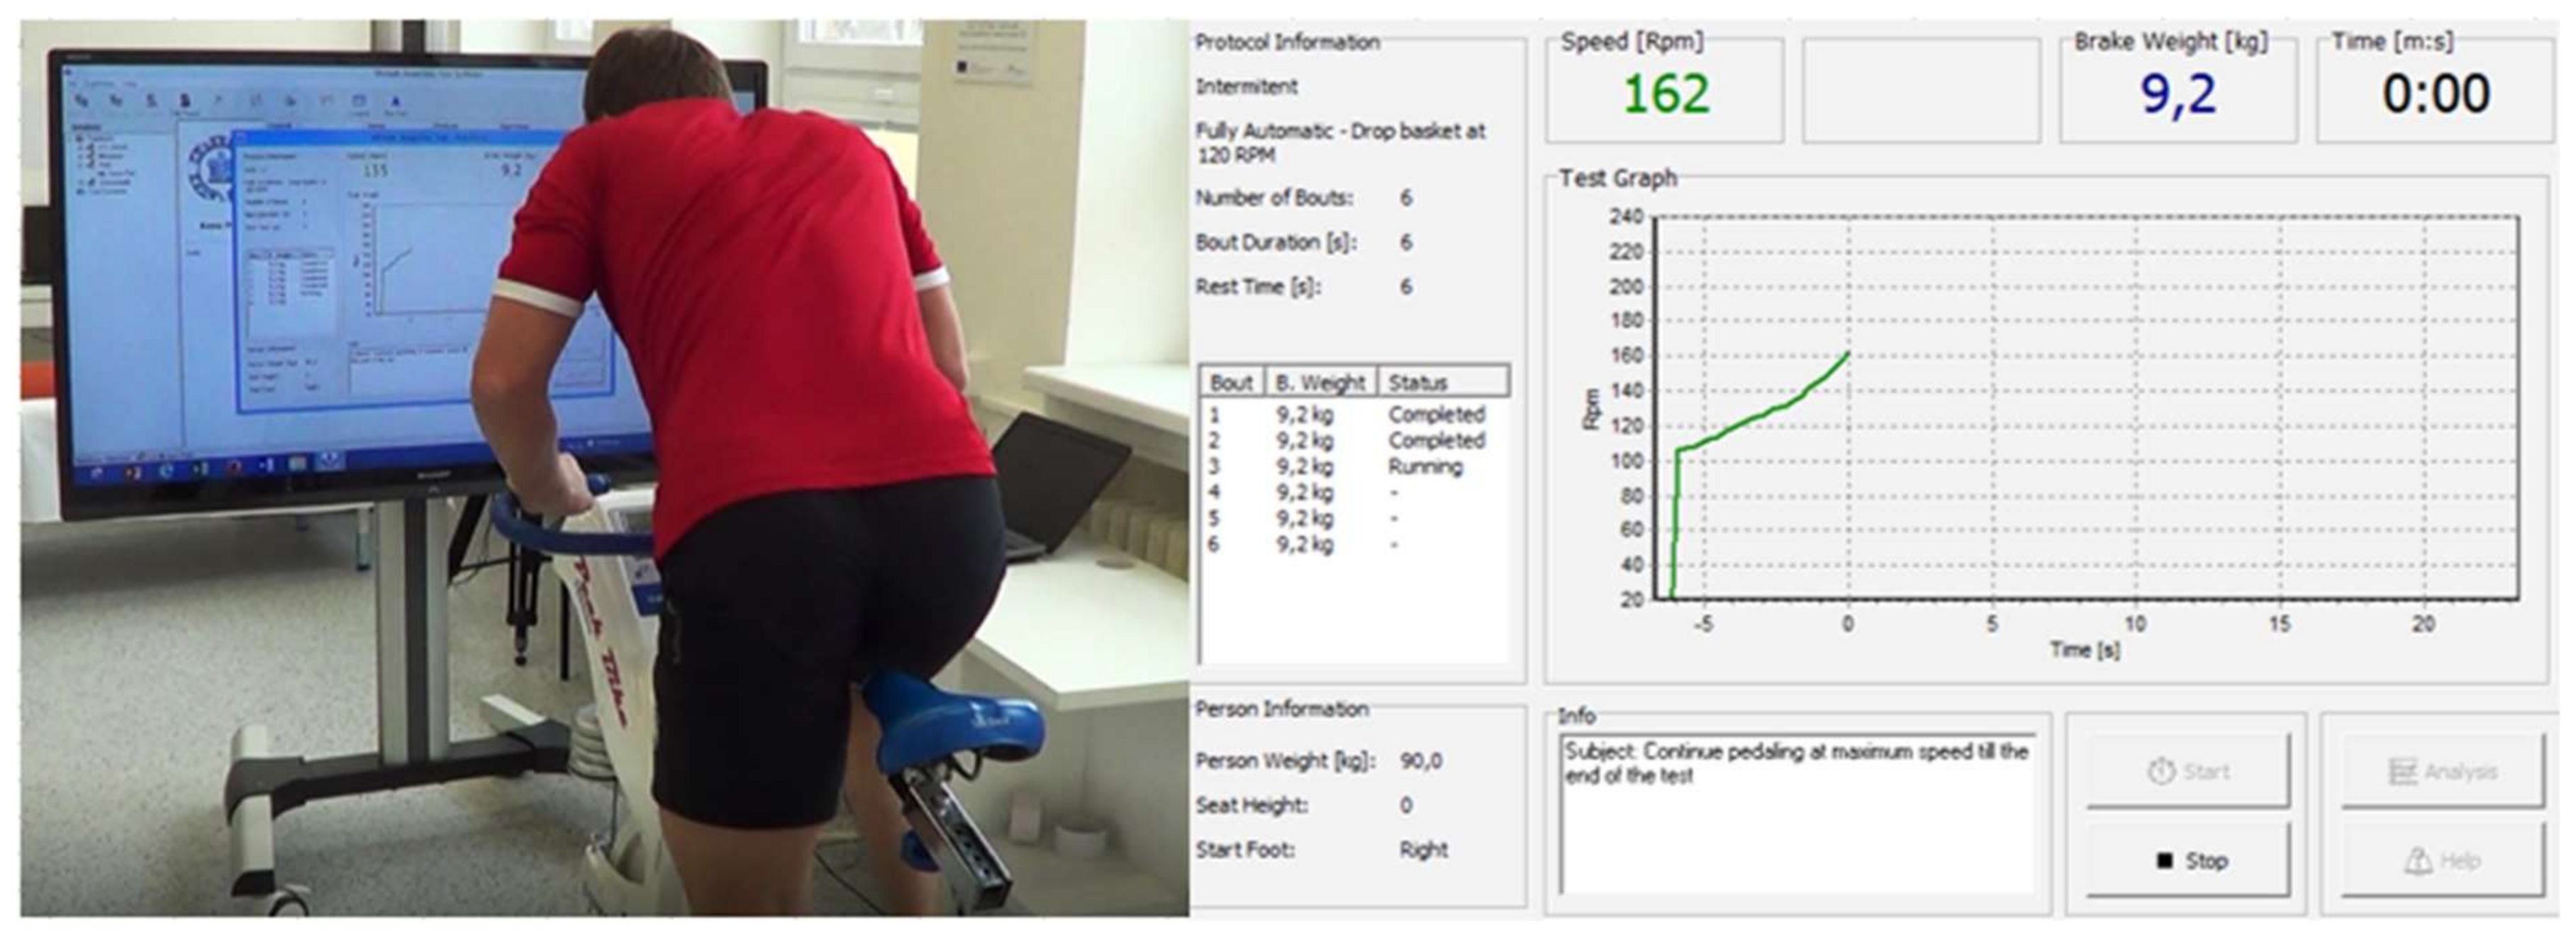
2.5. 6 × 6s Anaerobic Wingate Test—AnWT6x6
2.6. Visual Feedback
2.7. Statistical Analyses
3. Results
4. Discussion
5. Conclusions
Acknowledgments
Author Contributions
Conflicts of Interest
References
- Jung, M.-C.; Hallbeck, M.S. Quantification of the effects of instruction type, verbal encouragement, and visual feedback on static and peak handgrip strength. Int. J. Ind. Ergon. 2004, 34, 367–374. [Google Scholar] [CrossRef]
- Brown, L.E.; Weir, J.P. ASEP procedures recommendation I: Accurate assessment of muscular strength and power. J. Exerc. Physiol. Online 2001, 4, 1–21. [Google Scholar]
- Campenella, B.; Mattacola, C.G.; Kimura, I.F. Effect of visual feedback and verbal encouragement on concentric quadriceps and hamstrings peak torque of males and females. Isokinet. Exerc. Sci. 2000, 8, 1–6. [Google Scholar]
- Baltzopoulos, V.; Williams, J.G.; Brodie, D.A. Sources of error in isokinetic dynamometry: Effects of visual feedback on maximum torque measurements. J. Orthop. Sports Phys. Ther. 1991, 13, 138–142. [Google Scholar] [CrossRef] [PubMed]
- Hopper, D.M.; Axel Berg, M.A.; Andersen, H.; Madan, R. The influence of visual feedback on power during leg press on elite women field hockey players. Phys. Ther. Sport 2003, 4, 182–186. [Google Scholar] [CrossRef]
- Theodorou, A.; Paradisis, G.; Smpokos, E.; Chatzinikolaou, A.; Fatouros, I.; King, R.F.G.J.; Cooke, C.B. The effect of combined supplementation of carbohydrates and creatine on anaerobic performance. Biol. Sport 2017, 34, 169–175. [Google Scholar] [CrossRef] [PubMed]
- Lipinska, P.; Szwarc, A. Laboratory tests and game performance of young soccer players. Trends Sport Sci. 2016, 23, 33–39. [Google Scholar]
- Dragula, L.; Lehnert, M.; Psotta, R.; Gonosová, Z.; Valenta, S.; Stastny, P. The relative force in squat jump is the best laboratory predictor of sprint performance in adolescent soccer players. Hum. Mov. 2017, 18, 83–90. [Google Scholar]
- Roczniok, R.; Stanula, A.; Gabryś, T.; Szmatlan-Gabryś, U.; Gołaś, A.; Stastny, P. Physical fitness and performance of polish ice-hockey players competing at different sports levels. J. Hum. Kinet. 2016, 50, 201–208. [Google Scholar] [CrossRef] [PubMed]
- Quinney, H.; Dewart, R.; Game, A.; Snydmiller, G.; Warburton, D.; Bell, G. A 26 year physiological description of a National Hockey League team. Appl. Phys. Nutr. Metab. 2008, 33, 753–760. [Google Scholar] [CrossRef] [PubMed]
- Vescovi, J.D.; Murray, T.M.; Fiala, K.A.; VanHeest, J.L. Off-ice performance and draft status of elite ice hockey players. Int. J. Sports Phys. Perform. 2006, 1, 207–221. [Google Scholar] [CrossRef]
- Kavaliauskas, M.; Phillips, S.M. Reliability and sensitivity of the 6 and 30 second Wingate tests in physically active males and females. Isokinet. Exerc. Sci. 2016, 24, 277–284. [Google Scholar] [CrossRef]
- Herbert, P.; Sculthorpe, N.; Baker, J.S.; Grace, F.M. Validation of a six second cycle test for the determination of peak power output. Res. Sports Med. 2015, 23, 115–125. [Google Scholar] [CrossRef] [PubMed]
- Attia, A.; Hachana, Y.; Chaabène, H.; Gaddour, A.; Neji, Z.; Shephard, R.J.; Chelly, M.S. Reliability and validity of a 20-s alternative to the Wingate anaerobic test in team sport male athletes. PLoS ONE 2014, 9, e114444. [Google Scholar] [CrossRef] [PubMed]
- Hachana, Y.; Attia, A.; Chaabène, H.; Gallas, S.; Sassi, R.H.; Dotan, R. Test-retest reliability and circadian performance variability of a 15-s Wingate Anaerobic Test. Biol. Rhythm Res. 2012, 43, 413–421. [Google Scholar] [CrossRef]
- Hachana, Y.; Attia, A.; Nassib, S.; Shephard, R.J.; Chelly, M.S. Test-retest reliability,criterion-related validity, and minimal detectable change of score on an abbreviated wingate test for field sport participants. J. Strength Cond. Res. 2012, 26, 1324–1330. [Google Scholar] [CrossRef] [PubMed]
- Kavaliauskas, M.; Aspe, R.R.; Babraj, J. High-Intensity Cycling Training: The Effect of Work-to-Rest Intervals on Running Performance Measures. J. Strength Cond. Res. 2015, 29, 2229–2236. [Google Scholar] [CrossRef] [PubMed]
- Potteiger, J.A.; Smith, D.L.; Maier, M.L.; Foster, T.S. Relationship between body composition, leg strength, anaerobic power, and on-ice skating performance in division I men’s hockey athletes. J. Strength Cond. Res. 2010, 24, 1755–1762. [Google Scholar] [CrossRef] [PubMed]
- Stanula, A.; Roczniok, R.; Maszczyk, A.; Pietraszewski, P.; Zając, A. The role of aerobic capacity in high-intensity intermittent efforts in ice-hockey. Biol. Sport 2014, 31, 193–199. [Google Scholar] [CrossRef] [PubMed]
- Roczniok, R.; Maszczyk, A.; Czuba, M.; Stanula, A.; Pietraszewski, P.; Gabryś, T. The predictive value of on-ice special tests in relation to various indexes of aerobic and anaerobic capacity in ice hockey players. Hum. Mov. 2012, 13, 28–32. [Google Scholar] [CrossRef]
- Sjøgaard, G.; Jørgensen, L.V.; Ekner, D.; Søgaard, K. Muscle involvement during intermittent contraction patterns with different target force feedback modes. Clin. Biomech. 2000, 15, S25–S29. [Google Scholar] [CrossRef]
- Madeleine, P.; Jørgensen, L.; Søgaard, K.; Arendt-Nielsen, L.; Sjøgaard, G. Development of muscle fatigue as assessed by electromyography and mechanomyography during continuous and intermittent low-force contractions: Effects of the feedback mode. Eur. J. Appl. Phys. 2002, 87, 28–37. [Google Scholar] [CrossRef] [PubMed]
- Tod, D.; Iredale, F.; Gill, N. ‘Psyching-up’and muscular force production. Sports Med. 2003, 33, 47–58. [Google Scholar] [CrossRef] [PubMed]
- Minett, G.M.; Duffield, R. Is recovery driven by central or peripheral factors? A role for the brain in recovery following intermittent-sprint exercise. Front. Phys. 2014, 5, 24. [Google Scholar] [CrossRef] [PubMed] [Green Version]
- Lochbaum, M.; Gottardy, J. A meta-analytic review of the approach-avoidance achievement goals and performance relationships in the sport psychology literature. J. Sport Health Sci. 2015, 4, 164–173. [Google Scholar] [CrossRef]
- Frikha, M.; Chaâri, N.; Mezghanni, N.; Souissi, N. Influence of warm-up duration and recovery interval prior to exercise on anaerobic performance. Biol. Sport 2016, 33, 361–366. [Google Scholar] [CrossRef] [PubMed]
- Avelar, N.C.P.; Costa, S.J.; Da Fonseca, S.F.; Tossige-Gomes, R.; Gripp, F.J.; Coimbra, C.C.; Lacerda, A.C. The effects of passive warm-up vs. wholebody vibration on high-intensity performance during sprint cycle exercise. J. Strength Cond. Res. 2012, 26, 2997–3003. [Google Scholar] [CrossRef] [PubMed]
- McMillian, D.J.; Moore, J.H.; Hatler, B.S.; Taylor, D.C. Dynamic vs. static-stretching warm up: The effect on power and agility performance. J. Strength Cond. Res. 2006, 20, 492–499. [Google Scholar] [CrossRef] [PubMed]
- Barfield, J.P.; Sells, P.D.; Rowe, D.A.; Hannigan-Downs, K. Practice effect of the Wingate anaerobic test. J. Strength Cond. Res. 2002, 16, 472–473. [Google Scholar] [PubMed]
- Tipton, C.M.; Oppliger, R.A. The Iowa wrestling study: Lessons for physicians. Iowa Med. 1984, 74, 381–385. [Google Scholar] [PubMed]
- Brown, D.; Mackenzie, J.; Dennis, K.; Cullen, R. Comparison of body composition techniques to determine body fat in high school wrestlers. JEP Online 2006, 9, 24–32. [Google Scholar]
- Montgomery, D.; Turcotte, R.; Gamble, E.; Ladouceur, G. Validation of a cycling test of anaerobic endurance for ice hockey players. Res. Sports Med. Int. J. 1990, 2, 11–22. [Google Scholar] [CrossRef]
- Bar-Or, O. The Wingate Anaerobic Test An Update on Methodology, Reliability and Validity. Sports Med. Int. J. Appl. Med. Sci. Sport Exerc. 1987, 4, 381–394. [Google Scholar]
- McLester, J.R.; Green, J.M.; Chouinard, J.L. Effects of standing vs. seated posture on repeated wingate performance. J. Strength Cond. Res. 2004, 18, 816–820. [Google Scholar] [CrossRef] [PubMed]
- Reiser Ii, R.F.; Maines, J.M.; Eisenmann, J.C.; Wilkinson, J.G. Standing and seated Wingate protocols in human cycling. A comparison of standard parameters. Eur. J. Appl. Phys. 2002, 88, 152–157. [Google Scholar] [CrossRef] [PubMed]
- Karaba-Jakovljević, D.; Popadić-Gaćesa, J.; Grujić, N.; Barak, O.; Drapsin, M. Motivation and motoric tests in sports. Med. Pregl. 2007, 60, 231–236. [Google Scholar] [CrossRef] [PubMed]
- Harvey, L.; Bousson, M.; McLellan, C.; Lovell, D. The effect of previous wingate performance using one body region on subsequent wingate performance using a different body region. J. Hum. Kinet. 2017, 56, 119–126. [Google Scholar] [CrossRef] [PubMed]
- Petr, M.; Št‘astný, P.; Pecha, O.; Šteffl, M.; Šeda, O.; Kohlíková, E. PPARA intron polymorphism associated with power performance in 30-s anaerobic Wingate Test. PLoS ONE 2014, 9, e107171. [Google Scholar] [CrossRef] [PubMed]
- Cohen, L.; Manion, L.; Morrison, K. Research Methods in Education; Routledge: London, UK, 2002. [Google Scholar]
- Kellis, E.; Baltzopoulos, V. Resistive Eccentric Exercise: Effects of Visual Feedback on Maximum Moment of Knee Extensors and Flexors. J. Orthop. Sports Phys. Ther. 1996, 23, 120–124. [Google Scholar] [CrossRef] [PubMed]
- Baltzopoulos, V.; Eston, R.G.; Maclaren, D. A comparison of power outputs on the Wingate test and on a test using an isokinetic device. Ergonomics 1988, 31, 1693–1699. [Google Scholar] [CrossRef] [PubMed]
- Brown, L.E.; Whitehurst, M.; Buchalter, D.N. Comparison of Bilateral Isokinetic Knee Extension/Flexion and Cycle Ergometry Tests of Power. J. Strength Cond. Res. 1994, 8, 139–143. [Google Scholar]
- Fernandez-del-Olmo, M.; Rodriguez, F.; Marquez, G.; Iglesias, X.; Marina, M.; Benitez, A.; Vallejo, L.; Acero, R.M. Isometric knee extensor fatigue following a Wingate test: Peripheral and central mechanisms. Scand. J. Med. Sci. Sports 2013, 23, 57–65. [Google Scholar] [CrossRef] [PubMed]
- Peterson, B.J.; Fitzgerald, J.S.; Dietz, C.C.; Ziegler, K.S.; Baker, S.E.; Snyder, E.M. Off-ice anaerobic power does not predict on-ice repeated shift performance in hockey. J. Strength Cond. Res. 2016, 30, 2375–2381. [Google Scholar] [CrossRef] [PubMed]
- Farlinger, C.M.; Kruisselbrink, L.D.; Fowles, J.R. Relationships to skating performance in competitive hockey players. J. Strength Cond. Res. 2007, 21, 915–922. [Google Scholar] [PubMed]
- Peterson, B.J.; Fitzgerald, J.S.; Dietz, C.C.; Ziegler, K.S.; Ingraham, S.J.; Baker, S.E.; Snyder, E.M. Division I hockey players generate more power than Division III players during on- and off-ice performance tests. J. Strength Cond. Res. 2015, 29, 1191–1196. [Google Scholar] [CrossRef] [PubMed]
- Eriksson, M.; Halvorsen, K.A.; Gullstrand, L. Immediate effect of visual and auditory feedback to control the running mechanics of well-trained athletes. J. Sports Sci. 2011, 29, 253–262. [Google Scholar] [CrossRef] [PubMed]
- MacRae, H. Cycling with video feedback improves performance in untrained, but not in trained women. Res. Sports Med. 2003, 11, 261–276. [Google Scholar] [CrossRef] [PubMed]


| Constant Visual Feedback (n = 15) | Restricted Visual Feedback (n = 15) | t-Test (p Value) | Combined (n = 30) | |
|---|---|---|---|---|
| Age (years) | 22.86 ± 2.25 | 21.96 ± 2.05 | 0.81 | 22.45 ± 2.11 |
| Height (cm) | 186.92 ± 4.78 | 186.0 ± 4.62 | 0.63 | 186.5 ± 4.85 |
| Body mass (kg) | 82.23 ± 8.94 | 85.26 ± 8.99 | 0.37 | 83.8 ± 8.9 |
| Fat mass (%) | 9.80 ± 5.45 | 9.33 ± 4.90 | 0.33 | 9.69 ± 5.11 |
| Fat-free mass (kg) | 76.17 ± 7.20 | 74.89 ± 5.93 | 0.60 | 75.5 ± 6.5 |
| Playing experience (years) | 15.64 ± 1.51 | 15.02 ± 1.35 | 0.67 | 15.22 ± 1.45 |
| Stage | Parameter | CVF (Mean ± SD) | RVF (Mean ± SD) | Effect Size (Cohen’s d) | Together (Mean ± SD) |
|---|---|---|---|---|---|
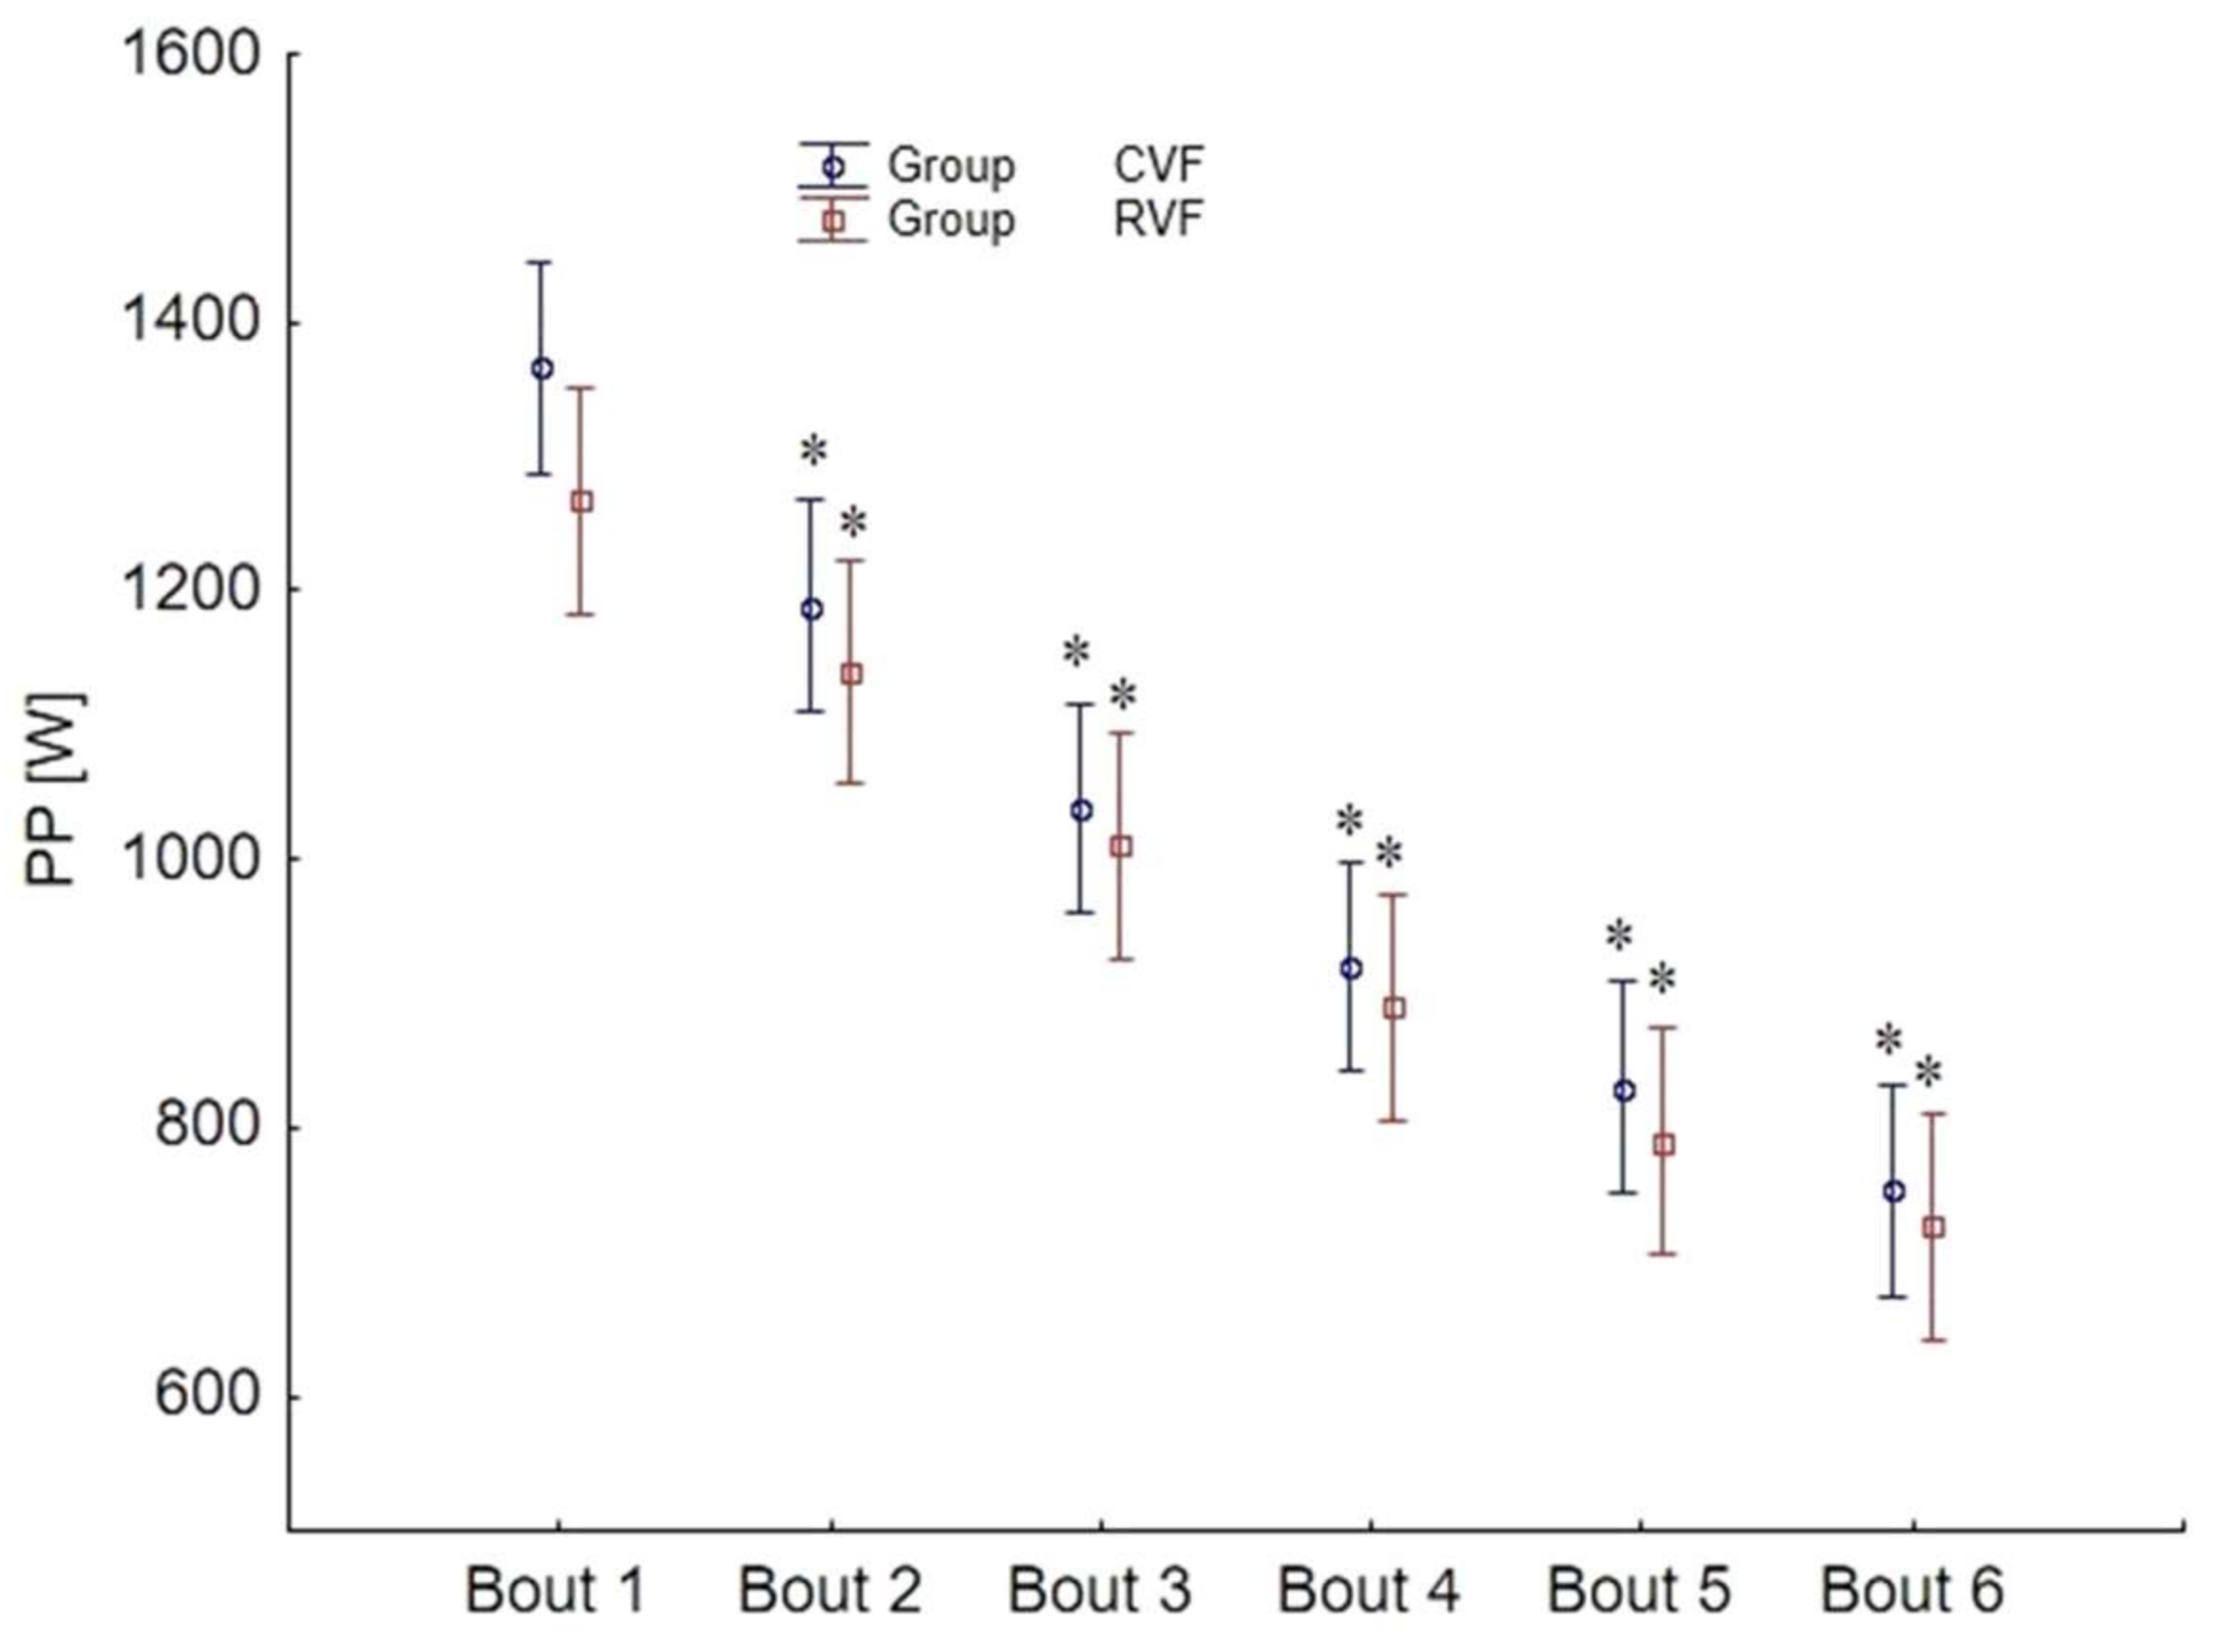
| 1 | PP (W) | 1379 ± 150 | 1266 ± 187 | 0.67 | 1324 ± 175 |
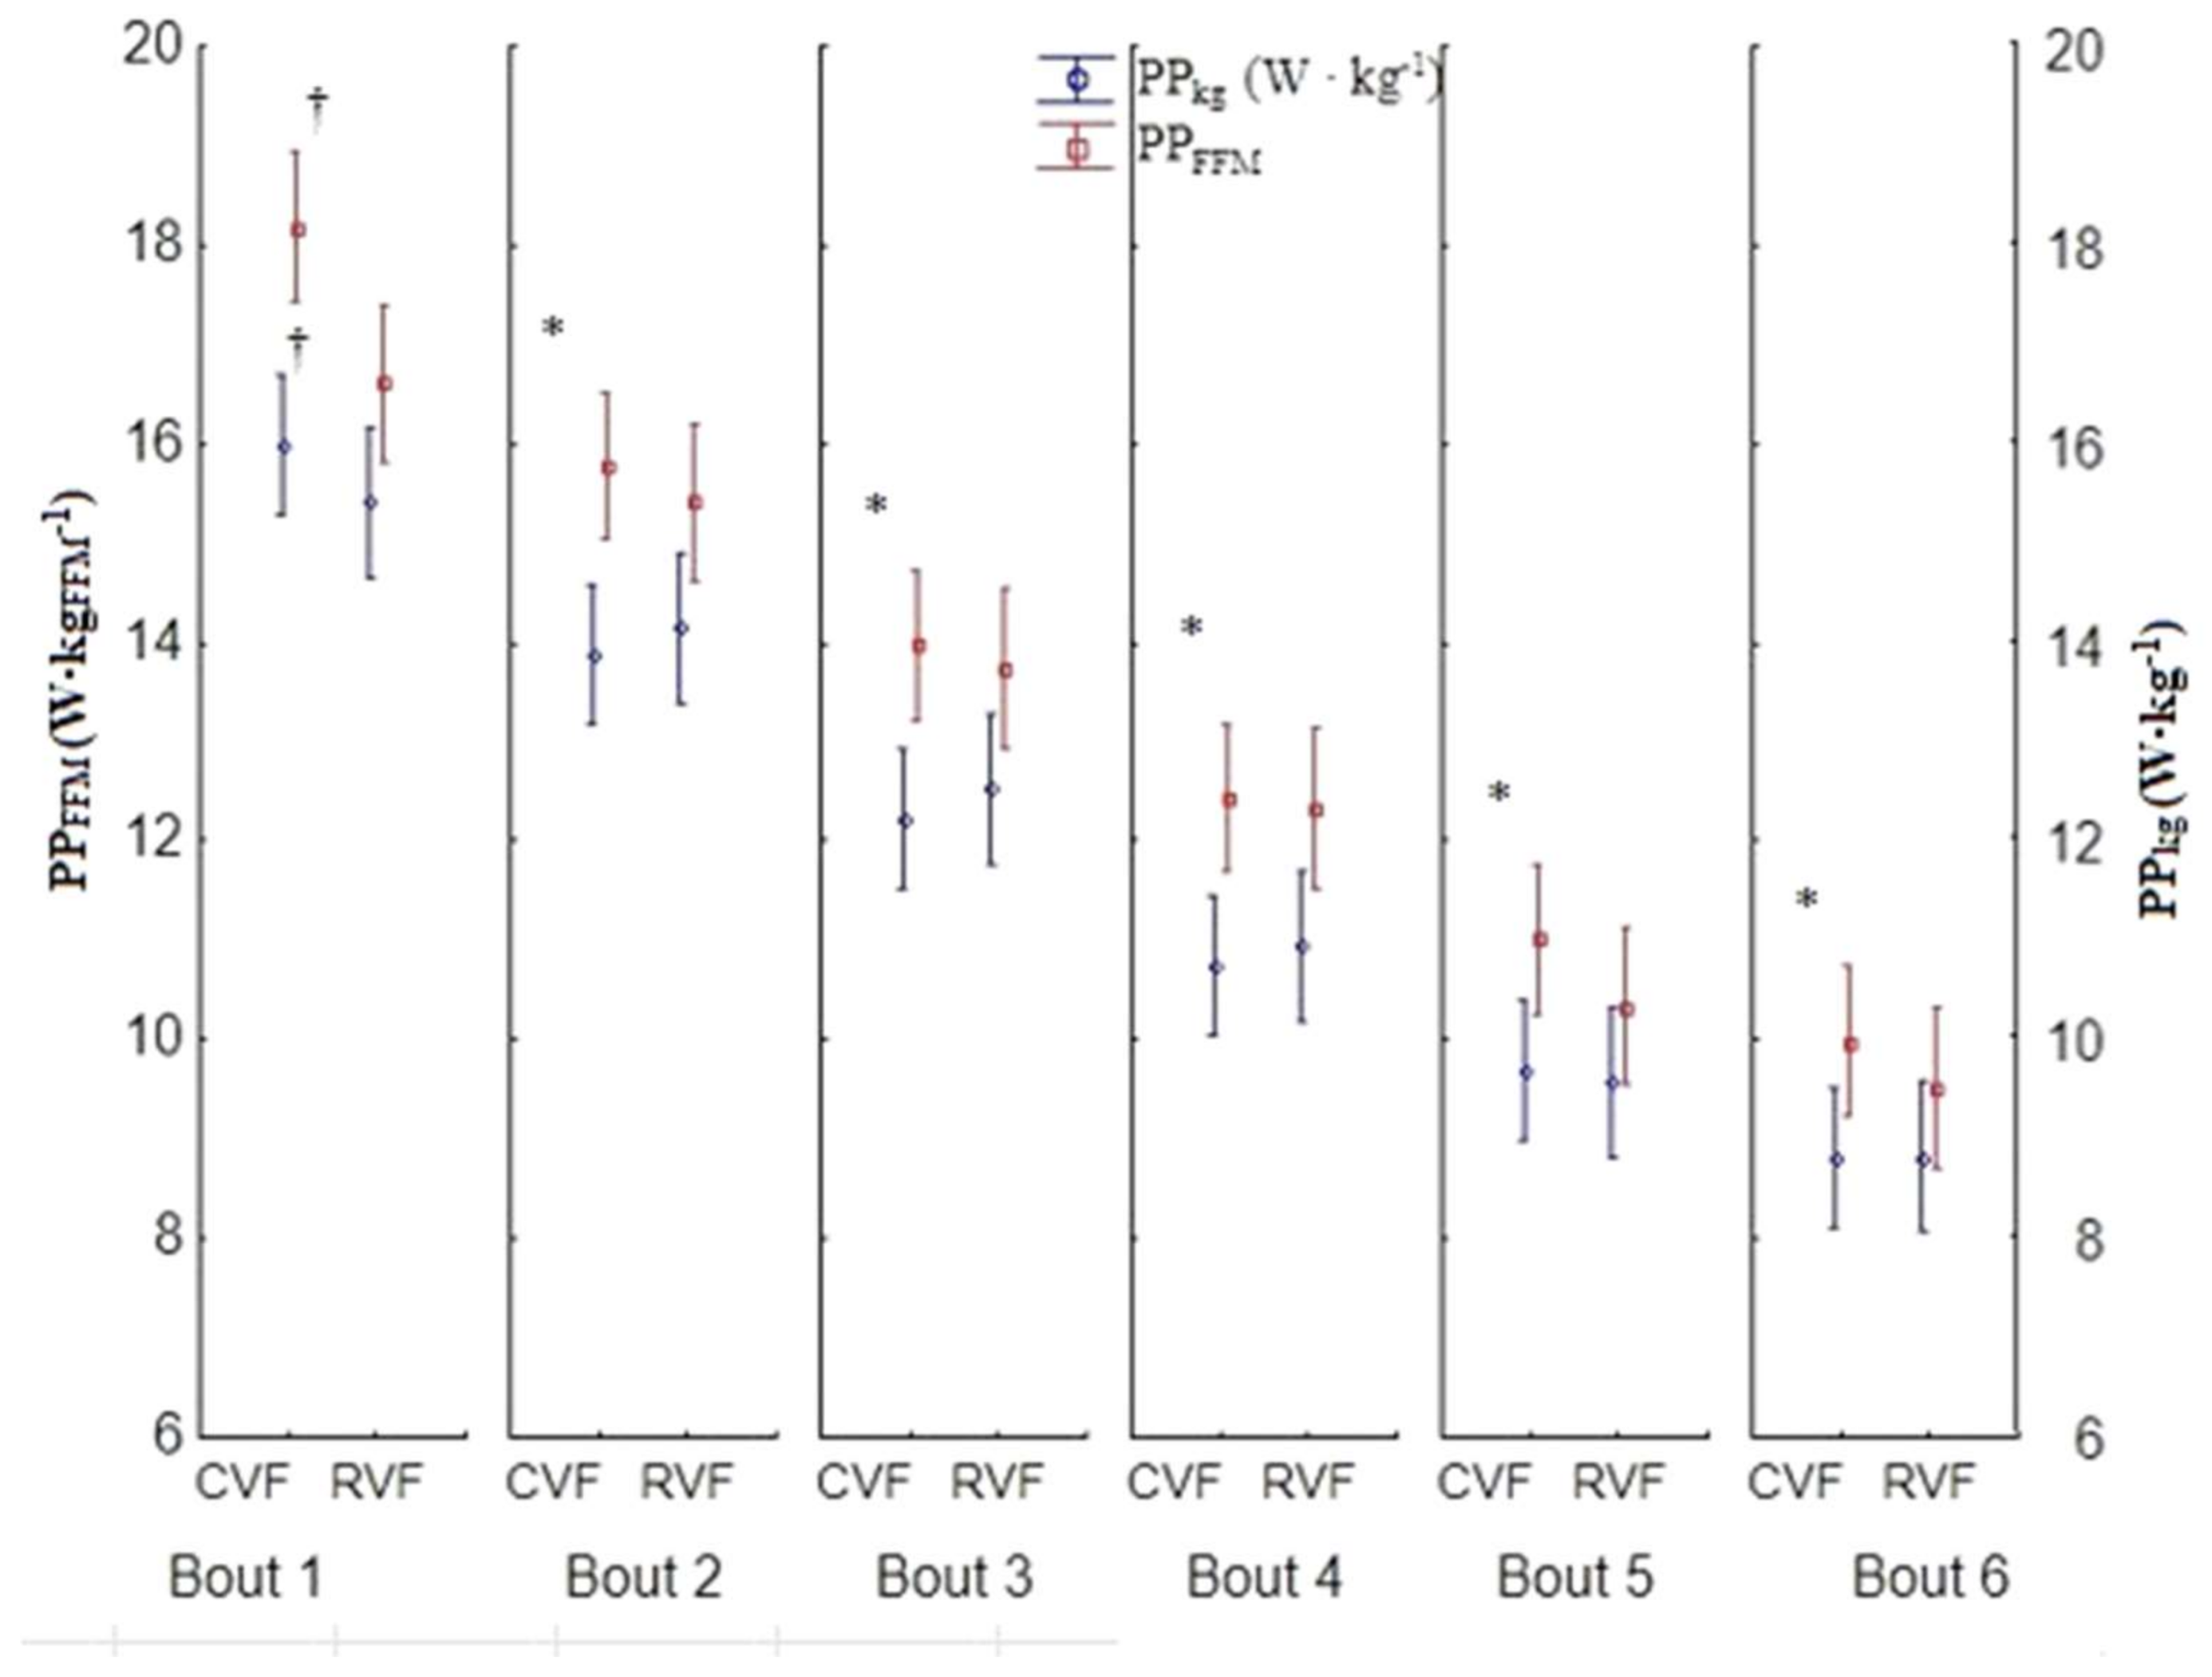
| PPkg (W·kg−1) | 16.2 ± 1.34 | 15.41 ± 1.50 | 0.56 | 15.82 ± 1.45 | |
| PPFFM(W·kg−1) | 18.43 ± 1.62 | 16.61 ± 1.68 | 1.10 | 17.56 ± 1.88 | |
| 2 | PP (W) | 1191 ± 159 | 1139 ± 186 | 0.30 | 1167 ± 171 |
| PPkg (W·kg−1) | 13.98 ± 1.27 | 13.94 ± 1.64 | 0.03 | 13.96 ± 1.43 | |
| PPFFM(W·kg−1) | 15.89 ± 1.31 | 15.51 ± 1.76 | 0.24 | 15.71 ± 1.53 | |
| 3 | PP (W) | 1040 ± 148 | 1010 ± 187 | 0.18 | 1025 ± 165 |
| PPkg (W·kg−1) | 12.21 ± 1.15 | 12.49 ± 1.73 | 0.20 | 12.35 ± 1.44 | |
| PPFFM(W·kg−1) | 13.87 ± 1.43 | 13.80 ± 1.94 | 0.04 | 13.84 ±1.67 | |
| 4 | PP (W) | 926 ± 154 | 889 ± 178 | 0.22 | 908 ± 164 |
| PPkg (W·kg−1) | 10.87 ± 1.52 | 10.94 ± 1.52 | 0.05 | 10.90 ± 1.49 | |
| PPFFM(W·kg−1) | 12.34 ± 1.57 | 12.19 ± 1.68 | 0.09 | 12.27 ± 1.60 | |
| 5 | PP (W) | 831 ± 152 | 790 ± 143 | 0.28 | 811 ± 147 |
| PPkg (W·kg−1) | 9.74 ± 1.49 | 9.80 ± 1.17 | 0.04 | 9.77 ± 1.32 | |
| PPFFM(W·kg−1) | 11.07 ± 1.68 | 10.98 ± 1.54 | 0.06 | 11.03 ± 1.58 | |
| 6 | PP (W) | 756 ± 139 | 726 ± 124 | 0.23 | 741 ± 130 |
| PPkg (W·kg−1) | 8.88 ± 1.43 | 8.82 ± 1.03 | 0.05 | 8.85 ± 1.23 | |
| PPFFM(W·kg−1) | 10.07 ± 1.50 | 9.66 ± 1.27 | 0.30 | 9.87 ± 1.38 |
© 2018 by the authors. Licensee MDPI, Basel, Switzerland. This article is an open access article distributed under the terms and conditions of the Creative Commons Attribution (CC BY) license (http://creativecommons.org/licenses/by/4.0/).
Share and Cite
Stastny, P.; Tufano, J.J.; Kregl, J.; Petr, M.; Blazek, D.; Steffl, M.; Roczniok, R.; Fiala, M.; Golas, A.; Zmijewski, P. The Role of Visual Feedback on Power Output During Intermittent Wingate Testing in Ice Hockey Players. Sports 2018, 6, 32. https://doi.org/10.3390/sports6020032
Stastny P, Tufano JJ, Kregl J, Petr M, Blazek D, Steffl M, Roczniok R, Fiala M, Golas A, Zmijewski P. The Role of Visual Feedback on Power Output During Intermittent Wingate Testing in Ice Hockey Players. Sports. 2018; 6(2):32. https://doi.org/10.3390/sports6020032
Chicago/Turabian StyleStastny, Petr, James J. Tufano, Jan Kregl, Miroslav Petr, Dusan Blazek, Michal Steffl, Robert Roczniok, Milos Fiala, Artur Golas, and Piotr Zmijewski. 2018. "The Role of Visual Feedback on Power Output During Intermittent Wingate Testing in Ice Hockey Players" Sports 6, no. 2: 32. https://doi.org/10.3390/sports6020032