
Effects of Pesticide Treatments on Nutrient Levels in Worker Honey Bees (Apis mellifera)

Abstract
:1. Introduction
2. Experimental Section
2.1. Colony Establishment
2.2. Biochemical Assays
2.3. Statistical Analysis
3. Results
4. Discussion
Acknowledgments
Author Contributions
Conflicts of Interest
References
- VanEngelsdorp, D.; Evans, J.D.; Saegerman, C.; Mullin, C.; Haubruge, E.; Nguyen, B.K.; Frazier, M.; Frazier, J.; Cox-Foster, D.; Chen, Y.; et al. Colony Collapse Disorder: A descriptive study. PLoS ONE 2009, 4, e6481. [Google Scholar] [CrossRef] [PubMed]
- VanEngelsdorp, D.; Caron, D.; Hayes, J.; Underwood, R.; Henson, M.; Rennich, K.; Spleen, A.; Andree, M.; Snyder, R.; Lee, K. A national survey of managed honey bee 2010–2011 winter colony losses in the USA: Results from the Bee Informed Partnership. 2012, 51, 115–124. [Google Scholar]
- Goulson, D.; Nicholls, E.; Botías, C.; Rotheray, E.L. Bee declines driven by combined stress from parasites, pesticides, and lack of flowers. Science 2015, 347. [Google Scholar] [CrossRef] [PubMed]
- Pimentel, D. Environmental and Economic Costs of the Application of Pesticides Primarily in the United States. In Integrated Pest Management: Innovation-Development Process; Peshin, R., Dhawan, A., Eds.; Springer-Verlag: New York, NY, USA, 2009; pp. 89–111. [Google Scholar]
- Mullin, C.A.; Frazier, M.; Frazier, J.L.; Ashcraft, S.; Simonds, R.; Pettis, J.S. High levels of miticides and agrochemicals in North American apiaries: Implications for honey bee health. PLoS ONE 2010, 5, e9754. [Google Scholar] [CrossRef] [PubMed]
- Wu, J.Y.; Anelli, C.M.; Sheppard, W.S. Sub-lethal effects of pesticide residues in brood comb on worker honey bee (Apis mellifera) development and longevity. PLoS ONE 2011, 6, e14720. [Google Scholar] [CrossRef] [PubMed]
- Desneux, N.; Decourtye, A.; Delpuech, J.-M. The sublethal effects of pesticides on beneficial arthropods. Annu. Rev. Entomol. 2007, 52, 81–106. [Google Scholar] [CrossRef] [PubMed]
- Neumann, P.; Carreck, N.L. Honey bee colony losses. J. Apic. Res. 2010, 49, 1–6. [Google Scholar]
- Mozes-Koch, R.; Slabezki, Y.; Efrat, H.; Kalev, H.; Kamer, Y.; Yakobson, B.; Dag, A. First detection in Israel of fluvalinate resistance in the varroa mite using bioassay and biochemical methods. Exp. Appl. Acarol. 2000, 24, 35–43. [Google Scholar] [CrossRef]
- Shen, M.; Yang, X.; Cox-Foster, D.; Cui, L. The role of varroa mites in infections of Kashmir bee virus (KBV) and deformed wing virus (DWV) in honey bees. Virology 2005, 342, 141–149. [Google Scholar] [CrossRef] [PubMed]
- Pettis, J.; Lichtenberg, E.; Andree, M.; Stitzinger, J.; Rose, R.; vanEngelsdorp, D. Crop pollination exposes honey bees to pesticides which alters their susceptibility to the gut pathogen Nosema ceranae. PLoS ONE 2013, 8, e70182. [Google Scholar]
- Huang, W.-F.; Solter, L.F.; Yau, P.M.; Imai, B.S. Nosema ceranae escapes fumagillin control in honey bees. PLoS Pathog. 2013, 9, e1003185. [Google Scholar] [CrossRef] [PubMed]
- Hoang, A. Immune response to parasitism reduces resistance of Drosophila melanogaster to desiccation and starvation. Evolution 2001, 55, 2353–2358. [Google Scholar] [CrossRef] [PubMed]
- Moret, Y.; Schmid-Hempel, P. Survival for immunity: The price of immune system activation for bumblebee workers. Science 2000, 290, 1166–1168. [Google Scholar] [CrossRef] [PubMed]
- Wahl, O.; Ulm, K. Influence of pollen feeding and physiological condition on pesticide sensitivity of the honey bee Apis mellifera carnica. Oecologia 1983, 59, 106–128. [Google Scholar] [CrossRef] [PubMed]
- Alaux, C.; Ducloz, F.; Crauser, D.; le Conte, Y. Diet effects on honeybee immunocompetence. Biol. Lett. 2010, 6, 562–565. [Google Scholar] [CrossRef] [PubMed]
- DeGrandi-Hoffman, G.; Chen, Y.; Huang, E.; Huang, M.H. The effect of diet on protein concentration, hypopharyngeal gland development and virus load in worker honey bees (Apis mellifera L.). J. Insect Physiol. 2010, 56, 1184–1191. [Google Scholar] [CrossRef] [PubMed]
- Haydak, M.H. Honey bee nutrition. Annu. Rev. Entomol. 1970, 15, 143–156. [Google Scholar] [CrossRef]
- Ponton, F.; Wilson, K.; Holmes, A.J.; Cotter, S.C.; Raubenheimer, D.; Simpson, S.J. Integrating nutrition and immunology: A new frontier. J. Insect Physiol. 2013, 59, 130–137. [Google Scholar] [CrossRef] [PubMed]
- Bernal, J.; Garrido-Bailón, E.; del Nozal, M.J.; González-Porto, A.V.; Martín-Hernández, R.; Diego, J.C.; Jiménez, J.J.; Bernal, J.L.; Higes, M. Overview of pesticide residues in stored pollen and their potential effect on bee colony (Apis mellifera) losses in Spain. J. Econ. Entomol. 2010, 103, 1964–1971. [Google Scholar] [CrossRef] [PubMed]
- Van Handel, E. Rapid determination of glycogen and sugars in mosquitoes. J. Am. Mosq. Control Assoc. 1985, 1, 299–301. [Google Scholar] [PubMed]
- Van Handel, E.; Day, J.F. Assay of lipids, glycogen and sugars in individual mosquitoes: Correlations with wing length in field-collected Aedes vexans. J. Am. Mosq. Control Assoc. 1988, 4, 549–550. [Google Scholar] [PubMed]
- Aronstein, K.A.; Saldivar, E.; Vega, R.; Westmiller, S.; Douglas, A.E. How Varroa parasitism affects the immunological and nutritional status of the honey bee, Apis mellifera. Insects 2012, 3, 601–615. [Google Scholar] [CrossRef] [PubMed]
- Pirk, C.W.W.; de Miranda, J.R.; Kramer, M.; Murray, T.E.; Nazzi, F.; Shutler, D.; van der Steen, J.J.M.; van Dooremalen, C. Statistical guidelines for Apis mellifera research. J. Apic. Res. 2013, 52, 1–24. [Google Scholar] [CrossRef]
- Littell, R.C.; Pendergast, J.; Natarajan, R. Modelling covariance structure in the analysis of repeated measures data. Stat. Med. 2000, 19, 1793–1819. [Google Scholar] [CrossRef]
- Von Ende, C.N. Repeated-measures analysis: growth and other time-dependent measures. In Design and Analysis of Ecological Experiments, 2nd ed.; Scheiner, S.M., Gurevitch, J., Eds.; Oxford University Press: New York, NY, USA, 2001; pp. 134–157. [Google Scholar]
- Preisser, E.L.; Elkinton, J.S. Exploitative competition between invasive herbivores benefits a native host plant. Ecology 2008, 89, 2671–2677. [Google Scholar] [CrossRef] [PubMed]
- Mbata, G.N.; Badji, K.; Brewster, C.C. Monitoring populations of Phthorimaea operculella in potato fields and in storage in Senegal. Int. J. Pest Manag. 2014, 60, 300–306. [Google Scholar] [CrossRef]
- Osborne, J.W. Improving your data transformations: Applying the Box-Cox transformation. Pract. Assess. Res. Eval. 2010, 15, 1–9. [Google Scholar]
- Shehata, S.M.; Townsend, G.F.; Shuel, R.W. Seasonal physiological changes in queen and worker honeybees. J. Apic. Res. 1981, 20, 69–78. [Google Scholar]
- Fluri, P.; Lüscher, M.; Wille, H.; Gerig, L. Changes in weight of the pharyngeal gland and haemolymph titres of juvenile hormone, protein and vitellogenin in worker honey bees. J. Insect Physiol. 1982, 28, 61–68. [Google Scholar] [CrossRef]
- Kunert, K.; Crailsheim, K. Seasonal changes in carbohydrate, lipid and protein content in emerging worker honeybees and their mortality. J. Apic. Res. 1988, 27, 13–21. [Google Scholar]
- Rani, U.; Jain, K.L. Dependence of body protein on age and season in Apis mellifera worker bees. Haryana Agric. Univ. J. Res. 1996, 26, 9–15. [Google Scholar]
- Deseyn, J.; Billen, J. Age-dependent morphology and ultrastructure of the hypopharyngeal gland of Apis mellifera workers (Hymenoptera, Apidae). Apidologie 2005, 36, 49–57. [Google Scholar] [CrossRef]
- Feazel-Orr, H.K.; Catalfamo, K.M.; Brewster, C.C.; Fell, R.D.; Anderson, T.D.; Traver, B.E.; Biology Department, Penn State Schuylkill, Schuylkill Haven, PA, USA. Unpublished data. 2015.
- Stabentheiner, A.; Pressl, H.; Papst, T.; Hrassnigg, N.; Crailsheim, K. Endothermic heat production in honeybee winter clusters. J. Exp. Biol. 2003, 206, 353–358. [Google Scholar] [CrossRef] [PubMed]

| Season (Year) | Treatment | Wet Weight (g) | Protein Level (mg/g) | Carbohydrate Level (mg/g) | N 1 |
|---|---|---|---|---|---|
| Fall 2012 | Control | 0.118 ± 0.002 | 92.0 ± 5.54 | 1.306 ± 0.214 | 121 |
| Chlorothalonil | 0.137 ± 0.005 | 118.7 ± 10.7 | 0.956 ± 0.131 | 158 | |
| Fumagilin | 0.119 ± 0.002 | 115.27 ± 8.0 | 1.130 ± 0.157 | 155 | |
| tau-Fluvalinate | 0.136 ± 0.007 | 122.3 ± 10.4 | 0.963 ± 0.01 | 141 | |
| Spring 2013 | Control | 0.146 ± 0.004 | 177.2 ± 8.7 | 2.117 ± 0.184 | 213 |
| Chlorothalonil | 0.138 ± 0.003 | 181.4 ± 11.2 | 1.625 ± 0.245 | 92 | |
| Fumagilin | 0.141 ± 0.002 | 168.0 ± 9.1 | 3.012 ± 0.326 | 173 | |
| tau-Fluvalinate | 0.141 ± 0.004 | 189.9 ± 10.8 | 3.318 ± 0.307 | 169 | |
| Summer 2013 | Control | 0.135 ± 0.002 | 116.8 ± 6.7 | 7.49 ± 0.476 | 209 |
| Chlorothalonil | 0.142 ± 0.002 | 142.2 ± 8.9 | 7.5 ± 0.557 | 75 | |
| Fumagilin | 0.139 ± 0.002 | 159.8 ± 8.1 | 13.94 ± 0.973 | 222 | |
| tau-Fluvalinate | 0.139 ± 0.002 | 129.4 ± 7.3 | 8.204 ± 1.563 | 179 |
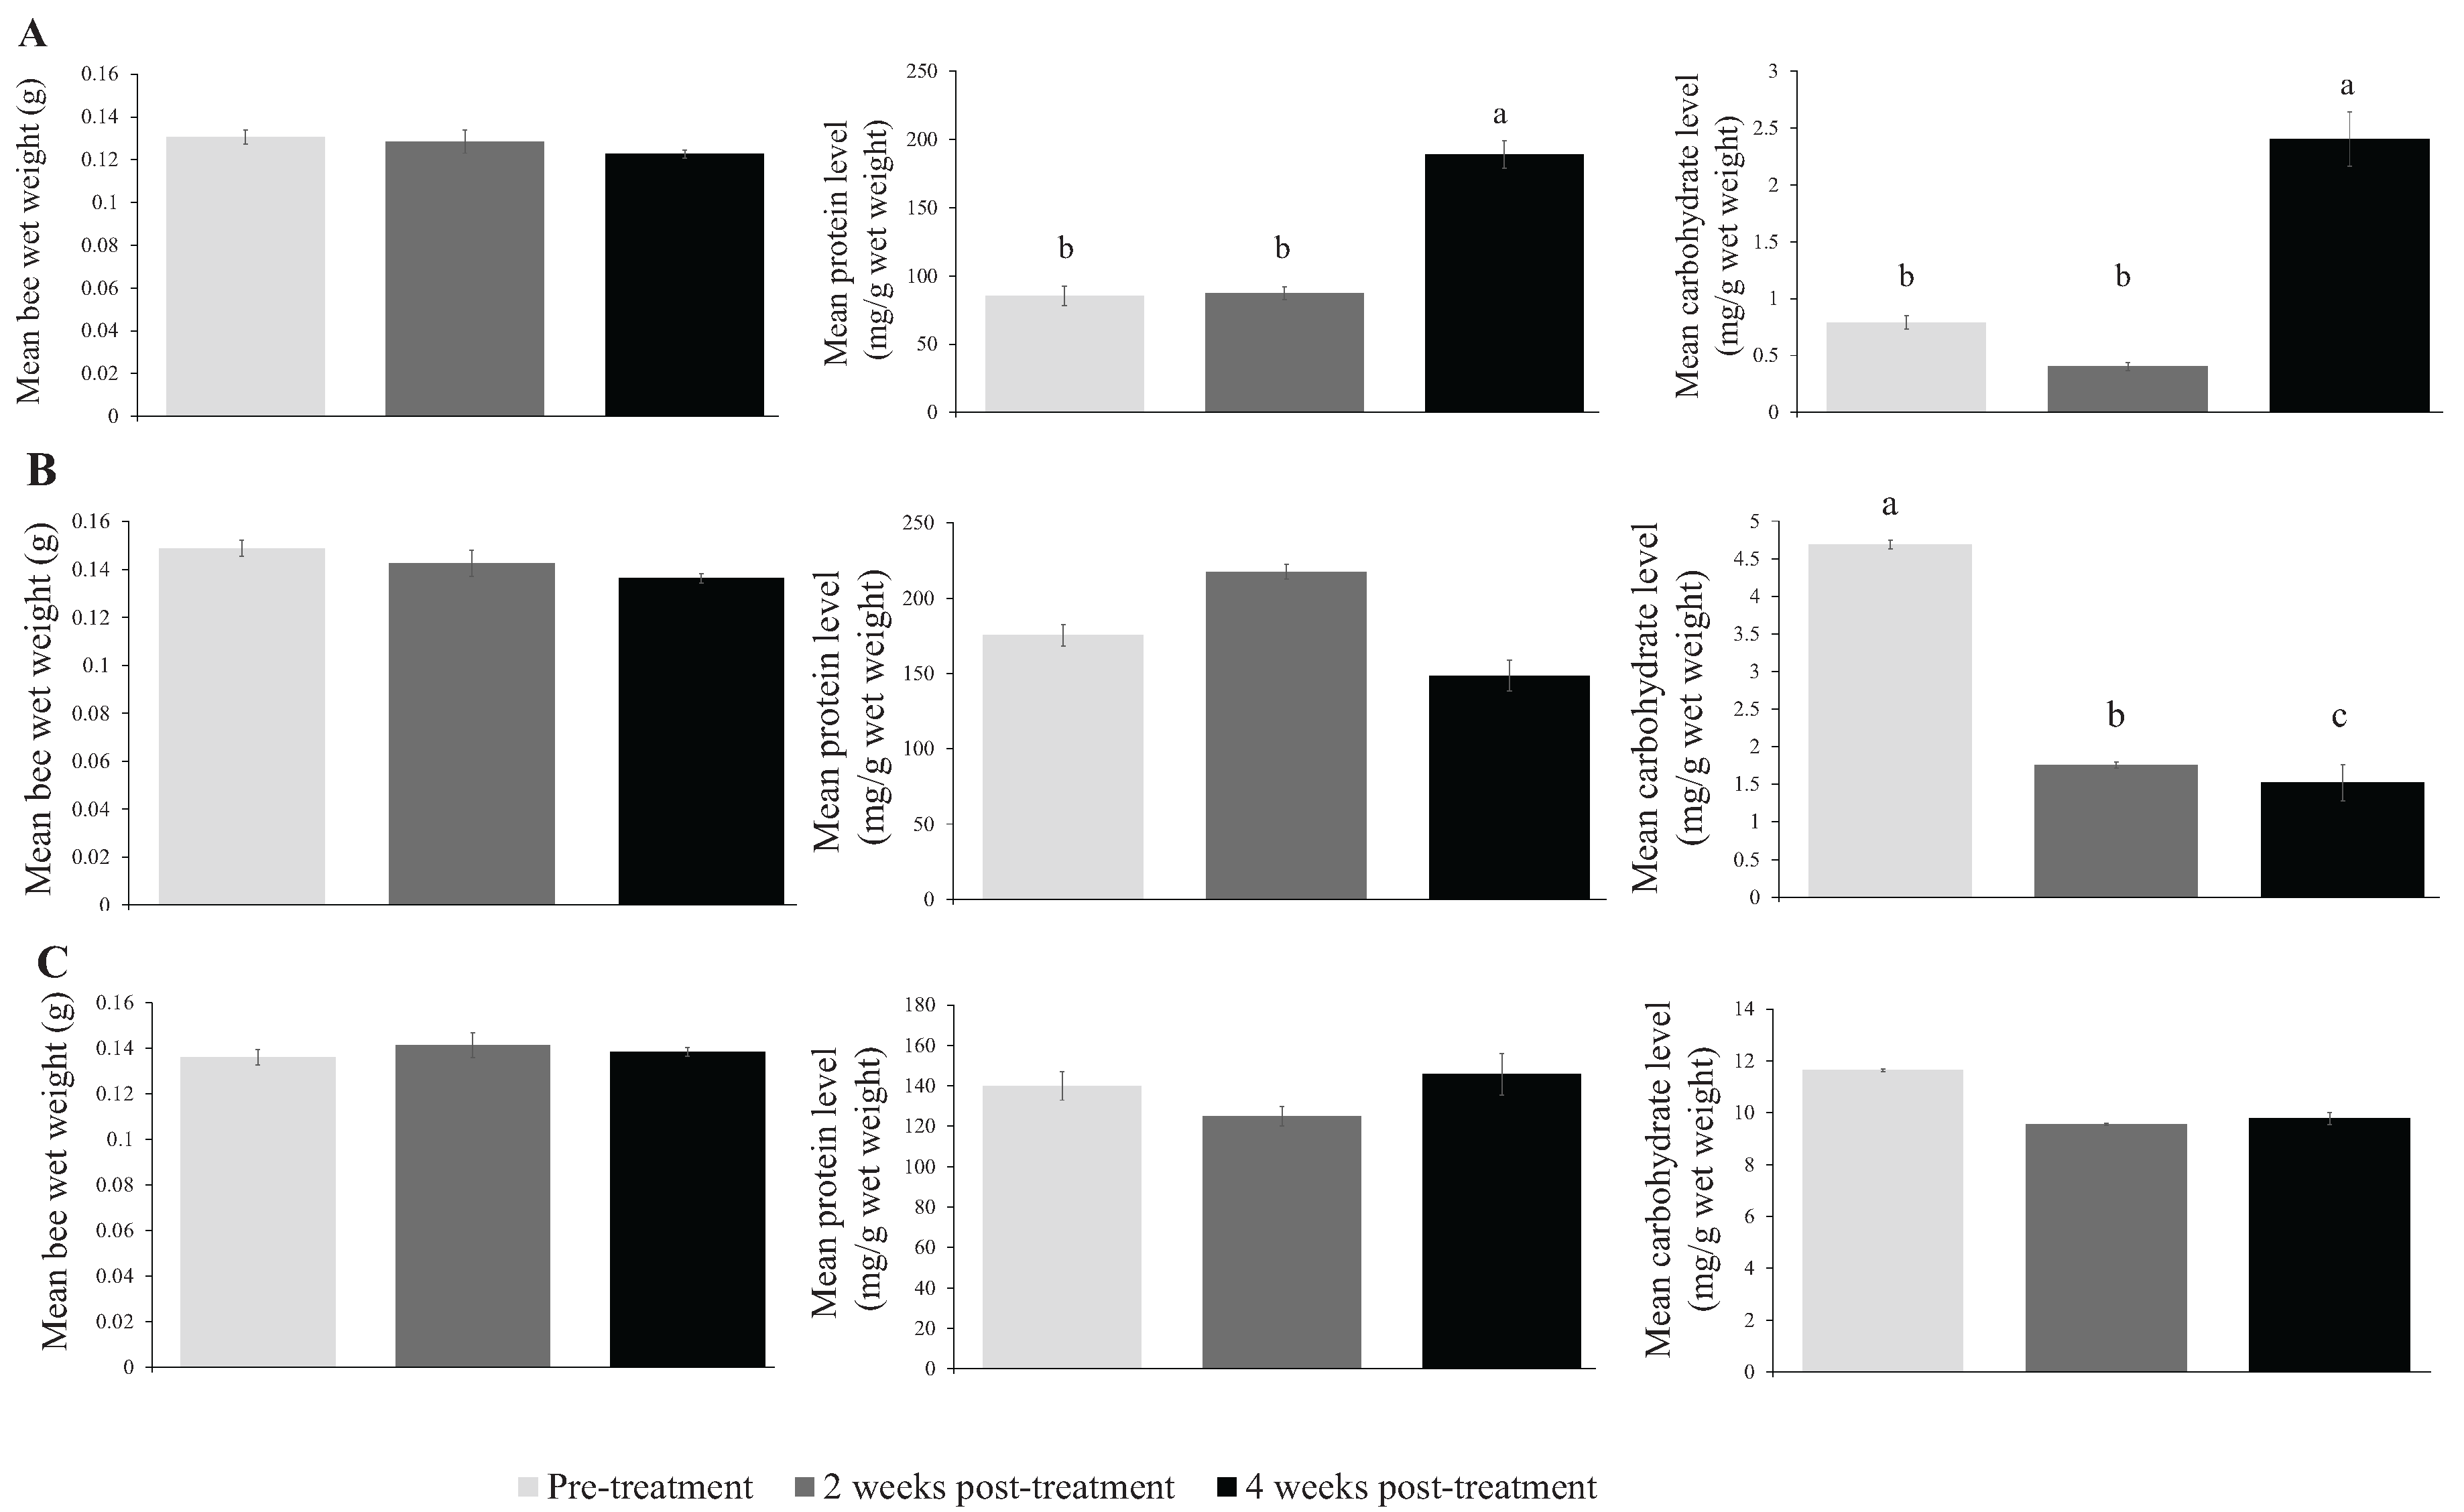
| Season (Year) | Sampling Time | Wet Weight (g) | Protein Level (mg/g) | Carbohydrate Level (mg/g) | N 1 |
|---|---|---|---|---|---|
| Fall 2012 | Pre-treatment | 0.131 ± 0.003 | 283.9 ± 23.8 b | 2.635 ± 0.193 b | 228 |
| 2 weeks post-treatment | 0.128 ± 0.005 | 291.6 ± 15.9 b | 1.343 ± 0.124 b | 197 | |
| 4 weeks post-treatment | 0.123 ± 0.002 | 629.6 ± 34.0 a | 8.009 ± 0.799 a | 150 | |
| Spring 2013 | Pre-treatment | 0.149 ± 0.003 | 585.0 ± 22.0 | 15.633 ± 0.768 a | 207 |
| 2 weeks post-treatment | 0.143 ± 0.003 | 725.3 ± 36.1 | 5.859 ± 0.505 b | 201 | |
| 4 weeks post-treatment | 0.136 ± 0.003 | 495.2 ± 24.9 | 5.067 ± 0.839 c | 239 | |
| Summer 2013 | Pre-treatment | 0.136 ± 0.002 | 386.2 ± 21.2 | 38.933 ± 3.689 | 207 |
| 2 weeks post-treatment | 0.141 ± 0.002 | 345.4 ± 18.8 | 31.824 ± 1.133 | 238 | |
| 4 weeks post-treatment | 0.138 ± 0.001 | 446.4 ± 25.0 | 32.594 ± 1.744 | 240 |
© 2016 by the authors; licensee MDPI, Basel, Switzerland. This article is an open access article distributed under the terms and conditions of the Creative Commons by Attribution (CC-BY) license (http://creativecommons.org/licenses/by/4.0/).
Share and Cite
Feazel-Orr, H.K.; Catalfamo, K.M.; Brewster, C.C.; Fell, R.D.; Anderson, T.D.; Traver, B.E. Effects of Pesticide Treatments on Nutrient Levels in Worker Honey Bees (Apis mellifera). Insects 2016, 7, 8. https://doi.org/10.3390/insects7010008
Feazel-Orr HK, Catalfamo KM, Brewster CC, Fell RD, Anderson TD, Traver BE. Effects of Pesticide Treatments on Nutrient Levels in Worker Honey Bees (Apis mellifera). Insects. 2016; 7(1):8. https://doi.org/10.3390/insects7010008
Chicago/Turabian StyleFeazel-Orr, Haley K., Katelyn M. Catalfamo, Carlyle C. Brewster, Richard D. Fell, Troy D. Anderson, and Brenna E. Traver. 2016. "Effects of Pesticide Treatments on Nutrient Levels in Worker Honey Bees (Apis mellifera)" Insects 7, no. 1: 8. https://doi.org/10.3390/insects7010008