Twenty Years of Elfin Enumeration: Abundance Patterns of Five Species of Callophrys (Lycaenidae) in Central Wisconsin, USA

Abstract
:
1. Introduction
2. Methods
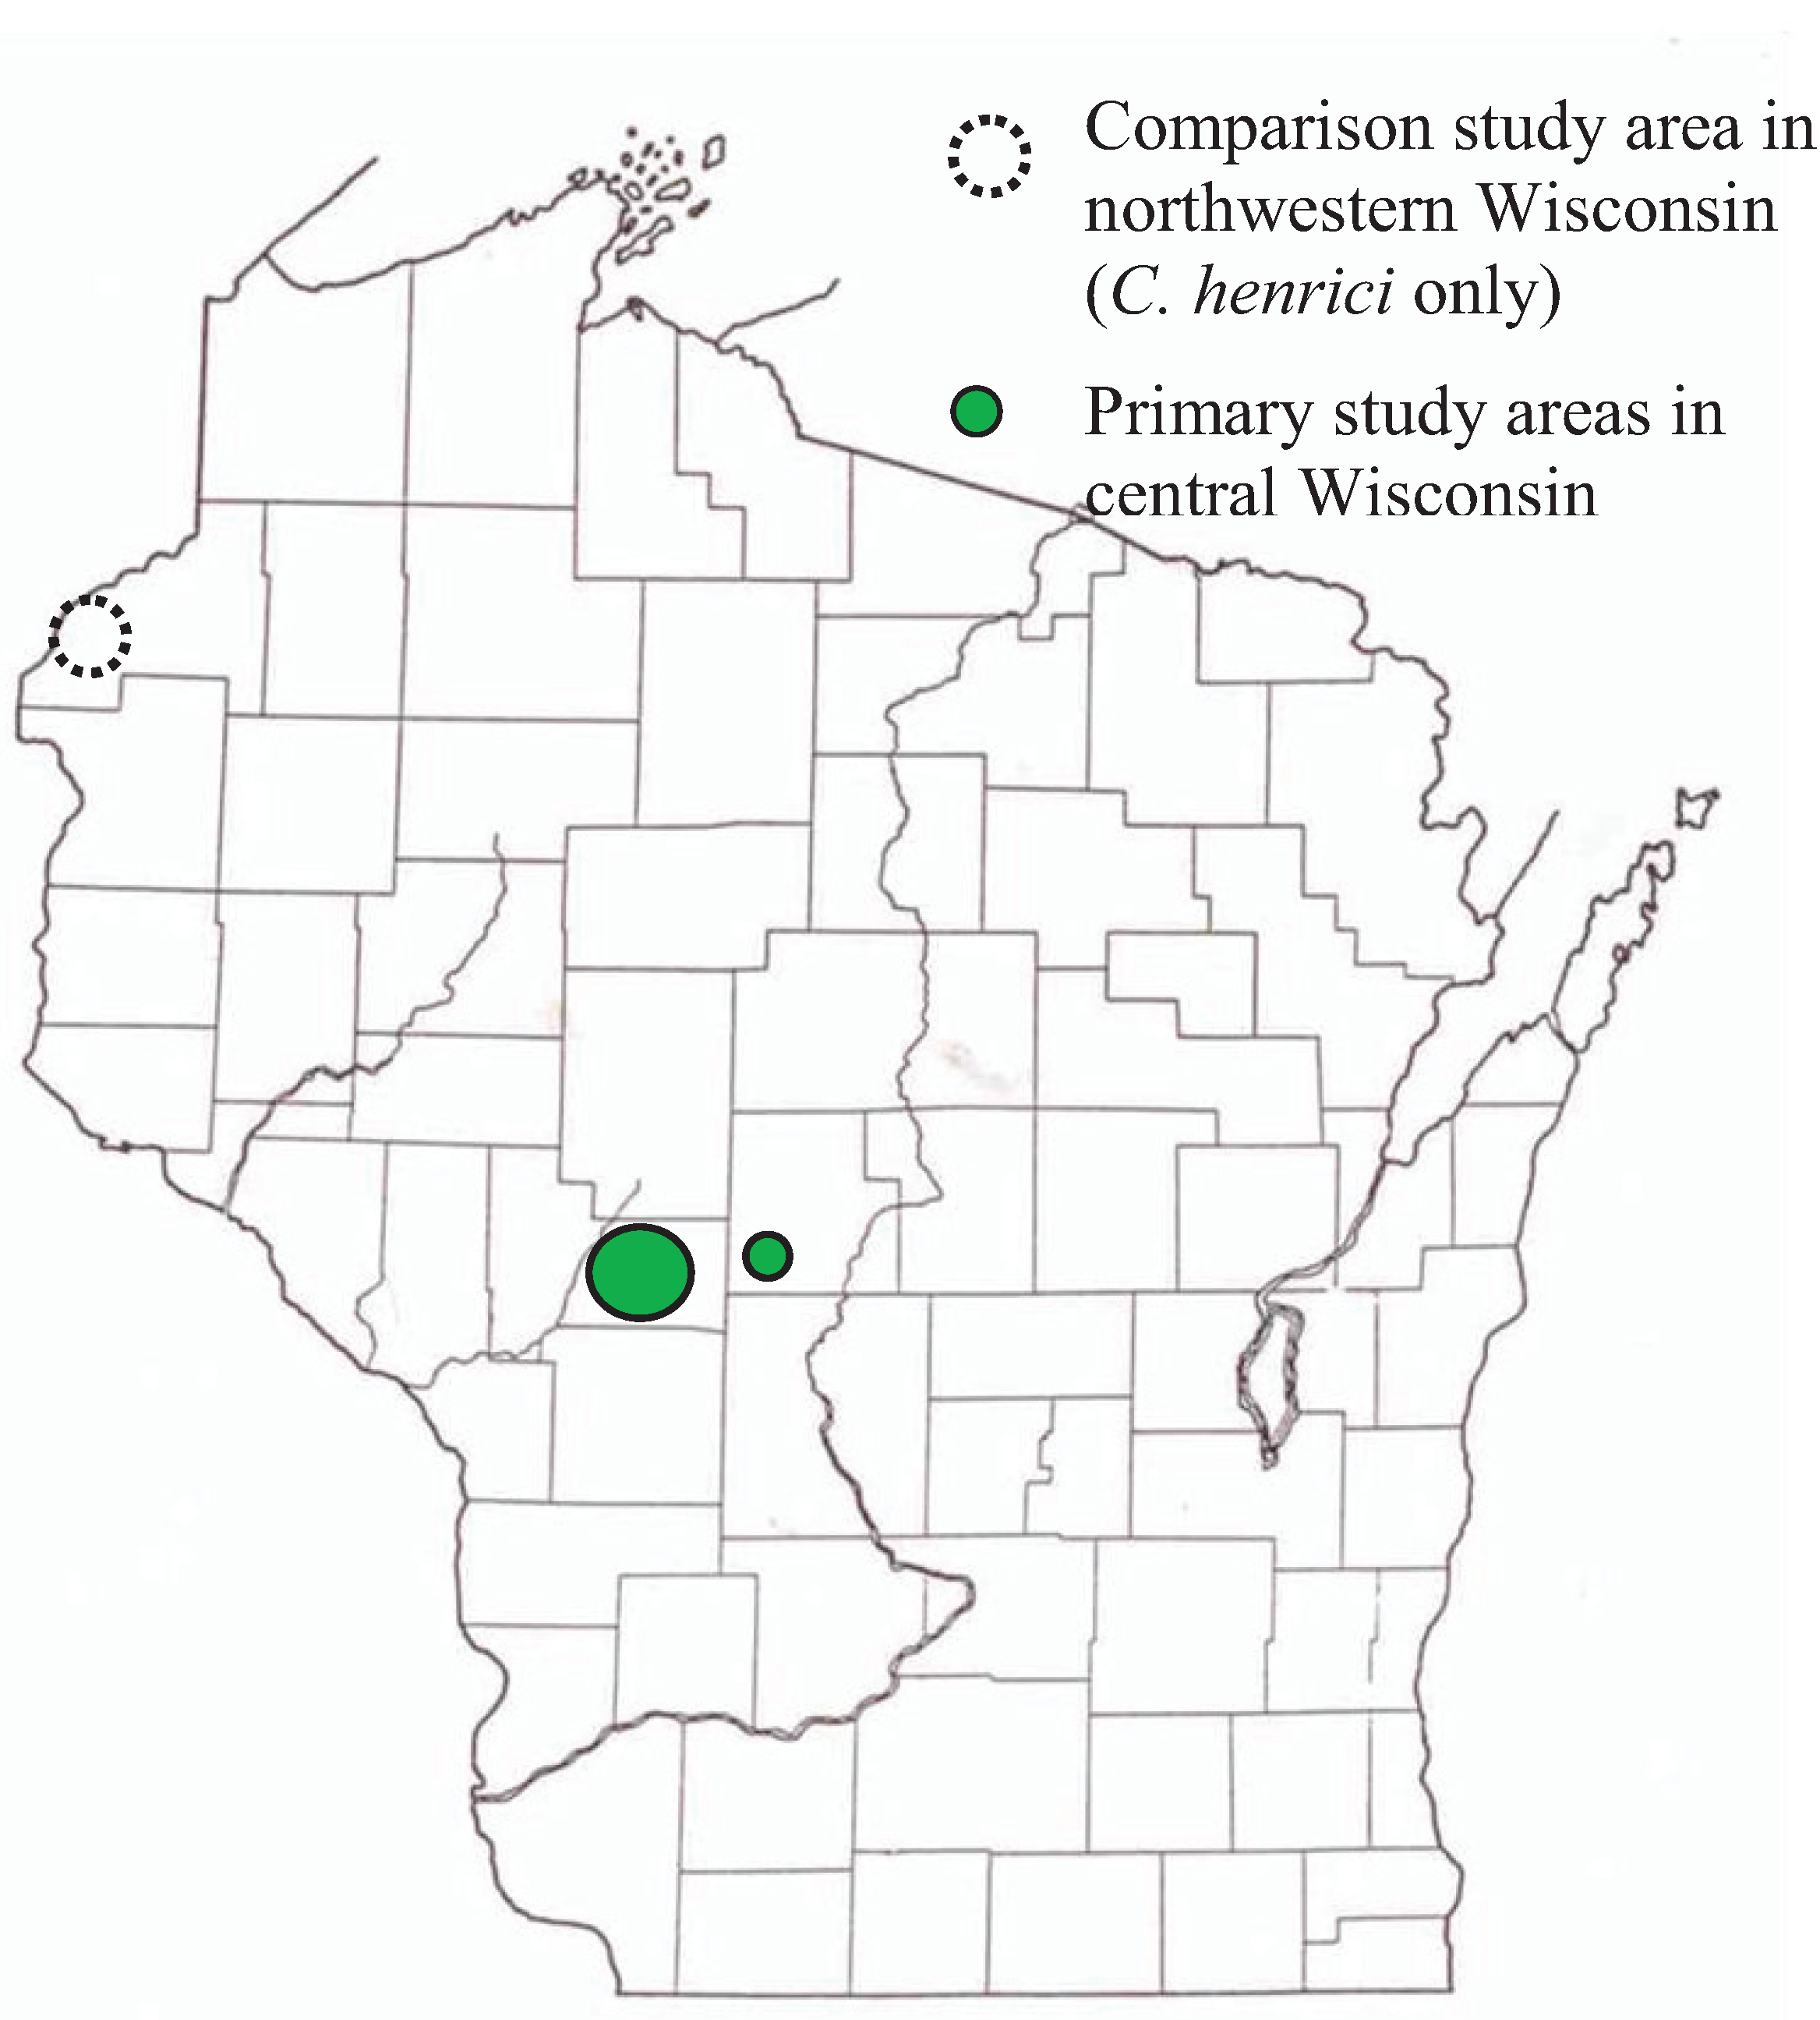
2.1. Sites and Surveys

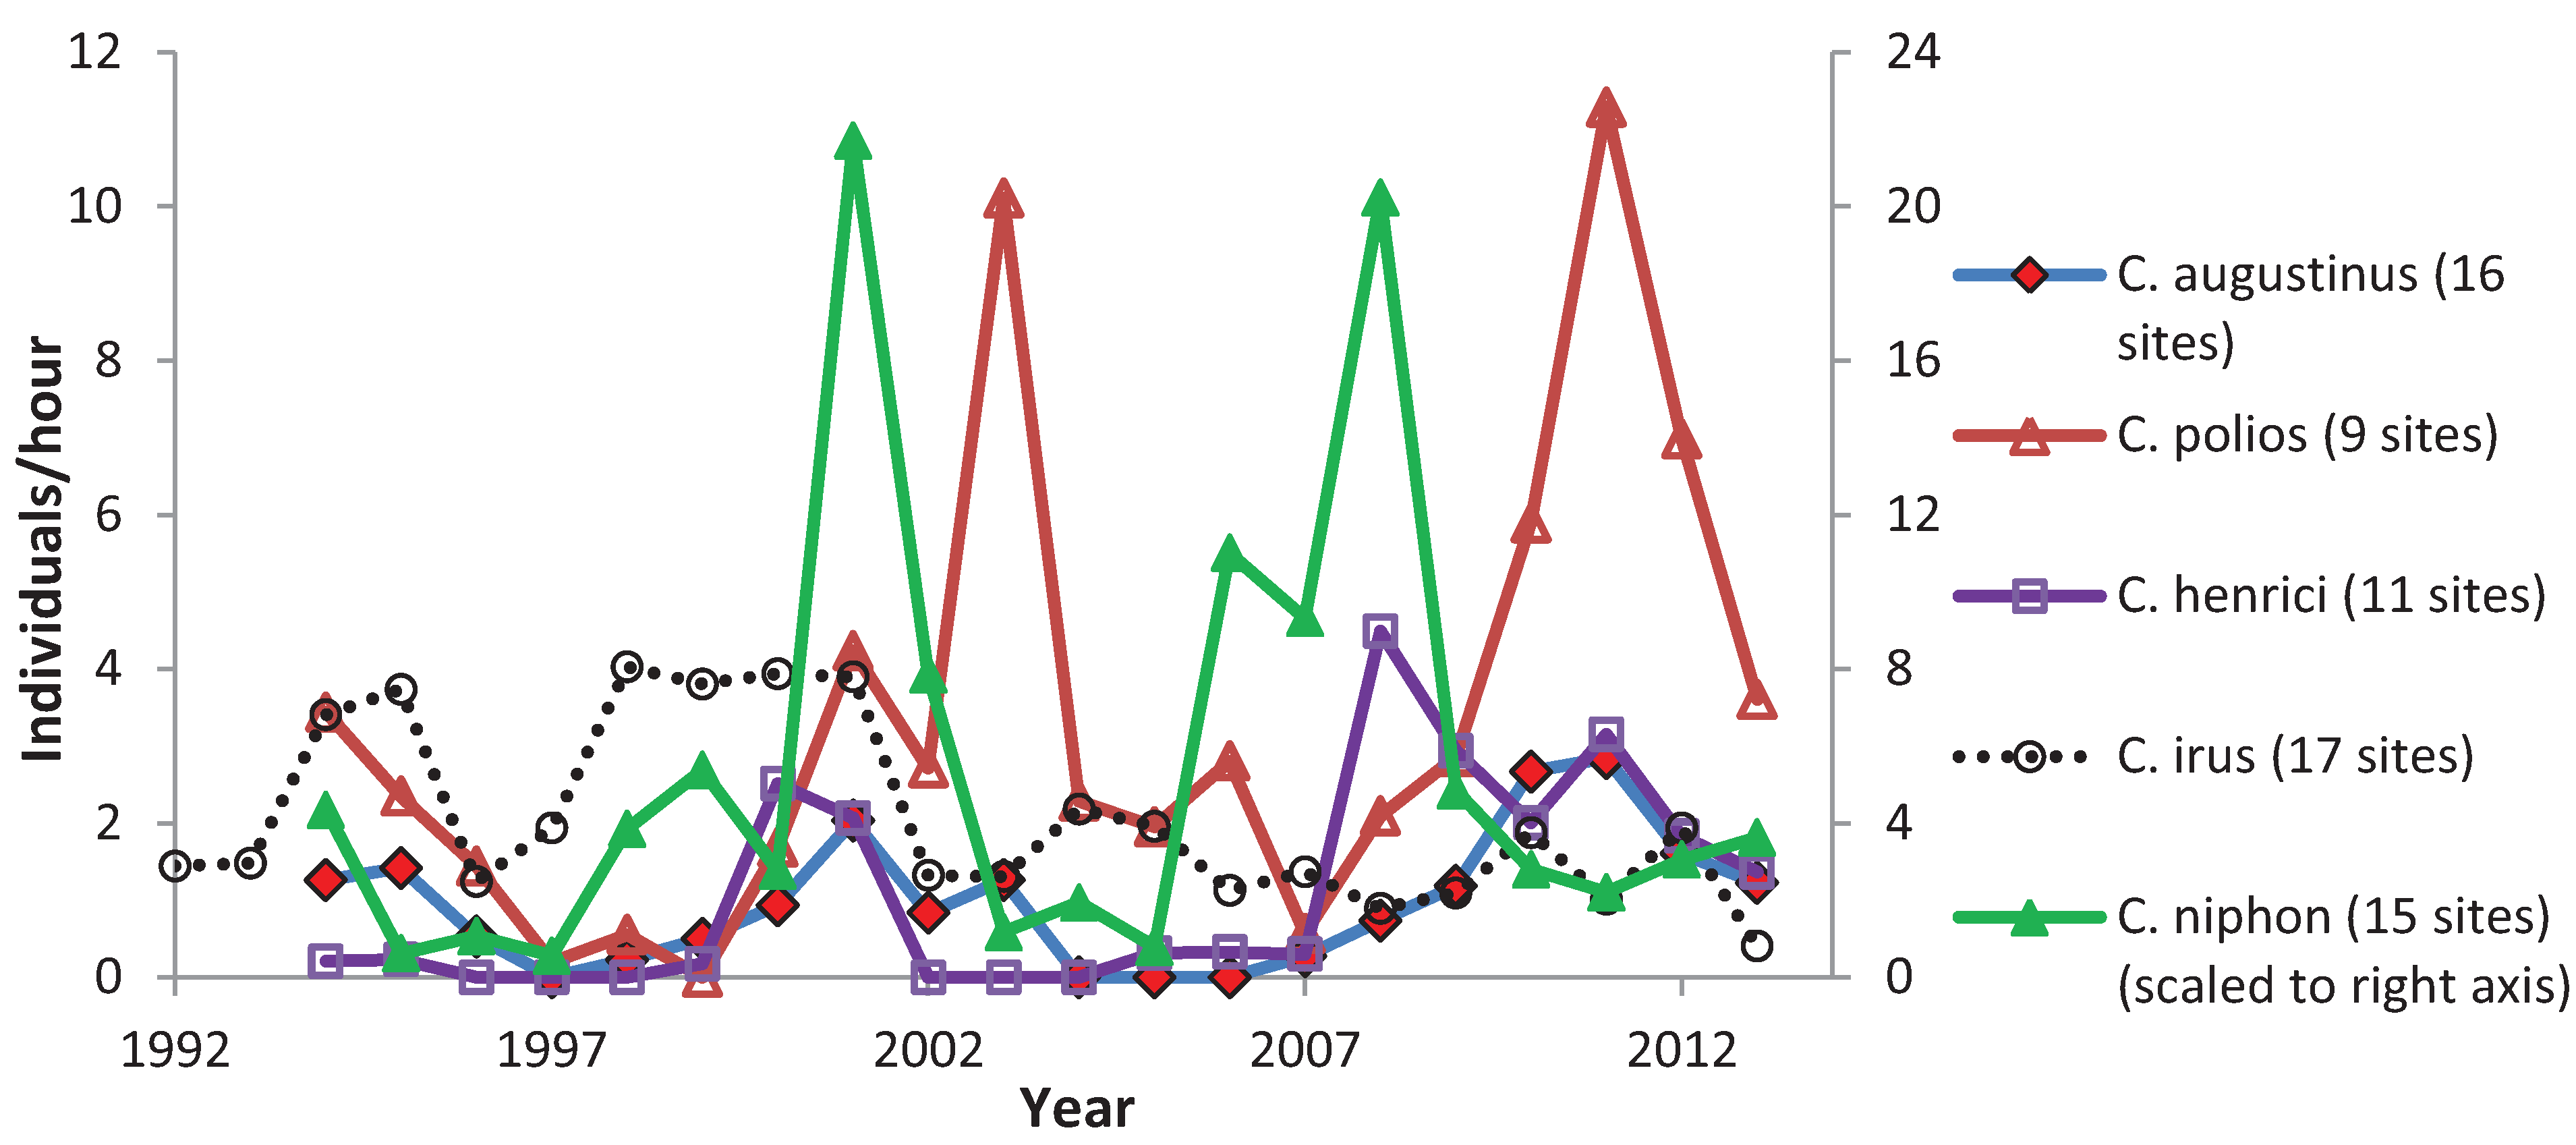
| Species 1 | Sites | Individuals | Likely host plant in Wisconsin |
|---|---|---|---|
| G Brown elfin Callophrys augustinus | 16 | 111 | heaths (Ericaceae) |
| S Hoary elfin Callophrys polios | 9 | 185 | bearberry Arctostaphylos uva-ursi |
| G Eastern pine elfin Callophrys niphon | 15 | 633 | pines Pinus |
| S Henry’s elfin Callophrys henrici | 11 | 63 | blueberries Vaccinium |
| S Frosted elfin Callophrys irus | 17 | 286 | wild lupine Lupinus perennis |
| County, site | Type 1 | Latitude | Longitude | Route Length (km) | Years found 2 | ||||
|---|---|---|---|---|---|---|---|---|---|
| Jackson County | |||||||||
| Bauer 2 | SM | 44.30 | 90.75 | 0.60 | 3 | 7 | 11 | 1 | 13 |
| Bauer 3 | SM | 44.30 | 90.75 | 0.60 | 2 | 4 | 11 | 1 | 13 |
| Brockway 1 | R | 44.30 | 90.743 | 1.00 | 8 | 11 | 11 | 5 | 18 |
| Dike 17 3 | R | 44.31 | 90.564 | 1.45 | 6 | 5 | 13 | 1 | 2 |
| North Brockway E 3 | SM | 44.32 | 90.73 | 0.55 | 15 | 17 | 13 | 8 | 12 |
| S Brockway W 1 3 | R | 44.281 | 90.742 | 0.30 | 1 | 2 | 13 | 2 | 12 |
| S Brockway W 4 3 | R | 44.283 | 90.744 | 0.40 | 1 | 5 | 15 | 7 | 16 |
| Stanton Road Main 3 | PH | 44.23 | 90.65 | 1.70 | 7 | 0 | 19 | 1 | 4 |
| West Castle Mound 2 3 | SM | 44.273 | 90.764 | 0.40 | 0 | 3 | 4 | 0 | 8 |
| West Castle Mound 4 3 | SM | 44.273 | 90.766 | 0.90 | 0 | 0 | 2 | 0 | 8 |
| West Castle Mound 5 | PH | 44.275 | 90.765 | 0.40 | 1 | 0 | 0 | 0 | 2 |
| Wildcat-Spangler NE 3 | SM | 44.2782 | 90.678 | 0.85 | 2 | 0 | 6 | 0 | 3 |
| Wildcat-Spangler SE | SM | 44.278 | 90.678 | 0.40 | 1 | 0 | 5 | 0 | 4 |
| Wood County | |||||||||
| Highway X N-S 3 | PH | 44.34 | 90.13 | 1.60 | 8 | 7 | 13 | 1 | 16 |
| Highway X E-W | PH | 44.30 | 90.13 | 1.00 | 1 | 0 | 14 | 0 | 0 |
| Highway X S | PH | 44.32 | 90.13 | 0.45 | 1 | 0 | 7 | 3 | 7 |
| Sandhill 2 | R | 44.33 | 90.13 | 0.30 | 0 | 0 | 0 | 0 | 3 |
| Sandhill 3 | R | 44.33 | 90.15 | 0.30 | 1 | 0 | 0 | 0 | 1 |
| Sandhill 7 | R | 44.33 | 90.20 | 0.65 | 3 | 0 | 0 | 6 | 0 |
2.2. Analysis
3. Results
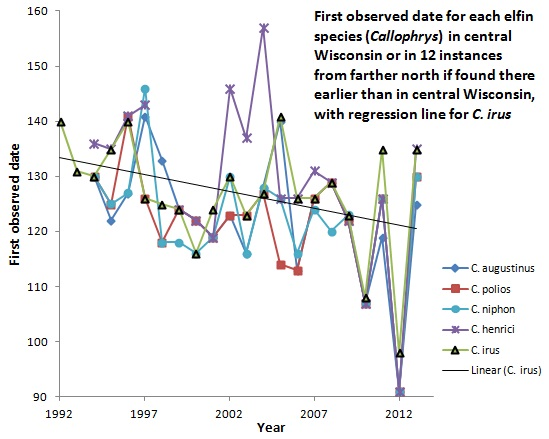
3.1. First Observed Date (FOD)
| Species | Central Wisconsin only | All data, including further north | ||
|---|---|---|---|---|
| N | r | N | r | |
| C. augustinus | 19 | −0.4327 | 20 | −0.4369 (p < 0.06) |
| C. polios | 20 | −0.1358 | 20 | −0.2495 |
| C. niphon | 20 | −0.2264 | 20 | −0.2679 |
| C. henrici | 15 | −0.4076 | 19 | −0.4222 (p < 0.07) |
| C. irus (1992–2013) | 22 | −0.31115 | -- | |
| 1994–2013 | 20 | −0.1872 | -- | |
| Species | N | r |
|---|---|---|
| C. augustinus | 19 | +0.0026 |
| C. polios | 20 | +0.0340 |
| C. niphon | 20 | −0.0768 |
| C. henrici | 15 | +0.1864 |
| C. irus | 22 | −0.1607 |
| Species | First observed date, Central Wisconsin only | All data, including further north | ||
|---|---|---|---|---|
| N | r | N | r | |
| C. augustinus | 19 | −0.7600 ** | 20 | −0.6145 ** |
| C. polios | 20 | −0.2169 | 20 | −0.2497 |
| C. niphon | 20 | −0.4703 | 20 | −0.7237 ** |
| C. henrici | 15 | −0.4548 * | 19 | −0.4960 * |
| C. irus (1992–2013) | 22 | −0.6507 ** | -- | |
| 1994–2013 | 20 | −0.5985 ** | -- | |
| Species | First observed date central Wisconsin only | All data, including further north | ||
|---|---|---|---|---|
| N | r | N | r | |
| C. augustinus | 19 | +0.5457 * | 20 | +0.5269 * |
| C. polios | 20 | +0.7753 *** | 20 | +0.5980 ** |
| C. niphon | 20 | +0.7564 *** | 20 | +0.7529 *** |
| C. henrici | 15 | +0.8105 ** | 19 | +0.5617 * |
| Species | First observed date, central Wisconsin only | All data for date, including further north | ||
|---|---|---|---|---|
| N | r | N | r | |
| C. augustinus | 17 | +0.3106 | 19 | +0.4875 * |
| C. polios | 19 | +0.1936 | 19 | +0.3357 |
| C. niphon | 19 | +0.3322 | 19 | +0.4187 + |
| C. henrici | 12 | +0.8056 ** | 17 | +0.5479 * |
| C. irus 1992–2013 | 21 | +0.4795 * | 21 | +0.4795 * |
| Species | Spring temperature, west central | Spring temperature, central | ||||||
|---|---|---|---|---|---|---|---|---|
| FOD central | FOD all | FOD central | FOD all | |||||
| N | r | N | r | N | r | N | r | |
| C. augustinus | 16 | −0.0458 | 18 | −0.1274 | 16 | −0.0739 | 18 | −0.1668 |
| C. polios | 18 | −0.4758 * | 18 | −0.4956 * | 18 | −0.5565 * | 18 | −0.5953 ** |
| C. henrici | 13 | −0.5125 + | 17 | −0.5354 * | 13 | −0.6455 * | 17 | −0.6373 ** |
| C. niphon | 18 | −0.5539 * | 18 | −0.6047 ** | 18 | −0.5899 * | 18 | −0.6594 ** |
| C. irus | 20 | −0.6147 ** | -- | 20 | −0.6584 ** | -- | ||
| Species | FOD, central only | FOD, all data including farther north | ||
|---|---|---|---|---|
| N | r | N | r | |
| Current year abundance | ||||
| C. augustinus (all) | 288 | −0.1984 ** | 320 | −0.1795 ** |
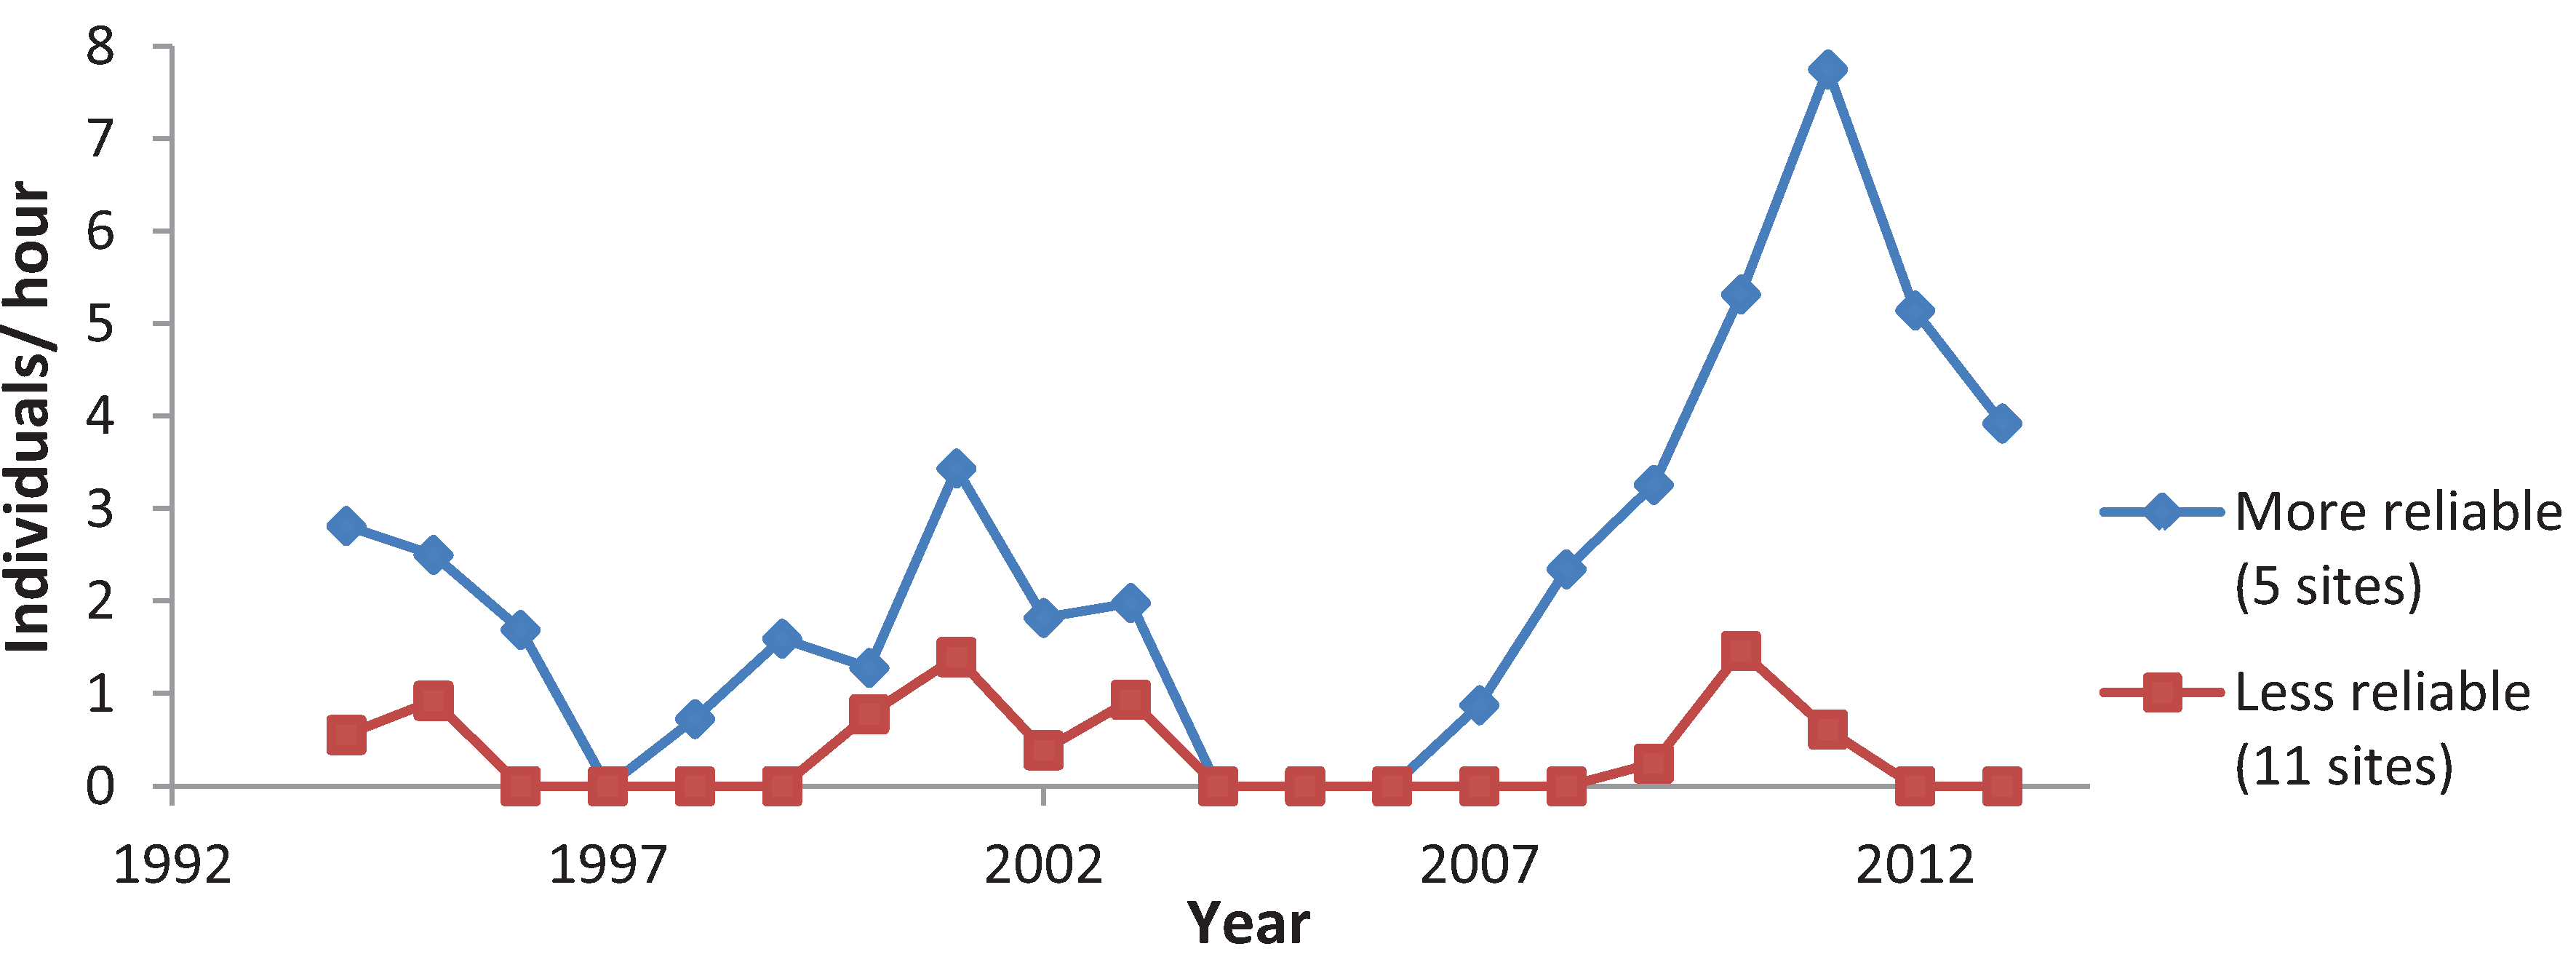
| more reliable sites 1 | 90 | −0.3284 ** | 100 | −0.2956 ** |
| less reliable sites 2 | 198 | −0.1616 ** | 220 | −0.1425 * |
| C. polios | 180 | −0.0765 | 180 | −0.0447 |
| C. niphon | 300 | −0.0669 | 300 | −0.1159 ** |
| C. henrici | 165 | −0.1641 * | 209 | −0.2760 *** |
| C. irus (all) | 358 | −0.0671 | NA | |
| extant sites 3 | 170 | −0.2251 ** | NA | |
| extant years 4 | 251 | −0.1908 ** | NA | |
| Next year’s abundance | ||||
| C. augustinus (all) | 272 | −0.1012 | 304 | −0.1334 |
| more reliable sites 1 | 85 | −0.2368 * | 95 | −0.2469 * |
| less reliable sites 2 | 187 | −0.0432 | 209 | −0.0431 |
| C. polios | 171 | −0.1909 * | 171 | −0.1187 |
| C. niphon | 285 | −0.1805 ** | 285 | −0.1933 ** |
| C. henrici | 154 | −0.0526 | 198 | −0.1830 ** |
| C. irus (all) | 341 | +0.0299 | NA | |
| extant sites 3 | 162 | −0.0692 | NA | |
| extant years 4 | 243 | −0.0714 | NA | |
| Species | N | r |
|---|---|---|
| C. augustinus | 20 | +0.8955 *** |
| C. polios | 20 | +0.7896 *** |
| C. henrici | 20 | +0.9125 *** |
| C. niphon | 20 | +0.6049 ** |
| C. irus 1992–2013 | 22 | +0.5241 * |
| 1994–2013 | 20 | +0.4642 * |
3.2. Climate and Elfin Abundance
3.3. Variation among Years
| Species | Current year abundance | Next year’s abundance | ||||||
|---|---|---|---|---|---|---|---|---|
| Winter | Winter | Spring | FOD | Spring | Summer | Growing Season | Year | FOD |
| C. augustinus (all) | Cool | earlier | warm | wet | wet | wet | ||
| flood | flood | |||||||
| more reliable 1 | Cool | earlier | wet | wet | wet | earlier | ||
| flood | flood | |||||||
| less reliable 2 | <snow | earlier | wet | wet | ||||
| C. polios | flood | wet | earlier | |||||
| flood | ||||||||
| C. niphon | wet | earlier | warm | warm | warm | earlier | ||
| flood | flood | |||||||
| C. henrici | earlier | warm | flood | earlier | ||||
| Flood | dry | |||||||
| C. irus (all) | warm | |||||||
| extant sites 3 | <snow | warm | earlier | |||||
| extant years 4 | <snow | warm | earlier | |||||
| Species 1 | Reserves | Permanency of Habitat | Shifting Mosaic | All sites | |||||
|---|---|---|---|---|---|---|---|---|---|
| N | r | N | r | N | r | N | R | ||
| N | C. augustinus | 120 | −0.0070 | 100 | +0.0826 | 100 | +0.0436 | 320 | +0.0326 |
| N | C. polios | 80 | +0.2160 + | 20 | +0.1782 | 80 | +0.1315 | 180 | +0.1706 * |
| S | C. niphon | 80 | +0.2310 * | 80 | −0.0184 | 140 | +0.0929 | 300 | +0.0923 |
| S | C. henrici | 100 | +0.3306 ** | 60 | +0.1022 | 60 | +0.2686 * | 220 | +0.2590 *** |
| S | C. irus all | 126 | −0.0534 | 84 | −0.4903 *** | 148 | −0.2002 * | 358 | −0.2056 *** |
| 1994–2013 | 120 | −0.1057 | 80 | −0.4822 *** | 140 | −0.2419 ** | 340 | −0.2413 *** | |


4. Discussion
4.1. First Observed Date (FOD)
4.2. Climate and Elfin Abundance
4.3. Variation among Years
5. Conclusions
Acknowledgments
Author Contributions
Conflicts of Interest
References
- Dennis, R.L.H. Butterflies and Climate Change; Manchester University Press: Manchester, UK/New York, NY, USA, 1993. [Google Scholar]
- Pollard, E.; Yates, T.J. Monitoring Butterflies for Ecology and Conservation; Chapman & Hall: London, UK, 1993. [Google Scholar]
- Thomas, J.A.; Simcox, D.J.; Hovestadt, T. Evidence based conservation of butterflies. J. Insect Conservat. 2011, 15, 241–258. [Google Scholar] [CrossRef]
- Thomas, C.D.; Wilson, R.J.; Lewis, O.T. Short-term studies underestimate 30-generation changes in a butterfly metapopulation. Proc. Royal Soc. London B 2002, 269, 563–569. [Google Scholar] [CrossRef] [Green Version]
- Bureau of Endangered Resources. The Endangered and Threatened Invertebrates of Wisconsin; Wisconsin Department of Natural Resources: Madison, WI, USA, 1999.
- Nielsen, M.C. Michigan Butterflies and Skippers; Michigan State University Extension: East Lansing, MI, USA, 1999. [Google Scholar]
- Shepherd, M.D. Species profile: Callophrys irus. Red List of Pollinator Insects in North America, CD-ROM Version 1; Shepherd, M.D., Vaughan, D.M., Black, S.H., Eds.; The Xerces Society for Invertebrate Conservation: Portland, OR, USA. Available online: http://www.xerces.org/frosted-elfin/ (accessed on 6 February 2014).
- Albanese, G.; Vickery, P.D.; Sievert, P.R. Habitat characteristics of adult frosted elfins (Callophrys irus) in sandplain communities of southeastern Massachusetts, USA. Biol. Conservat. 2007, 136, 53–64. [Google Scholar] [CrossRef]
- Albanese, G.; Vickery, P.D.; Sievert, P.R. Microhabitat use by larvae and females of a rare barrens butterfly, frosted elfin (Callophrys irus). J. Insect Conservat. 2008, 12, 603–615. [Google Scholar] [CrossRef]
- Pfitsch, W.A.; Williams, E.H. Habitat restoration for lupine and specialist butterflies. Restor. Ecol. 2009, 17, 226–233. [Google Scholar] [CrossRef]
- Weking, S.; Hermann, G.; Fartmann, T. Effects of mire type, land use and climate on a strongly declining wetland butterfly. J. Insect Conservat. 2013, 17, 1081–1091. [Google Scholar] [CrossRef]
- Rare, Declining, and Poorly Known Butterflies and Poorly Known Butterflies and Moths (Lepidoptera) of Forests and Woodlands in the Eastern United States; Schweitzer, D.F.; Minno, M.C.; Wagner, D.L. (Eds.) USDA Forest Service: Washington, DC, USA, 2011.
- Bried, J.T.; Muztagh, J.E.; Dillon, A.M. Local distribution factors and sampling effort guidelines for the rare frosted elfin butterfly. Northeast. Nat. 2012, 19, 673–684. [Google Scholar] [CrossRef]
- Pollard, E. A method for assessing changes in abundance of butterflies. Biol. Conservat. 1977, 12, 115–133. [Google Scholar] [CrossRef]
- Swengel, A.B. Observations of Incisalia irus (Lepidoptera: Lycaenidae) in central Wisconsin 1988–95. Great Lakes Entomol. 1996, 29, 47–62. [Google Scholar]
- Swengel, A.B. Effects of management on butterfly abundance in tallgrass prairie and pine barrens. Biol. Conservat. 1998, 83, 77–89. [Google Scholar] [CrossRef]
- Swengel, A.B.; Swengel, S.R. Co-occurrence of prairie and barrens butterflies: Applications to ecosystem conservation. J. Insect Conservat. 1997, 1, 131–144. [Google Scholar] [CrossRef]
- Swengel, A.B.; Swengel, S.R. Variation in timing and abundance of elfins (Callophrys) (Lepidoptera: Lycaenidae) in Wisconsin during 1987–1999. Great Lakes Entomol. 2000, 33, 45–68. [Google Scholar]
- Swengel, S.R.; Schlicht, D.; Olsen, F.; Swengel, A.B. Declines of prairie butterflies in the midwestern USA. J. Insect Conservat. 2011, 15, 327–330. [Google Scholar] [CrossRef]
- Opler, P.A.; Krizek, G.O. Butterflies East of the Great Plains; Johns Hopkins University Press: Baltimore, MD, USA, 1984. [Google Scholar]
- Scott, J.A. The Butterflies of North America; Stanford University Press: Stanford, CA, USA, 1986. [Google Scholar]
- Glassberg, J. Butterflies through Binoculars: The East; Oxford University Press: New York, NY, USA, 1999. [Google Scholar]
- Balogh, G. Wisconsin’s lupine feeding butterflies and their pine barrens habitat. Newsltr. Wisconsin Entomol. Soc. 1980, 8, 4–8. [Google Scholar]
- Curtis, J.T. The vegetation of Wisconsin; University of Wisconsin Press: Madison, WI, USA, 1959. [Google Scholar]
- Swengel, A.B.; Swengel, S.R. Long-term population monitoring of the Karner Blue (Lepidoptera: Lycaenidae) in Wisconsin, 1990–2004. Great Lakes Entomol. 2005, 38, 107–134. [Google Scholar]
- U.S. Fish & Wildlife Service. Karner Blue Recovery Plan (Lycaeides melissa samuelis); Department of the Interior: Fort Snelling, MN, USA, 2003.
- Shapiro, A.M. Partitioning of resources among lupine-feeding Lepidoptera. Am. Midl. Nat. 1974, 91, 243–248. [Google Scholar] [CrossRef]
- Thomas, J.A. A quick method for estimating butterfly numbers during surveys. Biol. Conservat. 1983, 27, 195–211. [Google Scholar] [CrossRef]
- Schlicht, D.W.; Swengel, A.B.; Swengel, S.R. Meta-analysis of survey data to assess trends of prairie butterflies in Minnesota, USA during 1979–2005. J. Insect Conservat. 2009, 13, 429–447. [Google Scholar] [CrossRef]
- ABstat User Manual; Version 7.20; Anderson–Bell Corp.: Parker, CO, USA, 1994.
- Wisconsin State Climate Office. Statewide and Divisional Data. Available online: http://www.aos.wisc.edu/~sco/clim-history/data-portal.html/ (accessed on 1 October 2013).
- Sparks, T.H.; Carey, P.D. The responses of species to climate over two centuries: An analysis of the Marsham phenological record, 1736–1947. J. Ecol. 1995, 83, 321–329. [Google Scholar] [CrossRef]
- Sparks, T.H.; Yates, T.J. The effect of spring temperature on the appearance dates of British butterflies 1883–1993. Ecography 1997, 20, 368–374. [Google Scholar] [CrossRef]
- Forister, M.L.; Shapiro, A.M. Climatic trends and advancing spring flight of butterflies in lowland California. Glob. Clim. Change 2003, 9, 1130–1135. [Google Scholar] [CrossRef]
- Polgar, C.A.; Primack, R.B.; Williams, E.H.; Stichter, S.; Hitchcock, C. Climate effects on the flight period of Lycaenid butterflies in Massachusetts. Biol. Conserv. 2013, 160, 25–31. [Google Scholar] [CrossRef]
- Bradley, N.L.; Leopold, A.C.; Ross, J.; Huffaker, W. Phenological changes reflect climate change in Wisconsin. Proc. Natl. Acad. Sci. USA 1999, 96, 9701–9704. [Google Scholar] [CrossRef]
- Diamond, S.E.; Frame, A.M.; Martin, R.A.; Buckley, L.B. Species’ traits predict phenological responses to climate change in butterflies. Ecology 2011, 92, 1005–1012. [Google Scholar] [CrossRef]
- National Oceanic and Atmospheric Administration. 2012 Wisconsin yearly weather summary. Available online: http://www.crh.noaa.gov/images/mkx/climate/2012/2012_WI_Yrly_Wx_Summary.pdf (accessed on 19 March 2014).
- Reese, M. Wisconsin butterflies—Early sightings. Available online: http://wisconsinbutterflies.org/butterfly/sightings/early/2012/ (accessed on 18 March 2014).
- Van Strien, A.J.; Plantenga, W.F.; Soldaat, L.L.; van Swaay, C.A.M.; WallisDeVries, M.F. Bias in phenology assessments based on first appearance data of butterflies. Oecologia 2008, 156, 227–235. [Google Scholar] [CrossRef]
- Pollard, E. Temperature, rainfall and butterfly numbers. J. Appl. Ecol. 1988, 25, 819–828. [Google Scholar] [CrossRef]
- Roy, D.B.; Rothery, P.; Moss, D.; Pollard, E.; Thomas, J.A. Butterfly numbers and weather: Predicting historical trends in abundance and the future effects of climate change. J. Anim. Ecol. 2001, 70, 201–217. [Google Scholar] [CrossRef]
- Warren, M.S.; Hill, J.K.; Thomas, J.A.; Asher, J.; Fox, R.; Huntley, B.; Roy, D.B.; Telfer, M.G.; Jeffcoate, S.; Harding, P.; et al. Rapid responses of British butterflies to opposing forces of climate and habitat change. Nature 2001, 414, 65–69. [Google Scholar]
- Breed, G.A.; Stichter, S.; Crone, E. Climate-driven changes in northeastern US butterfly communities. Nat. Clim. Change 2013, 3, 142–145. [Google Scholar]
- Transeau, E.N. The prairie peninsula. Ecology 1935, 16, 423–437. [Google Scholar] [CrossRef]
- Franzén, M.; Öckinger, E. Climate-driven changes in pollinator assemblages during the last 60 years in an Arctic mountain region in northern Scandinavia. J. Insect Conservat. 2012, 16, 227–238. [Google Scholar]
- Parmesan, C. Climate and species’ range. Nature 1996, 382, 765–767. [Google Scholar] [CrossRef]
- Forister, M.L.; McCall, A.C.; Sanders, N.J.; Fordyce, J.A.; Thorne, J.H.; O'Brien, J.; Waite, D.P.; Shapiro, A.M. Compounded effects of climate change and habitat alteration shift patterns of butterfly diversity. Proc Nat. Acad. Sci. USA 2010, 107, 2088–2092. [Google Scholar] [CrossRef]
- Mauquoy, D.; Yeloff, D. Raised peat bog development and possible responses to environmental changes during the mid- to late-Holocene. Can the palaeoecological record be used to predict the nature and response of raised peat bogs to future climate change? Biodiv. Conservat. 2008, 17, 2139–2151. [Google Scholar]
- Cormont, A.; Malinowska, A.H.; Kostenko, O.; Radchuk, V.; Hemerik, L.; WallisDeVries, M.F.; Verboom, J. Effect of local weather on butterfly flight behaviour, movement, and colonization: significance for dispersal under climate change. Biodiv. Conservat. 2011, 20, 483–503. [Google Scholar] [CrossRef]
- Cormont, A.; Jochem, R.; Malinowska, A.; Verboom, J.; WallisDeVries, M.F. Can phenological shifts compensate for adverse effects of climate change on butterfly metapopulations? Ecol. Model. 2012, 227, 72–81. [Google Scholar] [CrossRef]
- Williams, E.H. Managing habitat for lupines and rare butterflies. News Lepid. Soc. 2009, 51, 64–65. [Google Scholar]
- Menéndez, R.; González-Megías, A.; Hill, J.K.; Braschler, B.; Willis, S.G.; Collingham, Y.; Fox, R.; Roy, D.B.; Thomas, C.D. Species richness changes lag behind climate change. Proc. R. Soc. B 2006, 273, 1465–1470. [Google Scholar] [CrossRef]
- Thomas, C.D.; Gillingham, P.K.; Bradbury, R.B.; Roy, D.B.; Anderson, B.J.; Baxter, J.M.; Bourn, N.A.; Crick, H.Q.; Findon, R.A.; Fox, R.; et al. Protected areas facilitate species’ range expansions. Proc. Natl. Acad. Sci. USA 2012, 109, 14063–14068. [Google Scholar]
Appendix
| Species and climatic factor | Current year abundance | Next year’s abundance | ||
|---|---|---|---|---|
| C. augustinus all sites | ||||
| Winter temperature | 272 | −0.1513 * | ||
| Spring temperature | 288 | +0.1271 * | ||
| Summer Palmer | 272 | +0.1436 * | ||
| Summer precipitation | 288 | +0.2267 *** | ||
| Growing season Palmer | 272 | +0.1619 * | ||
| Growing season precipitation | 288 | +0.2033 *** | ||
| Annual precipitation | 288 | +0.1565 * | ||
| C. augustinus more reliable sites | ||||
| Winter temperature | 85 | −0.2346 * | ||
| Summer Palmer | 85 | +0.2220 * | ||
| Summer precipitation | 90 | +0.3430 ** | ||
| Growing season Palmer | 90 | +0.2224 * | ||
| Growing season precipitation | 90 | +0.2748 ** | ||
| Annual precipitation | 90 | +0.2167 * | ||
| C. augustinus less reliable sites | ||||
| Season-long snowfall | 187 | −0.1500 * | ||
| Summer precipitation | 198 | +0.1675 * | ||
| Growing season precipitation | 198 | +0.1653 * | ||
| C. polios | ||||
| Summer Palmer | 153 | +0.1853 * | ||
| Growing season Palmer | 153 | +0.1724 * | ||
| Growing season precipitation | 162 | +0.2010 * | ||
| C. henrici | ||||
| Winter Palmer | 176 | +0.1616 * | ||
| Spring Palmer | 187 | −0.1808 * | ||
| Spring temperature | 198 | +0.2086 ** | ||
| C. niphon | ||||
| Spring Palmer | 255 | +0.1836 ** | ||
| Spring precipitation | 270 | +0.2129 ** | ||
| Spring temperature | 270 | +0.2298 *** | ||
| Growing season temperature | 270 | +0.2361 *** | ||
| Annual temperature | 270 | +0.2123 *** | ||
| Annual Palmer | 240 | +0.1426 * | ||
| C. irus all | ||||
| Spring temperature | 324 | +0.1183 * | ||
| C. irus extant sites | ||||
| Season-long snowfall | 146 | −0.1949 * | ||
| Spring temperature | 154 | +0.2148 ** | ||
| C. irus extant years | ||||
| Season-long snowfall | 227 | −0.1820 ** | ||
| Spring temperature | 235 | +0.2030 ** | ||
© 2014 by the authors; licensee MDPI, Basel, Switzerland. This article is an open access article distributed under the terms and conditions of the Creative Commons Attribution license (http://creativecommons.org/licenses/by/3.0/).
Share and Cite
Swengel, A.B.; Swengel, S.R. Twenty Years of Elfin Enumeration: Abundance Patterns of Five Species of Callophrys (Lycaenidae) in Central Wisconsin, USA. Insects 2014, 5, 332-350. https://doi.org/10.3390/insects5020332
Swengel AB, Swengel SR. Twenty Years of Elfin Enumeration: Abundance Patterns of Five Species of Callophrys (Lycaenidae) in Central Wisconsin, USA. Insects. 2014; 5(2):332-350. https://doi.org/10.3390/insects5020332
Chicago/Turabian StyleSwengel, Ann B., and Scott R. Swengel. 2014. "Twenty Years of Elfin Enumeration: Abundance Patterns of Five Species of Callophrys (Lycaenidae) in Central Wisconsin, USA" Insects 5, no. 2: 332-350. https://doi.org/10.3390/insects5020332
APA StyleSwengel, A. B., & Swengel, S. R. (2014). Twenty Years of Elfin Enumeration: Abundance Patterns of Five Species of Callophrys (Lycaenidae) in Central Wisconsin, USA. Insects, 5(2), 332-350. https://doi.org/10.3390/insects5020332