Effect of Plastic Deformation and Damage Development during Friction of fcc Metals in the Conditions of Boundary Lubrication


Department of Science, Holon Institute of Technology, 52 Golomb St., P.O. Box 305, Holon 5810201, Israel
*
Author to whom correspondence should be addressed.
Lubricants 2019, 7(5), 45; https://doi.org/10.3390/lubricants7050045
Submission received: 8 March 2019
/
Revised: 29 April 2019
/
Accepted: 20 May 2019
/
Published: 23 May 2019
(This article belongs to the Special Issue Friction Mechanisms)
Abstract
:The main goal of the presented work was the analysis of the interaction between deformed microstructures and friction and the wear properties of four face centered cubic (fcc) metals. Pure fcc metals such as Ag, Cu, Ni, and Al with different values of stacking fault energy (SFE) were chosen for pin-on-disk tests in lubricated conditions. Friction properties of the four fcc metals are presented herein as their Stribeck curves. The transition from elasto-hydrodynamic lubrication (EHL) to boundary lubrication (BL) regions depends mainly on the values of SFE, hardness, and contact temperature. The acoustic emission (AE) parameters were analyzed in the transition from the EHL to the BL region. The models of friction in different lubricant conditions related to the AE waveforms were proposed. The nanocrystalline top surface layers characterized the deformed structure during friction of Ag in the BL region. The lamellar cross-sectional microstructure was formed in the subsurface layers of Ag, Cu, and Ni in the friction direction. Steady state friction and wear in the BL conditions were explained by a balance between the hardening and the dynamic recovery, which was strongly dependent on the SFE and the temperature. The interaction between the deformed structure, the friction, and the wear properties of the studied metals rubbed in the BL region is discussed herein.
1. Introduction
Friction and wear processes are very complex phenomena based on the deep understanding of multidisciplinary and multiscale effects of contact interaction, plastic deformation, and damage development in different environmental conditions. If theoretical and experimental models of asperity contact are widely studied, the number of publications concerning the effect of plastic deformation and damage development during friction is limited. Excellent analysis of modeling and simulation in tribology was recently presented in the review from [1], where different models based on the contact mechanics were carefully discussed, as was the importance of developing new models with consideration to the dislocation dynamic during friction. The authors conclude that, “Tribologists still need to identify key elementary processes specific to rough contacts under shear, and associated, for example, to crack nucleation and propagation, chemical reactions, or fluid-solid interactions.” The dislocation structure of surface layers under dry friction was originally studied by Rigney with colleagues [2,3,4,5] and Garbar [6,7]. A strong gradient of grain sizes with depth and formation of nanocrystalline structure was observed in the surface layers. The mechanisms of plastic deformation during friction were considered by Kulhmann-Wilsdorf [8]. A plateau range of high-deformed layers was reached at the end of the running-in process of steel and was preserved in the steady friction state. [9] The structure of the high-deformed layers of the top surface layers during friction and wear was close to the severe plastic deformation (SPD) obtained during different processes of refinement [10,11,12,13,14,15,16,17], including fatigue and cyclic creep [18,19,20].
The dislocation dynamic in surface layers during friction was simulated [21,22,23,24]. Application of preliminary hardening by grain refinement before the friction tests significantly improved the tribological properties of rubbed surfaces [25,26,27,28,29,30]. Different SPD methods of refinement provided the formation of ultrafine grained (UFG) and nanocrystalline (NC) structure (d = 100–200 nm) with relatively high strength [31,32,33,34,35,36,37,38,39,40,41,42]. It was shown that the shear stresses during fatigue were increased up to the maximum value, and then a plateau range was clearly exhibited in the high-deformed layers. Since the contact stress was cyclically varied in the contact spots, the fatigue models of friction were proposed [43,44,45]. Unfortunately, these models did not reflect the real contact conditions—the interrelation between the structural and the geometrical parameters of contact. Different friction models were developed in order to evaluate the transitions from one contact region to another. The critical points of transition from elastic to plastic contact were proposed according to a critical number of cycles [46,47,48,49,50,51,52,53,54,55]. The problems in the application of the mechanical properties of contact materials in the evaluation of critical deformation during friction under different contact conditions were considered [56]. It was shown that the asperity contacts models could not take into account the structural variations and the damage development in thin surface layers. The interaction between contact parameters, deformation, and temperature was proposed by Lim and Ashby as the wear maps [57,58], where different mechanisms of friction and wear were considered as the wear modes [59,60]. Furthermore, various wear maps for different contact materials were considered. In order to evaluate the application of the wear modes for real contact pairs, friction and wear experiments for steel using Lim’s and Ashby’s map were performed [61]. Unfortunately, the results of friction and wear tests of steel were not confirmed. It was clear that such complex phenomena as the interaction of rubbed bodies, especially in lubricated conditions, could not be described by the simple parameters used in these wear maps.
If the critical points of transition from elastic to plastic contact are mainly determined by mechanical properties, pressure, and temperature of contact surfaces in dry friction, the transitions in lubricated conditions are usually related to mechanical properties, contact pressure, asperity distribution, and thickness of lubricant film. The effect of surface roughness on the transition between mixed lubrication (ML) and elastohydrodynamic lubrication (EHL) were simulated [62,63]. A statistical description was requested for the description of multi-scale texture. A mathematical model containing the Reynolds equation, the particle load carrying equation, the asperity contact equation, and the heat balance equation was constructed for simulation of the mixed liquid–solid lubrication [64]. A thermal model of mixed lubrication in point contacts was proposed and used to study the roughness effect [65,66].
An algorithm based on the load-sharing concept was proposed, which assumed that the total transmitted load was carried by the asperities as well as the fluid film [67]. Interestingly, many existing models and simulations are related to the transition from EHL to ML conditions only, whereas there are few descriptions of the transition from ML to boundary lubrication (BL). It is reasonably clear that the transition to the ML region is mainly determined by the contact pressure, the roughness parameters, and the thickness of lubricant film when the number of direct contact spots is limited. However, when the number of direct contact spots is significantly increased in the transition to the BL region, the roles of the mechanical properties, the deformed microstructure, and the damage development increase dramatically. The analysis of friction and wear in the BL region associated with the effects of asperity interaction, tribochemistry, thickness of lubricant film, and mechanical properties of real contact spots is a very complex problem. Nowadays, the problems of contact interaction and the structural state of surface layers during friction with wear are considered separately.
The object of the presented work was to analyze the effects of the deformed structure, the hardening, and the damage development on the friction and wear properties of some four face centered cubic (fcc) metals with different stacking fault energy (SFE) values. The simplistic model of deformation and damage development of contact surfaces was based on the request that deformation and damage development occurred mainly in the soft body. Since the roughness parameters play an important role in the formation of contact surfaces, the smooth surface of a hard counterbody was used. In order to diminish adhesion and tribochemistry due to additives in oils, the lubricated conditions with base oil were used. Likewise, the tribochemistry/mixing and a third body’s effects on the damage development in the BL region were not considered in these experiments. These assumptions were based on our previous experiments, where the friction and the wear of copper rubbed in a wide range of loads and sliding velocities were studied [29,68,69]. The results of friction and wear experiments in PAO-4 lubricant are presented herein as the Stribeck curve where the boundary, the mixed, and the EHL were considered. Friction of Cu in lubricated conditions was characterized by the formation of layered lamellar structures in the direction of friction. The hardness of thin surface layers was saturated during repeated sliding.
Recently, the effect of grain refinement by equal channel angular pressing (ECAP) and the structural evolution of Cu subsurface layers on friction and wear were evaluated [29]. It was shown that the transitions from one lubricant region to another depend on the virgin grain size. The smaller the grain size of Cu is, the more severe the condition of the transition to BL region will be. The mechanisms of damage and failure of Cu samples under friction in the EHL region are similar to the damage and failure mechanisms in very high cycle fatigue. Friction in the EHL region is accompanied by initiation and coalescence of pores and microcracks [68]. A lot of ploughing tracks and large delaminated regions appear on the surface after friction with the higher loading rates. To better understand the mechanisms of friction and wear, systematic research of the deformed structure, the hardening, and the chemical composition of surface layers of fcc metals after friction in the BL region have been studied [69,70,71]. Based on these experimental results, the effects of the deformed structure and hardening during friction in the lubricated conditions are summarized in the presented work.
2. Materials and Methods
2.1. Friction and Wear Tests due to Acoustic Emission (AE) Measurements
Pure fcc metals such as Ag, Cu, Ni, and Al with different values of SFE were chosen as the materials for pins. Application of pure metals allowed us to avoid the effect of solute atoms on plastic deformation, grain size, and hardness. All friction tests were conducted using a pin-on-disk rig described in our previous publications [66,67,68]. Importantly, flat-shape pins and long-time running-in process provided the constant pressure with a time of test at each load. The pins rubbed against the steel disks (AISI 1040) hardened up to HRc = 45. The effects of load on friction and wear coefficients and average temperature near the interface were studied. Sliding velocity was constant at 0.37 m/s (300 rpm). In order to evaluate the transition from the EHL to the BL region, the effect of load on friction and wear properties was studied. The same values of the friction coefficient (μ) (μ ~0.1) with loading indicated the friction in the BL region. To evaluate the average values of friction and wear parameters, the tests were repeated five times at each load. The details of acoustic emission (AE) measurements are presented in work [70]. An AE probe [model R30-ALPHA (MISTRAS Holding Company Physical Acoustic Corporation, Princeton, NJ, USA)] with peak frequency of 300 kHz, 40 dB preamplification, and 42 dB filter threshold level was used and then transferred to the PC-controlled AE recording system with a sample rate of 1 MSPS (mega samples per second).
2.2. The Analysis of the Deformation Structure after Friction of Four Fcc Metals
Diffraction measurements were carried out in reflection geometry using a TTRAX III (Rigaku, Tokyo, Japan) diffractometer equipped with a rotating Cu anode operating at 50 kV/200 mA. The details of grain size analysis by XRD are presented in work [71]. Friction surfaces were carefully examined with a field emission scanning electron microscope (FE-SEM, Helios 460 F1Lite, FEI, Hillsboro, OR, USA). The cross-sectional TEM lamellae were prepared from the pins using a focused ion beam (FIB) (Helios 460 F1 Lite, FEI). Cross-sectioning of the specimens was done in the longitudinal and the transverse directions (parallel and perpendicular to the direction of friction). The details of structural measurements are in publication [72,73].
3. Results
3.1. Friction and Wear
Roughness parameters were measured: Ra of virgin disk—Ra = 0.07 ± 0.02 μn; Ra of virgin pin—Ra 0.04 ± 0.02 μm. Ra parameter of the samples after friction is shown in Table 1.
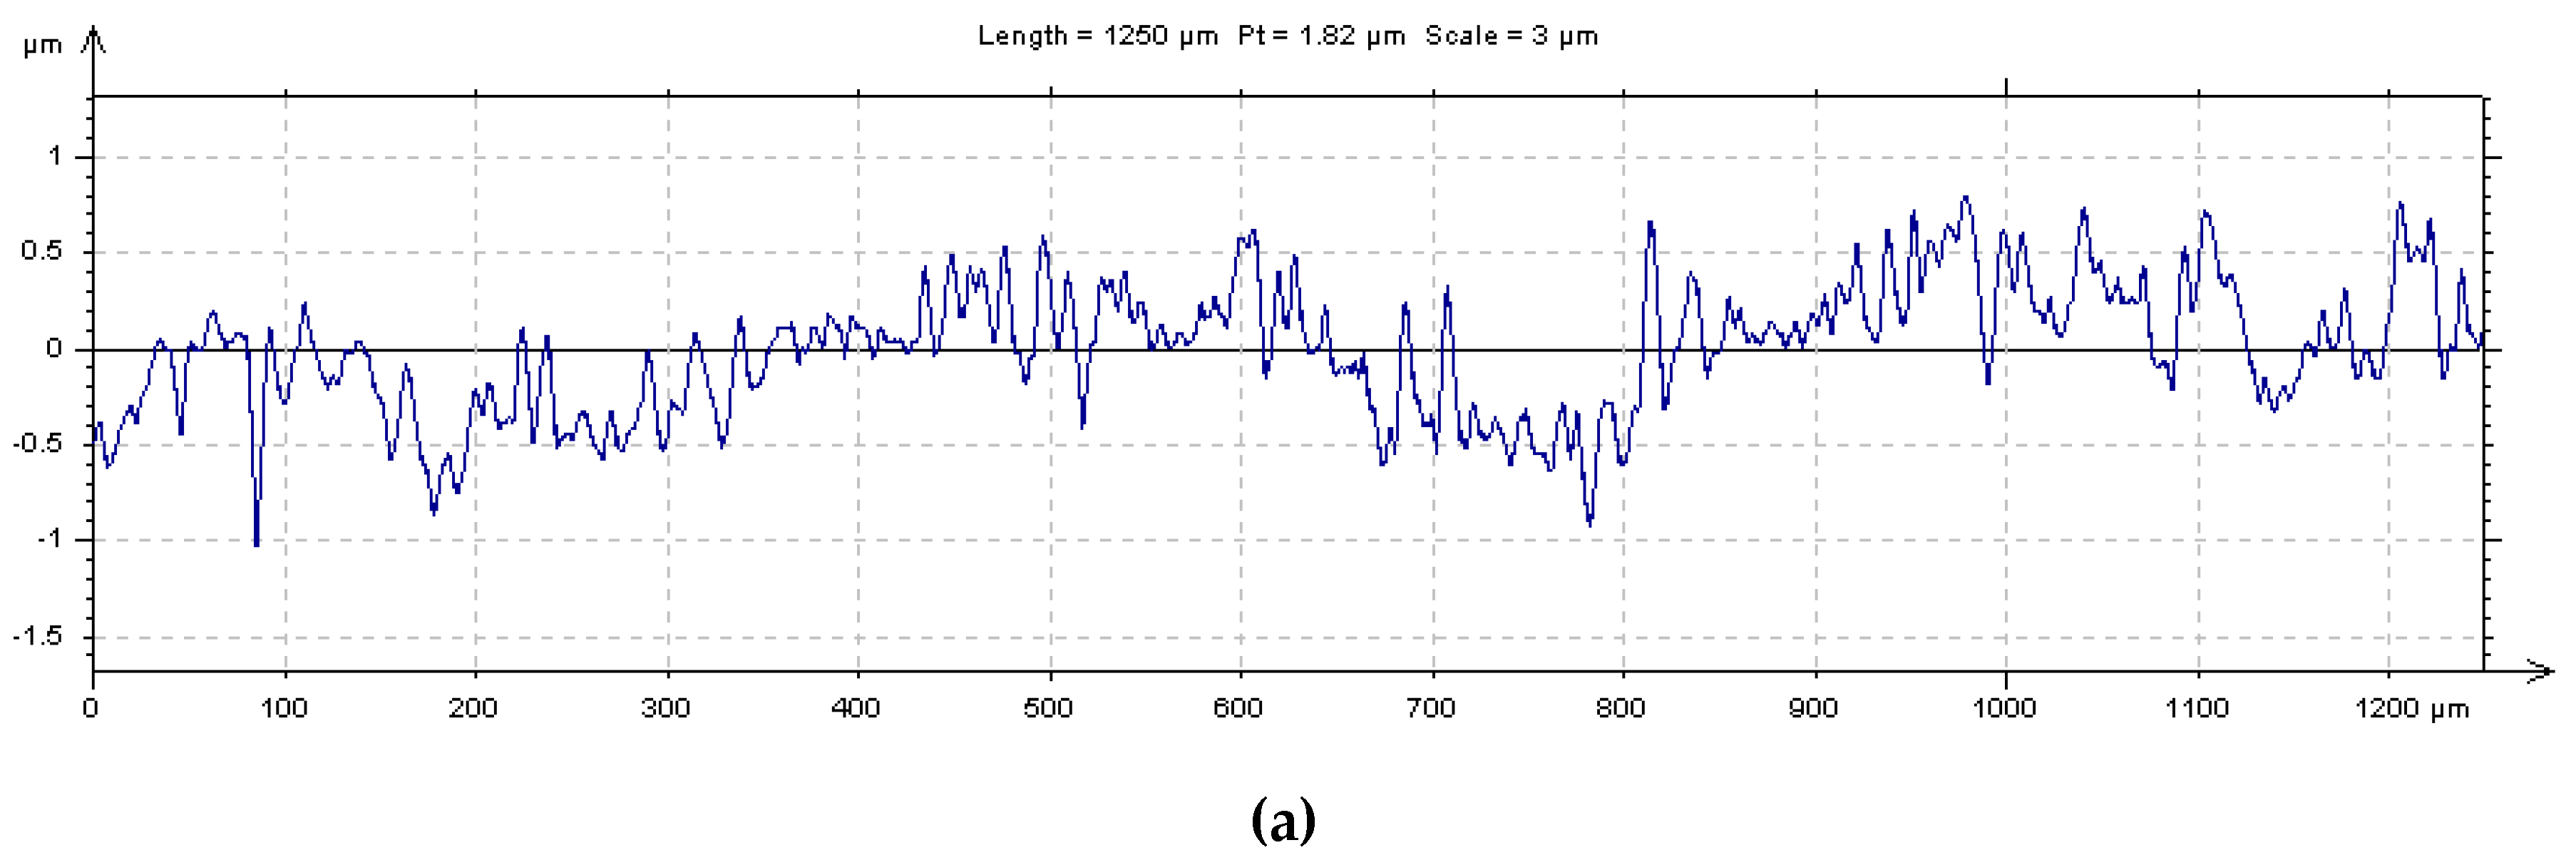
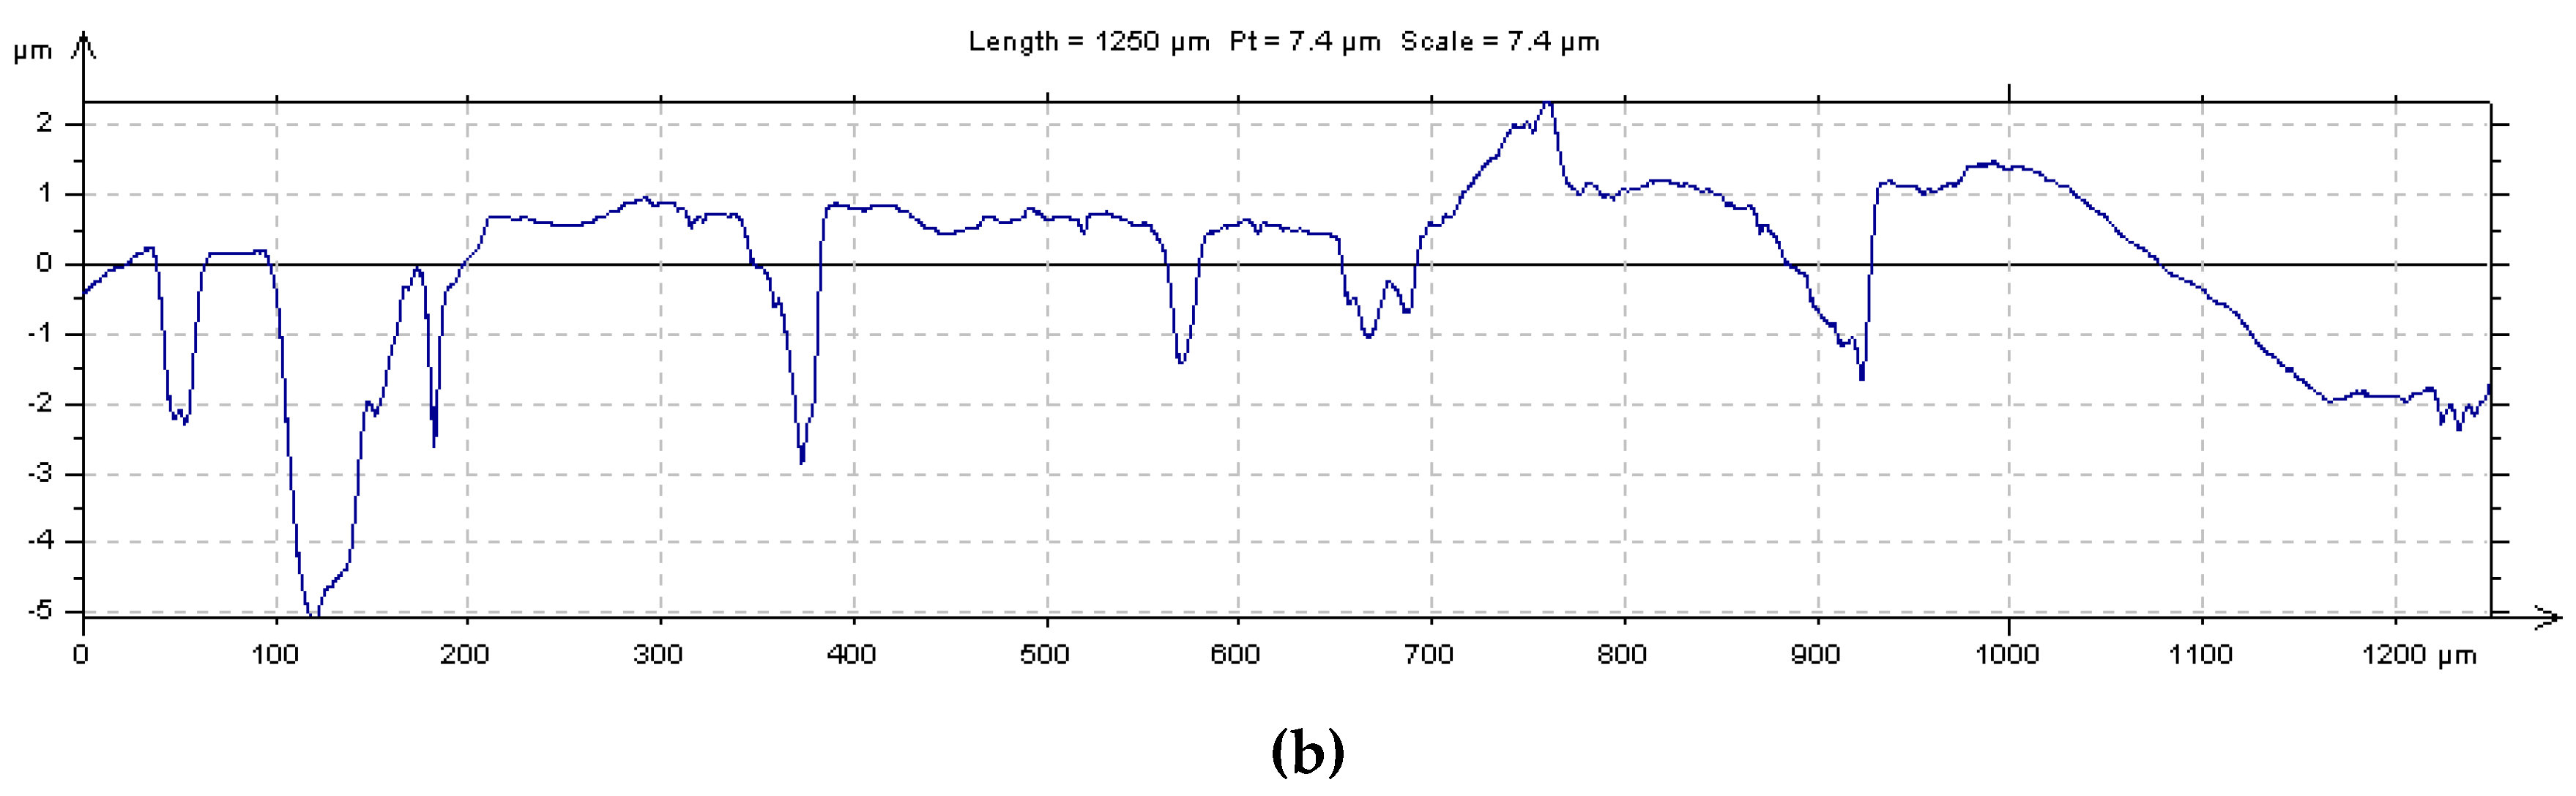
Roughness profiles of Ag and Ni after friction in the BL region are shown in Figure 2.
Although the surface of Ni was rougher than Ag, the wear rate of Ni was smaller.
A definite correlation between SFE and friction and wear properties was revealed. The values of SFE (γ) and the results of friction tests as the maximal values of load (N) in the BL region, the coefficient of friction (CoF), the wear coefficient of pin (k), the average values of grain sizes measured by XRD, and the homological temperature (Tavr/Tm) are presented in Table 2. Tavr = Tb + Tf, where Tb and Tf are bulk and flash temperature, respectively. Tm is the melting temperature. Flash temperature was calculated in our previous work [70].
It was seen that the transition from the EHL to the BL region occurred at different loads and correlated with the SFE, excluding Al; the lower the SFE was, the lower the load of the transition region and the maximal load of friction in the BL region was. Interestingly, for Cu and Ni (middle and high SFE), the maximal load in the BL region was significantly larger than the load for Ag (low SFE). An inverse proportional connection was observed between the wear coefficient and the non-dimensional SFE parameter; the larger the SFE was, the smaller the value of the wear coefficient was, excluding Al (Figure 3). This suggested that the dependences were determined by the structural evolution depending on the contact pressure and the SFE at a definite homological temperature. Although the maximal loads in the BL region were different for studied materials, the homological temperature was about the same (~0.3) for all studied metals except Al (>0.3).
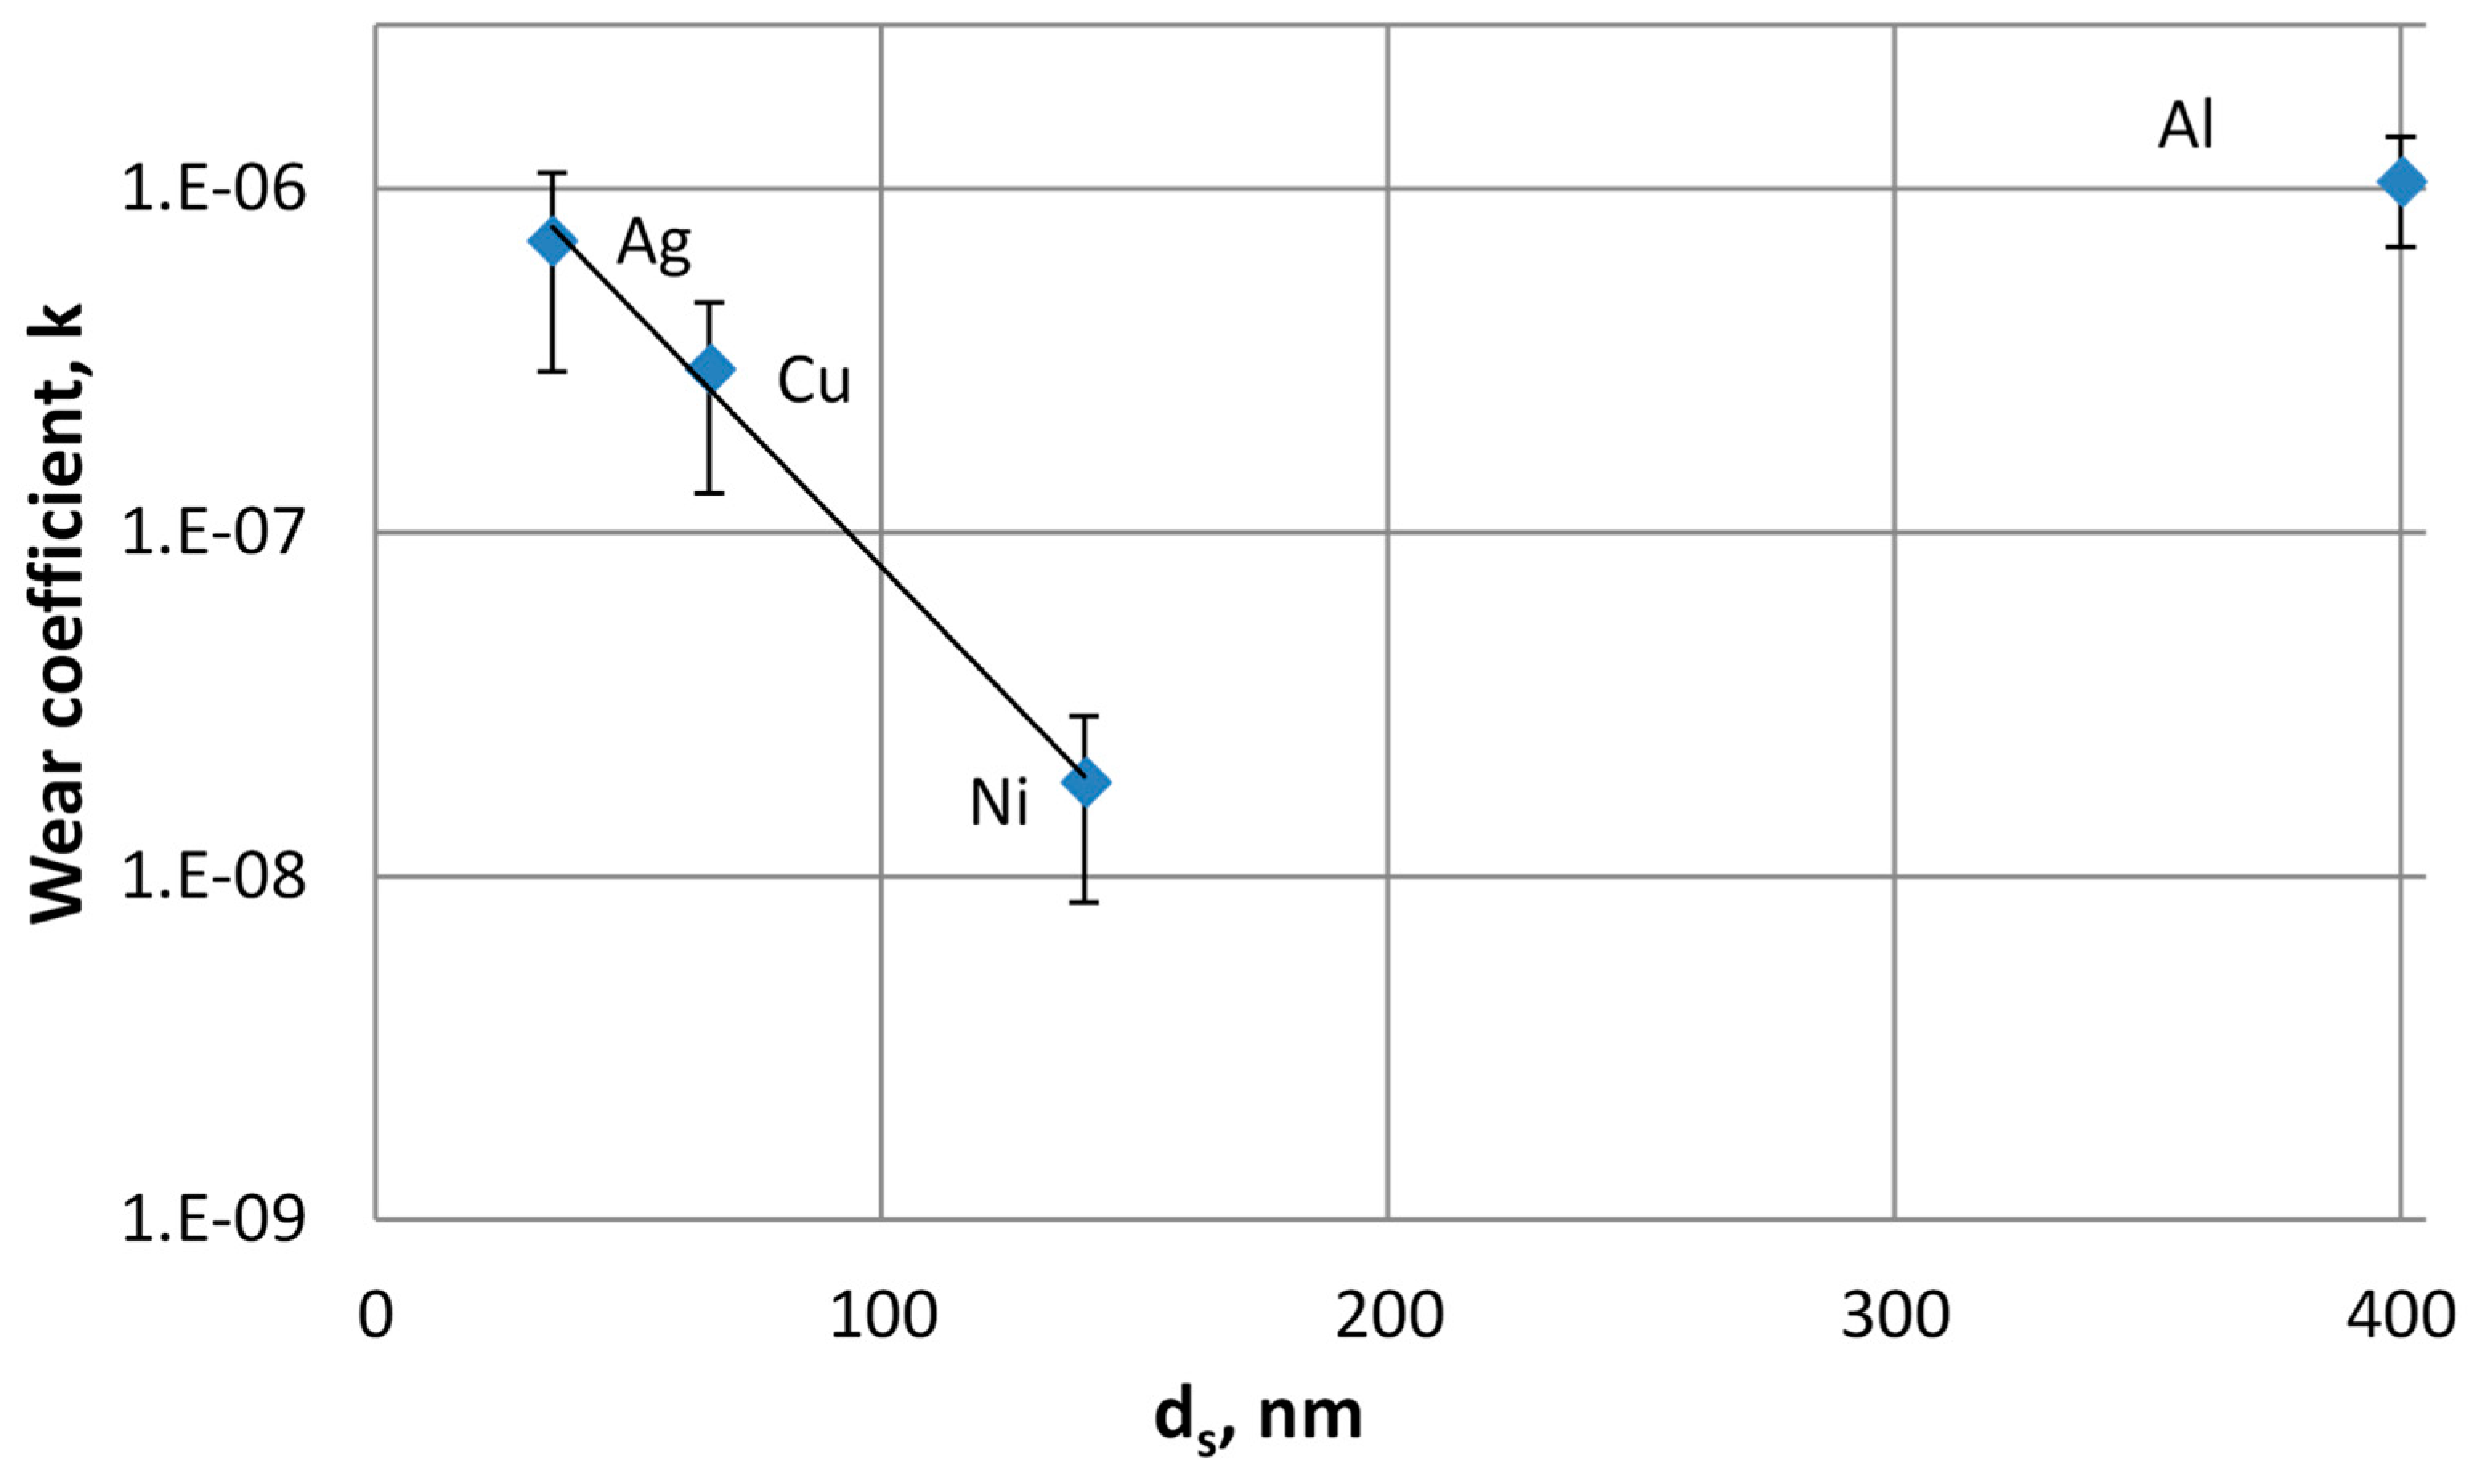
The effect of steady-state grain size, ds, on the wear coefficient is outlined in Figure 4.
It could be seen that Ag with a minimal value of SFE was refined up to a minimal value of grain size during severe plastic deformation in the BL region, while the maximal value of grain size appeared for Al with a maximal value of SFE. It should be noted that all fcc metals—except Al—rubbed at close to the same homological temperature (≤0.3) in the BL region, and thus friction and wear were determined by the evolution of deformed structure and damage development in our simplified model. Since SFE strongly affected plastic deformation and thus grain size, the interaction between these parameters was considered (Figure 5).
A strong correlation between non-dimensional grain size and SFE was observed.
3.2. Analysis of Acoustic Emission in the Transition from EHL to BL Conditions
To better understand the mechanisms of friction in the EHL and the BL regions, the AE signals were evaluated for metals with low and high SFE (Ag and Ni, [70]). The AE waveforms were evaluated in the EHL and the BL regions (Figure 6).
Large amplitude (Am) and low frequency (fm) were observed during friction in the EHL region of Ag and Ni (Figure 6a,b). Low frequency (~2.5 kHz) appeared both for Ag and Ni. Interestingly, the contact loads were principally different during friction in the EHL region. High frequency AE signals (Aμ) were also evaluated in the EHL region. Small Aμ values were revealed just under friction of Ni (Figure 6b). Friction in the BL region was accompanied by an increase in Am and Aμ, especially during friction of Ni (Figure 6d). It was expected that two different amplitudes characterized different processes of plastic deformation and damage development. At this stage, it was reasonable to anticipate that low-frequency AE signals mainly characterized the shearing in macroscale, while high-frequency signals indicated the plastic deformation in microscale. The AE waveforms during friction in the EHL and the BL regions were carefully analyzed. If the same low-frequency ranges (8–12 kHz) were observed during friction of Ag and Ni in the EHL region, the principal difference was revealed in the BL region: 8–16 kHz and 8–512 kHz for Ag and Ni, respectively.
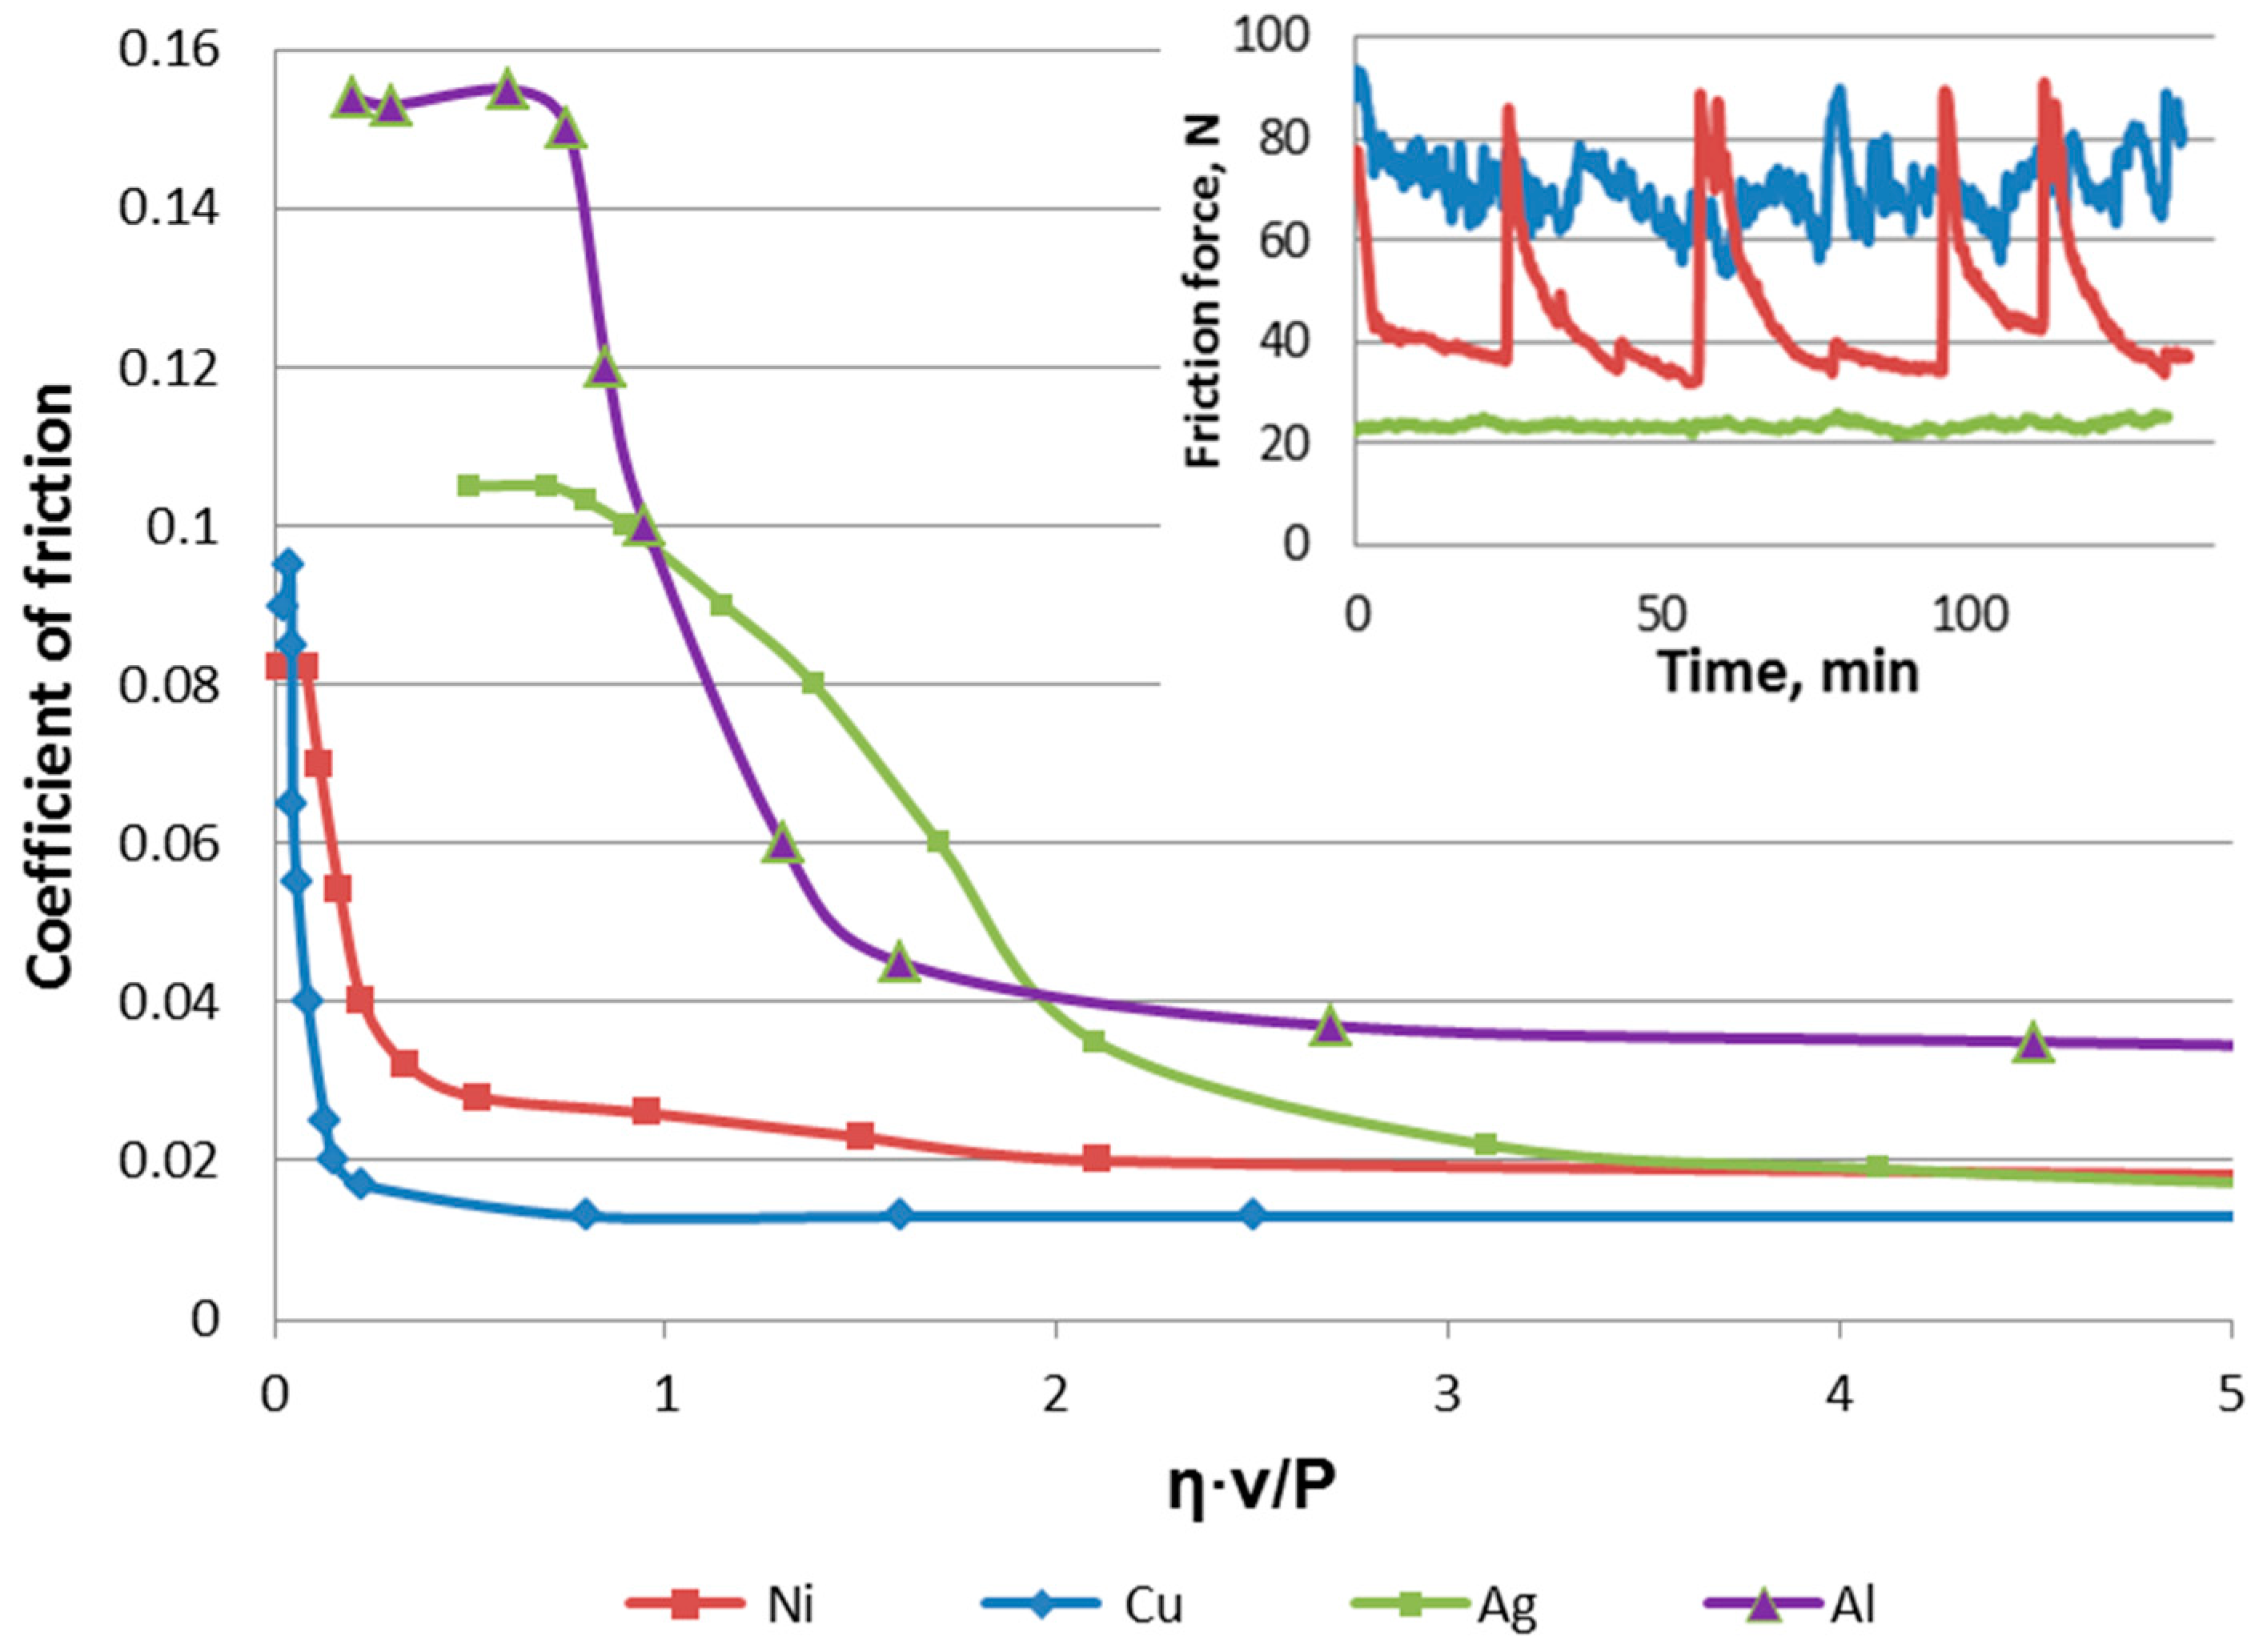
The interesting phenomenon of jumps in the friction force during tests in the BL region for Ni and Cu (see insert in Figure 1) was carefully studied. The friction coefficient for Ni was decreased from the maximal value (μ = 0.08) at a relatively high average temperature (103 °C) compared to that at the low friction point (μ = 0.05). At this point, the temperature was decreased to about 50 °C, leading to increased viscosity and the transition to mixed lubrication (ML). Interestingly, the height of jumps was decreased with the SFE decreasing (Cu) and was diminished for Ag. It was assumed that a friction force decreasing in the range of jumps was determined by the softening of high-deformed thin layers. In order to evaluate the process of softening occurring in the relatively high temperature during friction of Ni in the BL region, the samples were heated after friction in steps of 20 °C with measurements of the hardness values taken at each temperature. It was found that the hardness of Ni after friction in the BL and following annealing at the contact temperature, T = 240 °C (~0.14Tm), was decreased from 2700 MPa to 1700 MPa. A similar phenomenon of dynamic recrystallization of the grain refined Cu was observed at T = 153 °C [76]. In order to better understand the transition from one lubricant region to another, the sliding velocity in the BL region was increased from 300 rpm to 800 rpm (Figure 7). At the maximal sliding velocity, the friction coefficient was decreased practically to the same shape as the EHL waveform (μ = 0.02), which confirmed the relative ease of shearing in the direct contact spots (Figure 6b). In the BL region of Ni, the number of contact spots increased, and the values of the low frequency waves (fm) were also increased.
Thus, it was suggested that the jumps in the friction force of metals with relatively high SFE were associated with deformation hardening and dynamic recovery in the BL region.
3.3. Deformed Structure of Studied fcc Metals after Friction in the BL Region
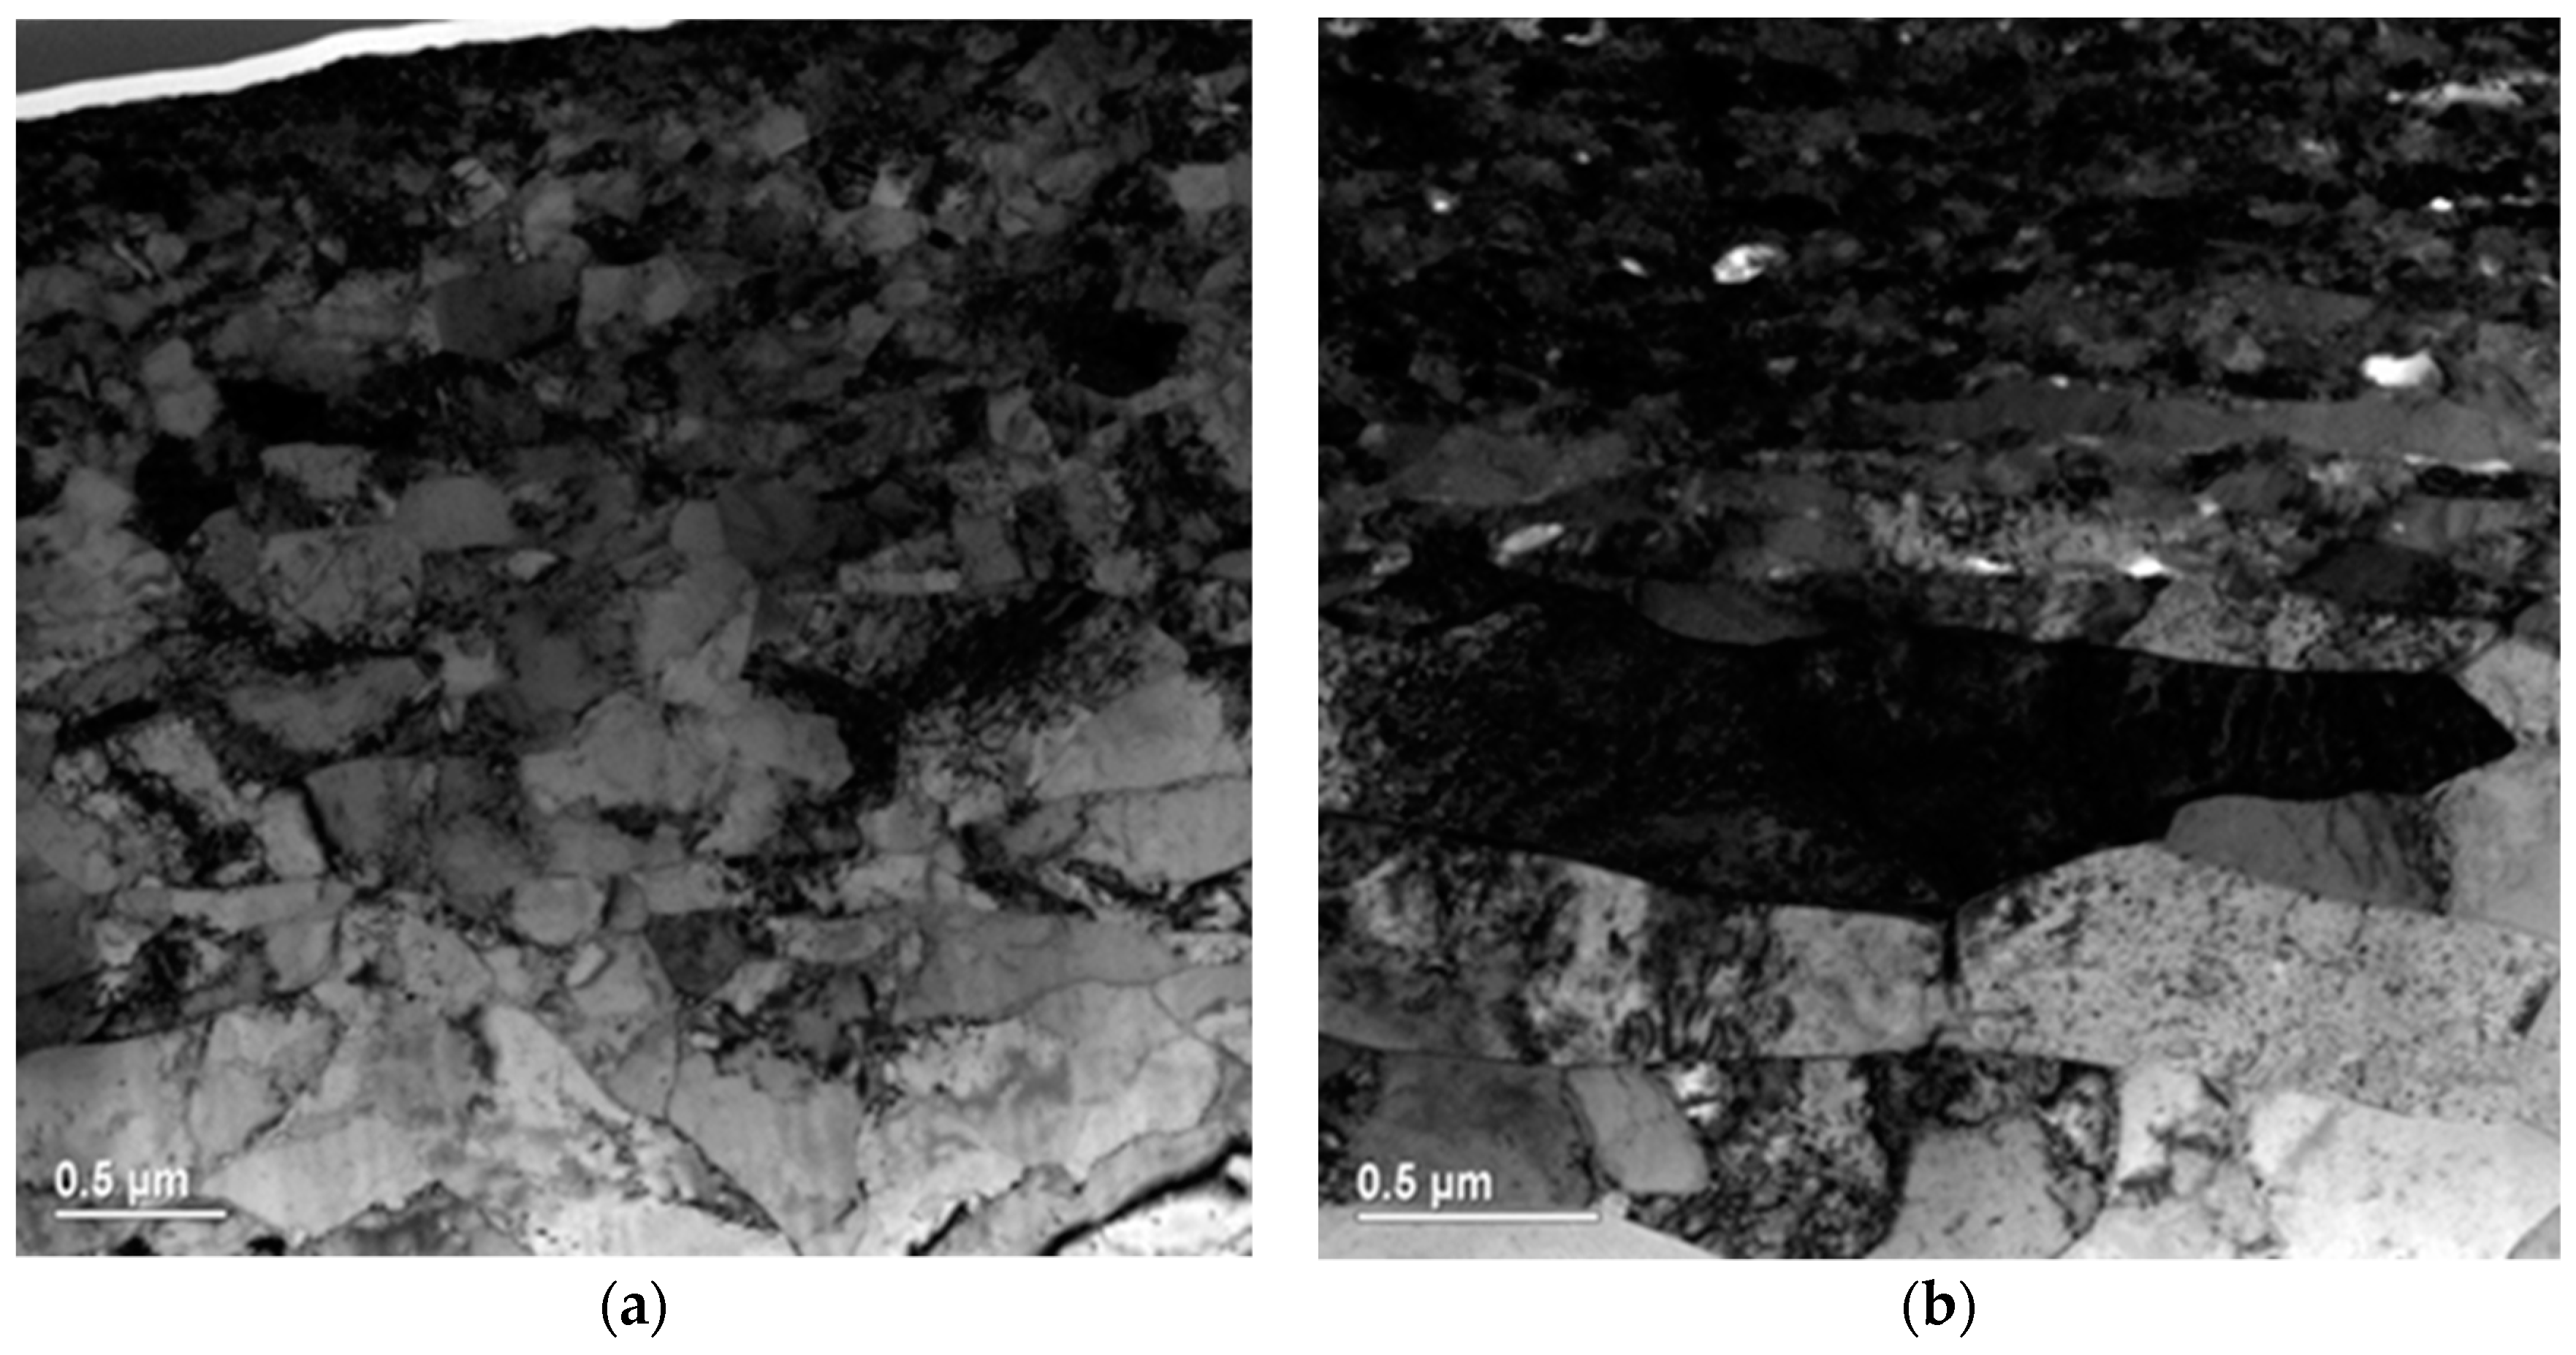
Cross-sectional images of deformed surface layers after friction in the BL region were studied parallel and perpendicular to the direction of friction [72,73]. The TEM cross-sectional images of thin surface layers parallel to the direction of friction are shown in Figure 8.
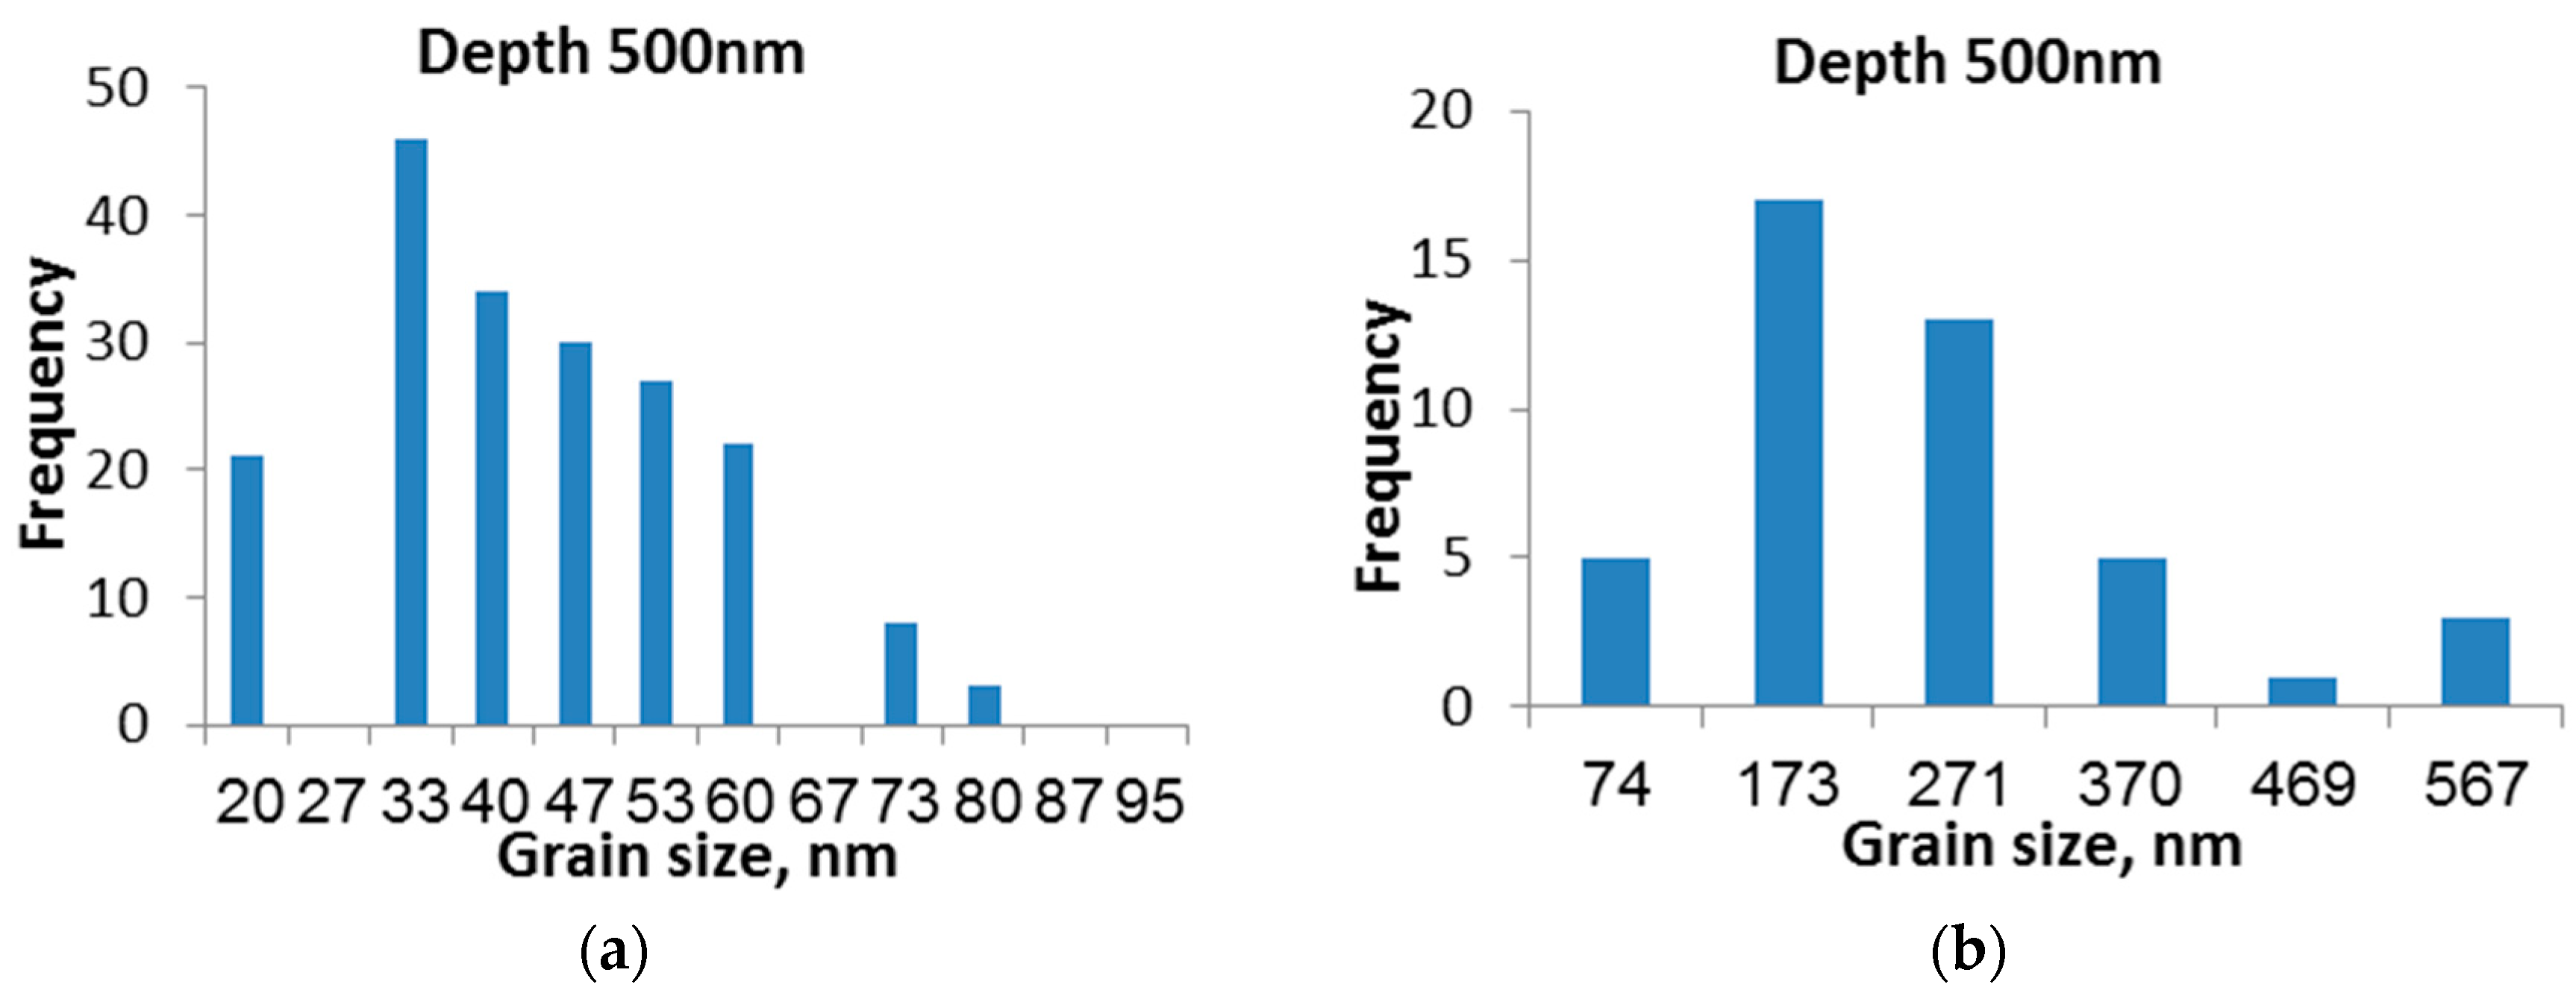
The size of grains and the thickness of high-deformed layers after friction depended mainly on the SFE. With SFE increasing from Ag to Cu and Ni, the thickness of these layers decreased. The average grain size increased from ~20 nm for Ag to 100–300 nm for Cu and Ni (Figure 8b,c). The subgrains in the top layers of Cu and Ni were confined by well-developed boundaries and a large amount of dislocation tangles in their interior. The average grain size of the top surface layers increased from ~100–200 nm for Cu and Ni to 1–3 μm below the damaged layer for Al. Friction of Al was accompanied by strong oxidation of the top surface layers [71]. It was shown that these layers could present well-pressed and sheared Al oxidized wear particles and some penetrated wear iron particles (Figure 8d). The size of noted wear particles was ~0.5–1 μm. Therefore, the behavior of Al during friction was different in comparison to other studied metals. Frequency distributions of grain sizes in the depth close to 500 nm for Ag and Ni (minimal and maximal SFE) are shown in Figure 9 [72].
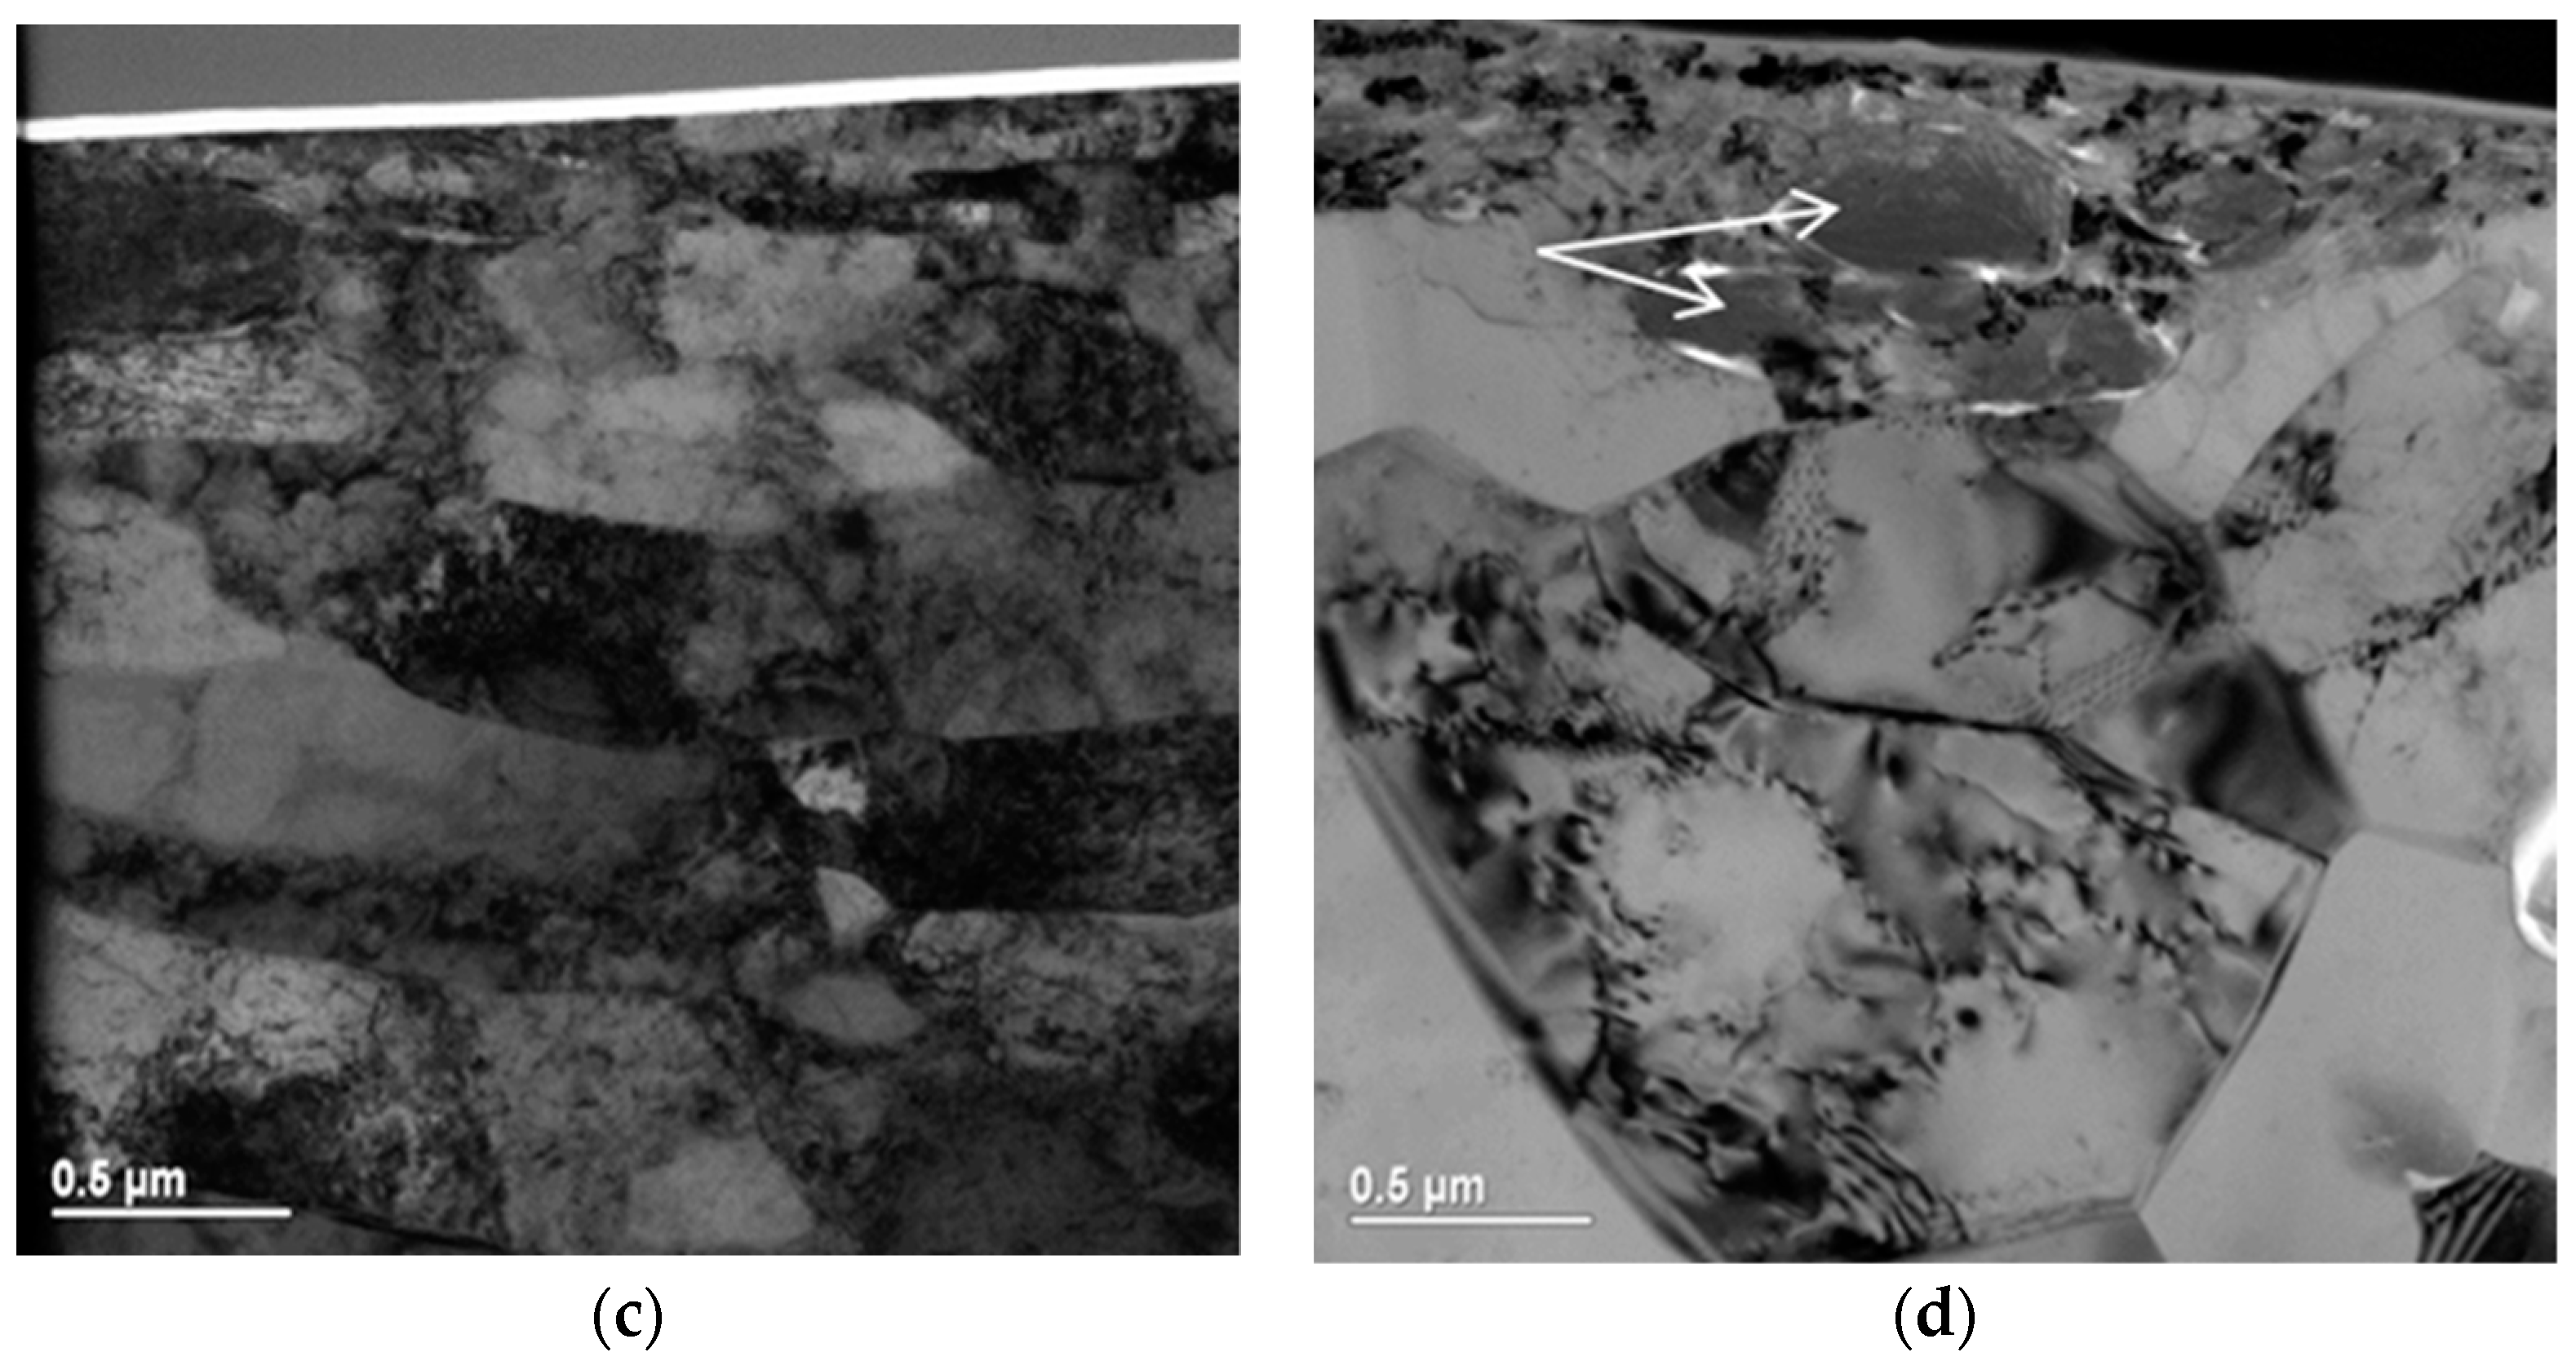
The maximal amount of grains for Ag with sizes 30–60 nm was observed in the depth of 500 nm (Figure 9a), while friction of Ni was characterized by a much larger range of grain sizes (~170–370 nm) (Figure 9b). With depth of deformation, a transition to lamellar structure for Ag, Cu, and Ni was revealed (Figure 10).
The lamellar structure consisted of strongly elongated subgrain/cells containing a high number of dislocations separated by sharp grain boundaries. The microcracks appeared in some grain boundaries. The lamellar structure was absent in Al surface layers.
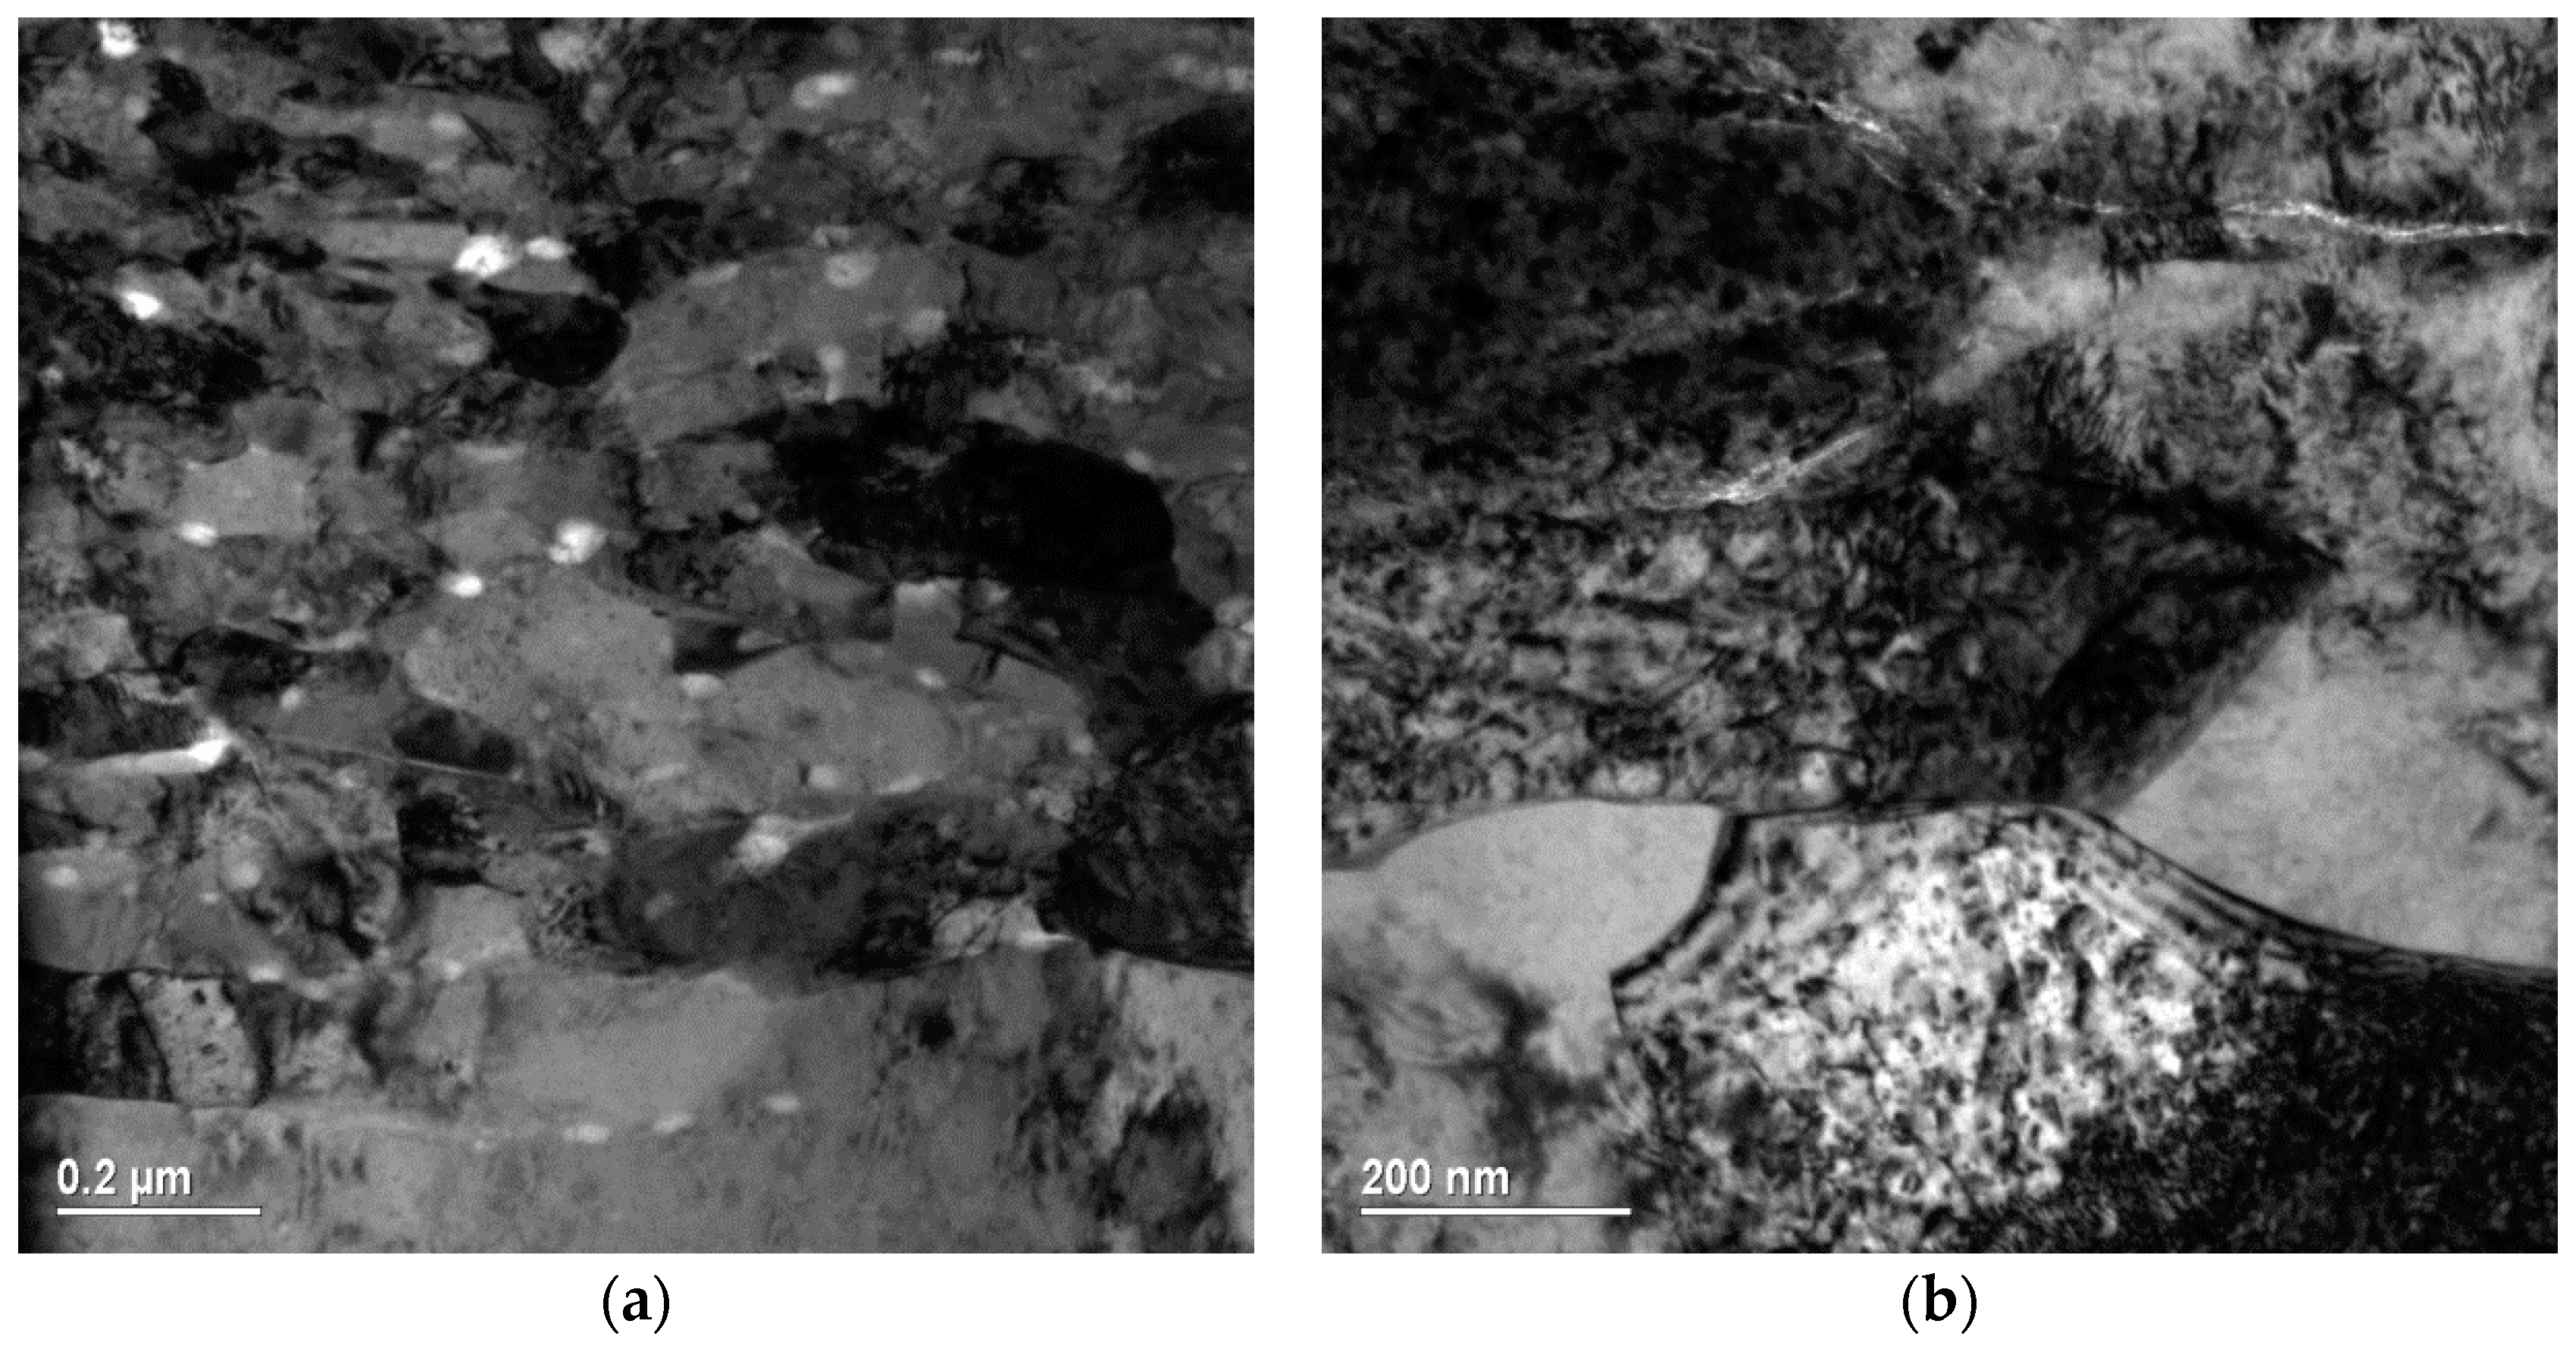
In order to better understand the evolution of grain structure developed in normal and parallel directions to friction and the formation of pores in the top layers of Ag, the TEM cross-sectional microstructures were studied. In fact, the dominant normal pressure was mainly affected in the direction perpendicular to the friction, while both the normal pressure and the shear stress were applied together in the direction parallel to the friction. BF TEM images of the deformed microstructures parallel and perpendicular to the direction of friction for Ag are shown in Figure 11.
Importantly, the lamellar microstructure clearly appeared in the cross-sectional microstructure for Ag parallel to the direction of friction and was practically absent in the sample normally oriented to the friction direction. More remarkably, pores and microcracks were observed mainly in the deformed microstructure parallel to the friction direction.
3.4. Damage Development during Friction in the BL Conditions
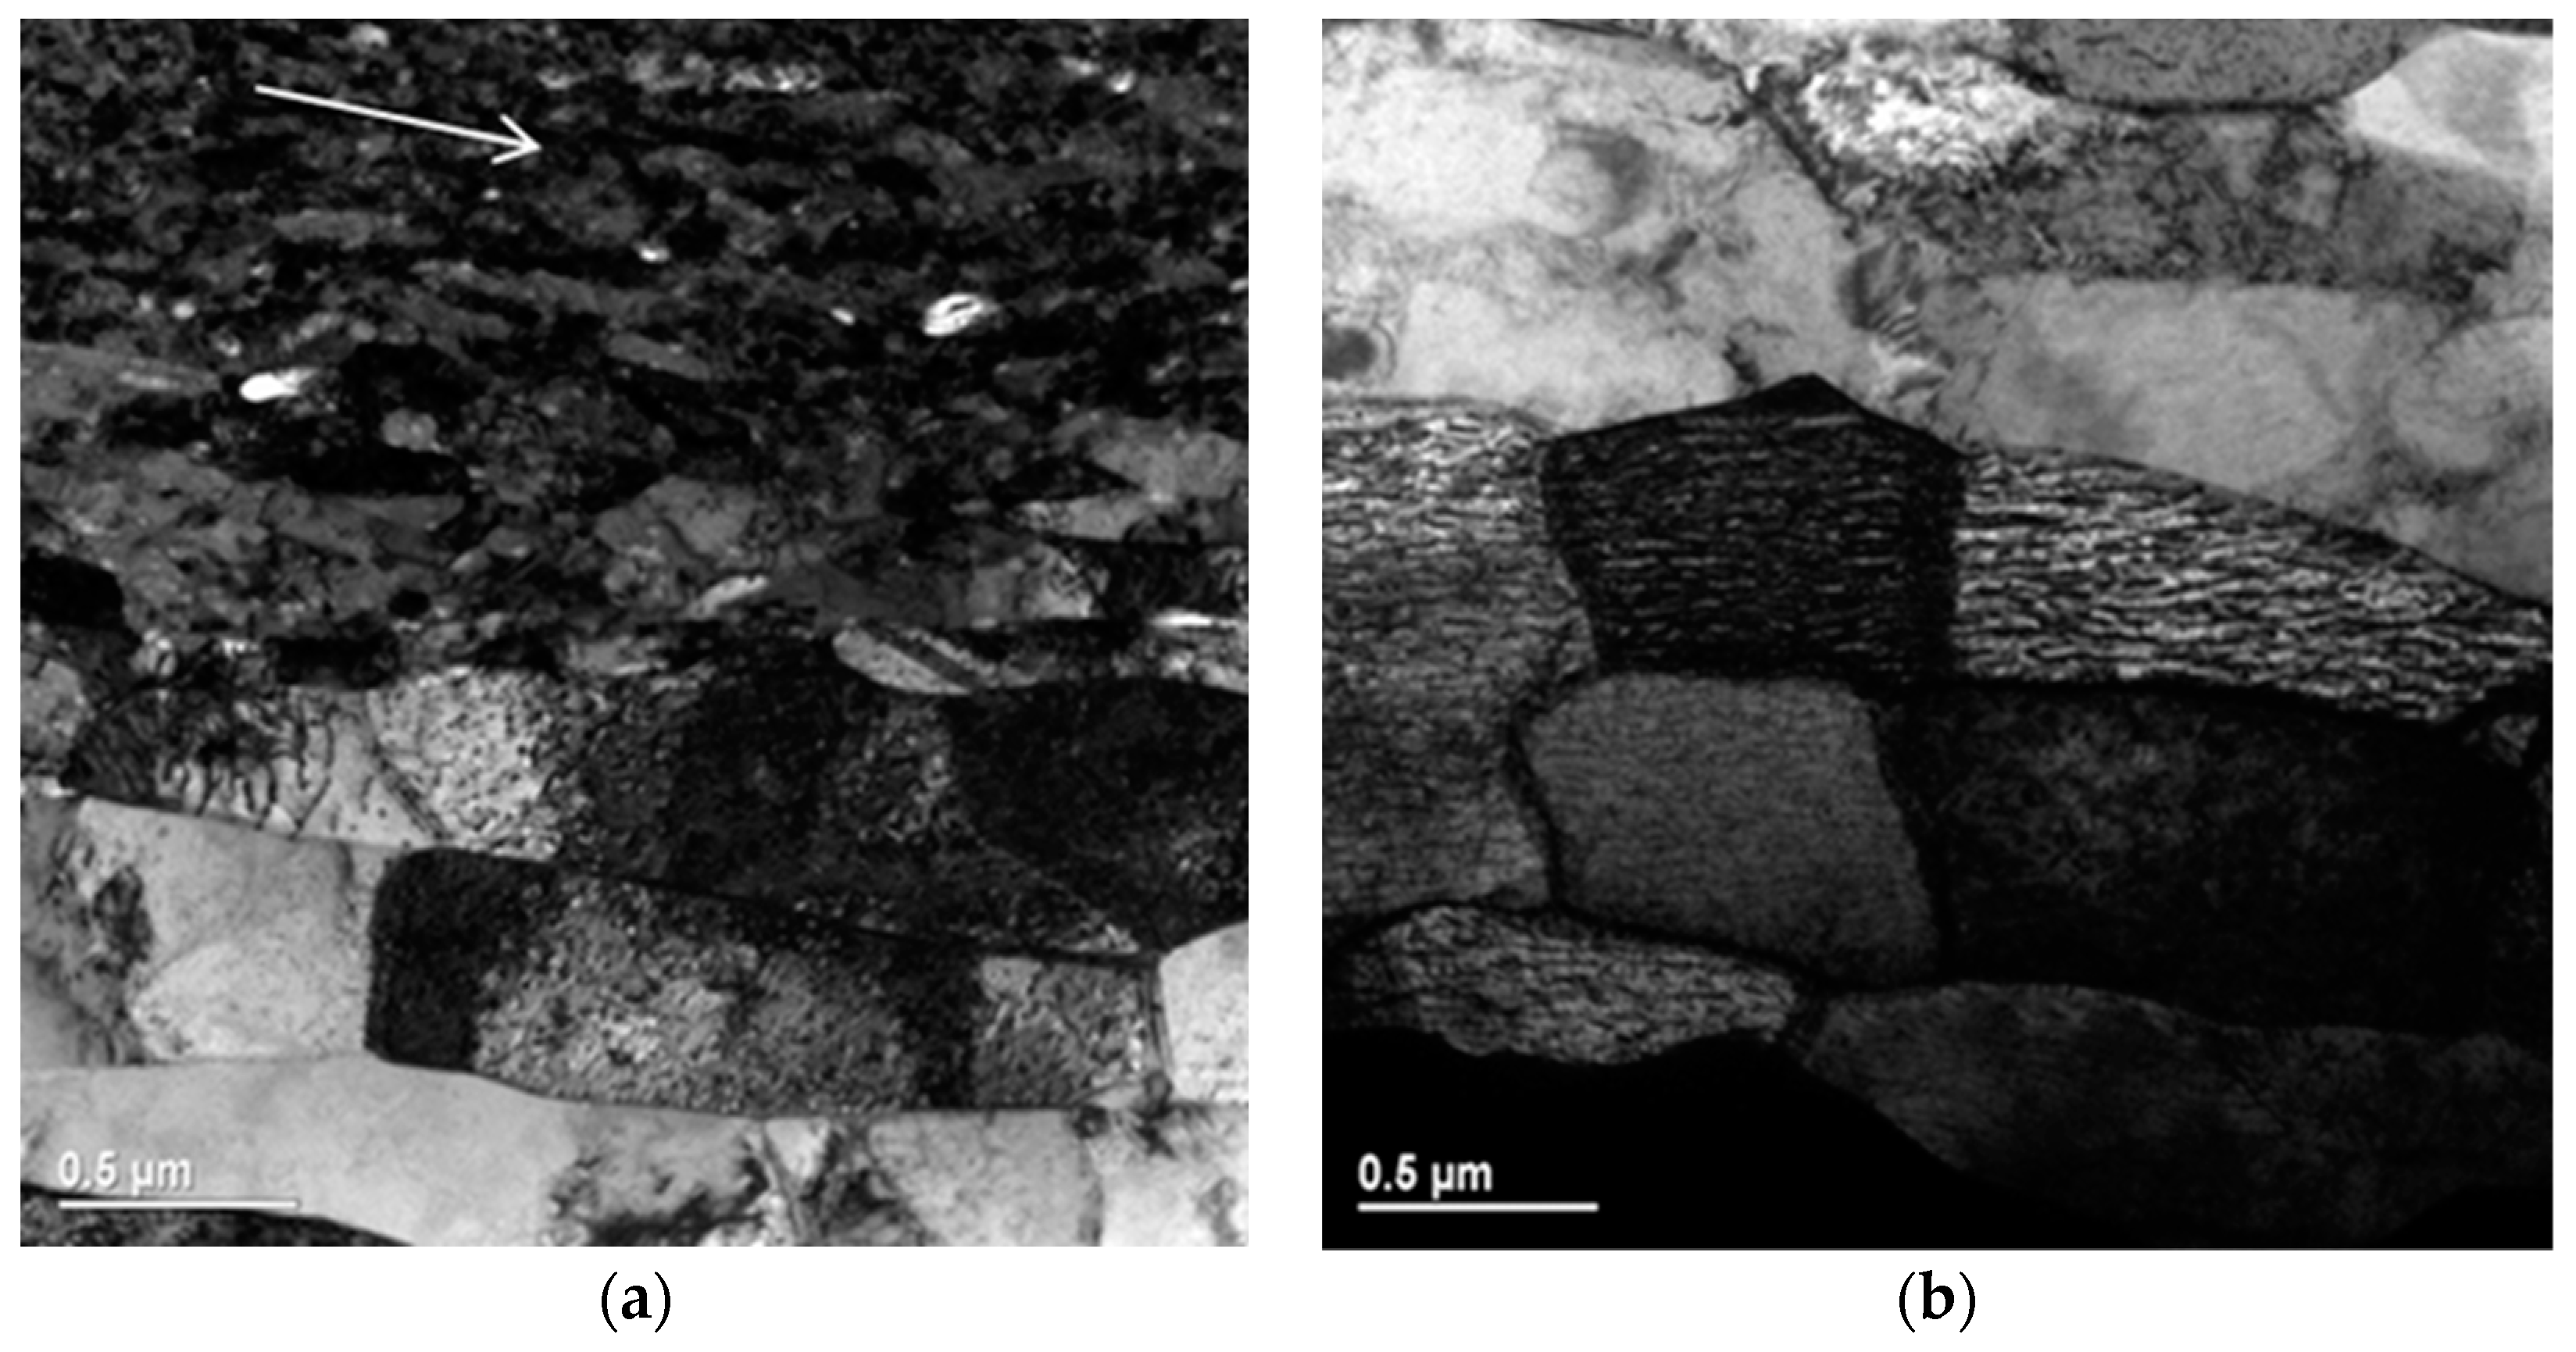
Damage development in the considered model was mainly determined by plastic deformation at a definite contact temperature. Damage development in the top surface layers of Ag (low SFE) and Ni (high SFE) during friction in the BL region is shown in Figure 12.
The pores and microcracks appeared in the boundary of lamellas under friction of Ag (Figure 11b, Figure 12a). This phenomenon is usually observed during large plastic deformation of metals with low SFE when the number of gliding dislocation systems is limited. A principally different picture was revealed under friction of Cu and Ni. For instance, plastic deformation of Ni in the top layers was accompanied by the formation of relatively large grains with a high density of dislocations inside and in the boundaries of grains. Lamellar structure was absent in the top surface layers of Ni and appeared in the depth of about 1 μm when the effect of normal pressure due to compression was diminished. The microcracks were formed in the high angle boundaries in shear bands of the subsurface layers. Apparently, high dislocation accumulation in the top layers of Ni was accompanied by specific annihilation of dislocations at a relatively high contact temperature that could decelerate the development of cracks during the formation of wear particles.
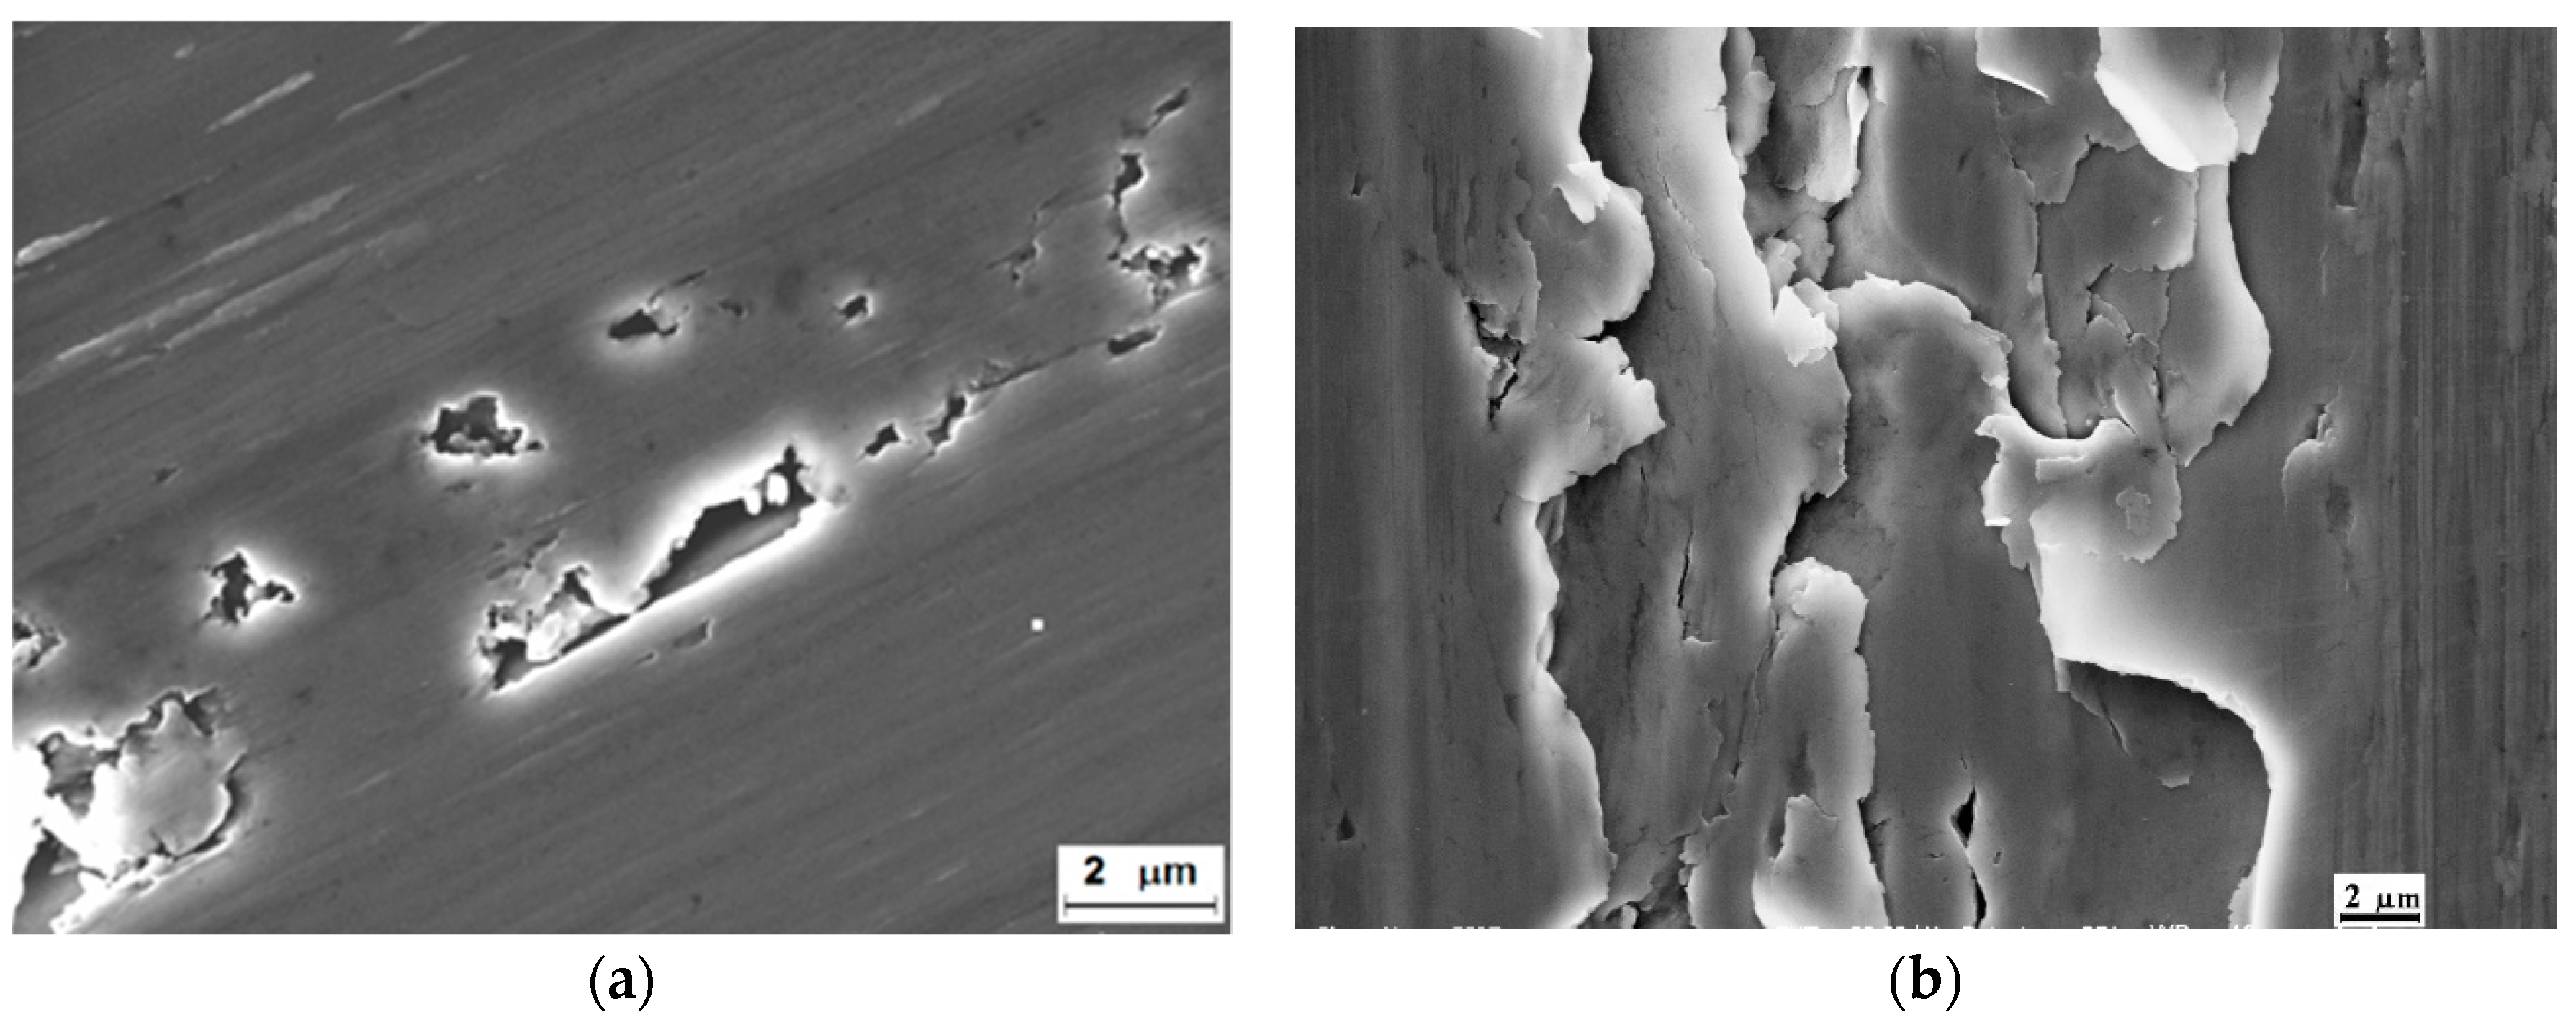
SEM images of Ag and Cu surfaces after friction in the BL region are shown in Figure 13.
It was clearly seen that the formation of wear particles was a result of joining pores and microcracks, while the delamination of the thin film was a dominant mechanism of damage development during friction of Cu and Ni. Ploughing tracks were also observed on the rubbed surfaces. The size of wear particles was analyzed by SEM. Many wear particles were found in the agglomerated state. However, the magnified images showed the size of wear particles changed from about 200 nm to 2–3 μm. We did not find a major difference in the average size of wear particles. Certainly, the formation and development of cracks in the deformed microstructure during friction is a complex problem that will require further careful analysis.
4. Discussion
The interaction between the friction properties (Stribeck curves) and the deformed structure of studied metals was considered. The same CoF (μ ~0.02) was observed in the EHL region for Ag, Cu, and Ni. With a loading, the transition from the EHL to the BL region occurred under different contact loads depending on the values of SFE and original hardness. The transition from the EHL region was usually characterized by the activation of plastic deformation in the contact spots, leading to increased CoF and wear rate. In the transition to the BL region, the nanocrystalline structure was formed in the top surface layers of Ag. This deformation structure with fairly equal grains and a large number of pores mainly in grain boundaries was preserved during loading in the BL region. Dynamic recovery was not observed in the top surface layers of Ag. Apparently, the dynamic recovery was limited due to cross-slip and splitting of full dislocations into partials containing a wide stacking fault ribbon during friction of Ag, similar to the SPD processes in metal and alloys with low SFE [76,77,78]. The limited dynamic recovery indicated a large hardening rate in the surface layers of Ag, thus explaining the low load in the transition from the EHL to the BL region. In comparison to Ag, the loads of transition to the BL region were significantly larger for Cu and Ni (Table 2). Friction of Cu and Ni was accompanied by the formation of inhomogeneous microstructures with large and small grains in the top surface layers. This was similar to the microstructure achieved due to thermally activated processes of rearrangement and annihilation of dislocations for fcc metals with relatively high values of SFE and contact temperature (382 and 540 K for Cu and Ni, respectively). Formation of the inhomogeneous structures indicated the dynamic recovery occurring during friction of Cu and Ni in the BL region. In fact, the hardness of the deformed layers of Ni was significantly decreased after annealing of the deformed structure of the surface layers at a relatively low temperature (0.14Tm), similar to that observed during annealing of refined Cu after refinement [79]. The hardness decrease and the formation of inhomogeneous structures with large and small grain structures at a low temperature indicated the dynamic recovery in the surface layers.
It was shown that the inhomogeneous structure provided both the high strength and the ductility of deformed metals and alloys [36,40]. Therefore, it was reasonable to anticipate that high wear resistance of Cu and Ni in relation to Ag was obtained due to the high strength and the ductility of the inhomogeneous structure.
Friction in the BL region was characterized by a steady-friction state when a constant value of CoF was preserved with loading. This steady-state region was determined by the balance between accumulation and annihilation of dislocations or balance between hardening and softening [70,71,72,73]. This balance strongly depended on SFE and contact temperature.
High hardness indicated localization of the deformation in the thin surface layers, while definite softening led to ease shearing. The presented simplified model was based on the simultaneous deformation hardening and softening during friction in the BL region. Based on the analysis of the deformed microstructure of four fcc metals during friction in the BL region, it was concluded [71] that:
where Hs is the hardness after friction, and Hv is the hardness before the friction. Remarkably, the final value of hardness was determined both by the maximal value of hardening, Hhardening, and the specific value of softening, Hsoftening, at close to the same homological temperatures. Again, this simplified model was based on the dominant role of plastic deformation and damage development during friction in the BL region when the effect of tribochemistry in a smooth contact asperity was limited.
Hs − Hv = ΔH = Hhardening − Hsoftening
The results of wear experiments for four fcc metals indicated much lower values of wear coefficients for the metals with higher values of SFE (Cu and Ni), excluding Al. The main problem in the application of the presented model was a difficulty in the evaluation of the structural parameters determining the deformation hardening and the dynamic recovery.
Friction and wear were determined both by the normal pressure and the shear stress. In order to better understand the effect of shear stress and normal pressure on the deformed microstructure, cross-sectional TEM images, oriented normally and parallel to the direction of friction, were compared. Formation of the lamellar structure in the direction of friction indicated the dominant role of shear stress in the direction of friction. Lamellar structure and shear bands ultimately led to instability and damage development during friction and wear. From the other side, the dynamic recovery responsible for ease shearing improved the lubricity of the surface layers.
The main dominant mechanisms of damage development during friction of Ag, Cu, and Ni were delamination and ploughing. It was expected that the size of single wear particles would be close to the grain size. In our evaluation, the single wear particles were close to 200 nm. However, many wear particles were in the agglomerated state. Recent analysis of wear particles during friction of steel–brass and steel–steel sliding pairs in the BL region showed wear particles close to 200 nm [80]. TEM analysis of the grain sizes in the deformed surface layers varied from 20 to 400 nm. Therefore, it could be suggested that the wear particles corresponded to the sizes of grain in the studied metals during friction in the BL conditions.
Friction and wear properties of Al, as well as the damage development, were different in comparison to Ag, Cu, and Ni and were determined by strong oxidation of surface layers with the formation of a thick third body of pressed wear particles [73].
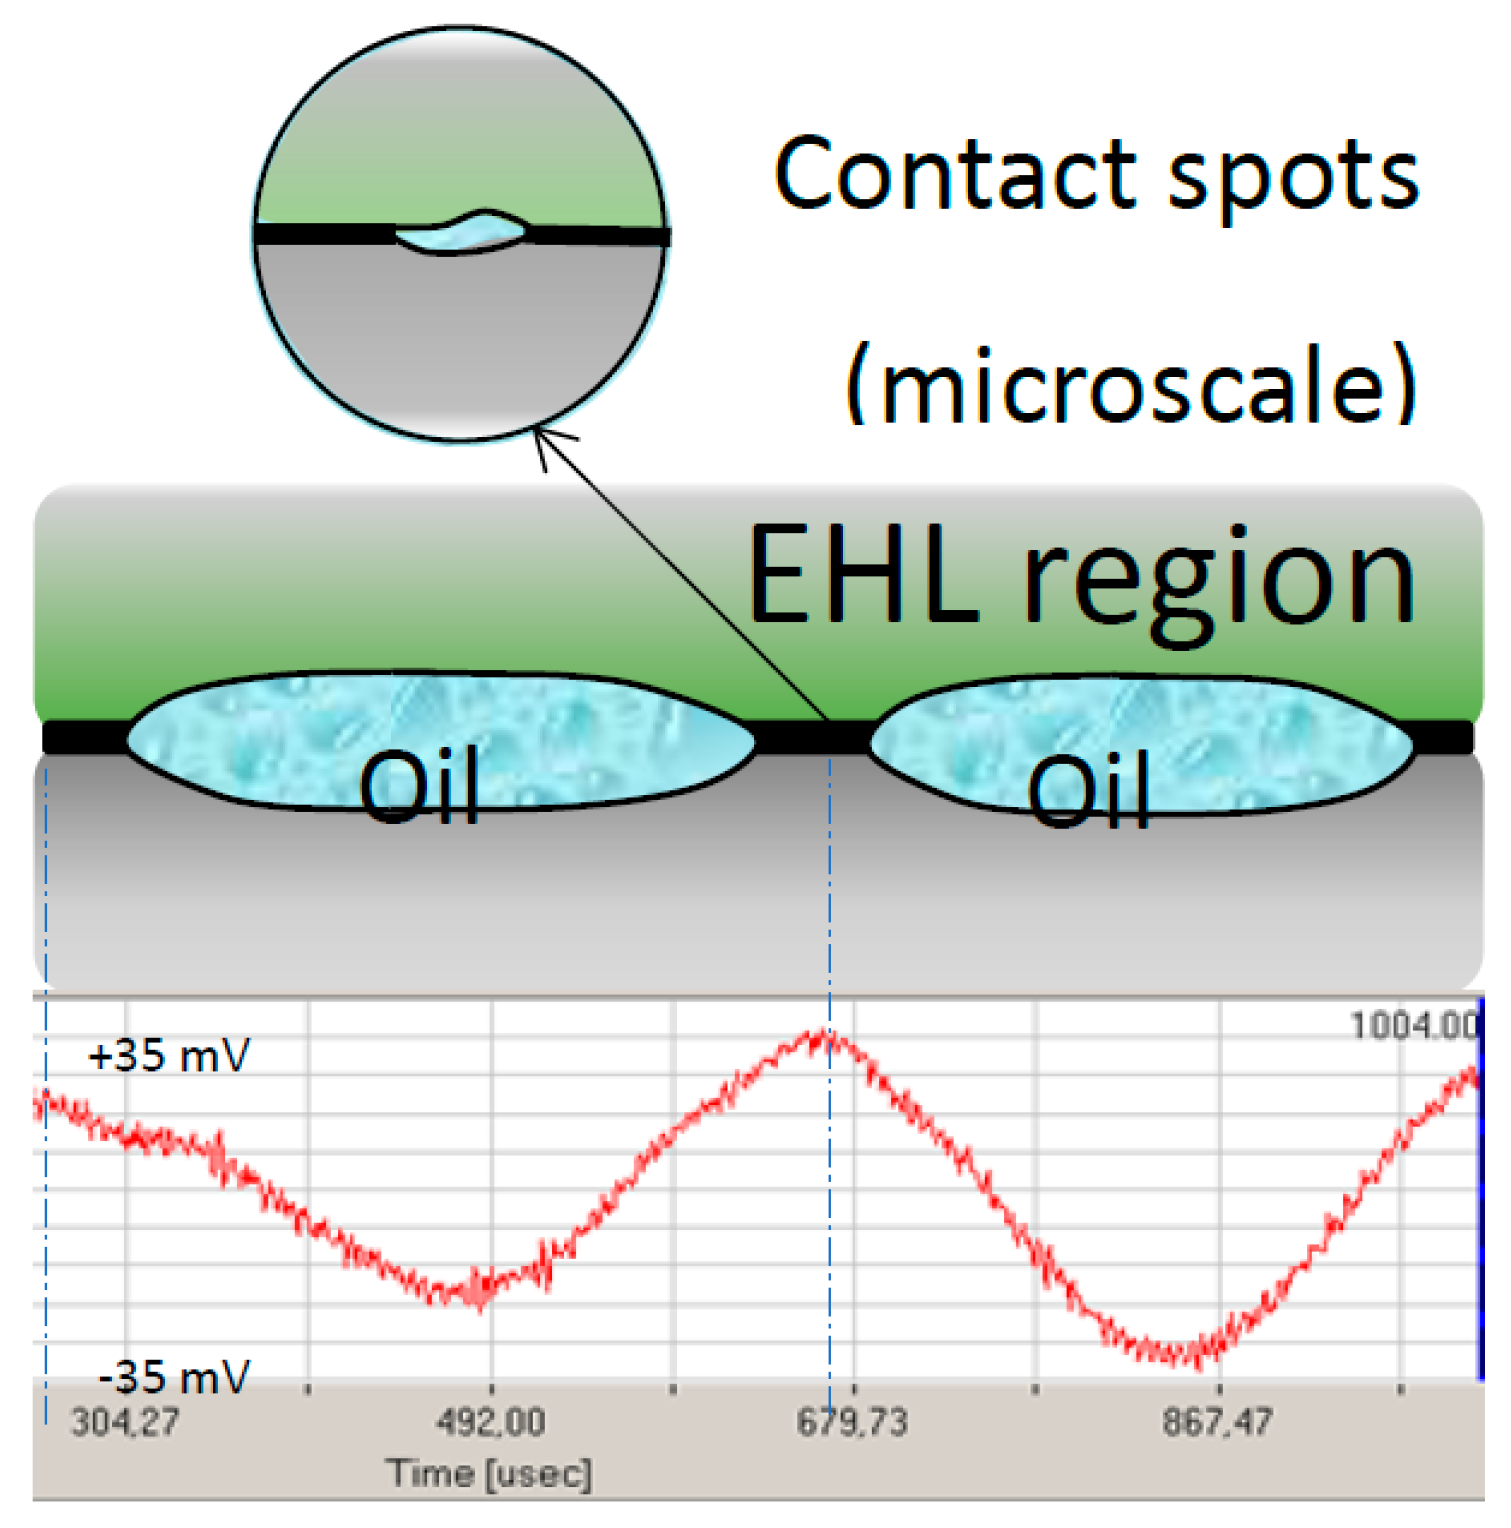
In order to evaluate the transition from one lubricant region to another, AE signals were estimated. Noise signals appeared just in the point of mechanical interaction of the contact spots. The models of contact interaction during friction in the EHL and the BL conditions were considered based on the analysis of the AE parameters (Figure 14, Figure 15 and Figure 16) [70].
At the points of direct contact, the level of AE signals increased. An absence of high frequency signals indicated the limited plastic deformation in the EHL conditions. During friction of Ag in the BL region, the low frequency wave was just increased from 2.5 kHz in the EHL to 5 kHz under the BL conditions (Figure 15).
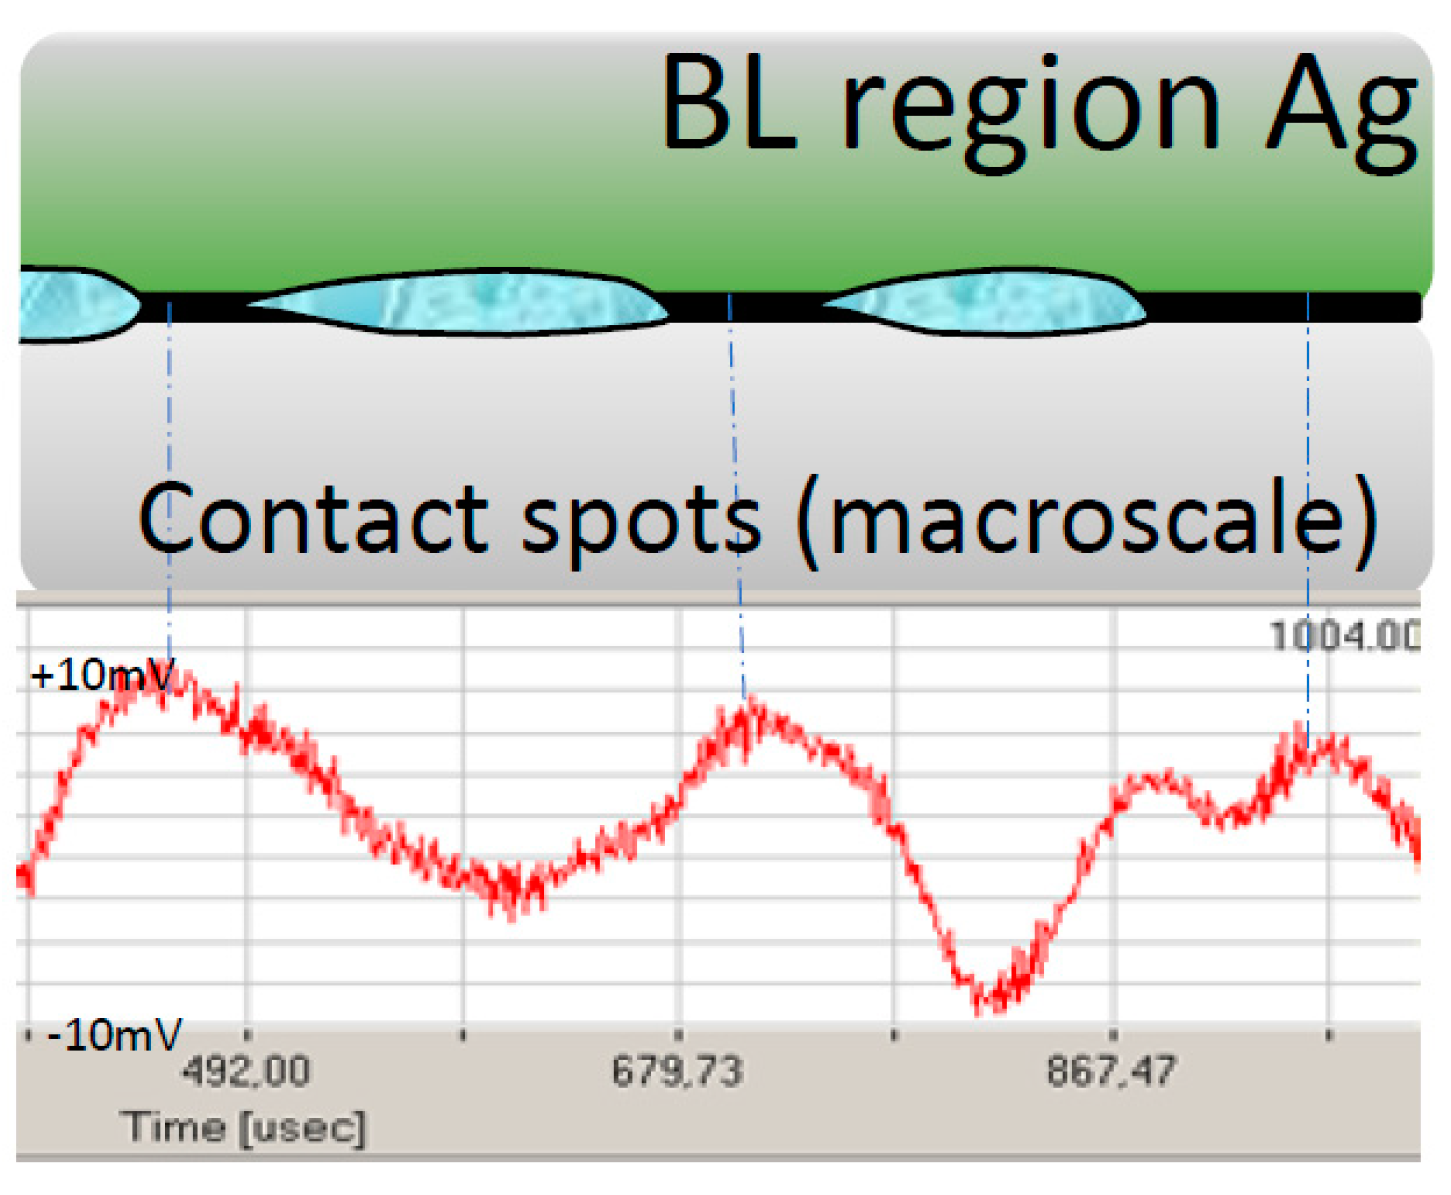
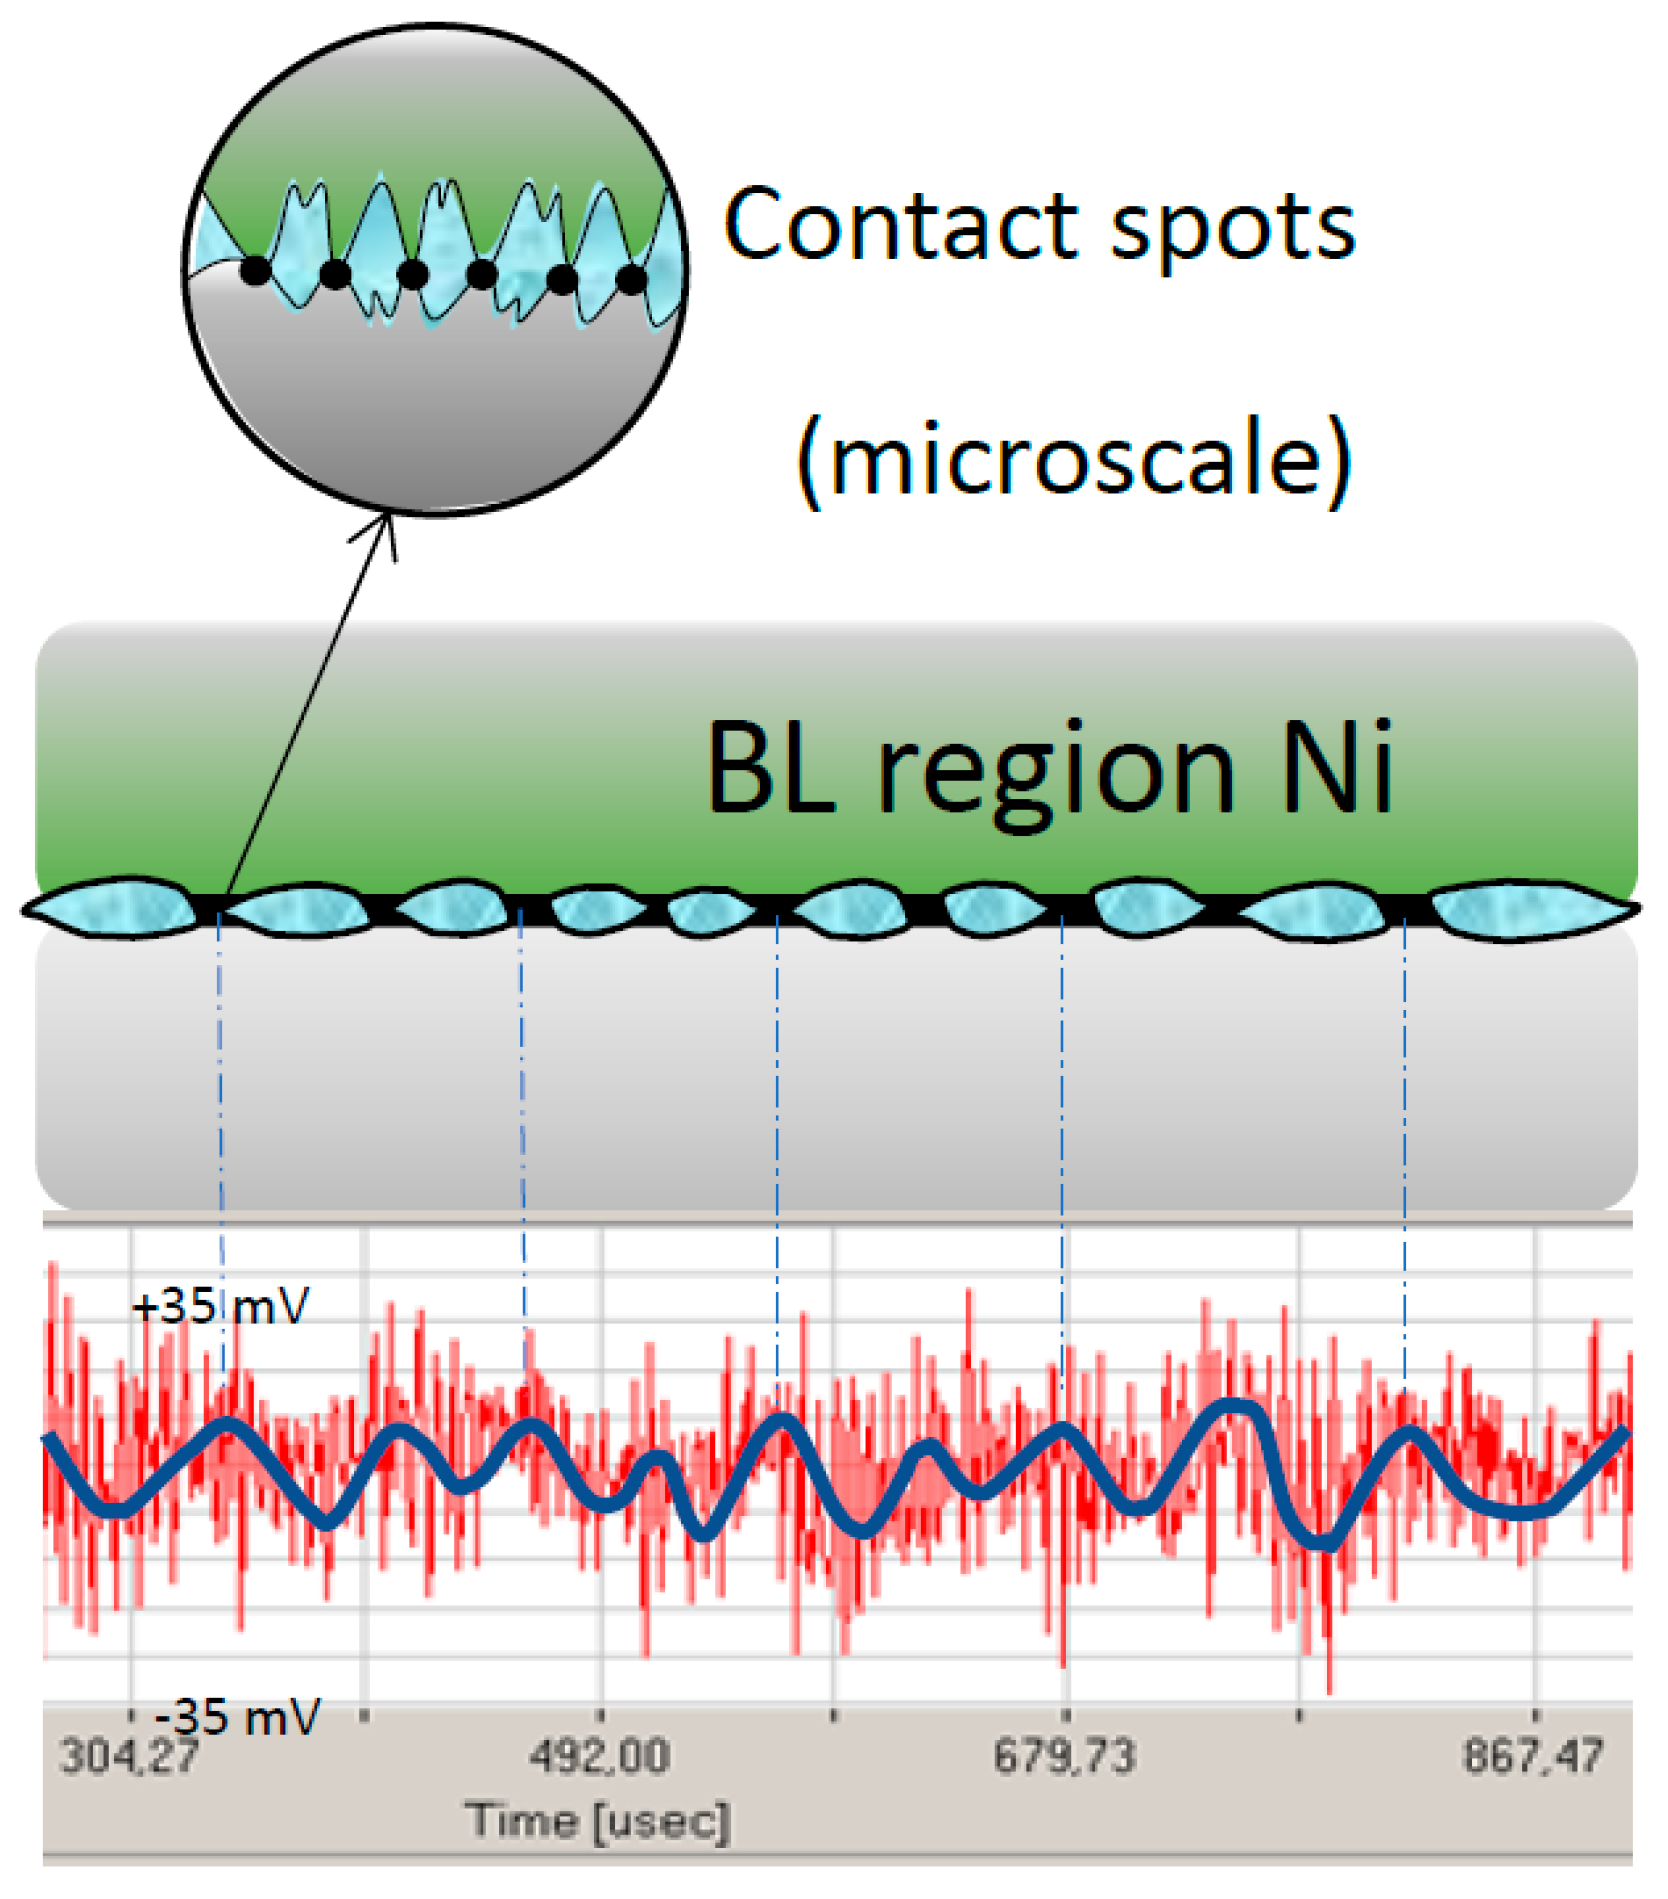
Friction of Cu and Ni in the BL region occurred at relatively high loads, leading to a larger number of contact spots and therefore to an increase in low-frequency AE signals (Figure 16). In the insert, the direct contact of a single contact spot at the microscale level is presented.
High-frequency AE signals (red color) indicated severe plastic deformation during friction of Ni in the BL region. Thus, the AE analysis clearly demonstrated the transition from one contact region to another, conveying a qualitative estimation of the dominant mechanisms of deformation (elastic or plastic) during friction and a correlation between the geometrical parameters in macro- and micro-scales. New experimental results are needed for better understanding the interaction between deformation microstructure, damage development, and geometrical parameters of contact. At this stage, an application of pure oils allows any simplification in the analysis of phenomena as complex as friction and wear.
5. Conclusions
A simplified model of interaction between the deformed microstructure and the friction and wear properties of four fcc metals rubbed in lubricated conditions was presented. The effects of SFE and contact temperature on the deformed microstructures of Ag, Cu, Ni, and Al during friction in the BL region were analyzed. Friction properties of four fcc metals were presented as the Stribeck curves. The transition from the EHL to the BL regions was determined by activation of plastic deformation in the contact spots depending mainly on the values of SFE and contact temperature. Friction of Cu and Ni was associated with deformation hardening and dynamic recovery at a relatively high contact temperature.
The AE parameters were analyzed in the transition from the EHL to the BL region. The models of contact interaction during friction in the EHL and the BL regions were proposed. The AE models clearly demonstrated the transition from one contact region to another, as well as provided a qualitative estimation of the dominant mechanisms of deformation (elastic or plastic) during friction and a correlation between the geometrical parameters in macro- and micro-scales.
A strong gradient of grain sizes during friction of four fcc metals was revealed by TEM imaging. Thermally activated processes of rearrangement and annihilation of dislocations were accelerated during friction of Cu and Ni due to relatively high values of SFE and contact temperature. Surface regions of Cu and Ni samples consisted of inhomogeneous microstructures with a wide range of grain sizes. If fairly equal ultrafine grains were observed in the cross-sectional microstructure oriented normally to the friction direction, the lamellar cross-sectional microstructure characterized the shearing in the direction parallel to the friction. Steady-state friction in the BL conditions was explained by a balance between the hardening and the dynamic recovery, which was strongly dependent on SFE and temperature. According to simplified structural models of friction in lubricated conditions, the best wear properties of fcc studied metals were determined by high hardening and a specific value of softening.
Author Contributions
A.M. studied friction and wear properties of fcc metals in lubricated conditions. V.P. evaluated the signals of acoustic emission and their connection to friction and wear. L.R analyzed the results of all experiments.
Funding
This research received no external funding.
Acknowledgments
The authors wish to gratefully thank Inna Popov for the TEM investigations.
Conflicts of Interest
The authors declare no conflict of interest.
References
- Vakis, A.; Yastrebov, V.; Scheibert, J.; Nicola, L.; Dini, D.; Minfray, C.; Almqvist, A.; Paggi, M.; Lee, S.; Limbert, G.; et al. Modeling and simulation in tribology across scales: An overview. Tribol. Int. 2018, 125, 169–199. [Google Scholar] [CrossRef]
- Rigney, D. On the mechanical properties of near-surface material in friction and wear. In Fundamental of Tribology, Proceedings of International Conference on the Fundamentals of Tribology; Suh, N., Saka, N., Eds.; The MIT Press: Cambridge, MA, USA, 1978; pp. 119–126. [Google Scholar]
- Heilmann, P.; Rigney, D. Runnig-in process affecting friction and wear. In The Running–in Process in Tribology, Proceedings 8th Leeds–Lyon Symposium on Tribology; Dowson, D., Taylor, C., Godet, M., Berthe, D., Eds.; Butterworth-Heinemann Ltd.: Oxford, UK, 1981; pp. 25–33. [Google Scholar]
- Hirth, J.; Rigney, D. Crystal plasticity and the delamination theory of wear. Wear 1976, 39, 133–141. [Google Scholar] [CrossRef]
- Hirth, J.; Rigney, D. The application of dislocation conceptions in Friction and Wear. In Dislocations in Solids; Nabarro, F., Ed.; Elsevier: Amsterdam, The Netherlands, 1983; pp. 1–54. [Google Scholar]
- Garbar, I. Structure-based selection of wear-resistant materials. Wear 1995, 181–183, 50–55. [Google Scholar] [CrossRef]
- Garbar, I. Fragmentation of low-carbon steel and copper surface layers during fatigue and adhesive wear. Wear 1986, 7, 1043–1053. [Google Scholar]
- Kulhmann-Wilsdorf, D. Dislocation concepts in friction and wear. In Fundamentals of Friction and Wear of Materials; Rigney, D., Ed.; American Society of Metals, Ohio, Metals Park: Novelty, OH, USA, 1980; pp. 119–186. [Google Scholar]
- Rapoport, L.; Rybakova, L. The influence of surface layer structure state on friction and wear processes (in Russian). Frict. Wear (Trenie i Iznos Mash) 1987, 8. part I, 888–894, part II, 1038–1043. [Google Scholar]
- Alpas, A.; Hu, H.; Zhang, J. Plastic deformation and damage accumulation below the worn surfaces. Wear 1993, 162–164, 188–195. [Google Scholar] [CrossRef]
- Rainforth, W.; Stevens, R.; Nutting, J. Deformation structures induced by sliding contact. Phylos. Mag. 1992, 66, 621–641. [Google Scholar] [CrossRef]
- Rigney, D.; Fu, X.; Hammerberg, J.; Holian, B.; Falk, M. Examples of structural evolution during sliding and shear of ductile materials. Scr. Mater. 2003, 49, 977–983. [Google Scholar] [CrossRef]
- Walker, J.; Ross, I.; Rainforth, W.; Lieblich, M. TEM characterisation of near surface deformation resulting from lubricated sliding wear of aluminium alloy and composites. Wear 2007, 263, 707–718. [Google Scholar] [CrossRef] [Green Version]
- Moshkovich, A.; Perfilyev, V.; Bendikov, T.; Lapsker, I.; Cohen, H.; Rapoport, L. Structural evolution in copper layers during sliding under different lubricant conditions. Acta Mater. 2010, 58, 4685–4692. [Google Scholar] [CrossRef]
- Meshi, L.; Samuha, S.; Cohen, S.; Laikhtman, A.; Moshkovich, A.; Perfilyev, V.; Lapsker, I.; Rapoport, L. Dislocation structure and hardness of surface layers under friction of copper in different lubricant conditions. Acta Mater. 2011, 59, 342–348. [Google Scholar] [CrossRef]
- Shockley, J.; Rauch, E.; Chromik, R.; Descartes, S. TEM microanalysis of interfacial structures after dry sliding of cold sprayed Al–Al2O3. Wear 2017, 376–377, 1411–1417. [Google Scholar] [CrossRef]
- Agribay, N.; Chandross, M.; Cheng, S.; Michael, J. Linking microstructural evolution and macroscale friction behavior in metals. J. Mater. Sci. 2017, 52, 2780–2799. [Google Scholar]
- Feltner, C.; Laird, C. Cyclic stress–strain response of FCC metals and alloys—I phenomenological experiments. Acta Metall. 1967, 15, 1621–1632. [Google Scholar] [CrossRef]
- Mughrabi, H.; Hezz, K.; Stark, X. Cyclic deformation and fatigue behaviour of α-iron mono-and-polycrystals. Int. J. Fract. 1981, 17, 193–220. [Google Scholar] [CrossRef]
- Laird, C. The applications of dislocation concepts in fatigue. In Dislocations in Solids; Nabarro, F., Ed.; Elsevier: Amsterdam, The Netherlands, 1983; pp. 55–120. [Google Scholar]
- Merkle, A.; Marks, L. A predictive analytical friction model from basic theories of interfaces, contacts and dislocations. Tribol. Lett. 2007, 26, 73–84. [Google Scholar] [CrossRef]
- M’ndange-Pfupfu, A.; Marks, L. A dislocation-based analytical model for the nanoscale processes of shear and plowing friction. Tribol. Lett. 2010, 39, 163–167. [Google Scholar] [CrossRef]
- Sun, F.; Vander Giessen, E.; Nicola, L. Plastic flattening of a sinusoidal metal surface: A discrete dislocation plasticity study. Wear 2012, 296, 672–680. [Google Scholar] [CrossRef] [Green Version]
- Gagel, J.; Weygand, D.; Gumbsch, P. Discrete dislocation dynamics simulations of dislocation transport during sliding. Acta Mater. 2018, 156, 215–227. [Google Scholar] [CrossRef]
- Kong, X.; Liu, Y.; Qiao, L. Dry sliding tribological behaviors of nanocrystalline Cu–Zn surface layer after annealing in air. Wear 2004, 256, 747–753. [Google Scholar] [CrossRef]
- Zhang, Y.; Han, Z.; Wang, K.; Lu, K. Friction and wear behaviors of nanocrystalline surface layer of pure copper. Wear 2006, 260, 942–948. [Google Scholar] [CrossRef]
- Kato, H.; Sasase, M.; Suiya, N. Friction-induced ultra-fine and nanocrystalline structures on metal surfaces in dry sliding. Tribol. Int. 2010, 43, 925–928. [Google Scholar] [CrossRef]
- Yao, B.; Han, Z.; Li, Y.; Tao, N.; Lu, K. Dry sliding tribological properties of nanostructured copper subjected to dynamic plastic deformation. Wear 2011, 271, 1609–1616. [Google Scholar] [CrossRef]
- Moshkovich, A.; Perfilyev, V.; Gorni, D.; Lapsker, I.; Rapoport, L. The effect of Cu grain size on transition from EHL to BL regime (Stribeck curve). Wear 2011, 271, 1726–1732. [Google Scholar] [CrossRef]
- Wasekar, N.; Haridoss, P.; Seshadri, S.; Sundararajan, G. Sliding wear behavior of nanocrystalline nickel coatings: Influence of grain size. Wear 2012, 296, 536–546. [Google Scholar] [CrossRef]
- Filippov, A.; Tarasov, S.; Fortuna, S.; Podgornykh, O.; Shamarin, N.; Rubtsov, V. Microstructural, mechanical and acoustic emission-assisted wear characterization of equal channel angular pressed (ECAP) low stacking fault energy brass. Tribol. Int. 2018, 123, 273–285. [Google Scholar] [CrossRef]
- Figueroa, C.; Schouwenaars, R.; Cortés-Péreza, J.; Petrov, R.; Kestens, L. Ultrafine gradient microstructure induced by severe plastic deformation under sliding contact conditions in copper. Mater. Charact. 2018, 138, 263–273. [Google Scholar] [CrossRef]
- Valiev, R.; Estrin, Y.; Horita, Z.; Langdon, T.; Zechetbauer, M.; Zhu, Y. Producing bulk ultrafine-grained materials by severe plastic deformation. JOM 2006, 58, 33–39. [Google Scholar] [CrossRef] [Green Version]
- Valiev, R.; Islamgaliev, R.; Alexandrov, I. Bulk nanostructured materials from severe plastic deformation. Prog. Mater. Sci. 2000, 45, 103–189. [Google Scholar] [CrossRef]
- Zhilyaev, A.; Langdon, T. Using high-pressure torsion for metal processing: Fundamentals and applications. Prog. Mater. Sci. 2008, 53, 893–979. [Google Scholar] [CrossRef]
- Edalati, K.; Horita, Z. High pressure torsion of pure metals: Influence of atomic bond parameters and stacking fault energy of grain size and correlation with hardness. Acta Mater. 2011, 59, 6831–6836. [Google Scholar] [CrossRef]
- Mishra, A.; Kad, B.; Gregori, F.; Meyers, M. Microstructural evolution in copper subjected to severe plastic deformation: Experiments and analysis. Acta Mater. 2007, 55, 13–28. [Google Scholar] [CrossRef]
- Gubicza, J.; Chinh, N.; Csanadi, T.; Langdon, T.; Ungar, T. Microstructure and strength of severely deformed fcc metals. Mater. Sci. Eng. 2007, A462, 86–90. [Google Scholar] [CrossRef]
- Brown, T.; Saldana, C.; Murthy, T.; Mann, J.; Guo, Y.; Allard, L.; King, A.; Compton, W.; Trumble, K.; Chandrasekar, S. A study of the interactive effects of strain, strain rate and temperature in severe plastic deformation of copper. Acta Mater. 2009, 57, 5491–5500. [Google Scholar] [CrossRef]
- Mei, Q.; Tsuchiya, K.; Gao, H. Different stages in the continuous microstructural evolution of copper deformed to ultrahigh plastic strains. Scr. Mater. 2012, 67, 1003–1006. [Google Scholar] [CrossRef]
- Starink, M.; Qiao, X.; Zhang, J.; Gao, N. Predicting grain refinement by cold severe plastic deformation in alloys using volume averaged dislocation generation. Acta Mater. 2009, 57, 5796–5811. [Google Scholar] [CrossRef] [Green Version]
- Zhang, P.; An, X.; Zhang, Z.; Wu, S.; Li, S.; Zhang, Z.; Figueiredo, R.; Gao, N.; Langdon, T. Optimizing strength and ductility of Cu–Zn alloys through severe plastic deformation. Scr. Mater. 2012, 67, 871–874. [Google Scholar] [CrossRef]
- Franklin, F.; Widiyart, I.; Kapoor, A. Computer simulation of wear and rolling contact fatigue. Wear 2001, 251, 949–955. [Google Scholar] [CrossRef]
- Widiyarta, I.; Franklin, F.; Kapoor, A. Modelling thermal effects in ratcheting-led wear and rolling contact fatigue. Wear 2008, 265, 1325–1331. [Google Scholar] [CrossRef]
- Bohera, C.; Barrau, O.; Gras, R.; Rezai-Aria, F. A wear model based on cumulative cyclic plastic straining. Wear 2009, 267, 1087–1094. [Google Scholar] [CrossRef] [Green Version]
- Bhagwat, P.; Sista, B.; Vemaganti, K. A Computational study of the effects of strain hardening in micro-asperity friction models. Tribol. Lett. 2017, 65, 154. [Google Scholar] [CrossRef]
- Archard, J. Elastic deformation and the laws of friction. Proc. R. Soc. Lond. Ser. A 1957, 243, 190–205. [Google Scholar]
- Johnson, K.L.; Greenwood, J.; Higginson, J. The contact of elastic regular wavy surfaces. Int. J. Mech. Sci. 1985, 27, 383–396. [Google Scholar] [CrossRef]
- Chang, W.; Etsion, I.; Bogy, D. An elastic–plastic model for the contact of rough surfaces. ASME J. Tribol. 1987, 109, 257–263. [Google Scholar] [CrossRef]
- Majumdar, A.; Bhushan, B. Fractal model of elastic–plastic contact between rough surfaces. ASME J. Tribol. 1991, 113, 1–11. [Google Scholar] [CrossRef]
- Kogut, L.; Etsion, I. A finite element based elastic–plastic model for the contact of rough surfaces. Tribol. Trans. 2003, 46, 383–390. [Google Scholar] [CrossRef]
- Jackson, R.; Green, I. A statistical model of elasto-plastic asperity contact between rough surfaces. Tribol. Int. 2006, 39, 906–914. [Google Scholar] [CrossRef]
- Jackson, R.; Streator, J. A multi-scale model for contact between rough surfaces. Wear 2006, 261, 1337–1347. [Google Scholar] [CrossRef]
- Kragelsky, I. Friction and Wear; Butterworths: London, UK, 1965. [Google Scholar]
- Persson, B. Sliding Friction; Springer: Berlin, Germany, 2000. [Google Scholar]
- Rapoport, L. Steady friction state and contact models of asperity interaction. Wear 2009, 267, 1305–1310. [Google Scholar] [CrossRef]
- Lim, S.; Ashby, M. Wear-mechanism maps. Acta Metall. 1987, 35, 1–24. [Google Scholar] [CrossRef]
- Ashby, M.; Lim, S. Wear-mechanism maps. Scripta Metall. 1990, 24, 805–810. [Google Scholar] [CrossRef]
- Williams, J. Wear modeling: Analytical, computational and mapping: A continuum mechanics approach. Wear 1999, 225, 1–17. [Google Scholar] [CrossRef]
- Williams, J. Wear and wear particles—some fundamentals. Tribol. Int. 2005, 38, 863–870. [Google Scholar] [CrossRef]
- Rapoport, L. The competing wear mechanisms and wear maps for steels. Wear 1995, 181–183, 280–289. [Google Scholar] [CrossRef]
- Larsson, R. Modelling the effect of surface roughness on lubrication in all regimes. Tribol. Int. 2009, 42, 512–516. [Google Scholar] [CrossRef]
- Bonaventure, J.; Cayer-Barrioz, J.; Mazuyer, D. Transition between mixed lubrication and elastohydrodynamic lubrication with randomly rough surfaces. Tribol. Lett. 2016, 64, 44. [Google Scholar] [CrossRef]
- Wang, W.; Liu, K.; Jiao, M. Thermal and non-Newtonian analysis on mixed liquid–solid lubrication. Tribol. Int. 2007, 40, 1067–1074. [Google Scholar] [CrossRef]
- Wang, W.; Chen, H.; Hu, Y.; Wang, H. Effect of surface roughness parameters on mixed lubrication characteristics. Tribol. Int. 2006, 39, 522–527. [Google Scholar] [CrossRef]
- Faraon, C.; Schipper, D. Stribeck curve for starved line contacts. J. Tribol. 2007, 129, 181–187. [Google Scholar] [CrossRef]
- Akbarzadeh, S.; Khonsari, M. Effect of surface pattern on Stribeck curve. Tribol. Lett. 2010, 37, 477–486. [Google Scholar] [CrossRef]
- Moshkovich, A.; Perfilyev, V.; Meshi, L.; Samuha, S.; Cohen, S.; Cohen, H.; Laikhtman, A.; Rapoport, L. Friction, wear and structure of Cu samples in the lubricated steady friction state. Tribol. Int. 2012, 46, 154–160. [Google Scholar] [CrossRef]
- Moshkovich, A.; Lapsker, I.; Laikhtman, A.; Perfilyev, V.; Rapoport, L. The failure and damage mechanisms under friction of copper in the EHL and mixed EHL regions. Tribol. Lett. 2013, 51, 57–64. [Google Scholar] [CrossRef]
- Moshkovich, A.; Perfilyev, V.; Lapsker, I.; Feldman, Y.; Rapoport, L. Study of the transition from EHL to BL regions under friction of Ag and Ni. I. Analysis of acoustic emission. Tribol. Int. 2017, 113, 189–196. [Google Scholar] [CrossRef]
- Moshkovich, A.; Lapsker, I.; Feldman, Y.; Rapoport, L. Severe plastic deformation of four FCC metals during friction under lubricated conditions. Wear 2017, 386–387, 49–57. [Google Scholar] [CrossRef]
- Popov, I.; Moshkovich, A.; Cohen, S.; Perfilyev, V.; Vakahy, A.; Rapoport, L. Microstructure and nanohardness of Ag and Ni under friction in boundary lubrication. Wear 2018, 404–405, 62–70. [Google Scholar] [CrossRef]
- Popov, I.; Moshkovich, A.; Bendikov, T.; Rapoport, L. Deformation microstructure and chemical composition of surface layers of Cu and Al under friction in lubricated conditions. Tribol. Lett. 2018, 66, 78. [Google Scholar] [CrossRef]
- Murr, L.E. Interfacial Phenomena in Metals and Alloys; Addison-Wesley: Boston, MA, USA, 1975. [Google Scholar]
- Gallagher, P. The influence of alloying, temperature and related effects on the stacking fault energy. Metall. Trans. 1970, 1, 2429–2461. [Google Scholar]
- An, X.; Wu, S.; Zhang, Z.; Figueiredo, R.; Gao, N.; Langdon, T. Evolution of microstructural homogeneity in copper processed by high-pressure torsion. Scr. Mater. 2010, 63, 560–563. [Google Scholar] [CrossRef]
- Kaschner, G.; Gibeling, J. Evolution of dislocation glide kinetics during cyclic deformation of copper. Acta Mater. 2002, 50, 653–662. [Google Scholar] [CrossRef]
- Hong, S. Cyclic stress-strain response and slip mode modification in fatigue of FCC solid solutions. Scr. Mater. 2001, 44, 995–1001. [Google Scholar] [CrossRef]
- Wang, Y.; Lapovok, R.; Wang, J.; Qi, Y.; Estrin, Y. Thermal behavior of copper processed by ECAP with and without back pressure. Mater. Sci. Eng. A 2015, 628, 21–29. [Google Scholar] [CrossRef]
- Akchurin, A.; Bosman, R.; Lugt, P.; Van Drogen, M. Analysis of wear particles formed in boundary-lubricated sliding contacts. Tribol. Lett. 2016, 63, 16–30. [Google Scholar] [CrossRef]
Figure 1.
The Stribeck curves in the transition from the elasto-hydrodynamic lubrication (EHL) to the boundary lubrication (BL) region for the studied metals. The insert demonstrates the details of the friction behavior at the maximal load in the BL region (the explanation is below). On the X-axis, η is viscosity, V is sliding velocity, and P is contact pressure.

Figure 2.
Roughness parameter Ra after friction of Ag (a) and Ni (b).


Figure 3.
The effect of the non-dimensional SFE parameter, γ/bG, on the wear coefficient.

Figure 4.
The effect of the steady-state grain size, ds (XRD), on the wear coefficient.

Figure 5.
The interaction between the grain size of the studied metals after friction in the BL region and SFE.
Figure 5.
The interaction between the grain size of the studied metals after friction in the BL region and SFE.

Figure 6.
The acoustic emissions (AE) under EHL (a,b) and BL (c,d) friction regions for Ag (a,c) and Ni (b,d).
Figure 6.
The acoustic emissions (AE) under EHL (a,b) and BL (c,d) friction regions for Ag (a,c) and Ni (b,d).

Figure 7.
(a) The AE waveforms after friction of Ni in the mixed lubrication (ML) region (n = 300 rpm, N = 1710 N) and (b) the transition to the EHL region (n = 800 rpm, N = 1710 N).
Figure 7.
(a) The AE waveforms after friction of Ni in the mixed lubrication (ML) region (n = 300 rpm, N = 1710 N) and (b) the transition to the EHL region (n = 800 rpm, N = 1710 N).

Figure 8.
Cross-sectional TEM images of top surface layers of Ag (a), Cu (b), Ni (c), and Al (d) after friction. Directions of friction for Ag and iron wear particles in surface layers of Al are shown by arrows.
Figure 8.
Cross-sectional TEM images of top surface layers of Ag (a), Cu (b), Ni (c), and Al (d) after friction. Directions of friction for Ag and iron wear particles in surface layers of Al are shown by arrows.


Figure 9.
Frequency distribution of grain sizes in the depth of 500 nm for Ag (a) and Ni (b) after friction in the BL region.
Figure 9.
Frequency distribution of grain sizes in the depth of 500 nm for Ag (a) and Ni (b) after friction in the BL region.

Figure 10.
Cross-sectional TEM images demonstrate the transitions from practically equiaxial to lamellar microstructure of Ag (a) and from the inhomogeneous to the lamellar microstructure of Ni (b). Direction of friction is indicated by the arrow.
Figure 10.
Cross-sectional TEM images demonstrate the transitions from practically equiaxial to lamellar microstructure of Ag (a) and from the inhomogeneous to the lamellar microstructure of Ni (b). Direction of friction is indicated by the arrow.

Figure 11.
TEM images of cross-sectional microstructure of Ag oriented normally (a) and parallel (b) to the friction direction.
Figure 11.
TEM images of cross-sectional microstructure of Ag oriented normally (a) and parallel (b) to the friction direction.

Figure 12.
Cross-sectional TEM images of damage development after friction of Ag (a) and Ni (b).

Figure 13.
SEM images of damaged surfaces of Ag (a) and Cu (b) after friction in the BL region [71].
Figure 13.
SEM images of damaged surfaces of Ag (a) and Cu (b) after friction in the BL region [71].

Figure 14.
The macroscale model of the EHL region and the corresponding waveform.

Figure 15.
Macroscale model of the BL region and the corresponding waveform under friction of Ag.

Figure 16.
Model of the BL region and the corresponding AE waveform under friction of Ni.


Table 1.
Ra parameters of the studied metals after friction in the BL region at maximal load.
| Material | Ag | Ni | Cu | Al |
|---|---|---|---|---|
| Ra, μm | 0.145 ± 0.025 | 0.413 ± 0.025 | 0.6 ± 0.2 | 0.27 ± 0.11 |
Table 2.
The values of stacking fault energy (SFE), maximal values of load (N) in the BL region, the coefficient of friction (CoF), the wear coefficient of pin (k), the hardness after friction (Hs), the average grain size (d), and the homological temperature (Tavr/Tm). Wear coefficient is k = W × H, where W is wear loss (mm3/Nm) and H is hardness after friction.
| SFE, γ mJ/m2 [74,75] | Load, N | CoF | Wear coefficient, k | Hardness, Hs, GPa | Grain size, d, nm, XRD | Tavr/Tm | |
|---|---|---|---|---|---|---|---|
| Al | 166 | 194 ± 34 | 0.16 ± 0.02 | 1.05 × 10⁻⁶ | 0.28 ± 0.03 | 440 ± 75 | 0.36 |
| Ag | 16 | 223 ± 23 | 0.1 ± 0.02 | 7.05 × 10⁻⁷ | 0.78 ± 0.12 | 33 ± 3 | 0.26 |
| Cu | 45 | 1273 ± 57 | 0.09 ± 0.01 | 2.99 × 10⁻⁷ | 1.5 ± 0.2 | 63 ± 1 | 0.28 |
| Ni | 125 | 1820 ± 200 | 0.08 ± 0.02 | 1.88 × 10⁻⁸ | 2.63 ± 0.25 | 140 ± 3 | 0.31 |
© 2019 by the authors. Licensee MDPI, Basel, Switzerland. This article is an open access article distributed under the terms and conditions of the Creative Commons Attribution (CC BY) license (http://creativecommons.org/licenses/by/4.0/).
Share and Cite
MDPI and ACS Style
Moshkovich, A.; Perfilyev, V.; Rapoport, L. Effect of Plastic Deformation and Damage Development during Friction of fcc Metals in the Conditions of Boundary Lubrication. Lubricants 2019, 7, 45. https://doi.org/10.3390/lubricants7050045
AMA Style
Moshkovich A, Perfilyev V, Rapoport L. Effect of Plastic Deformation and Damage Development during Friction of fcc Metals in the Conditions of Boundary Lubrication. Lubricants. 2019; 7(5):45. https://doi.org/10.3390/lubricants7050045
Chicago/Turabian StyleMoshkovich, Alexey, Vladislav Perfilyev, and Lev Rapoport. 2019. "Effect of Plastic Deformation and Damage Development during Friction of fcc Metals in the Conditions of Boundary Lubrication" Lubricants 7, no. 5: 45. https://doi.org/10.3390/lubricants7050045
Note that from the first issue of 2016, this journal uses article numbers instead of page numbers. See further details here.