Influence of Test Stand and Contact Size Sensitivity on the Friction Coefficient in Sheet Metal Forming


Institute for Production Engineering and Forming Machines, Technische Universität Darmstadt, Otto-Berndt-Str. 2, 64287 Darmstadt, Germany
*
Author to whom correspondence should be addressed.
Lubricants 2018, 6(2), 41; https://doi.org/10.3390/lubricants6020041
Submission received: 6 April 2018
/
Revised: 23 April 2018
/
Accepted: 24 April 2018
/
Published: 27 April 2018
(This article belongs to the Special Issue Tribology in Metal Forming)
Abstract
:The precise knowledge of frictional behavior is highly relevant for accurate modelling in sheet metal forming simulations. This allows e.g., the precise prediction of restraining forces which, in turn, determines an optimal draw bead strategy and blank-texture-development for automotive components. As a result, tryout loops can be avoided and thus production costs can be reduced. Nevertheless, the benefit of this detailed friction description is often ignored by the use of a constant friction coefficient. Finding a practical solution has motivated numerous research projects in recent decades. In this context, many efforts have been made to develop test stands to gain a better understanding of friction and to determine load-dependent friction coefficients for simulations. However, different test stands for friction investigation show a big quantitative difference in friction value which makes the direct use of the values in finite element simulation questionable. Therefore, the focus of this paper is to compare two different common strip drawing tests and detect the sources of deviation. In particular, the influence of the contact area between tool and blank is investigated. The results indicate that while the effect of the different test stands is negligible, a high dependency of the friction coefficient on the contact area was shown. This phenomenon is caused by macroscopic lubricant distribution over the contact area, which varies according to the size of the tools. The results show a potential field of research in categorizing different friction test stands and resolving the issue of quantitative non-comparable coefficients of friction.
1. Introduction
Sheet metal forming and particularly deep drawing operations are widely used in manufacturing process chains, as for example in the automotive industry. The process is characterized by high efficiency and excellent surface quality of the deep drawn part. Due to high competition in the industrial field of sheet metal forming and the increasing demand for more challenging product geometries, process windows are getting narrower. Given the fact that friction is a key parameter for the robustness of the deep drawing process [1], the tribological behavior in the forming process must be fully understood and implemented in Finite-Element (FE)-supported tool development. However, the most common constant coefficient of friction (COF) is used and serves often as an additional fitting parameter between numerical simulation and experiment, resulting in a variation of the COF from 0.05 [2] to 0.15 [3]. To integrate more realistic, non-constant friction models into the forming simulation, several approaches have been adopted to provide the describing data. A new approach is to determine the COF on the microscopic scale in numerical simulations by modelling the tool and workpiece surface as a solid and the lubricant as a fluid [4]. In a further step, the mutual influence between the contact partners during relative movement is simulated and as a result the COF can be calculated. However, it still needs several input variables such as a three-dimensional tool and blank surface measurements, determination of the material properties of the tool and a blank in the surface near the area, analyses of the lubricant viscosity and friction tests for calibration [5]. On the one hand, the COF can be calculated load-dependently without any additional financial expenditure. On the other, there is a high expenditure for FE software, measuring equipment and employee training. At the same time, statistical (experimental) surveys are necessary to identify deviating surface profiles.
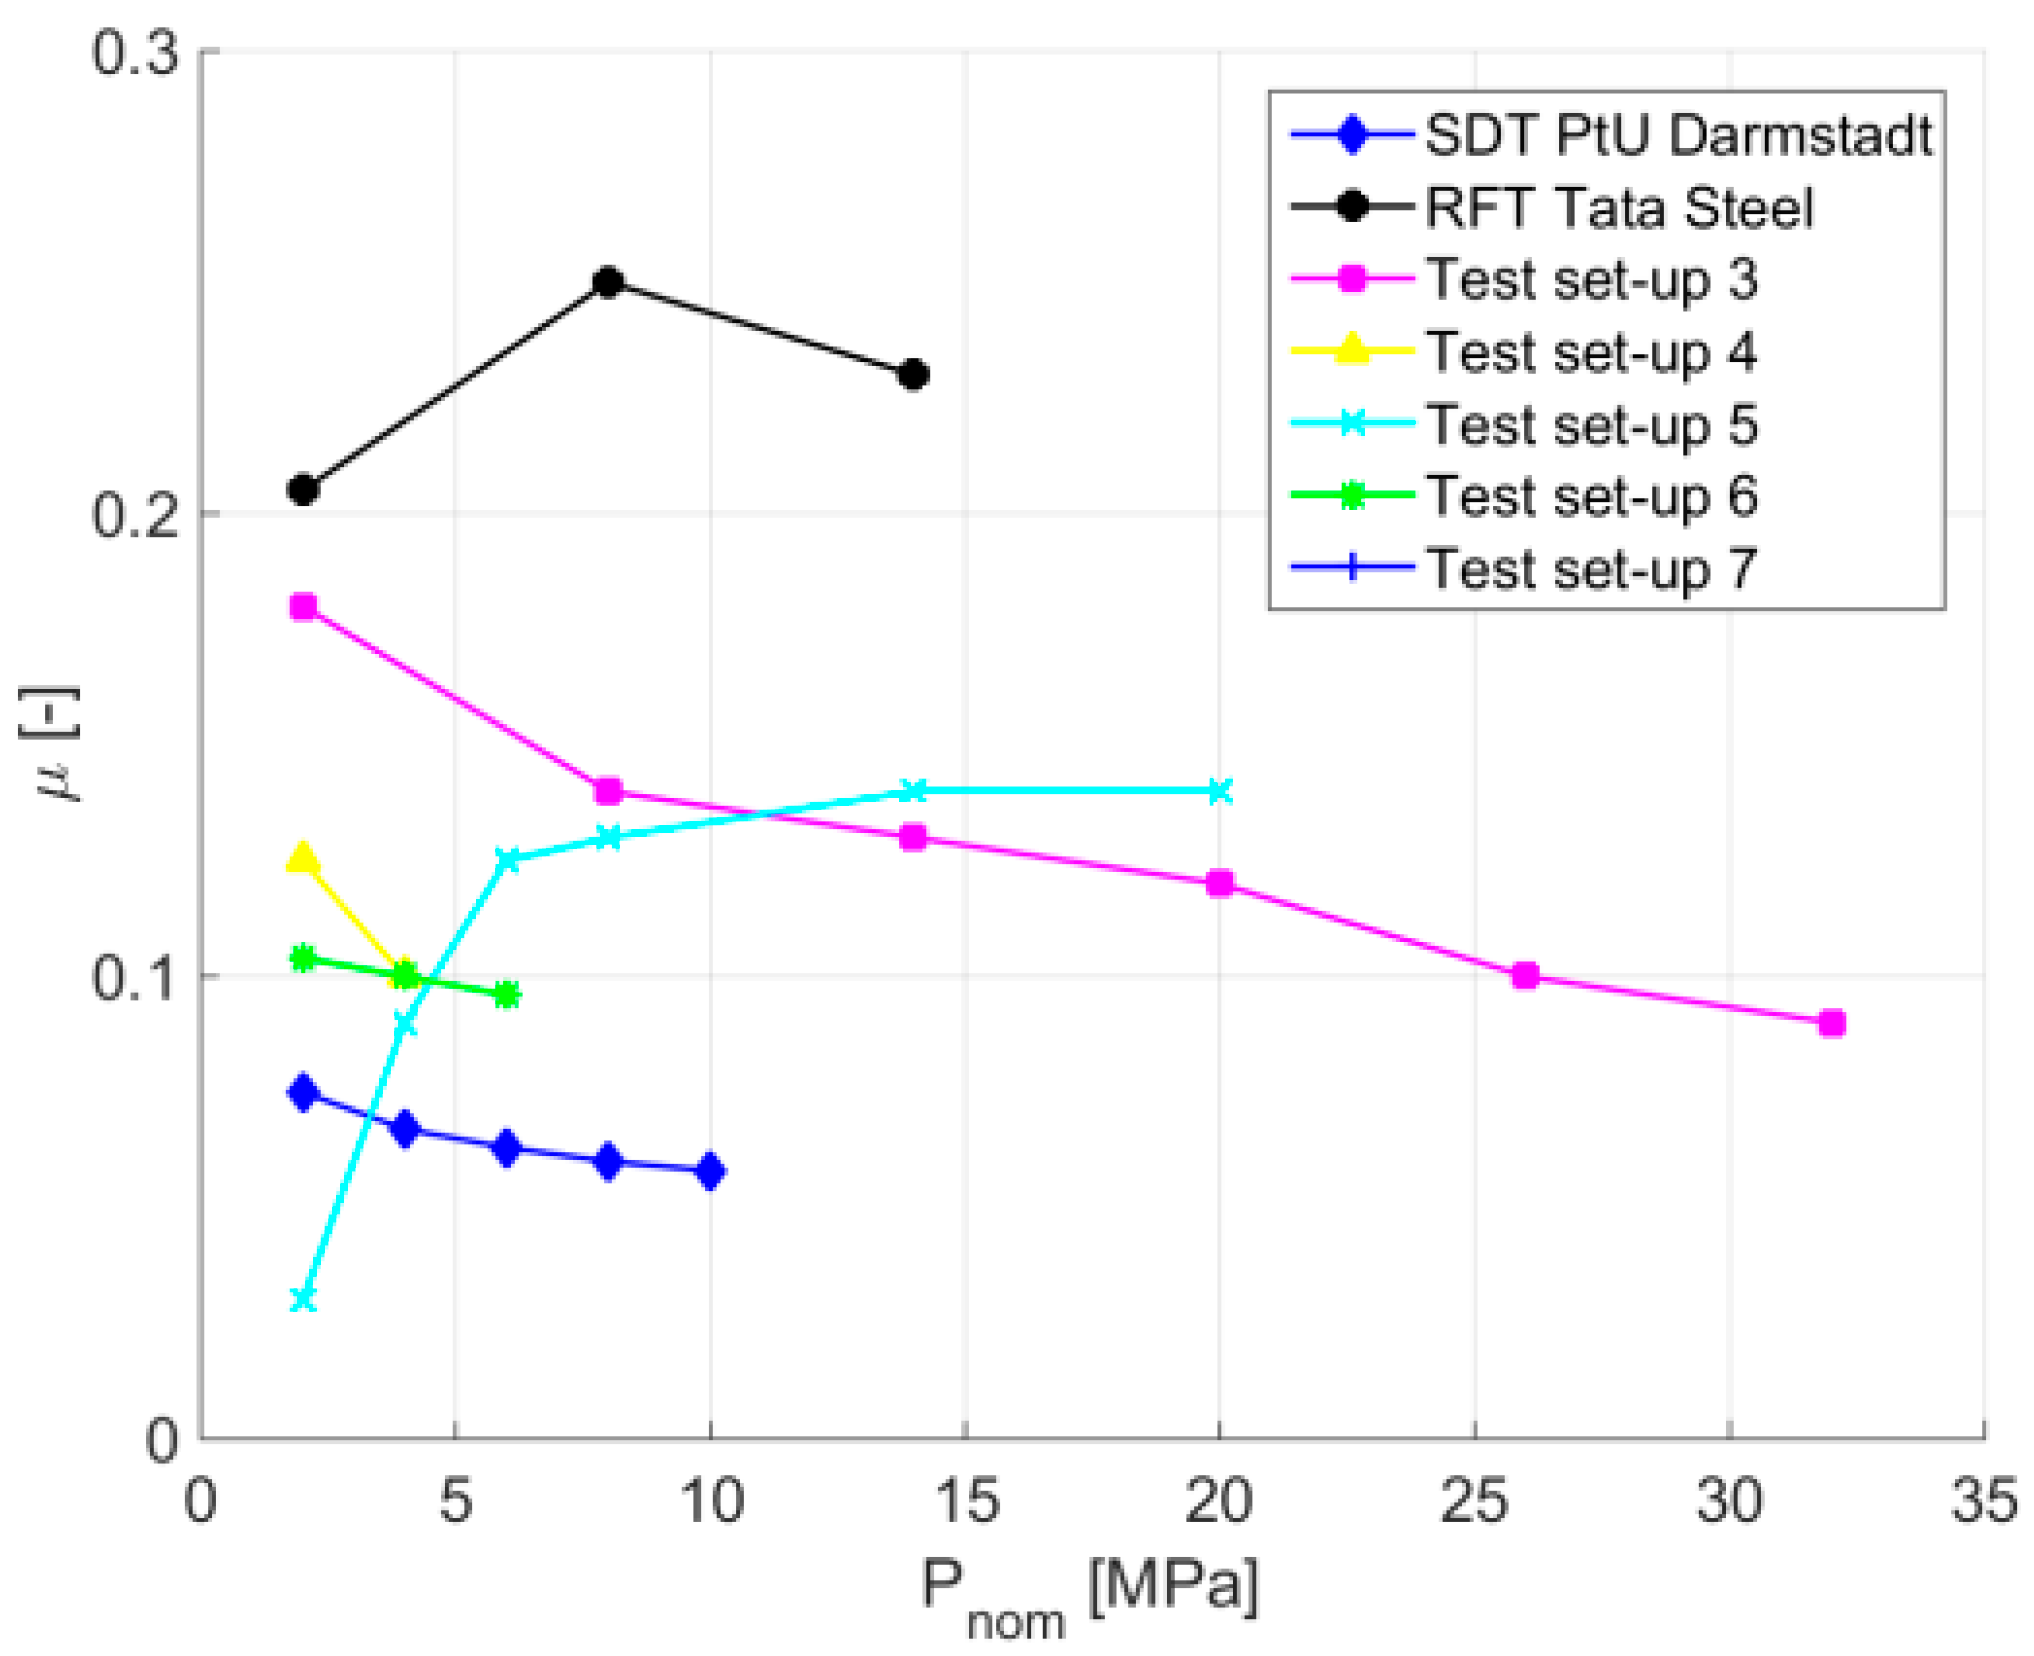
Another more application-oriented approach is to determine the COF experimentally by several friction test stands, where parameters such as velocity, temperature and contact pressure can be adjusted [6,7,8]. Furthermore, the results can be used to fit an analytical friction law. For this purpose, the most important parameters affecting friction must be defined. According to Zoeller and Ludwig, the significant parameters influencing friction in sheet metal forming are contact pressure [9,10], relative velocity, surface texture, lubricant amount, lubricant viscosity, temperature, and sliding distance [11]. The advantage of this experimental approach is the direct use of the measured data. The principle is based on the assumption that the dependence of the laboratory measurement results and the chosen test stand is negligible. In a past study, six friction test stands, which are widely used in the industrial and academic field, were compared in a round-robin test [12] (see Figure 1). To eliminate fluctuations based on variation of material properties, the same tribological system, consisting of lubricant, tool, and sheet material, was used in every test. Nevertheless, the results for the friction coefficient over the contact normal pressure deviate not only quantitatively, but also in the course of the curve.
Since all test stands are used to evaluate tribological behavior, two reasons for the deviation are controversially discussed. Firstly, the test stands are characterized by a different stiffness. Therefore, variations in the contact pressure distribution are present. Secondly, the contact area of each test stand was different. The effect of a significantly reduced contact area on the friction coefficient is already known for microforming [13]. Gou analyzed the size effect by comparing lubricated and non-lubricated specimens and determining the friction coefficient. Since the change in friction coefficient only occurred for lubricated specimens, hydrostatic and hydrodynamic fluid effects could be responsible for this phenomenon [14]. Emmens analyzed the effect of different contact areas on the friction coefficient, using a vertical strip drawing test [15]. He showed that the contact area and, in particular, the tool length has a high influence on the friction coefficient. Its value varied between 0.02 and 0.1 for the different contact areas. However, since the amount of lubricant (11–16 g/m2) does not represent the state of the art, a knowledge transfer into the industrial application is limited. Furthermore, a rather small contact area was investigated (2500 mm2). Therefore, the results are more sensitive towards misalignment and elastic deformation of the tools than investigations with higher contact areas.
The previously mentioned publications showed an influence of contact area and test stand design on the value of the friction coefficient. Therefore, the focus of this paper is to investigate the effect of different test stands on the coefficient of friction and give plausible explanations for the observed effect. Two influencing parameters are identified, i.e., contact area and test stand rigidity. In experiments the results of two different test stands are compared with each other, using the same tribological system and the same contact areas. Moreover, the contact area of one test stand was varied to investigate the effect of tool size in an isolated way.
2. Experimental Setup
The experimental setups of both test devices are based on a strip drawing test. Thus, the friction coefficient is calculated by division of friction and normal force. The lubricated blank is positioned between the upper and the lower tool. After applying a defined normal contact pressure, the strip is pulled by a gripper. During the process the friction forces are recorded by force transducers.
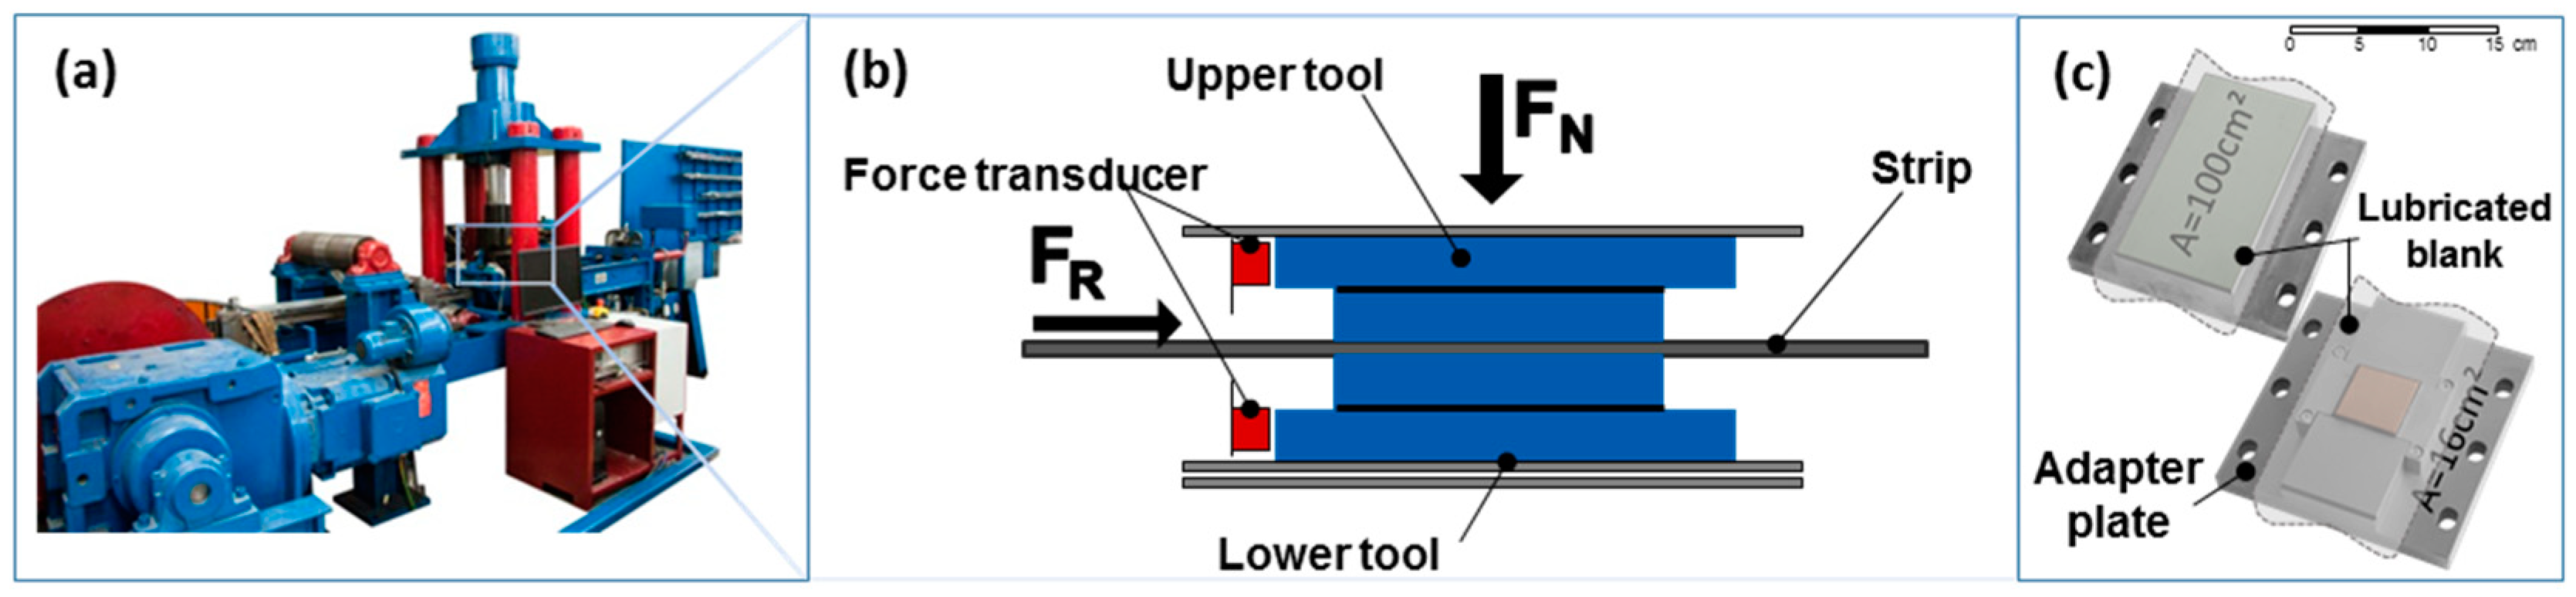
Besides the testing procedure also the design of the testing area is comparable. The tools are supported by four pillars and the contact normal force is applied by a hydraulic cylinder. A picture of the strip drawing test according to VDA standard [15] and the schematic figure of the testing principle as well as the investigated area is shown in Figure 2. To examine the effect of different contact variables on the same test stand without any variation of tool material, an adapter plate is used. With this, the tool of the minimized strip draw test can be used on the VDA-standardized strip draw test.
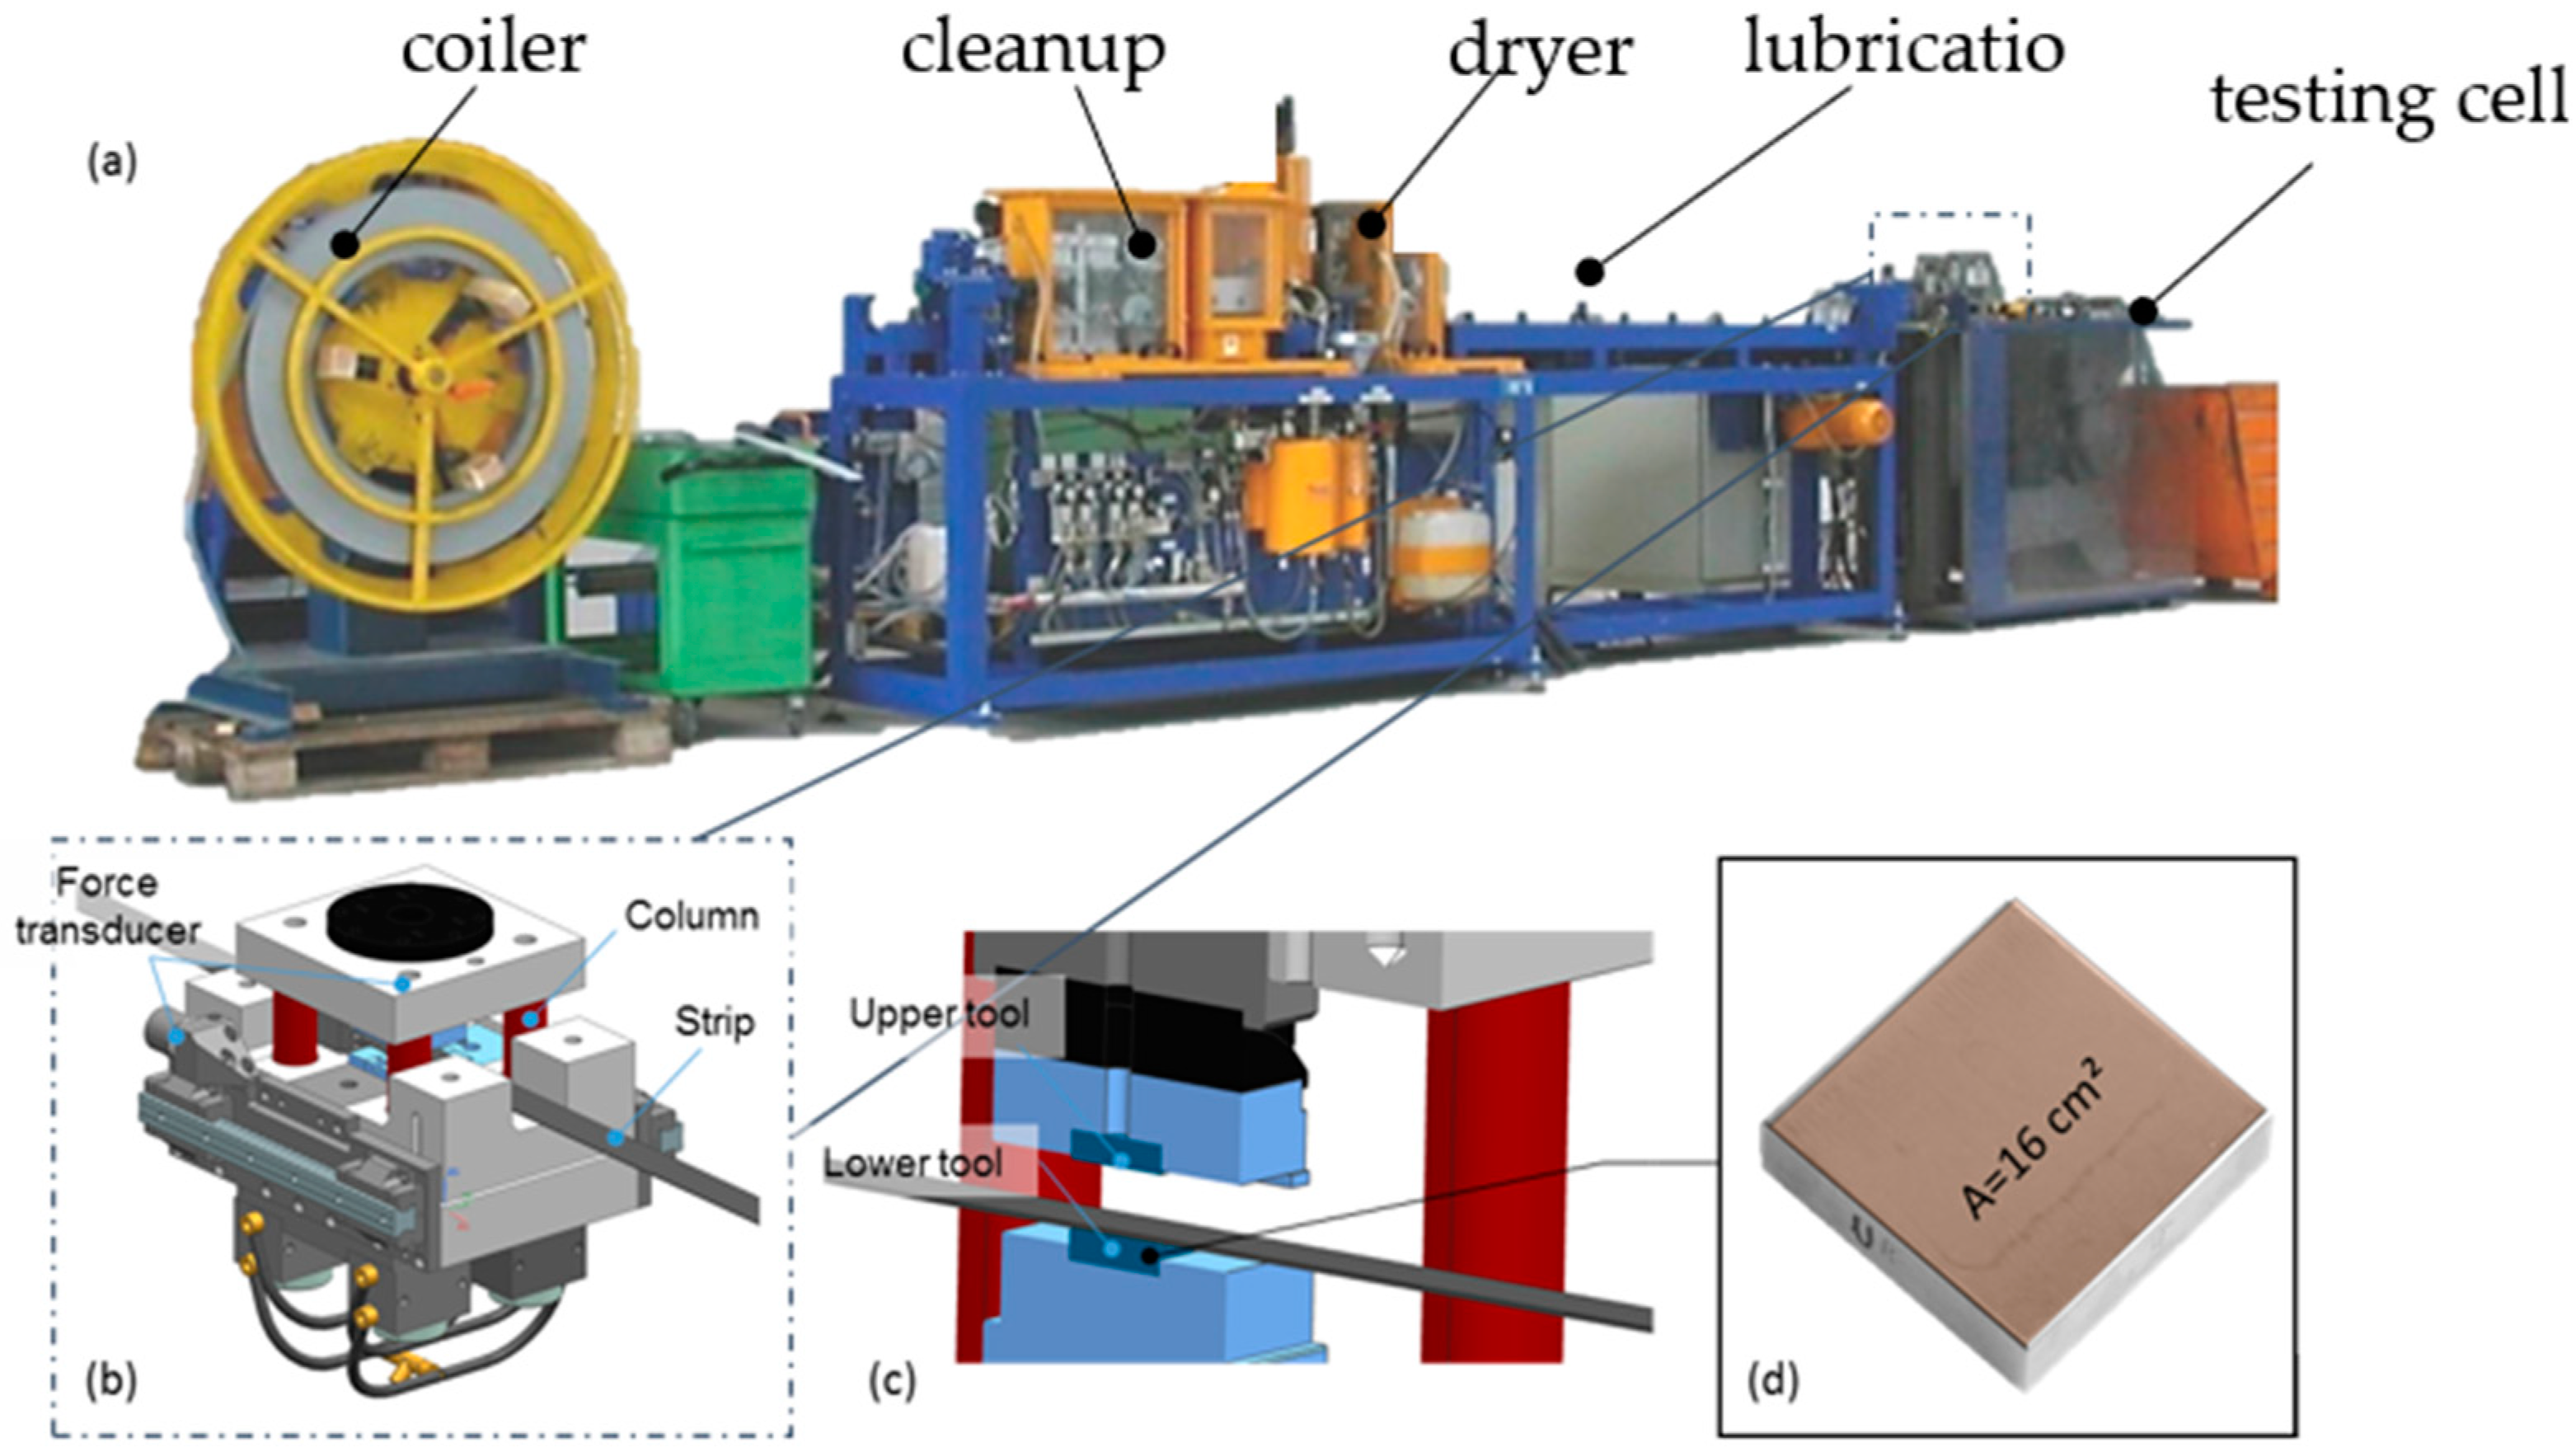
Figure 3 shows the minimized strip drawing test with a detailed look at the testing cell and the investigated contact area.
The main difference between both test stands is the different nominal contact area and the rigidity of the loading device. Since the testing cell is smaller and the four columns are thinner a different elastic deformation will occur. A low rigidity causes nonuniform pressure distribution in the contact zone for higher contact normal pressures. Changing the contact area, can have an influence on the lubrication conditions during the test. Therefore, both factors have the potential to trigger a variation in friction coefficient. Table 1 shows the experimental plan and the variation of the influencing variables.
Experimental Procedure
The blank strips are lubricated with a spray lubrication device. The lubricant amount is controlled gravimetrically and by means of a lubrication measurement device (LUBRI-Mini). The measuring principle is presented in chapter four of this paper. For that reason, a homogeneous lubrication over the whole blank strip can be guaranteed. In the next step the strips are processed. The time between lubrication and processing is fixed to a maximum of 24 h to prevent macroscopic lubricant pockets. The first five strokes for every contact size are not evaluated, to prevent unsteady conditions. After the first strokes the tools are saturated and steady state is reached, so no intermediate cleaning of the tools was performed between the single strokes. The experiments have been repeated three times.
3. Experimental Results
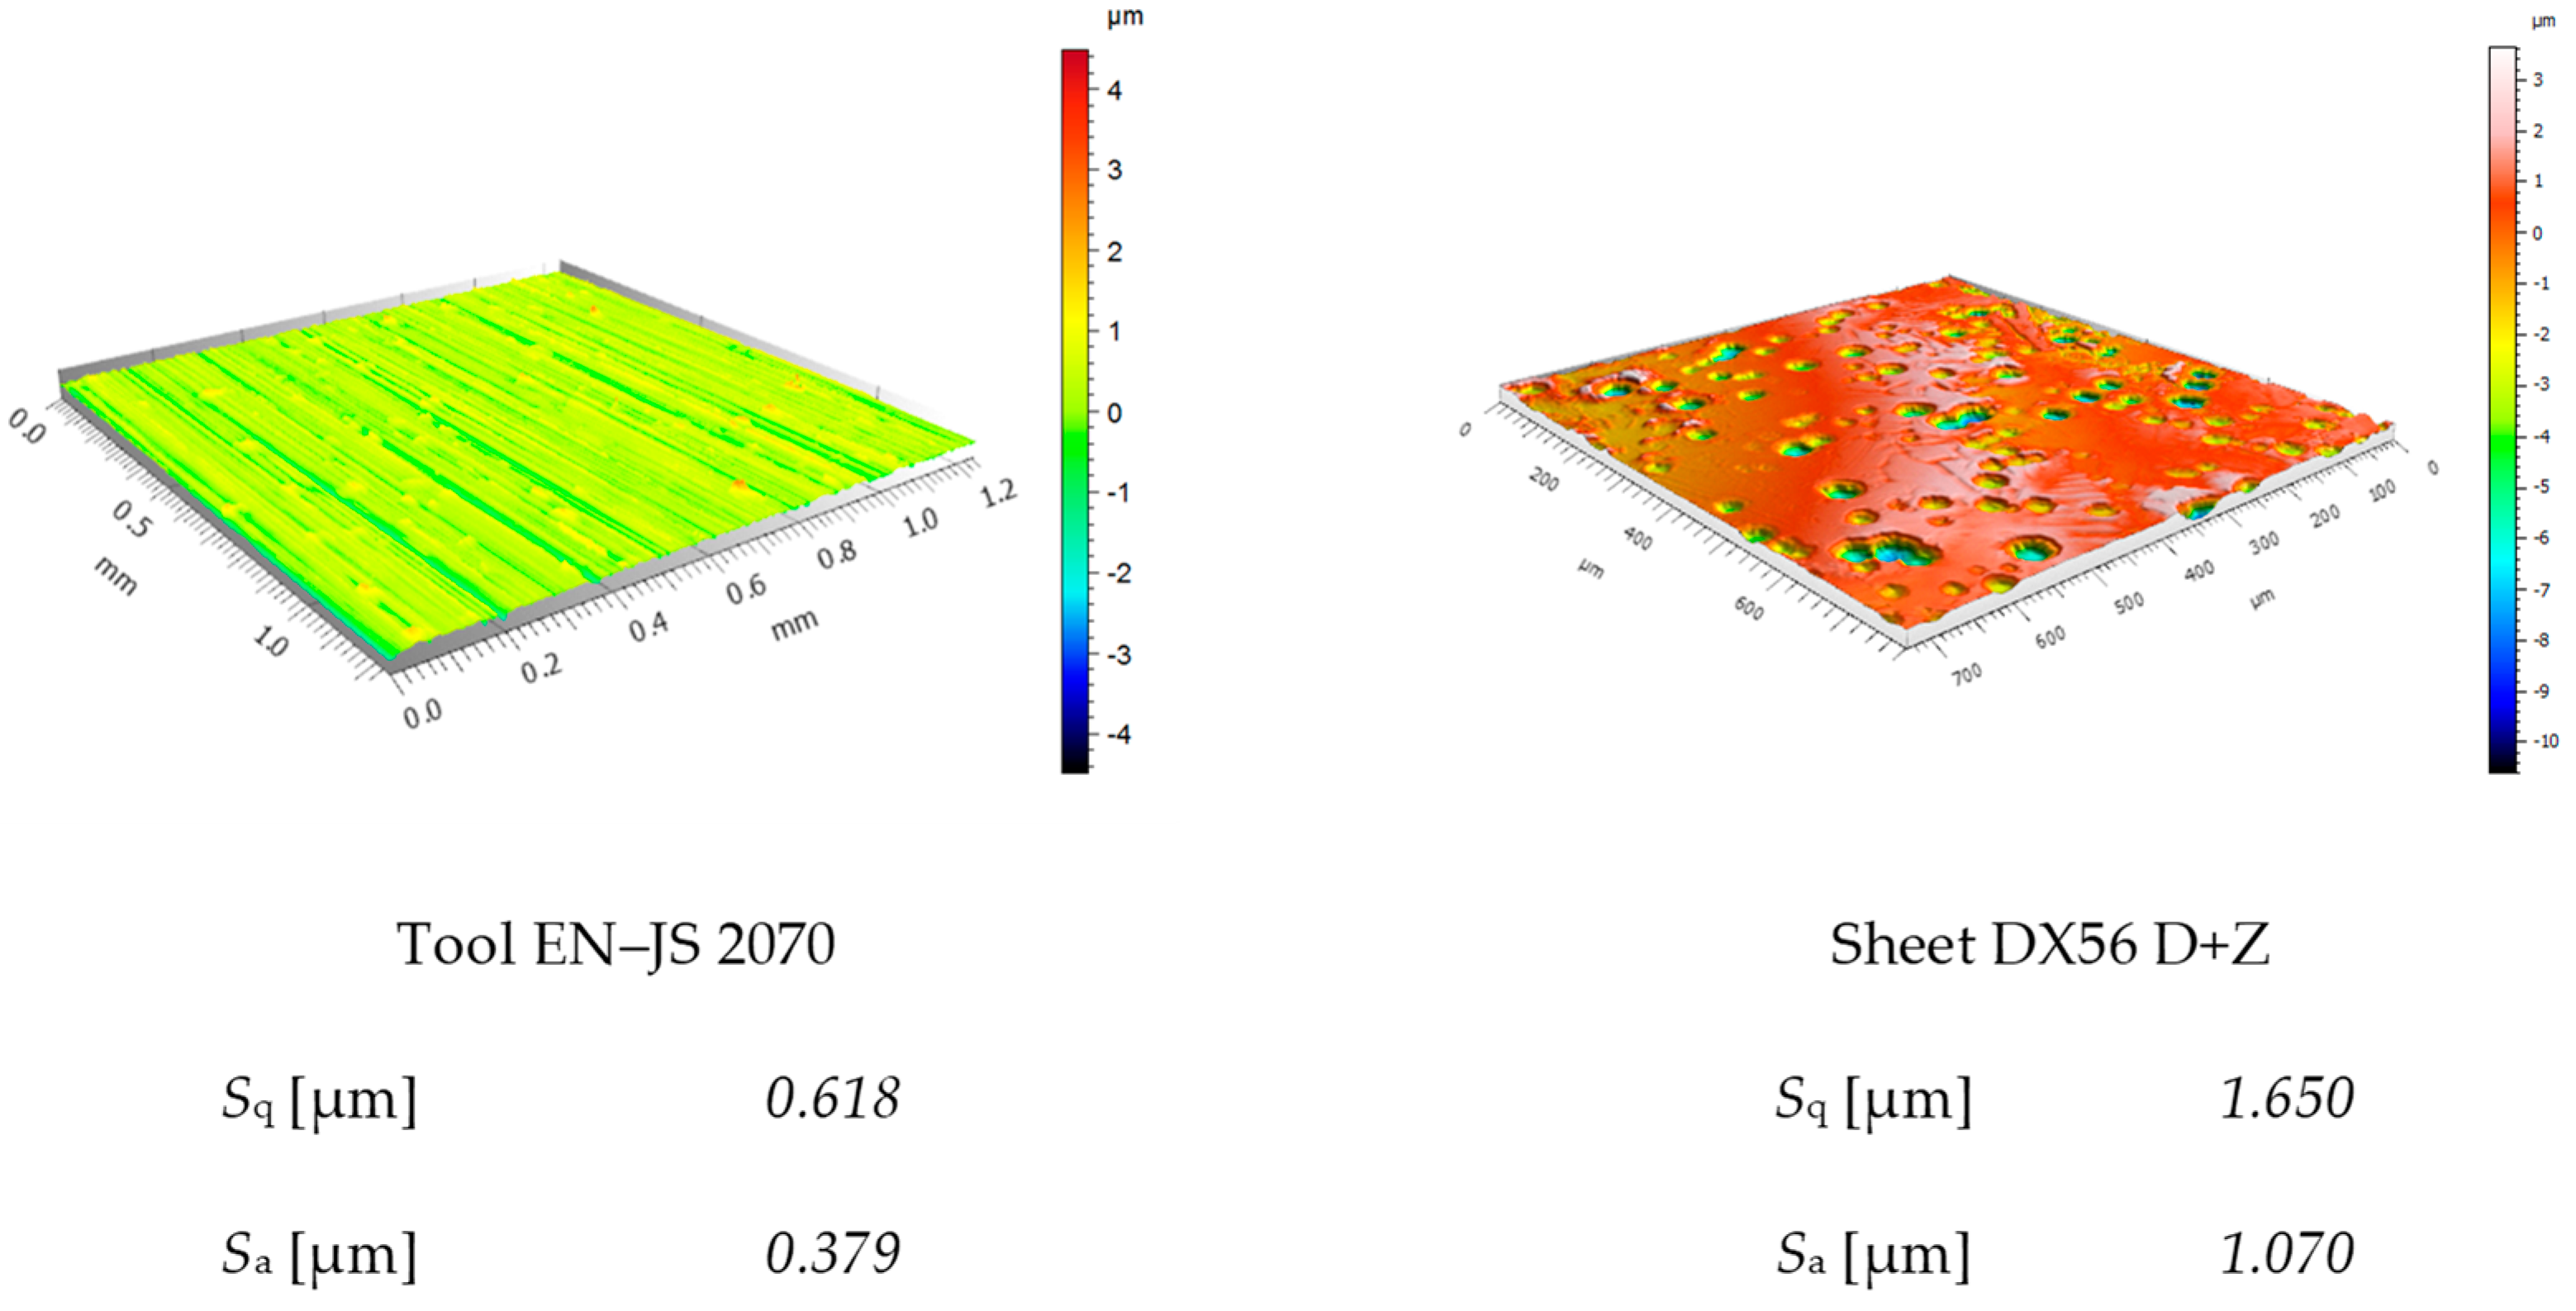
The experiments have been conducted using DX56 D+Z as sheet material and ANTICORIT PL 3802–39S (Fuchs, Mannheim, Germany) as lubricant. The lubricant is typically used by OEM’s for deep drawing operations: For further details see the technical datasheet provided by the manufacturer [16]. For all experiments EN–JS 2070 (Römheld & Moelle, Mainz, Germany) (Sa = 0.38 µm) as tool material has been used.
The sheet material has a pretex surface with round cavities and a flat base structure (see Figure 4). The surface topographies shown in Figure 4 were evaluated using a confocal microscope (µSurf®). Besides the contact area, the velocity and the amount of lubrication has been varied. The experiments to determine the friction coefficient were repeated at least three times. Figure 5 shows that the friction coefficient over contact normal pressure in the VDA test is almost constant. The different curves show a variation of velocity and lubricant amount. As can be seen the results match the understanding of the tribological state of the art:
- The friction coefficient reduces with increasing lubricant amount [17].
While the reduction of velocity for 2 g/m2 shows the expected effect on the friction coefficient, an increase of the friction coefficient with reduced velocity could not be observed for 1 g/m2. The reason could be that hydrodynamic effects, causing the reduction of the friction coefficient are not present since the asperities of the blank surface are not flooded sufficiently with lubricant. Thus, only boundary lubrication is present, resulting in a low sensitivity towards velocity.
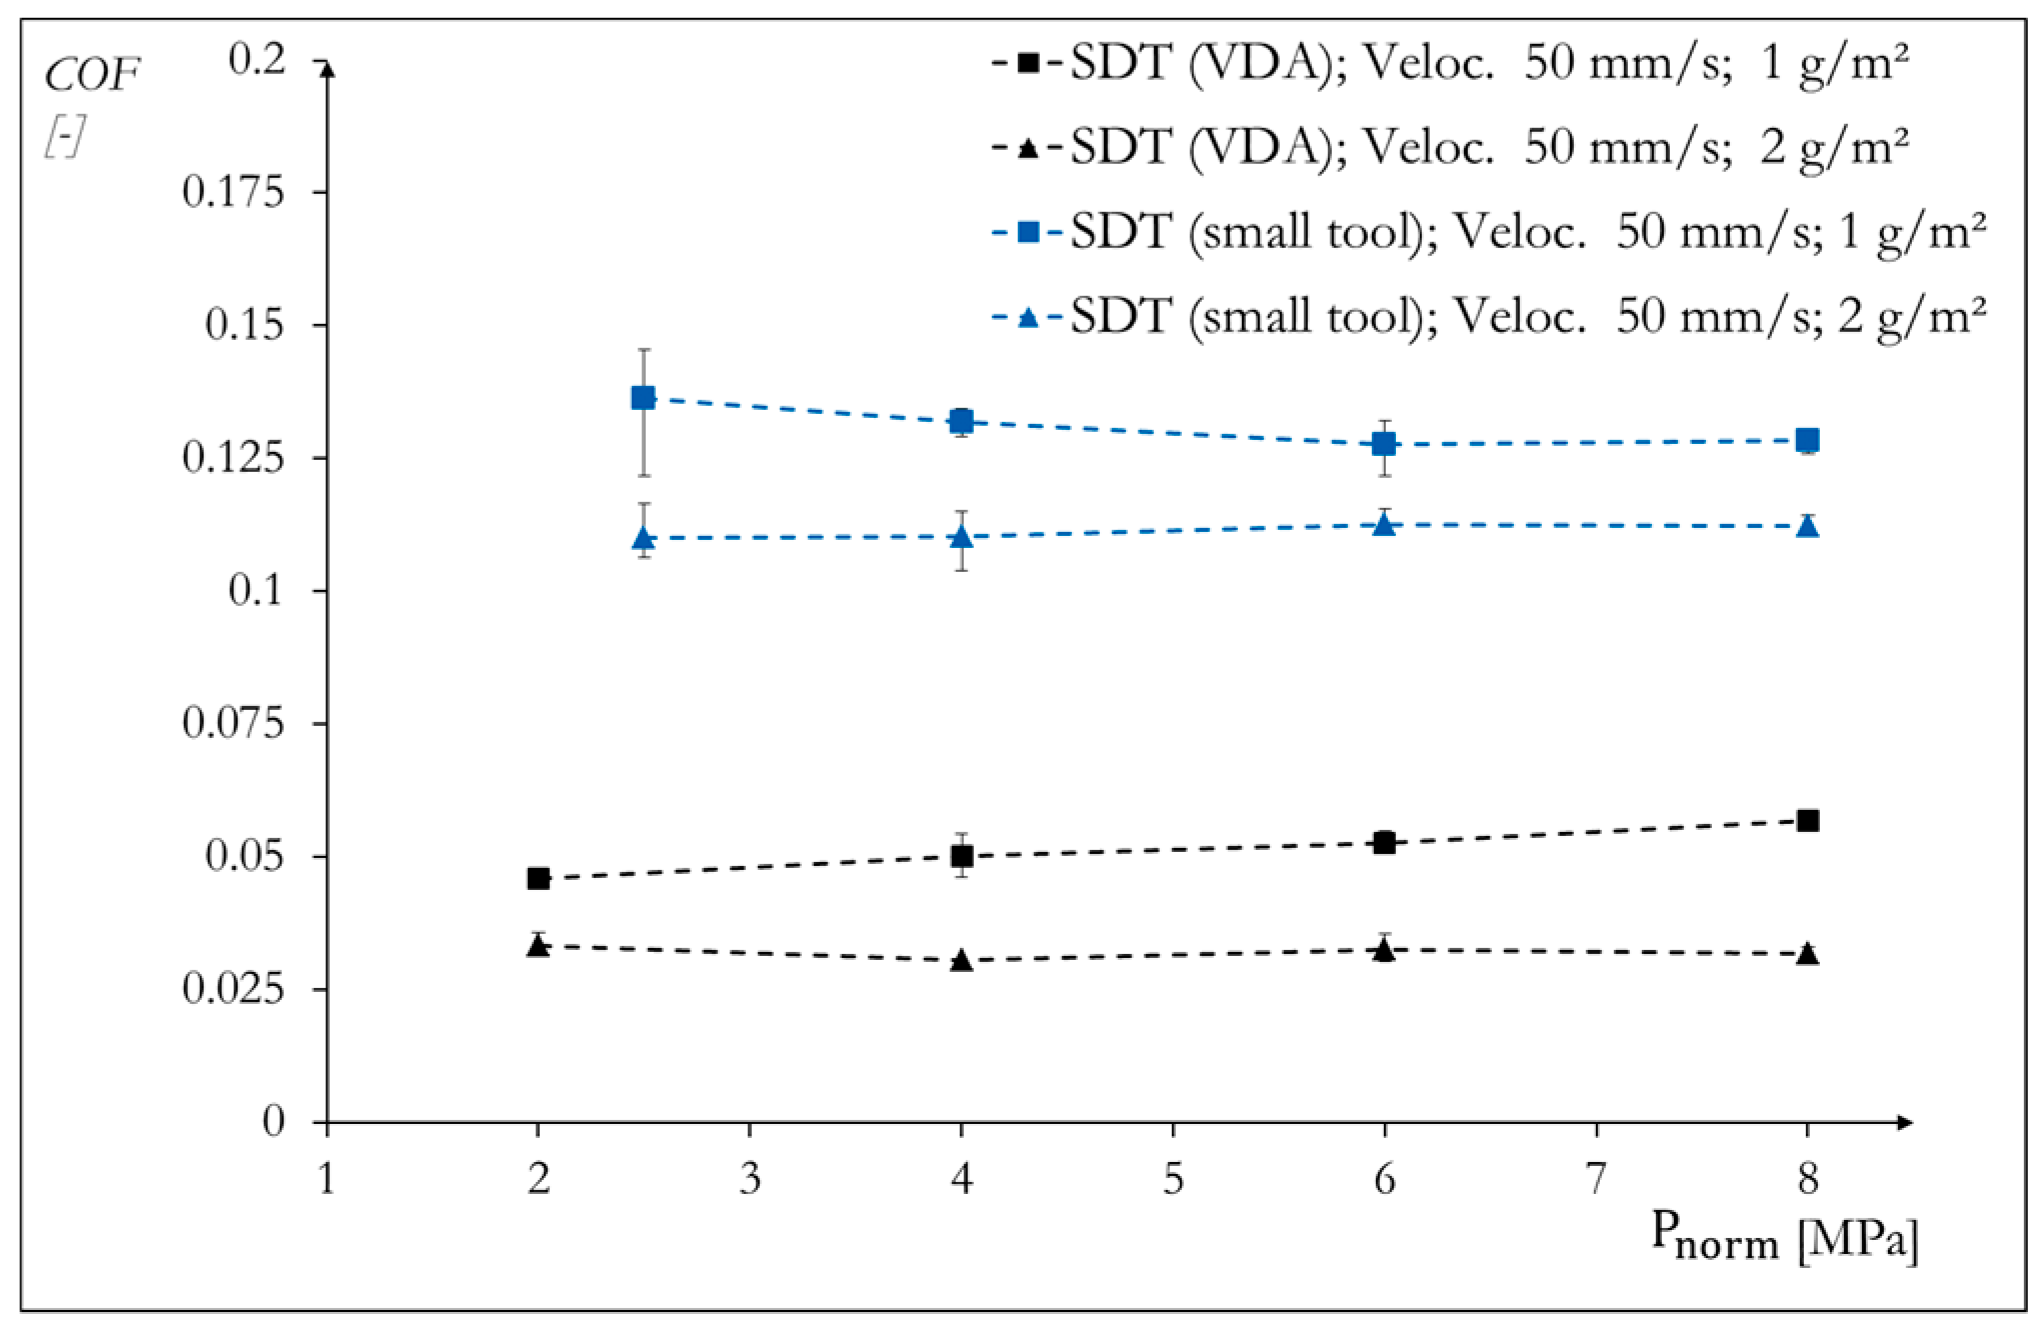
In Figure 6 the results of the two-different strip drawing tests are compared (with each other). Although the tribological conditions are equal, there is a quantitative significant difference between both test stands. While the VDA normed strip drawing test reaches values for the COF between 0.05 and 0.025 the minimized strip drawing test with a reduced contact area (1600 mm2) shows a variation of COF between 0.08 and 0.13.
In general, the effect of reduced COF due to increased lubricant amount can be seen for both test stands in the investigated range of the contact normal pressure. Moreover, the course of the curve of the minimized strip drawing test tends to be more non-linear compared to the VDA test stand.
To investigate the reasons for the difference in values, two different contact areas at the same test stand (VDA) are evaluated (see Figure 7). By doing so, it can be excluded that the sensor or load cells in the various test stands are responsible for the different results. However, it can be seen that the values for the small tool are significantly higher than the standard tooling. This behavior applies to both oil quantities. The qualitative characteristic course of the values is similar too. This shows that the size of the contact area in a test rig has a significant influence on the COF.
This influence can either be caused by a tribological effect or by a variation of the test stands structural integrity under load as the tool size is changed. Since the “supporting area” of the tool is getting smaller a change in the momentum is triggered. The effective direction of the friction forces is pointing in opposite direction to the drawing direction. Therefore, a higher length of the tools represents a higher stiffness, which has a direct influence on the vibrational behavior.
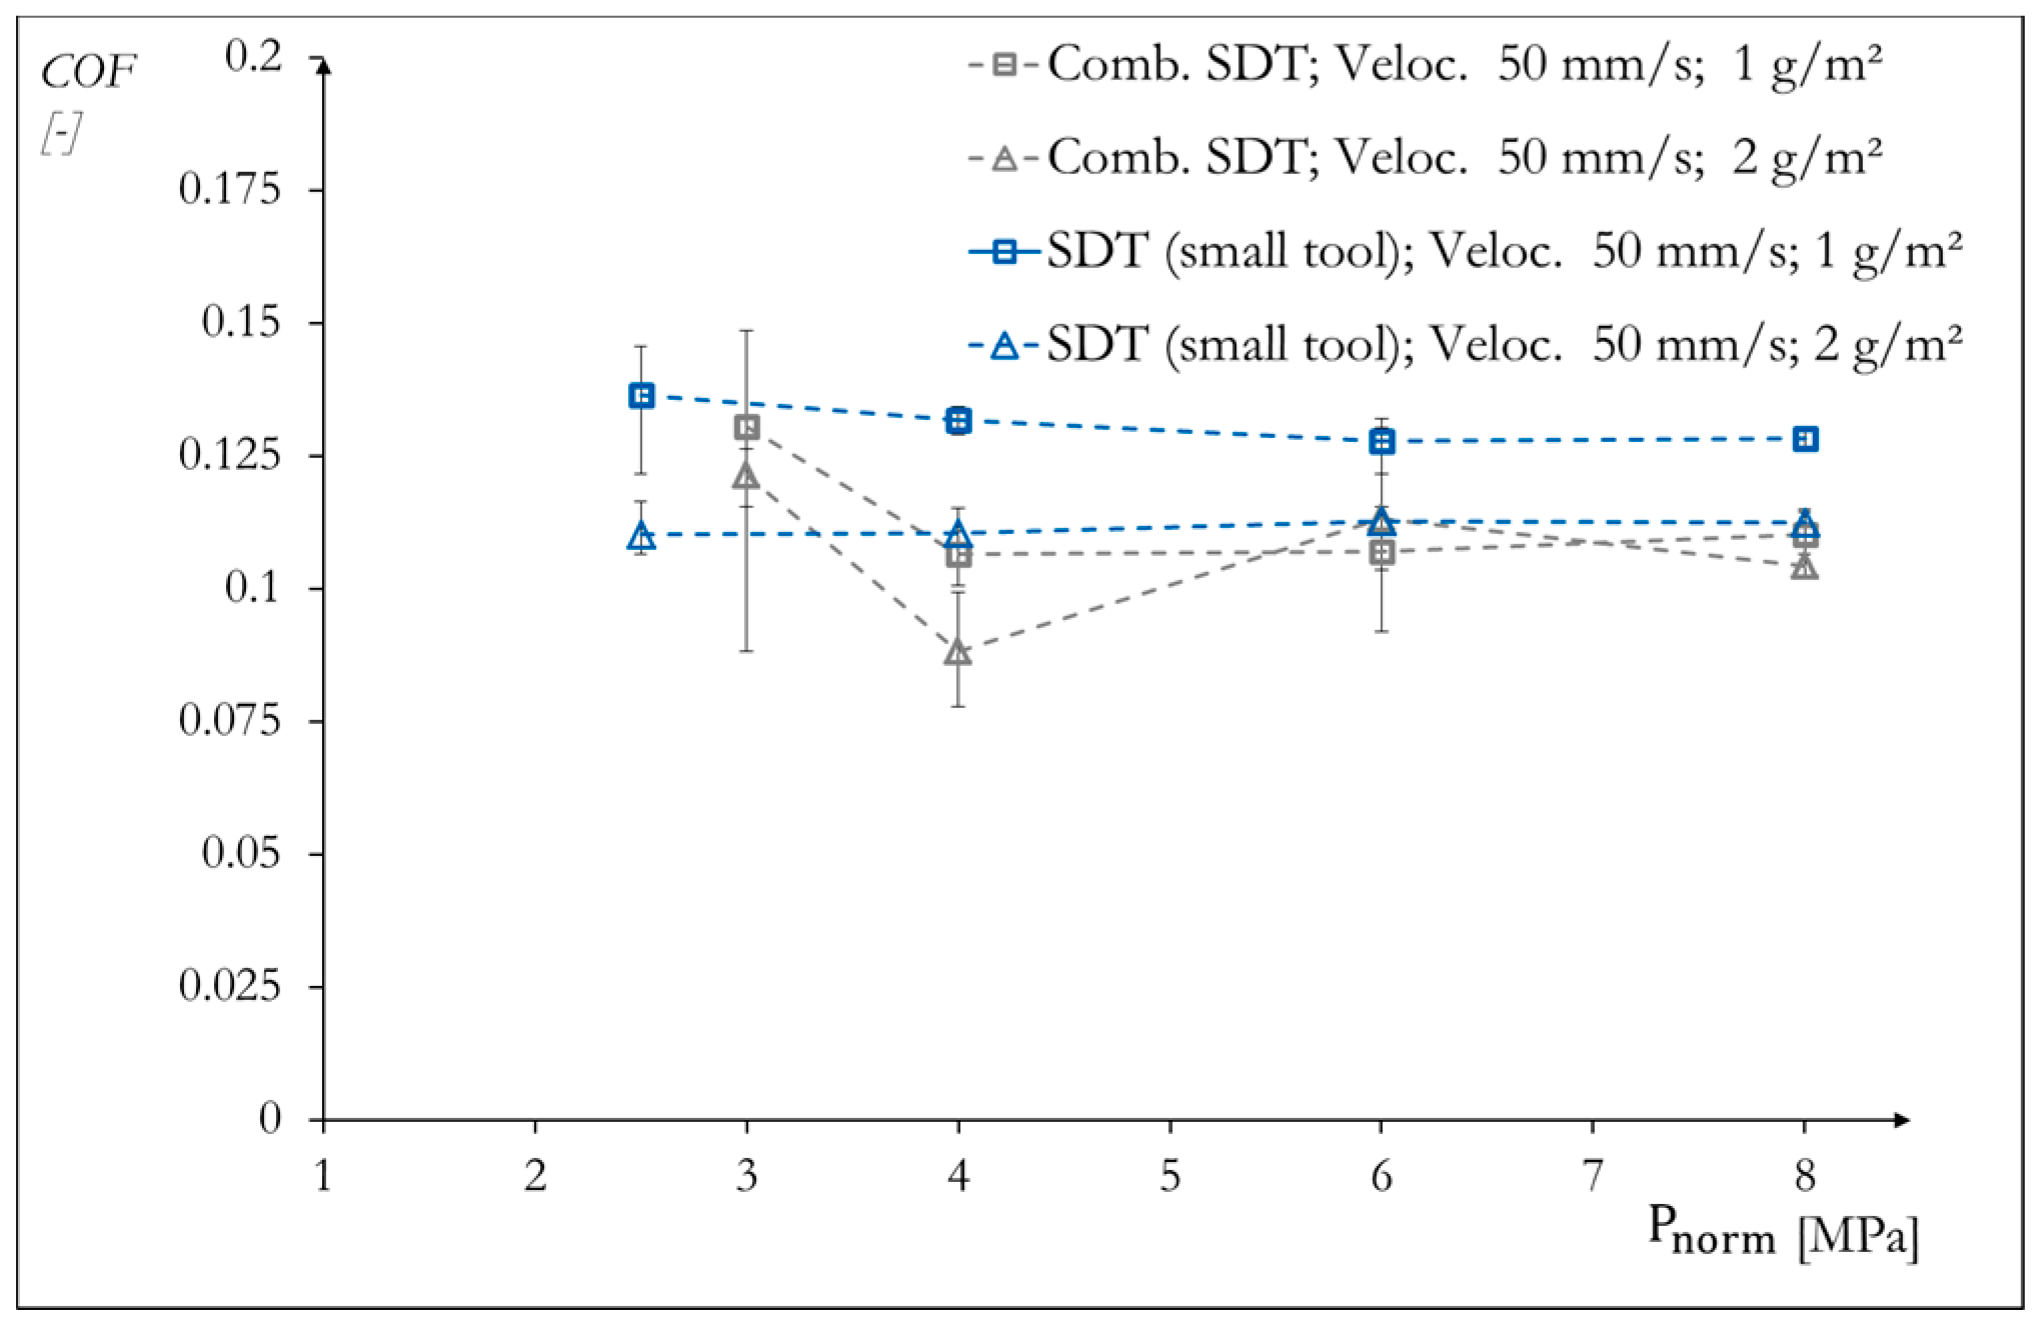
To isolate the effect of different rigidity, the friction curves for the same contact area and different test stands have been compared. As can be seen in Figure 8, the COF for both test stands is within a range of 0.05. However, the course of the COF over the contact normal pressure for the VDA test stand is still more constant than the COFs determined by the minimized strip drawing test. Summing up the results of both friction test stands, the qualitative course of the COF over the contact normal pressure and the quantitative value of the COF can be identified as the main dissimilarities. The results suggest that the design and the rigidity of the test stand have a low influence on the COF. As a result, it can be concluded that the size of the contact area has a significant influence on the value of the friction coefficient, whereas the rigidity of the test stand is responsible for the qualitative course of the friction curve.
4. Discussion
Besides the effect of the test stand structural integrity, tribological effects could also be responsible for a change in the friction coefficient caused by a change in the contact area. According to Gou [13], the change in COF is mainly triggered by lubrication effects. To validate this theory, the lubricant distribution in the contact area must be non-uniform: close to the edges of the tool the lubricant must be squeezed out and therefore reduced locally. Furthermore, the average lubricant amount over the contact area must decrease with decreasing contact area.
In the following an approach describing the squeeze out effect is presented. The analytics presented only account for static conditions. As soon as tool and blank move relatively to each other a Couette flow term in y-direction must be added to the equation. Nevertheless, the effect shown in the following analytics is still present, causing the discussed squeeze out effect. Furthermore, the analytics are based on certain boundary conditions and simplifications, which are presented in the following passages.
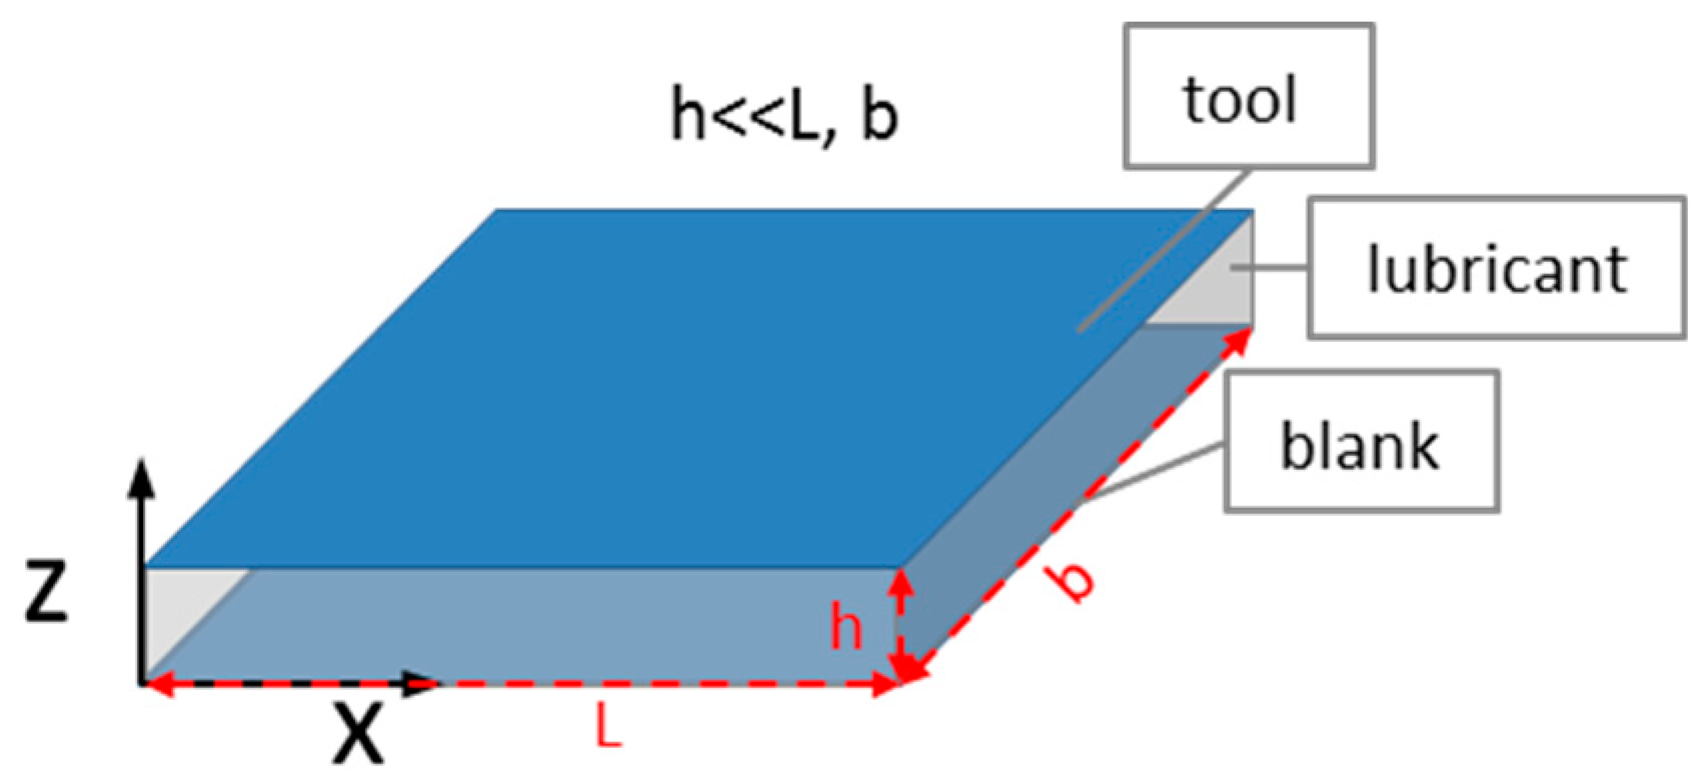
Since the distance between tool and blank (h) is much smaller than the dimensions of the tool in x- and y-direction (Figure 9) an “infinite parallel-plate channel” describes the predominant conditions best.
To simplify the problem, only the component in x direction of the velocity and pressure is analyzed. Applying the Navier-Stokes equations on the system boundaries leads to the following equations:
is representing the dynamic viscosity, the velocity component of the fluid in x direction and the pressure as a function of the x coordinate. Assuming the distance between both tools (h) is constant and the previous mentioned simplification is considered, the derivative of the velocity component in y-direction is zero.
Since the lubricant is getting squeezed out of the contact zone, the maximum pressure for two parallel plates must be in the center of the tool. Towards the edges the pressure is reduced, due to hydraulic friction to a constant value of . Therefore, the pressure can be described by the following equation:
By derivation of this equation the following term (4) can be derived:
After integration and inserting the boundary condition, the velocity profile in x-direction can be described by the following equation:
By integration in y and z direction over the whole system boundaries the volume flow (Q) from the center to the edge of the tool is defined as:
The approximate expression only considers the pressure gradient in x direction. Therefore, this correlation is only valid for a two-dimensional problem. However, this assumption is sufficient as a first analytical approach, describing the lubrication conditions for the strip drawing test. It can be seen that an increased characteristic length, which is corresponding to a higher contact area, results in a reduced volume flow of the lubricant.
The hydraulic resistance () describes the fluid friction and therefore the restraining forces affecting the lubricant in the contact zone:
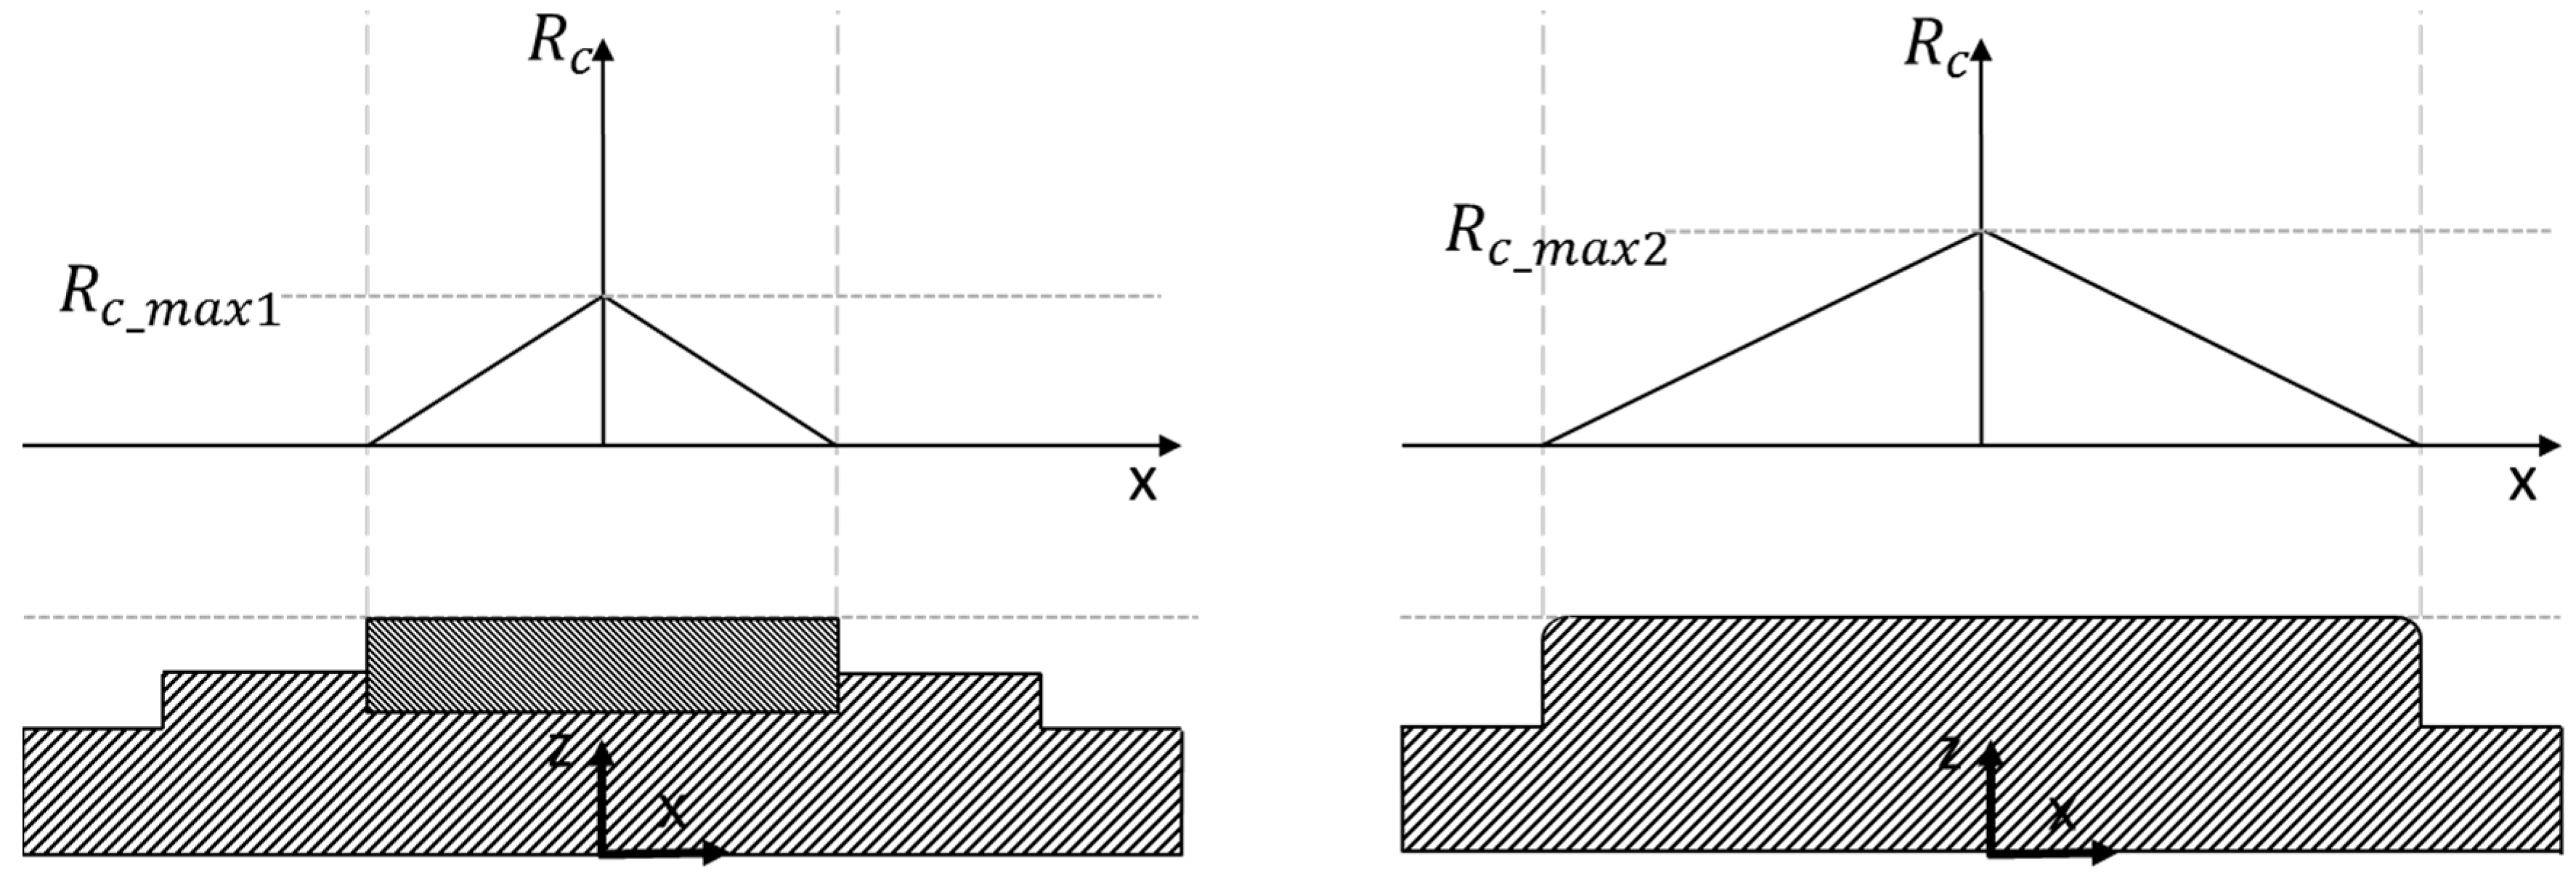
From Equation (7) the relation between characteristic length (L) and the hydraulic resistance can be seen. All other parameters do not change by varying the contact area because they are either material properties () or not representing the boundaries of the system (b). With increasing contact area, the characteristic length is increasing and therefore the hydraulic resistance, resulting in a higher amount of lubricant in the contact zone. For simplicity, pressure and velocity are both only a factor of x and not additionally from y as well. Therefore, the equation is only an approximation for a two-dimensional case, where the change of the contact area is represented by a change in the characteristic length (L).
Figure 10 shows the comparison of the hydraulic resistance for both investigated contact areas.
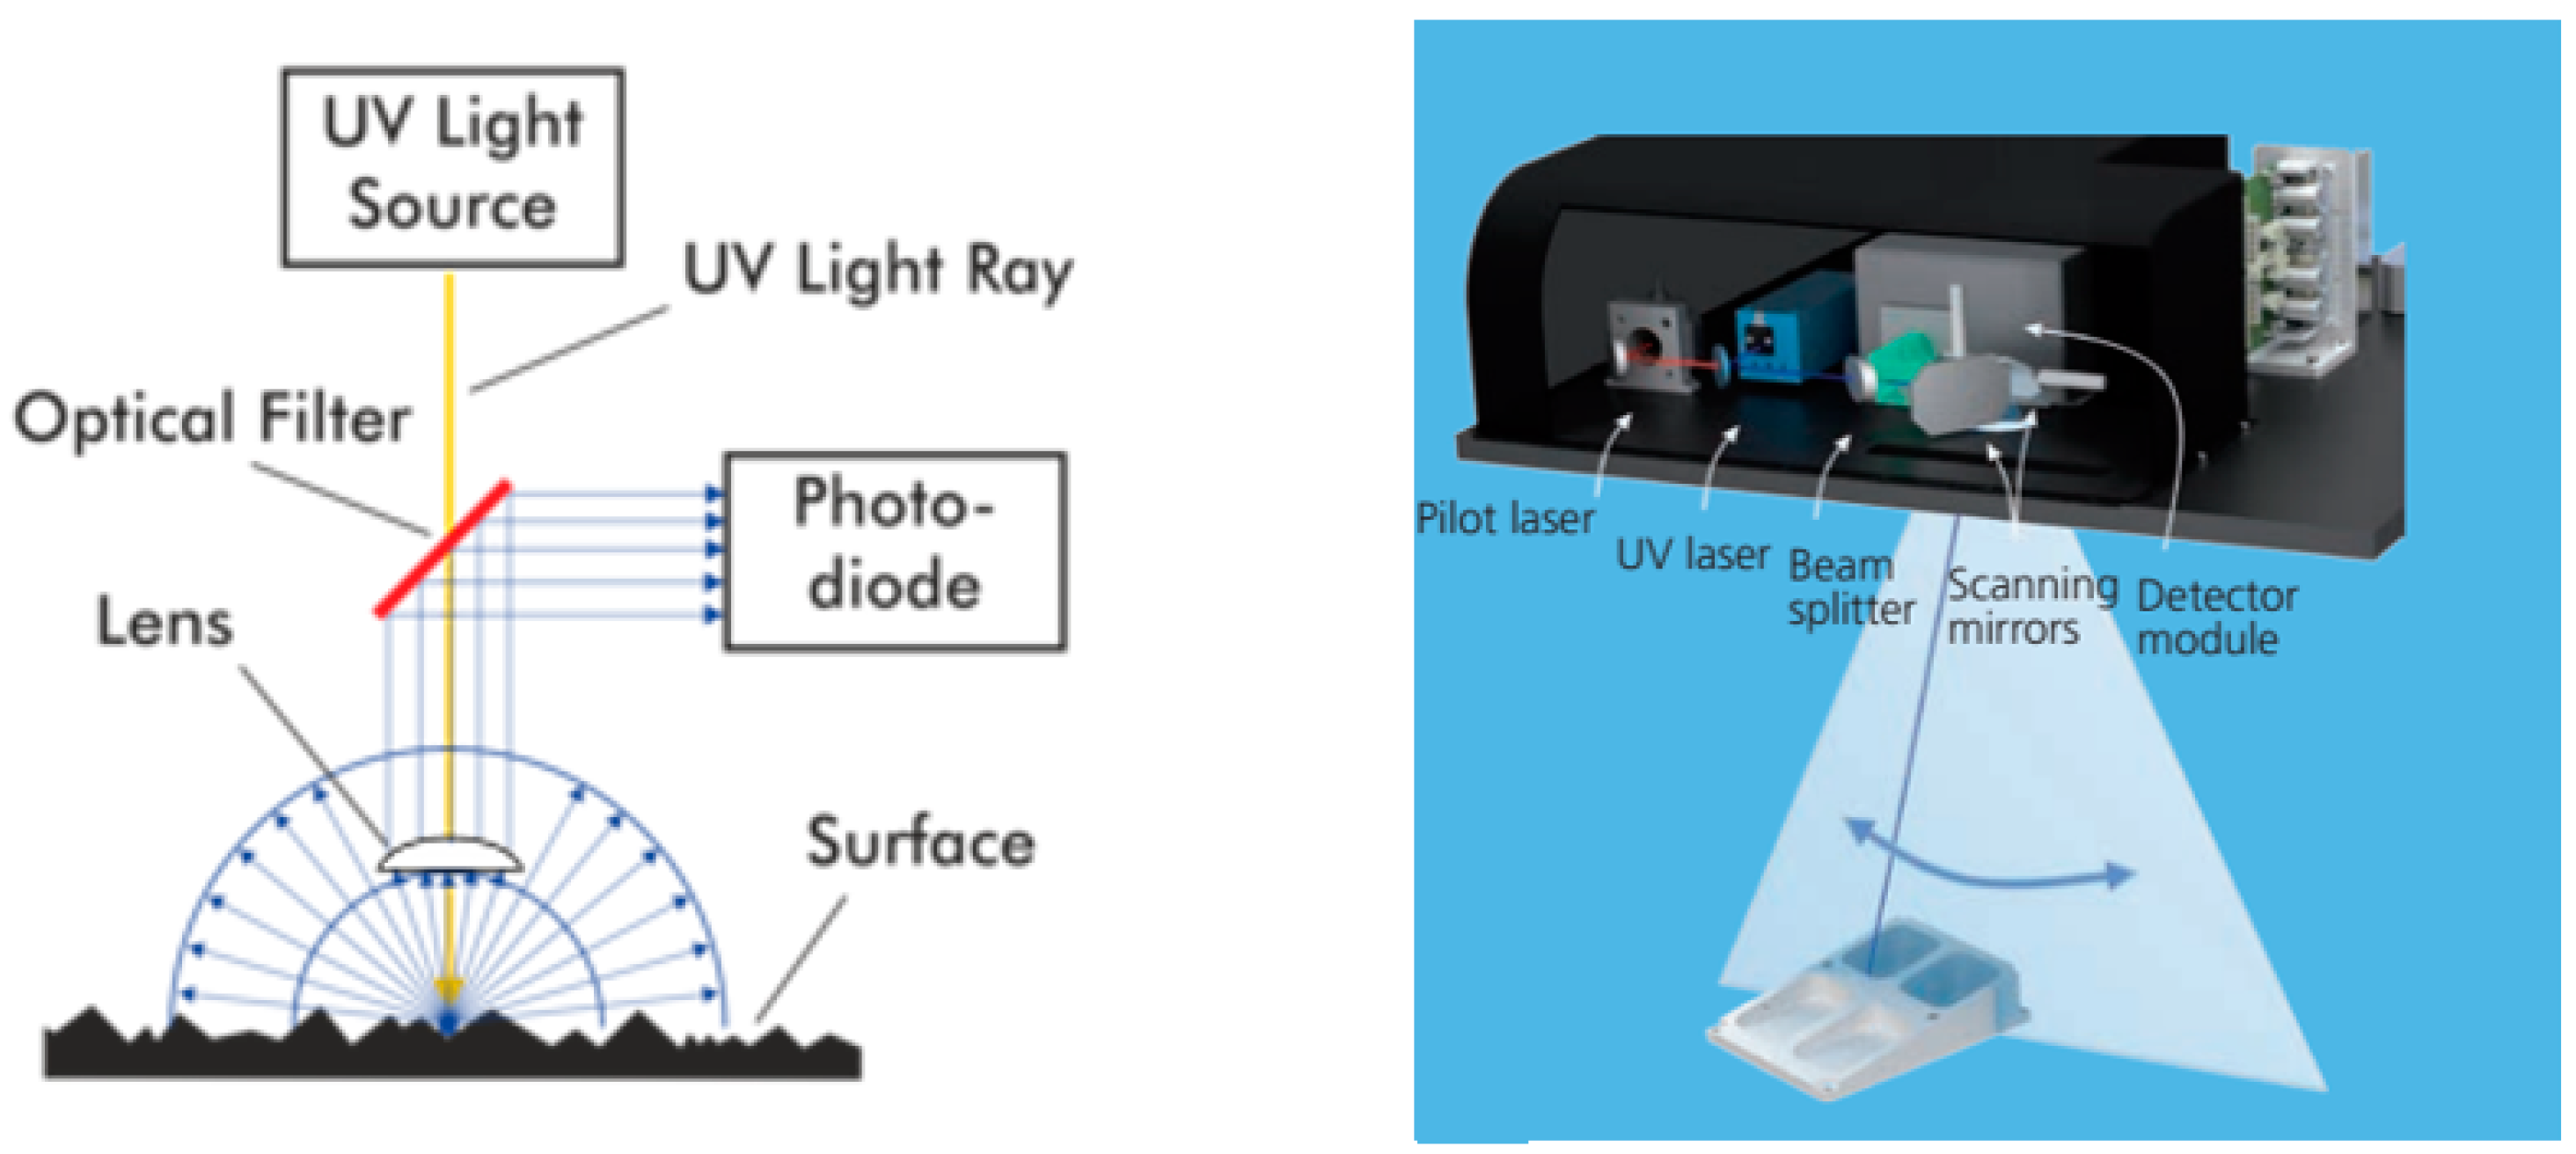
To validate the analytical approach, experimental measurements of the lubricant distribution have been conducted. Thus, two different lubricant measurement devices (F-Scanner and LUBRI-Mini) have been used. Based on the fluoroscopic principle the F-Scanner enables the detection of lubricant distributions for large areas (>1 m2). The device scans the surface of the object incrementally and creates a three-dimensional surface plot. The plot captures information about the location in x- and y-coordinates and the intensity of the emitted radiation. Figure 11 shows the design of the scanning device and illustrates the measuring principle, which is based on the excitement of organic substances by an ultraviolet light.
The other device that has been used to investigate the lubricant distribution is the Lubri-Mini manufactured by Kienzle (Flensburg, Germany). The working principle is also based on fluorescence excitement of the organic lubricant (see Figure 12). Unlike the F-Scanner, the LUBRI-Mini utilizes a measuring head (diameter 10 mm), which can be placed on the workpiece. Therefore, the lubricant distribution can be examined faster for an area of approximately 100 mm2. Due to the measuring principle the resolution is limited, since overlap of the single measuring areas is not permitted.
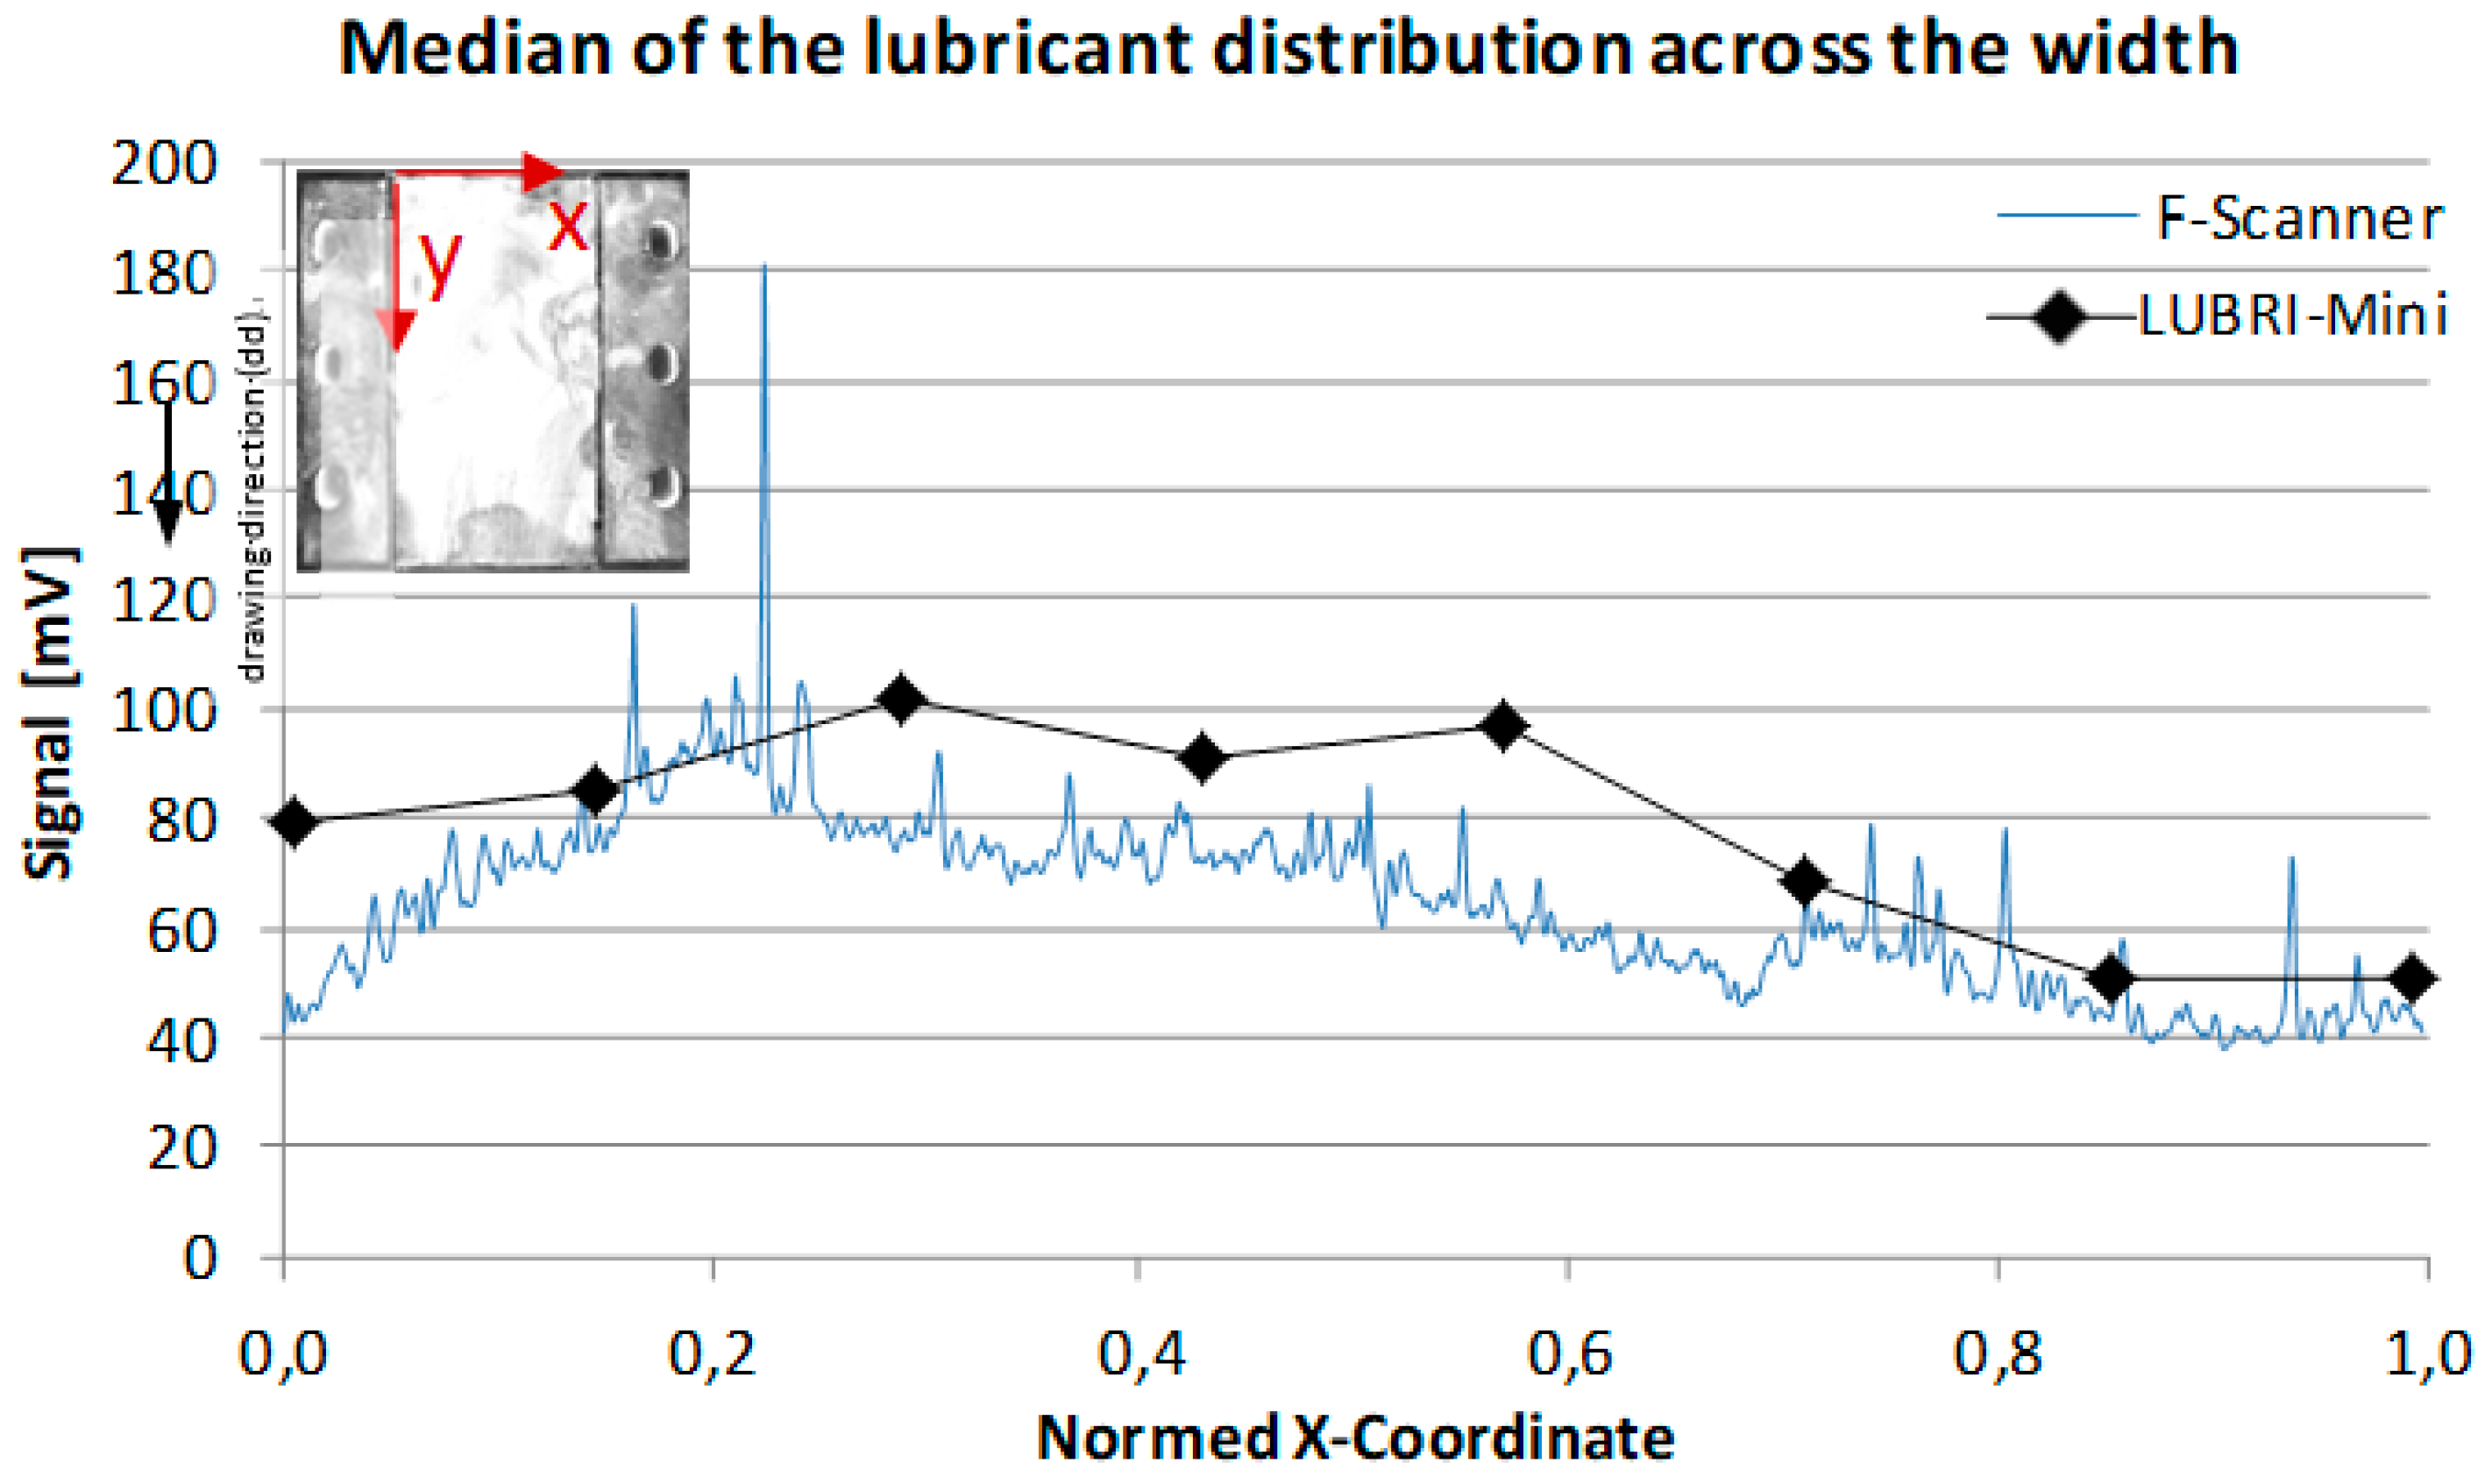
The lubricant distribution has been analyzed in steady state after ten strokes at equal conditions. Figure 13 shows the lubricant distribution over the width. The signal in mV is representing a lubricant quantity. As can be seen, the distribution of the lubricant over the width of the tool is highly non-linear. Close to the edge of the tool almost no lubricant is present. The maximum of the lubrication is located between the left edge and the center of the tool. This tilt could be caused by a non-uniform pressure distribution over the contact area. However, due to the macroscopic lubricant pocket and the gradually reduced lubrication towards the edges of the tools, it is proven that the lubrication does not disperse homogeneously over the surface. The gradient in lubricant amount is mainly caused by internal friction between fluid and tool which results in a pressure gradient inside the fluid.
Figure 14 shows the lubricant distribution over the length of the tool. Likewise, the distribution over the width shows a highly nonlinear course of the curve, mainly caused by a non-uniform pressure distribution.
The results of the measurement from the LUBRI-Mini and the F-Scanner are in a good agreement, besides one higher deviation at the end of the tool (see Figure 14). This deviation is most likely caused by a removal of lubricant during the transport of the tools or through additional application of the lubricant by wiping off the blank on the tool surface. However, since most of the results show a good agreement for the distribution over the width as well as over the length, the results seem to be valid.
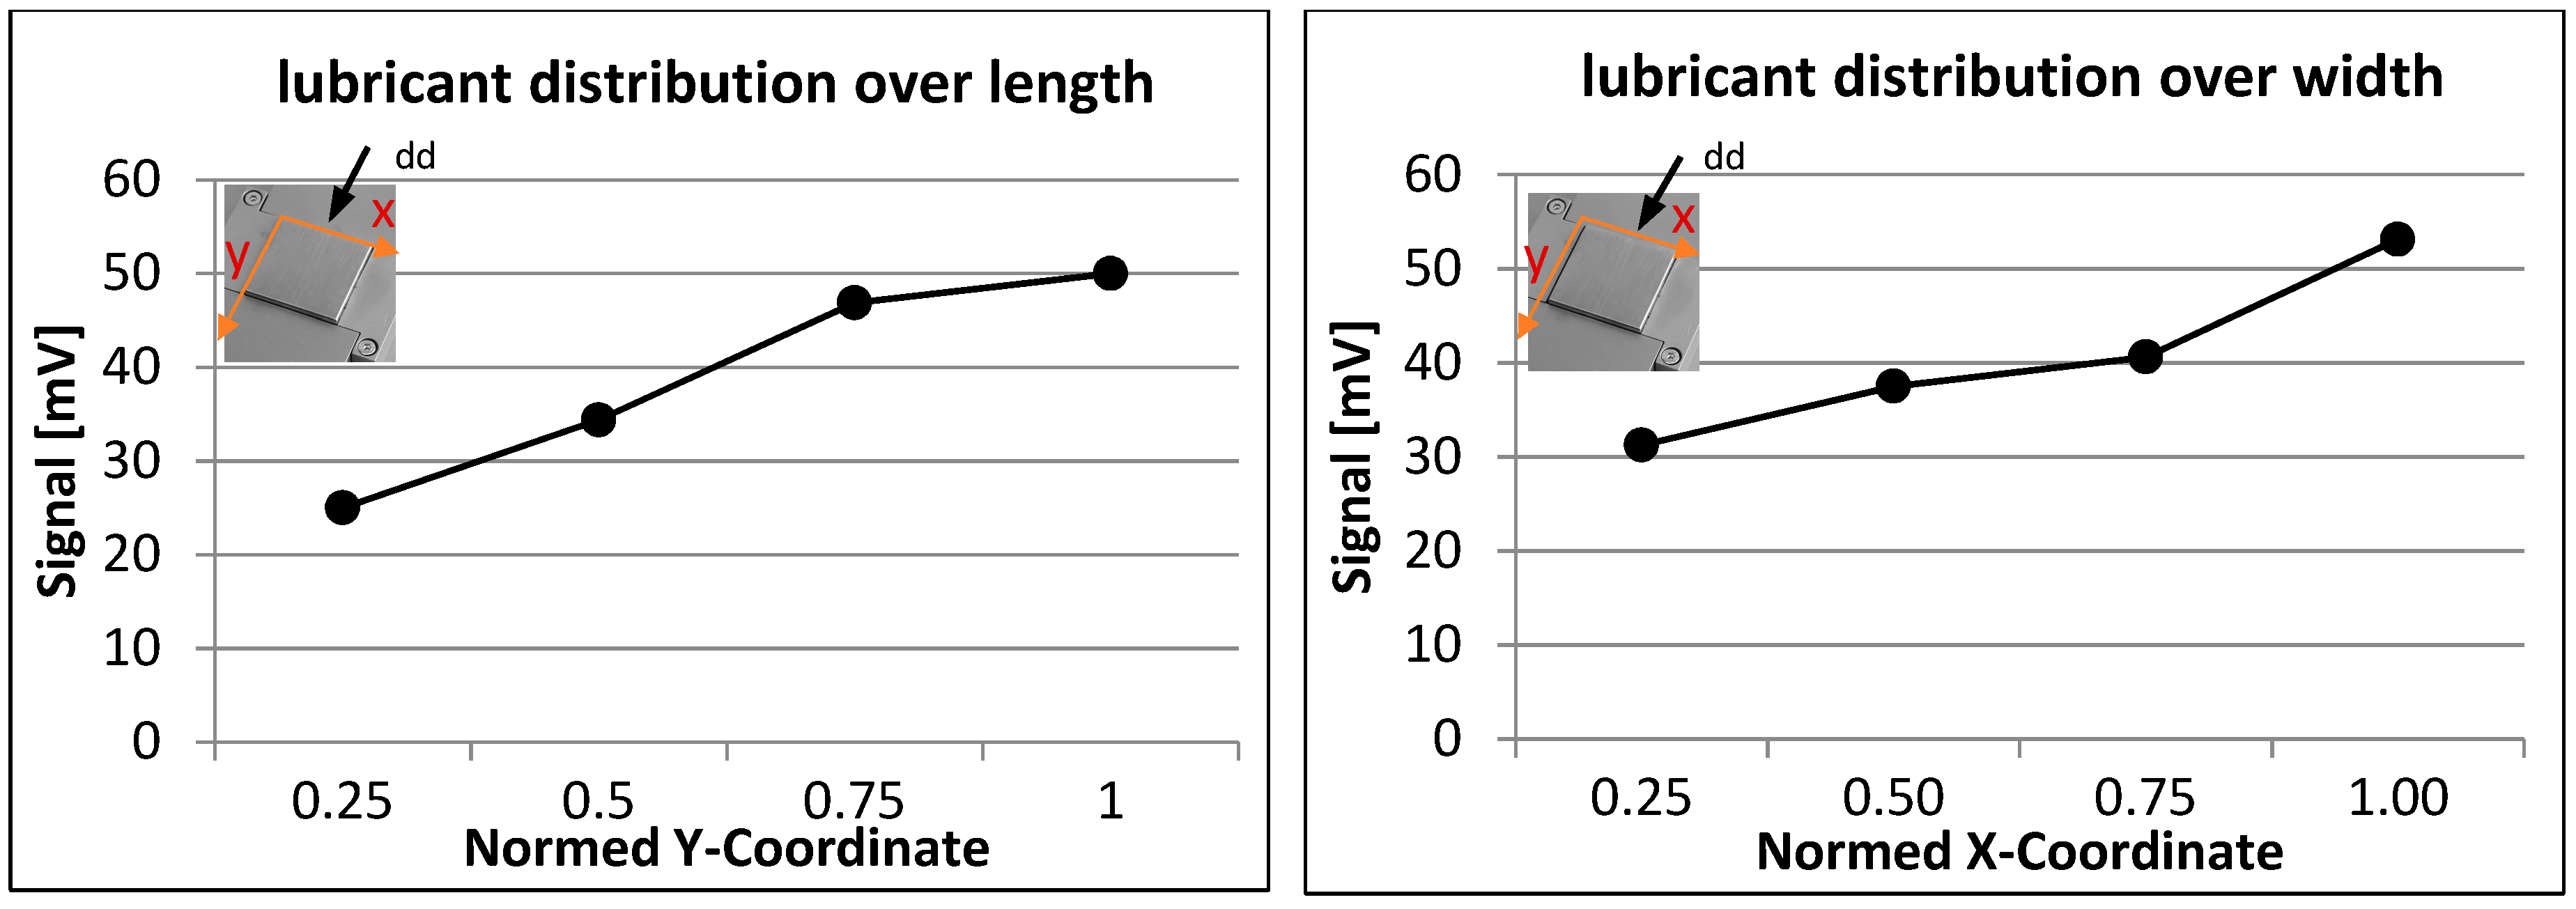
As can be seen from Figure 15, the lubrication of the small tool is also not homogeneous over the contact area. Moreover, no significant increase of the lubrication towards the center of the tool is present. Since the contact area of the tool is smaller, the number of measuring points is also reduced and therefore, the course over the width and over the length has only four fulcrums.
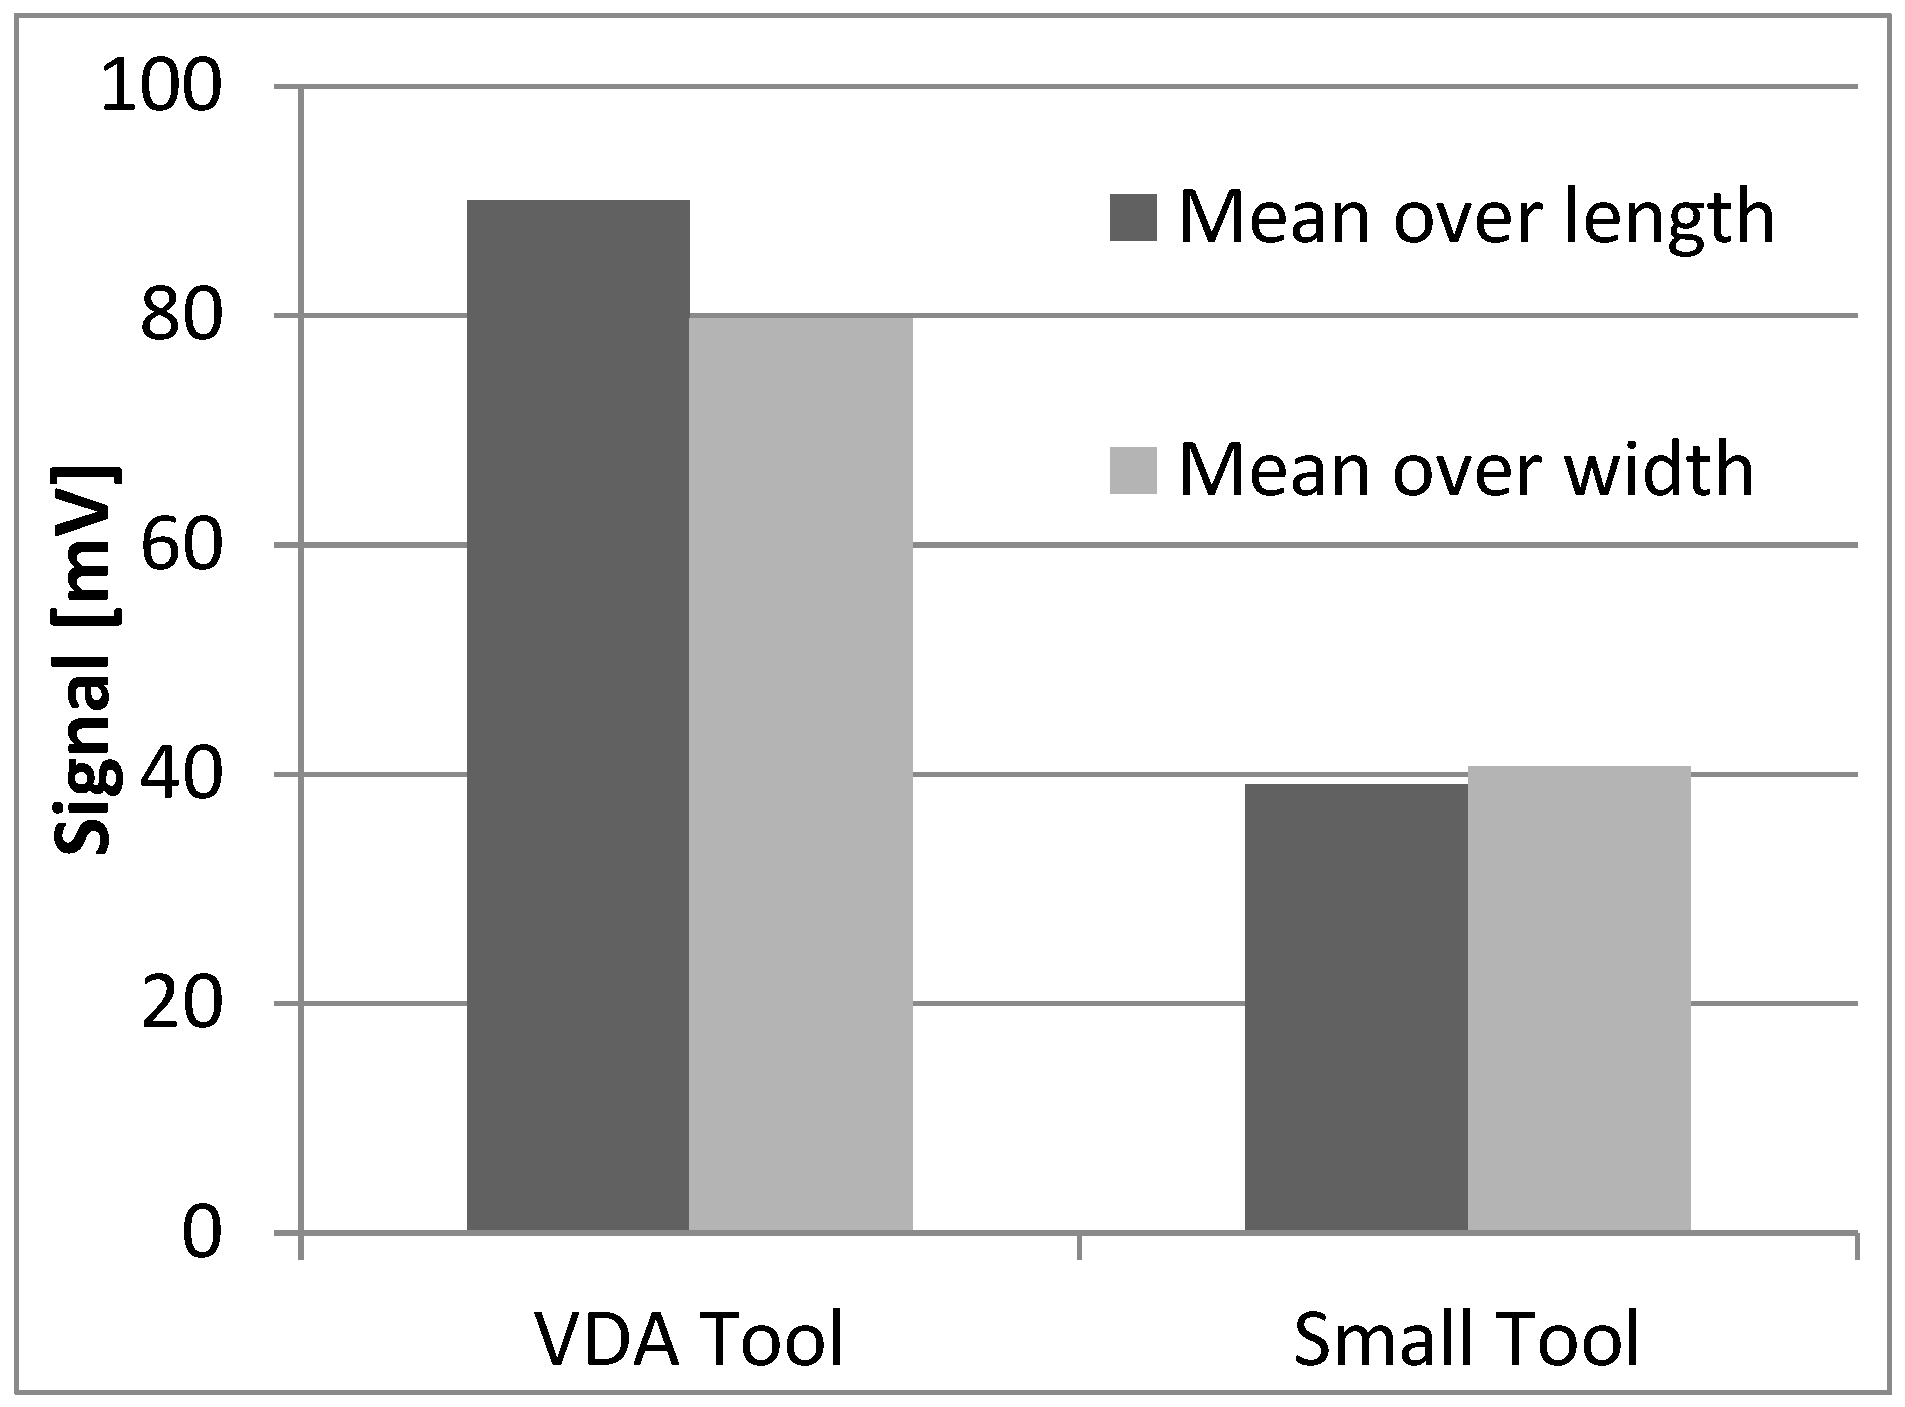
The main information regarding the lubrication can be derived by comparing the mean distribution of the VDA tool with the small tool. As can be seen from Figure 16, the mean lubrication amount of the VDA tool is approximately two times higher than the lubrication amount of the small tool. This applies for the lubrication over the width as well as for the lubrication over the length.
The comparison of the different mean lubricant amounts gives a reasonable explanation for the increasing friction coefficient with reducing contact area. Therefore, the macroscopic lubrication effects are identified as critical parameters for the tribological system.
5. Conclusions
In this article, the effect of different test stand rigidities and different contact areas on the friction coefficient has been investigated. By comparing a VDA normed strip drawing test stand with a minimized strip drawing test, both parameters have been analyzed separately. Therefore, in a first approach, different contact areas have been used, leading to significantly different coefficients of friction. By comparing the same contact area of two different strip drawing tests the effect of the test stand rigidity was analyzed isolated. In general, two effects have been identified:
- The quantitative value of the mean friction coefficient over the contact pressure is dependent on the contact area.
- The course of the friction coefficient over the contact pressure is dependent on the rigidity of a test stand.
The authors assumed that the dominant influence of the contact area size on the friction coefficient is caused by different lubricant distribution over the contact area. To validate the plausibility of this theory the lubricant distribution was measured, showing a highly non-uniform and quantitatively different lubrication amount for the different contact area sizes. Therefore, the postulated theory was made plausible.
In contrast to the state of the art, where the friction coefficient is mostly described as a factor of velocity, contact normal pressure and temperature, the results presented in this paper show a more complex correlation. However, more experimental investigations must be carried out, for example by gradually decreasing/increasing the contact area.
Author Contributions
F.D. and V.R. conceived and designed the experiments. V.R. performed and supervised the experiments. F.D. was responsible for the sheet metal supplies and confocal measurements. F.D. and V.R. analyzed the experimental data. V.R. was responsible for the lubrication distribution measurements and the analytical model. V.R. wrote the paper. F.D., P.G. and V.R. were responsible for reviewing and revising the paper. P.G. contributed the experimental facilities and tools.
Funding
This research received no external funding.
Acknowledgments
We acknowledge support by the German Research Foundation and the Open Access Publishing Fund of Technische Universität Darmstadt.
Conflicts of Interest
The authors declare no conflict of interest.
Abbreviations/Nomenclature
| COF | Coefficient of friction |
| dd | Drawing direction |
| FE | Finite Element |
| g | Gramm |
| L | Characteristic length |
| m2 | Square meter |
| MPa | Megapascal |
| Pressure | |
| Volume flow | |
| Flow resistance | |
| Velocity component in x-direction | |
| Dynamic viscosity |
References
- Emrich, A.; Liewald, M.; Ruf, G. Stochastic analysis in FE-simulation of sheet metal forming as a key enabler for a robust production process. In Proceedings of the 4th Forming Technology Forum Zurich, Zurich, Switzerland, 17–18 May 2011; pp. 17–18. [Google Scholar]
- Weinschenk, A.; Volk, W. Systematic investigation of geometrical parameters’ influence on the appearance of surface deflections in sheet metal forming. J. Phys. 2016, 734, 032004. [Google Scholar] [CrossRef]
- Govik, A.; Nilsson, L.; Moshfegh, R. Finite element simulation of the manufacturing process chain of a sheet metal assembly. J. Mater. Process. Technol. 2012, 212, 1453–1462. [Google Scholar] [CrossRef]
- Hol, J. Multi-Scale Friction Modeling for Sheet Metal Forming. Ph.D. Thesis, University of Twente, Enschede, The Netherlands, 2013. [Google Scholar]
- Hol, J.; Wiebenga, J.H.; Hörning, M.; Dietrich, F.; Dane, C. Advanced friction simulation of standardized friction tests: A numerical and experimental demonstrator. J. Phys. 2016, 734, 32092. [Google Scholar] [CrossRef]
- Filzek, J.; Ludwig, M.; Groche, P. Improved FEM simulation of sheet metal forming with friction modelling using laboratory tests. In Proceedings of the IDDRG, Bilbao, Spain, 5–8 June 2011. [Google Scholar]
- Groche, P.; Möller, N. Tribological investigation of deep drawing processes using servo presses. In Proceedings of the ASME 2012 International Manufacturing Science and Engineering Conference, Notre Dame, IN, USA, 4–8 June 2012. [Google Scholar]
- Staeves, J.; Schmoeckel, D. Topography of sheet metal and its relationship to the tribological behaviour during the forming process. In Proceedings of the 1st International Conference on Tribology in Manufacturing Process, Gifu, Japan, 19–23 October 1997. [Google Scholar]
- Merklein, M.; Zoeller, F.; Sturm, V. Experimental and numerical investigations on frictional behavior under consideration of varying tribological conditions. Adv. Mater. Res. 2017, 966, 270–278. [Google Scholar]
- Gil, I.; Galdos, L.; Mendiguren, J.; Mugarra, E.; de Argandona, E.S. Influence of the pressure dependent coefficient of friction on deep drawing springback predictions. In Proceedings of the ESAFORM, Nantes, France, 27–29 April 2016. [Google Scholar]
- Ludwig, M. Bewertung von Einflussgrößen auf die Reibverhältnisse in der Blechumformung und deren Korrelation mit numerisch ermittelten Belastungsverläufen. Ph.D. Thesis, TU-Darmstadt, Darmstadt, Germany, 2016. [Google Scholar]
- Merklein, M. GDDRG Arbeitskreis Arbeitsgruppe Oberflächentopographie und Umformbarkeit Reibwertbestimmung: VDEH Round robin friction tests. In Proceedings of the IDDRG Working Group Meeting, Zurich, Switzerland, 2–5 June 2013. [Google Scholar]
- Wang, C.; Bin, G.; Debin, S. Friction related size-effect in microforming—A review. Manuf. Rev. 2014, 1, 23. [Google Scholar] [CrossRef]
- Guo, B.; Gong, F.; Wang, C.J.; Shan, D.B. Flow stress and tribology size effects in scaled down cylinder compression. Trans. Nonfer. Metal. Soc. China 2009, 19, 516–520. [Google Scholar] [CrossRef]
- Emmens, W.C. Tribology of Flat Contacts and Its Application in Deep Drawing. Ph.D. Thesis, University of Twente, Enschede, Switzerland, 1997. [Google Scholar]
- VDA230-213: Test Procedures for the Product Classes Prelube. 2009. Available online: https://www.vda.de/en/services/Publications/vda-230-213-test-procedures-for-the-product-classes.html (accessed on 24 April 2018).
- ANTICORIT PL 3802-39S: Corrosion Prevention Oil with Excellent Drawing Properties. 2006. Available online: http://www.fuchs.com/cn/en/special/product/product/19774-anticorit-pl-3802-39-s/ (accessed on 24 April 2018).
- Kosanov, J.; Lenard, J.G.; Uhrig, J.; Wallfarth, B. The effect of lubricant additives on the coeffcient of friction in the flat-die test. Mater. Sci. Eng. 2006, A427, 274–281. [Google Scholar] [CrossRef]
- Büttner, S.; Gottschall, S. Automated detection of filmic residues. IST Inter. Surf. Technol. 2016, 9, 46–47. [Google Scholar]
- Brandenburg, A. F-SCANNER: Large-Area Inline Inspection of Surface Cleanliness and Coatings. 2016. Available online: https://www.ipm.fraunhofer.de/content/dam/ipm/en/PDFs/product-information/PK/OOA/F-Scanner-Fluorescence-measurement.pdf (accessed on 24 April 2018).
- Prozessanalytik, K. Brochure LUBRI-Mini; BAM: Florence, AL, USA, 2011. [Google Scholar]
Figure 1.
Comparing of different test stands for friction coefficient evaluation [12].
Figure 1.
Comparing of different test stands for friction coefficient evaluation [12].

Figure 2.
(a) Strip Draw Test according to VDA 230–213; (b) Schematic diagram of the test stand; (c) Investigated contact area.
Figure 2.
(a) Strip Draw Test according to VDA 230–213; (b) Schematic diagram of the test stand; (c) Investigated contact area.

Figure 3.
(a) Minimized Strip Draw Test; (b) Schematic illustration of the testing cell; (c) Cross section of the testing cell; (d) Investigated contact area.
Figure 3.
(a) Minimized Strip Draw Test; (b) Schematic illustration of the testing cell; (c) Cross section of the testing cell; (d) Investigated contact area.

Figure 4.
Surface evaluation of tool and sheet material.

Figure 5.
Friction coefficient over contact normal pressure of VDA–standardized strip drawing test (variation of velocity and lubricant amount).
Figure 5.
Friction coefficient over contact normal pressure of VDA–standardized strip drawing test (variation of velocity and lubricant amount).
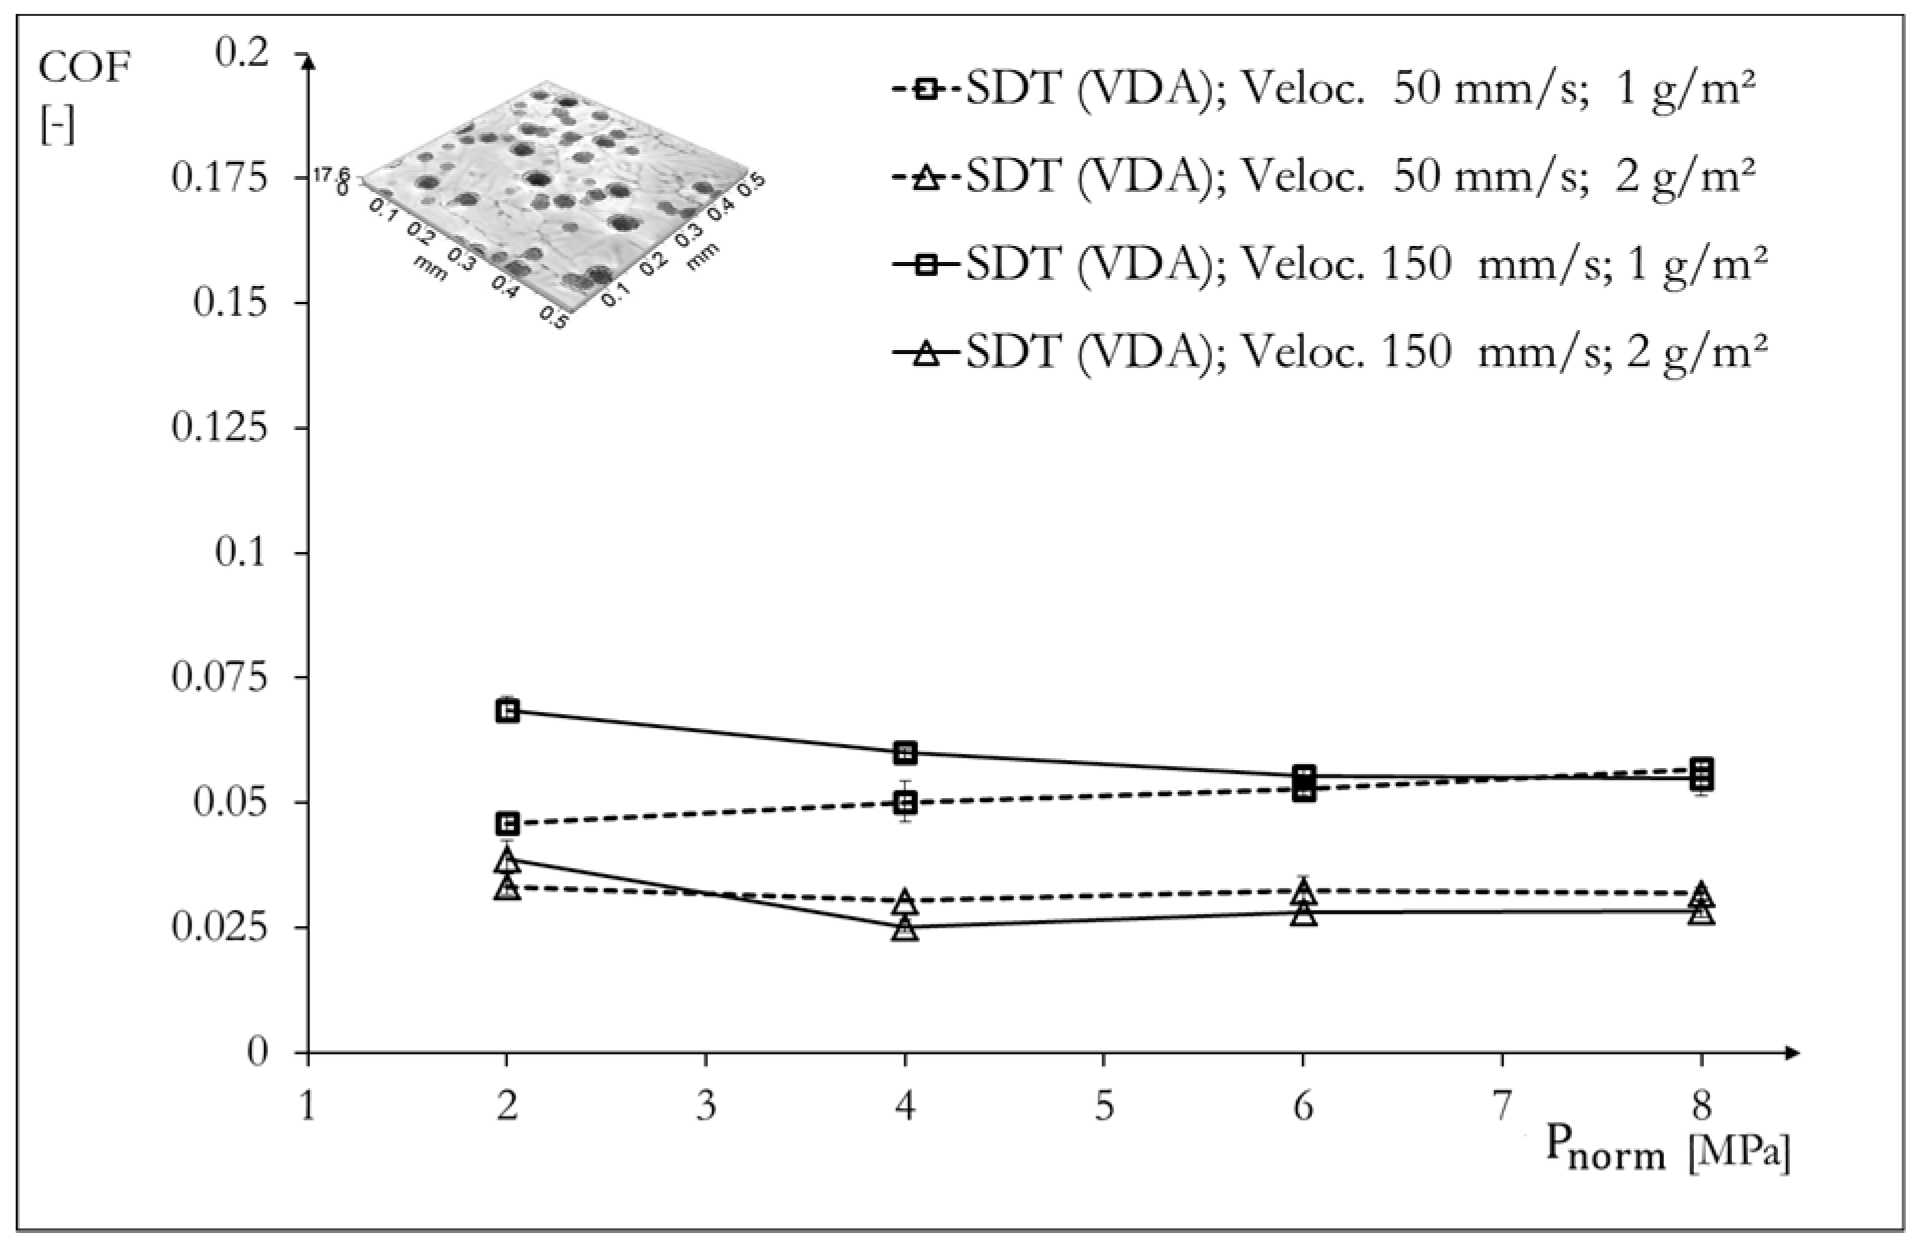
Figure 6.
Friction coefficient over contact normal pressure of VDA strip drawing test and minimized strip drawing test (variation of lubricant amount).
Figure 6.
Friction coefficient over contact normal pressure of VDA strip drawing test and minimized strip drawing test (variation of lubricant amount).
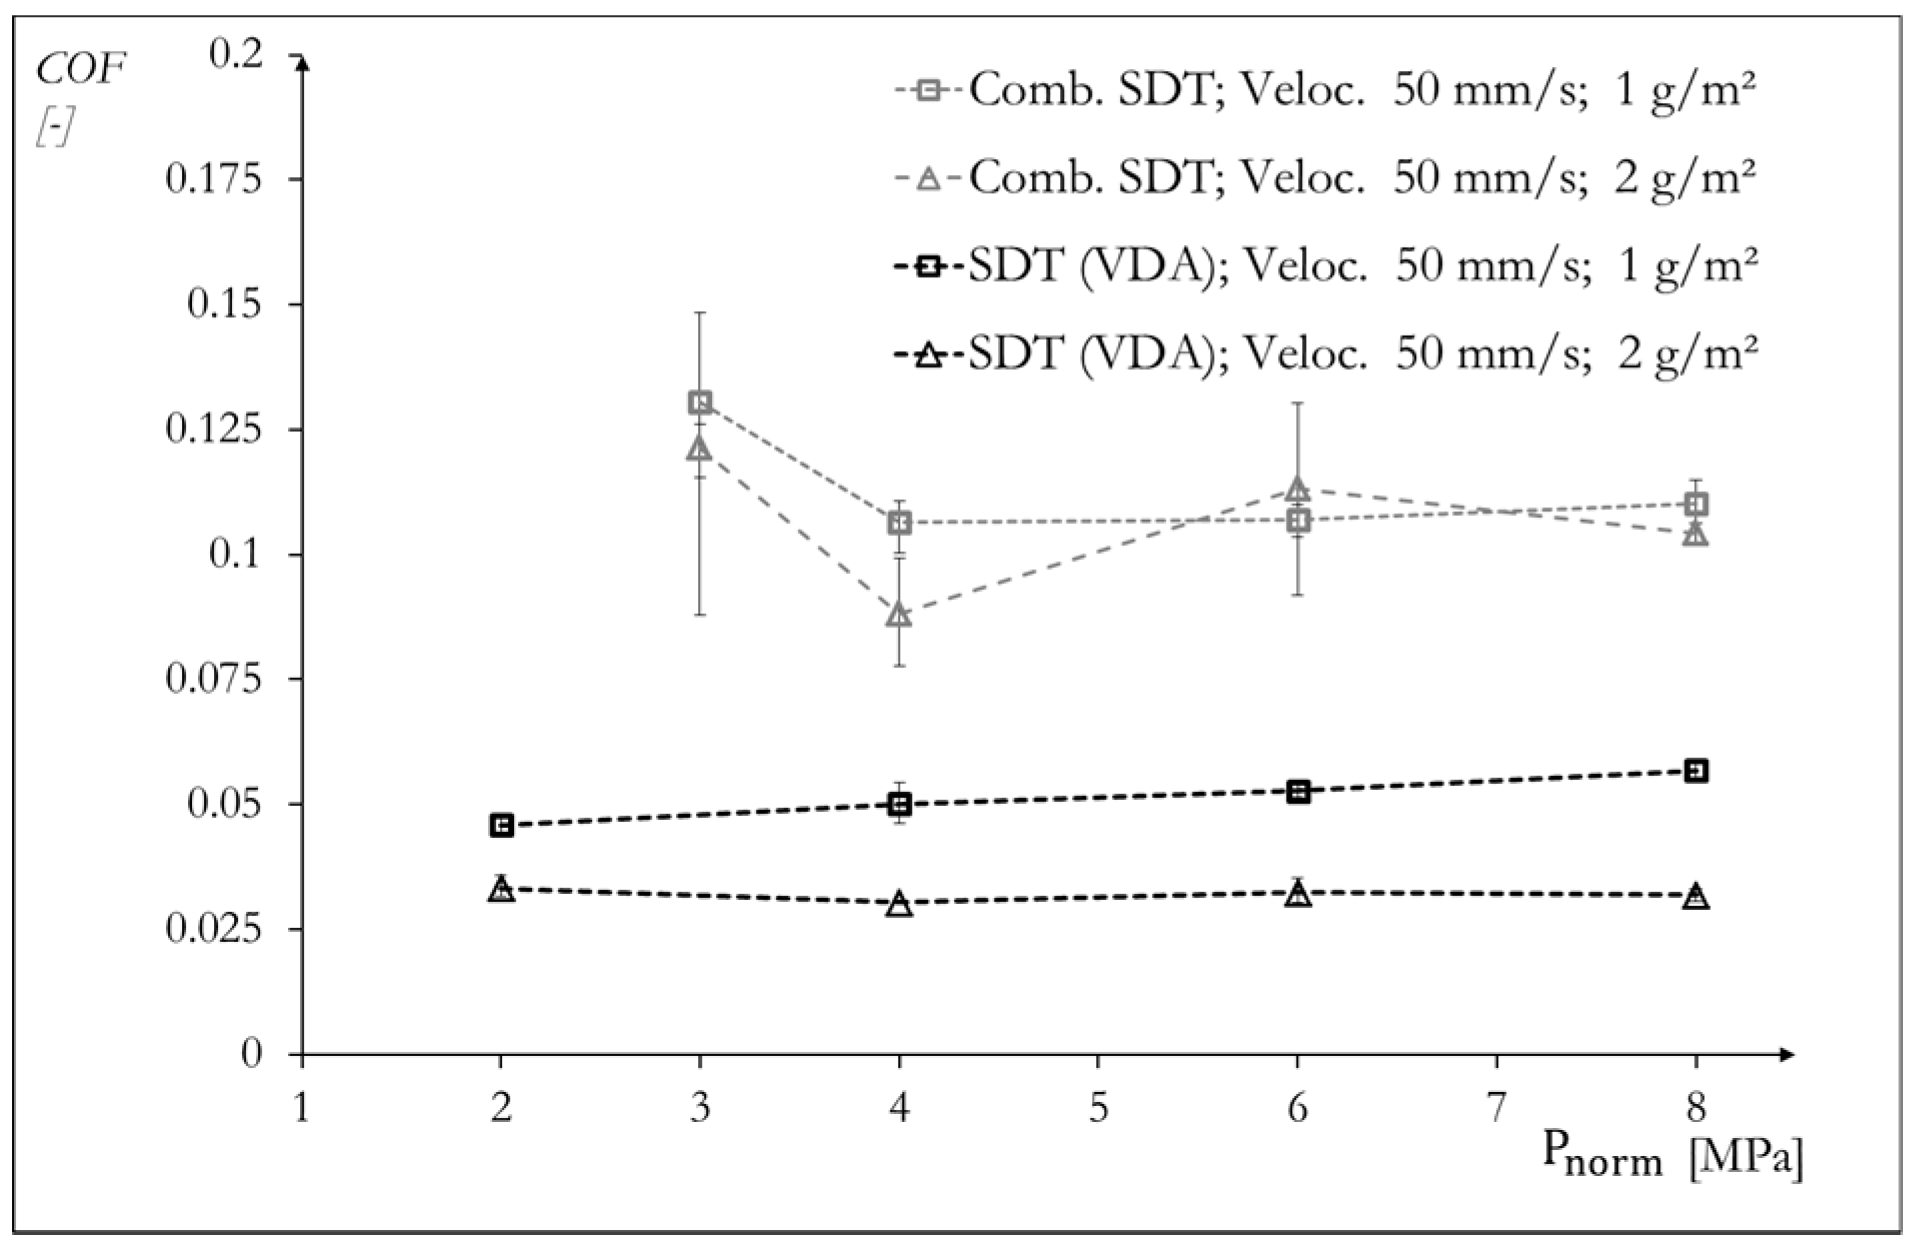
Figure 7.
Friction coefficient over contact normal pressure of VDA strip drawing test stand with different tool geometries and contact sizes.
Figure 7.
Friction coefficient over contact normal pressure of VDA strip drawing test stand with different tool geometries and contact sizes.

Figure 8.
Friction coefficient over contact normal pressure of VDA strip drawing test and combined strip drawing test using the same tool size (variation of lubricant amount).
Figure 8.
Friction coefficient over contact normal pressure of VDA strip drawing test and combined strip drawing test using the same tool size (variation of lubricant amount).

Figure 9.
Sketch of the tool-blank contact with entrapped lubricant.

Figure 10.
Comparison of the incremental hydraulic resistance for different contact areas (left: small tool, right: VDA tool).
Figure 10.
Comparison of the incremental hydraulic resistance for different contact areas (left: small tool, right: VDA tool).

Figure 11.
F-scanner with illustration of the working principle [19] and the identification of the single components [20].

Figure 12.
Measuring principle and illustration of the LUBRI-Mini [21].
Figure 12.
Measuring principle and illustration of the LUBRI-Mini [21].

Figure 13.
Median value of the lubricant distribution over the width of the tool.

Figure 14.
Median value of the lubricant distribution over the length of the tool.
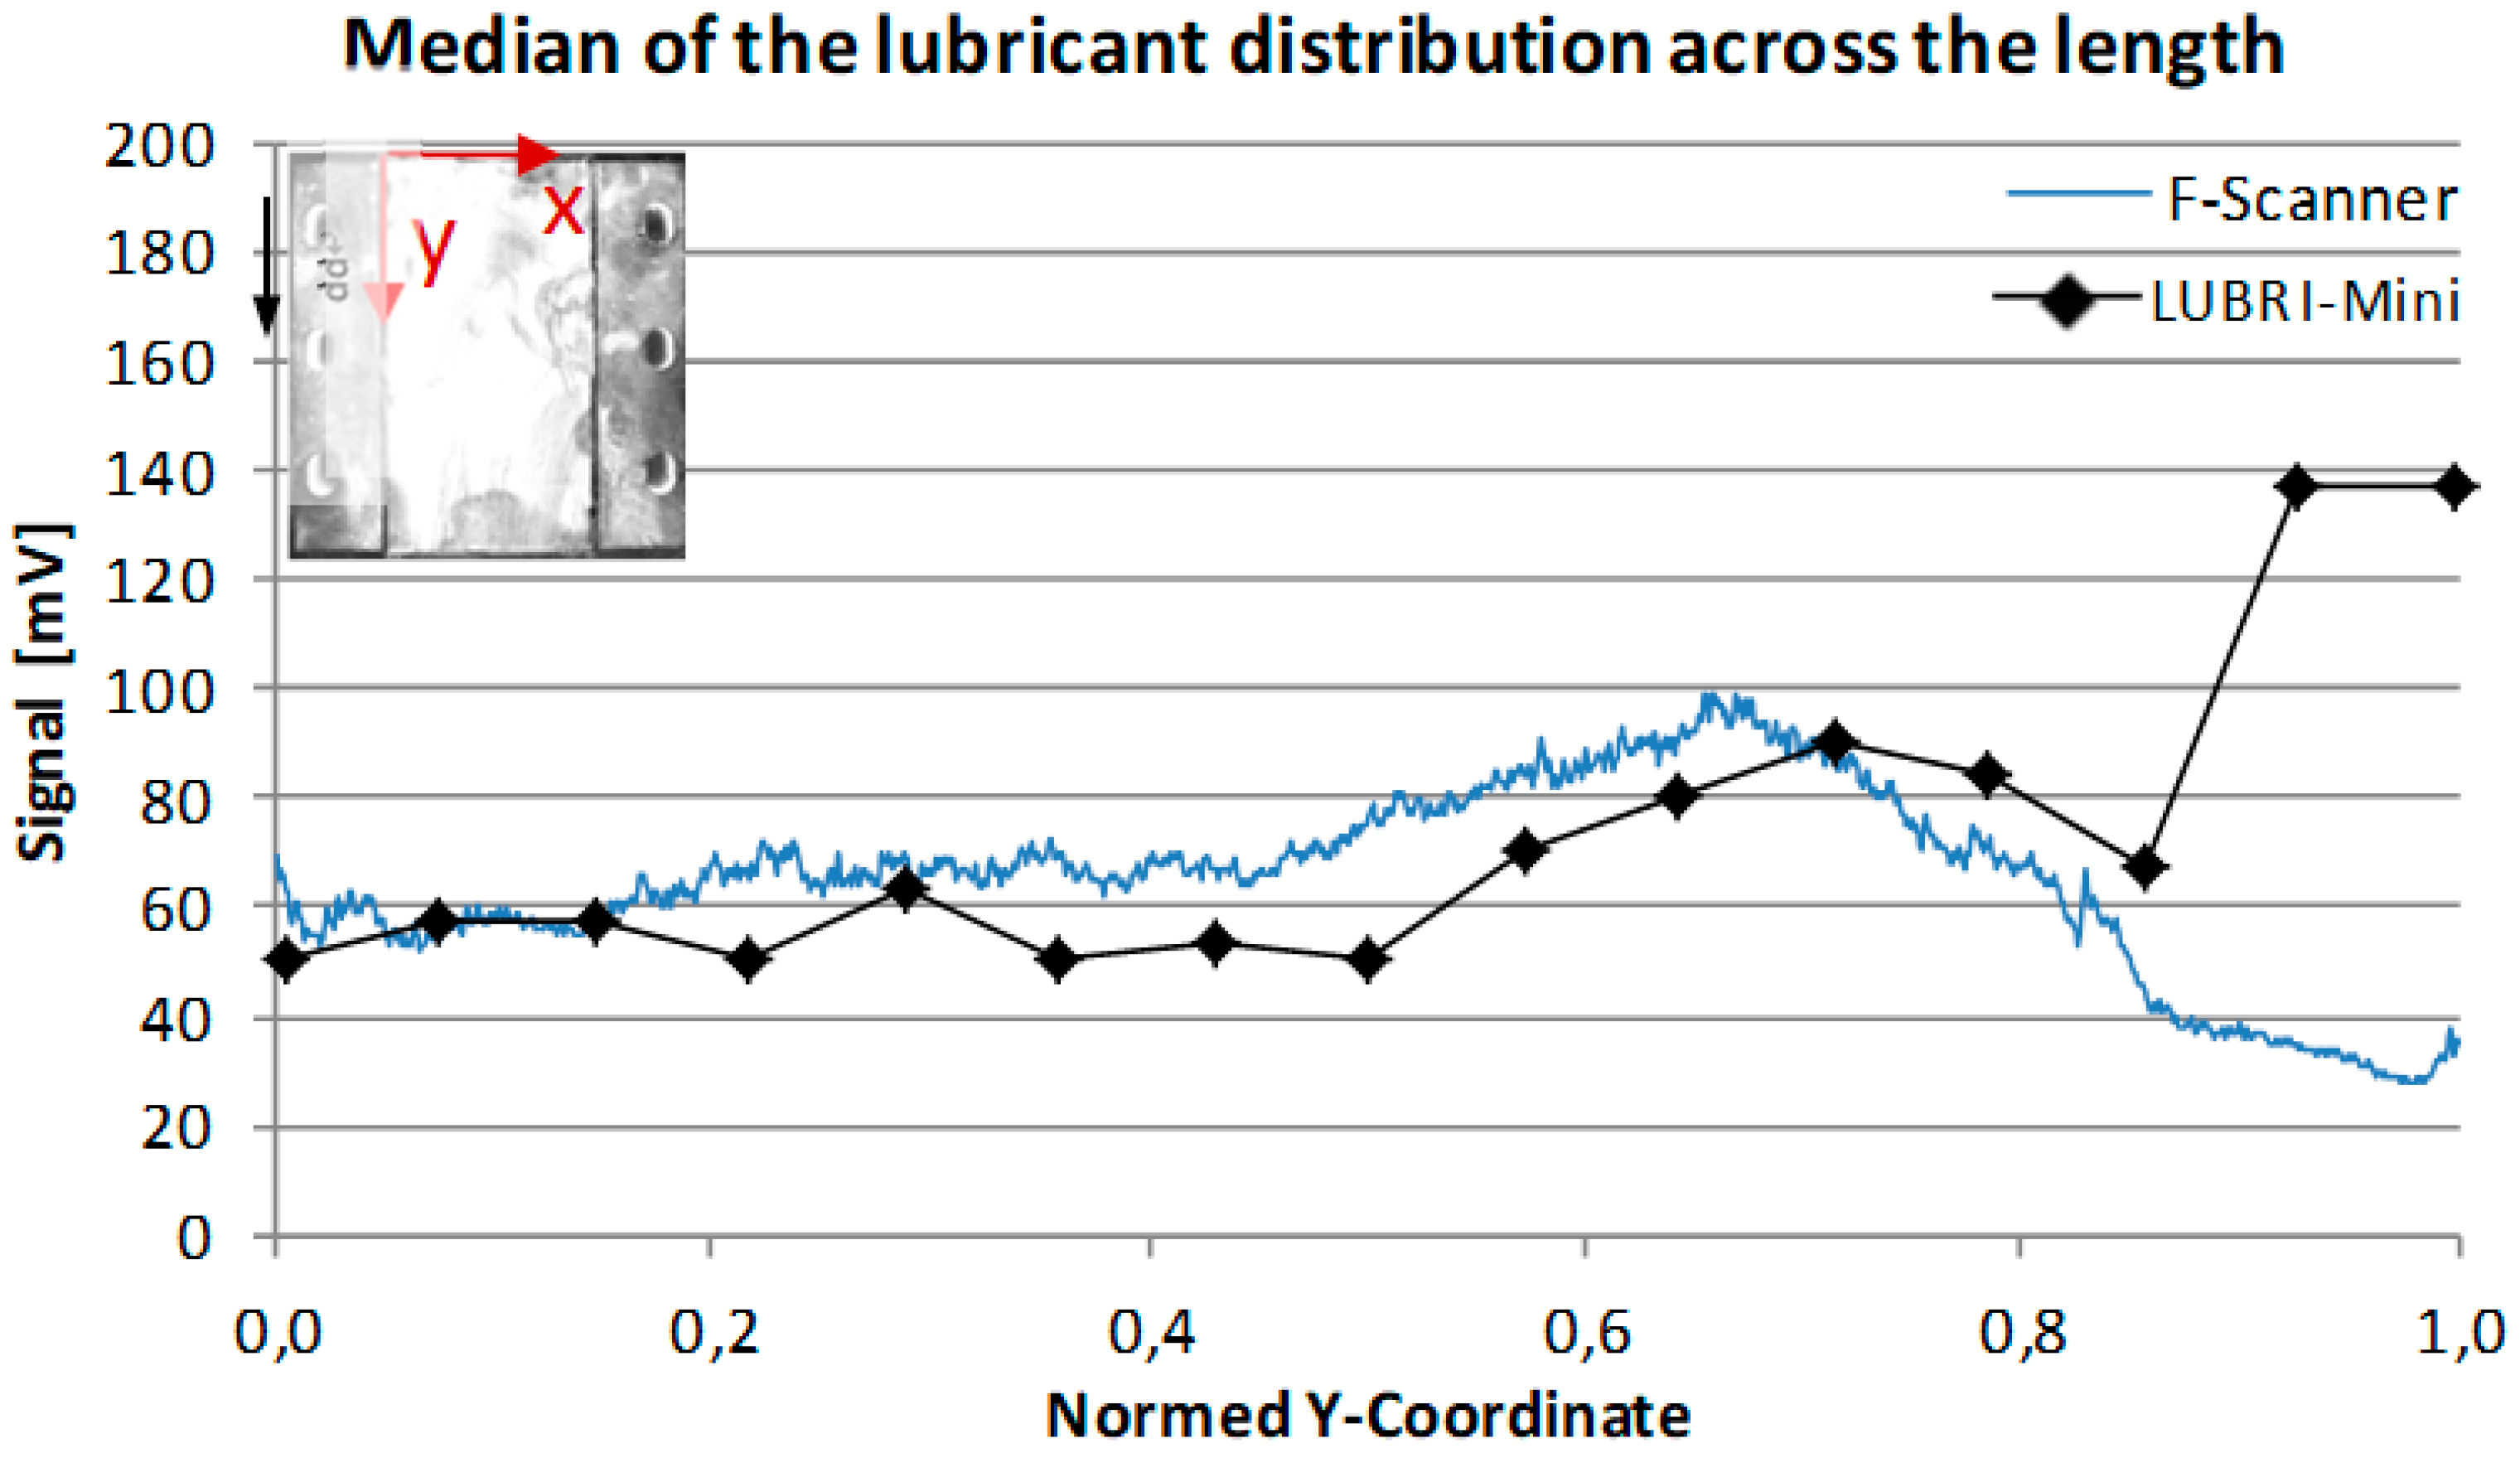
Figure 15.
Median of the lubricant distribution across the width (left) and across the length (right) using the LUBRI-Mini.
Figure 15.
Median of the lubricant distribution across the width (left) and across the length (right) using the LUBRI-Mini.

Figure 16.
Comparison of the mean lubricant distribution over the contact area of the small and the VDA tool.
Figure 16.
Comparison of the mean lubricant distribution over the contact area of the small and the VDA tool.

Table 1.
Experimental parameters.
| Test Stand | Strip Draw Test VDA-Standard | Strip Draw Test VDA-Standard (Small Tool) | Minimized Strip Draw Test |
|---|---|---|---|
| Contact Size [cm2] | 100 | 16 | 16 |
| Velocity [mm/s] | 50; 150 | 50; 150 | 50; 150 |
| Lubricant Amount [g/m2] | 1; 2 | 1; 2 | 1; 2 |
| Pressure [MPa] | 2; 4; 6; 8 | 2; 5; 4; 6; 8 | 3; 4; 6; 8 |
| Drawing Length [mm] | 200 | ||
© 2018 by the authors. Licensee MDPI, Basel, Switzerland. This article is an open access article distributed under the terms and conditions of the Creative Commons Attribution (CC BY) license (http://creativecommons.org/licenses/by/4.0/).
Share and Cite
MDPI and ACS Style
Recklin, V.; Dietrich, F.; Groche, P. Influence of Test Stand and Contact Size Sensitivity on the Friction Coefficient in Sheet Metal Forming. Lubricants 2018, 6, 41. https://doi.org/10.3390/lubricants6020041
AMA Style
Recklin V, Dietrich F, Groche P. Influence of Test Stand and Contact Size Sensitivity on the Friction Coefficient in Sheet Metal Forming. Lubricants. 2018; 6(2):41. https://doi.org/10.3390/lubricants6020041
Chicago/Turabian StyleRecklin, Viktor, Florian Dietrich, and Peter Groche. 2018. "Influence of Test Stand and Contact Size Sensitivity on the Friction Coefficient in Sheet Metal Forming" Lubricants 6, no. 2: 41. https://doi.org/10.3390/lubricants6020041
Note that from the first issue of 2016, this journal uses article numbers instead of page numbers. See further details here.