
A Tribological Assessment of Ultra High Molecular Weight Polyethylene Types GUR 1020 and GUR 1050 for Orthopedic Applications

Abstract
:
1. Introduction
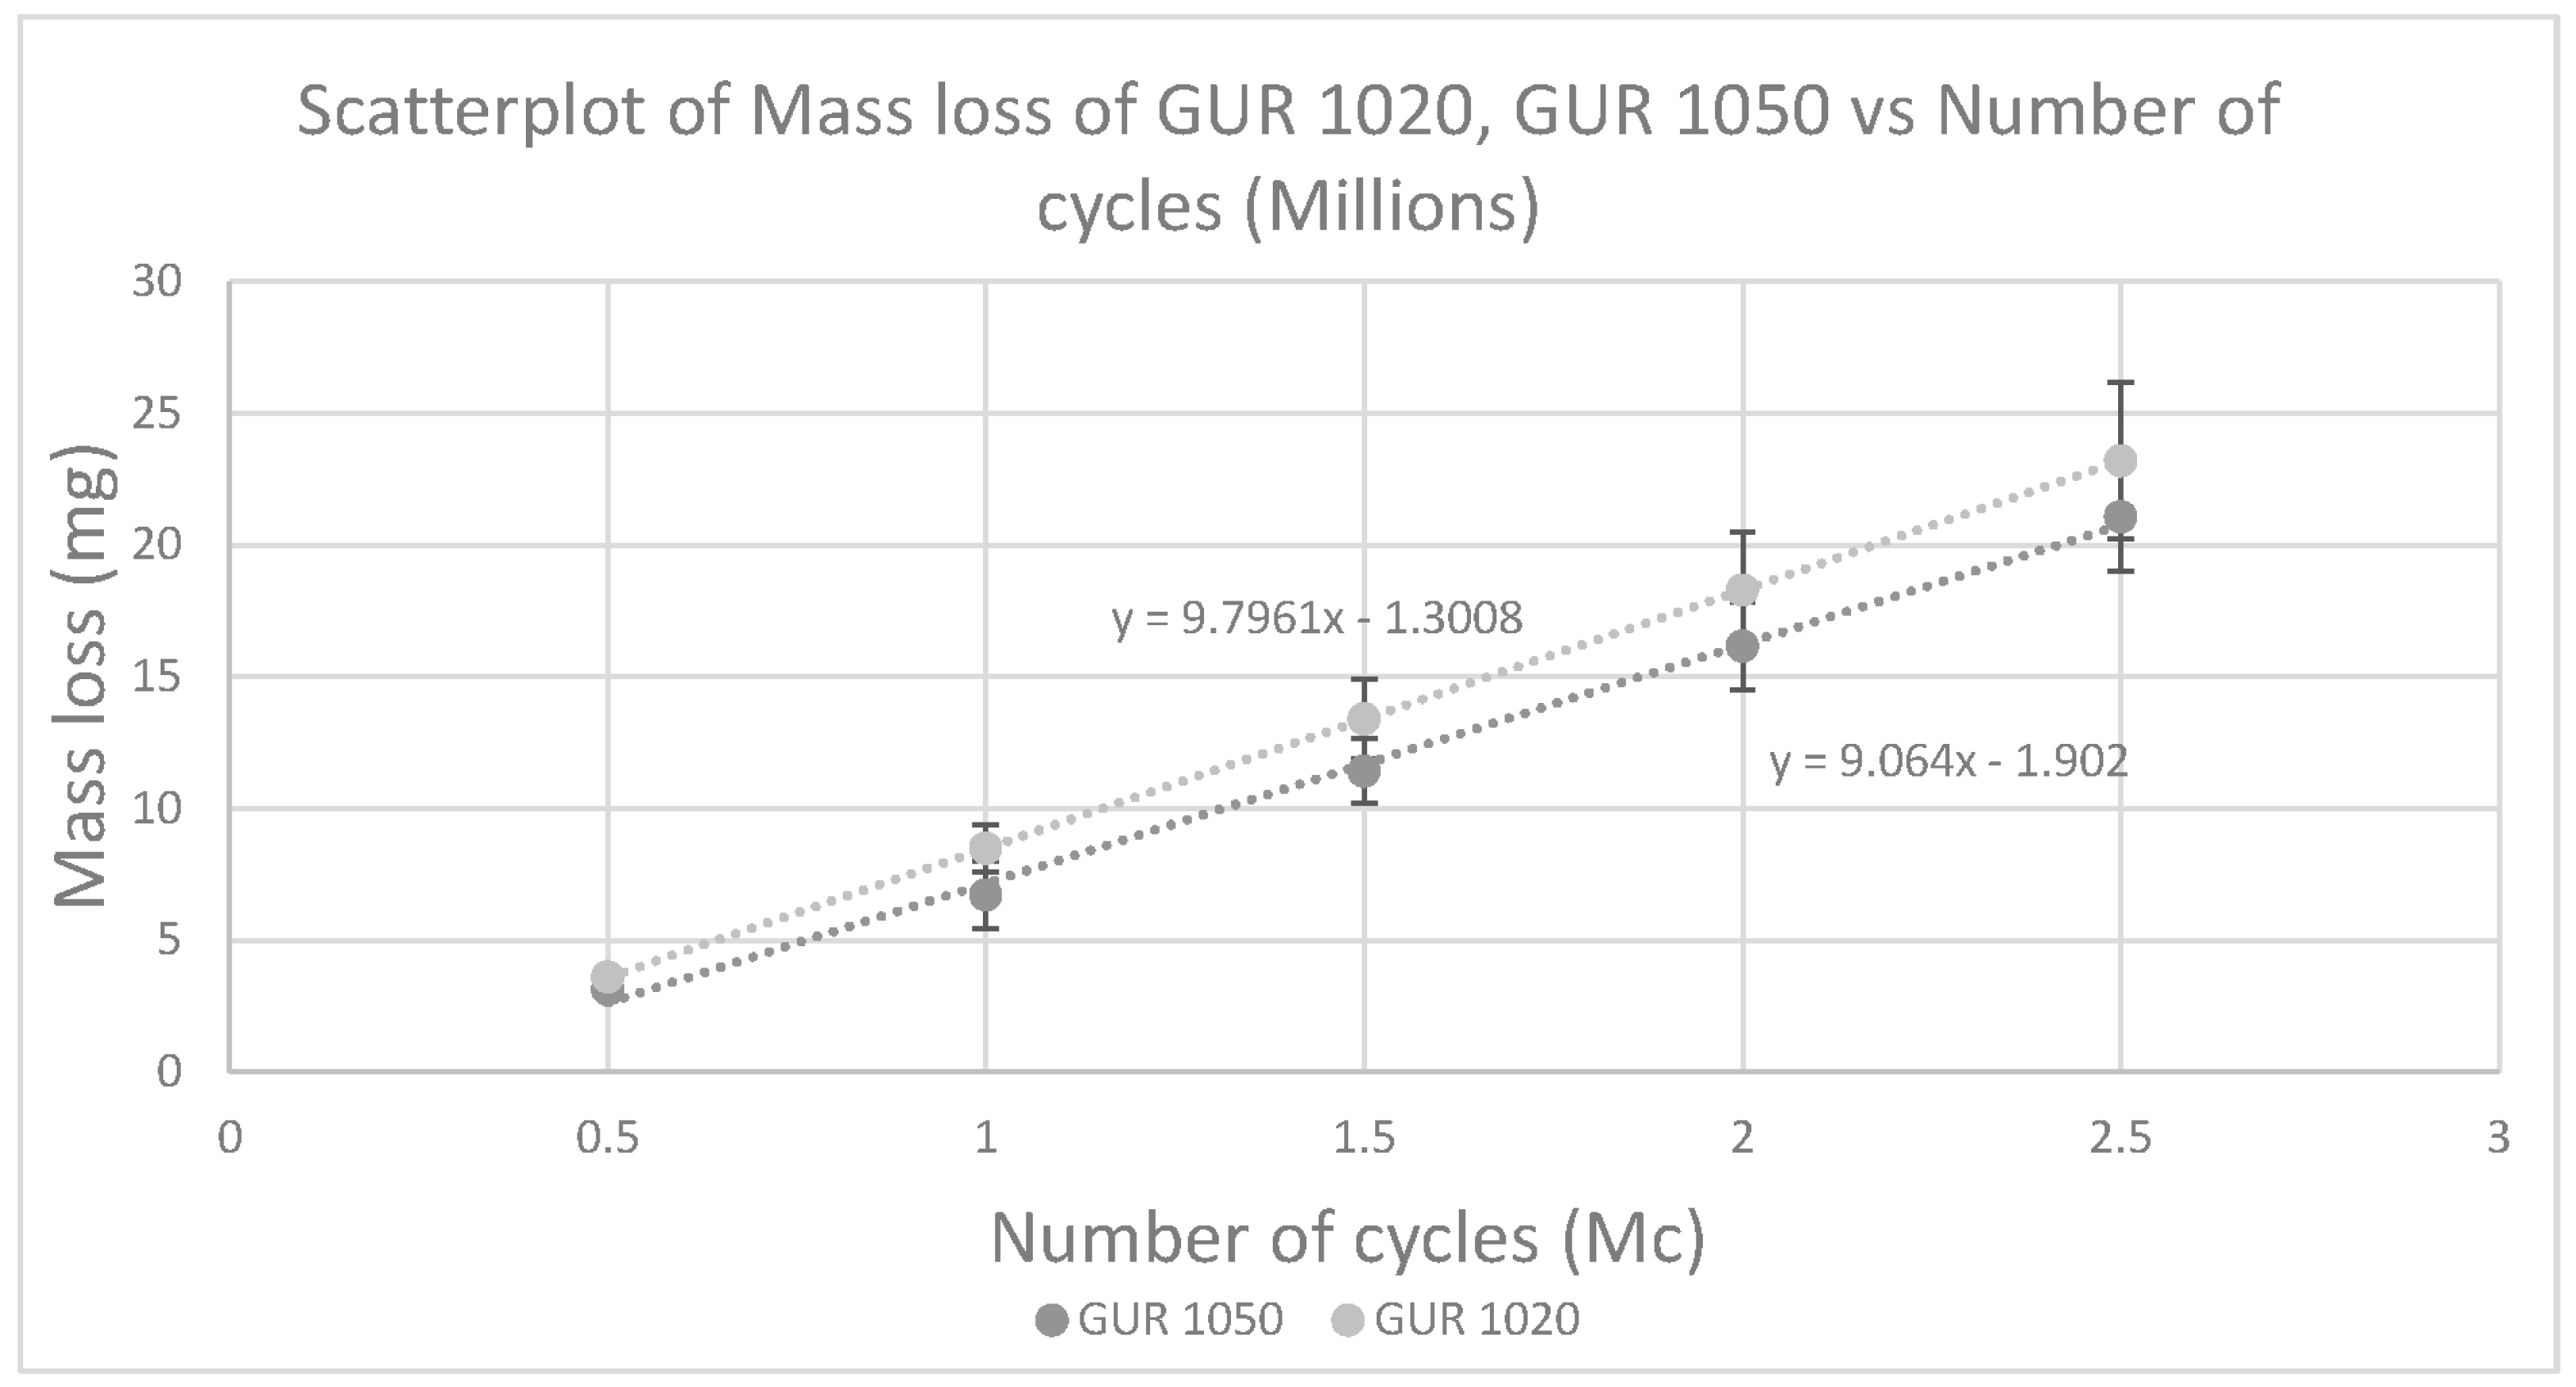
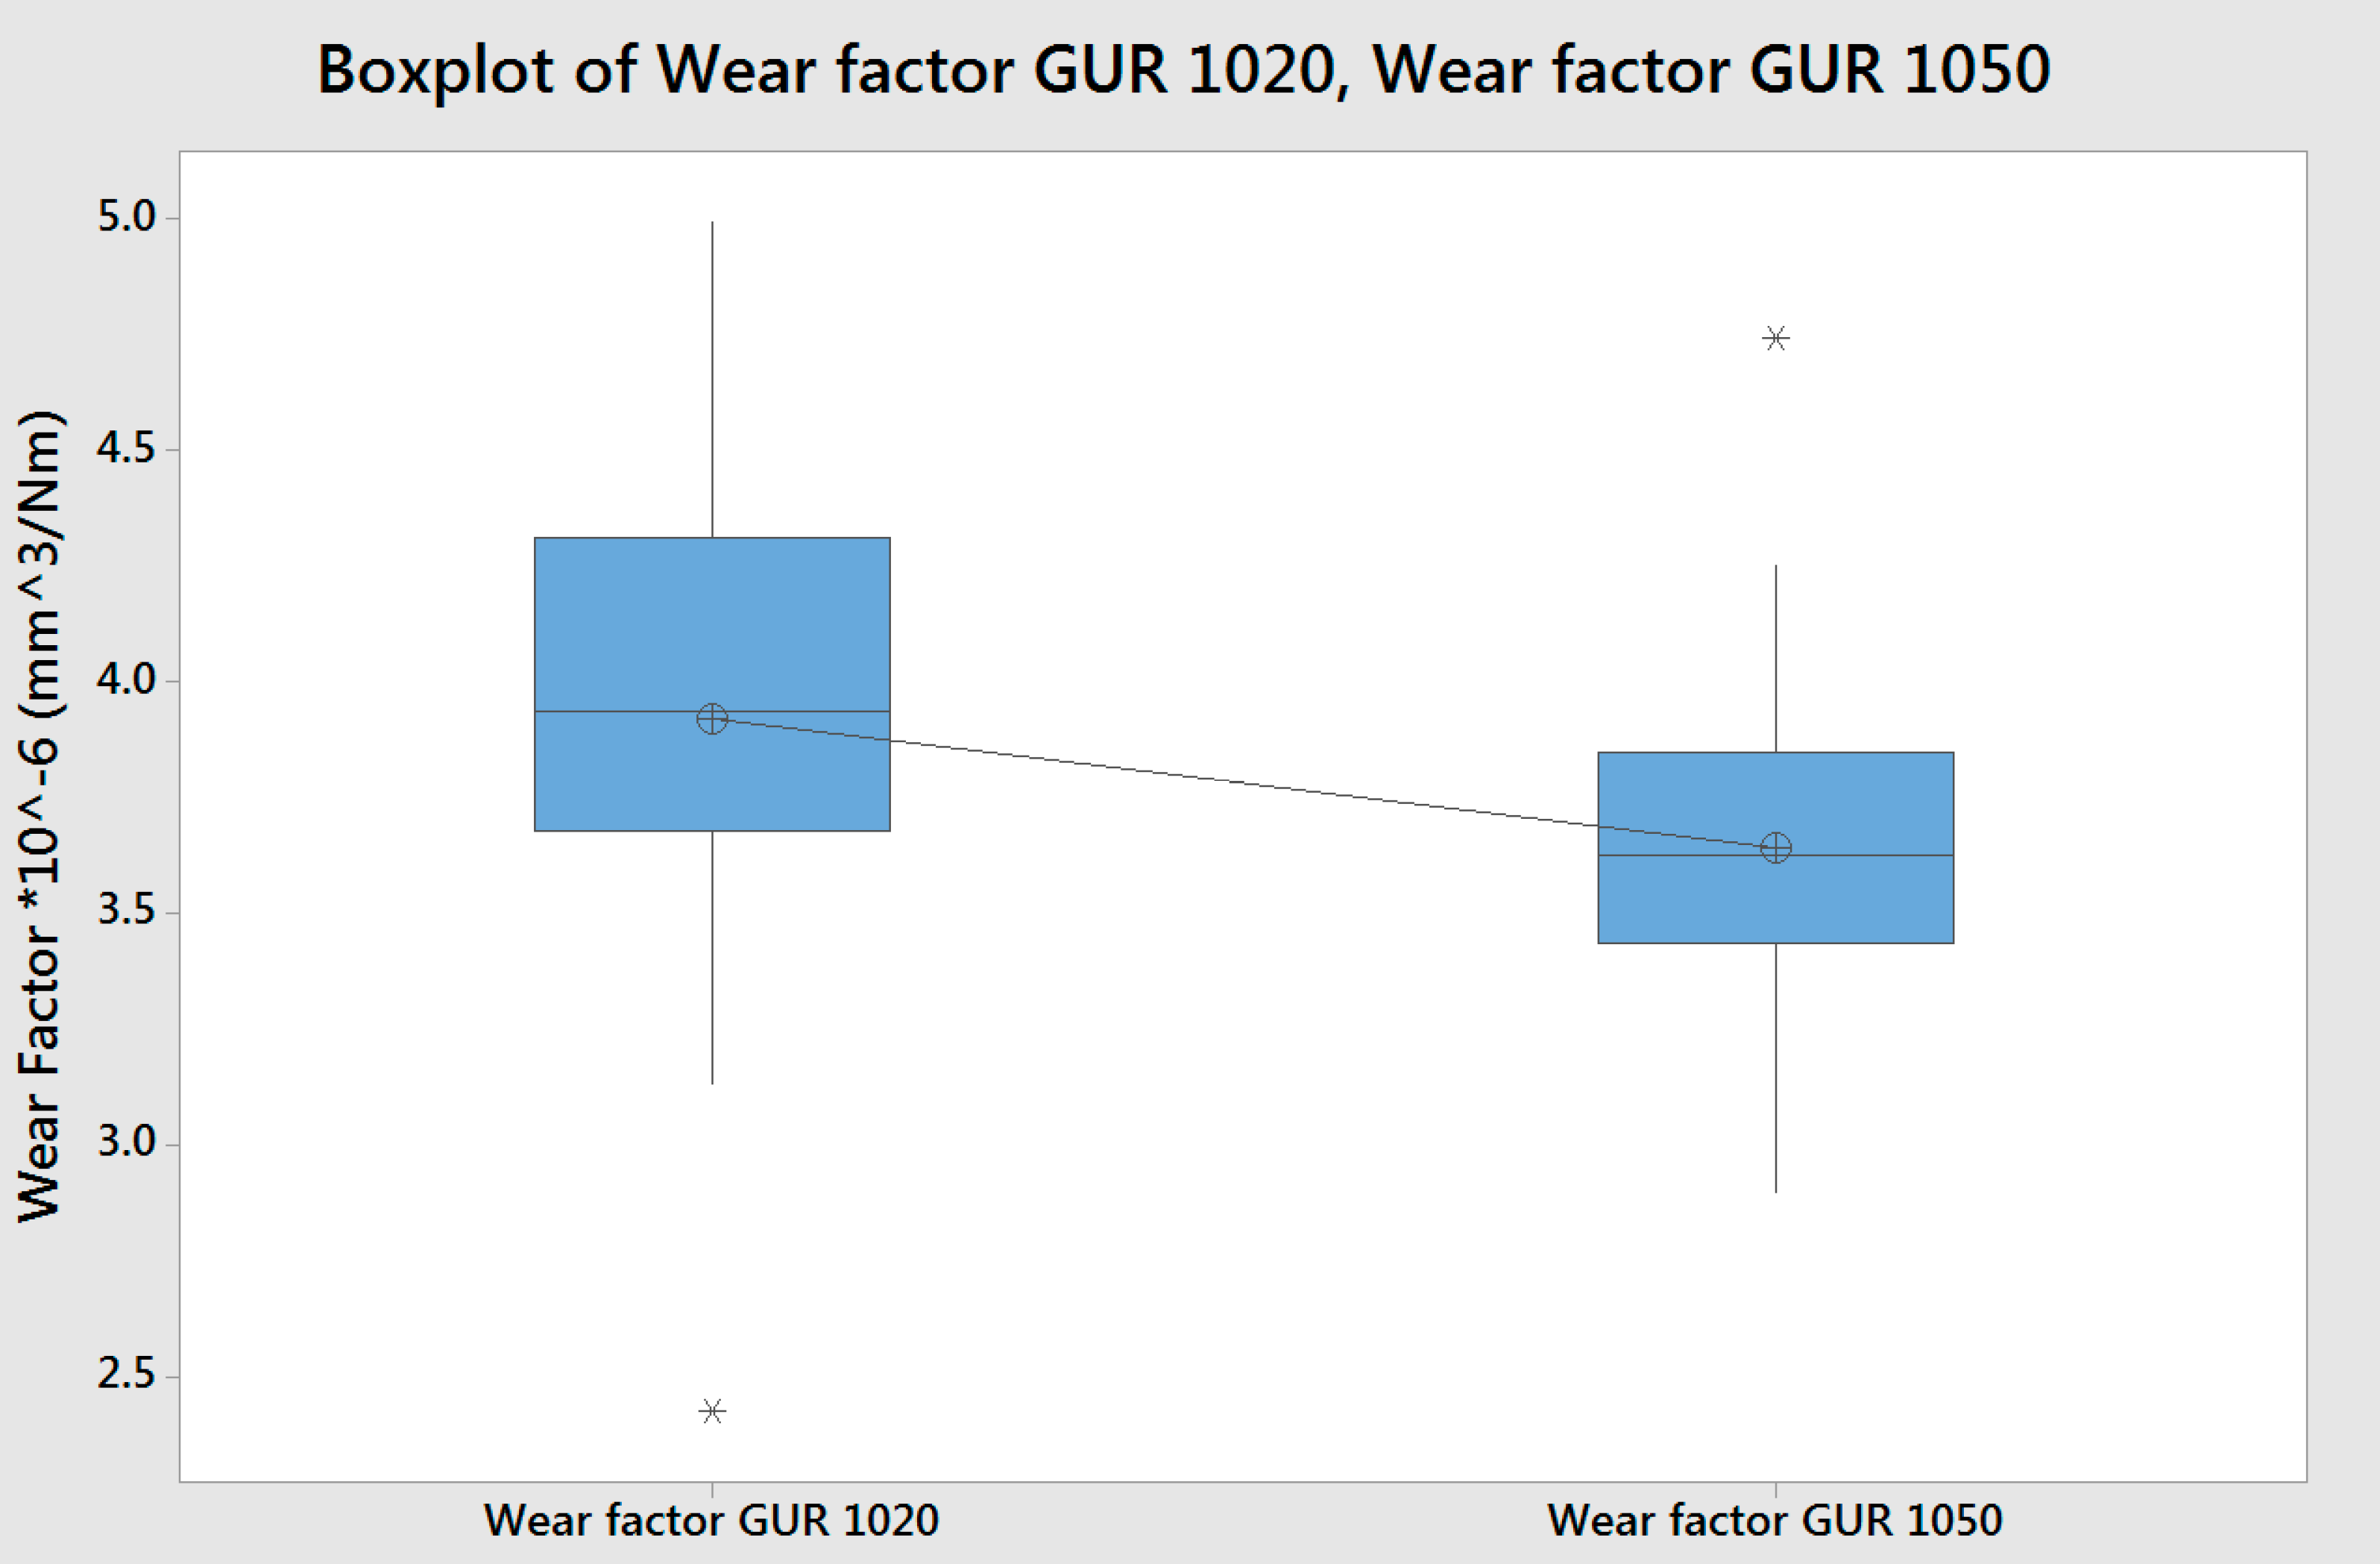
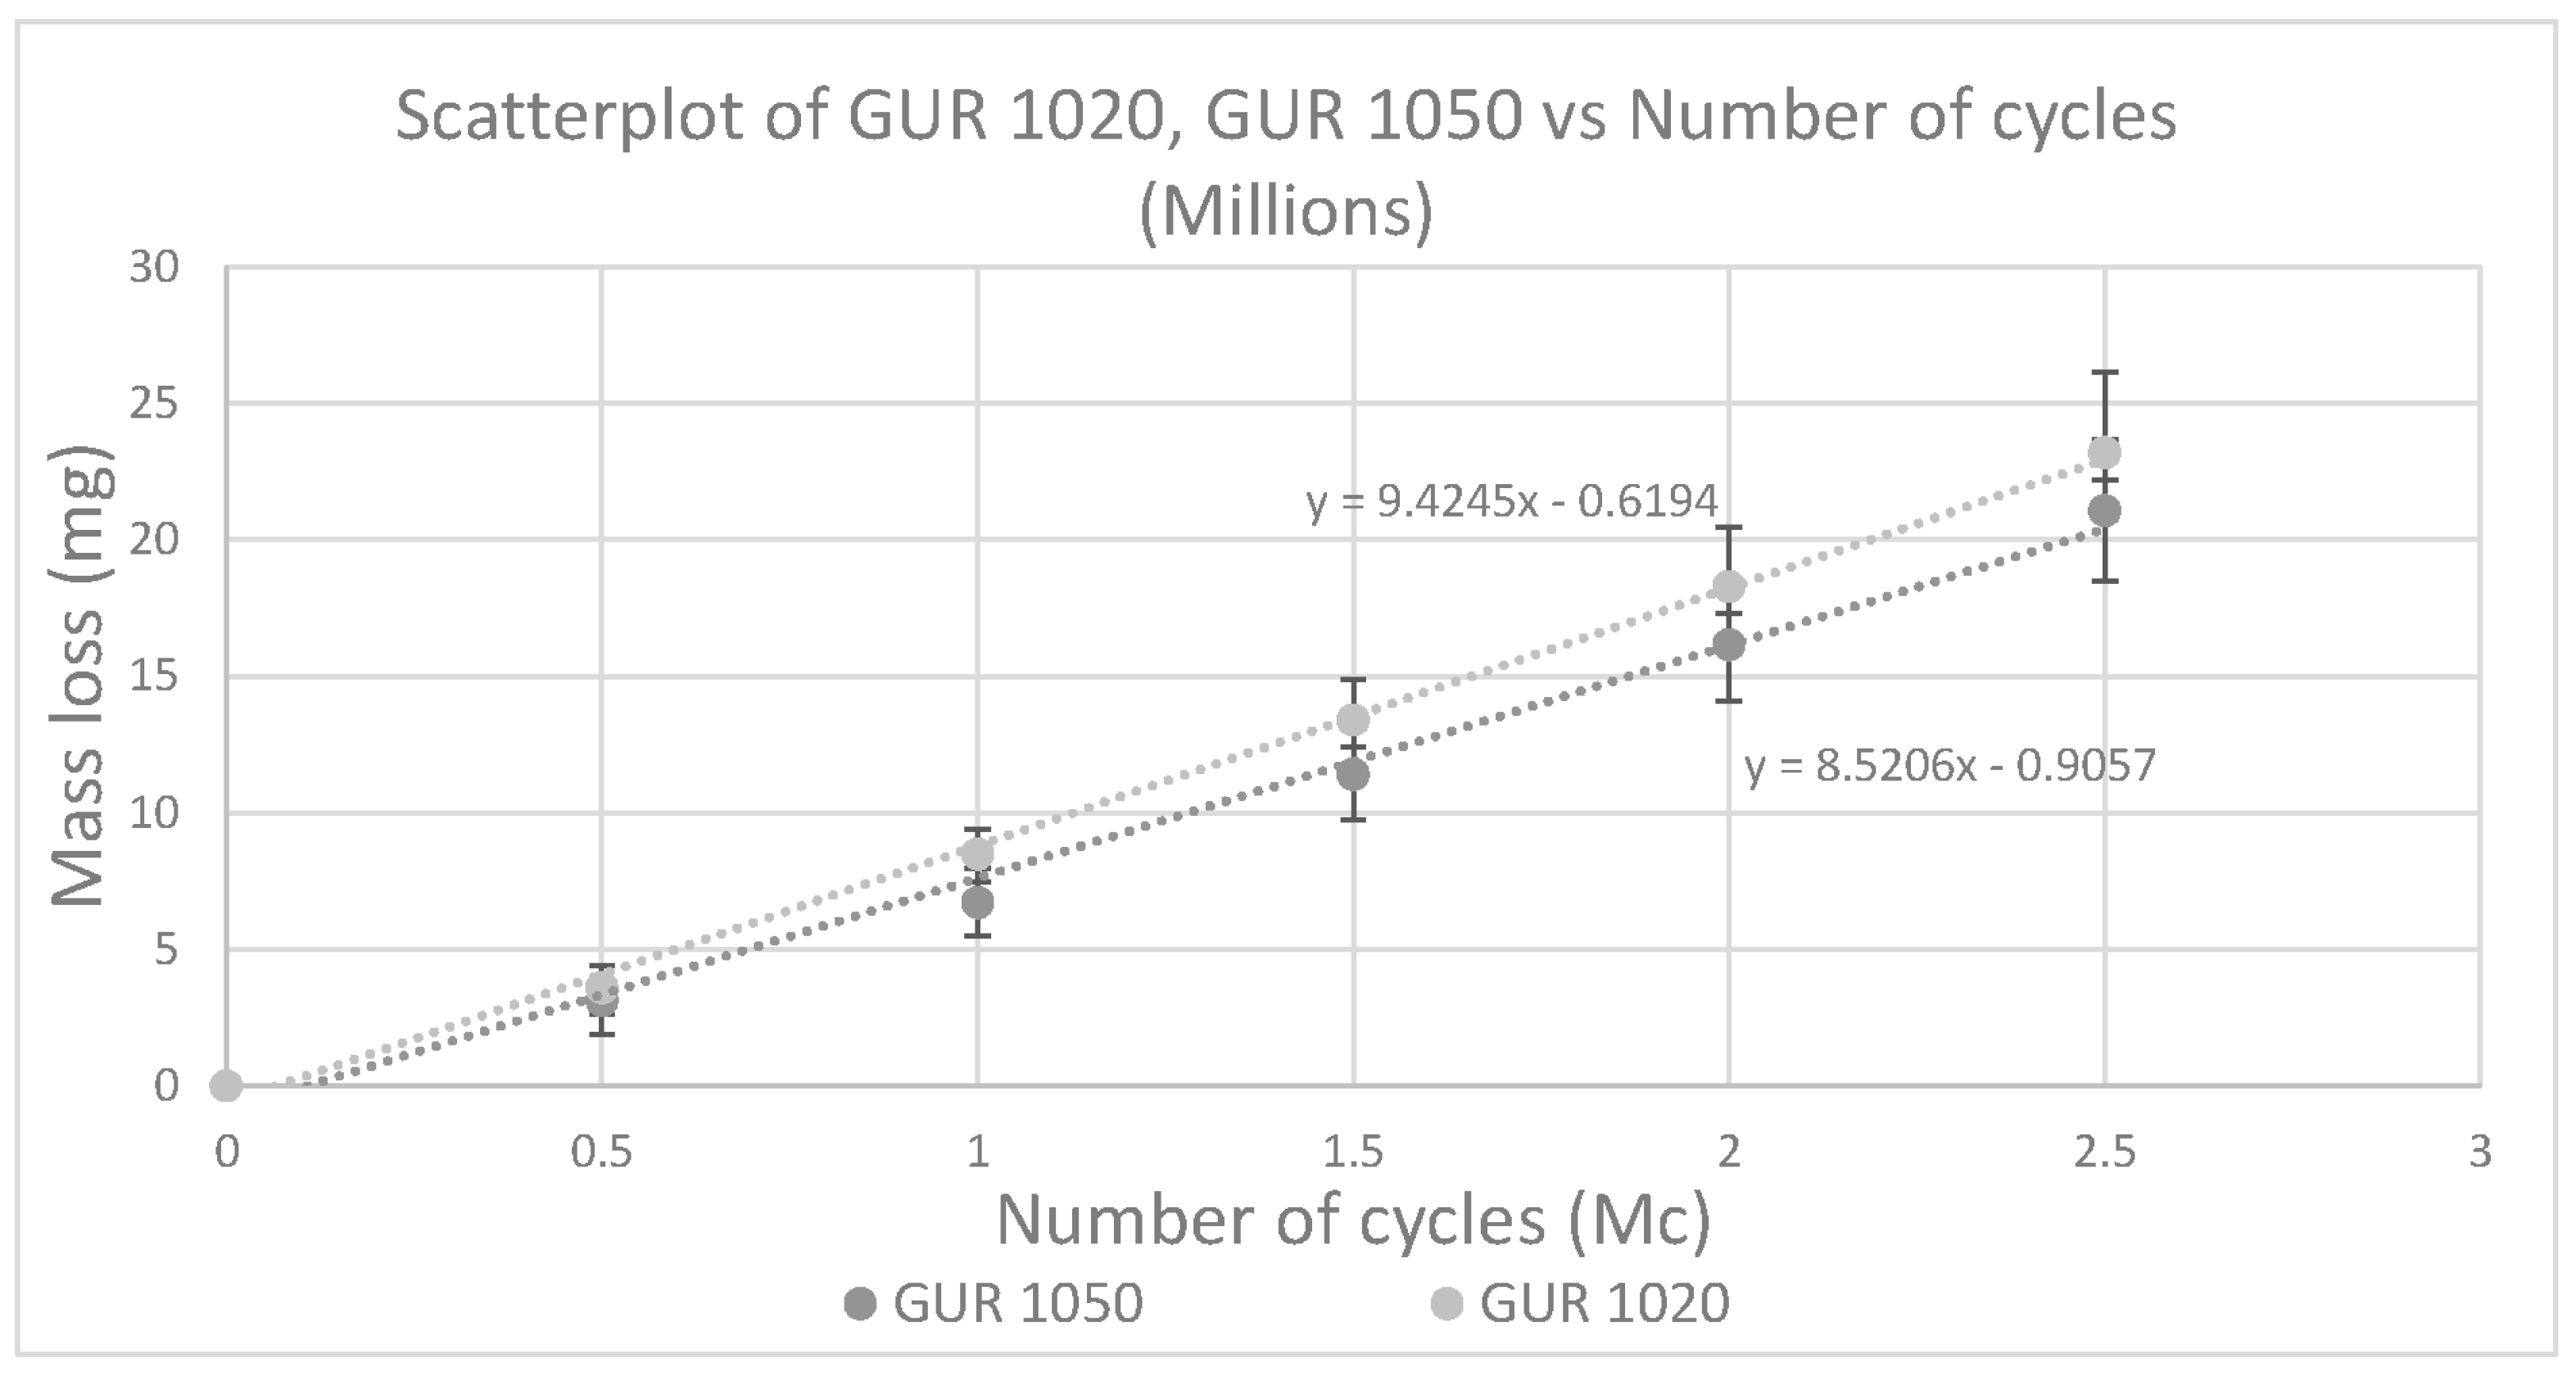
2. Results
2.1. Statistical Analysis
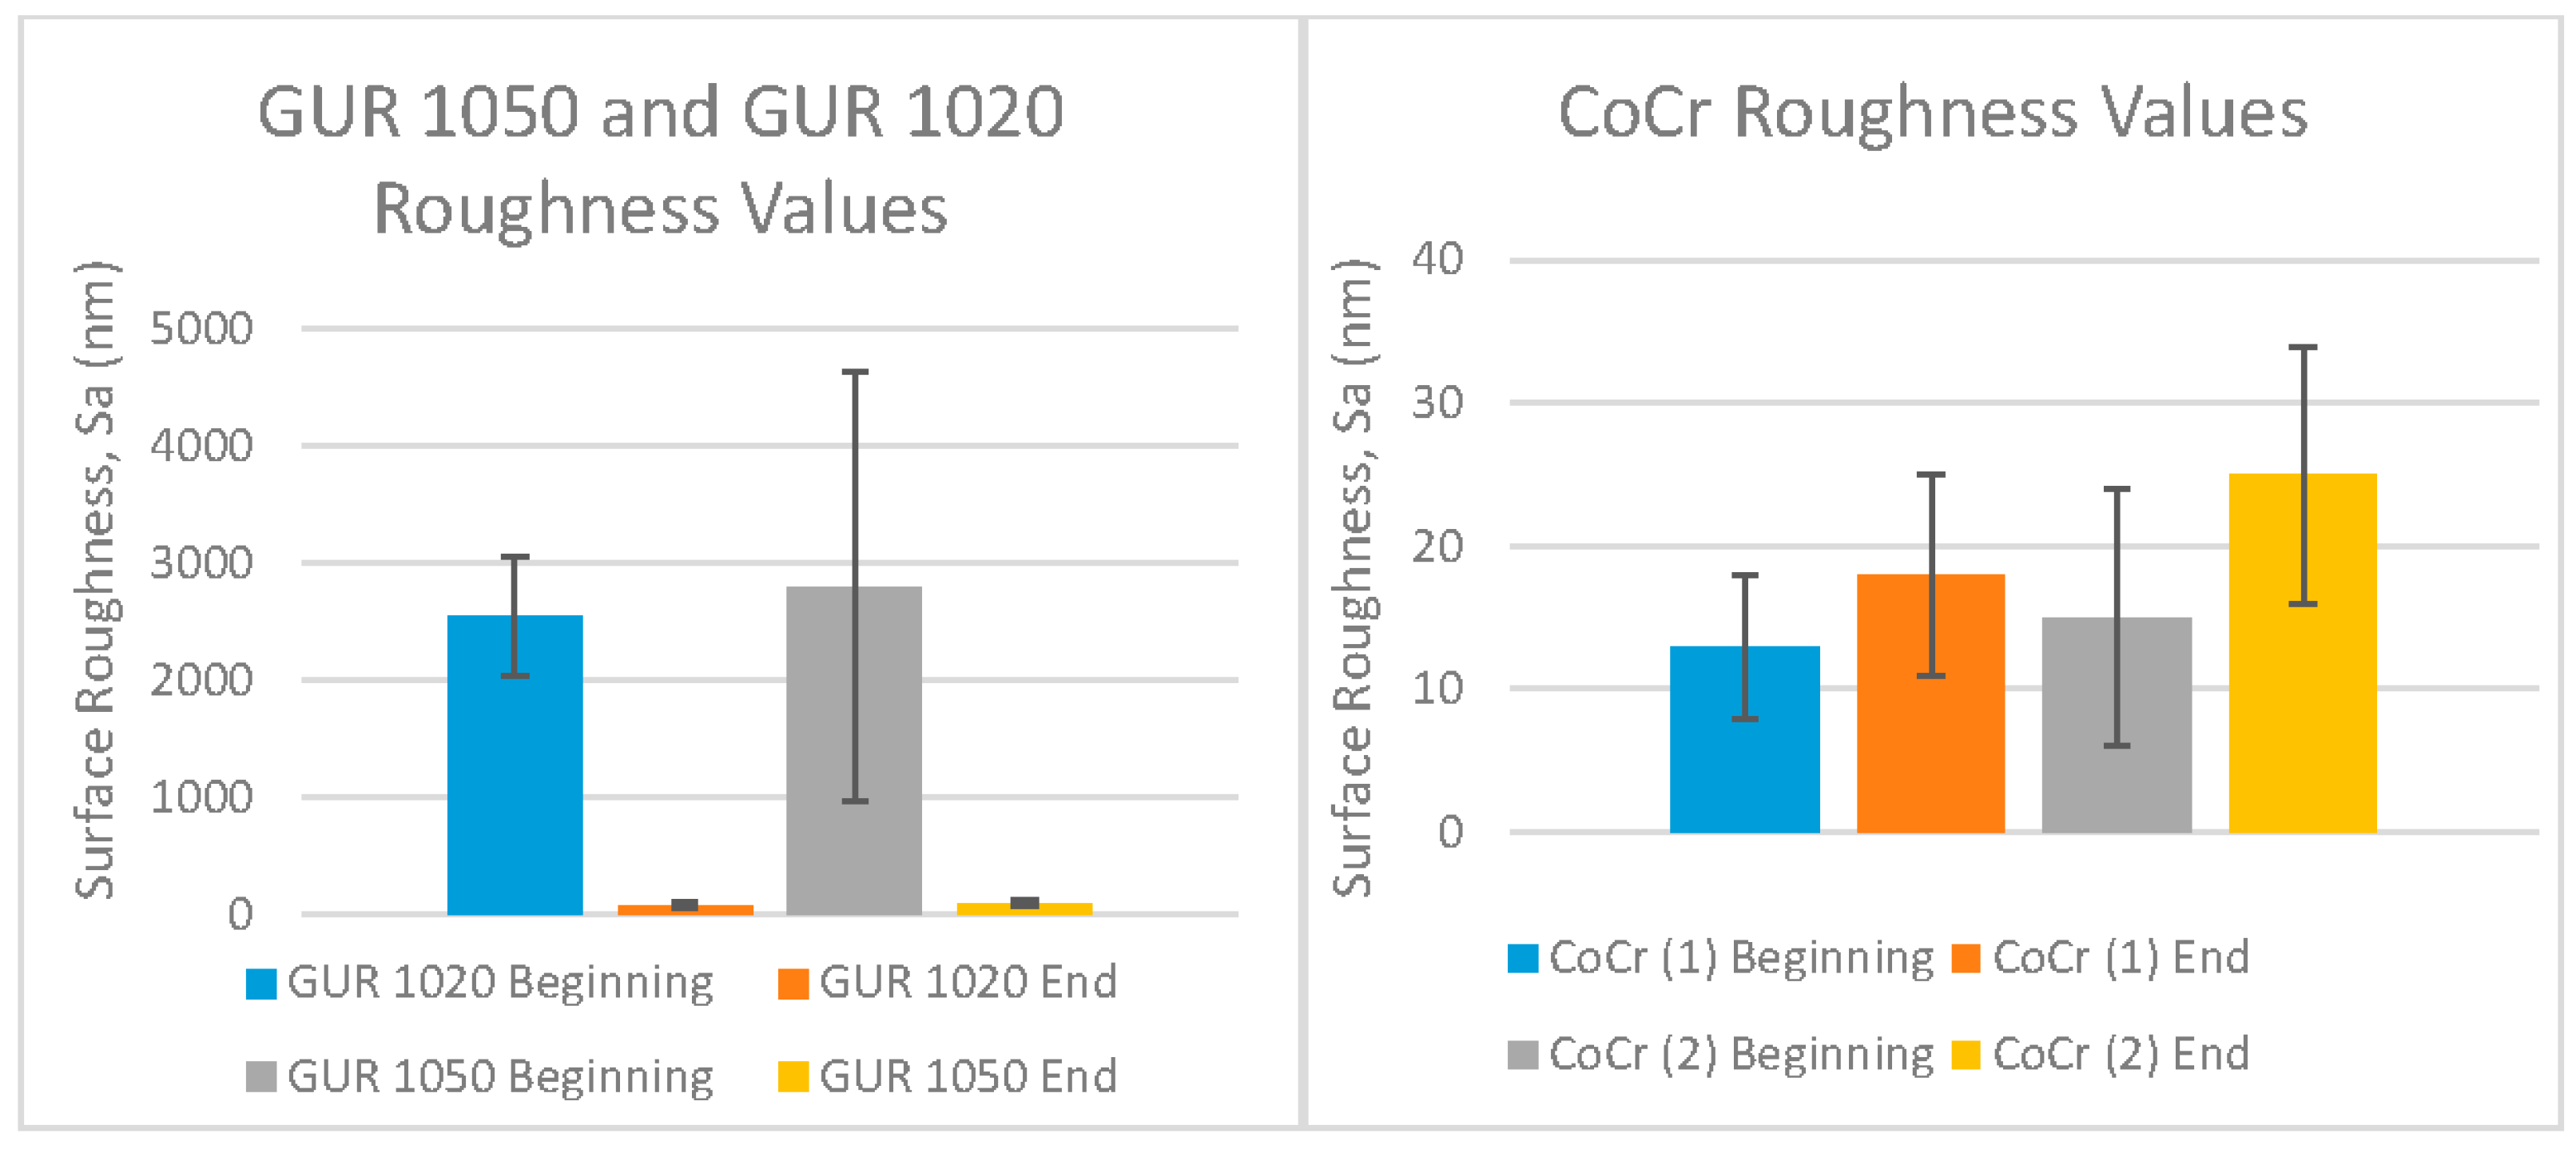
2.2. Surface Profile
2.3. Controls
3. Discussion
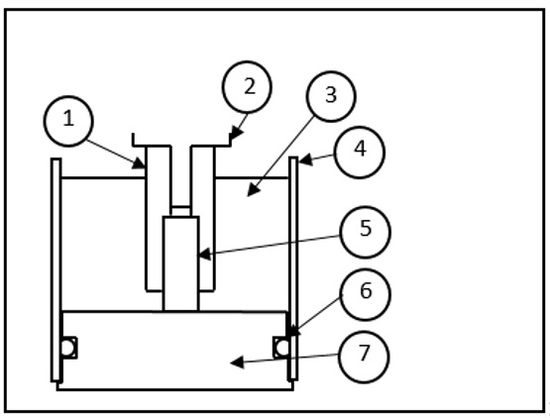
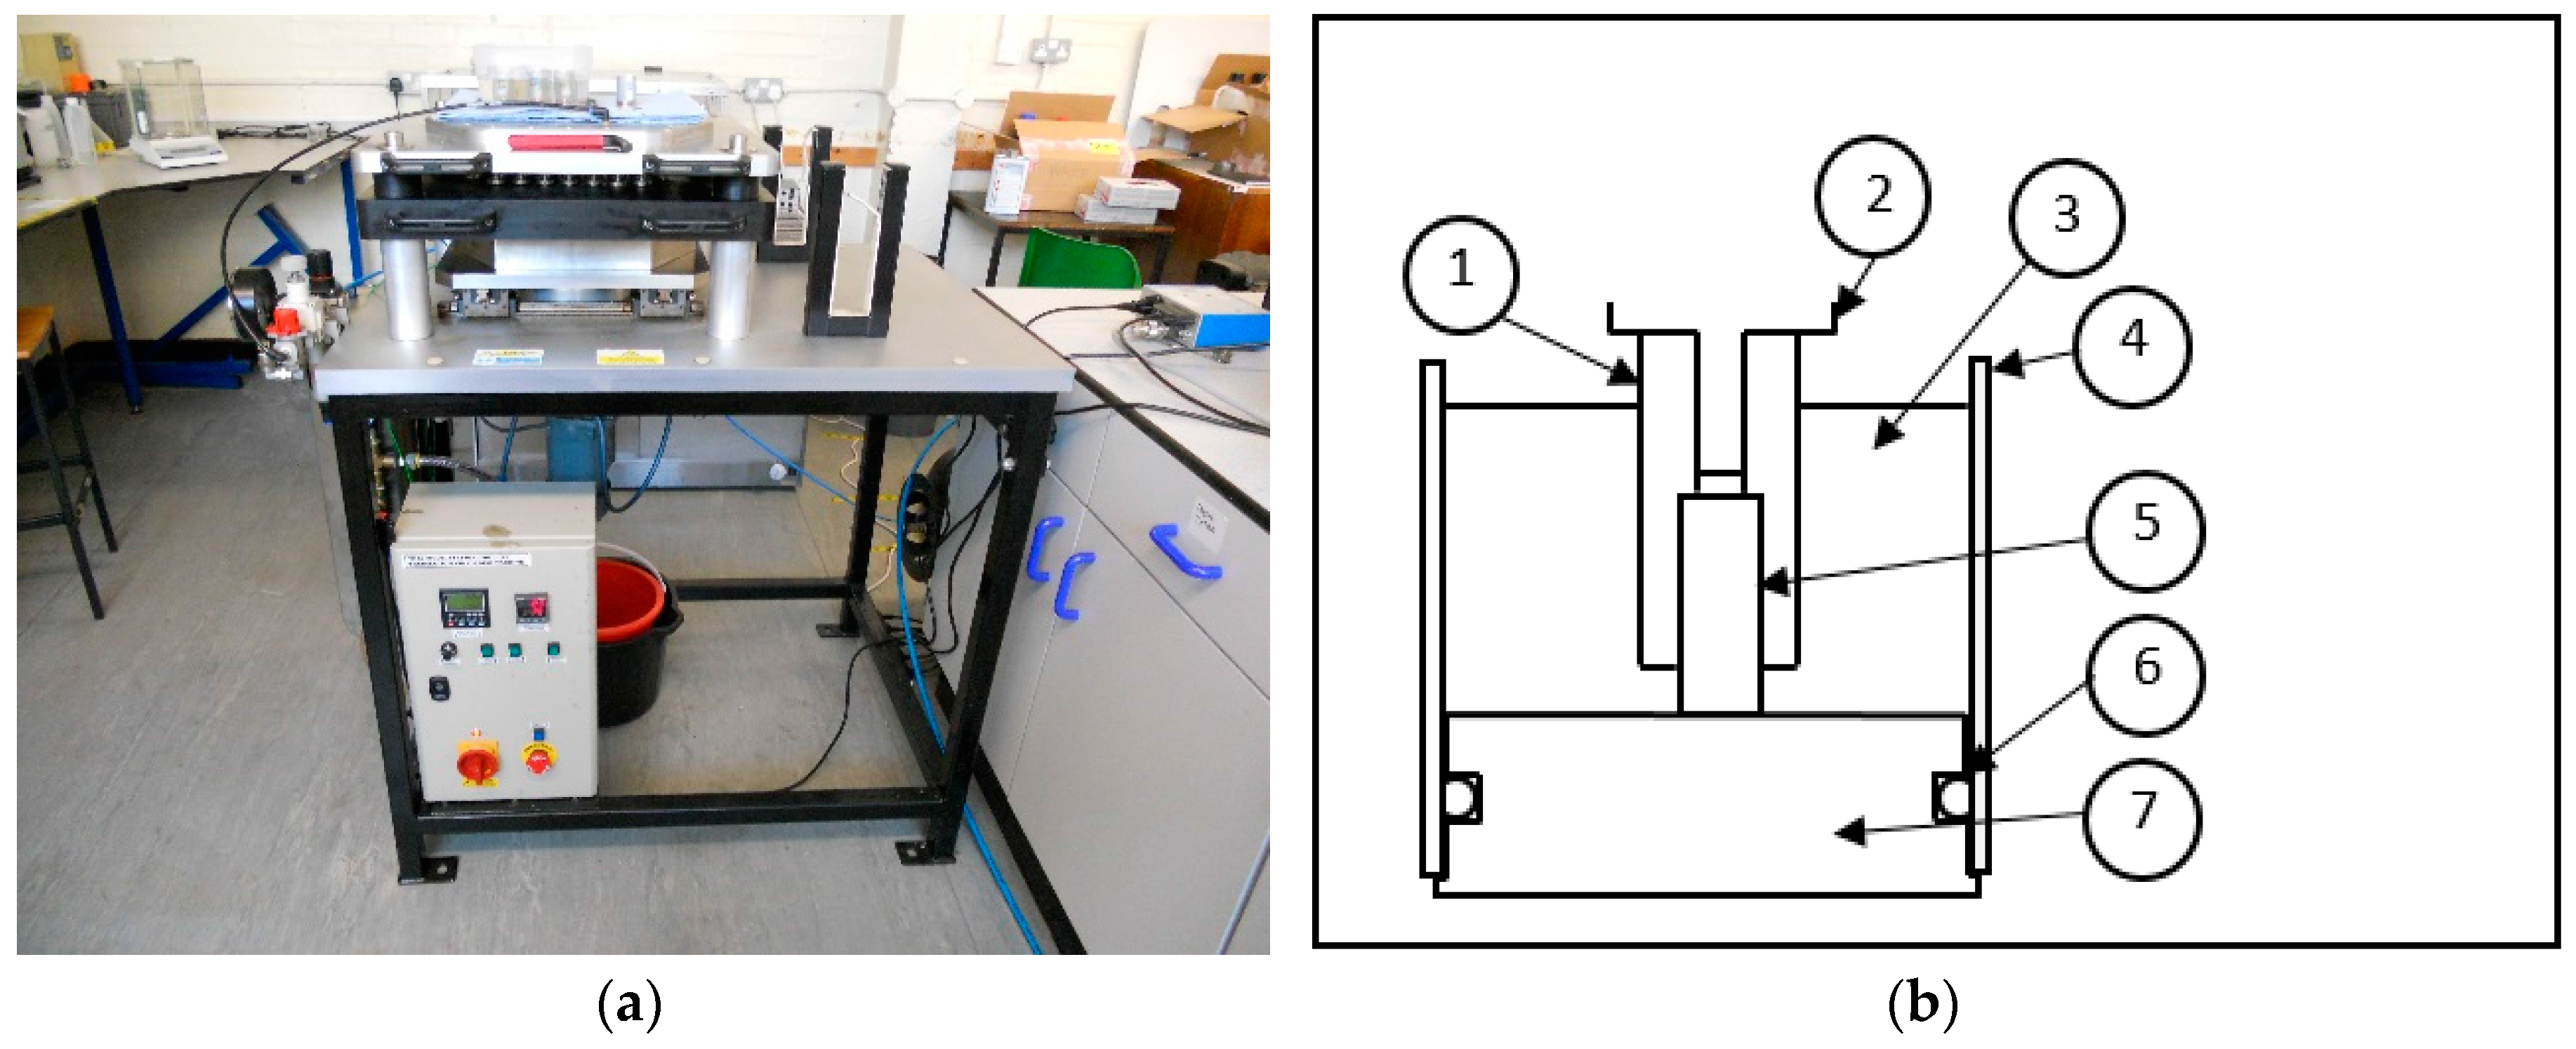
4. Methods and Materials
5. Conclusions
Acknowledgments
Author Contributions
Conflicts of Interest
References
- Young, E. National Joint Registry for England, Wales, Northern Ireland and the Isle of Man; Annual Report, 12th; National Joint Registry: Hempstead, UK, 2015. [Google Scholar]
- Registry, N.J. Summary of Annual Statistics. Available online: http://www.njrcentre.org.uk/njrcentre/Healthcareproviders/Accessingthedata/StatsOnline/NJRStatsOnline/tabid/179/Default.aspx (accessed on 30 November 2015).
- Kurtz, S.M. UHMWPE Biomaterials Handbook; Elsevier: Burlington, VT, USA, 2009. [Google Scholar]
- NICE. Total Hip Replacement and Resurfacing Arthroplasty for End-Stage Arthritis of the Hip. NICE Technology Appraisal Guidance [TA304] February 2014. Available online: http://www.nice.org.uk/guidance/ta304 (accessed on 24 February 2016).
- Ingham, E.; Fisher, J. Biological reactions to wear debris in total joint replacement. Proc. Inst. Mech. Eng. H J. Eng. Med. 2000, 214, 21–37. [Google Scholar] [CrossRef]
- Abu-Amer, Y.; Darwech, I.; Clohisy, J.C. Aseptic loosening of total joint replacements: Mechanisms underlying osteolysis and potential therapies. Arthritis Res. Ther. 2007, 9 (Suppl. 1). [Google Scholar] [CrossRef] [PubMed]
- Hall, R.M.; Unsworth, A. Wear in retrieved Charnley acetabular sockets. Proc. Inst. Mech. Eng. H J. Eng. Med. 1996, 210, 197–207. [Google Scholar] [CrossRef]
- Kobayashi, A.; Freeman, M.A.; Bonfield, W.; Kadoya, Y.; Yamac, T.; Al-Saffar, N.; Scott, G.; Revell, P.A. Number of polyethylene particles and osteolysis in total joint replacements. J. Bone Jt. Surg. B 1997, 79, 844–848. [Google Scholar] [CrossRef]
- Green, T.R.; Fisher, J.; Matthews, J.B.; Stone, M.H.; Ingham, E. Effect of size and dose on bone resorption activity of macrophages by in vitro clinically relevant ultra high molecular weight polyethylene particles. J. Biomed. Mater. Res. 2000, 53, 490–497. [Google Scholar] [CrossRef]
- Dumbleton, J.H.; Manley, M.T.; Edidin, A.A. A literature review of the association between wear rate and osteolysis in total hip arthroplasty. J. Arthroplast. 2002, 17, 649–661. [Google Scholar] [CrossRef]
- Harris, W.H. “The lysis threshold”: An erroneous and perhaps misleading concept? J. Arthroplast. 2003, 18, 506–510. [Google Scholar] [CrossRef]
- Bragdon, C.R.; O’Connor, D.O.; Lowenstein, J.D.; Jasty, M.; Syniuta, W.D. The importance of multidirectional motion on the wear of polyethylene. Proc. Inst. Mech. Eng. H J. Eng. Med. 1996, 210, 157–165. [Google Scholar] [CrossRef]
- Harsha, A.P.; Joyce, T.J. Challenges associated with using bovine serum in wear testing orthopaedic biopolymers. Proc. Inst. Mech. Eng. H J. Eng. Med. 2011, 225, 948–958. [Google Scholar] [CrossRef]
- Standard Test Method for Wear Testing of Polymeric Materials Used in Total Joint Prostheses. ASTM F732-00; ASTM: West Conshohocken, PA, USA, 2011; pp. 1–11.
- Saikko, V. Effect of lubricant protein concentration on the wear of ultra-high molecular weight polyethylene sliding against a CoCr counterface. J. Tribol. 2003, 125, 638–642. [Google Scholar] [CrossRef]
- Liao, Y.S.; Benya, P.D.; McKellop, H.A. Effect of protein lubrication on the wear properties of materials for prosthetic joints. J. Biomed. Mater. Res. 1999, 48, 465–473. [Google Scholar] [CrossRef]
- British Standards Insitution (2011). BS ISO 5834-2:2011. Implants for Surgery—Ultra-High-Molecular-Weight Polyethylene: Moulded Forms; British Standards Online: London, UK, 2011. [Google Scholar]
- Kurtz, S.M.; Muratoglu, O.K.; Evans, M.; Edidin, A.A. Advances in the processing, sterilization, and crosslinking of ultra-high molecular weight polyethylene for total joint arthroplasty. Biomaterials 1999, 20, 1659–1688. [Google Scholar] [CrossRef]
- Atwood, S.A.; van Citters, D.W.; Patten, E.W.; Furmanski, J.; Ries, M.D.; Pruitt, L.A. Tradeoffs amongst fatigue, wear, and oxidation resistance of cross-linked ultra-high molecular weight polyethylene. J. Mech. Behav. Biomed. Mater. 2011, 4, 1033–1045. [Google Scholar] [CrossRef] [PubMed]
- Galvin, A.L.; Ingham, E.; Tipper, J.L.; Fisher, J. Estimation of the osteolytic potential of noncrosslinked and crosslinked polyethylenes and ceramic-on-ceramic total hip prostheses. J. ASTM Int. 2006, 3, 1. [Google Scholar]
- Harsha, A.P.; Joyce, T.J. Comparative wear tests of ultra-high molecular weight polyethylene and cross-linked polyethylene. Proc. Inst. Mech. Eng. H J. Eng. Med. 2013, 227, 600–608. [Google Scholar] [CrossRef] [PubMed]
- Saikko, V. Performance analysis of an orthopaedic biomaterial 100-station wear test system. Proc. Inst. Mech. Eng. C J. Mech. Eng. Sci. 2010, 224, 697–701. [Google Scholar] [CrossRef]
- Saikko, V. A hip wear simulator with 100 test stations. Proc. Inst. Mech. Eng. H J. Eng. Med. 2005, 219, 309–318. [Google Scholar] [CrossRef]
- Korduba, L.A.; Wang, A. The effect of cross-shear on the wear of virgin and highly-crosslinked polyethylene. Wear 2011, 271, 1220–1223. [Google Scholar] [CrossRef]
- Turell, M.E.; Friedlaender, G.E.; Wang, A.; Thornhill, T.S.; Bellare, A. The effect of counterface roughness on the wear of UHMWPE for rectangular wear paths. Wear 2005, 259, 984–991. [Google Scholar] [CrossRef]
- Turell, M.; Wang, A.; Bellare, A. Quantification of the effect of cross-path motion on the wear rate of ultra-high molecular weight polyethylene. Wear 2003, 255, 1034–1039. [Google Scholar] [CrossRef]
- Elfick, A.P.D.; Hall, R.M.; Pinder, I.M.; Unsworth, A. Wear in retrieved acetabular components: Effect of femoral head radius and patient parameters. J. Arthroplast. 1998, 13, 291–295. [Google Scholar] [CrossRef]
- Atkinson, J.R.; Dowson, D.; Isaac, J.H.; Wroblewski, B.M. Laboratory wear tests and clinical observations of the penetration of femoral heads into acetabular cups in total replacement hip joints. III: The measurement of internal volume changes in explanted Charnley sockets after 2–16 yearsin vivo and the determination of wear factors. Wear 1985, 104, 225–244. [Google Scholar]
- Saikko, V. A multidirectional motion pin-on-disk wear test method for prosthetic joint materials. J. Biomed. Mater. Res. 1998, 41, 58–64. [Google Scholar] [CrossRef]
- British Standards Institution (2011). BS ISO 7206-2:2011. Implants for Surgery—Partial and Total Hip Joint Prostheses. In Part 2: Articulating Surfaces Made of Metallic, Ceramic and Plastics Materials; British Standards Online: London, UK, 2011. [Google Scholar]
- Liao, Y.S.; McKellop, H.; Lu, Z.; Campbell, P.; Benya, P. The effect of frictional heating and forced cooling on the serum lubricant and wear of UHMW polyethylene cups against cobalt-chromium and zirconia balls. Biomaterials 2003, 24, 3047–3059. [Google Scholar] [CrossRef]
- Joyce, T.J.; Langton, D.J.; Jameson, S.S.; Nargol, A.V. Tribological analysis of failed resurfacing hip prostheses and comparison with clinical data. Proc. Inst. Mech. Eng. J J. Eng. Tribol. 2009, 223, 317–323. [Google Scholar] [CrossRef]
- Archard, J.F. Contact and rubbing of flat surfaces. J. Appl. Phys. 1953, 24, 981–988. [Google Scholar] [CrossRef]


| Mechanical Property | GUR 1020 | GUR 1050 |
|---|---|---|
| Charpy impact strength | 203 | 101 |
| Tensile yield stress | 24.6 | 21.7 |
| Ultimate tensile strength | 63 | 50 |
| Density | 937 | 932 |
| Material | Mean Wear Rate (mg/Mc) (with Bedding in Phase) | Mean Wear Factor () (without Bedding in Phase) |
|---|---|---|
| GUR 1020 (pins) | ||
| GUR 1050 (pins) | ||
| CoCr discs |
| Material | Mean Initial Roughness | Mean Final Roughness |
|---|---|---|
| GUR 1020 | ||
| GUR 1050 | ||
| CoCr disc (1) | ||
| CoCr disc (2) |
| Authors | Material (Gamma Irradiation (kGy)) | Wear Rate (mg/Mc) | Wear Factor |
|---|---|---|---|
| This study | GUR 1020 (0) | ||
| GUR 1050 (0) | |||
| [21] | GUR 1020 (0) | ||
| [22] | Various types of UHMWPE (NA) | ||
| [23] | GUR 1020 (25–40) | ||
| [24] | GUR 1020 (0) | ||
| [25] | GUR 1050 (0) | ||
| [26] | GUR 1050 (0) | ||
| [19] | GUR 1020 (0) | ||
| GUR 1050 (0) | |||
| [20] | GUR 1020 (0) | NA | |
| GUR 1050 (0) | NA |
| Authors | Material | Initial Roughness | Final Roughness |
|---|---|---|---|
| This study | 1020 | ||
| 1050 | |||
| CoCr (1) | |||
| CoCr (2) | |||
| [21] | 1020 | ||
| CoCr | “unchanged” | ||
| [29] | SS 316L | “no damage whatsoever on the plates” | |
| [20] | CoCr | “no change in the surface roughness detected for the Cobalt chromium” | |
| BS ISO 7206-2: 2011 [30] | CoCr | NA |
© 2016 by the authors; licensee MDPI, Basel, Switzerland. This article is an open access article distributed under the terms and conditions of the Creative Commons Attribution (CC-BY) license (http://creativecommons.org/licenses/by/4.0/).
Share and Cite
Hunt, B.J.; Joyce, T.J. A Tribological Assessment of Ultra High Molecular Weight Polyethylene Types GUR 1020 and GUR 1050 for Orthopedic Applications. Lubricants 2016, 4, 25. https://doi.org/10.3390/lubricants4030025
Hunt BJ, Joyce TJ. A Tribological Assessment of Ultra High Molecular Weight Polyethylene Types GUR 1020 and GUR 1050 for Orthopedic Applications. Lubricants. 2016; 4(3):25. https://doi.org/10.3390/lubricants4030025
Chicago/Turabian StyleHunt, Benjamin J., and Thomas J. Joyce. 2016. "A Tribological Assessment of Ultra High Molecular Weight Polyethylene Types GUR 1020 and GUR 1050 for Orthopedic Applications" Lubricants 4, no. 3: 25. https://doi.org/10.3390/lubricants4030025