1. Introduction
Nowadays, there is pushing demand in fuel economy for passenger vehicles in order to fulfill legislative requirements for CO
2 emissions. This in turn leads to the introduction of ultra-low viscosity lubricants which could be one efficient way for lubricants to contribute to the fuel economy performance of passenger cars by reducing shear forces. However, a decrease in lubricant viscosity will result in thinner oil films and thus it will be more difficult for the oil to keep the loaded contacts efficiently apart from each other. This may imply a transition from full film to mixed lubrication with potentially accelerated wear rates and locally increased friction [
1]. In order to avoid detrimental impacts on the engine and all its components it is necessary to add for example extreme pressure (EP) or anti wear (AW) additives which have the ability to form friction and wear reducing tribolayers [
1]. However, the prediction of the forming tribolayers is highly complicated by operating conditions such as load, speed, and temperature. For that reason, additives are used in high concentrations to guarantee the formation and durability [
2]. In this context, zinc dithiophosphates (ZDDPs) are widely used as lubricant additives. The triumphal procession of ZDDP in the automotive industry already started more than 70 years ago [
3]. ZDDP acts as an anti-wear agent, antioxidant, and corrosion inhibitor by decomposing peroxide and effectively destroying peroxy radicals. Interestingly, also the reaction products of ZDDP with peroxide and the respective radicals are again strongly efficient in corrosion inhibition [
3]. The friction reducing properties of ZDDP are mainly attributed to an increased load support, beneficial mechanical properties by preferential shearing, removal of Fe
2O
3 particles, and finally the surface protection against corrosion. The growth and removal rate of the tribolayers is a highly dynamic process [
4].
Apart from the abovementioned positive effects of ZDDP as a lubricant additive, it is well known that sulphur and phosphorous oxides as well as ash may negatively affect the effective life of exhaust catalysts [
1]. Additionally, due to phosphorous and sulphur limits in engine oil specifications, it is considered to progressively reduce the usage of ZDDP or even to replace it [
5]. A successful reduction or replacement certainly needs a thorough understanding of the governing mechanisms. It is well known that effective tribolayers can be realized by thermal or tribomechanical activation in loaded contacts [
6]. Fujita and Spikes studied the morphology of the tribolayers for different temperatures and contact pressures up to 950 MPa [
6]. They could show that pronounced tribolayers under thermal activation are only possible at temperatures higher than 150 °C, whereas loaded conditions already yield in an efficient tribolayer at room temperature. Although quite similar regarding their composition, Bancroft
et al. proved that the tribomechanically induced reaction layers are more wear resistant than the thermally activated layers [
7].
A closer look at the layer morphology shows some important aspects. According to the well-established model by Schmaltz, the boundary layer system typically consists of an inner and outer boundary layer [
8]. The inner layer (tribomutation layer) is a fine-crystalline zone resulting from finishing processes or surface deformations with a thickness around 400 nm up to 5 µm (depending on operating conditions). In contrast to that, the outer boundary layer is composed of an oxide layer (<100 nm) followed by a reaction- or tribolayer (<150 nm thickness) and finally an adsorption layer on top [
8]. The reaction layer is particularly interesting as it is responsible for the friction and wear reduction. Usually, this reaction layer is rough and patchy mainly composed of pyro- and orthophosphate glasses on the bulk level with an additional nanoscale layer of zinc polyphosphates and a sulphur-rich layer of typically 20 nm close to the metal surface [
9]. Over the years, lots of microstructural studies and investigations related to the chemical nature of the reaction layers were done. In particular, Martin
et al. applied analytical techniques such as electron energy loss spectroscopy (EELS), X-ray adsorption fine structure analysis (EXAFS) or X-ray absorption near-edge spectroscopy (XANES) to reveal the chemical composition and structure of said layers [
10,
11,
12,
13]. Despite the use of high resolution and sophisticated analytical methods, there is still a controversial issue concerning the specific reaction pathways and kinetics of the ZDDP layer formation [
1]. Some recent progress was made by using, for example, classical molecular dynamics simulations (MD simulations) coupled with tight binding quantum chemical MD [
14]. Mosey
et al. explained the positive effects of ZDDP by a cross-linking of phosphates under sufficiently high contact pressure [
15]. Gauvin
et al. and Berkani
et al. could experimentally verify the simulations by spectroscopic methods under contact pressures of up to 7 GPa [
16,
17]. However, studies referring to the transfer of these findings to highly loaded cylindrical roller thrust bearings are scarce in literature. Moreover, the role and origin of typically observed blue- and brown-colored films on the contacting surfaces are still not fully understood. According to Hsu, the different colors of the layers (e.g., blue or brown films) are due to thickness differences [
18].
In this research contribution, we would like to study those brown- and blue-colored films in highly loaded cylindrical roller thrust bearings in more detail by various advanced and high resolution techniques such as Raman spectroscopy and transmission electron microscopy (TEM). For a given load of 80 kN and an operating temperature of 60 °C in a roller bearing lubricant test rig (FE8 test according to DIN 51819-3 [
19]), the speed, as one decisive factor for the film formation, was varied between 10, 15, and 20 rpm. Below 10 rpm, at the given load and temperature, no protective tribolayer can be detected [
20]. With increasing speed, there is a shift in the amount of blue- and brown-colored regions. As the appearance of blue and brown regions on the loaded surfaces usually indicates the successful formation of the wear protective tribolayer and is also most pronounced for the highest applied speed at 20 rpm, a stronger emphasis is put on analyzing said colored regions for this particular speed within this research work.
3. Results and Discussion
Systematic studies on the tribofilm formation using ZDDP as an additive are rather scarce for highly loaded contacts
i.e., contact pressure higher than 1 GPa. For that reason, the tribolayer formation on the surface of highly loaded cylinder roller thrust bearing rings at 1.92 GPa has been examined in the present study by high resolution and complementary characterization techniques. The tribological behavior of the used mineral oil of class ISO VG 100 mixed with ZDDP was tested in a modified FE8 test rig (DIN 51819-3). Here, the test rig is modified in terms of torque measurement and axial load supply which is done hydraulically [
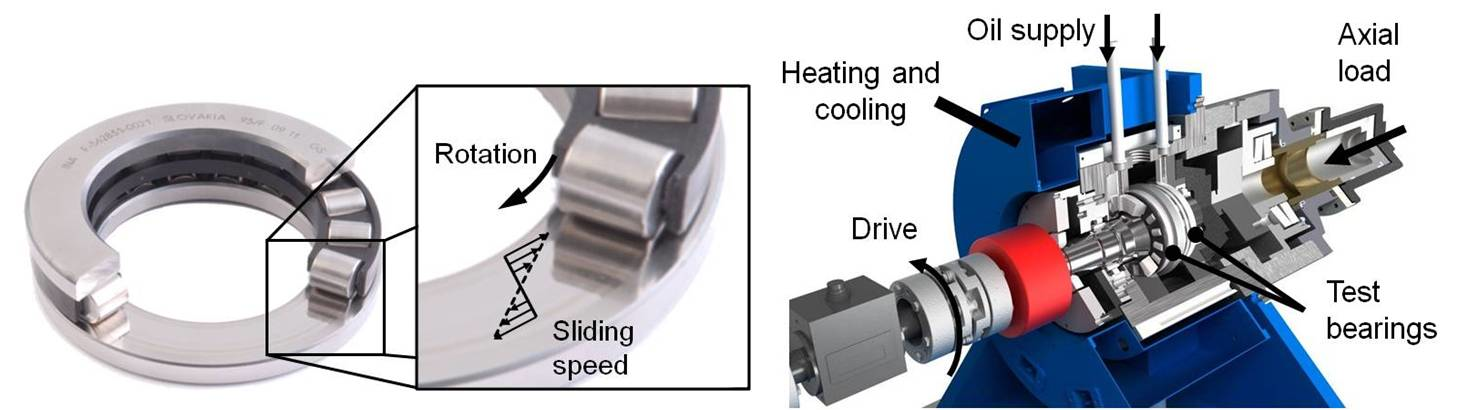
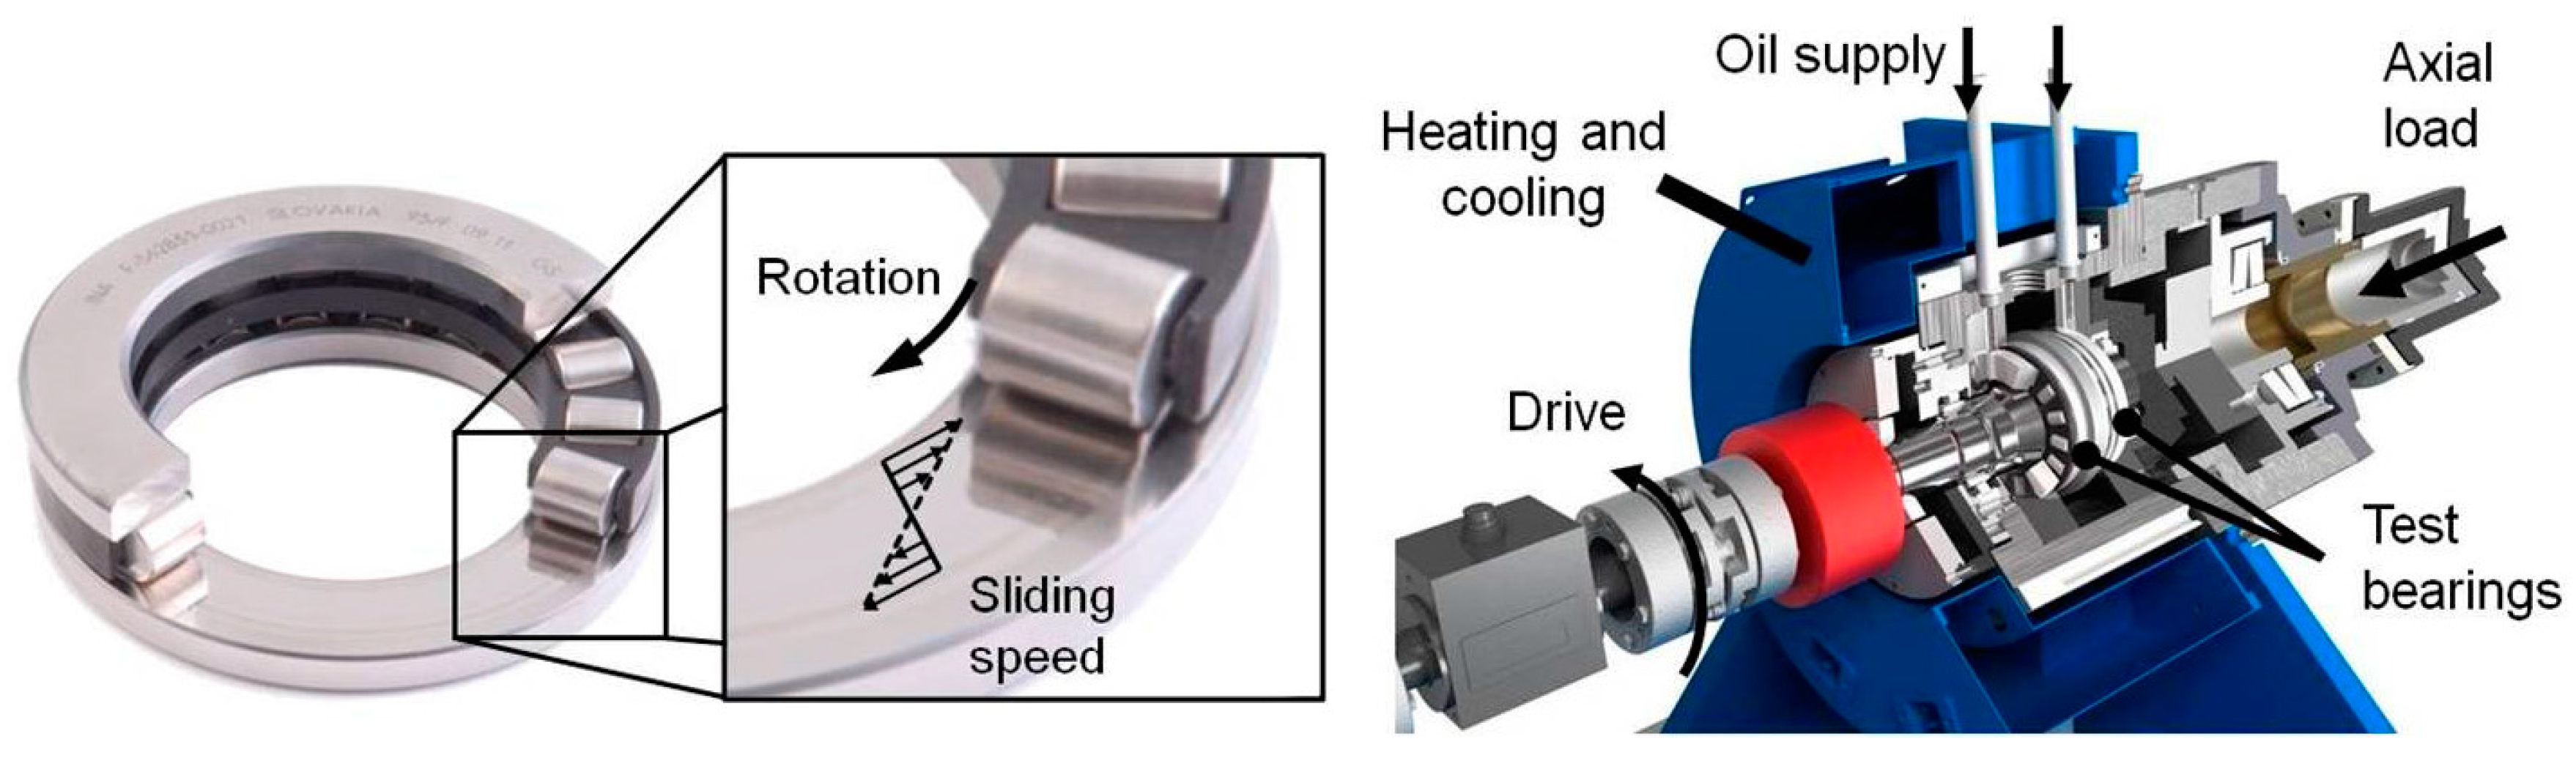
20]. Two cylindrical roller thrust bearings of type 81212 are used for the classification test due to the high percentage of slippage between washer and roller. The bearing and the quantitative run of the sliding speed curve as well as the FE8 test rig setup are shown in
Figure 1. The axial load can be applied dynamically and under different operating conditions during one test. More details about the test rig and the experimental procedure can be found in [
20].
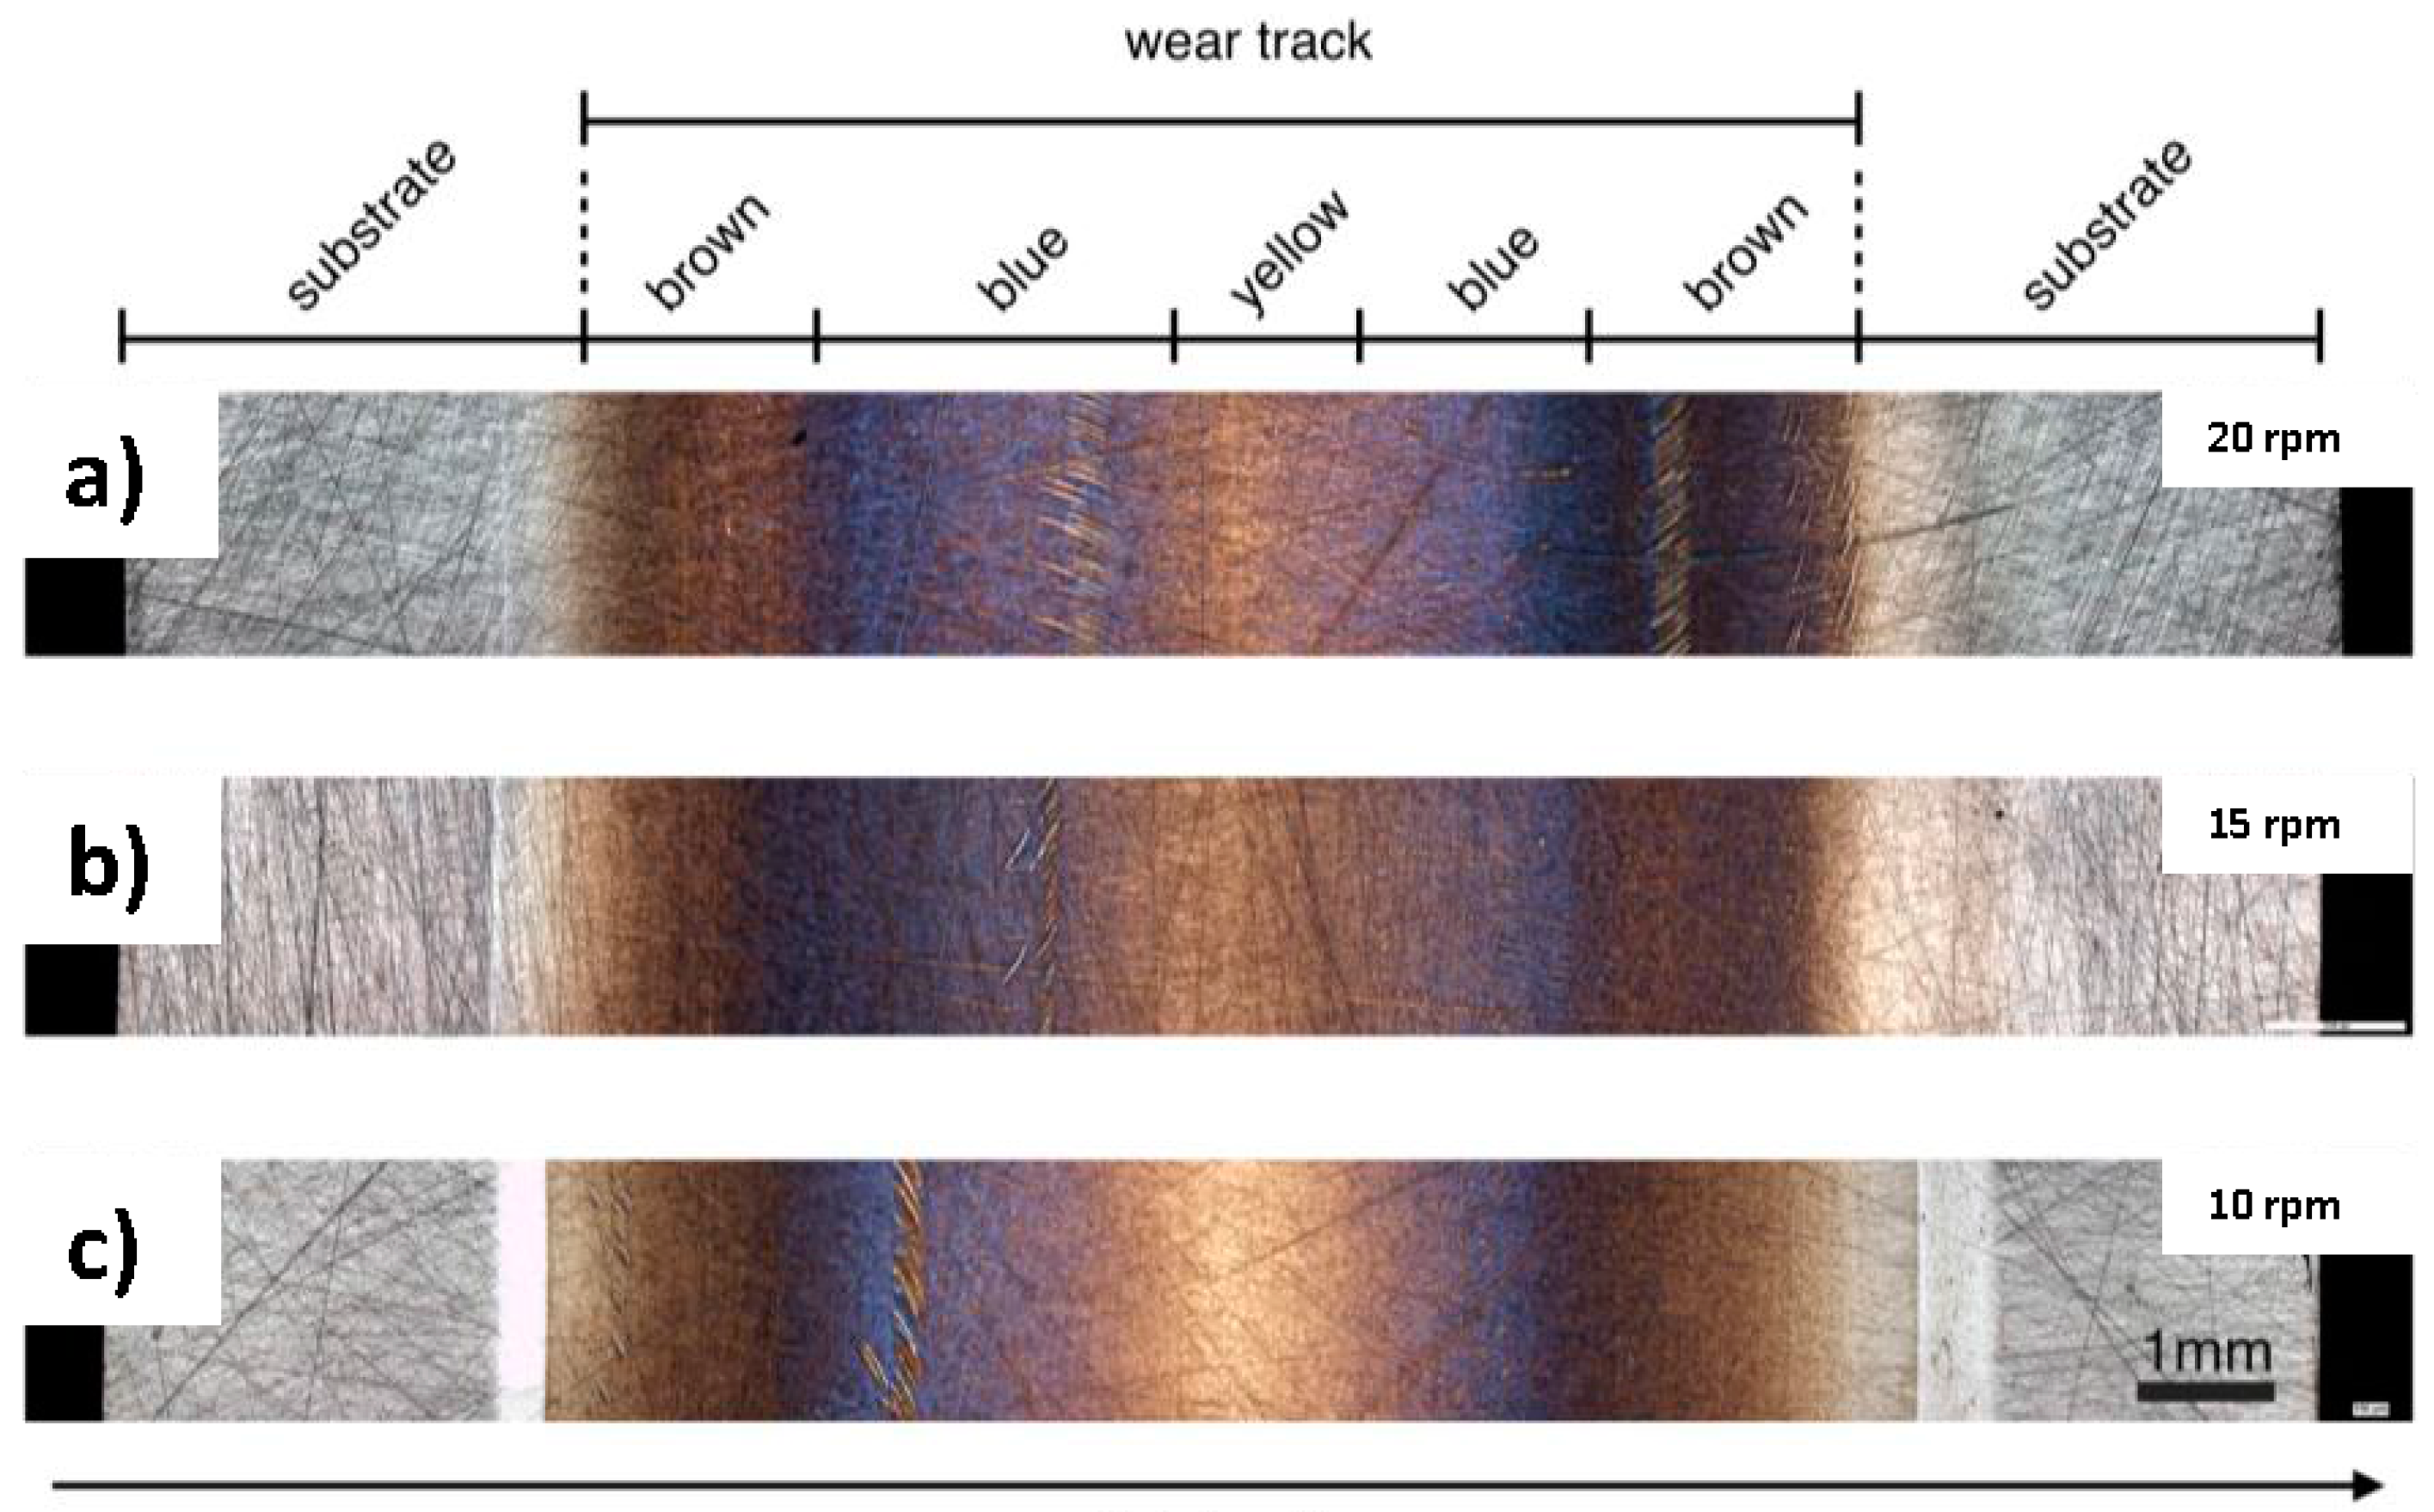
Figure 2 shows an overview of typical wear tracks recorded by optical light microscopy after having run the modified FE8 test for bearings for two hours and different rotational speeds (10, 15, and 20 rpm). Here, 10 rpm represents a lower limit for the tribolayer formation. At the given experimental conditions
i.e., load, temperature and additive concentration, no tribolayer will be built up below 10 rpm [
20]. In the figure, the radial direction is from left to right (from inner to outer diameter). The differently colored regions (grey-for the substrate-brown-blue-yellow-blue-brown and grey again) can be clearly indentified along the radial direction for all tested rotational speeds.
Except the grey regions, which are considered substrate without wear, the other three colored regions which had intensive contact to the cylindrical rollers during the test are completely located in the wear track. The emerging bright bands at lower speeds are wear tracks with abrasive and adhesive wear. Due to the highest sliding speeds at the sides of the wear track, this area is highly critical with respect to wear. The inner track is even more critical as the smallest rolling speed and consequently the highest ratio of solid body contact can be found in this part. Because of that, the wear track at the inner part is more pronounced (
Figure 2c). The width of the roller (11 mm) exceeds the one of the wear track (~9 mm). The contact width between roller and washer is about 10–10.5 mm and includes the area of wear in
Figure 2c.
The transition zones between different regions are quite diffuse and partially overlapping to some extent. With increasing rotational speed, the amounts of blue- and brown- colored regions are changed narrowing the yellow central part of the ring. For 20 rpm, the blue zone is more intense compared to lower rotational speeds. For that reason, the analysis of the layers in the following will be focused on that particular speed. By using a higher magnification (see
Figure 3), the blue-film region appears more patchy like “islands” and not as a homogeneous layer. Additional topographical parameters such as root mean square roughness (rms) and peak to valley (PV) distance of the blue and brown films were obtained by white light interferometry from the inner and outer segments (see
Table 2). The pristine arithmetic surface roughness of the steel substrate is R
a, steel ~0.2 µm. The roughness decreases with the formation of the tribolayers, partially covering the visible grinding marks of the substrate (see
Figure 2). However, there is neither a tendency for the rms value nor the PV distance for the differently colored regions as a function of rotational speed as can be seen in
Table 2. However, roughness generally plays an important role for the tribolayer formation in boundary lubricated contacts. Tribolayers usually form faster and require less energy input to be formed for a rough surface compared to a smooth surface [
4].
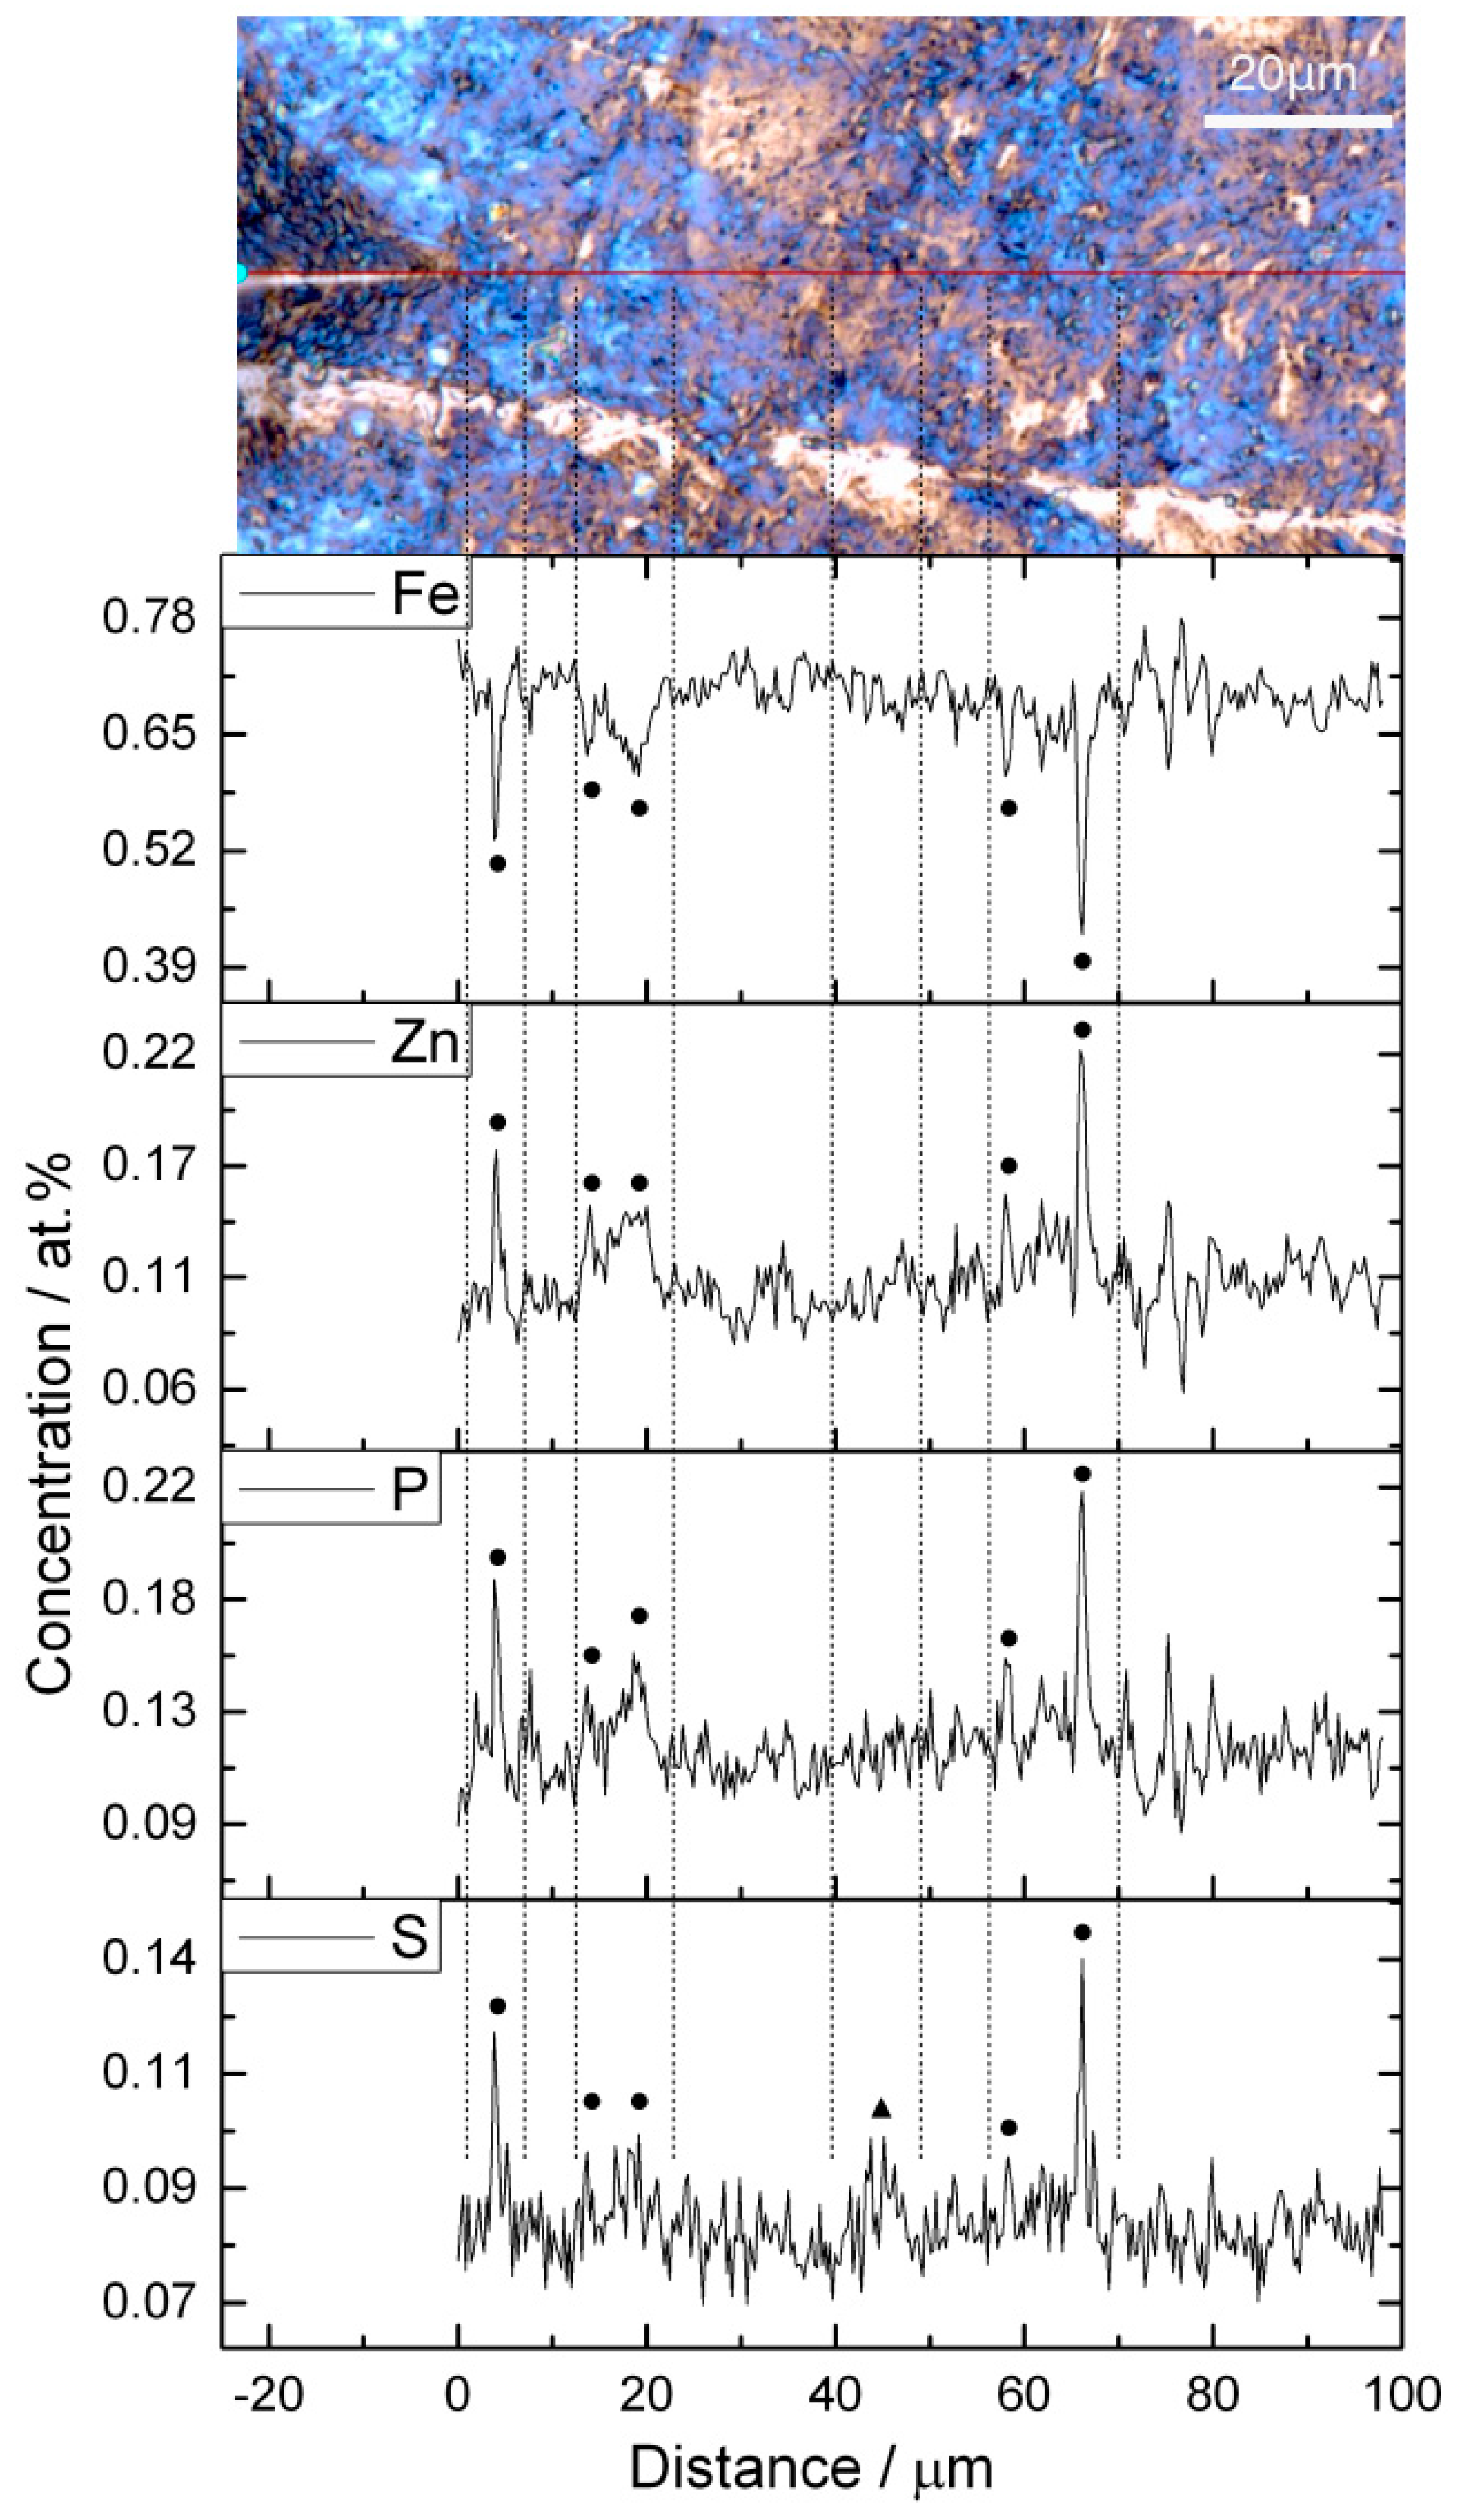
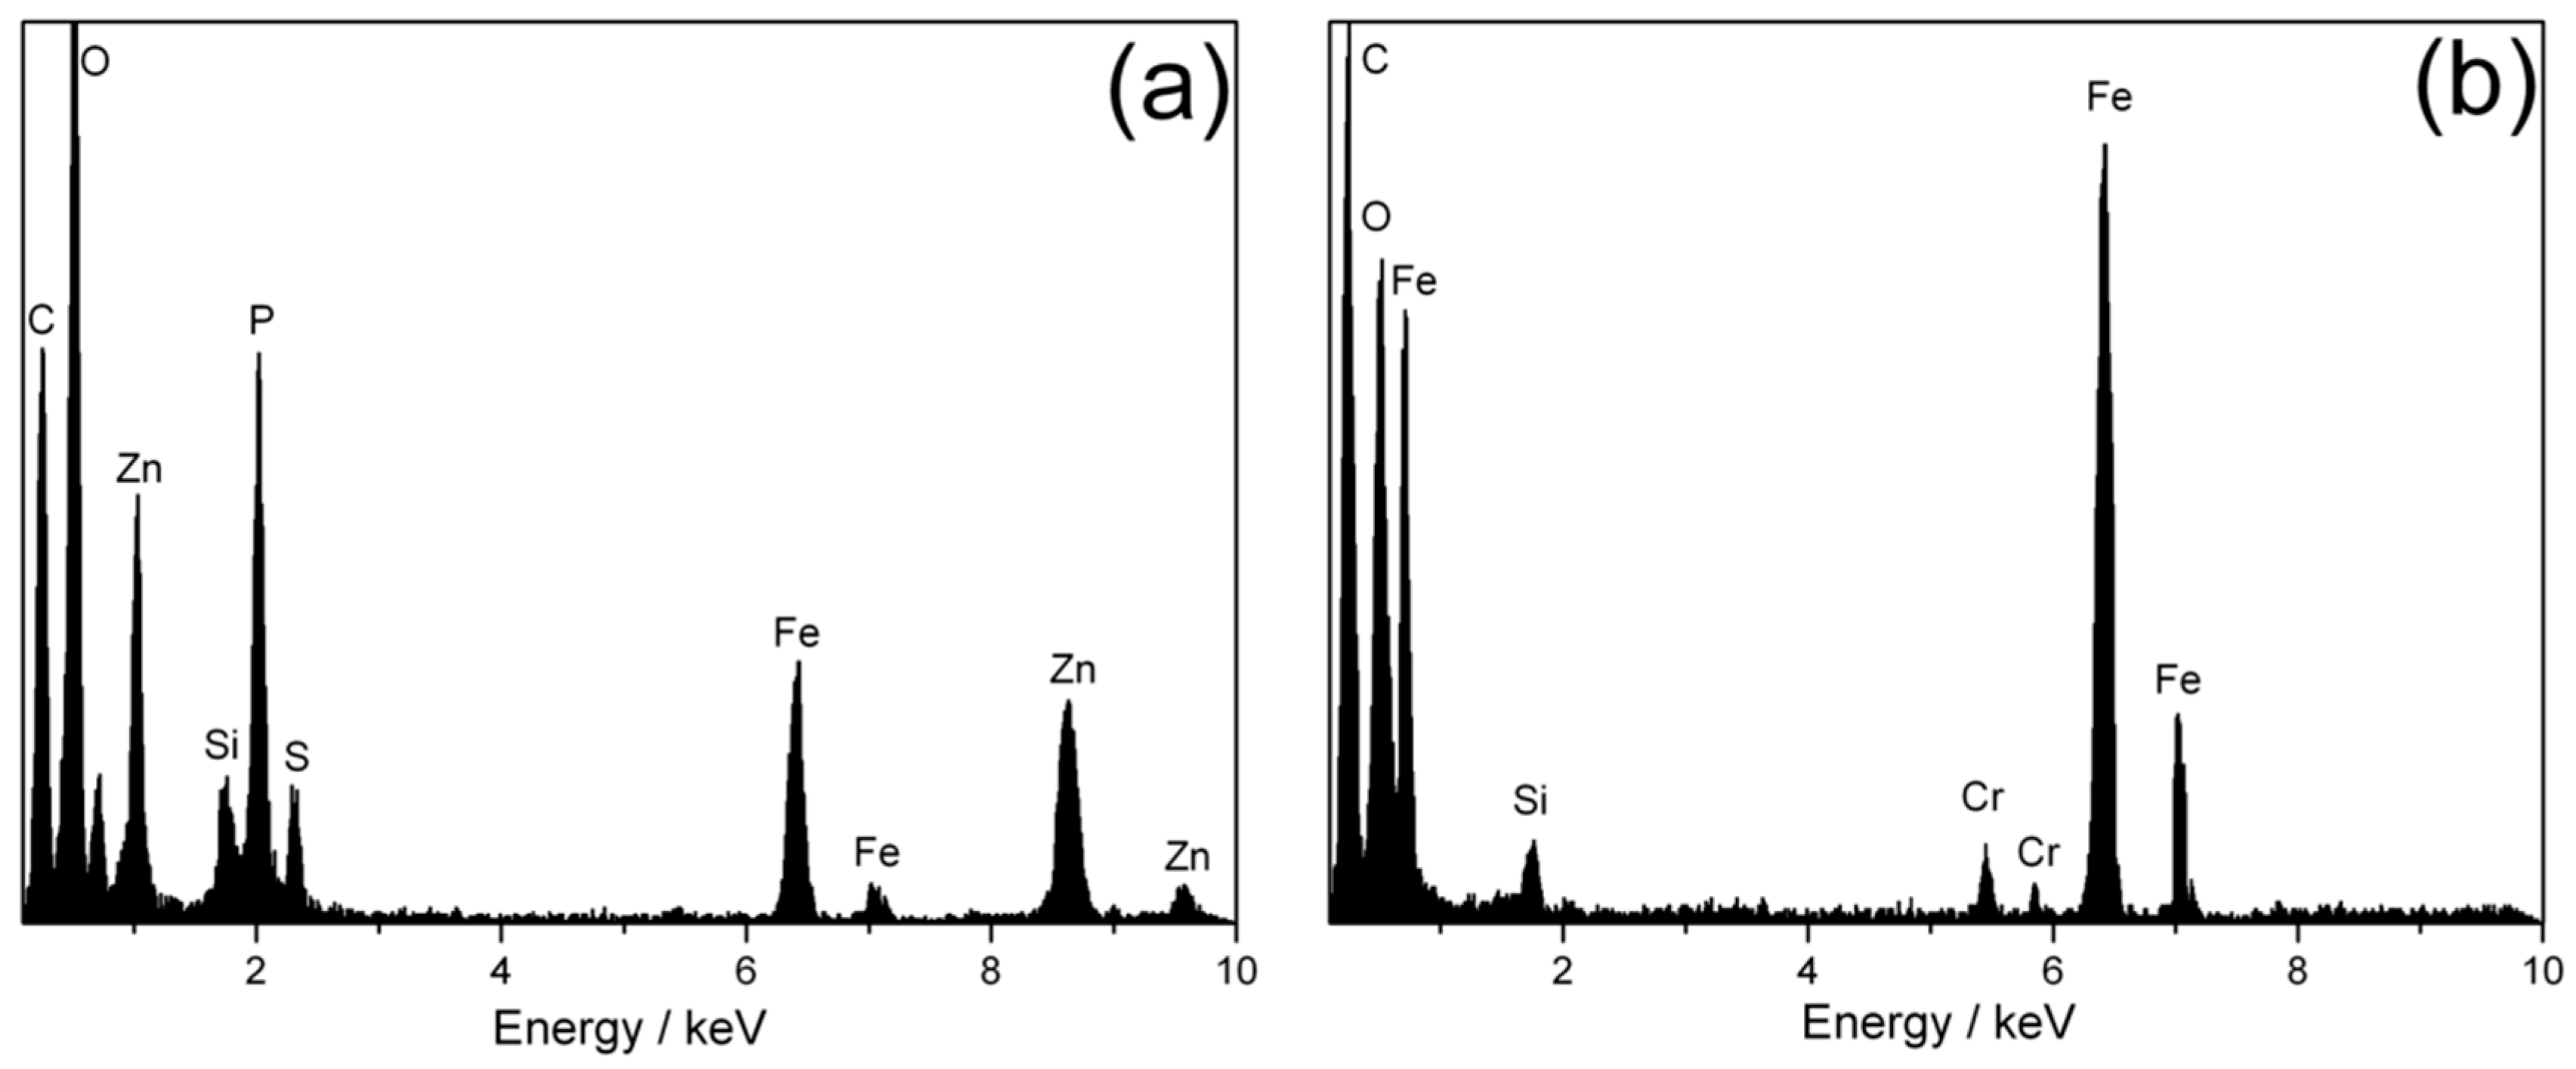
Figure 3 displays the results of an EDS line-scan, which shows the distribution of typically occurring elements such as Zn, S, or P. In the figure, dots and triangles are used to represent the position of blue- and brown-colored regions. Along the scan-line, blue and brown film regions are mixed up thus complicating the analysis. Here, the content of Zn, P, and S rise while scanning through the blue-film region. On the other hand, in the brown-film region, only sulphur shows a slightly higher content.
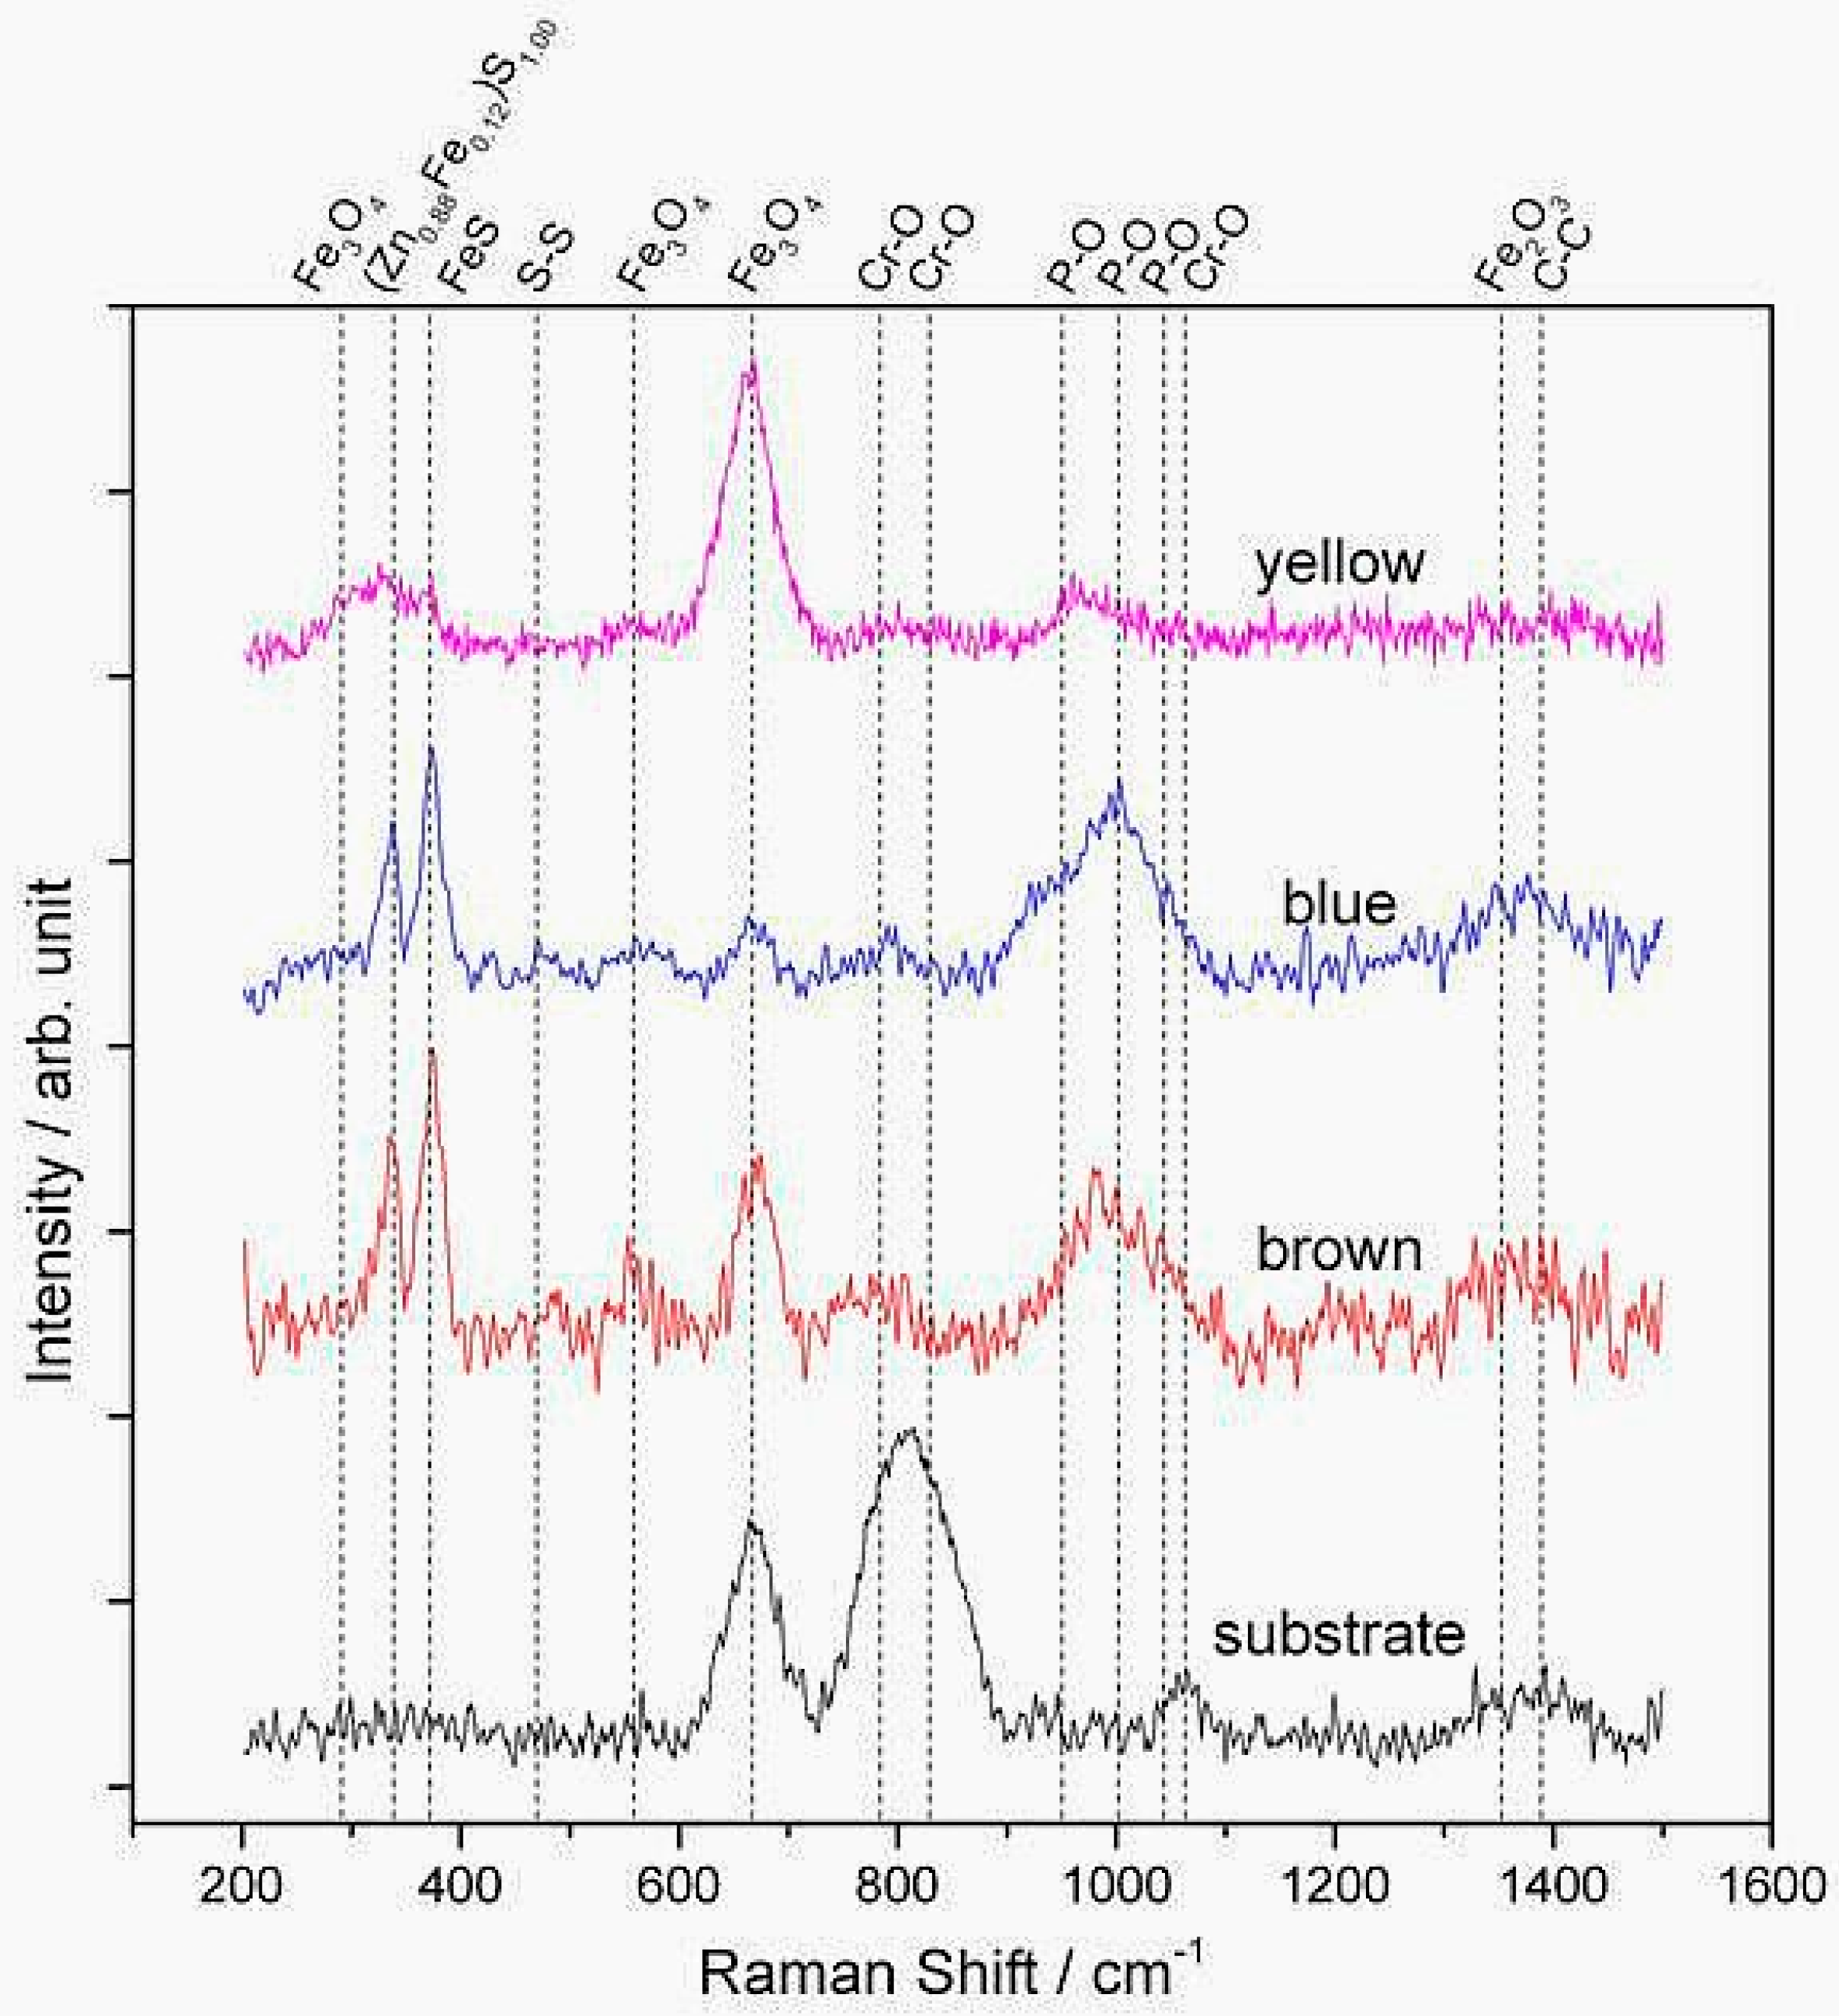
Deeper information regarding the chemical bonding within the tribolayer was acquired with the help of Raman spectroscopy. In
Figure 4, Raman spectra taken between 200 and 1500 cm
−1 show the resonance peaks present at the yellow-, blue- and brown-colored regions, as well as the substrate. As a reference, the spectrum of the substrate showed the typical peaks to Cr-O and Fe-O, without revealing neither phosphates nor sulphides. In the yellow region, the spectrum mainly shows iron oxide (Fe
3O
4) at around 680 cm
−1 and some sulphides. The Cr-O peaks (native oxide of the steel) of the substrate were not observed, presumably either due to the covering of this phase with other or a higher Raman activity of Fe
3O
4. Compared to the substrate, the blue and brown film regions display pronounced P-O, Fe-S, and Zn-S resonance peaks. The broad band at 1000 cm
−1 is related to polyphosphates including three sub-peaks at 965, 1007, and 1045 cm
−1 [
17]. Additionally, the band at 386 cm
−1 corresponds to FeS [
21], whereas the peak at 351 cm
−1 corresponds to ZnS [
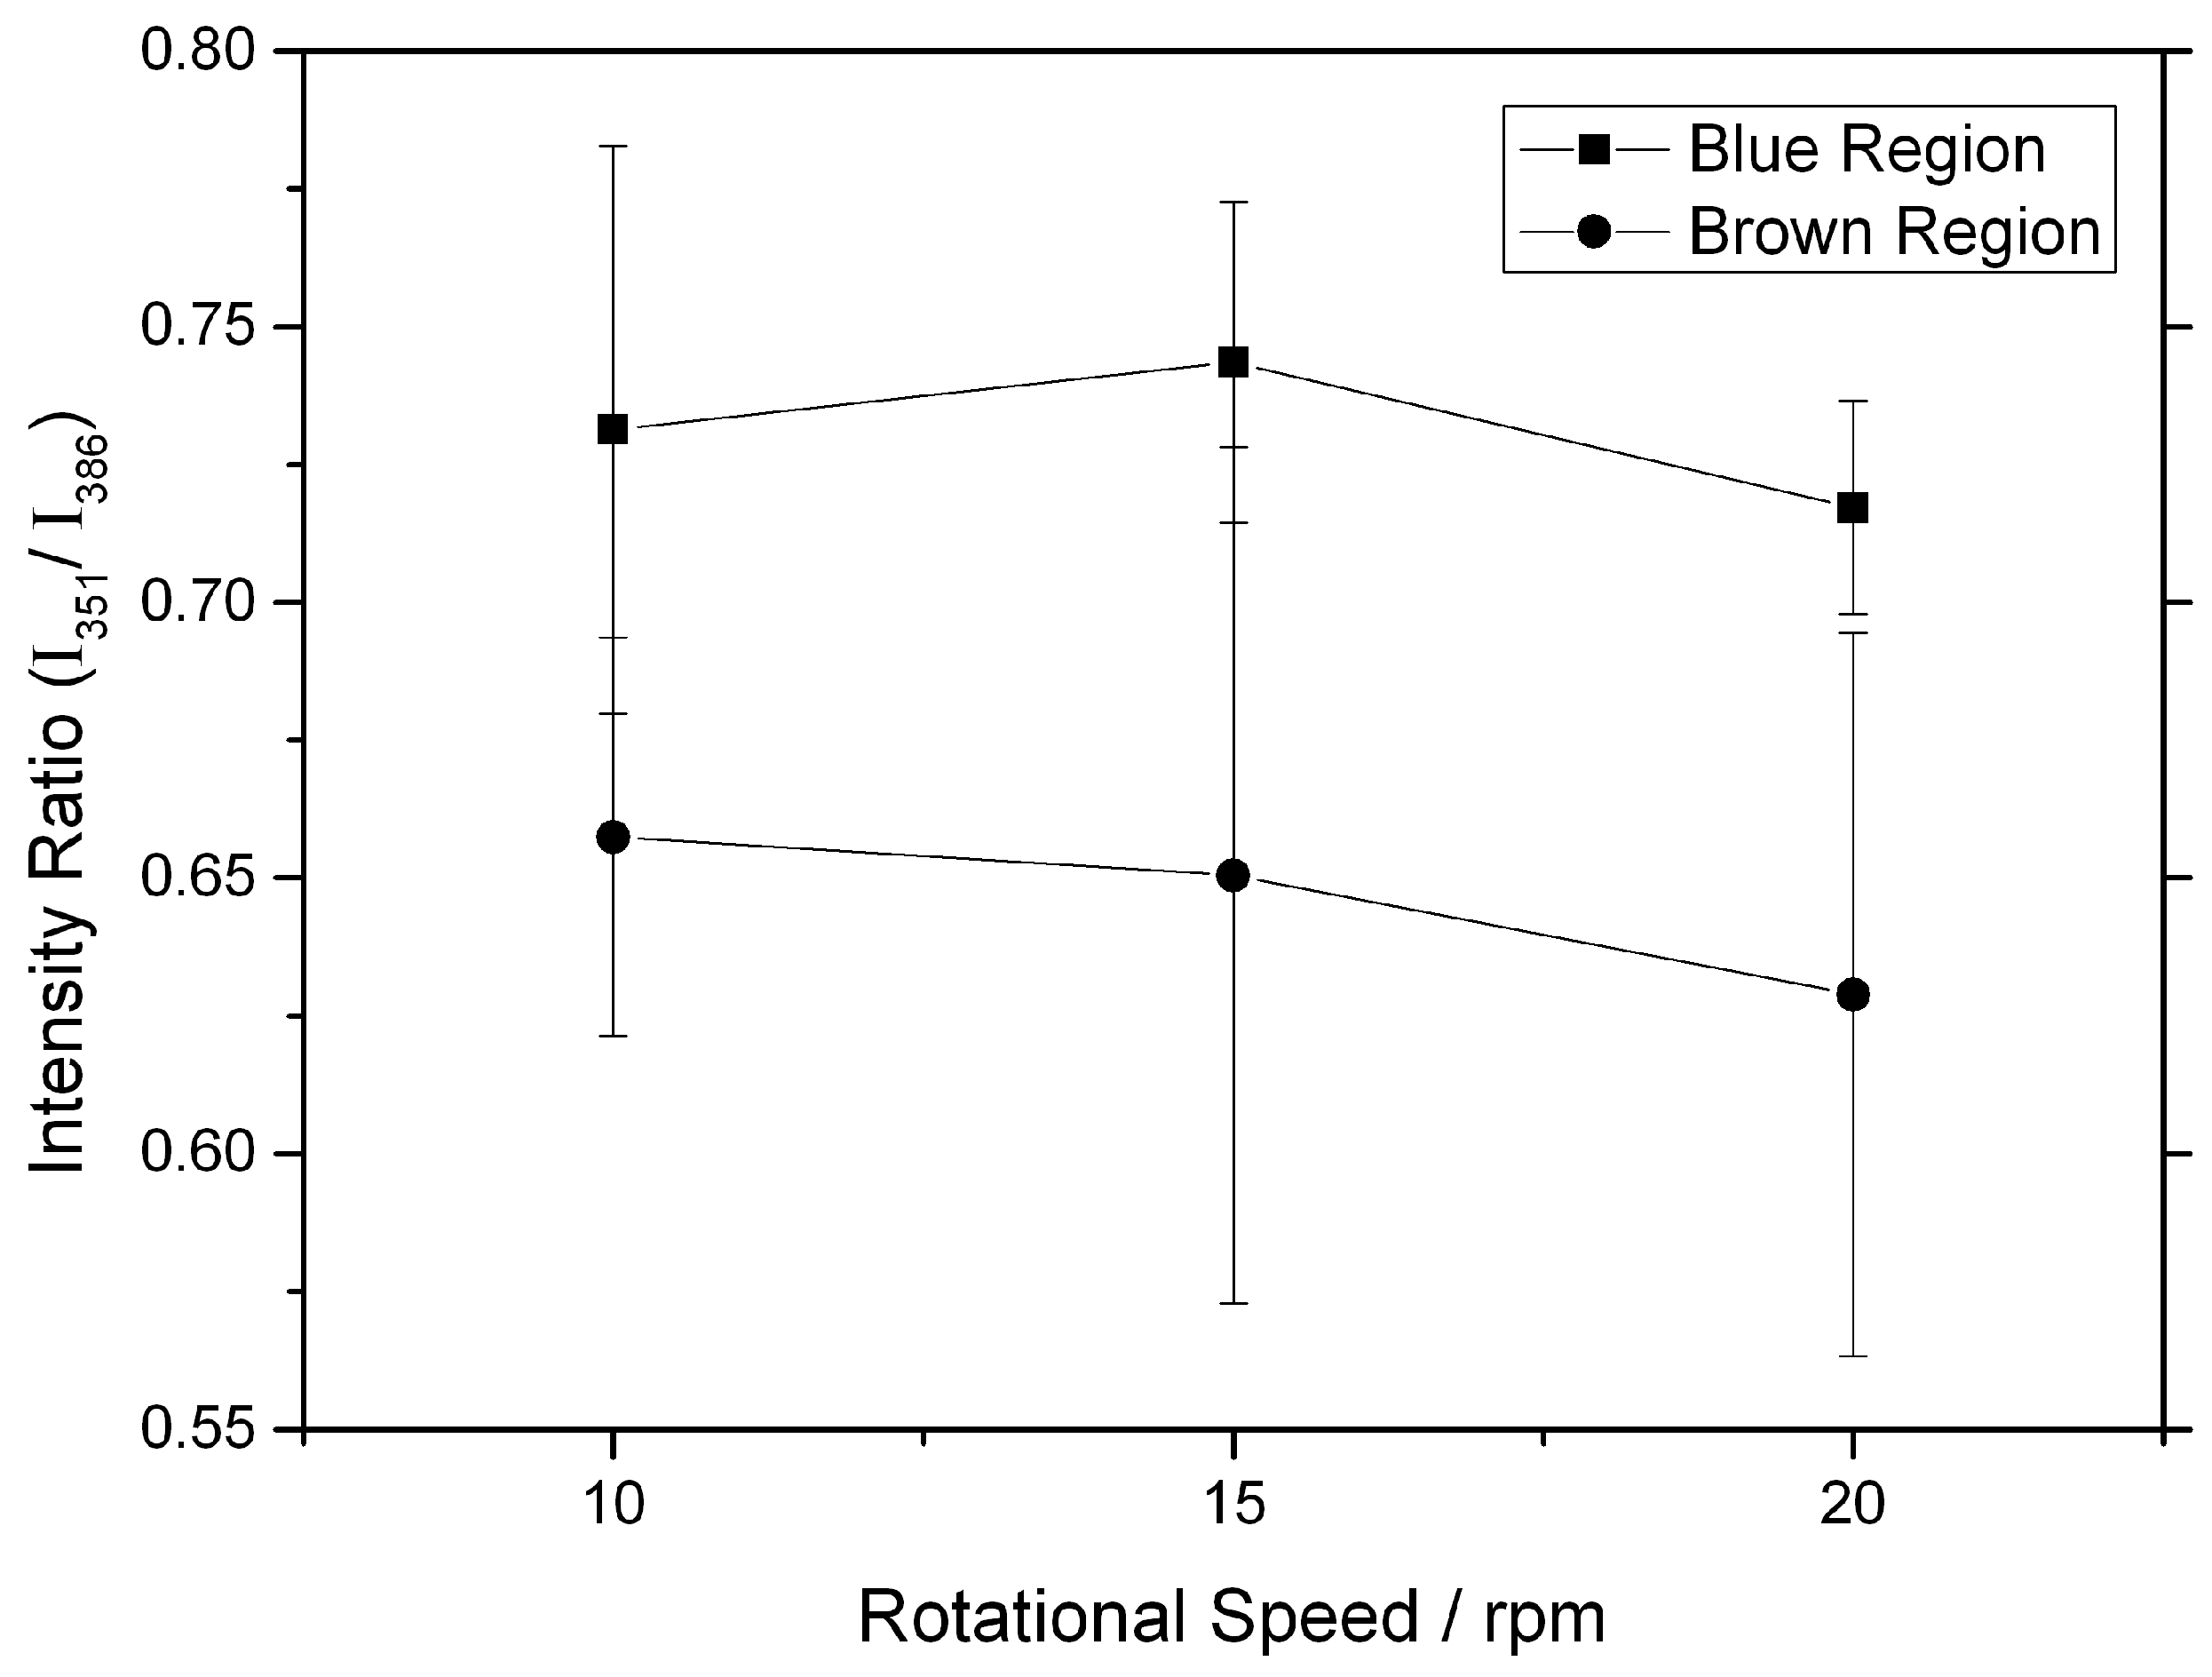
22]. Since Raman spectroscopy is a volume-sensitive technique, the analysis must be performed by comparing intensity ratios. In this sense, a comparison of the blue and brown films is carried out by relating the intensities of the (Zn
0.88Fe
0.12)S
1.00 band (351 cm
−1) [
23] and the FeS band at 386 cm
−1 (
Figure 5). By comparing the intensity ratio of the aforementioned bands for both regions, it can be stated that this intensity ratio is higher for the blue film, indicating a higher (Zn
0.88Fe
0.12)S
1.00 relative content. Furthermore, higher relative peak intensity for Fe
3O
4 is noticed for the brown-colored region, whereas no evident difference in the polyphosphate signal can be detected in the Raman spectra for both regions. This is a significant finding between the different colored regions, emphasizing that the color difference could be strongly attributed to the chemical composition instead of the layer thickness, as previously assumed in the literature [
18].
Figure 6a shows a bright-field electron micrograph of the analyzed zone. Four different regions are noticed being from top-right to bottom-left: Ion-deposited Pt protective layer, electron beam-deposited Pt protective layer, the respective tribolayer, the tribomutation layer and finally the steel substrate. The protective Pt layers are necessary for the FIB preparation in order to avoid damaging the region of interest. The bright tribolayer has a thickness between 70 and 140 nm and the deformed tribomutation layer between 250 and 450 nm which is in a good agreement with values listed in literature [
8]. The thickness mainly varies because of roughness differences and the subjected loading profile (see
Figure 1 magnified insert) from the inner to outer ring segment. Selected area electron diffraction (SAED) was performed on two regions of interest (the tribolayer and the substrate) at 200 kV with a diffraction aperture of 180 nm. The diffraction pattern of the tribolayer (
Figure 6b) resembles an amorphous structure, with some reflections from the substrate. This is an unavoidable feature, due to the aforementioned size of the diffraction aperture of 180 nm. The diffraction pattern of the substrate (
Figure 6c) has been indexed and fully corresponds to ferrite (ICDD International Centre for Diffraction Data, PDF-2-file: 06-0696), being observed the main six reflections. The layered structure and the amorphous nature of the tribolayer fits well to the layer model proposed by Schmaltz and Bec
et al. who describe the existence of a fine-crystalline and deformed tribomutation layer followed by a crystalline layer of sulphides and oxides and finally an amorphous tribolayer consisting of polyphosphates on top [
8,
24]. The crystalline layer of sulphides and oxides cannot be clearly identified in the TEM image. The typical thickness of this layer would be about 20 nm [
24]. In contrast to that, the tribomutation layer is well pronounced due to the relatively high Hertzian contact pressure of around 1.92 GPa. Furthermore, chemical analysis was performed on the substrate and the blue film region by TEM-EDS due to its higher spatial resolution compared to conventional SEM-EDS (see
Figure 7). In
Figure 7a, the presence of distinct Zn, P, and S peaks is visible compared to the substrate spectrum.
The question regarding which film is more beneficial concerning the tribological performance cannot be answered in a straightforward manner. As soon as the colored tribolayers form (blue or brown), the bearings last until the end of the FE8 test without failing. The reaction pathways are still a matter of debate and the operating conditions provide a quite complex set of parameters with a difficult interplay between each other. By increasing the speed, more energy will be stored in the tribosystem and additionally the contact will be more effectively replenished with lubricant and so additive molecules thus facilitate the formation of potential wear resistant tribolayers. Mosey’s MD simulations suggested a contact pressure induced cross-linking of zinc phosphate molecules [
15]. According to Gosvami
et al., the nucleation and growth of tribolayers can be well described by a stress and thermally activated Arrhenius model. In this context, it is then assumed that the nucleation and growth are significantly influenced by surface heterogeneities, such as roughness, thus lowering the necessary activation energy for the tribolayer formation by varying contact areas and stresses [
25]. On the other hand, a certain regeneration time between two rolling events is needed to allow for the formation of the layers [
20]. With increasing speed, the time between two rolling events is shortened and therefore impeding the layer formation. It will be interesting to systematically elucidate the lower boundaries for the respective operating conditions under which a successful tribolayer can still be generated and to further reveal the reaction pathways of the tribolayers especially for highly loaded thrust bearings.


 ,
, 


