
Friction Reduction and Reliability for Engines Bearings

1
HEIG-VD, 1 route de Cheseaux, 1400 Yverdon, Switzerland
2
Renault S.A., 1 avenue du golf, 78280 Guyancourt, France
*
Author to whom correspondence should be addressed.
Lubricants 2015, 3(3), 569-596; https://doi.org/10.3390/lubricants3030569
Submission received: 10 July 2015
/
Revised: 10 July 2015
/
Accepted: 16 July 2015
/
Published: 23 July 2015
(This article belongs to the Special Issue Friction and Lubrication of Bearings)
Abstract
:Friction reduction is necessary in order to decrease engine emissions, so bearing friction needs to be reduced but with the constraint that low friction solutions should not affect bearing reliability. To meet this target of low friction and high reliability bearings, several technical solutions are reviewed. Particular attention is paid to evaluating friction reduction performance for each solution. Damage risks relating to customer uses are also presented in order to check that these risks are negligible with low friction solutions.
1. Introduction about Friction Reduction Stakes and Damages
Today, friction reduction has become a key point for new automotive engines due to the constraint of reducing CO2 emissions. After advertisements about crash testing with Euro New Car Assessment Program (NCAP) rating stars, low CO2 emission now constitutes a commercial advantage for automotive sales as every manufacturer attempts to improve car efficiency. Solutions for fuel economy may deal with drag force resistance reduction (aerodynamic, rolling), car weight reduction and engine efficiency improvement. From a global point of view, engine friction represents a non-negligible part of engine power loss, which determines engine efficiency. Engine efficiency is estimated by making comparisons between different engines used with the NEDC cycle (New European Driving Cycle). This driving cycle has been designed by a European committee to assess pollutant emissions of automotive engines during a driving period intended to represent a certain average customer usage [1]. Unfortunately, it is generally accepted that this cycle does not perfectly reflect customer usage and, particularly, customer consumption. New driving cycles are currently being discussed to obtain more realistic car consumption estimations with respect to customer use. However, at the moment, the NEDC test remains the official European reference test.
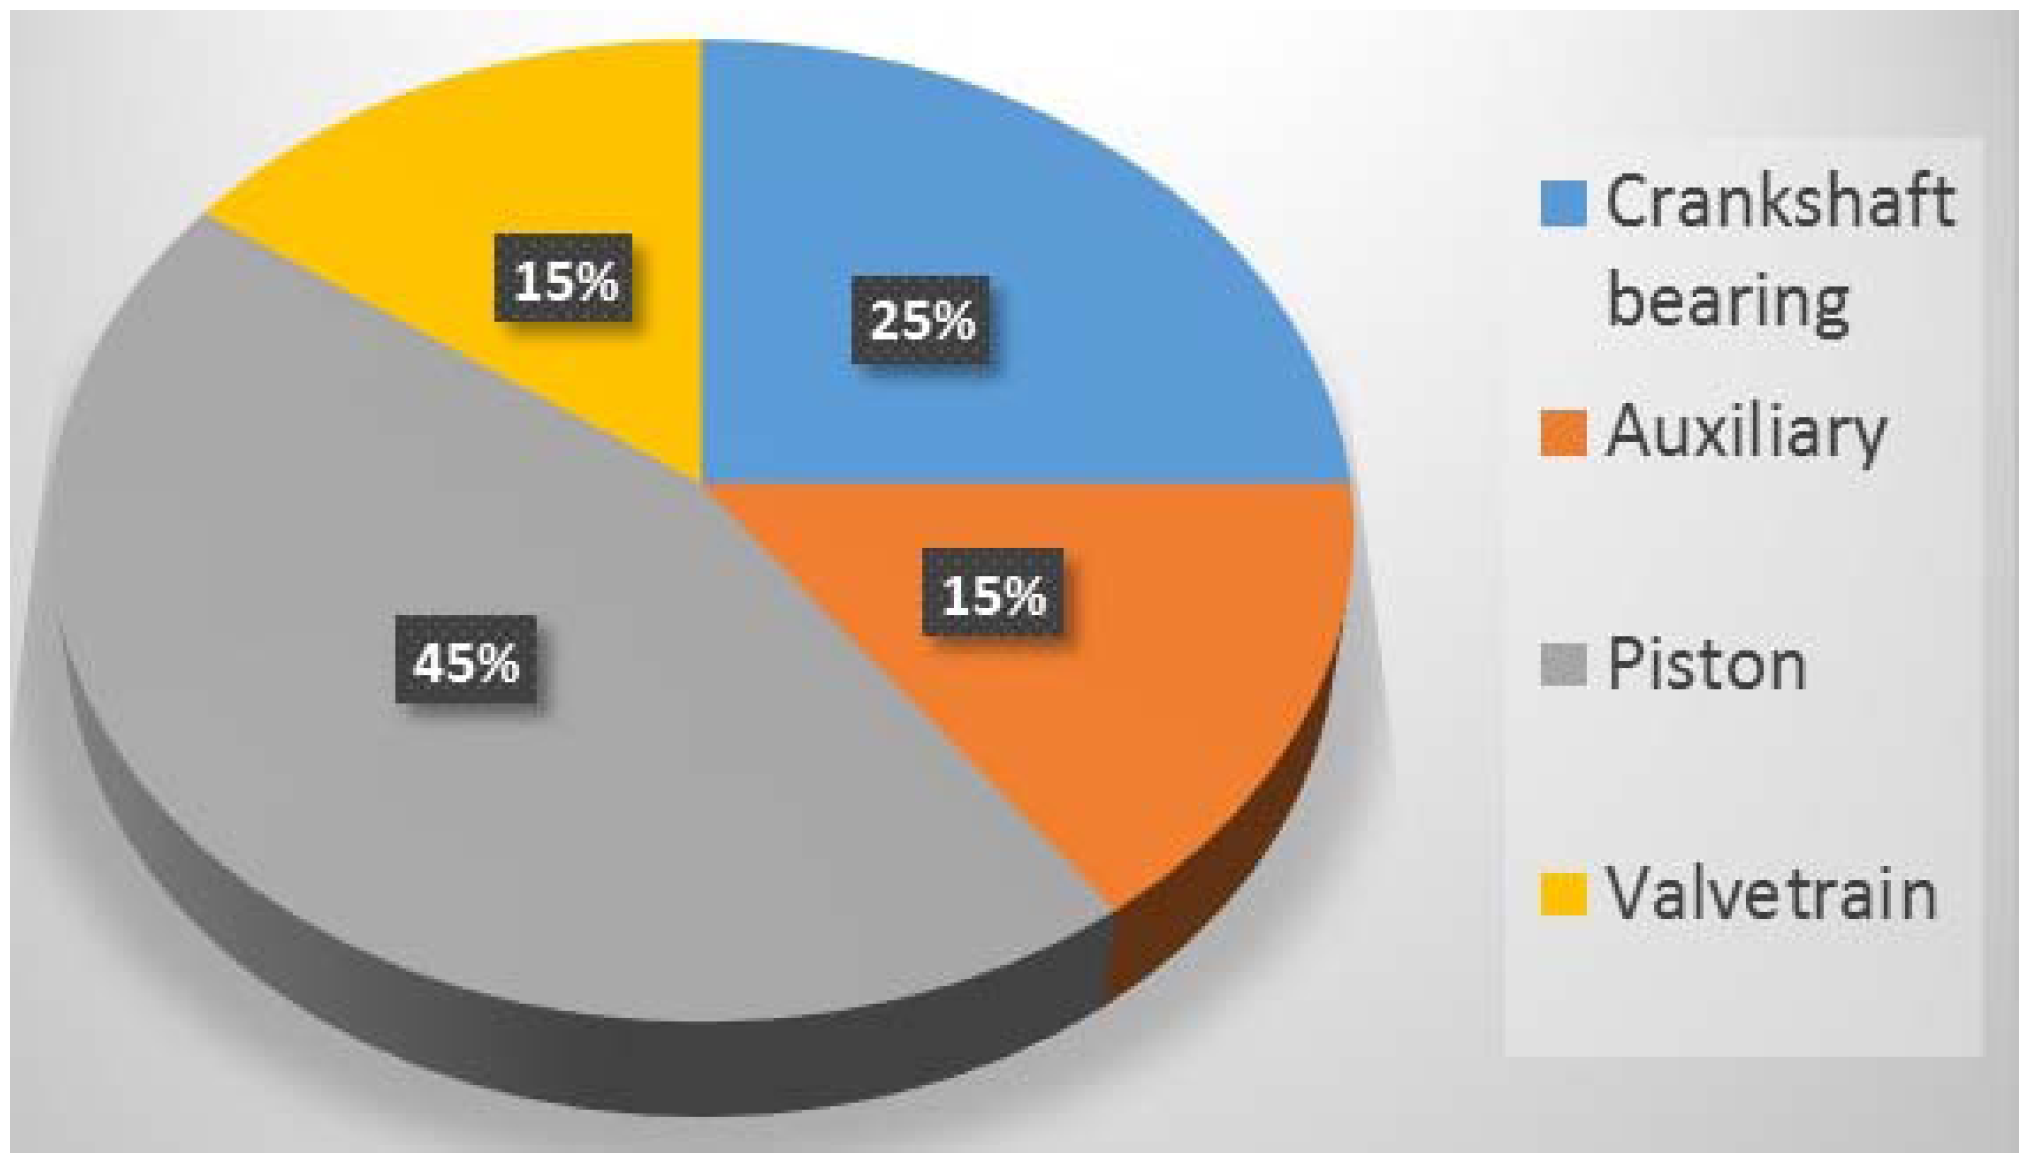
With this driving test, an automotive car equipped with a current two liter engine will produce approximately 120 g of CO2 emissions per km. The friction power loss of the engine corresponds to 25–30 g of CO2/km, with a corresponding fuel consumption of roughly 0.9 L/100 km. Engine component friction distribution varies slightly according to specialists. In his synthesis, Holmberg [2] proposes a variation interval for each friction contributor to the global engine friction. A general idea is given in Figure 1 where the friction ratio due to crankshaft bearings is about 25%. By optimizing bearings and their environment, which means the lubricant circuit and structural components like the camshaft, crankshaft, conrod and cylinder head, it seems possible to reach 25% bearing friction reduction. However, a possible adverse effect should be mentioned at this stage. Due to the sudden importance placed on friction reduction, it is possible that excessive optimistic values are claimed for new technologies or new processes. For example, a more than 60% reduction in global engine friction in the next 10 years has been predicted with respect to new engines. Unfortunately, without a large improvement of technology in component friction, this target will remain unreachable. This means that for anticipated friction reduction, tribological analyses based on realistic friction will have to be conducted to check the feasibility of such improvements.
Figure 1.
Engine friction distribution.
Thanks to new materials, for example nanotechnologies, new developments are under progress and will certainly contribute to engine friction reduction. However, for a low friction bearing solution, it is important to design or to validate new solutions with respect to running engine conditions and reliability targets.
The latest design trend is to improve engine efficiency thanks to engine down-speeding and to engine down-sizing. These evolutions mean that engine bearings are operating in more severe conditions than 10 years ago. From a practical point of view, oil temperatures are higher as contact pressure and cycles are more severe.
To complete this overview on bearings, it is necessary to take into account the recent developments implemented to make customers’ lives easier. During the last five years, all car manufacturers have offered a guarantee of at least three years. In certain cases, the warranty period could reach up to seven years. At the same time, to reduce usage cost and to improve customer comfort, the interval between oil changes has also increased. As a consequence of these developments, it is imperative to check that the risk of wear and fatigue in bearings is negligible and that the risk of damage is not increased by oil ageing.
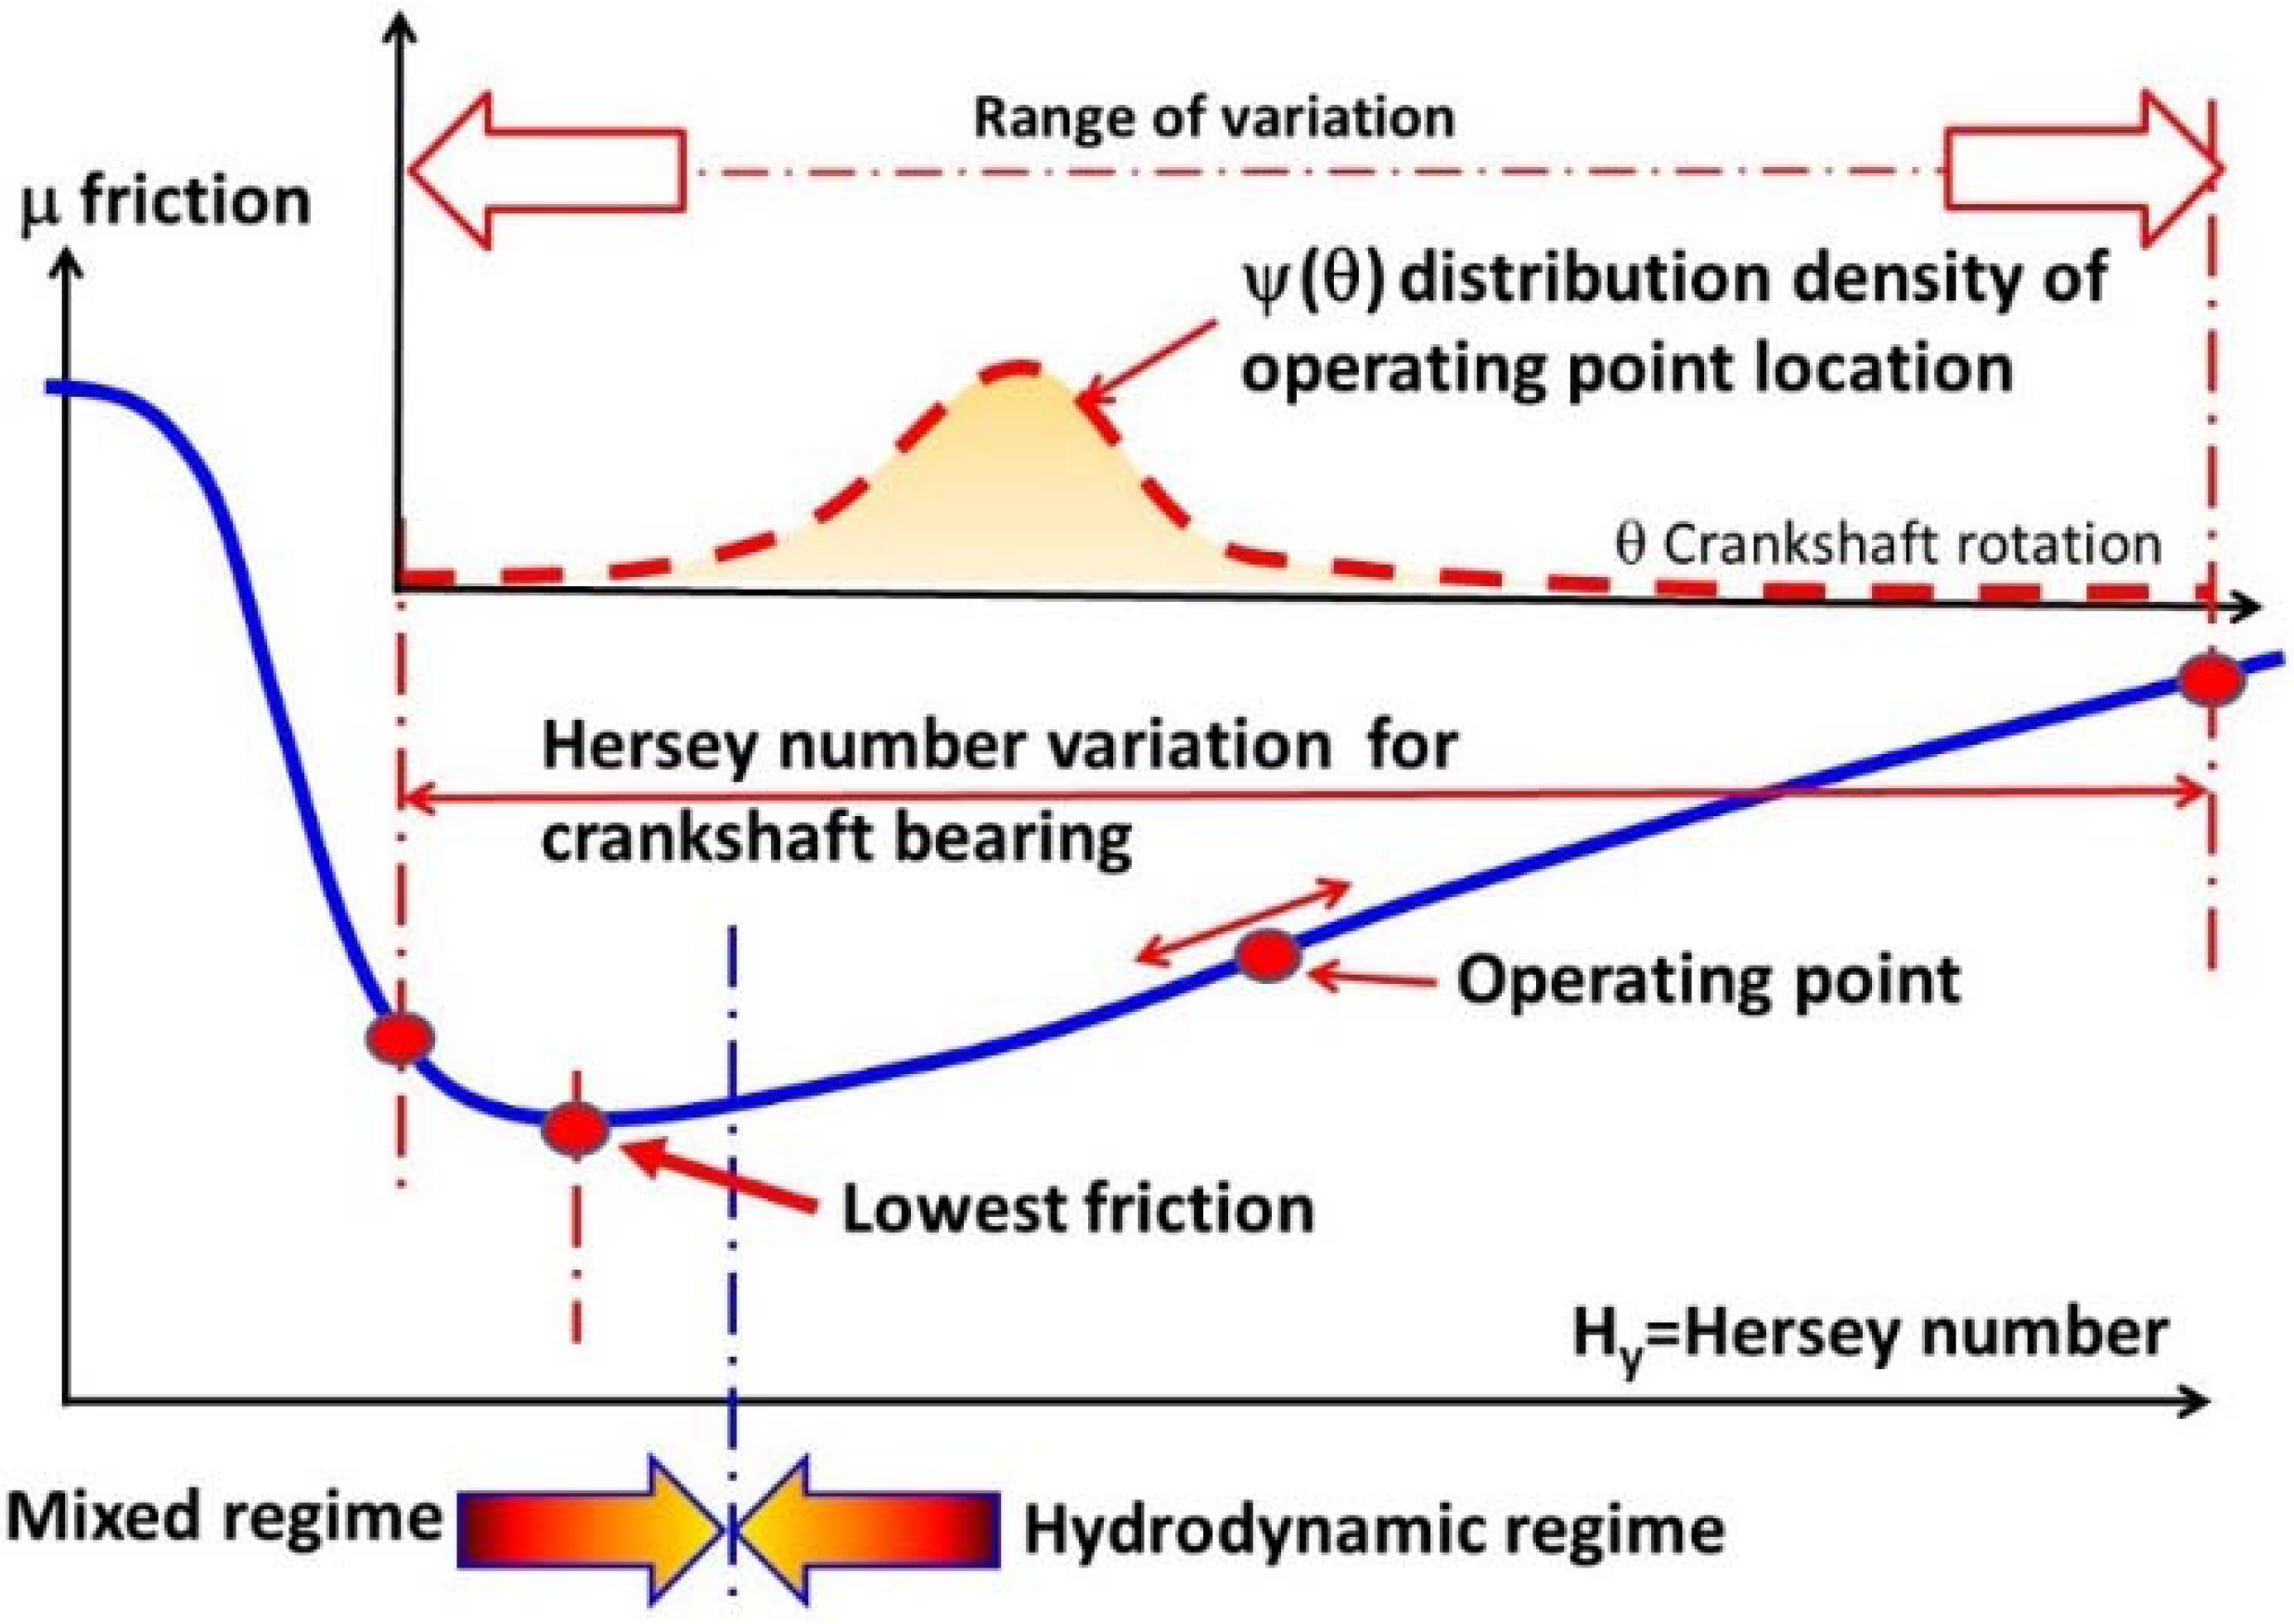
After these various comments about engine design background, it is clear that low friction bearing design has to go hand in hand with improvements in reliability. For example, an easy friction reduction could be obtained by reducing oil viscosity. However, some lubricated components could begin to operate in a mixed lubrication regime with a potential wear problem. The components usually concerned by this lubrication regime are piston rings, camshaft bearings and tappets. An increase in the mixed lubrication domain will increase particle generation and wear. These effects could affect lubricated components downstream with respect to the lubricant circuit. Just for friction reduction, oil viscosity decrease is an acceptable solution, but when low friction and reliability have to be treated at the same time, it is no longer a solution. The decrease in viscosity conceals a trap in terms of reliability, due to the fact that Stribeck’s curve indicates lower friction in mixed regimes. To illustrate this point it is interesting to look at this Stribeck’s curve in the case of a crankshaft bearing during a combustion cycle at moderate load in regard to the NEDC cycle as shown in Figure 2. Moderate load at relatively high speed implies that some squeeze effect can be neglected in the hydrodynamic lubrication for gasoline engine bearings. Thus, the shaft center location in the bearing clearance can be seen as a quasi-static state succession controlled by the load carrying capacity of the bearing in rotation.
Figure 2.
Stribeck’s curve for crankshaft bearing.

As friction is the main subject of this item, it is interesting to bear in mind a few notions and relationships which are used for numerical estimations.
In this figure, Stribeck’s curve is plotted with respect to Hersey’s number . This dimensionless number is defined as the product of dynamic viscosity by angular speed upon specific pressure applied on bearing. For fixed viscosity and speed, pressure can be expressed by a biunivocal relationship with the crankshaft angle. It means we can obtain:
with Cfr the instantaneous friction torque, R the bearing radius and F the normal load applied on the bearing.
To complete this plot, it is necessary to add the time distribution of the operating point location. This operating point represents the instantaneous friction of the crankshaft bearing during the combustion cycle. This time distribution, called ψ(Hy) or ψ(θ), is expressed in term of Hersey’s number or in crankshaft rotation angle.
Then, the average friction coefficient becomes:
It must be noted that the friction coefficient definition for radial bearing (Relationship 1) has no realistic meaning with an applied load close to nil. In that case, the friction torque, due to Couette flow, is not zero, as the fluid is sheared. With the previous friction Definition (1), the friction coefficient rises to infinity.
However, this average friction coefficient, multiplied by the bearing radius and by the normal load, keeps a mechanical meaning, frictional torque, and it will be used in this sense.
For this lubricated component, we can observe that a decrease in oil viscosity will translate Stribeck’s curve towards the right. This translation gives a lower global friction torque. However, the bearing will operate longer in a mixed lubrication regime, which means more microscopic contact occurrences take place between the shaft and bearing surface. The consequences are higher temperatures, higher wear rates and higher hydrodynamic pressure peaks. Thus, the rule to maintain reliable bearing is as follows: a viscosity decrease must be associated with bearing performance improvement. This improvement will be characterized with better resistance to wear and fatigue.
The average friction coefficient can also be deduced from the Petroff relationship. Then, the definition of the coefficient is:
where the average friction torque is defined by:
with Cr the radial clearance, η oil viscosity, average eccentricity ratio, L bearing width ω rotational speed.
From the field, it appears that an average eccentricity ratio comprised between 0.6 and up to 0.7 gives a realistic order of magnitude for conrod bearing friction during the combustion cycle at nominal speed [3,4].
Therefore, this paper will present low friction solutions related to bearings but also the main bearing damages and their characteristics in order to reach a good understanding of the particular remedies adopted for low friction solutions. Bearing damages will be presented first as a low friction solution directly depends on potential bearing damages.
2. Damage Characteristics
As mentioned previously, it is useful to have an overview of the main characteristics of damages and their consequences on low friction solutions for engine bearings. As a background to bearing characteristics, a quick synthesis of functional bearing properties will complete this overview. Ultimately, damage and bearing performance knowledge leads to a better understanding of certain antifriction material evolutions.
2.1. Fatigue
The subject of fatigue damage can be quite complex if we try to use a similar approach to that of structural fatigue analysis.
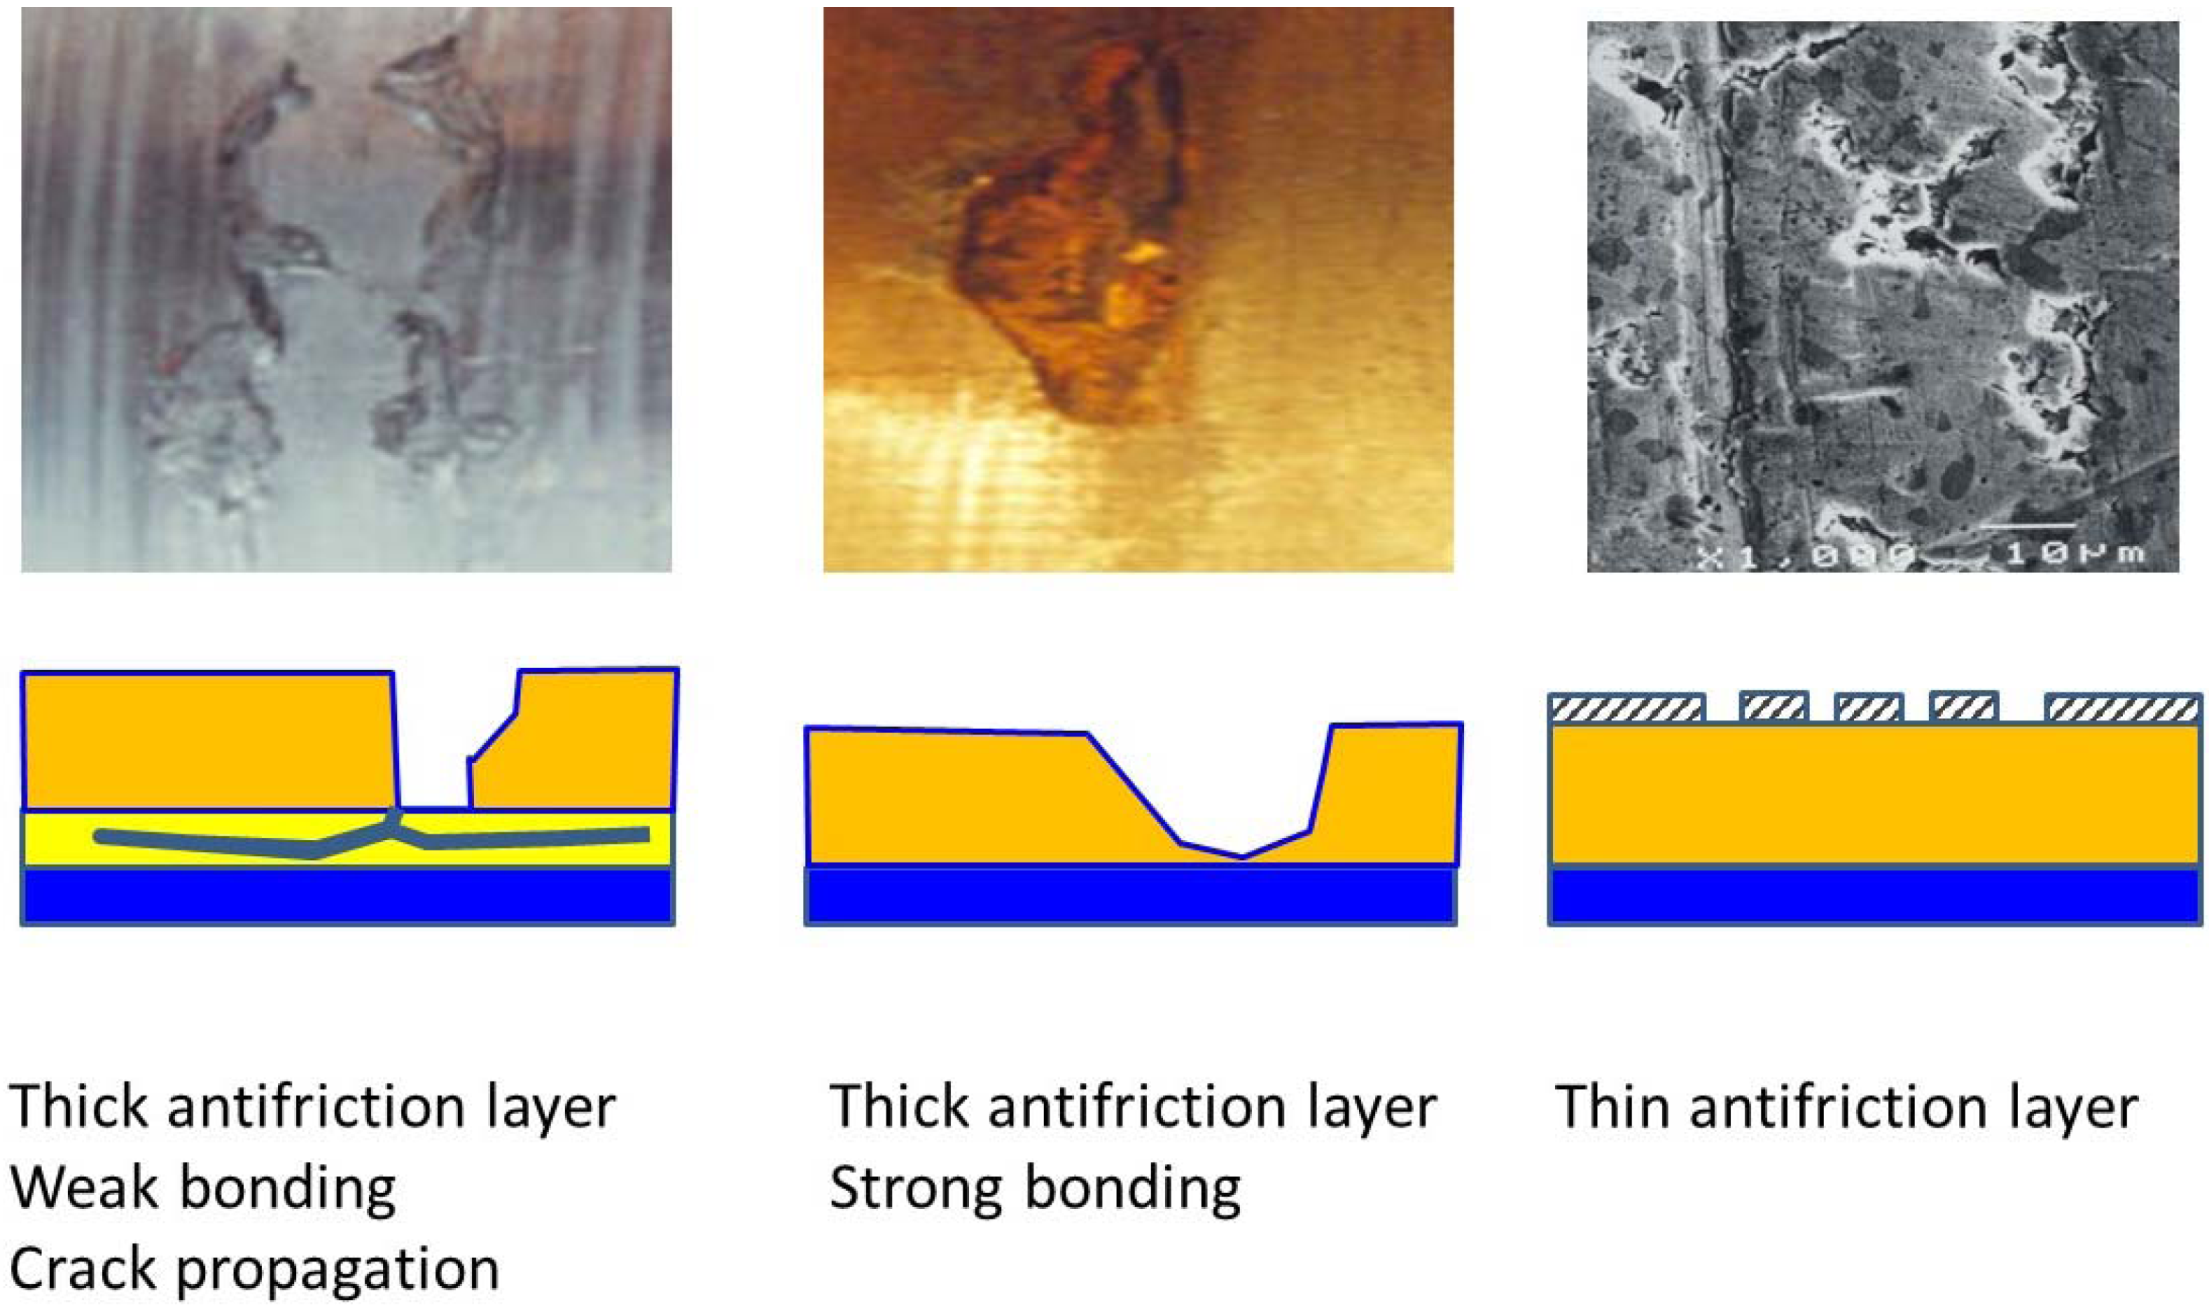
The target of fatigue analysis is to estimate the cycle number which generates microscopic nucleation in antifriction material. In the damage process leading to antifriction material removal after fatigue occurrence, the following steps are involved: nucleation site coalescence and crack propagation. With respect to antifriction characteristics, thickness, bonding strength with substrate, final facies damages will be different. Figure 3 shows three specific fatigue facies related, from left to right, to aluminum tin alloy, to brass, and to lead tin overlay. It can be seen that the full damage process description is very complex.
Figure 3.
Fatigue facies.
To overcome this complexity in carrying out an accurate stress analysis resulting in an efficient fatigue analysis, bearing suppliers use essentially specific pressure, or diametral pressure as a criterion. It means that for a radial load F, the diametral pressure must be lower than Rm:
with L bearing length and D shaft diameter.
However, accurate forecasting involves consideration of stress tensor and tridimensional fatigue analysis. Then, to correctly evaluate the fatigue risk, it is also necessary to use accurate pressure fields.
Thermo-Elasto-Hydro-Dynamic calculations provide more realistic results than hydrodynamic calculation results. In particular, elastic aspects ensure that the maximum hydrodynamic pressure becomes closer to reality instead of showing huge and unrealistic pressure peaks as could happen with hydrodynamic calculation where bodies are considered rigid. Thermal aspects allow one to take into account thermal stress in bearing overlay, which is relevant for internal stress overlay. On fatigue resistance, the results presented in paper [5] have shown the influence of antifriction layer bonding, thermal stress and residual stress induced by antifriction plastic flow. For new bearings, this implies that an increase in terms of temperature and the number of cycles requires improved fatigue resistance. By considering Basquin’s law [6] for moderate temperature variation associated with moderate stress variation, it is possible to estimate the modifications required to maintain high reliability. To get a certain cycle number providing fatigue, called Nrup, the following relationship links temperature change and stress modification.
with : reference stress, : reference temperature, a and b: two constants of the antifriction material.
For antifriction materials, these a and b constants are respectively close to 0.2 and 0.25. It is interesting to keep in mind that, in Basquin’s relationship, temperature acts on two levels: stress increases and material resistance decreases as temperature increases.
From a practical point of view, the previous Equations (5) and (6) allow one to assess the need in term of mechanical characteristics of antifriction material as soon as the temperature evolution has been estimated. The procedure consists of keeping the number of fatigue cycles higher than customer cycles.
2.2. Wear
This damage is also quite complex to forecast. Today, the way to assess wear intensity requires specific hydrodynamic calculations. Firstly, the lubrication equation has to consider rough surfaces in order to take into account some beneficial or disadvantageous effect due to surface texture or special asperity distribution. This is usually done by introducing flow factors in Reynold’s equation [7]. Secondly, a microscopic contact model with statistical parameters description has to be put into the calculation. In this way, it is possible to simulate mixed lubrication. With this kind of tool, which represents a big technical advance in comparison with pure hydrodynamic calculation, two problems detailed below remain:
- -
- Accuracy of contact intensity forecast
- -
- Calculated wear pattern
Contact intensity: contact in mixed lubrication is generally quantified in terms of power density of contact designated by PVcontact. To estimate this parameter, it is necessary to evaluate the contact pressure, Pcon, which corresponds to the part of the nominal pressure carried by asperity contact. So, the definition is:
with T = cycle period, V(t) relative speed.
However, with lubrication calculation software PVcontact values such as 100–1000 megapascal-meter per second (MPa.m/s) are regularly obtained locally in certain bearing areas such as edge faces or bore relief edges. Unfortunately, these values are far from what really happens and do not at all correspond to a stabilized contact when a bearing runs. Heat flow generated by such contact can be estimated by multiplying PVcontact by a friction coefficient related to the tribological couple (shaft/bearing antifriction). In that case, heat flow is so enormous that it would involve quasi instantaneous melting of antifriction material at the bearing surface, which is not observed for soft mixed lubrication. Some interesting improvements could be obtained by introducing some numerical wear [8]. This calculation artifice allows a reduction in the contact pressure peak. However, computed values could remain too high [9,10,11]. The recommendation when faced with such results is to evaluate by thermal consideration the maximum values of µPVcontact for the bearing, with special attention to the cooling path. For example, the crankshaft web has to be seen as a heat exchanger. The link between simulation results and experiments will also allow for an approximating wear time rate which is directly dependent, in first approximation (Archard relationship), to the term PVcontact.
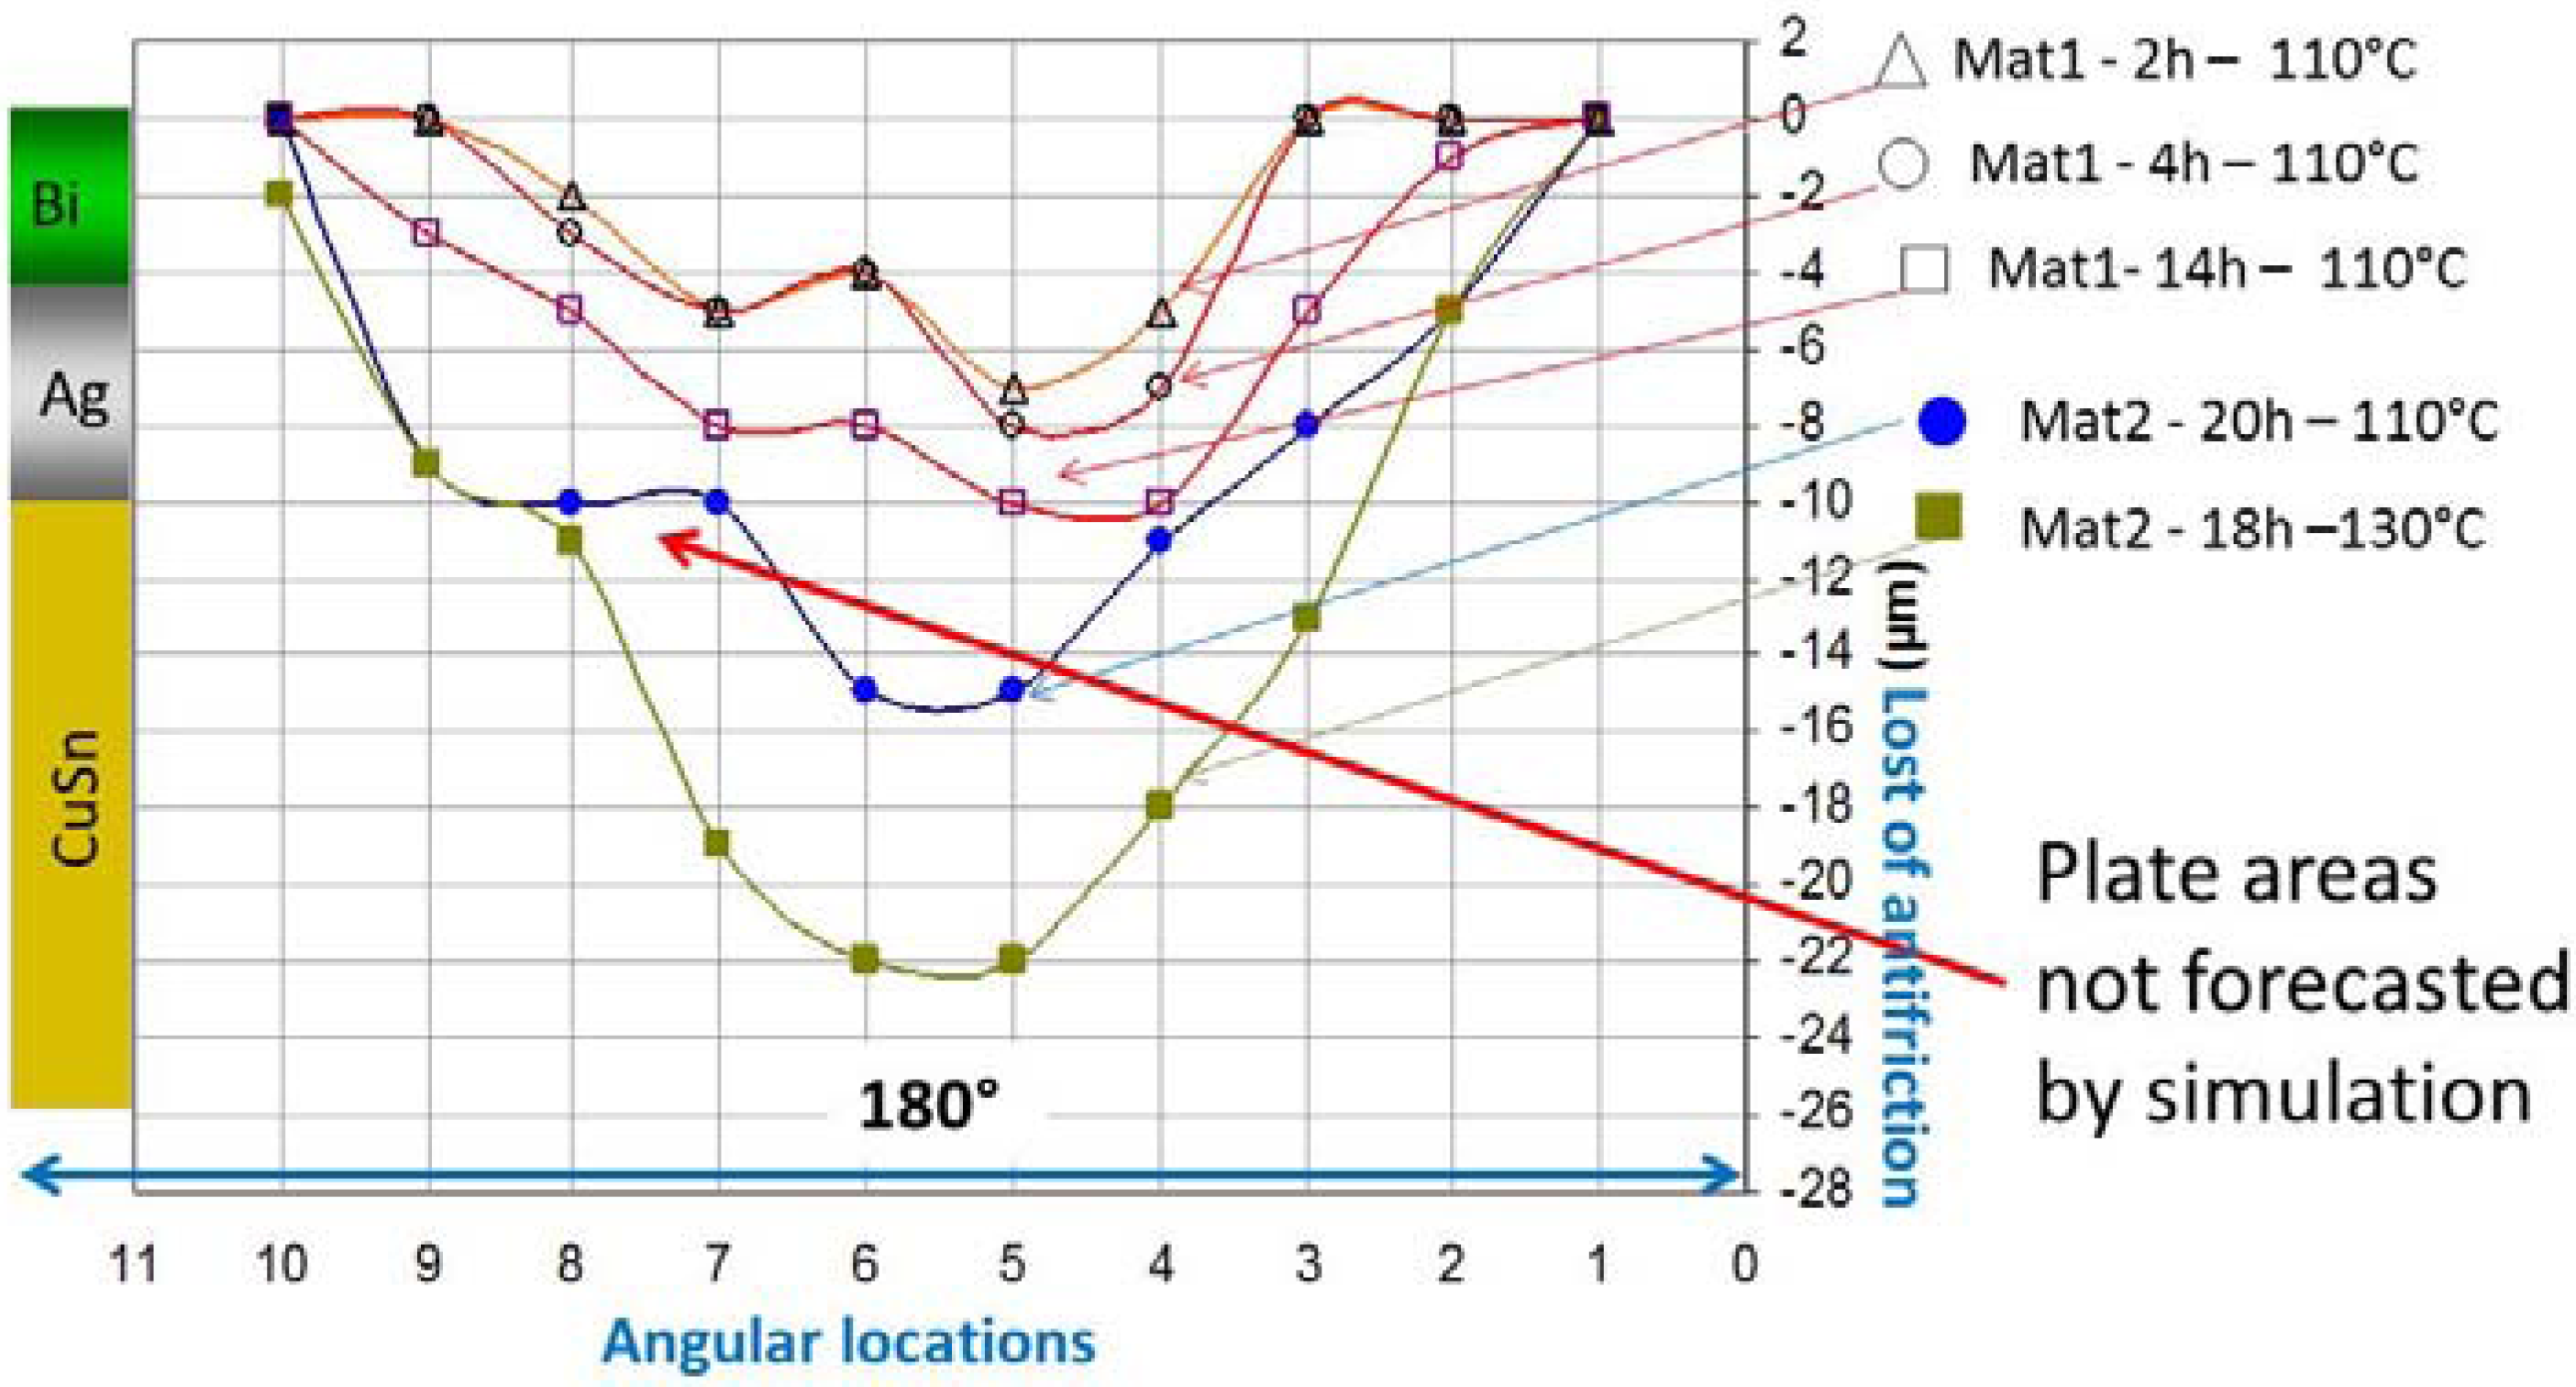
Wear pattern: With wear calculation, it is possible to obtain the pattern profile in a bearing. However, in the field, it has been observed that calculation results are sometimes quite far from reality. In fact, some unusual wear patterns are obtained. By measuring the worn bearing thickness along the circumference at different instances during an endurance test, one can obtain profiles such as those shown in Figure 4. The results come from a two turbocharged diesel engine with silver alloy bearings.
Figure 4.
Wear patterns.

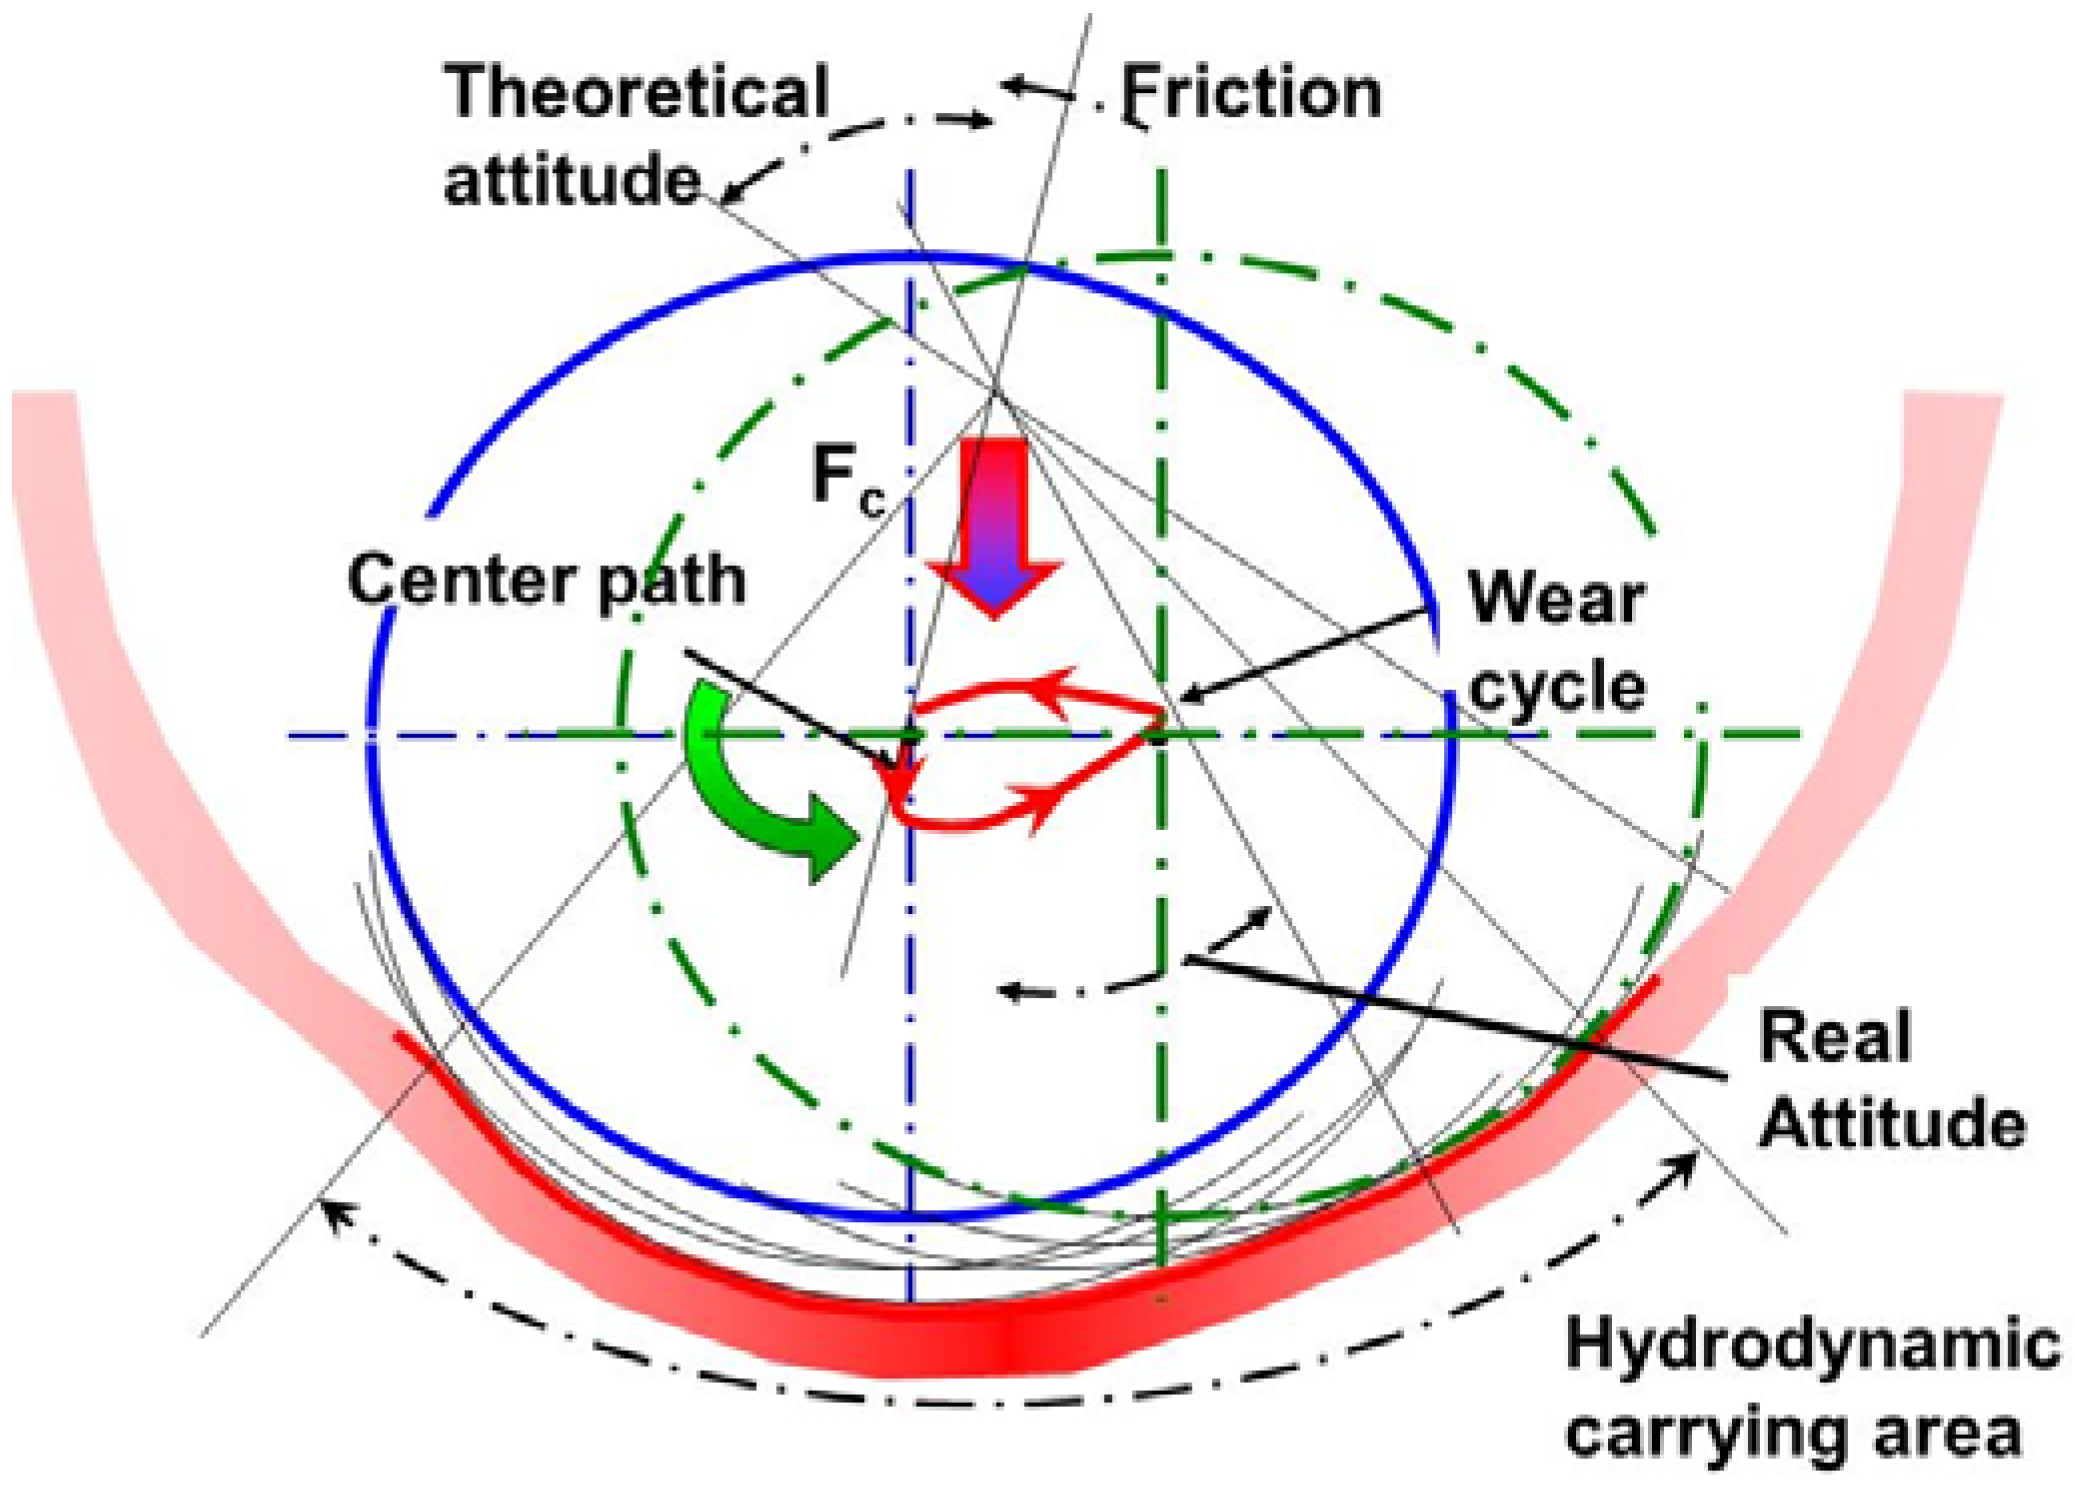
These various profiles do not correspond to a simple shaft translation in the overlay. In fact, the wear process is not a uniform antifriction material removal. In certain situations it has been shown [10] that the shaft center can move as shown schematically in Figure 5.
Figure 5.
Shaft center path during wear process.

Confronted with these difficulties in wear prediction, it remains very interesting to identify the wear factor correlating calculations and measurements in order to get realistic wear forecasts.
2.3. Seizure
This failure remains of great importance for design engineers. Often, bearing seizure does not allow us to determine the root of the failure to be the bearing and its environment could be completely destroyed. For example, an antifriction material defect will not be identifiable when the whole bearing is destroyed. Neither can a bolt problem be determined when all the parts of the conrod are broken.
From a theoretical point of view, seizure is considered to occur when the heat generation is higher than the heat dissipated by heat transfer and by lubricant flow.
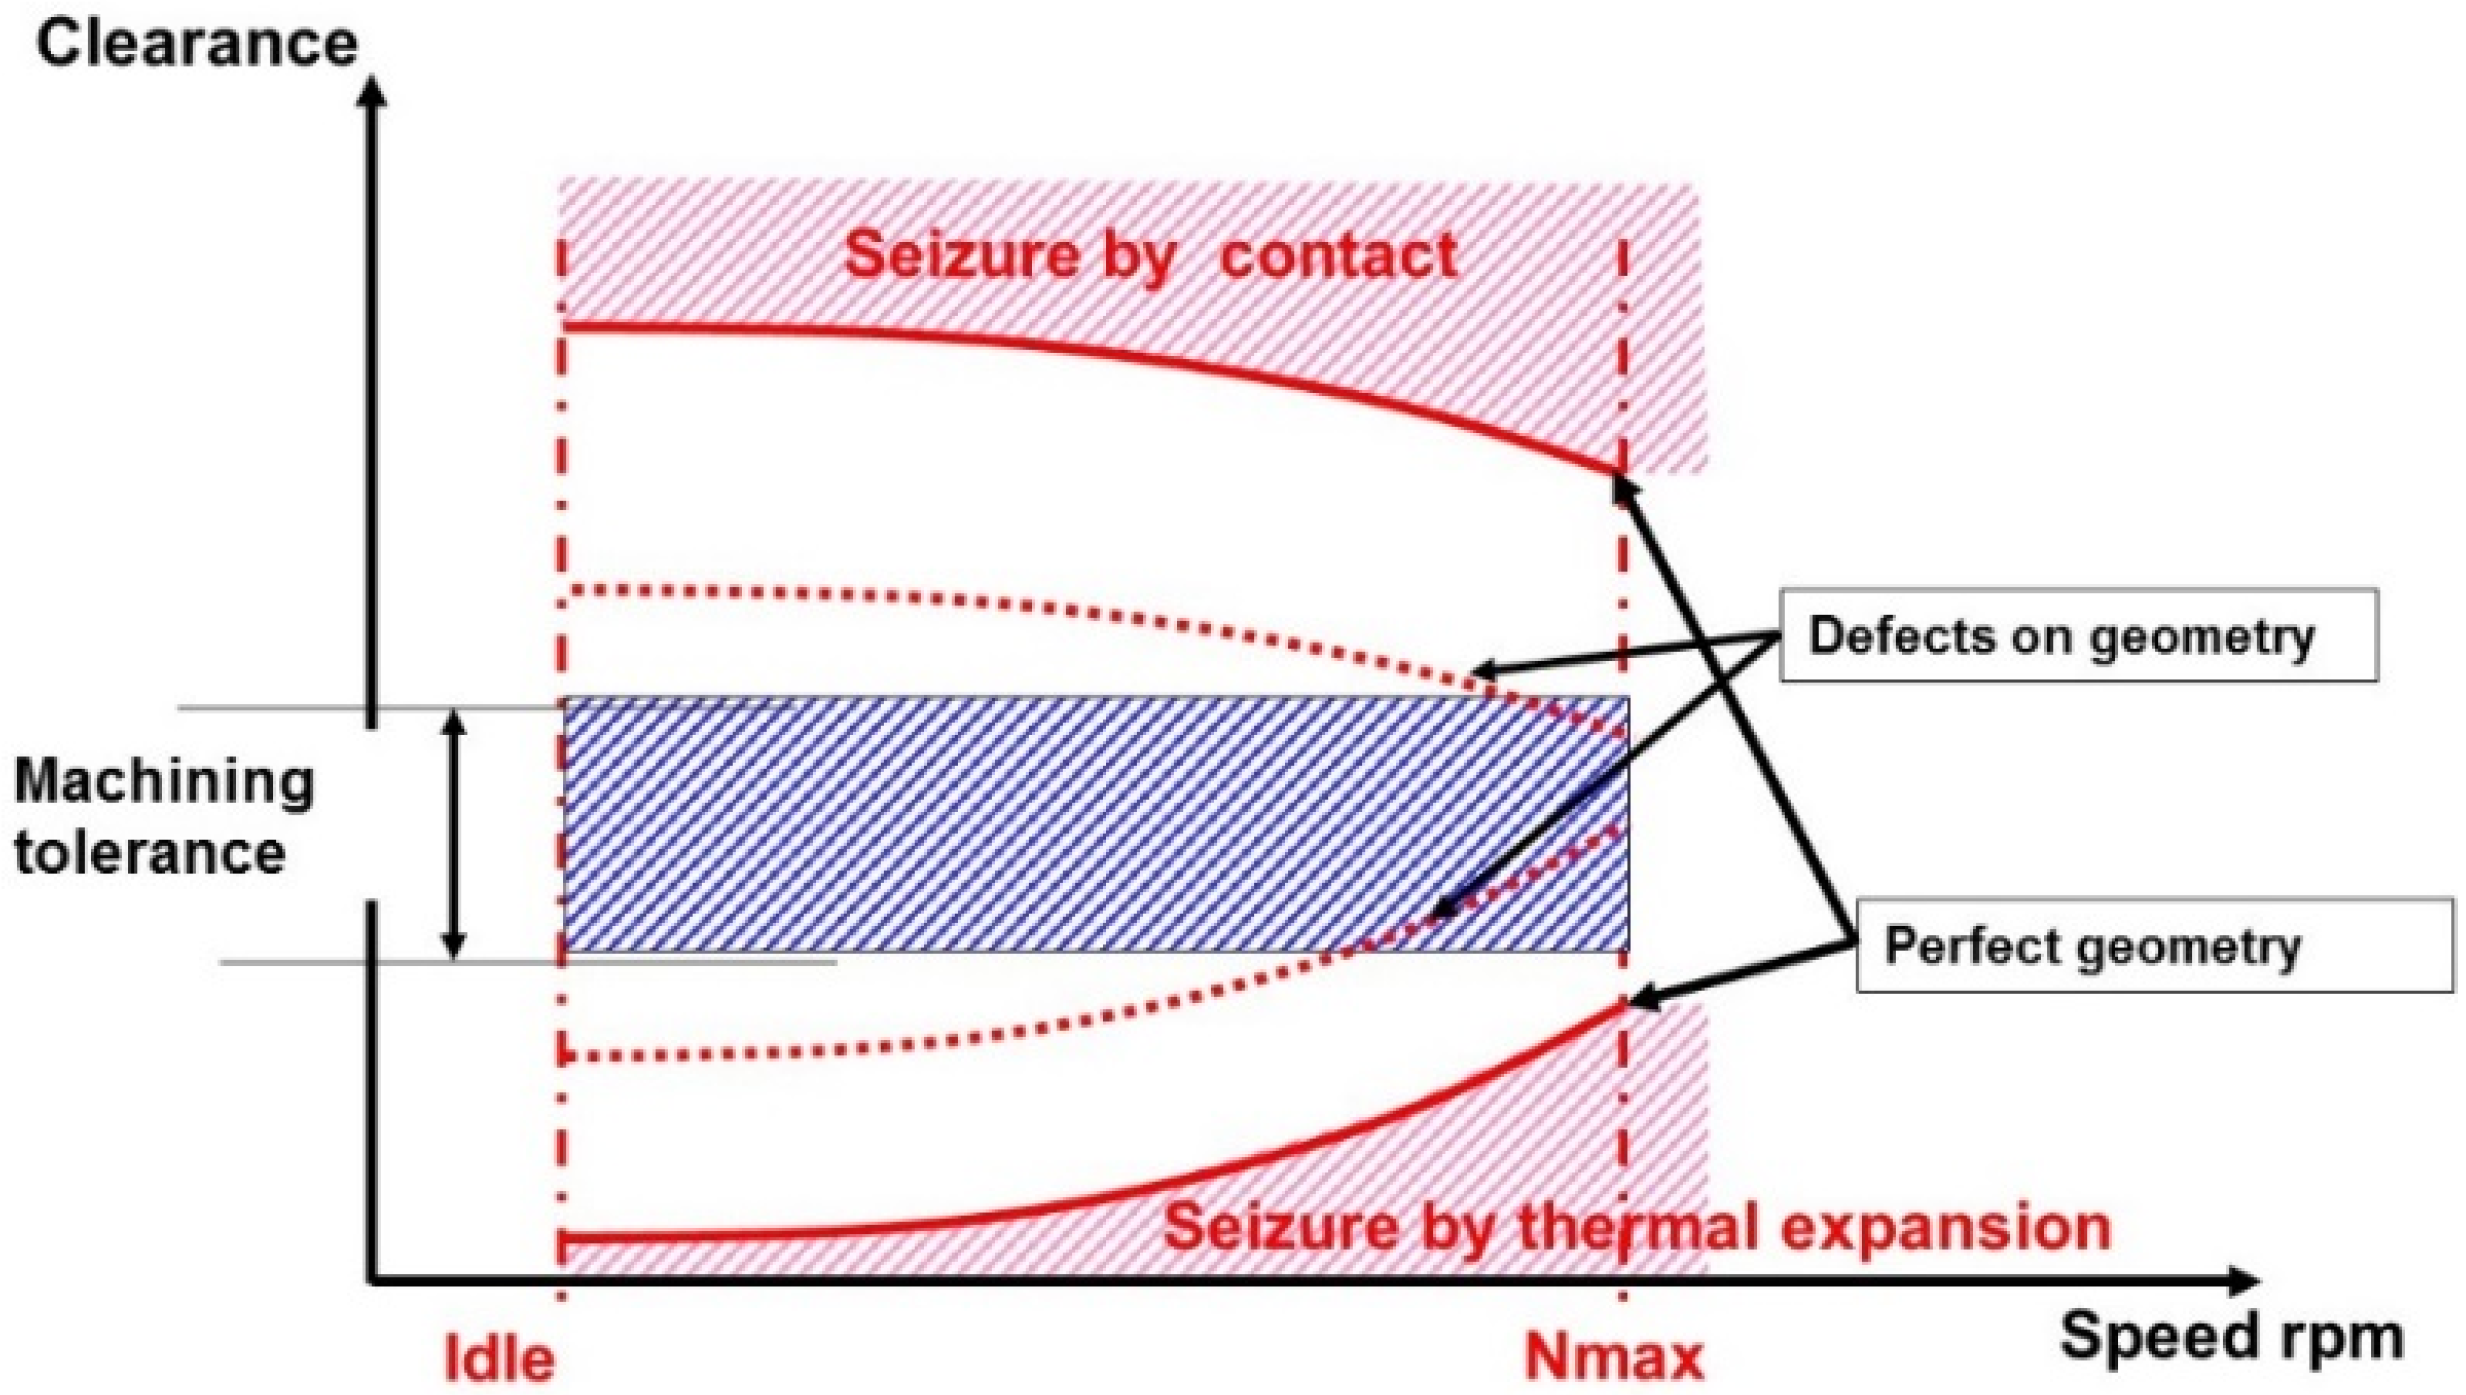
From a practical point of view, seizure due to geometrical defects occurs in more than 90% of cases. Too small a clearance or too big a clearance can generate high heat generation in bearings, which can induce seizure. To illustrate this point, Figure 6 presents the two domains of bearing seizure (red on figure) with respect to the clearance and the speed. For a large clearance, seizure is induced by asperity contact. For a low clearance, seizure is due to clearance reduction by different thermal expansion between the shaft and the housing [11].
Figure 6.
Seizure graph.
As bearing is machined (bored or broached) with some tolerances, we must introduce clearance variations in this graph in order to assess the seizure risk with respect to this machining tolerance. This tolerance is represented by a blue rectangle.
As shaft geometry or bearing geometry are not perfect, local geometrical defects must also be taken into account to determine the seizure domain limits. The seizure areas will grow with respect to the geometrical defect amplitude. It implies that with the help of the red dot lines in Figure 6, it is possible by introducing worse geometrical defects to check if the clearance variation strip could operate without seizure risk. In other words, the blue rectangle must not cross the dotted red lines.
So, for new bearing designs, it will be necessary to estimate the friction (mixed and hydrodynamic) for bearings with the largest geometrical defects associated with the bearing and shaft machining quality. The friction estimation will be carried out with the minimal clearance and the maximal clearance. Once the minimal and the maximal clearance limit have been defined, the distance between the two limits of seizure domains must be larger than the machining tolerance of the bearing clearance. Otherwise, quality level or machining tolerance must be reduced.
2.4. Bearing Properties
After the description of the three main types of damage which naturally involve properties of fatigue resistance, wear resistance and seizure resistance for reliable bearing, some other properties have to be mentioned with a few explanations. The idea is to emphasize the strangeness of bearing material properties and the compromise made between various properties for specific bearing applications. Some bearing properties are completely antagonist with each other. This particularity of bearing properties explains why some bearings can have up to seven different layers and can consist of composite materials with different phases, such as aluminum-tin bearings. The importance of each bearing property is strongly dependent on the application. For example, a very rigid crankshaft would not need to take into account edge loading due to crankshaft bending. The conformability property would not be important in this case.
The remaining qualitative bearing properties to enumerate, in no order of importance, include:
- -
- Embeddability
- -
- Cavitation resistance
- -
- Corrosion resistance
- -
- Delamination resistance
- -
- Conformability
- -
- Adaptability
The new trends in development try to define properties in more mechanical and quantified terms like hardness, yield strength, ductility and fatigue resistance [12]. However, due to the behavioral complexity of antifriction material, due to the difficulty to translate them into mechanical properties and due to habit, old qualitative properties are still used.
2.4.1. Embeddability
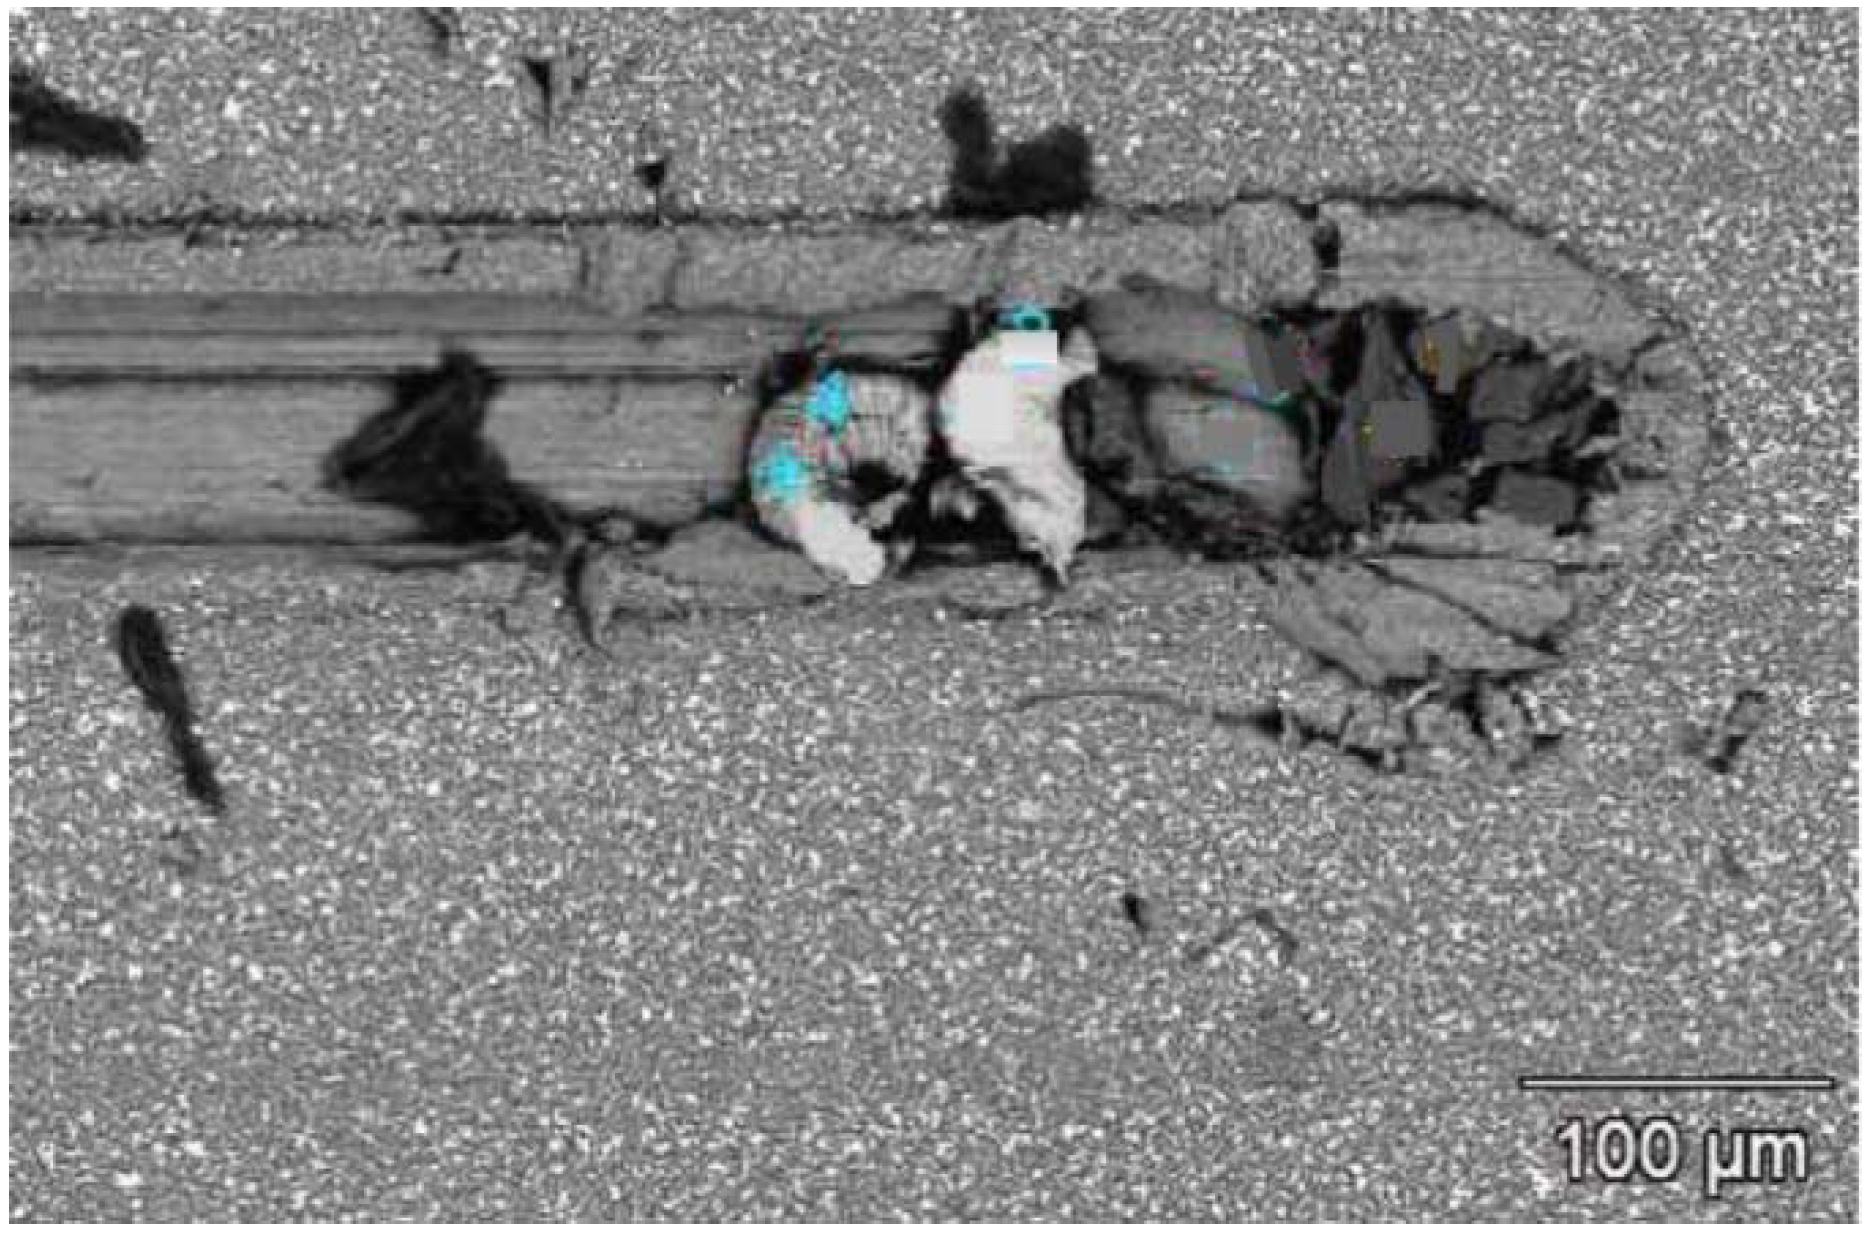
Unfortunately, all automotive engines or industrial devices generate hard particles. Most often the oil filter cannot remove all the particles bigger than the minimum oil film thickness in lubricated components such as crankshaft bearings. To operate successfully, the lubricated component must have an antifriction layer able to embed small hard particles in the surface layer without damaging the antagonist shaft surface and also without producing scratch grooves on its surface. Another effect due to hard particle pollutant is the increase in friction of the bearing [13,14], which leads to a higher running temperature. This friction increase is related to the contaminant concentration as soon as the concentration exceeds approximately 0.3 mg/L in current automotive engines. From a practical point of view, hard particles must sink quasi instantaneously into the overlay. In Figure 7, the hard particle has produced an undesirable score on an aluminum/tin alloy surface. Generally, the embeddable layer is designed with a thickness close to the lubricant filter threshold. Overlay material property needs a low hardness and, moreover, must have great ductility and a high elastic modulus to avoid an “elastic spring back” of the aggressive particles. Otherwise, the embedded layer would become like emery, due to the fact that the hard particles are not fully embedded. Such a problem is frequently encountered with hyper-elastic materials like elastomer seals.
Figure 7.
Embedded particle.

From another point of view, one can see the bearing overlay acting as a small particle filter. The embeddability property is fairly important for long life engines.
2.4.2. Cavitation Resistance
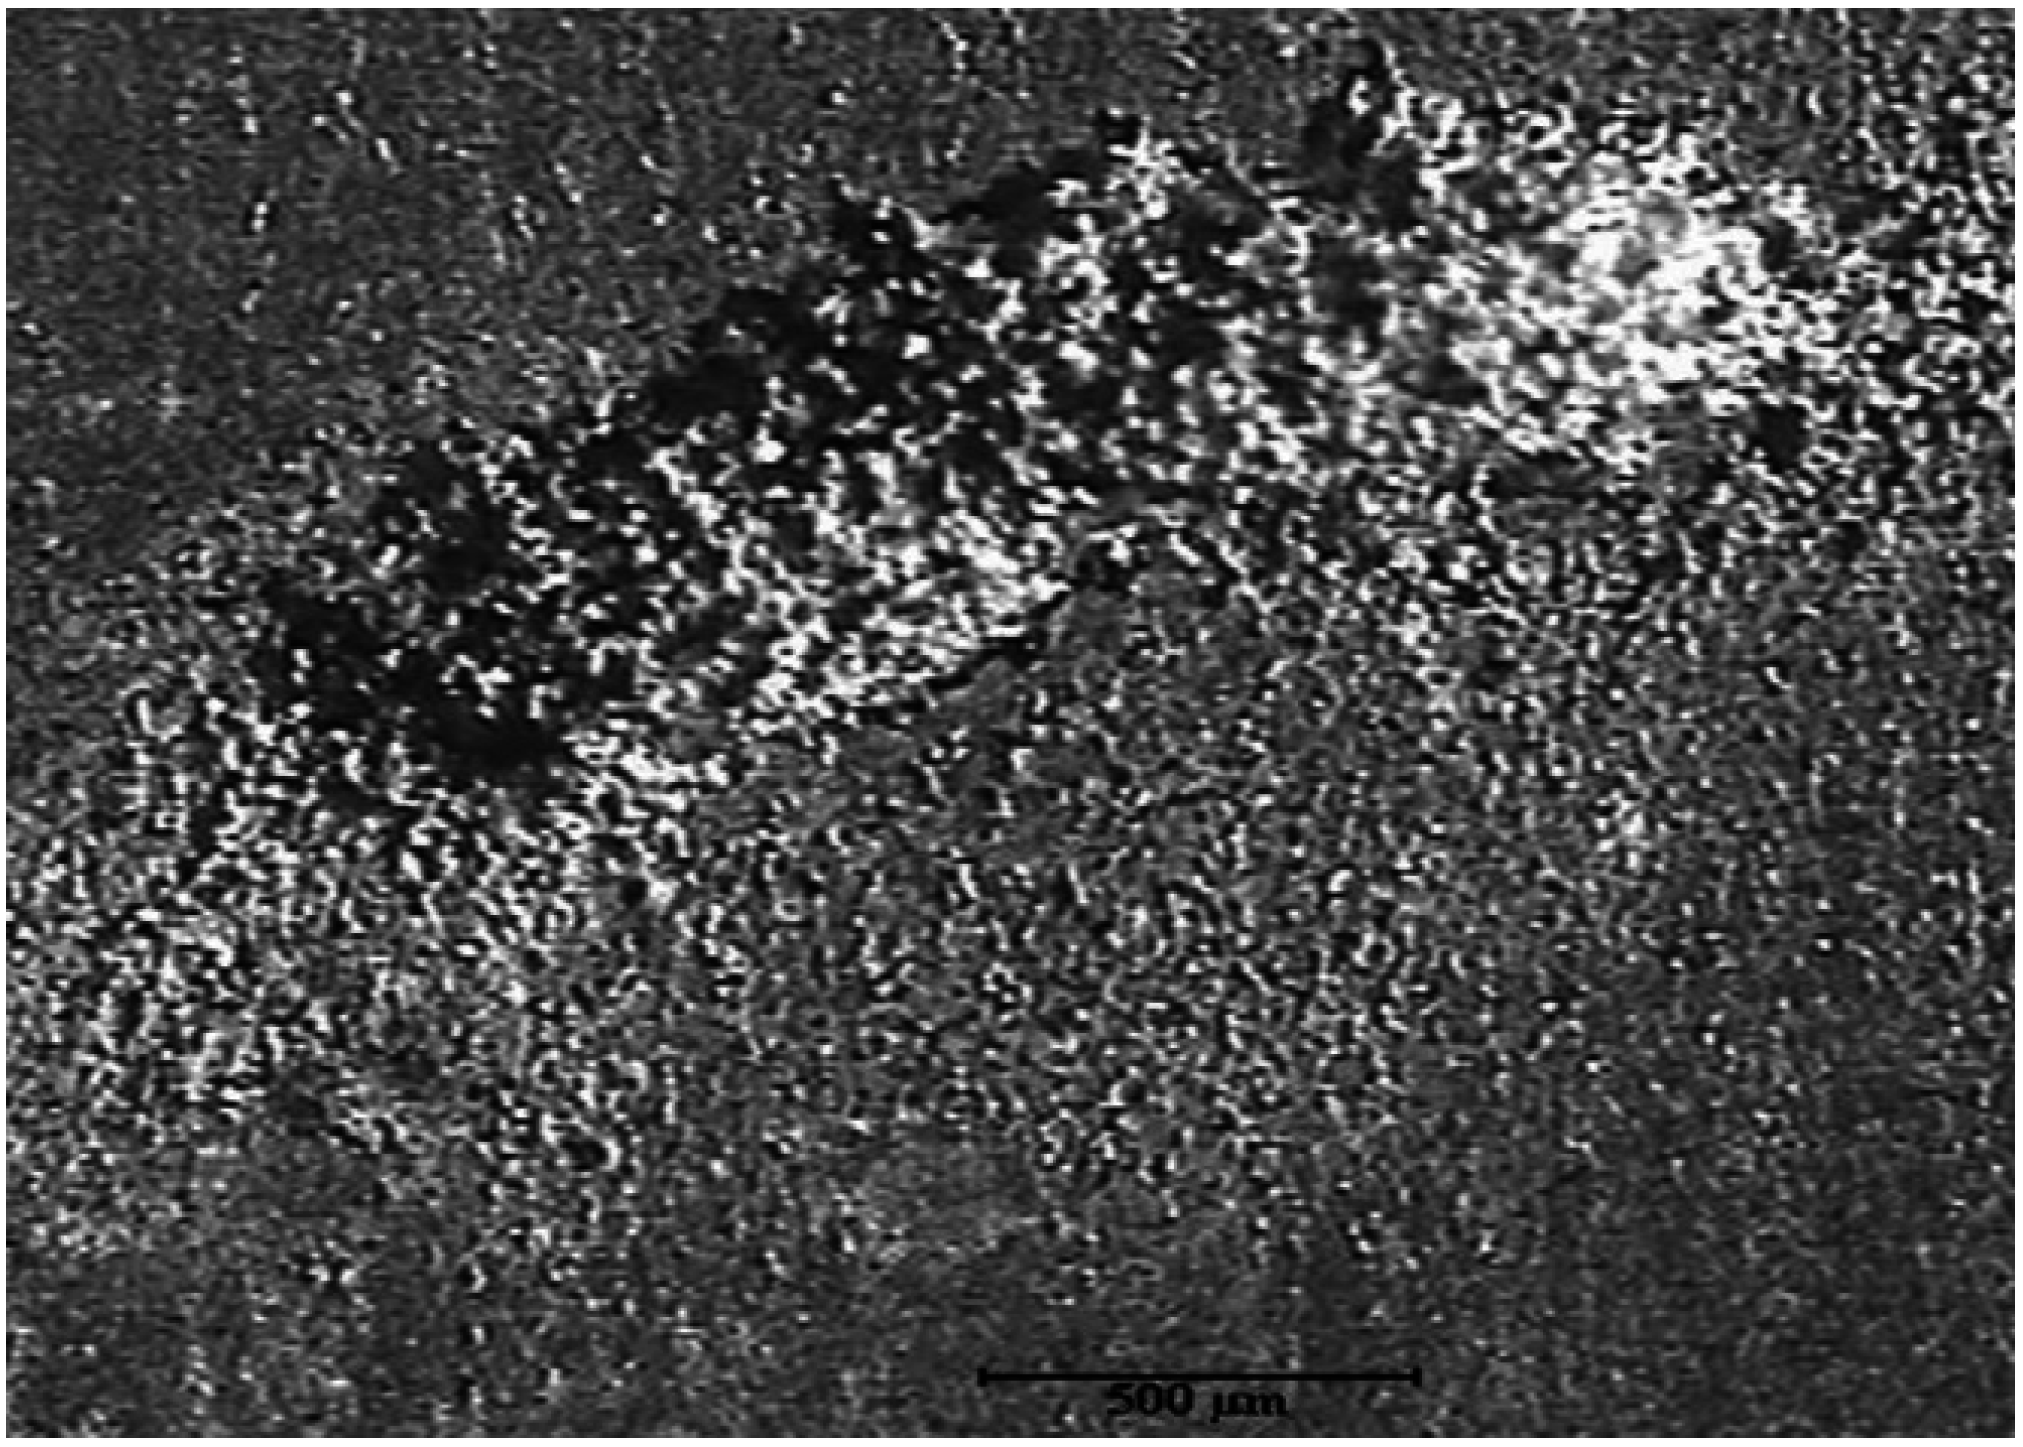
In hydrodynamic bearings, cavitation phenomenon can occur (due to a sudden depression, bubbles filled with vapor are created in the flowing liquid). In radial hydrodynamic bearings, the phenomenon is mainly due to high rotational shaft speeds combined with sudden section variations or with sudden shaft center translations [15]. When the depression ceases to exists, the bubbles collapse. The bubble crash generates shock waves and micro-jets at the bearing surface. These micro-impacts produce surface damage. This kind of damage is characterized by circular craters of approximately 10 µm diameter which can be detected by microscope on bearing surfaces (see Figure 8). After some time, these impacts can completely destroy the bearing surface and can produce bearing failure. To resist this type of damage, the bearing must have a high level of hardness, which is the opposite of the previous property. Once again, this property is not systematically requested but concerns only specific applications which have to guarantee a very long life.
Figure 8.
Cavitation damage.
2.4.3. Corrosion Resistance
With new antifriction materials (nickel, copper, molybdenum) and lead prohibition in antifriction material, the corrosion resistance is easily satisfied in standard engines (diesel or gasoline). For lead overlay, tin or indium are added to give some corrosion resistance with respect to alkaline oil. When tin is added, the diffusion phenomenon could eventually affect the bearing resistance.
2.4.4. Delamination Resistance
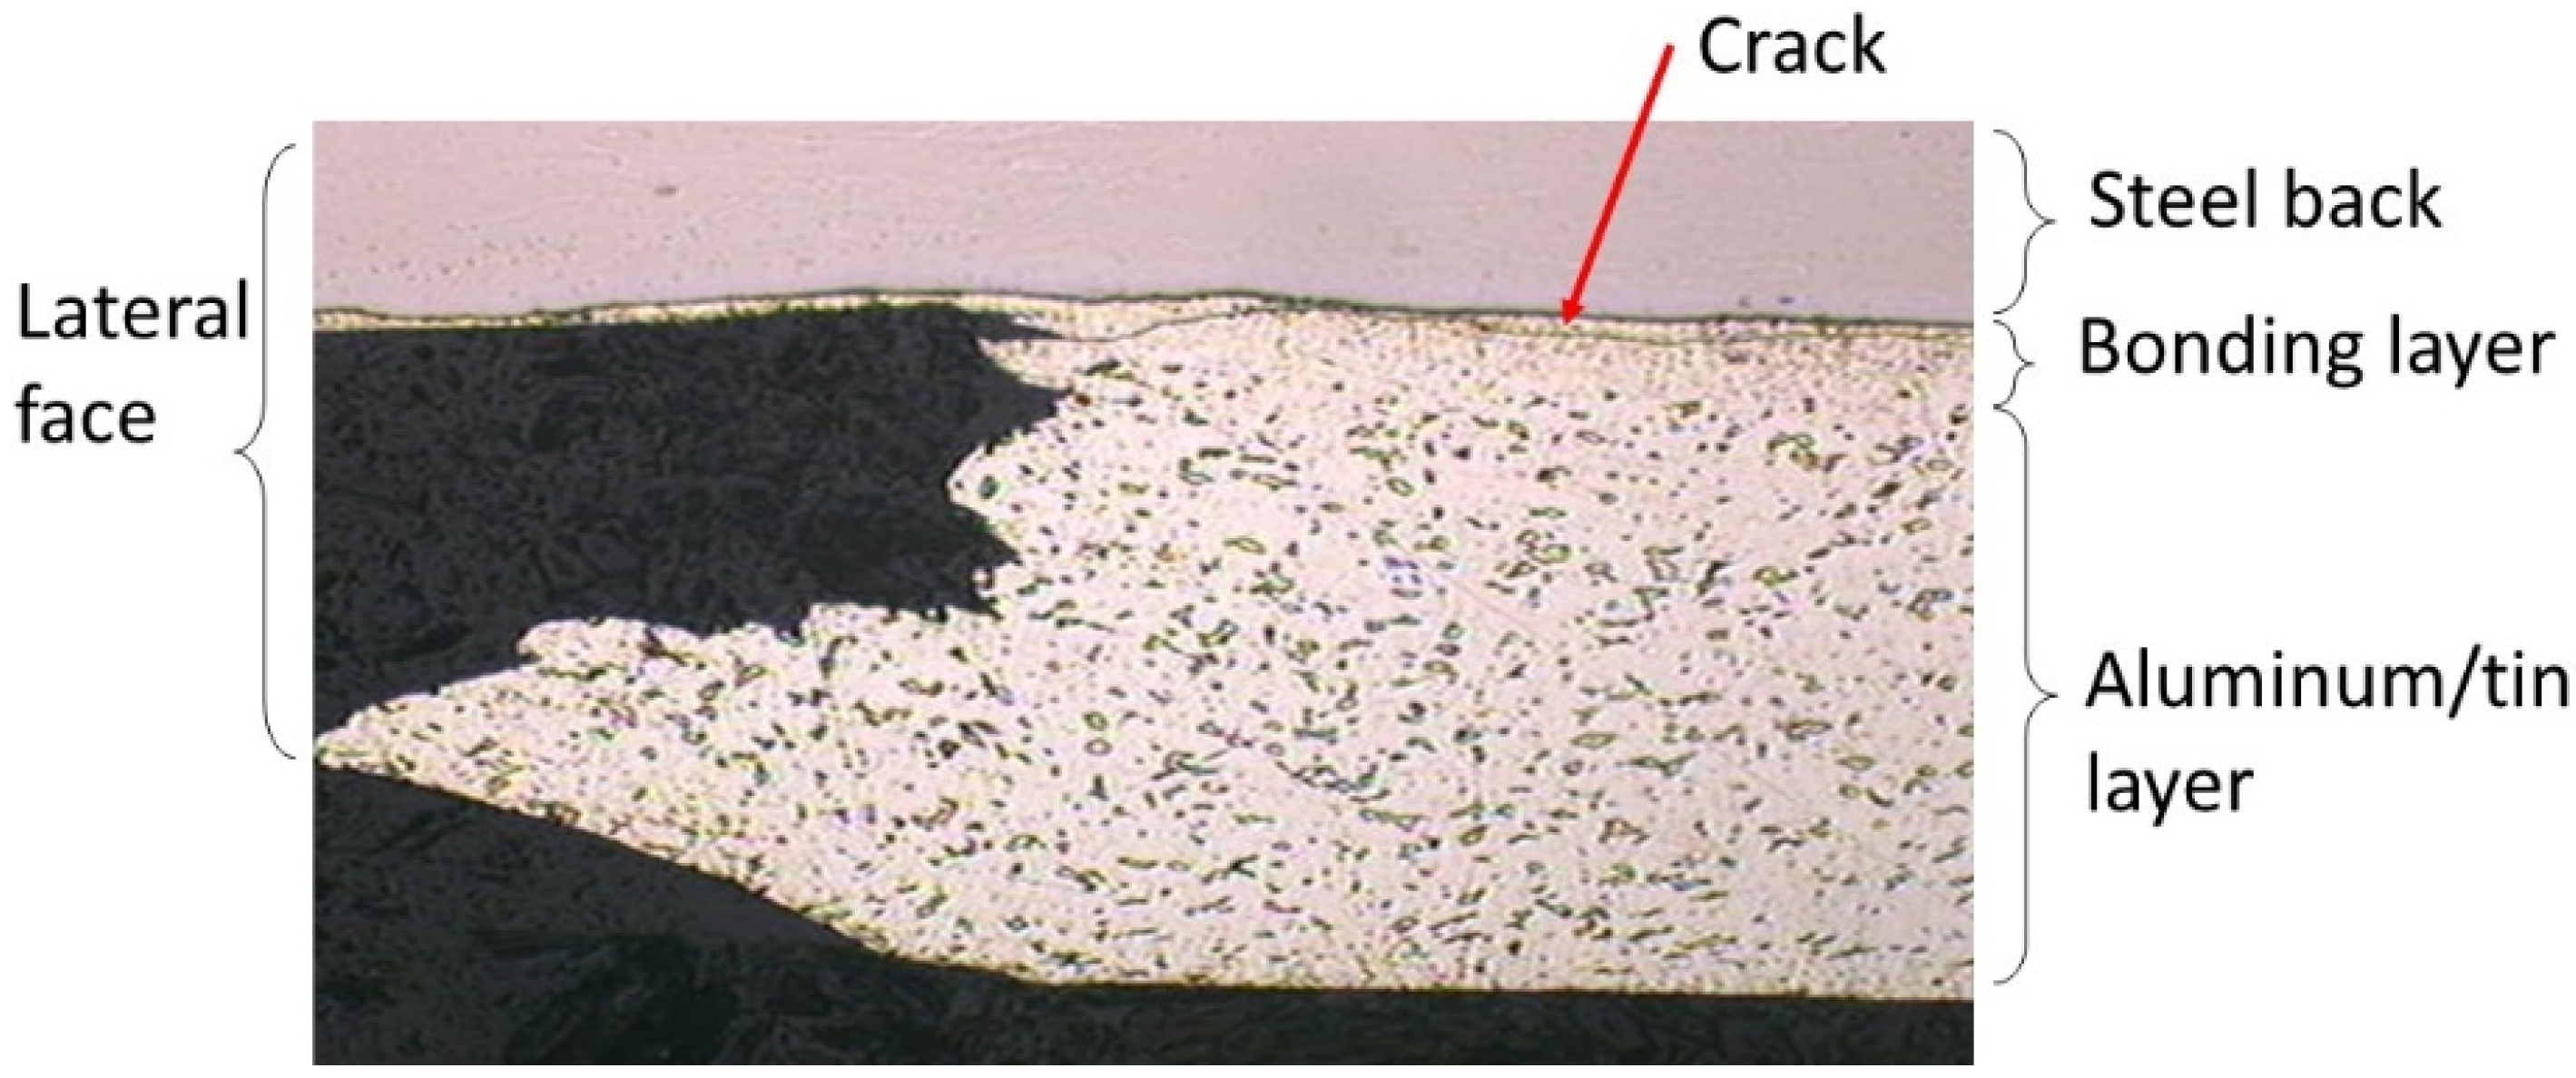
As the bearing structure is composed of several layers, bonding between these layers is mandatory. This is especially true when two adjacent layers have different thermal expansion coefficients. Generally, special surface preparations are made or an interlayer is used to guarantee bonding quality. The fact that some surface layers must be made of very good antifriction material makes adhesion with another layer very difficult as, in essence, this antifriction material must not generate adhesion to any other shaft material. Due to internal stress concentration at the edge, the most likely areas in bearings for delamination occurrence are the lateral faces and the joint faces, as can be observed in Figure 9.
In this figure, the crack is propagated in the bonding layer which has the weakest mechanical properties.
Figure 9.
Crack at the interface.
2.4.5. Conformability
This is the bearing material property which allows the bearing to obtain a conformal surface contact when the contact between shaft and bearing occurs on an edge. With conformable surfaces, a highly stressed contact area will become larger. After this, geometrical evolution and pressure decrease will allow hydrodynamic lubrication. This property is fundamental for any device with geometrical defects or deflection under loadings, like for example main bearings in thermal automotive engines. This geometrical adaptation of the bearing surface can be achieved by creep, plastic flow or wear. Once again, this adaptation needs an easy flow or wear of antifriction material. This property is the opposite of a good fatigue resistance, which requires high yield strength. Furthermore, such geometrical modification must not generate heat, which means that very low friction materials or easily melted material must be involved in the contact. Again, the importance of this property will suit the application (edge loading, shaft bending).
2.4.6. Adaptability
When antifriction material is in contact, no solid bonding must occur due to cold welding with asperities from antagonist surfaces. Rabinowicz tables [16] are well-known for assessing the adaptability of pure and simple materials. These tables are also called solid miscibility tables. The higher the solid miscibility is, the easier the cold welding phenomenon is. It means that the friction between the two materials in contact will be higher for high miscibility. In the past, the widespread use of lead as an antifriction material can be explained by the fact that this material has no miscibility with other shaft materials.
Today, with composite or alloy materials, often used in antifriction, some tests are necessary to check adaptability between the materials in contact. This aspect remains quite important particularly when direct contact can occur between shaft and bearing or between the bearing back and its housing. The solid miscibility between antagonist materials is directly related to seizure bearing or to micro-welding of the bearing back.
3. Friction Reduction Solution
Armed with these damage details and recommendations, we can list the specificities of various low friction bearing solutions. First of all, we must highlight the fact that there is no longer a unique solution to lower friction in modern engines. Ten years ago, low friction solutions were obtained just by reducing oil viscosity. Today, high temperature high shear (HTHS) viscosities lower than 2.6 millipascal-second (mPa.s) involve several component modifications in order to guarantee reliability, as will be explained hereafter. A low friction engine has become the accumulated benefit of multiple low friction solutions. It must be highlighted that some low friction solutions are very difficult to accurately evaluate without laboratory measurement equipment.
To structure the bearing friction solutions, it is interesting to consider three complementary solution families:
- -
- Family related to bearing material
- -
- Family concerning bearing geometry
- -
- Family taking into account the environment
Obviously, final friction benefit cannot be assessed as a sum of separate friction benefits as each solution can improve the base friction mechanism. This point is sometimes forgotten in optimistic forecasts.
In order to give concrete information on low friction solutions, the benefit of these solutions is expressed in terms of g of CO2 per km on NEDC cycle. To evaluate this quantity, first the friction power reduction provided by the low friction solution was estimated and, subsequently, this value was translated in terms of CO2. This translation was carried out by considering the case of a car equipped with a two liter engine.
3.1. Material Family
Antifriction material with high bulk modulus (higher than 0.1 gigapascal) can play a significant role in terms of friction reduction. This implies that there are mechanical interactions between antagonist surfaces. For example, for low bulk modulus materials like rubber, low friction could be reached, then mixed lubrication is delayed due to the high local conformability capacity of rubber. The contact between shaft asperity and rubber bearings is very difficult due to the low elasticity of rubber. This kind of material is frequently used for water-lubricated bearings even with solid contaminants. Usual utilizations are for the vertical pump shaft or propeller shaft with a low diametral pressure. However, until now, no automotive engine application has been done with a full rubber bearing, due to the high flexibility of this bearing type. However, the latest significant evolution involving rubber properties in lubrication has been the use of some thin plastic layers on bearings.
Based on this statement, suitable bulk modulus materials have been used in situations related to:
- -
- Low lubricant viscosity and very thin lubricant film
- -
- Stop and start engine strategies
3.1.1. Low Lubricant Viscosity and Very Thin Lubricant Film
These situations occur more often as bearings become more and more highly loaded. A current example is bearings in downsized automotive engines. Elasto-hydrodynamic calculation can give some minimum oil film thickness around 0.25 µm for the most severe bearing application. This value is arguable but in comparison with older calculations and older engine bearing applications, it indicates an extremely thin film. From a practical point of view, this means that surface interactions will occur. To obtain a bearing reliably, its active surfaces must be coated with a low friction overlay in conjunction with oil additives and smoother surfaces (low roughness). The aim of the antifriction layer is to reduce friction during surface interactions. The most common solutions are MoSx or DLC coatings. However, new coatings, composite coatings or deposits with WC/Co, TiN, TiC, TiB2, WS2, nanostructured coatings are also under investigation. Some very interesting results have been obtained with WS2. Seizure resistance is highly improved and operation with thinner lubricant films is allowed [17].
For this particular item, it is important to highlight the fact that currently a lot of new antifriction materials are being tested and will provide new antifriction performance, such as for example polyimide coatings [18]. In the past, the cost and scarcity of nanoparticles has not allowed many investigations. With new efficient and cheap processes to produce nanoparticles, the cost constraint has vanished. From a practical point of view, it seems that some friction reduction—about 0.2 g CO2 per km—could be expected with new efficient coatings, particularly in the valve train.
3.1.2. Stop and Start Engine Strategies
These strategies have provided, for the last five years, a good benefit in terms of vehicle CO2 emission reduction. This represents approximately a CO2 reduction for the whole engine of about to 2–3 g per km. However, there is a major mechanical drawback in that engines have to deal with starts at very low crankshaft speed with hot oils with very low viscosities. During a few crankshaft rotations, the bearing operates in a mixed lubrication regime. However, the contact between shaft and bearing must not produce bearing damage. One of the best solutions is to maintain an adsorbed oil film on the antagonist surfaces, particularly on bearing surfaces, with a very good adhesion. A simple way to obtain this improved resistance of the adsorbed oil film adhesion is to use bearings with a polymer overlay, as proposed today by several bearing manufacturers.
Generally, this overlay solution is formed by a polymer matrix with a solid lubricant filler and hard particles to run-in the surface. Solid lubricant fillers are carbon graphite and molybdenum disulfide. Their role is to achieve low friction during hard contact. Due to high local temperature at the bearing surface during contact, these polymers must be also high temperature resistant.
With polymer coatings, the main worry is binding quality as polymer material has quite a different thermal expansion to the metallic substrate. During temperature rise, delamination stress will build up in the overlay. How bearing manufacturers solve this potential delamination problem is to adopt a specific surface preparation and to add adhesion promoters to the polymer [19]. Polymer overlays have been tested on different bearing substrates such as AlSn sputtered bearings and have demonstrated improvement in terms of wear and fatigue resistance [20].
3.2. Geometry Family
This family of low friction solutions is quite varied and for reasons of clarity subdivision families are adopted. These subdivisions are related to three levels: macroscopic level, mesoscopic level and microscopic level. These will constitute the following chapters.
3.2.1. Macroscopic Level
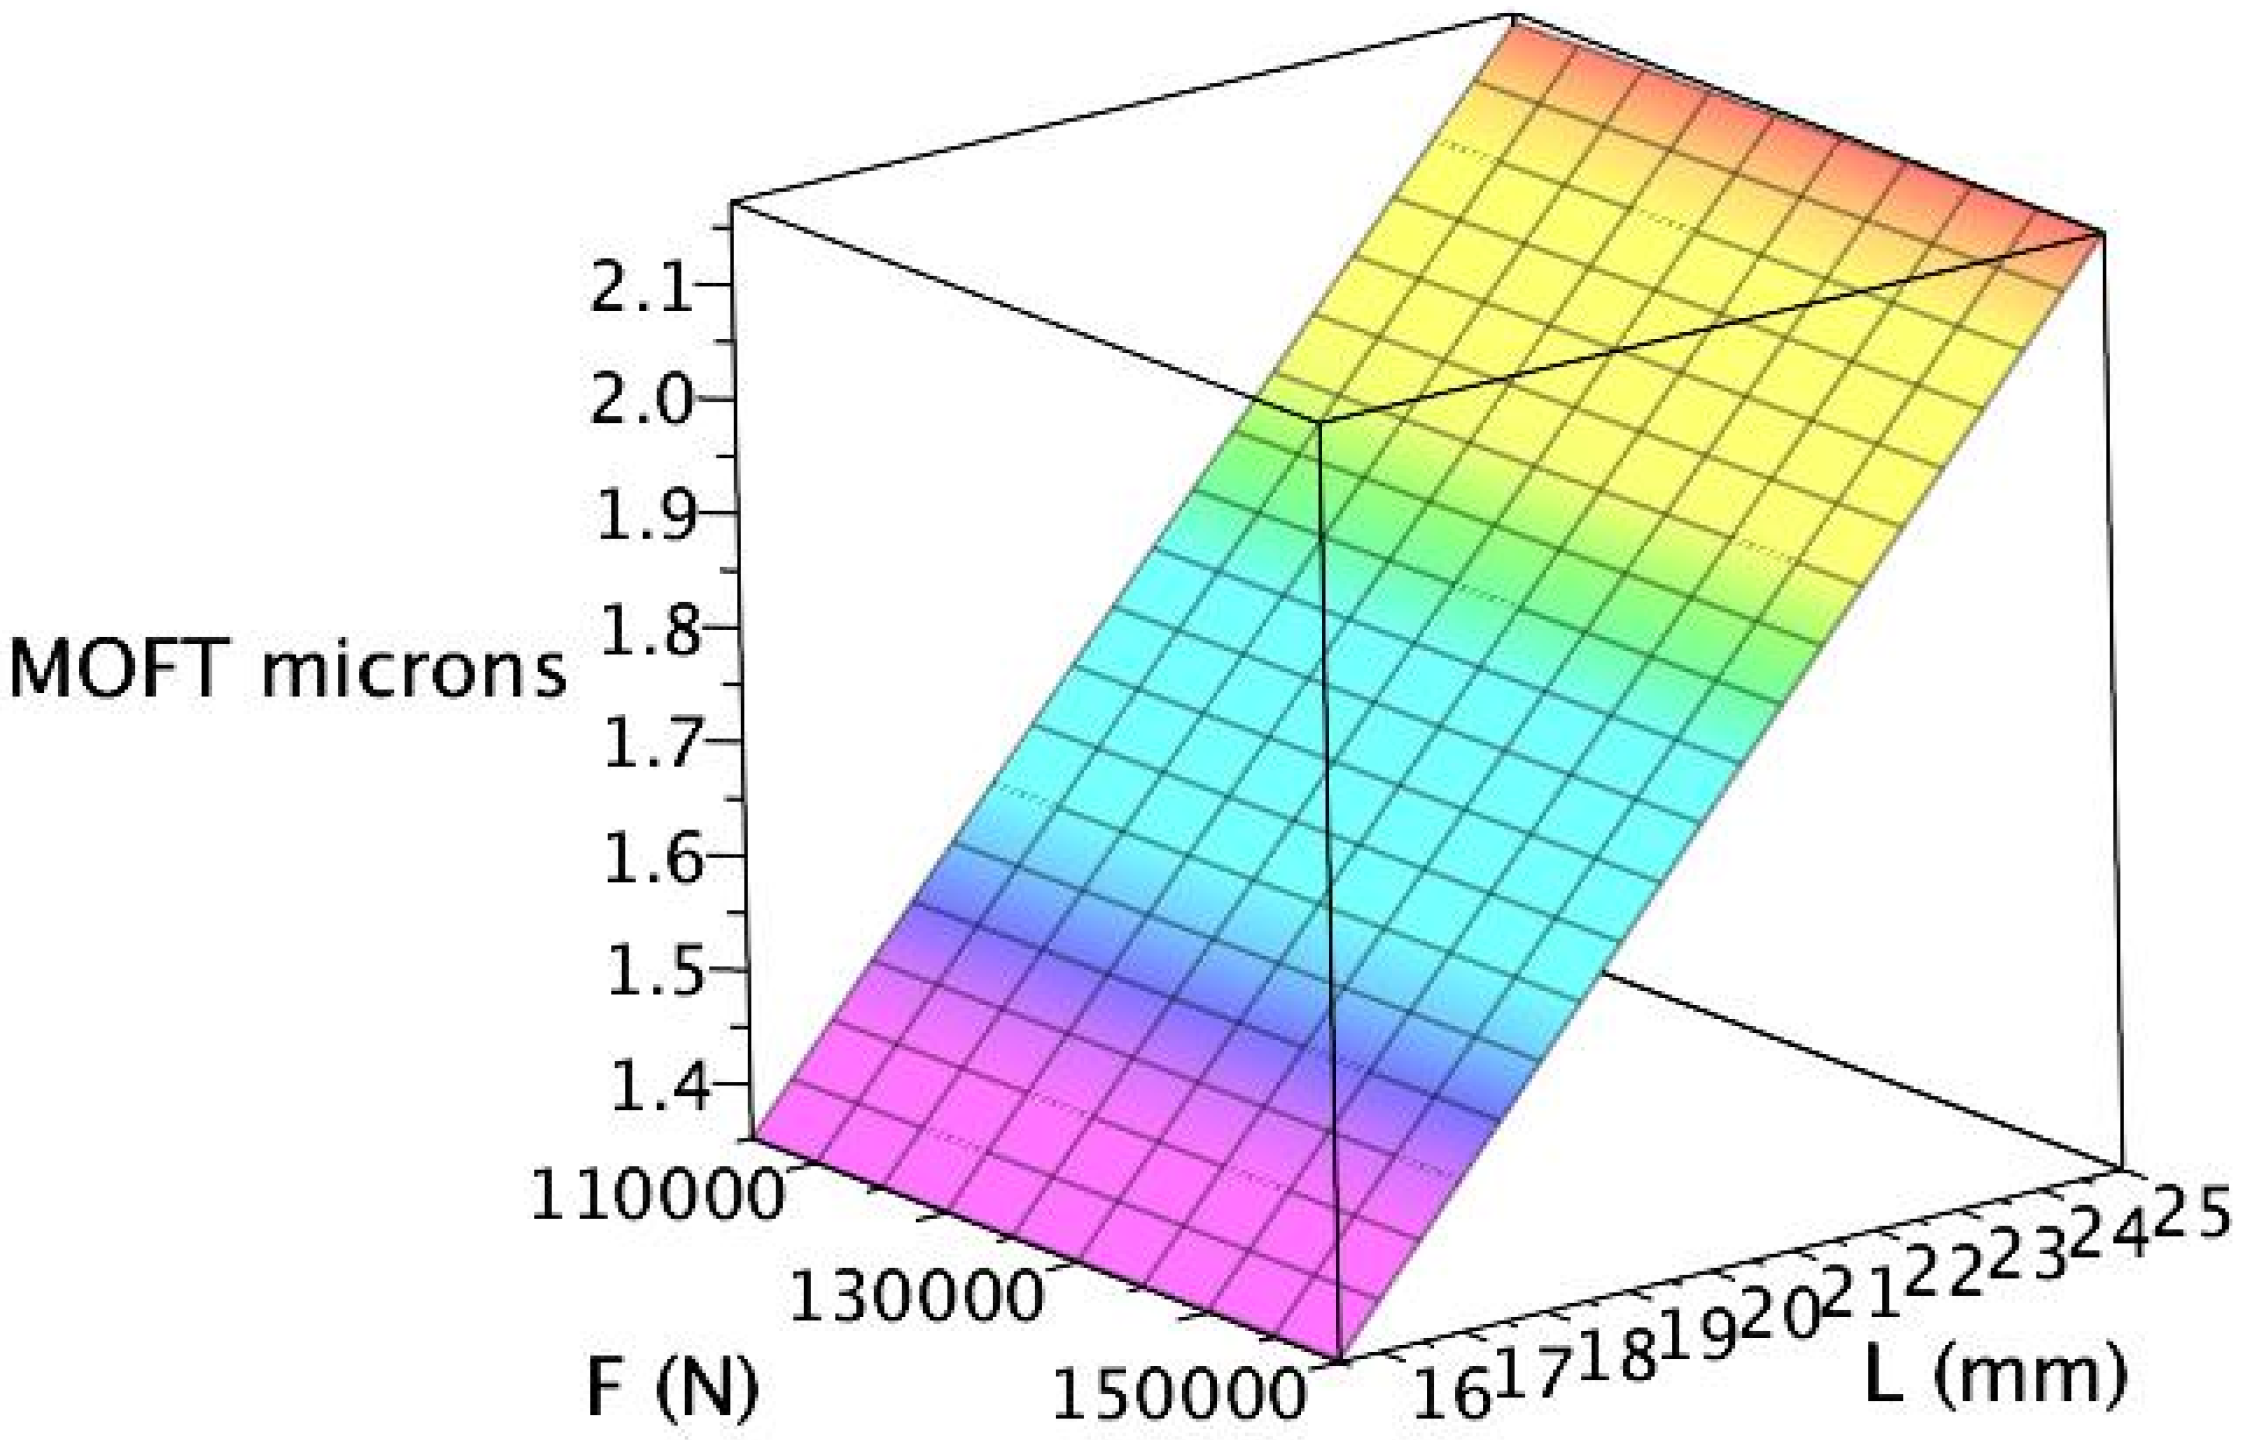
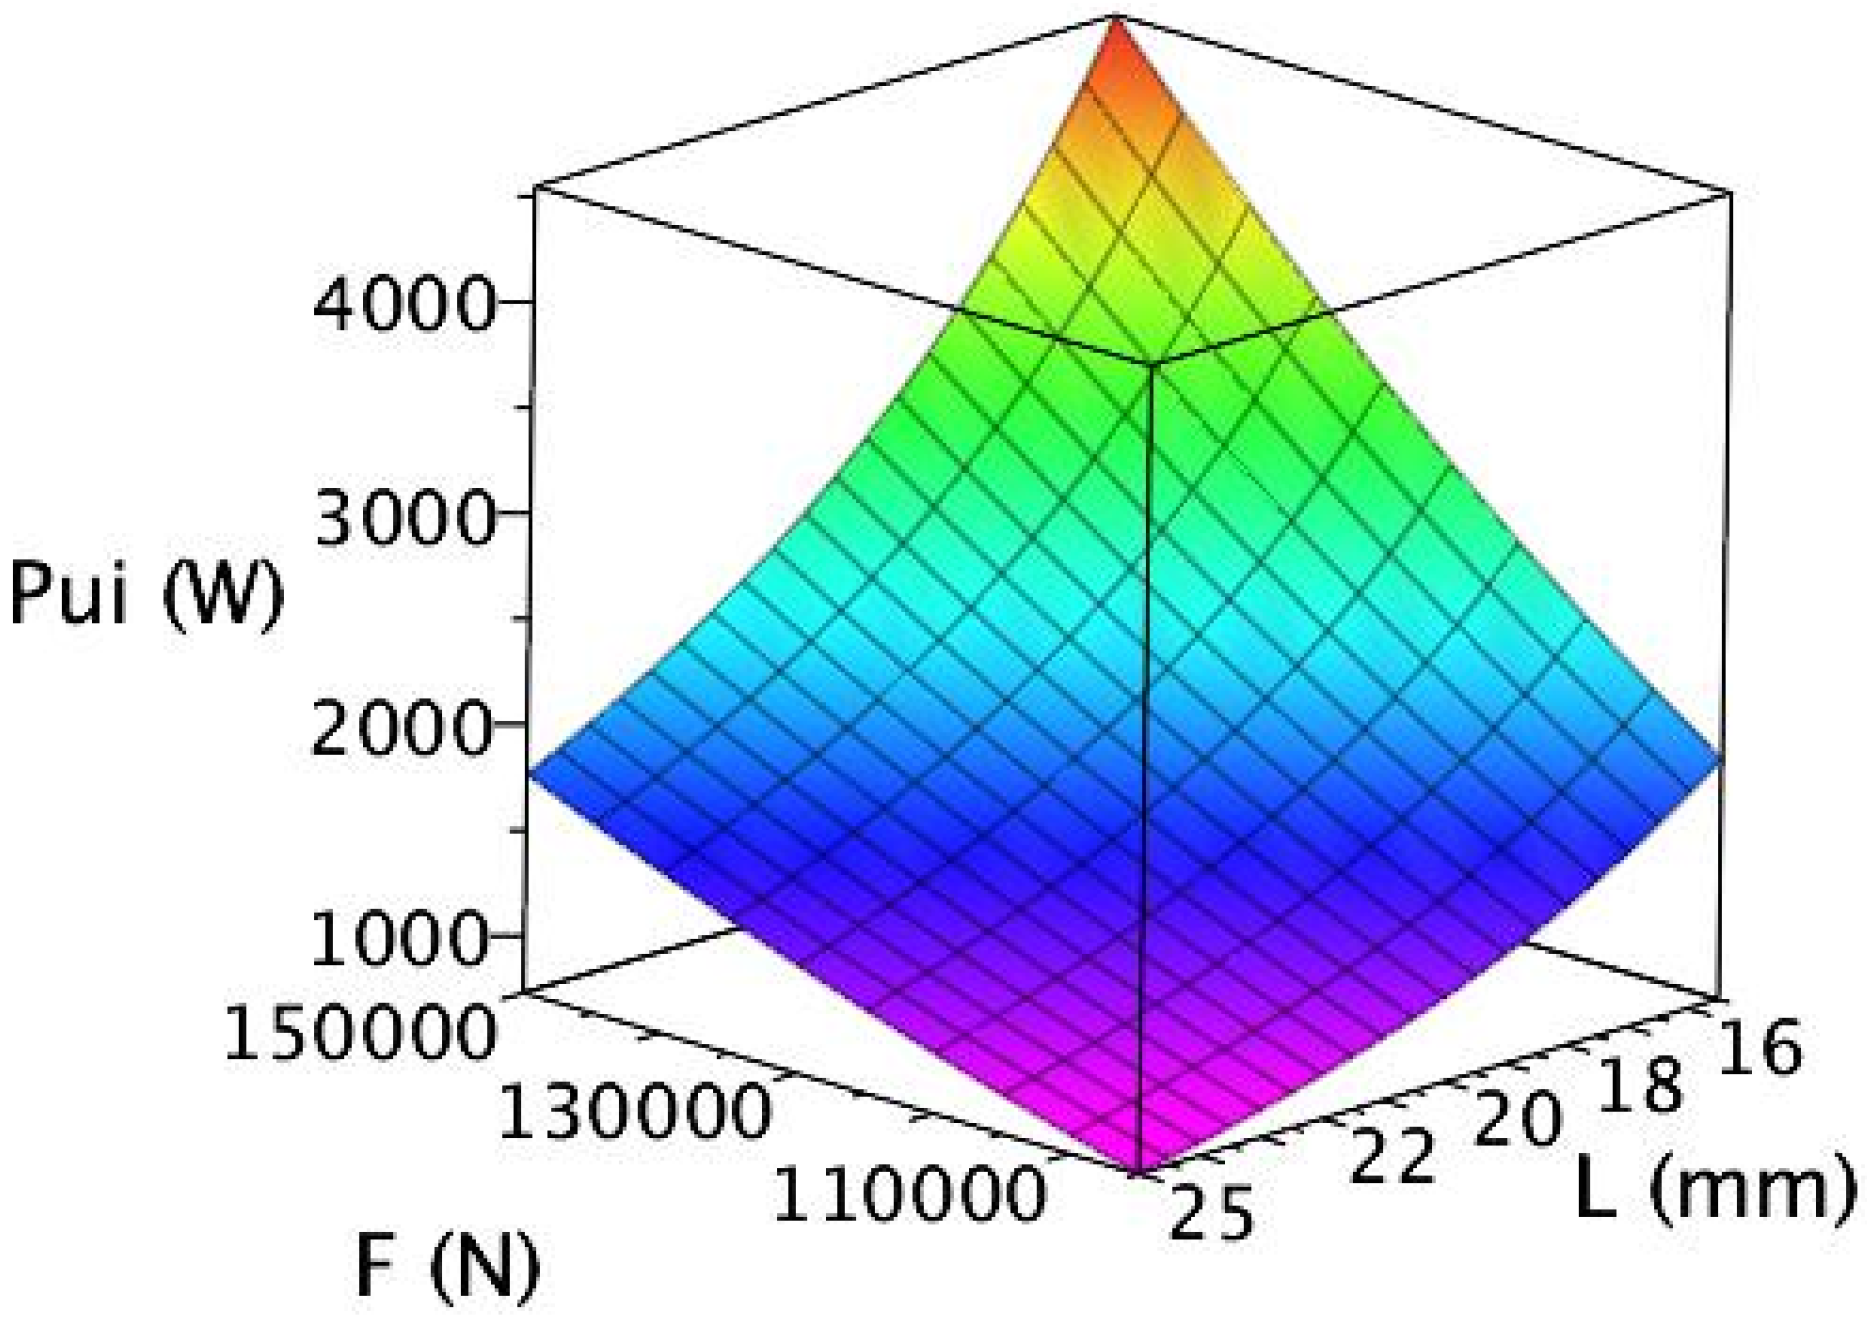
An easy crude optimization can be made by adapting the ratio L/D (L = bearing width and D = bearing diameter). The classic way to proceed is to impose a maximal specific pressure. For example, with bimetallic AlSn bearing this could be 50 megapascal. Then, for a given load, and a parametric bearing width, bearing eccentricity is estimated and the dissipated friction power can be evaluated as shown in Figure 10. Friction power and minimum oil film thickness (MOFT) have been assessed in an isoviscous hydrodynamic regime and with finite element technic to solve Reynold’s equation. This evaluation has been carried out for a shaft rotating at constant speed of 400 rad/s, a constant radial force and an oil viscosity of 0.01 pascal-second. It can be observed that the wider the bearing is, the lower the friction power is. In Figure 11, the associated MOFT is also slightly thicker when width is larger.
Figure 10.
Friction power.

Figure 11.
Minimum oil film thickness (MOFT).
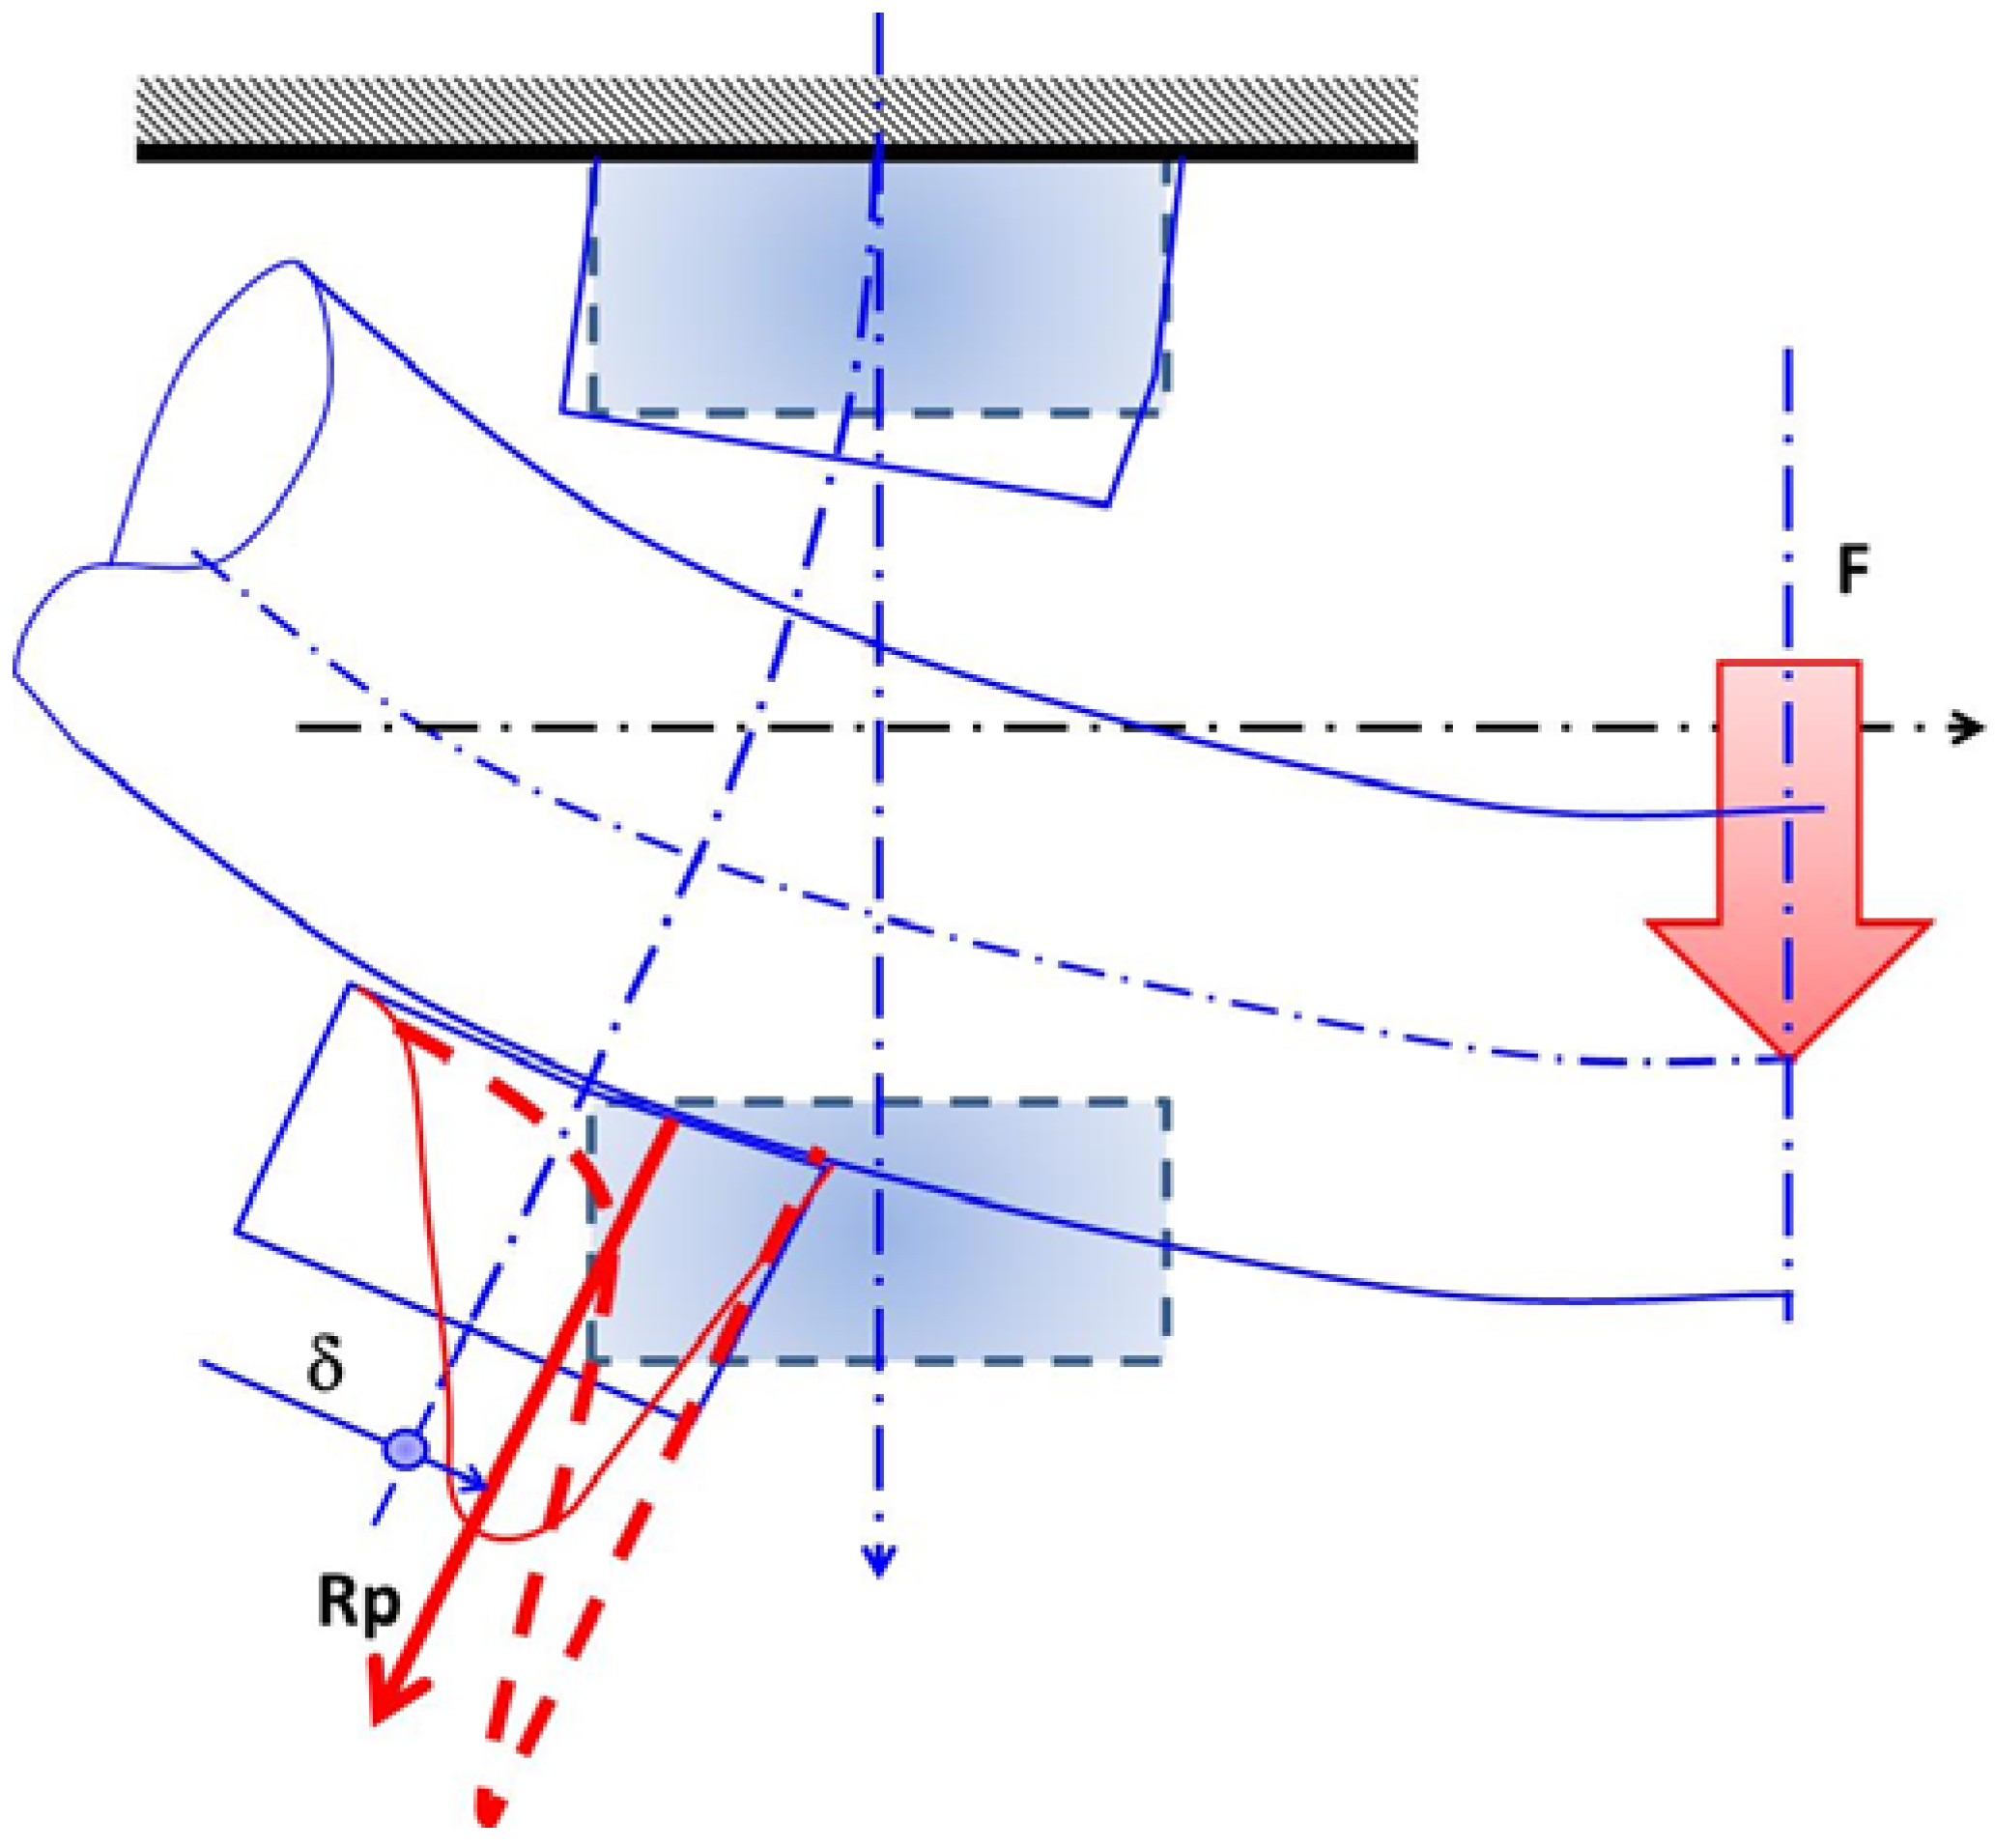
However, bearing width has also to be optimized with respect to crankshaft design stiffness housing. A minimal crankshaft radius is imposed by its own mechanical strength so that the bending stress in journal bearing or in crankpin will remain lower than the fatigue resistance. By considering the maximal pressure withstood by the bearing, the minimal width can be determined. However, for the reliability of the bearing it is also important to minimize the edge loading on the main bearing. A common example of minimization concerns the main bearing housing stiffness.
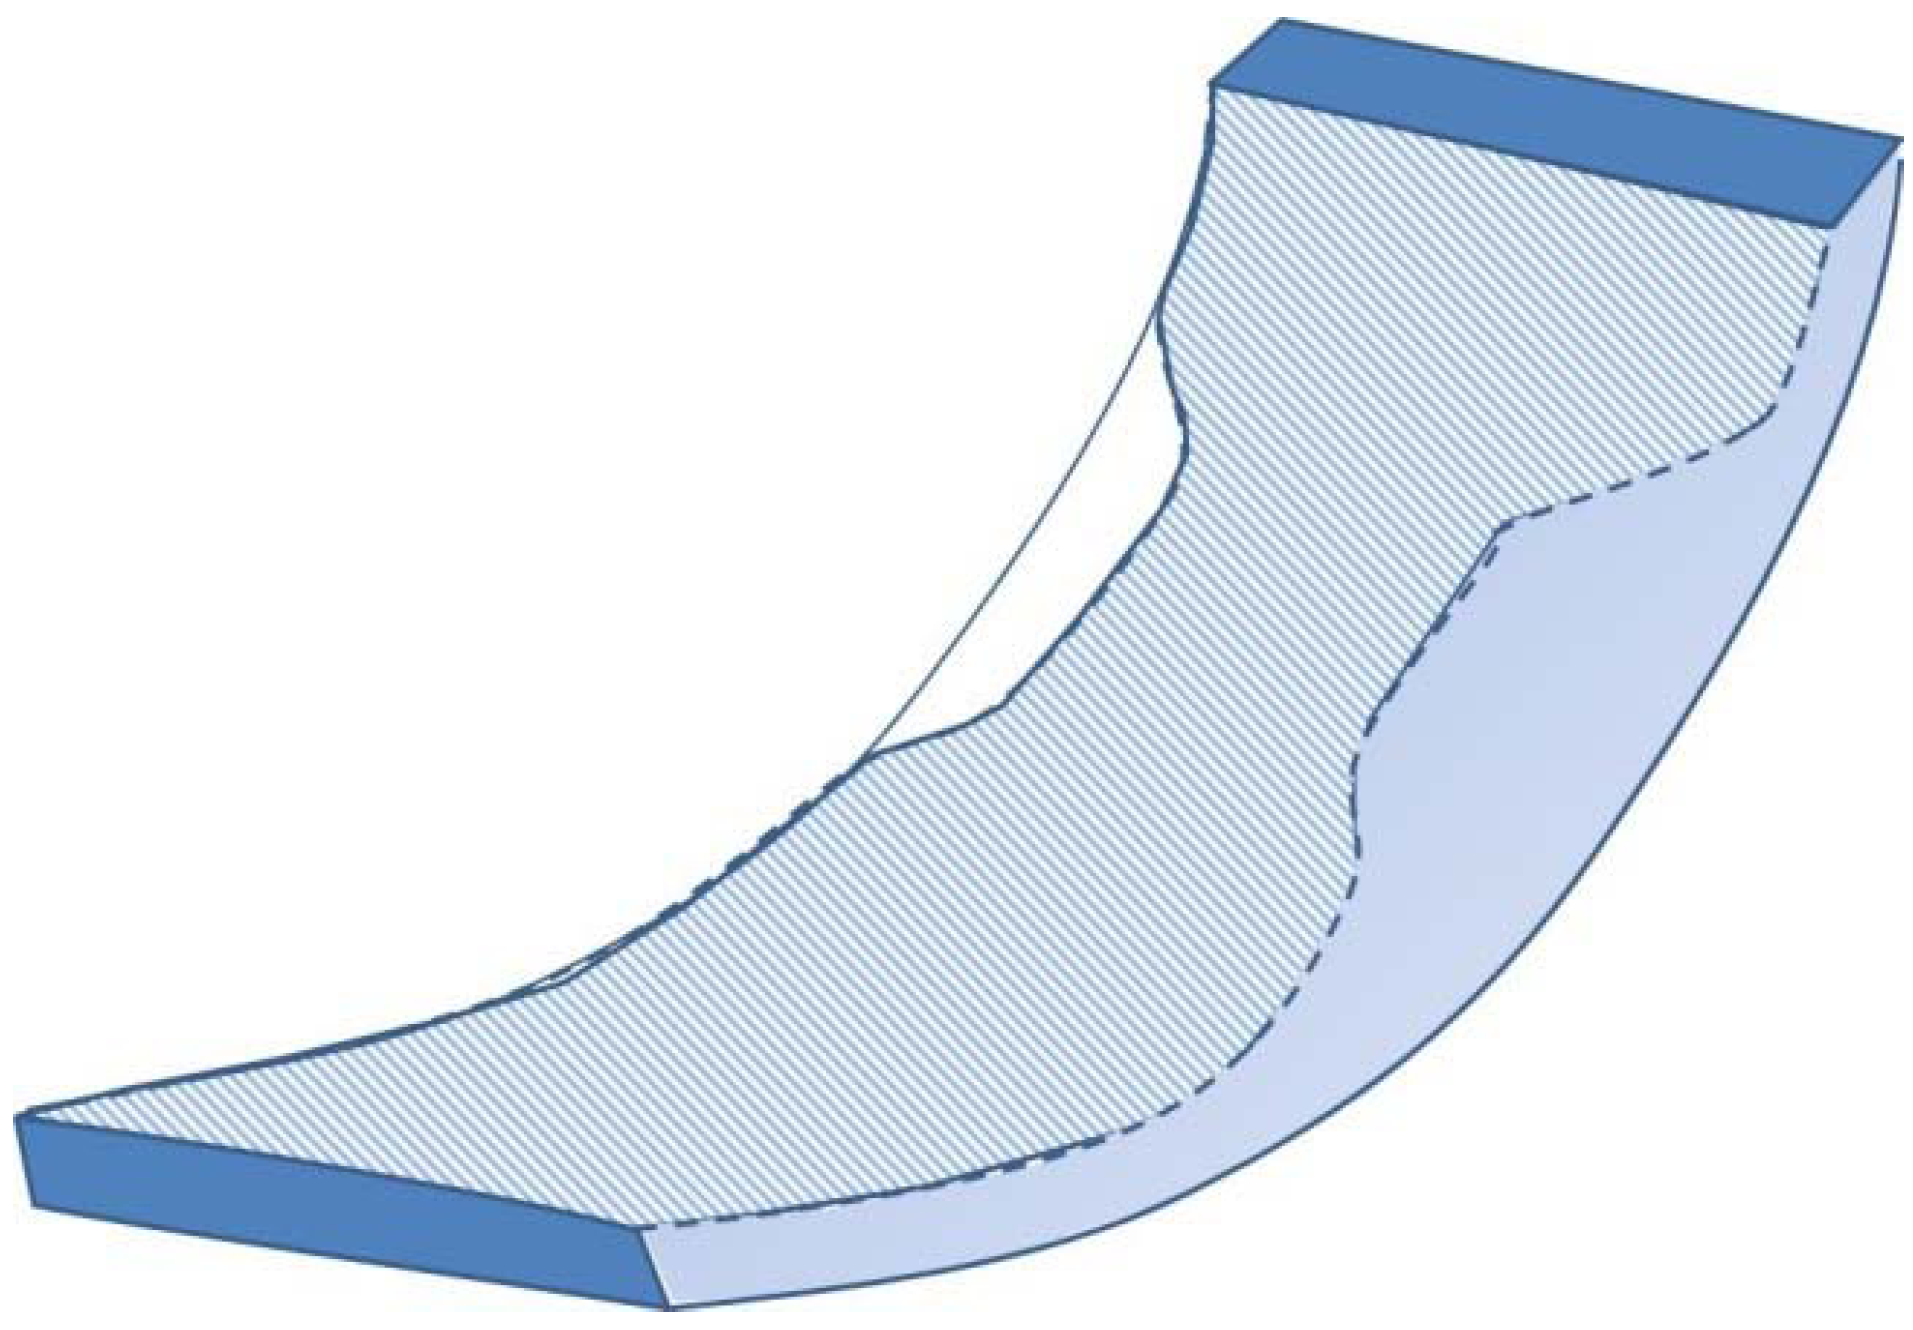
When the engine is running the crankshaft bends under the conrod loading. The crankshaft slope in the main bearing causes the bearing housing to bend as shown in Figure 12. This housing deflection is due to the bending moment generated by the axial displacement, called δ, of the hydrodynamic pressure resultant, Rp. For large δ values the hydrodynamic field will look like the plotted one in a dotted line in the figure. Due to the piezoviscosity effect and mixed lubrication at the edge, the friction will be higher.
Figure 12.
Lateral stiffness of main bearing.

So, with respect to high or low lateral bending stiffness of the housing, the hydrodynamic pressure field will either be spread well or not and will generate low or high friction.
To summarize this procedure for crankshaft optimization, the crankshaft resistance determines its radius, the bearing fatigue resistance defines the bearing width and the crankshaft bending flexibility determines the lateral stiffness of the main bearing housing. The final value is directly related to the average bearing housing width. Special attention has to be paid to keep a high vertical stiffness of bearing housing for vibration and harshness reasons. When this design is adopted, a saving of around 0.5 g of CO2 per km has been estimated when the main bearings and their housing are optimized.
Another easy optimization but one which is delicate to machine is to reduce active bearing width in the areas where the loading is quite moderate, as presented in Figure 13. The bearing fatigue resistance is not affected by this geometrical evolution. From a practical point of view, friction reduction is evaluated at less than 0.2 up to 0.3 g of CO2 per km.
Figure 13.
Optimized bearing pattern.
In the cylinder head, the camshaft bearing respects this concept. Generally, half of the bearings have a reduced width, as is illustrated in Figure 14.
Figure 14.
Camshaft bearing.
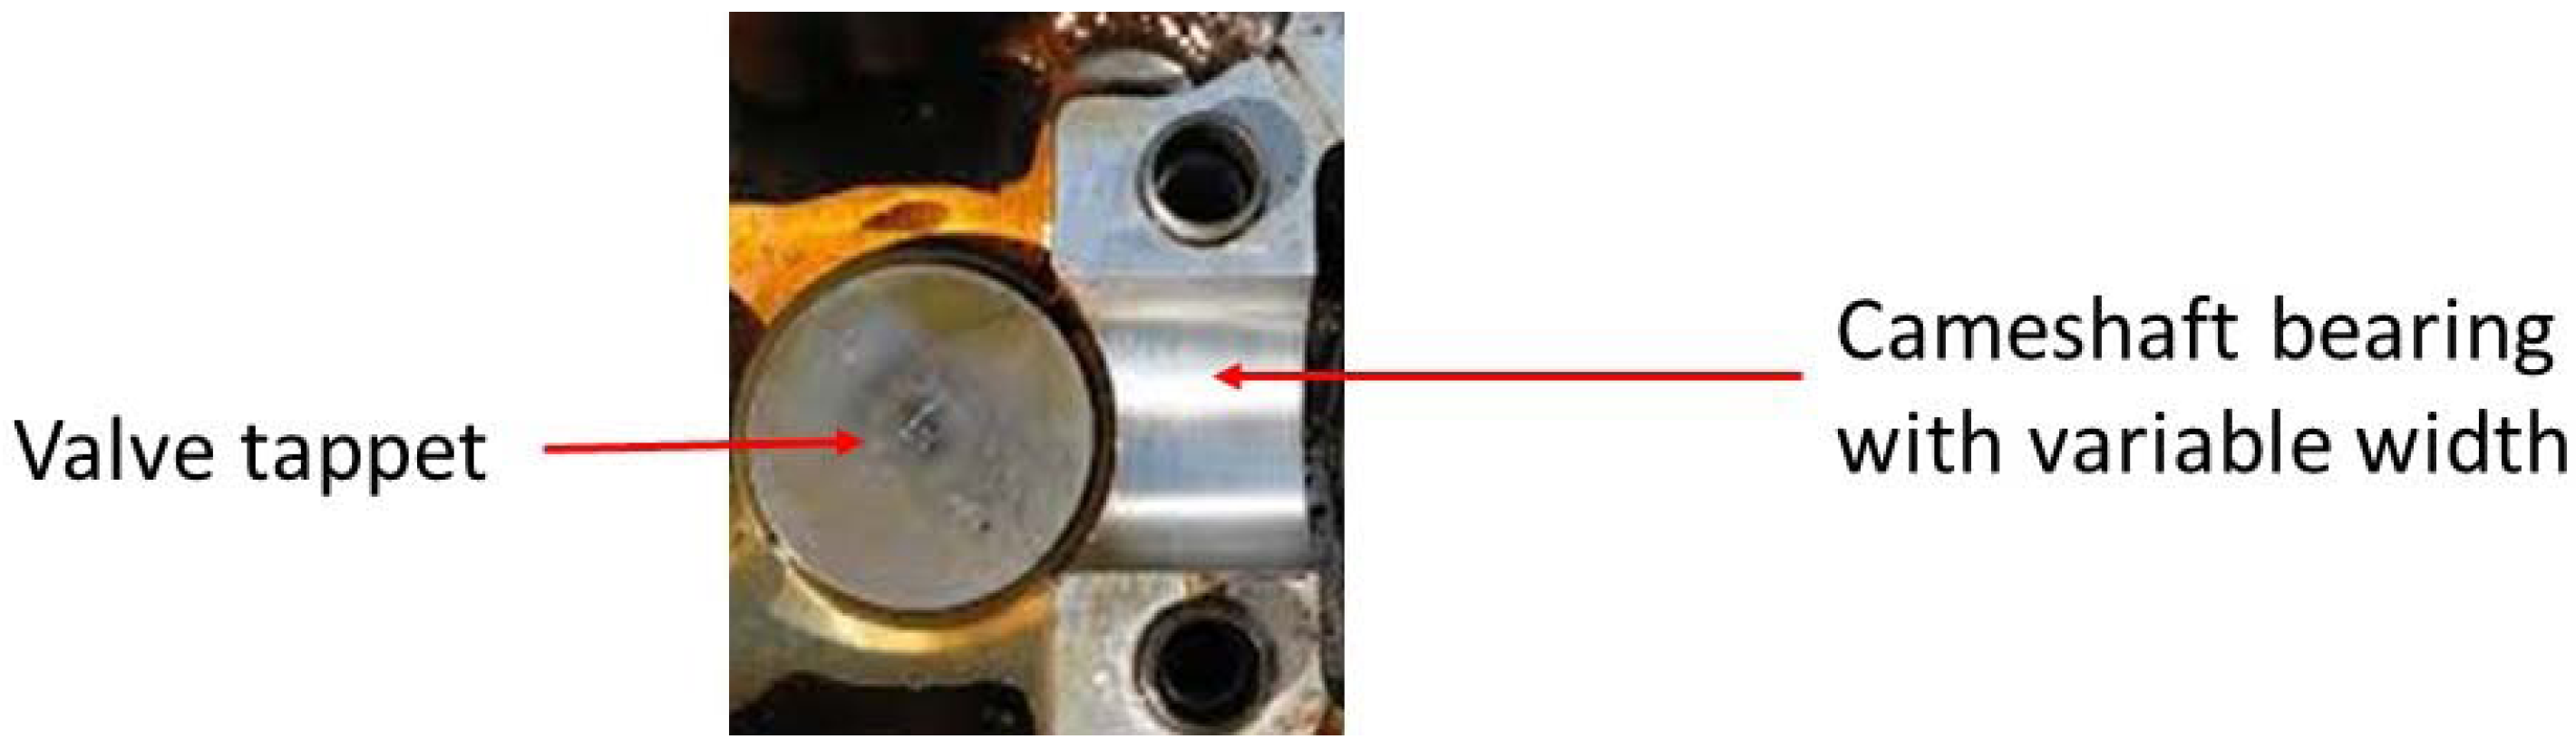
The point to pay attention to is the oil leakage if there is a full groove in the bearing or a lubricant feeding through the shaft.
3.2.2. Mesoscopic Level
With respect to the mesoscopic surface aspect, a lot of work has been done over the last 10 years. Principally, it concerns surface texture and microwaves. The component where these aspects have been investigated for many years is the cylinder liner and the piston rings where the main antagonist problems are to obtain:
- -
- A design with low ring and piston skirt friction
- -
- A design offering a low oil consumption through the fire ring
- -
- High reliability
Dimples on the top surface and on the bottom surface of the liner have shown friction reduction without increasing the oil flow through the rings. Dimples on rings can also reduce friction [21,22]. Today, some engines are manufactured by mass production with laser dips along the liner [23] with different patterns (cf. Figure 15).
Figure 15.
Patterns of dimples (bigger dimple dimension 150 microns).
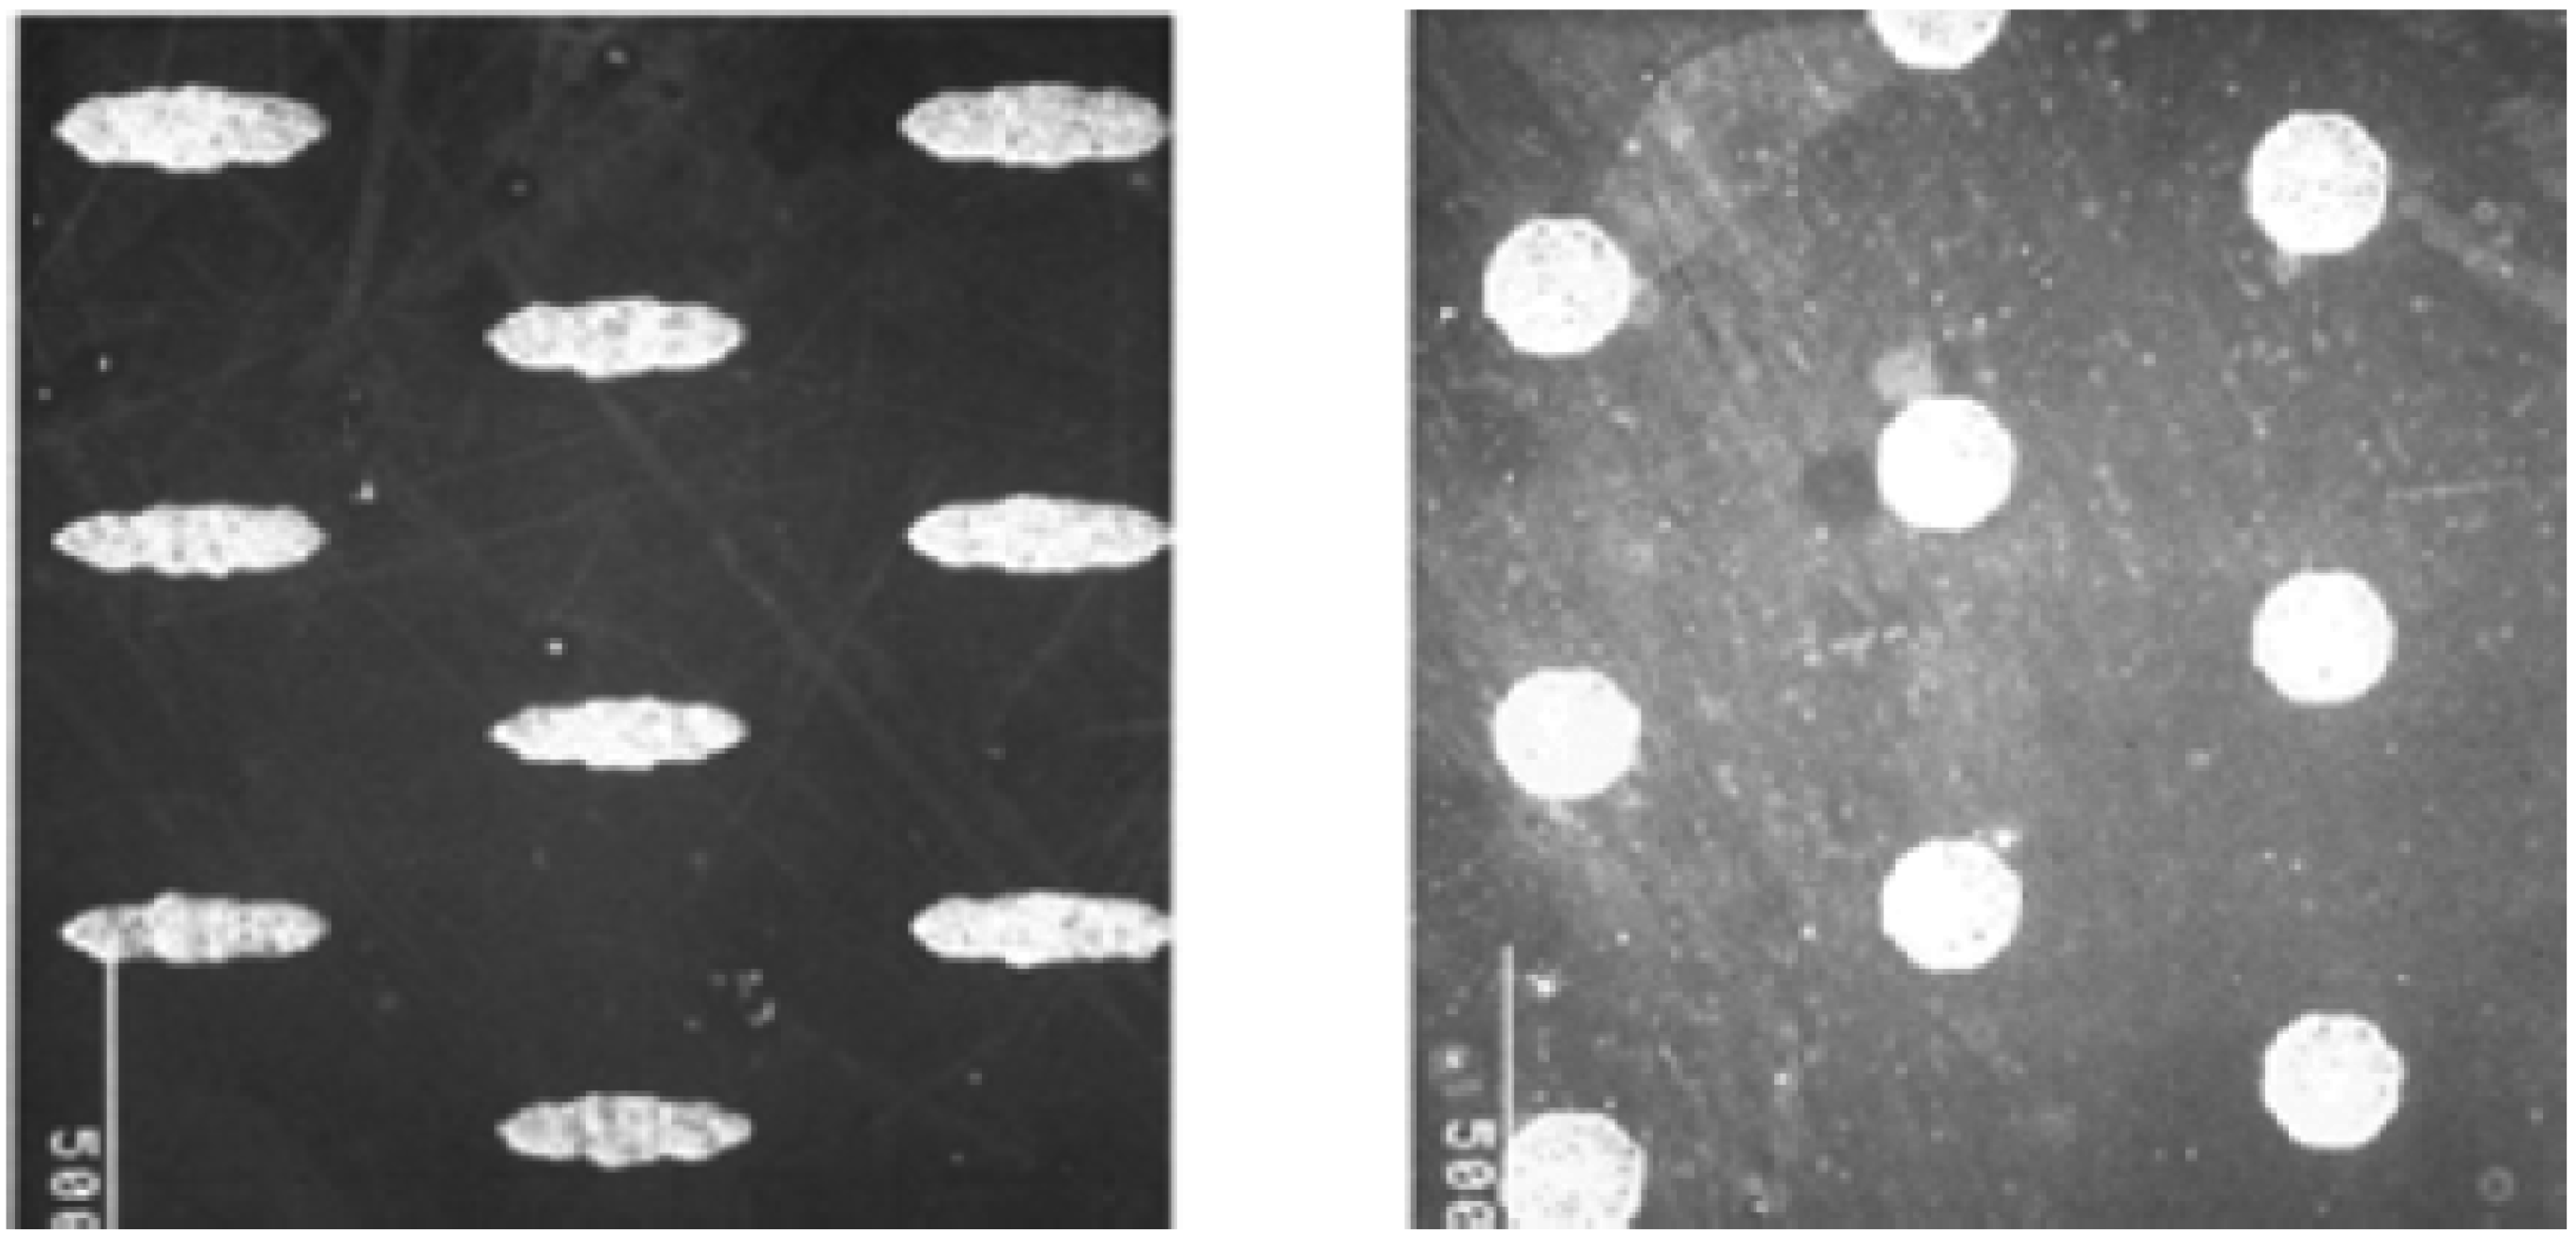
However, from experimental results in the literature, it appears there is a wide variability in the results. For example, there is not yet a general consensus among engine specialists about the cross-hatch angle during the honing process of the cylinder liners in engines.
Concerning crankshaft lubrication, some surface textures have also been tested. At present, it has been clearly demonstrated by experimentation and simulation that friction improvements can be obtained with adequate dimples on thrust bearings [24,25]. Some similar friction improvements have been obtained with surface texture on tappet shims [26]. For textured journal bearings, there are not enough experimental results to confirm this improvement in this application. However, several simulations show potentially lower friction with textured shafts [27,28]. It has also been demonstrated that some improvement could be obtained by texturing the bearing surface [29]. Nevertheless, the texture design is quite complex as the dimples’ density, size, and location around the journal circumference are related to the running conditions of the bearing. The important point with respect to texture is also the improvement provided by this texture in the case of mixed lubrication. Braun et al. [30] experimentally demonstrate high friction benefits by using texture surfaces but found also, like previous authors, that certain textures can be worse than a smooth surface.
Another kind of mesoscopic feature, currently used in bearings, is the micro-groove. For micro-grooves, many advantages are mentioned but historically the choice of this kind of surface is essentially due to the boring process, which was in competition with the broaching process. Today, some realistic advantages have been recognized such as:
- -
- A better fatigue resistance due to compressive residual stress introduced by the cutting tool during the boring process.
- -
- The possibility to suppress the joint face reliefs of bearings and how it means a decrease in oil leakage flow.
- -
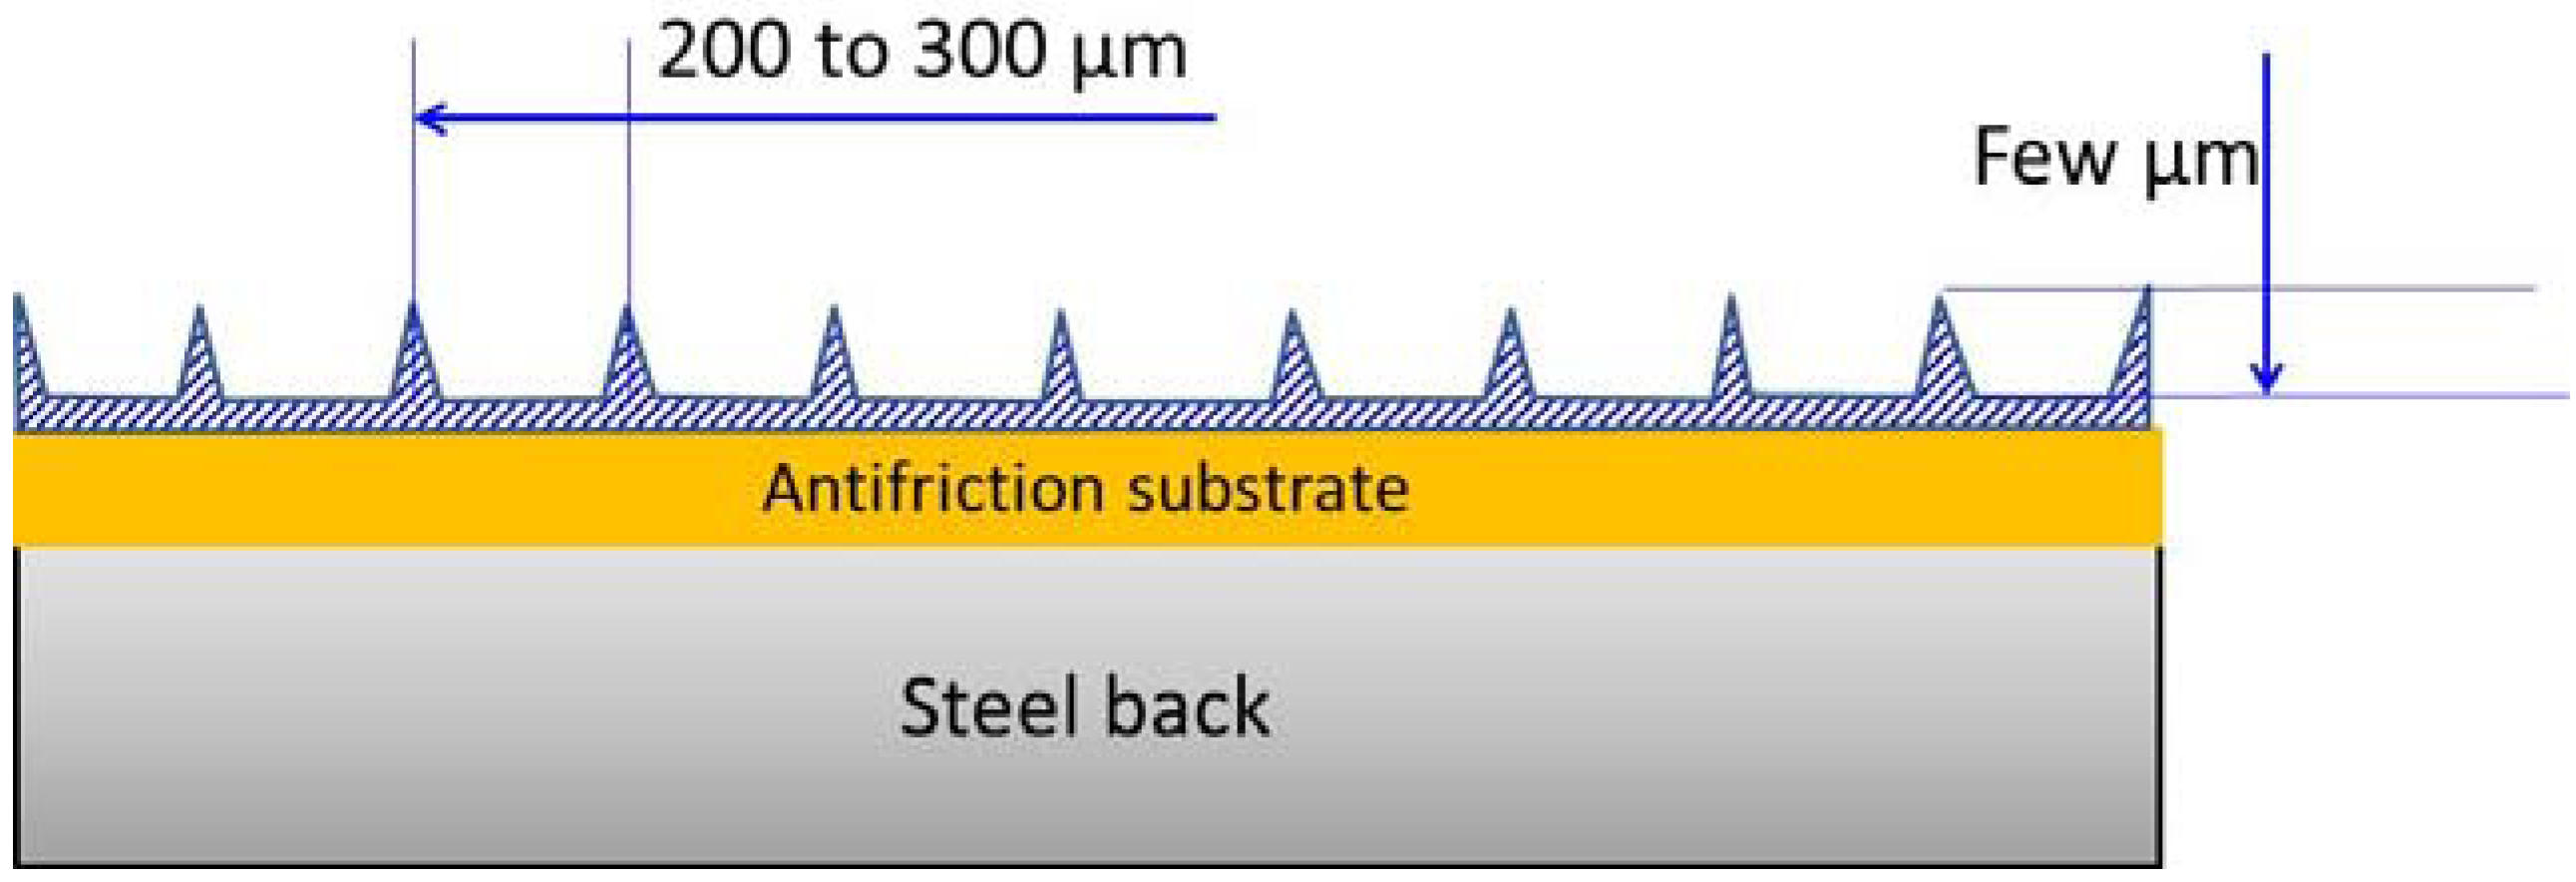
- A better conformability if the “micro-ribs” on the surface have a thin shape as demonstrated in Figure 16. The rib height varies from 2 µm up to 8 µm relative to the microgroove location in the bearing. Then, in the case of contact with the shaft, the surface adaptation can be made without generating high friction.Figure 16. Microgroove on bearing.
![Lubricants 03 00569 g016]()
- -
- A lower running temperature due to a higher oil flow on the bearing.
- -
- A thicker minimum oil film thickness when this is measured from the surface between ribs. With lubrication calculation it is also demonstrated that the local average minimum oil film thickness is higher than the film thickness for a perfectly flat surface. However, recent experiments [31] have shown opposite results.

To give a summary of the micro-ribs effect on lubrication, the non-contestable improvements remain a better fatigue resistance, a better conformability and a lower temperature. As it is not possible to get reliable confirmation with respect to advantages or disadvantages in adopting bearing texture, no friction benefit is mentioned.
3.2.3. Microscopic Level
At this geometrical level, it is essentially the roughness and the waviness on the shaft which could be controlled and optimized. For reasons of clarity, the parameter definitions are not repeated as they are well expressed in norms or in every tribology book. In the past, the automotive industry has often used some parameters such as R or Ra and W or Wa [32]. However, these parameters are really insufficient to correctly describe the surface functionality. Now, in conjunction with previous parameters, Rpk, Rk, Rvk are commonly used. These parameters are deduced from the Abbott-Firestone curve. Maximal values are imposed on Rpk and Rk but the minimal value is imposed on Rvk as this parameter is seen as the oil reserve on the surface. Today, the parameter Vo [33] related to the lubricant retention volume is more often used and is more relevant. It has been experimentally demonstrated that the higher Vo is the lower the friction is for mixed lubrication [34]. Generally, porous spray coatings are claimed to offer a low friction coefficient due to their high volume of lubricant retention.
The lack of refined contact description in mixed lubrication has not yet allowed us to recommend new surface parameters. For example, it is easy to estimate and it makes sense mechanically that to avoid scuffing between a sliding asperity and the antagonist surface, it is necessary to limit the distance between the oil pockets present on the surface. Nevertheless, this distance is not equivalent to the parameter AR or Rsm. New parameters have to be proposed for this distance. With new contact surface measurement devices and 3D norms, improvements in surface description are in progress. Soon, it will be possible to recognize oil pockets on the surface and, hence, to estimate a certain average distance between oil pockets.
New roughness parameters and their optimization will at first concern bearing reliability. However, a bearing accepting a thinner oil film thickness will also operate with lower friction.
3.3. Environment Family
As mentioned in the introduction, it would be inappropriate to optimize the bearing without considering its environment. This chapter is dedicated to the external aspects of the bearing which have an influence on its own friction or whose friction is related to the bearing design. For example, misalignment between the main bearings on the crankshaft or on the camshaft increases the friction, while large oil flow leakage in bearings will involve a bigger oil pump with higher power consumption. In no order of importance we have reported below some influential environmental factors.
3.3.1. Oil Optimization
The optimization of the oil viscosity and of the oil additives is an obvious and efficient low friction solution, which is being continuously optimized by petrol manufacturers.
On this topic, it is also important to highlight the fact that lubricant additive definition remains in the private area of petrol companies despite the fact that it has a very great influence on friction in boundary and mixed conditions. For example, the wear and seizure risk in camshaft bearing remains directly linked to additive performance as the lubrication is sometimes mixed and the tribological couple is steel against aluminum alloy. This tribological couple is not at all optimal but oil additives allow it to operate safely. The lack of additive knowledge means that the engine designer can just test new oils without any forecast simulations.
For a decrease in viscosity, a crude estimation of friction reduction for the global engine could be done by considering that the global friction decrease is directly related to the square root of the viscosity. For bearing friction, the decrease can be considered as proportional to the viscosity decrease. Unfortunately, the low level of knowledge about additive modifications does not allow for the prediction of any friction modifications.
3.3.2. Optimal Temperature
In the NEDC cycle, before starting, every part of the engine is at room temperature (20 °C). The average engine temperature is quite low during the first 200 s; hence, the oil temperature is quite low, the viscosity is high and this generates high friction. To reduce oil viscosity in bearings, several solutions have been developed to accelerate the oil temperature rise. Two solutions are currently being used by engine designers:
- -
- One solution consists of isolating some of the oil during the starting period in order to obtain a faster temperature increase [3]. The insulating device consists of deviating the oil flow so that it does not pass through the oil sump. Therefore, the oil sump is no longer part of the lubricant circuit. When the oil temperature reaches a certain value, the oil flowing down goes again through the sump. According to different authors, the gain will be around 2 or 3 g CO2 per km for the global engine.
- -
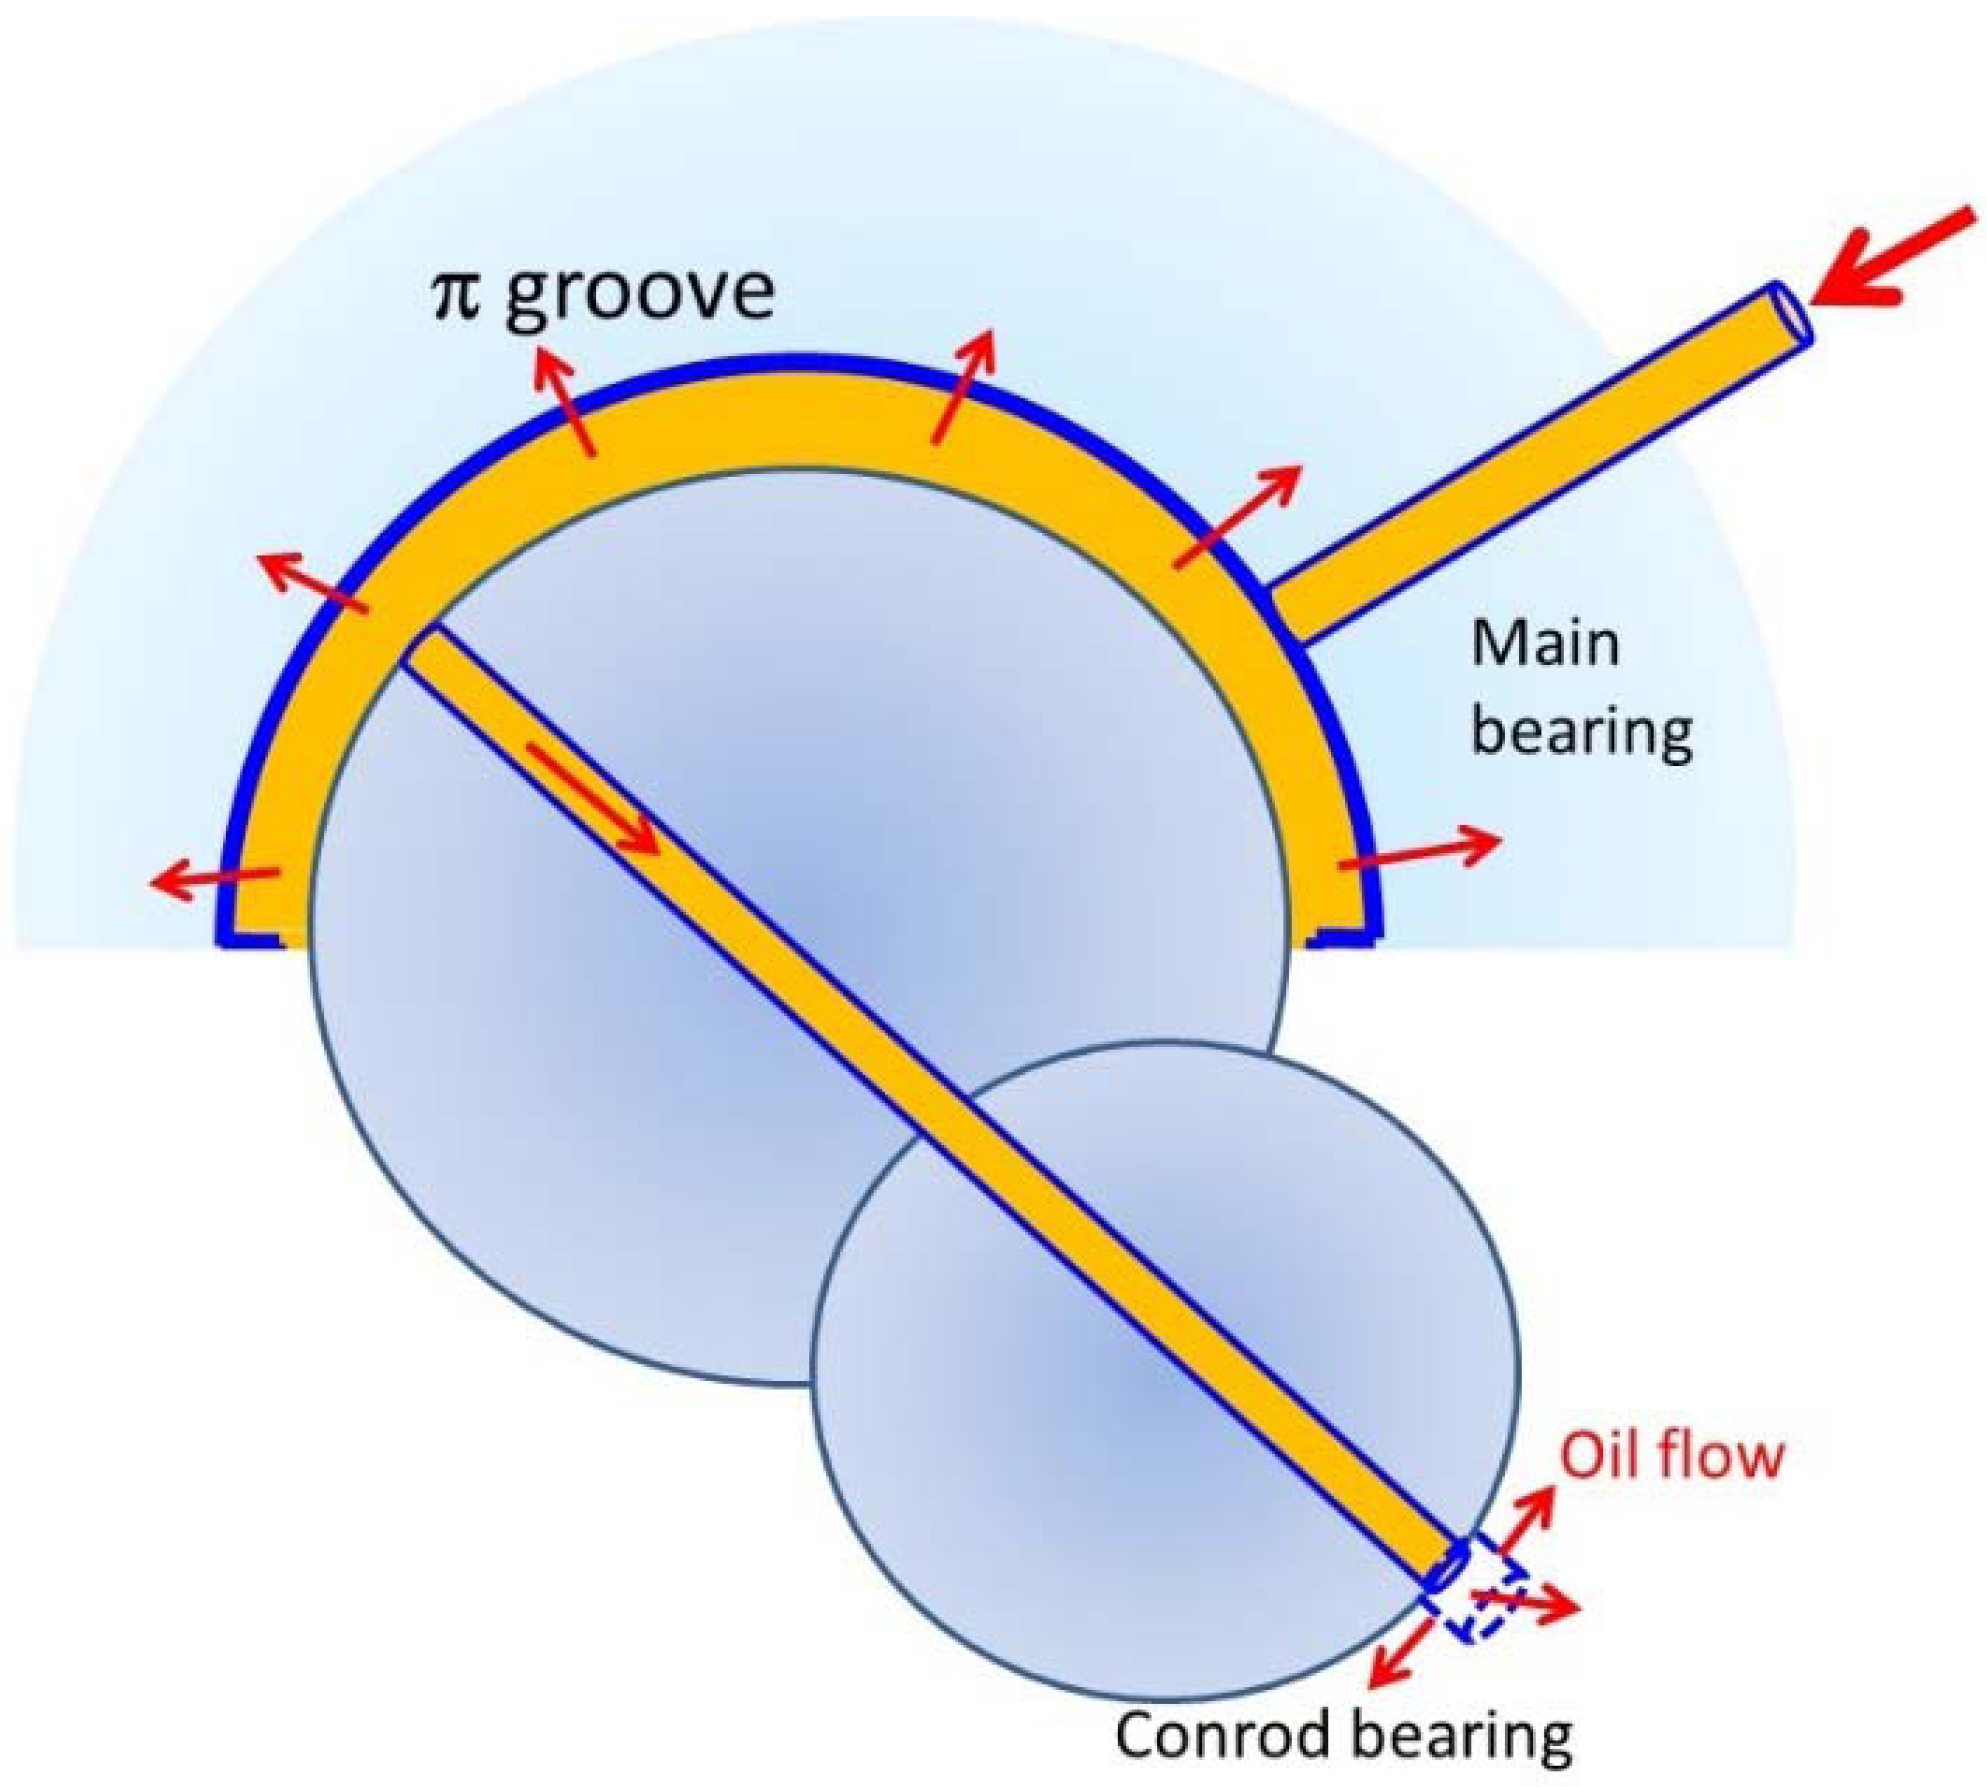
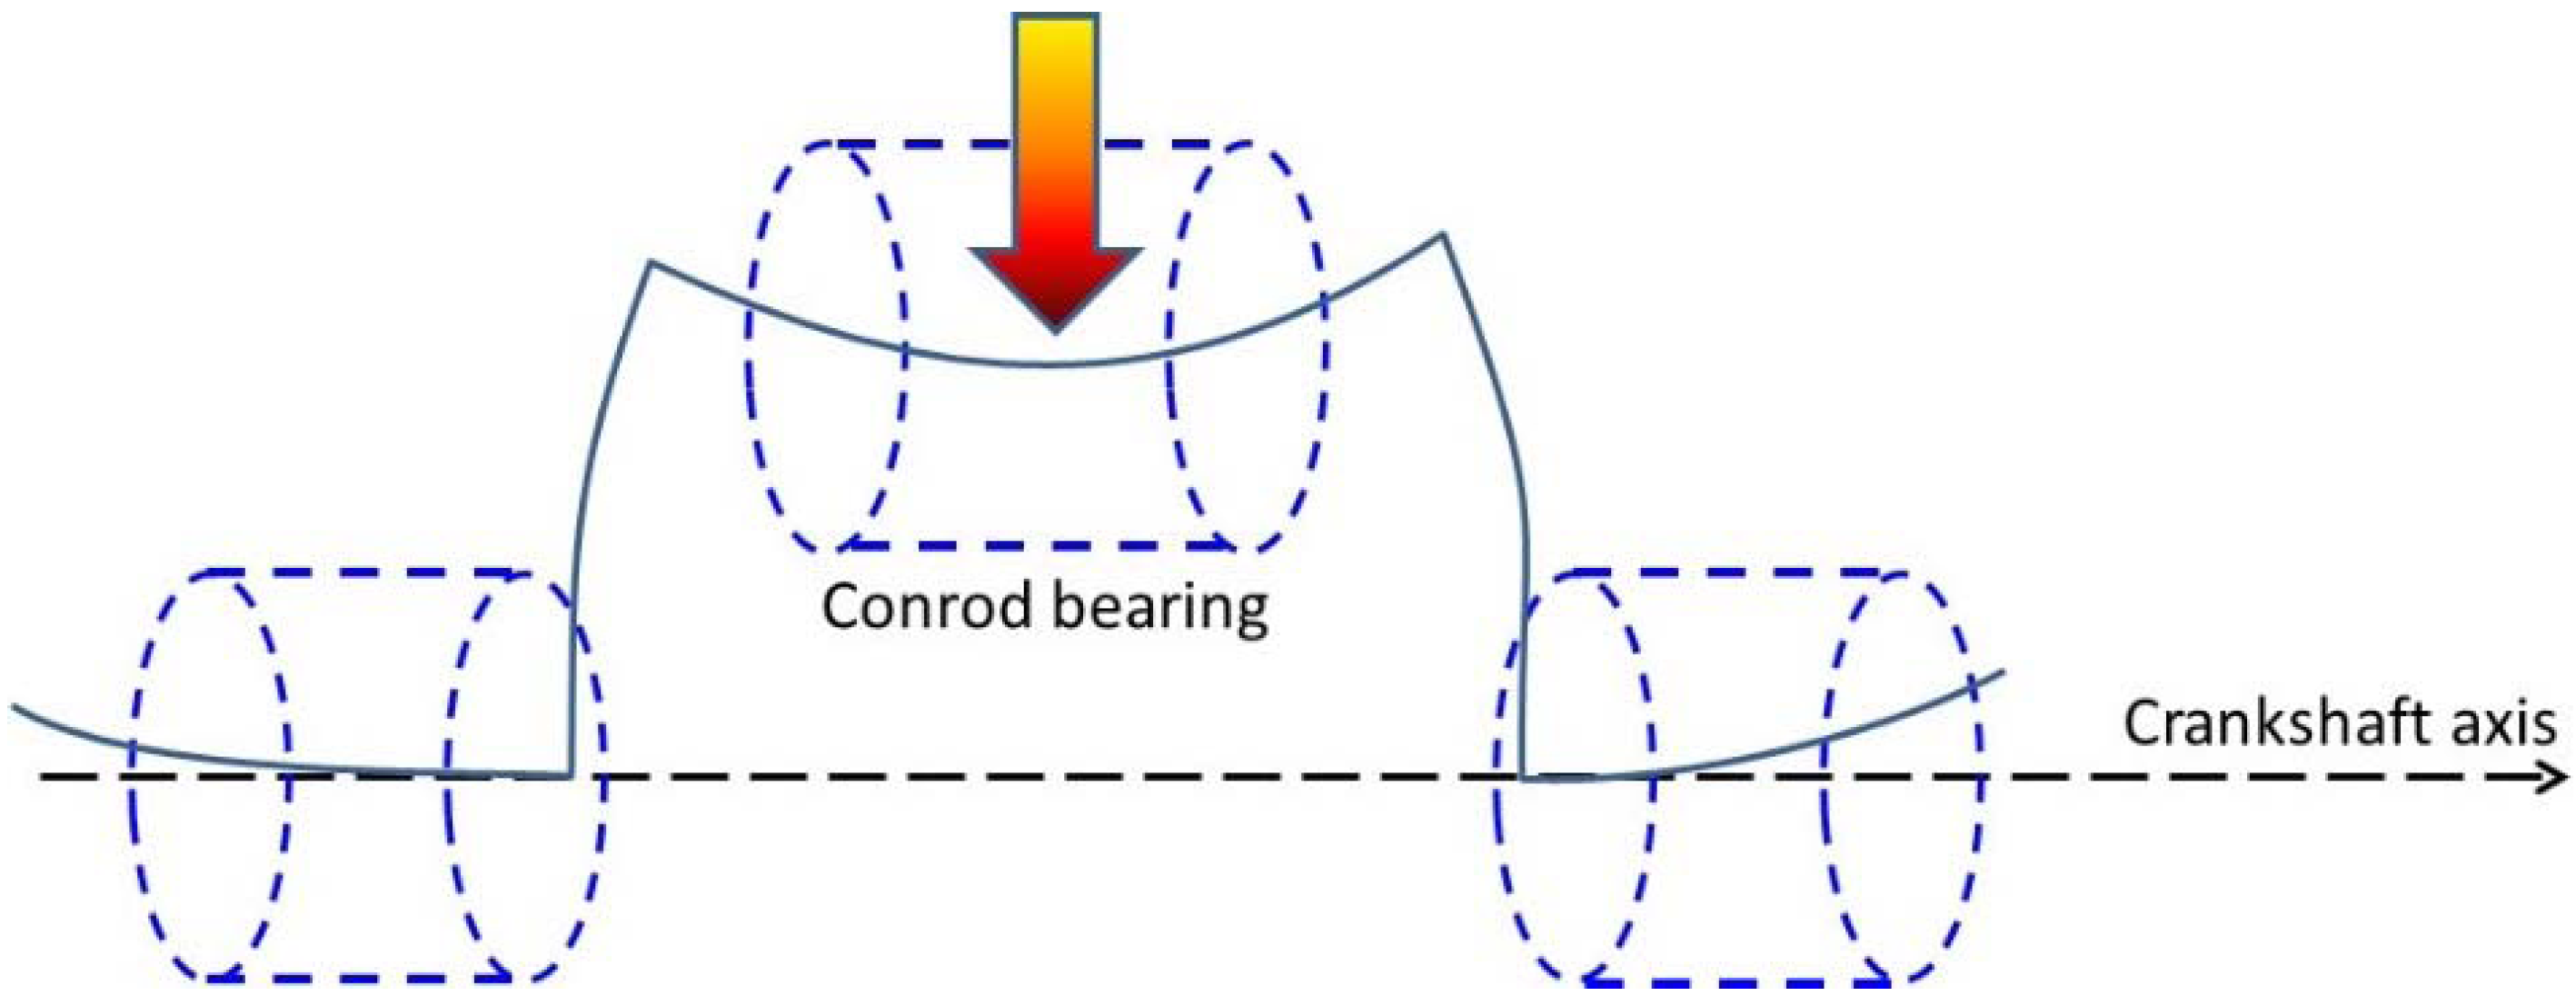
- Another solution is the modification of oil circuit from the main bearing to the conrod bearing. The underlying idea is to maximize the heat generated by the oil shear in the main bearing groove. In order of importance, the first optimization is to adopt the minimal groove depth as the volumic density of heat is related to the groove depth at power four. The minimal depth is the depth which does not produce cavitation in the groove. The second optimization consists of reducing the main bearing clearance in order to reduce the leakage flow from the main bearing. It will mean that more heat will increase the oil temperature in the conrod flow. For the same bearing clearance, the cross section of the oil leakage is approximately 10–20 times higher for the main bearing with respect to the conrod bearing (see Figure 17). The third optimization involves having one main bearing feeding two conrod bearings instead of having one main bearing feeding one conrod bearing. This design reduces by 30%–40% the leakage flow from the main bearing and increases the oil shear in the grooves of main bearings.
The accumulation of these three optimizations can save around 0.2–0.4 g of CO2.
- -
- From the literature and oil company claims, investigations into oil are being made in order to obtain a lower viscosity at low temperatures, while preserving a certain viscosity at high temperatures.
Figure 17.
Oil flows.

3.3.3. Convex and Concave Shaft
In order to keep a relatively uniform film thickness in the bearing during the combustion cycle, some specific shaft patterns can be adopted. This is particularly appropriate for turbocharged diesel engine crankshafts, which are subject to very high bending. The direct consequence is that a straight line on the shaft generatrice does not remain straight during combustion. This line becomes curved, as presented in Figure 18 where the deformed center line of the crankshaft is drawn. This shaft bending concerns the journal in the main bearing and in the conrod bearing. The crankshaft curvature will decrease the bearing performance.
Figure 18.
Crankshaft bending.
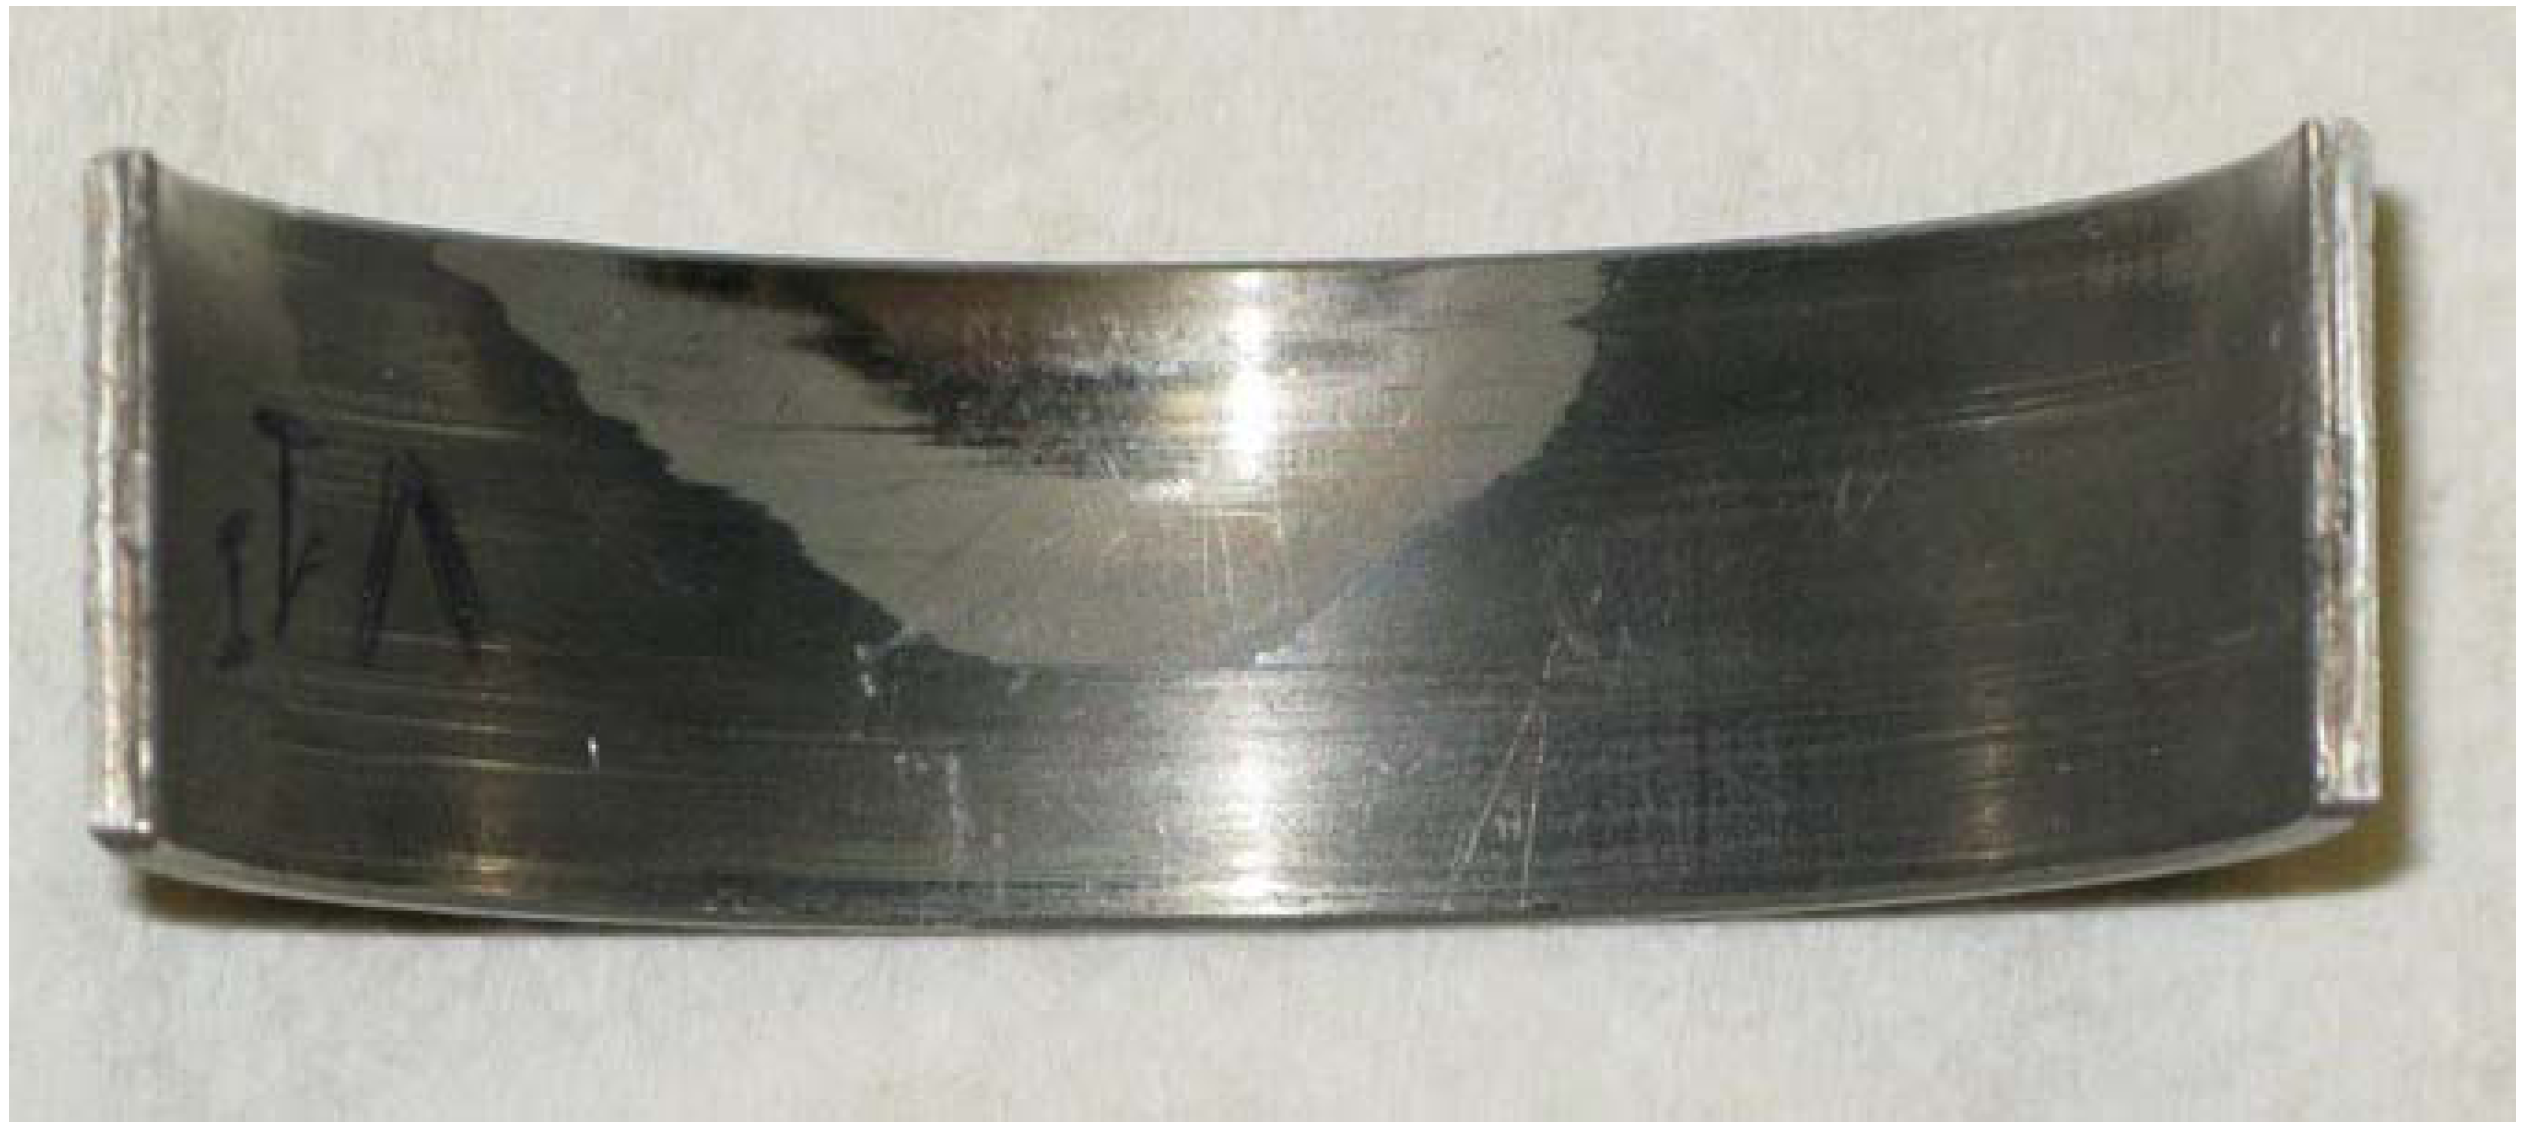
The MOFT will be thinner at the edges of the conrod bearing and the edge of the main bearings, thus the friction will be higher. A common pattern of contact on the main bearing due to the edge loading on the main crankshaft bearing is presented in Figure 19.
Figure 19.
Edge loading on main bearing.
In order to compensate for these geometrical defects, the shaft can be machined into a special convex shape (barrel shape) for conrod bearings. The difficulty is to get a low tolerance on the curvature machining. From the field, the machined bumps of the curvature are generally between 2 µm and 3 µm.
This kind of solution is quite usual for piston pins and small end bushes. In pistons, the pin housing bore is machined with a double “trumpet” shape in order to follow the distortion and the ovalization of the pin when this is bent. With these features, the contact surfaces between the piston bores and the piston pins remain quite consistent and the edge loadings are reduced.
For small end bushes, an hourglass pattern for the bore is sometimes used to compensate for piston pin bending.
At this stage, it is interesting to remember that crankshaft loading is hyperstatic and can generate extra-loading at the main bearings not adjacent to conrod loading. One way to avoid this effect is to use large main bearing clearances. In this way, the conrod loading will just generate two reactions on the adjacent main bearings. Unfortunately, large clearances increase harness noise. A compromise between acoustic and friction requirements has to be found.
From a general point of view, the friction reductions due to these geometrical shape optimizations are not really sensitive for the NEDC cycle but will be more efficient for high loaded engine use. In the end, the main benefit of shaft pattern optimization is bearing reliability.
3.3.4. Crankshaft Equilibrium
Crankshaft loading can also be optimized. For an engine with four cylinders in-line, the current question is to choose the number of counterweights. In order to have the smallest mean loading during the combustion cycle for each bearing, it is recommended to adopt eight counterweights distributed along the crankshaft. The major disadvantage is that the crankshaft is slightly more expansive than a four counterweights. This geometrical definition enables a better equilibrium of each part of the shaft.
For NEDC cycle, the friction improvement can reach a value around 0.2 g of CO2 per km.
3.3.5. Misalignment
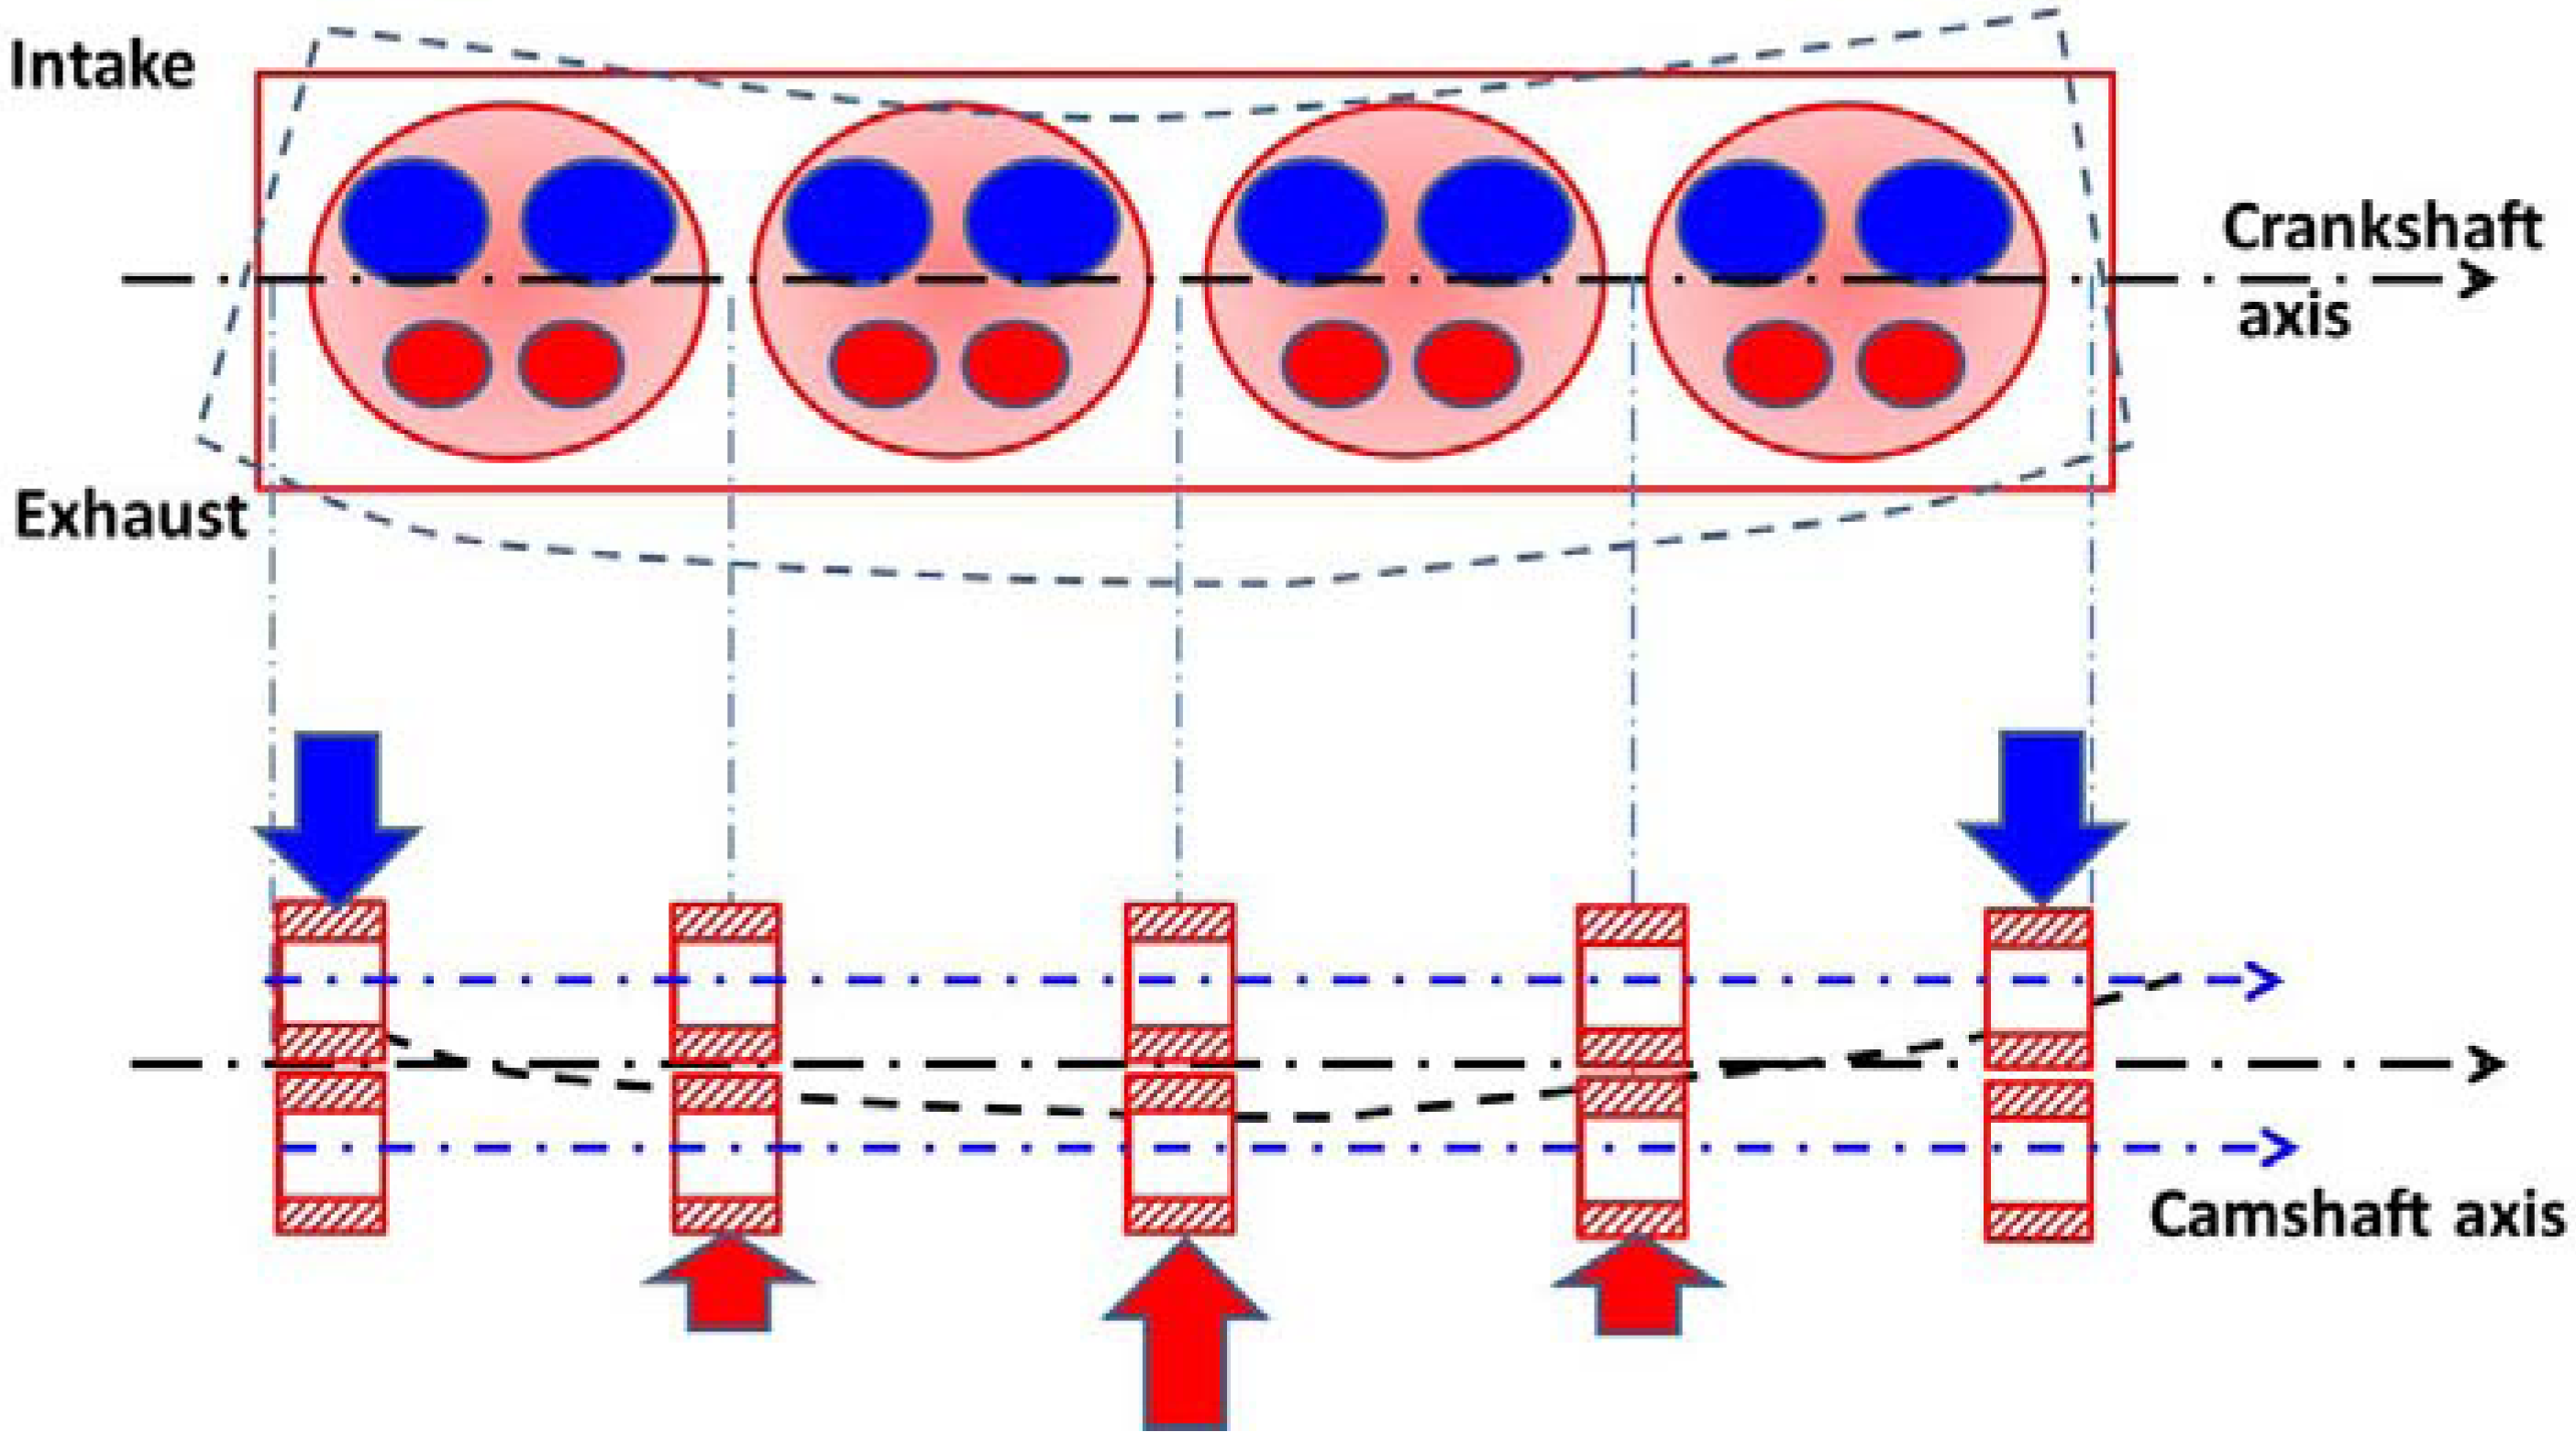
Due to manufacturing dispersion, misalignment between main bearing centers is unavoidable. However, misalignment could also result from engine frame deformation taking place during the combustion cycle. With respect to the engine design, thermal misalignment could be greater than the machining misalignment. In the field, the bearing center misalignment of the crankshaft due to machining is around 30 µm for a 2-liter engine. If there is a cylinder head with one side for intake and the other side for exhaust, it is possible to get a curved shape from the thermal field, as illustrated in Figure 20. Some deflection values like 30–40 µm can be observed. For camshafts, extra loading will appear so that the shaft obtains the same curvature as the cylinder-head bearing center line. This loading due to thermal misalignment will generate extra-friction. The same kind of thermal deformation could be observed for the crankshaft due to the fact the upper part of the cylinders is hotter than the lower part. Cylinders have a certain “accordion” shape. One way to correct this effect is to optimize the coolant circuit in the cylinder-head and in the cylinder-block and to optimize the cylinder-head deck design.
Figure 20.
Cylinder head deformation due to differential thermal expansion.
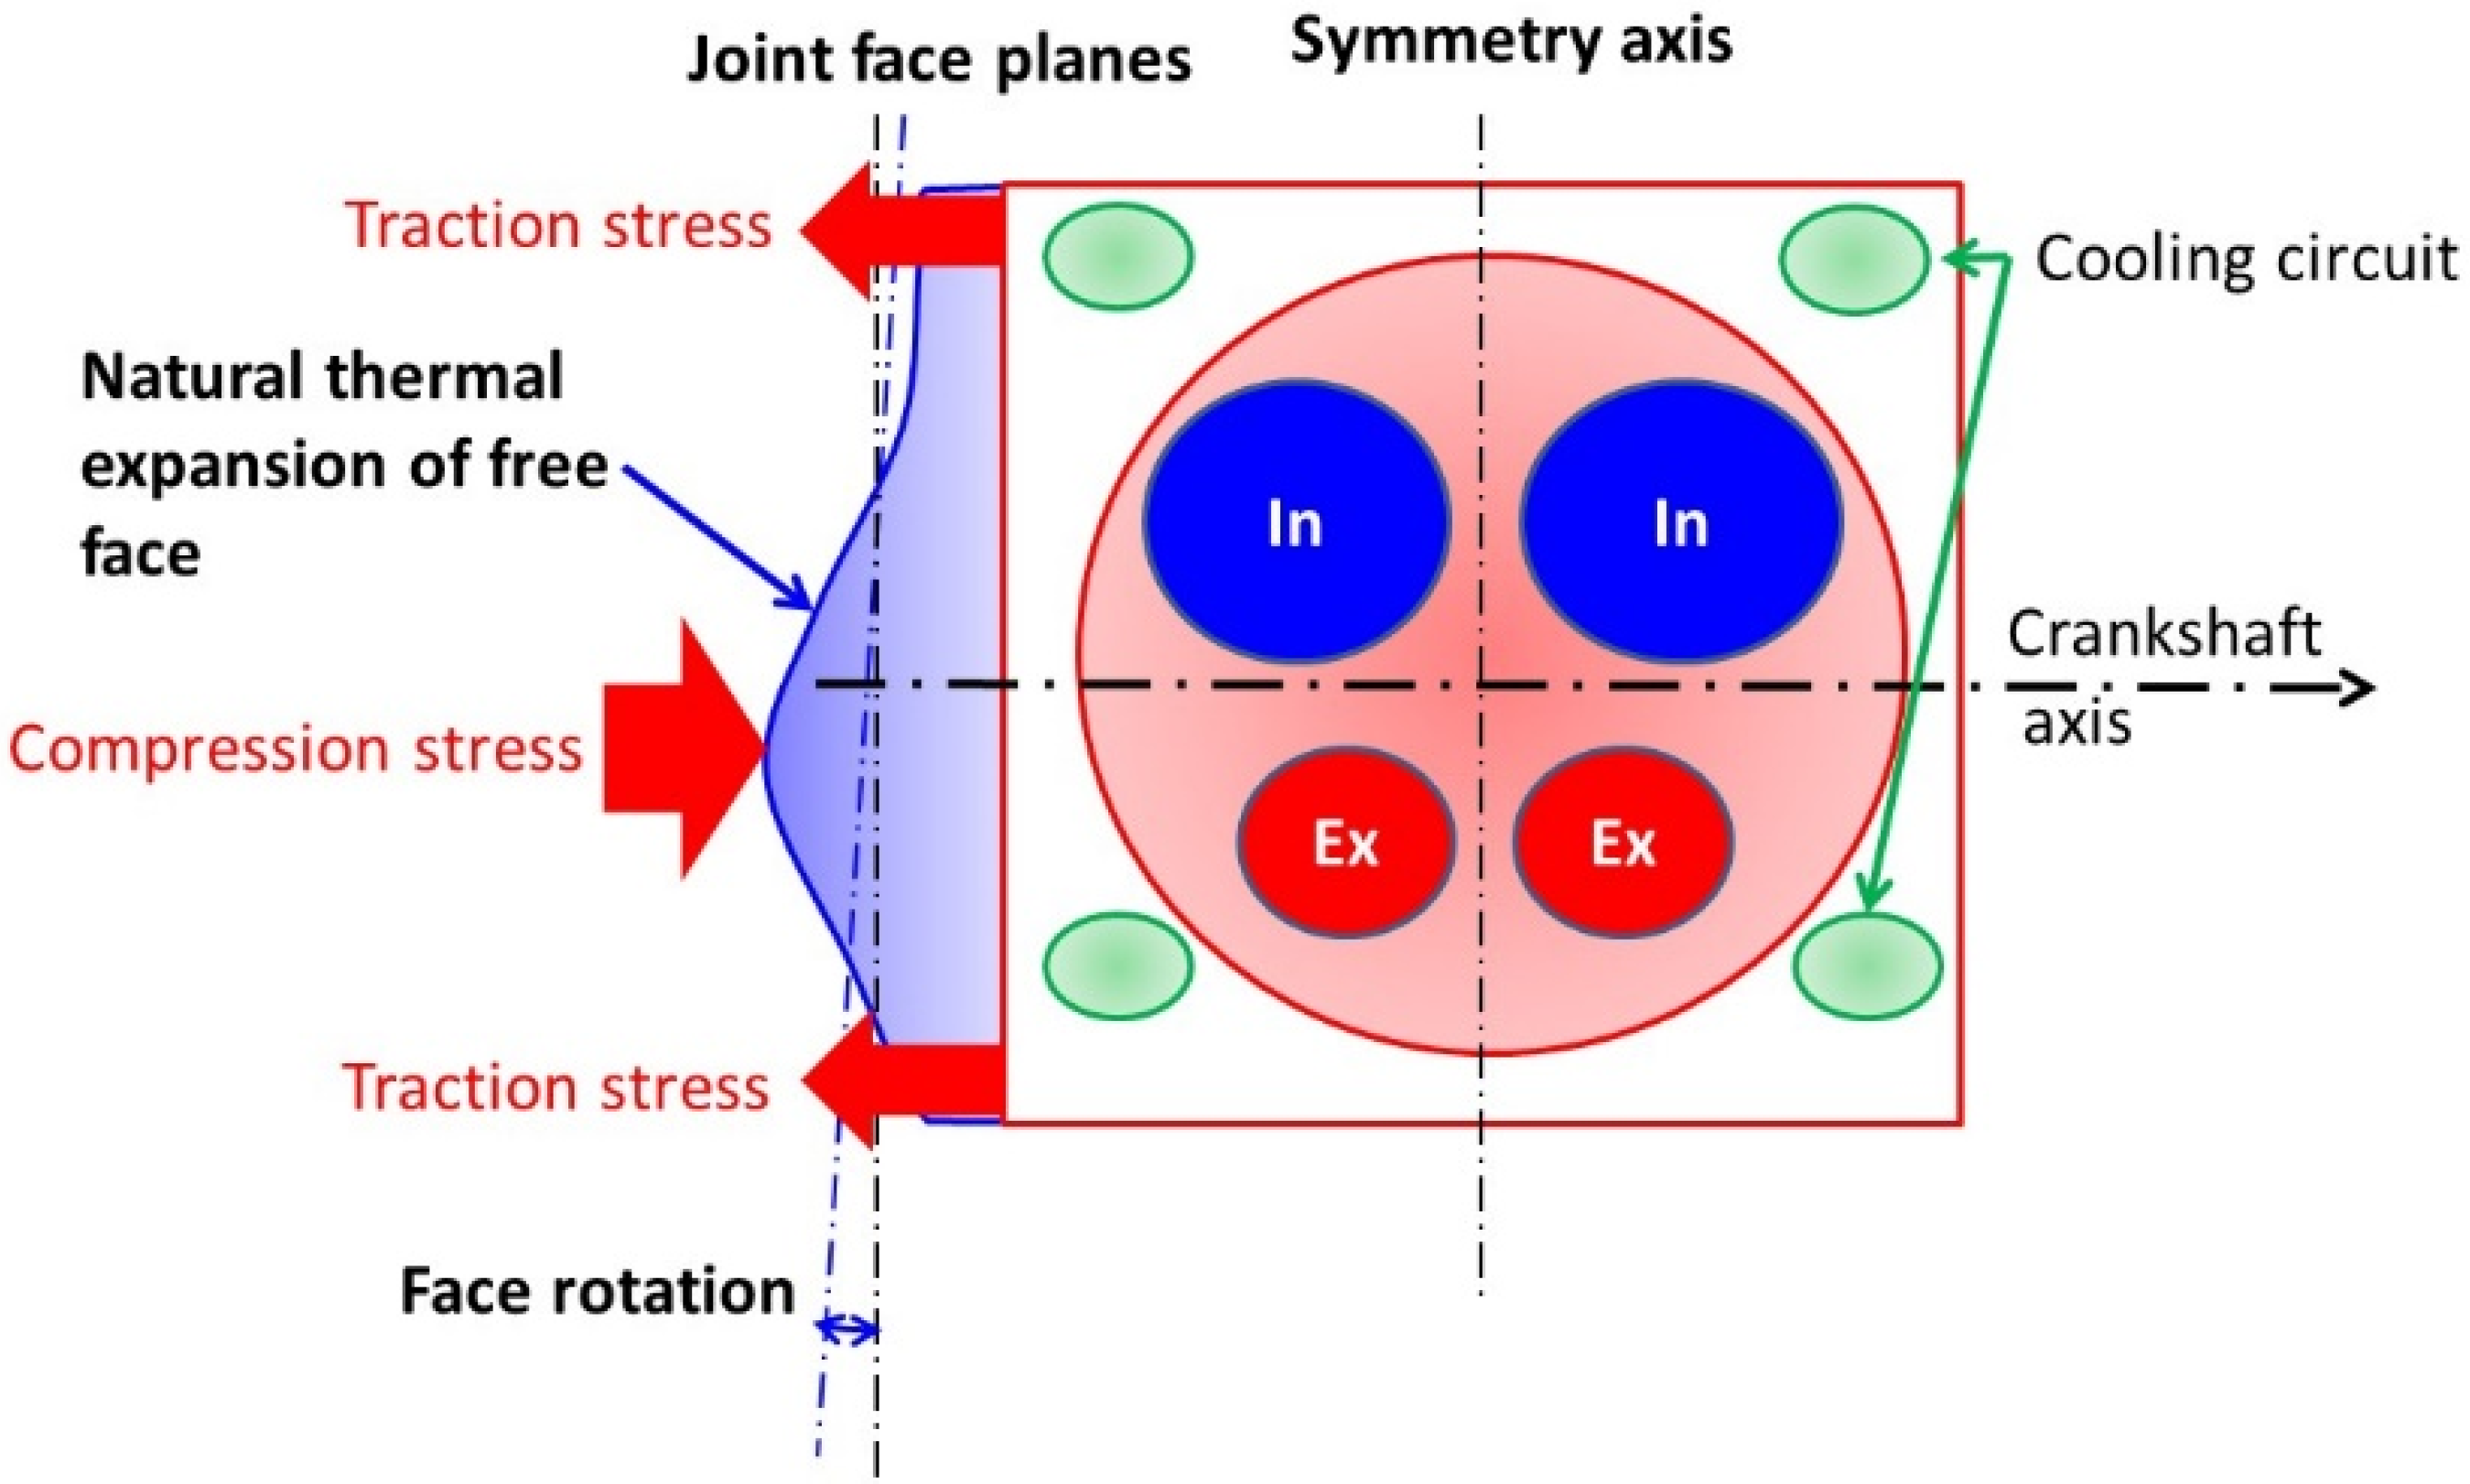
As a multi-cylinder engine in-line can be seen as the periodic sum of elementary mono-cylinder, the joint face between each element is a plane. To remove the face rotation of each element the thermal field has to be optimized by the coolant circuit design. Figure 21 shows a thermal expansion of the cylinder element which will generate stress traction in low expansion areas and compression stress in large expansion.
Figure 21.
Thermal expansion of a joint face.
From a practical point of view, the misalignment defect can be equivalent to approximately 0.2 g of CO2 per km.
3.3.6. Oil Circuit Optimization
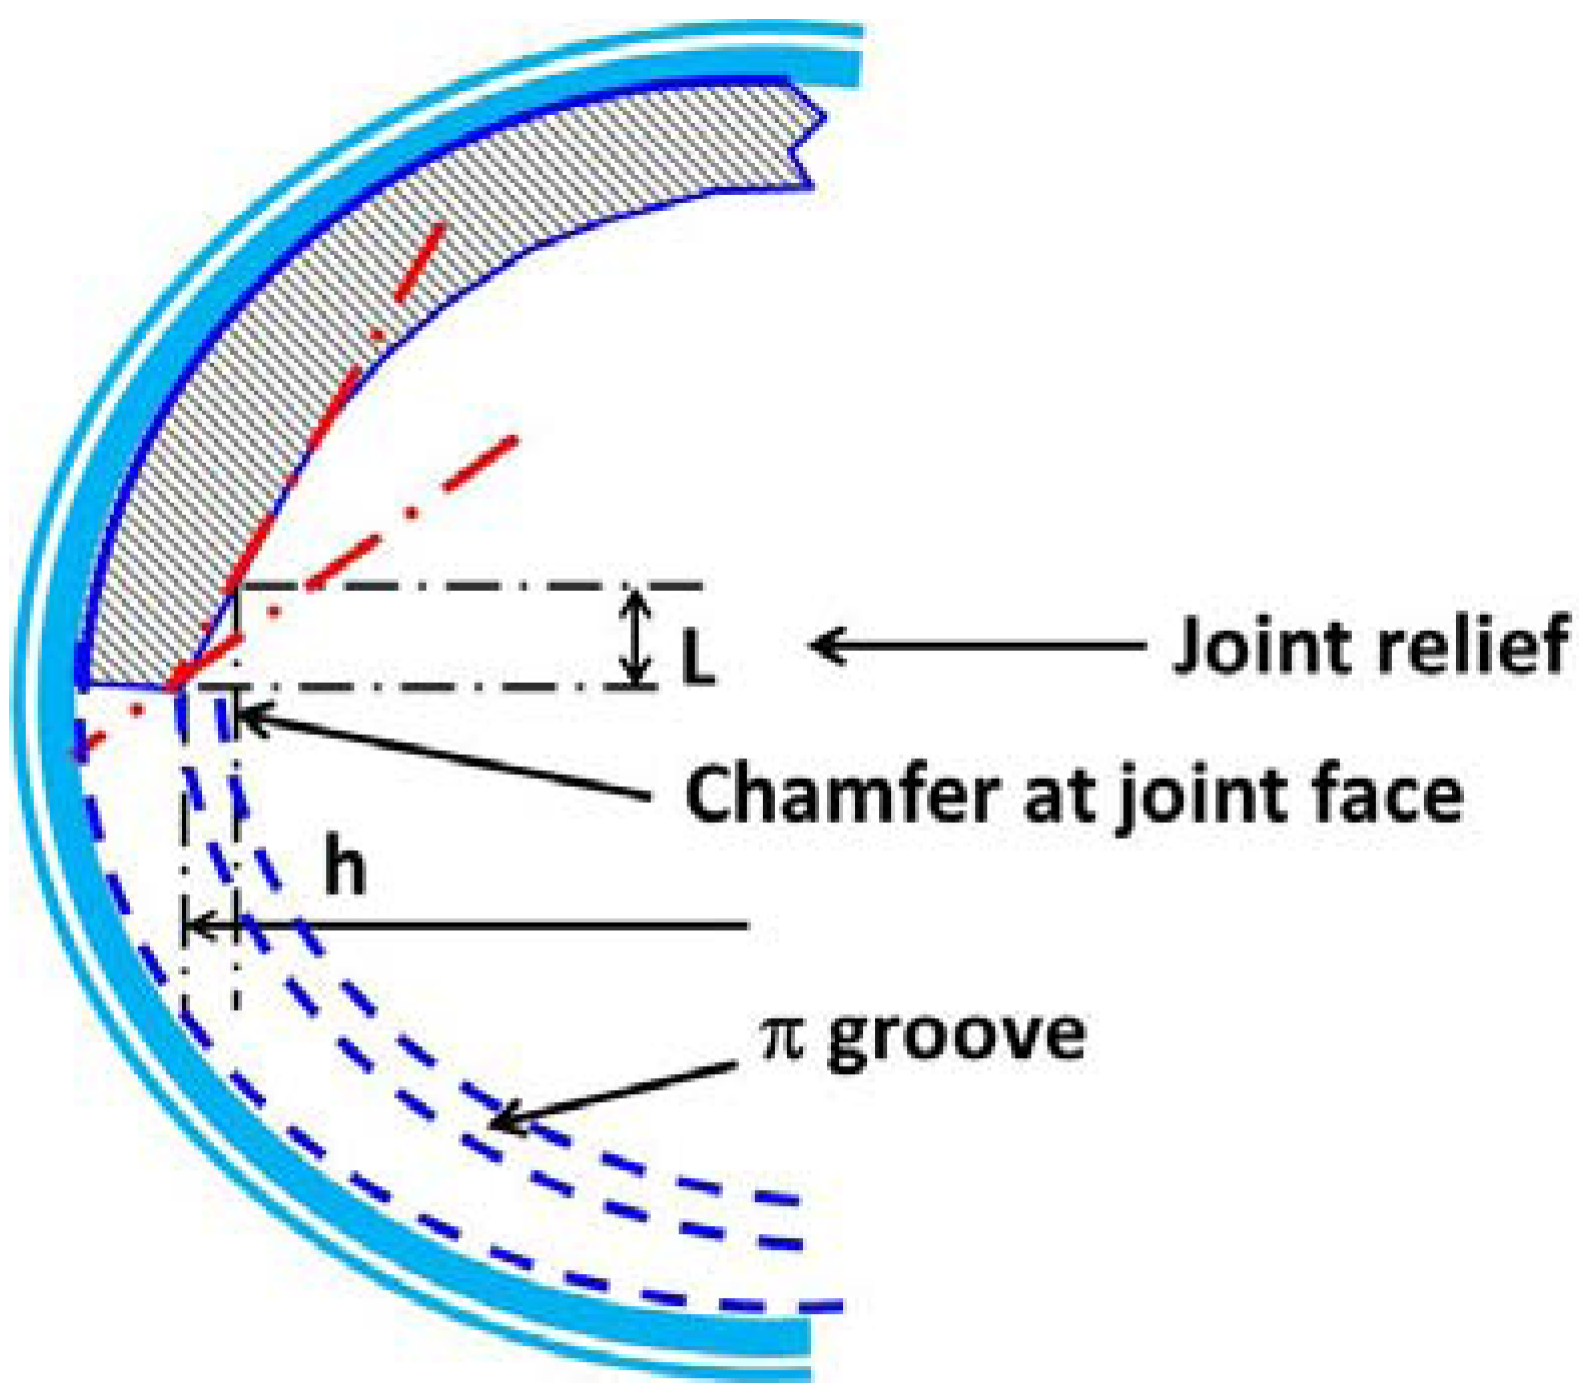
Just by reducing the oil leakage in the oil circuit it is possible to redesign the pump or to get a higher calibration [35]. We will not consider the thermo-management, which has also some effect on the oil temperature particularly during the first 200 s in the NEDC cycle. Concerning oil flow optimization, a simple calculation on the main bearing with joint face reliefs shows a considerable oil leakage. At this stage, it is interesting to keep in mind that the leakage flow in the bearing is proportional to the leakage film thickness at power three.
In Figure 22, a plain bearing and bearing with a π groove are represented. The chamfers at the bearing joint faces can cause a considerable oil leakage flow. The oil flow can be reduced by minimizing chamfers and joint face reliefs as is done with certain bearings with no chamfer and no joint relief but simply high microgrooves at the joint faces.
Figure 22.
Chamfer at bearing joint face.

4. Friction Measurement
As soon as low friction solutions are proposed for engine components it becomes important to be able to quantify the friction improvement. With the growing importance of minimizing engine friction, every car manufacturer and every automotive engineering company (A.V.L., F.E.V., I.A.V., Ricardo, Moteur Moderne, etc.) have several engine tests (mono and multi-cylinders) and several test rigs dedicated to friction measurement. Unfortunately, many low friction solutions for bearings provide little friction reduction, which could be very difficult to measure precisely with standard methods on engine tests.
As a reminder, car companies estimate engine friction with standard methods which are: the Strip-method where only inertia loads act on bearings [36], the Run-down method for which several flywheels can be used, the Shut-off method, the Willan’s line method [37], the motoring test which involves very accurate measurements of the instantaneous gas pressure in cylinders and of the engine torque. However, all these methods do not directly provide the bearing friction, which is obtained by deduction from other measurements. The consequence is that the accuracy of bearing friction estimation is the sum of the accuracy of the other measurements involved.
To get accurate bearing friction measurement it is necessary to use specific test rigs for bearings, like for example, the test rig developed by Miba [38]. To get realistic bearing test rig performance in terms of friction, there are some points to take into account, which are:
- -
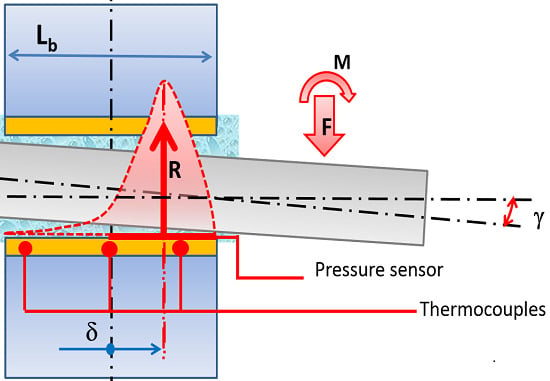
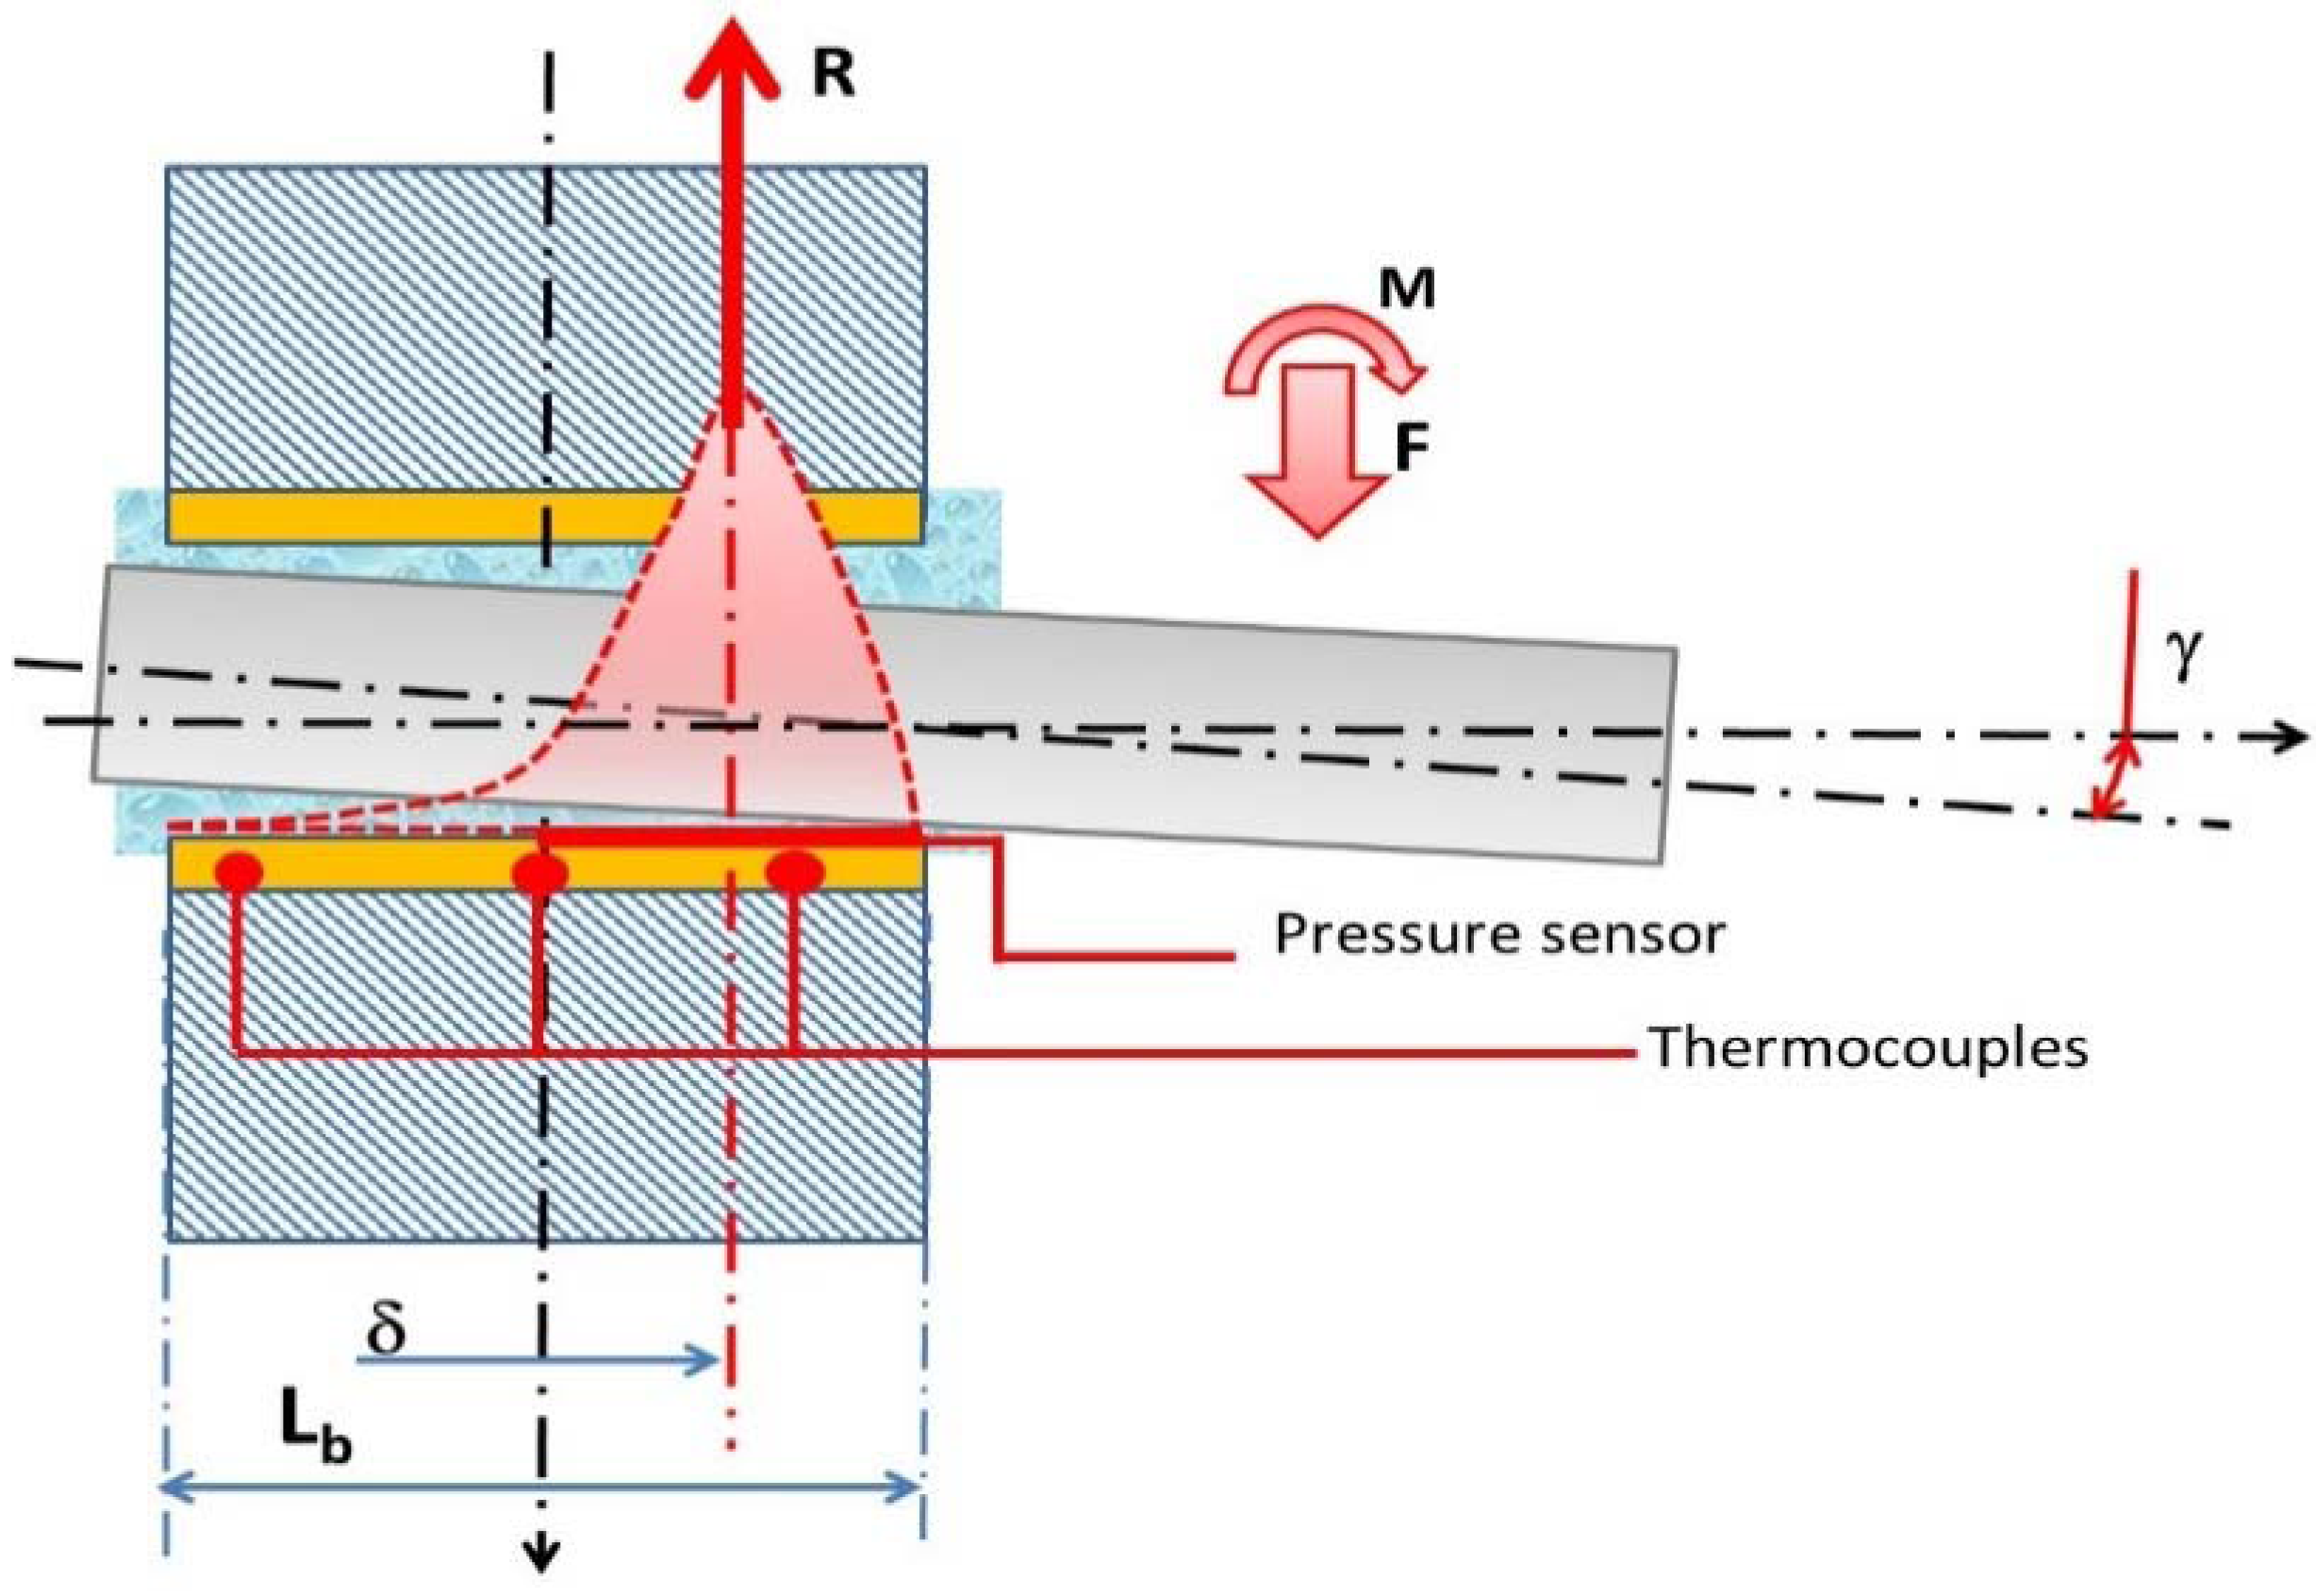
- To have realistic loadings in term of intensity and direction, which includes edge loading. To reproduce engine loadings on bearings, the load cell must be able to have a very short response time. This can represent around 104 N of load variation in less than 5 ×·10−5 s. Came and hydraulic devices are not suitable for this constraint. Concerning edge loading, this could be applied by shaft angularity or by bending moment. To check, it is possible to use angular sensor and thermocouples in the bearing (cf. Figure 23). Axial temperature differences can be translated as oil film pinch.
- -
- To obtain realistic geometry with defects (pattern, misalignment between main bearing centers, axis and location misalignment between small end and big end of the conrod). Real minimal oil film thicknesses in engine bearings are very thin, about one micron thick. The circularity of the bearing is not as good and hydrodynamic pressure rises locally to deform the bearing bore and give a better conformability to the shaft journal. This extra local pressure generates extra friction which does not appear with perfect geometry.
Figure 23.
Diagram of instrumented bearing on test rig.
5. Conclusions
With this general overview on bearing friction and its reliability, it appears that certain aspects of friction optimization and bearing reliability are not obvious and need investigation, development and experimentation. Many remaining issues could be seen as “open problems” from a theoretical point of view.
The main damages listed in this paper provide an overview of the aspects to consider to achieve reliable low friction bearings. Fatigue mechanisms involve considering thermal aspects as well as residual stress and elasto-plastic behavior in order to globally assess the phenomenon. Seizure probability remains very difficult to predict, and wear patterns are sometimes unexpected and very different to the numerical simulations. Concerning these damages, the coupling between numerical simulation and experience remains essential for safe bearing design.
Several low friction solutions in relation with bearing, its design and its environment are presented above, and together they represent a potential of around 2 g of CO2 per km. These low friction solutions are related to:
- -
- Nano-particles
- -
- macro geometrical optimizations (bearing, groove, shaft, housing stiffness)
- -
- Micro and meso geometrical optimization (micro-grooves, texture, etc.)
- -
- Oil circuit optimization
Ultimately, refined validation tests are necessary to characterize the benefit of each low friction solution.
Author Contributions
Jean-Louis Ligier and Bruno Noel have conceived the main lines of the paper which has been written by Jean-Louis Ligier and which has been critically reviewed by Bruno Noel.
Conflicts of Interest
The authors declare no conflict of interest.
References
- European Commission. European Union Regulation (EC) No 443/2009 of the European Parliament and of the Council of the 23 April 2009. Official Journal L140: 1–15.
- Holmberg, K.; Andersson, P.; Erdemir, A. Global energy consumption due to friction in passenger cars. Tribol. Int. 2012, 47, 221–234. [Google Scholar] [CrossRef]
- Roberts, A.; Brooks, R.; Shipway, P. Internal combustion engine cold start efficiency. Energy Convers. Manag. 2014, 82, 327–350. [Google Scholar] [CrossRef]
- Ligier, J.-L. Lubrification des Paliers Moteurs; Editions Technip: Pairs, France, 1997. [Google Scholar]
- Ligier, J.-L.; Dutfoy, L. Fatigue Analysis of Conrod Bearing; SAE Technical Paper 2011-01-0197; SAE International: Warrendale, PA, USA, 2011. [Google Scholar]
- Suresh, S. Fatigue of Materials; Cambridge University Press: Cambridge, UK, 1998. [Google Scholar]
- Bayada, G.; Martin, S.; Vazquez, C. An average flow model of the Reynolds roughness including a mass flow preserving cavitation model. J. Tribol. 2005, 127, 793–802. [Google Scholar] [CrossRef]
- Bonneau, D.; Fatu, A.; Souchet, D. Paliers Hydrodynamiques—Equations, Modèles Numériques Isothermes et Lubrification Mixte; Hermes Science: Paris, France, 2011. [Google Scholar]
- Allmaier, H.; Priestner, C.; Sander, D.E.; Reich, F.M. Friction in automotive engines. In Tribology in Engineering; Intech: Rijeka, Croatia, 2013. [Google Scholar]
- Ligier, J.-L.; Dutfoy, L.; Mathevet, X. Optimisation de l’usure d’un système lubrifié avec charge d’angle. In Proceedings of the Journées Internationales Francophones de la Tribology, Albi, France, 27–28 May 2010.
- Ligier, J.L.; Dutfoy, L. Modelling and prediction of a simplified seizure mechanism occurring in conrod bearings. Méc. Ind. 2011, 12, 265–273. [Google Scholar]
- Bravo, A.E.; Durán, H.A.; Jacobo, V.H.; Ortiz, A.; Schouwenaars, R. Towards new formulations for journal bearing alloys. Wear 2013, 302, 1528–1535. [Google Scholar] [CrossRef]
- Khonsari, M.M.; Booser, E.R. Effect of contamination on the performance of hydrodynamic bearings. In Proceedings of the Institution of Mechanical Engineers, Part J: Journal of Engineering Tribology, Baton Rouge, LA, USA, 1 May 2006; IMechE: London, UK, 2006; Volume 220. [Google Scholar]
- Tomimoto, M. Experimental verification of a hard particle induced friction model in journal bearings. Wear 2003, 254, 749–762. [Google Scholar] [CrossRef]
- Ligier, J.-L. Avaries en Lubrification; Editions Technip: Pairs, France, 2004. [Google Scholar]
- Rabinowicz, E. Friction and Wear of Materials, 2nd ed.; Wiley: Hoboken, NJ, USA, 1995. [Google Scholar]
- Nyberg, H.; Sundberg, J.; Sarhammar, E.; Gustavsson, F.; Kubart, T.; Nyberg, T.; Jansson, U.; Jacobson, S. Extreme friction reductions during initial running-in of W-S-C-Ti low friction coatings. Wear 2013, 302, 987–997. [Google Scholar] [CrossRef]
- Görlach, B.; Holweger, W. Future polyimide coatings used in high loaded bearings. Ind. Lubr. Tribol. 2005, 57, 197–201. [Google Scholar] [CrossRef]
- Beaurepaire, O.; Uehara, S.; George, J. Engine Bearings with a Durable Polymer Coating for Hybrids and Start-stop Applications; Articles techniques R-2011608010; SIA: Versailles, France, 2011. [Google Scholar]
- Rahnejat, H. Tribology and Dynamics of Engine Powertrain; Woodhead Publishing: Sawston, Cambridge, UK, 2010. [Google Scholar]
- Etsion, I.; Sher, E. Improving fuel efficiency with laser surface textured piston rings. Tribol. Int. 2009, 42, 542–547. [Google Scholar] [CrossRef]
- Dumitru, G.; Romano, V.; Weber, H.P.; Haefke, H.; Gerbig, Y.; Pflüger, E. Laser microstructuring of steel surfaces for tribological applications. Appl. Phys. A 2000, 70, 485–487. [Google Scholar] [CrossRef]
- Praca, M.; Uehara, S.; Ferreira, M.; Mian, O. New polymeric coating on sputtered bearings for heavy duty diesel engines. SAE Int. J. Engines 2013, 6, 623–628. [Google Scholar] [CrossRef]
- Scaraggi, M. Optimal textures for increasing the load support in a thrust bearing Pad geometry. Tribol. Lett. 2014, 53, 127–143. [Google Scholar] [CrossRef]
- Shen, C.; Khonsari, M.M. Effect of dimple’s internal structure on hydrodynamic lubrication. Tribol. Lett. 2013, 52, 415–430. [Google Scholar] [CrossRef]
- Gangopadhyay, A.; McWatt, D.G. The effect of novel surface textures on tappet shims on valvetrain friction and wear. In Proceedings of the STLE/ASME 2006 International Joint Tribology Conference, San Antonio, TX, USA; 2008; Volume 51, pp. 221–230. [Google Scholar]
- Qiu, Y.; Khonsari, M.M. Performance analysis of full-film textured surfaces with consideration of roughness effects. J. Tribol. 2011, 133. [Google Scholar] [CrossRef]
- Cupillard, S.; Glavatskih, S.; Cervantes, M.J. Computational fluid dynamics analysis of a journal bearing with surface texturing. Proc. Inst. Mech. Eng. J J. Eng. Tribol. 2008, 222, 97–107. [Google Scholar] [CrossRef]
- Tala-Ighil, N.; Maspeyrot, P.; Fillon, M.; Bounif, A. Effects of surface texture on journal-bearing characteristics under steady-state operating conditions. Proc. Inst. Mech. Eng. J J. Eng. Tribol. 2007, 221, 623–633. [Google Scholar] [CrossRef]
- Braun, D.; Greiner, C.; Schneider, J.; Gumbsch, P. Efficiency of laser surface texturing in the reduction of friction under mixed lubrication. Tribol. Int. 2014, 77, 142–147. [Google Scholar] [CrossRef]
- Adatepe, H.; Biyikhoglu, A.; Sofuoglu, H. An investigation of tribological behaviors of dynamically loaded non-grooved and micro-grooved journal bearings. Tribol. Int. 2013, 58, 12–19. [Google Scholar] [CrossRef]
- International Organisation for Standardisation (ISO), NF EN ISO 4287, NF EN ISO 12085 (1988), NF EN ISO 13565, Spécifications géométriques des produits—Méthode du profil—Paramètres liés aux motifs. AFNOR édition: St. Denis La Plaine, France, 1988.
- Mummery, L. Surface Texture Analysis: The Handbook. Hommelwerke GmbH: Muhlhausen, Germany, 1990. [Google Scholar]
- Wang, G.; Nie, X.; Tjong, J. Surface Effect of a PEO Coating on Friction at Different Sliding Velocities; SAE Paper 2015-01-06897; SAE International: Warrendale, PA, USA, 2015. [Google Scholar]
- Dutfoy, L.; Ligier, J.-L. Analysis and design of bearing oil circuit. In Tribology 2008: Surface Engineering of Automotive Powertrains for Environmentally Friendly Transport; IMECH: London, UK, 2008. [Google Scholar]
- Ciulli, E. A review of internal combustion engine losses. Part 2: Studies for Global Evaluations. Proc. Inst. Mech. Eng. D J. Automob. Eng. 1993, 207, 229–240. [Google Scholar] [CrossRef]
- Punt, M.; Martyr, A. Engine Testing; Butterworth Heinemann: Oxford, UK, 1995. [Google Scholar]
- Allmaier, H.; Sander, D.E.; Knauder, C.; Reich, F.M. Investigation of friction power losses in automotive journal bearings. J. Teknol. 2014, 66, 23–27. [Google Scholar] [CrossRef]
- Someya, T.; Mihara, Y. New thin film sensors for engine bearings. In Proceedings of the CIMAC Congress, Kyoto, Japan, 7–11 June 2004. Paper No. 91.
- Ronkainen, H.; Valkonen, A.; Kapulainen, M.; Simo, V.; Hokkanen, A.; Stuns, I. Embedded optical sensor for oil film pressure measurement in journal bearings. In Proceedings of the NORDTRIB 2008, Tampere, Finland, 10–13 June 2008.
© 2015 by the authors; licensee MDPI, Basel, Switzerland. This article is an open access article distributed under the terms and conditions of the Creative Commons Attribution license (http://creativecommons.org/licenses/by/4.0/).
Share and Cite
MDPI and ACS Style
Ligier, J.-L.; Noel, B. Friction Reduction and Reliability for Engines Bearings. Lubricants 2015, 3, 569-596. https://doi.org/10.3390/lubricants3030569
AMA Style
Ligier J-L, Noel B. Friction Reduction and Reliability for Engines Bearings. Lubricants. 2015; 3(3):569-596. https://doi.org/10.3390/lubricants3030569
Chicago/Turabian StyleLigier, Jean-Louis, and Bruno Noel. 2015. "Friction Reduction and Reliability for Engines Bearings" Lubricants 3, no. 3: 569-596. https://doi.org/10.3390/lubricants3030569