Modeling and Forecasting of Depletion of Additives in Car Engine Oils Using Attenuated Total Reflectance Fast Transform Infrared Spectroscopy

Abstract
:1. Introduction

| Additives | Chemical Composition | Purpose |
|---|---|---|
| Viscosity Index Improvers | Acrylate polymers | To keep the viscosity at acceptable levels. |
| Anti-Foaming Agents | Dimethylsilicones (dimethylsiloxanes) | To reduce the foaming effect in oils. |
| Anti-Oxidants | Zinc dithiophosphate (ZDP); Alkyl sulphides; Aromatic sulphides; Aromatic amines; Hindered phenols. | To inhibit the oxidation process of oils. |
| Detergents | Phenolates, sulphonatesphosphonates of alkaline, alkaline-earth elements such as Mg, Ca, Na, Ba. | To neutralize strong acids present in the lubricant. To form a film on part of the surface preventing high temperature deposition of sludge. |
| Dispersants | Long chain hydrocarbons succinimides, such as polyisobutylenesuccinimides | To keep the foreign particles present in a lubricant in a dispersed form. |
| Pour Point Depressants | Co-polymers of polyalkylmethacrylates | To inhibit formation and agglomeration of wax particles |
2. Mathematical Approach
- ▪
- ξox defines the fraction of oxidized materials formed because of carbonyl oxidation. Also, it accounts for the amount of antioxidants consumed during this process.
- ▪
- ξaw represents the fraction of contaminants appearing because of wear metal poisoning. To an extent, it quantifies the amount of antiwear additives (AWs) depleted solely due to metal contamination.
- ▪
- ξsu expresses the fraction of contaminants appearing as a result of sulfate oxidation. Also, it expresses the amount of depleted sulfonate detergents.
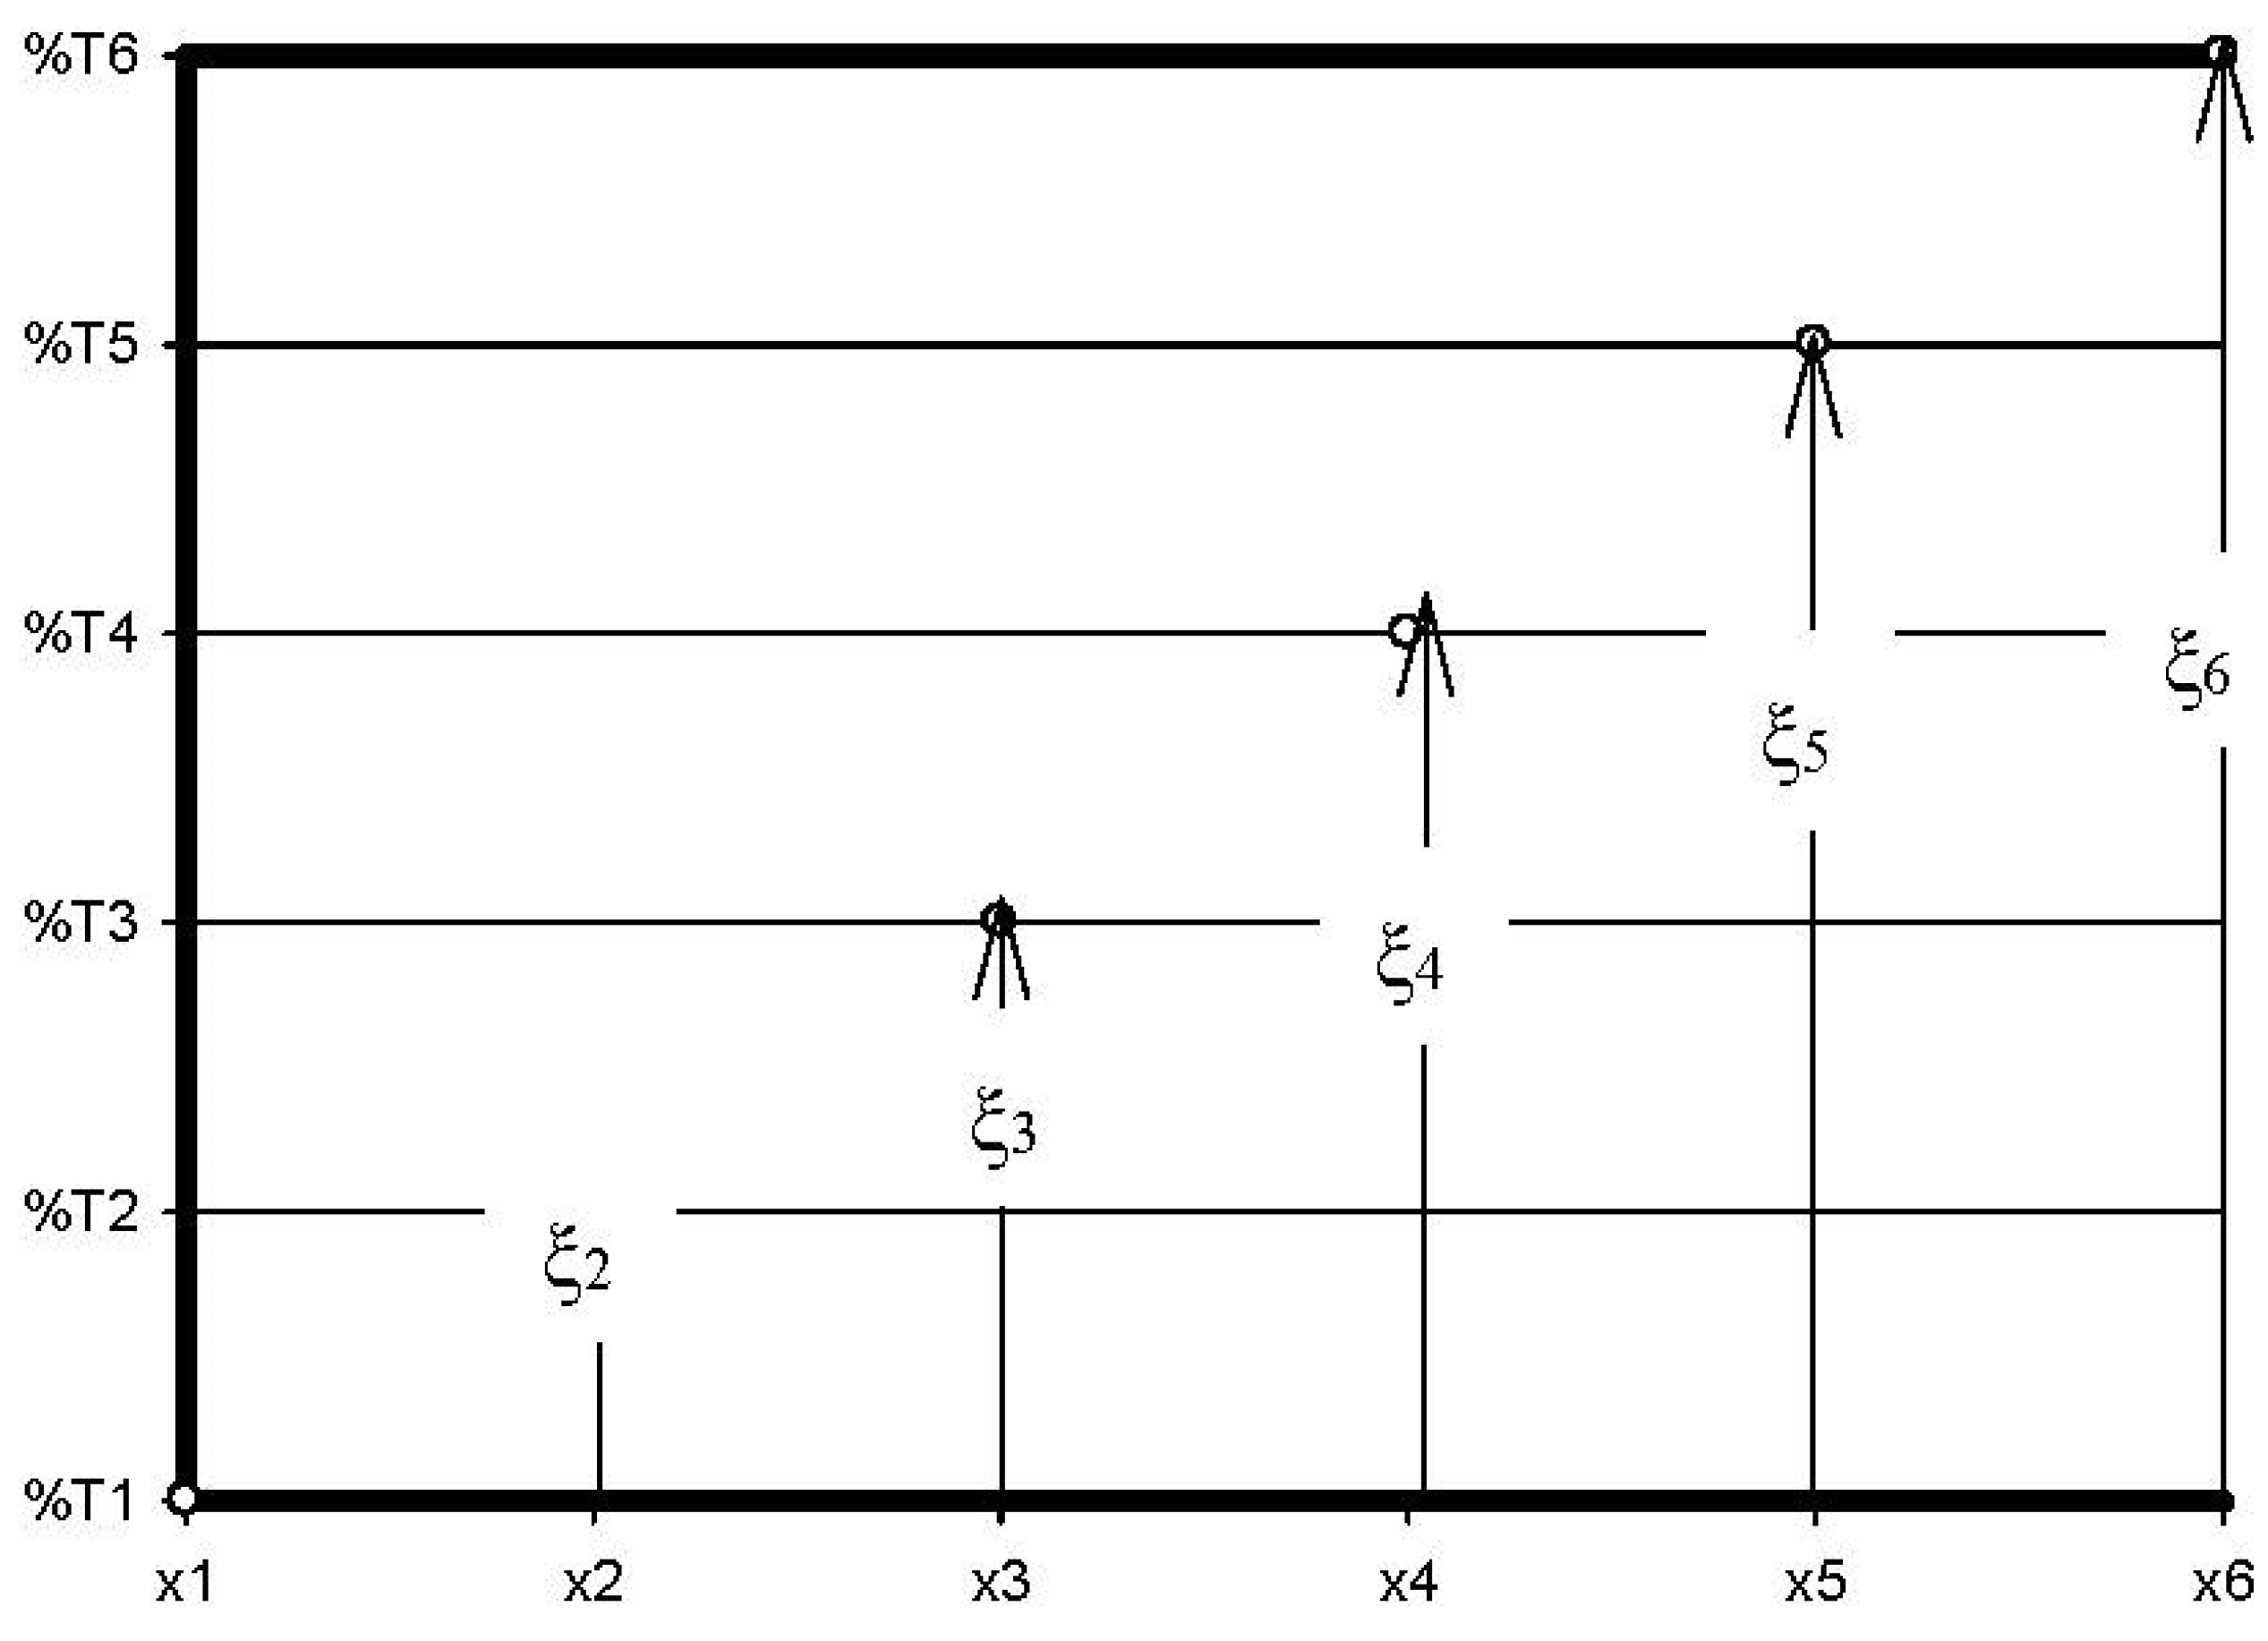
- %Ti is the transmittance of the fresh lubricating oil, in %.
- %Tx is the transmittance of a used lubricating oil at any distance x, in %.
- ξi is the fraction of DA appearing solely due to a specific chemical process, in molfresh lubricant/molDA.

- ri in molfresh lubricant/molDA·km;
- ξi, in molfresh lubricant/molDA;
- x, in km.
3. Experimental
3.1. Sampling
| Car Engine Specifications | Type and Lubricating Oil Grades | Experimental Code | Distance at which Samples were Collected | |
|---|---|---|---|---|
| In miles | In kms | |||
| I-4, 4 Cylinders, 1.8 L | Fully Synthetic 5W-40 | FS_5W | 0 | 0 |
| 1150 | 1851 | |||
| 1380 | 2221 | |||
| 1678 | 2700 | |||
| 1818 | 2926 | |||
| CamPro, 4 Cylinders, 125 gross | Semi Synthetic 15W-50 | SS_15W | 0 | 0 |
| 1483 | 2387 | |||
| 2020 | 3251 | |||
| 2810 | 4522 | |||
| 3175 | 5110 | |||
3.2. Instrumentation
4. Results and Discussion
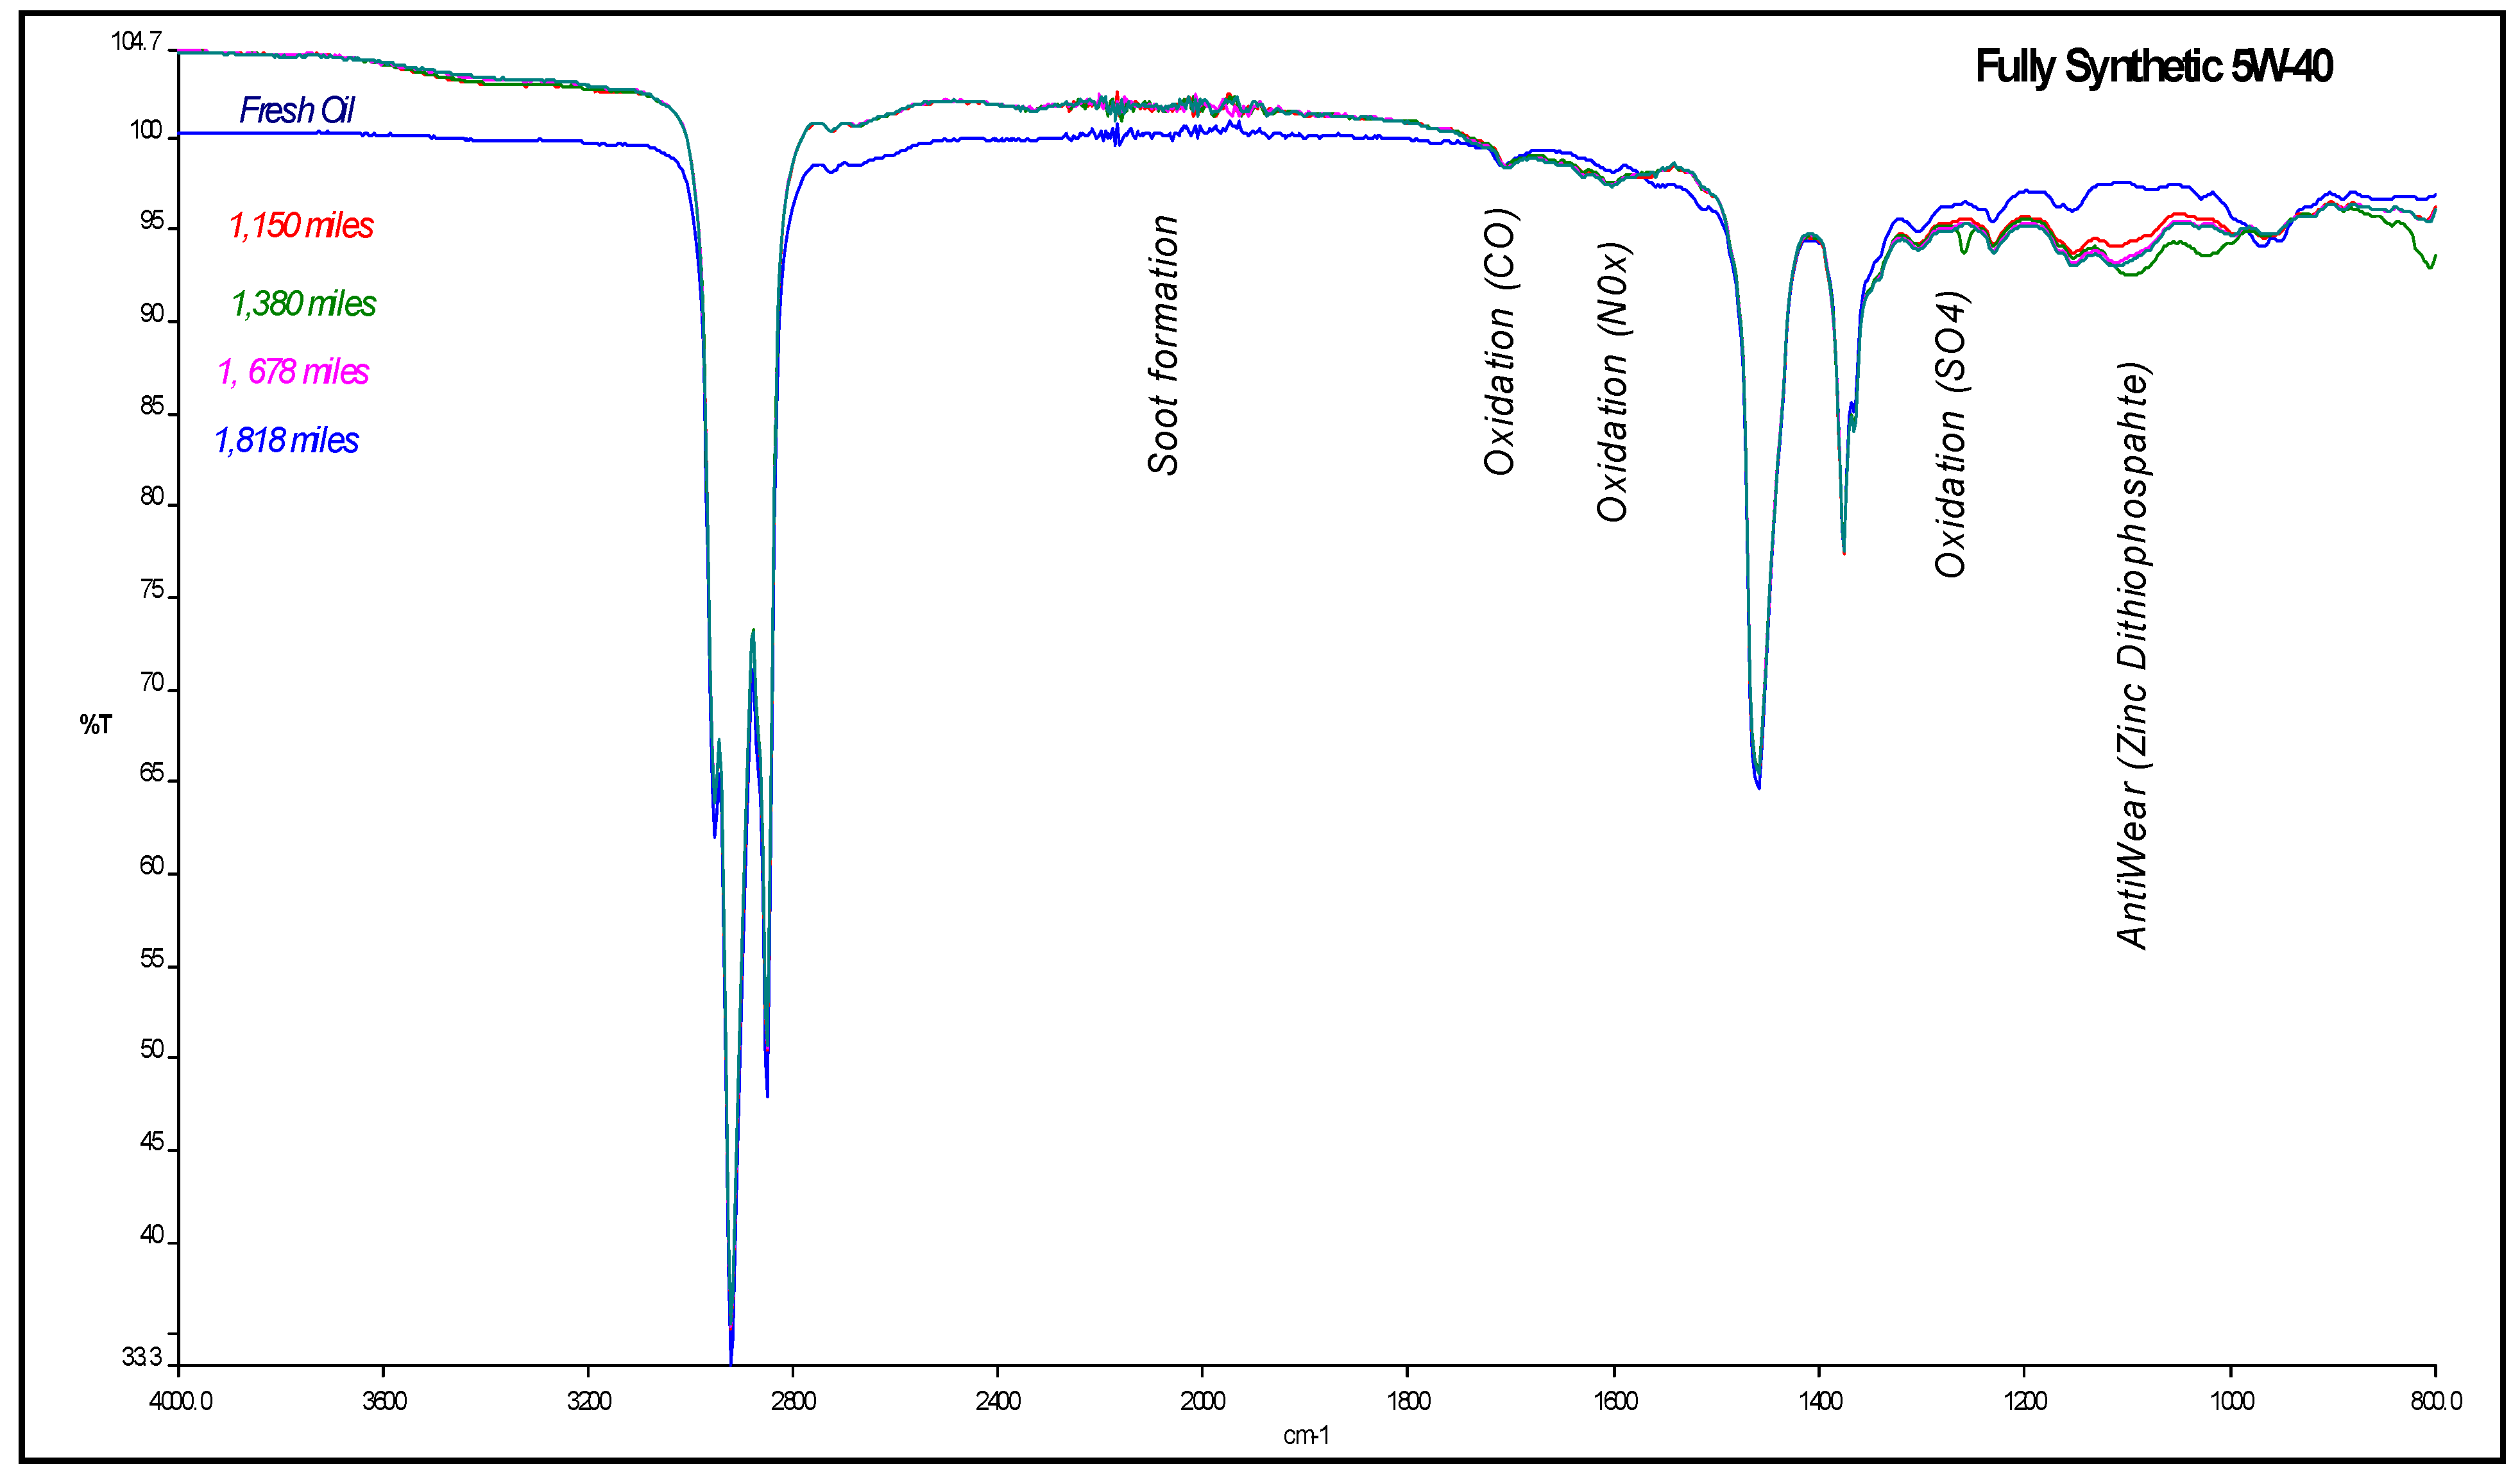
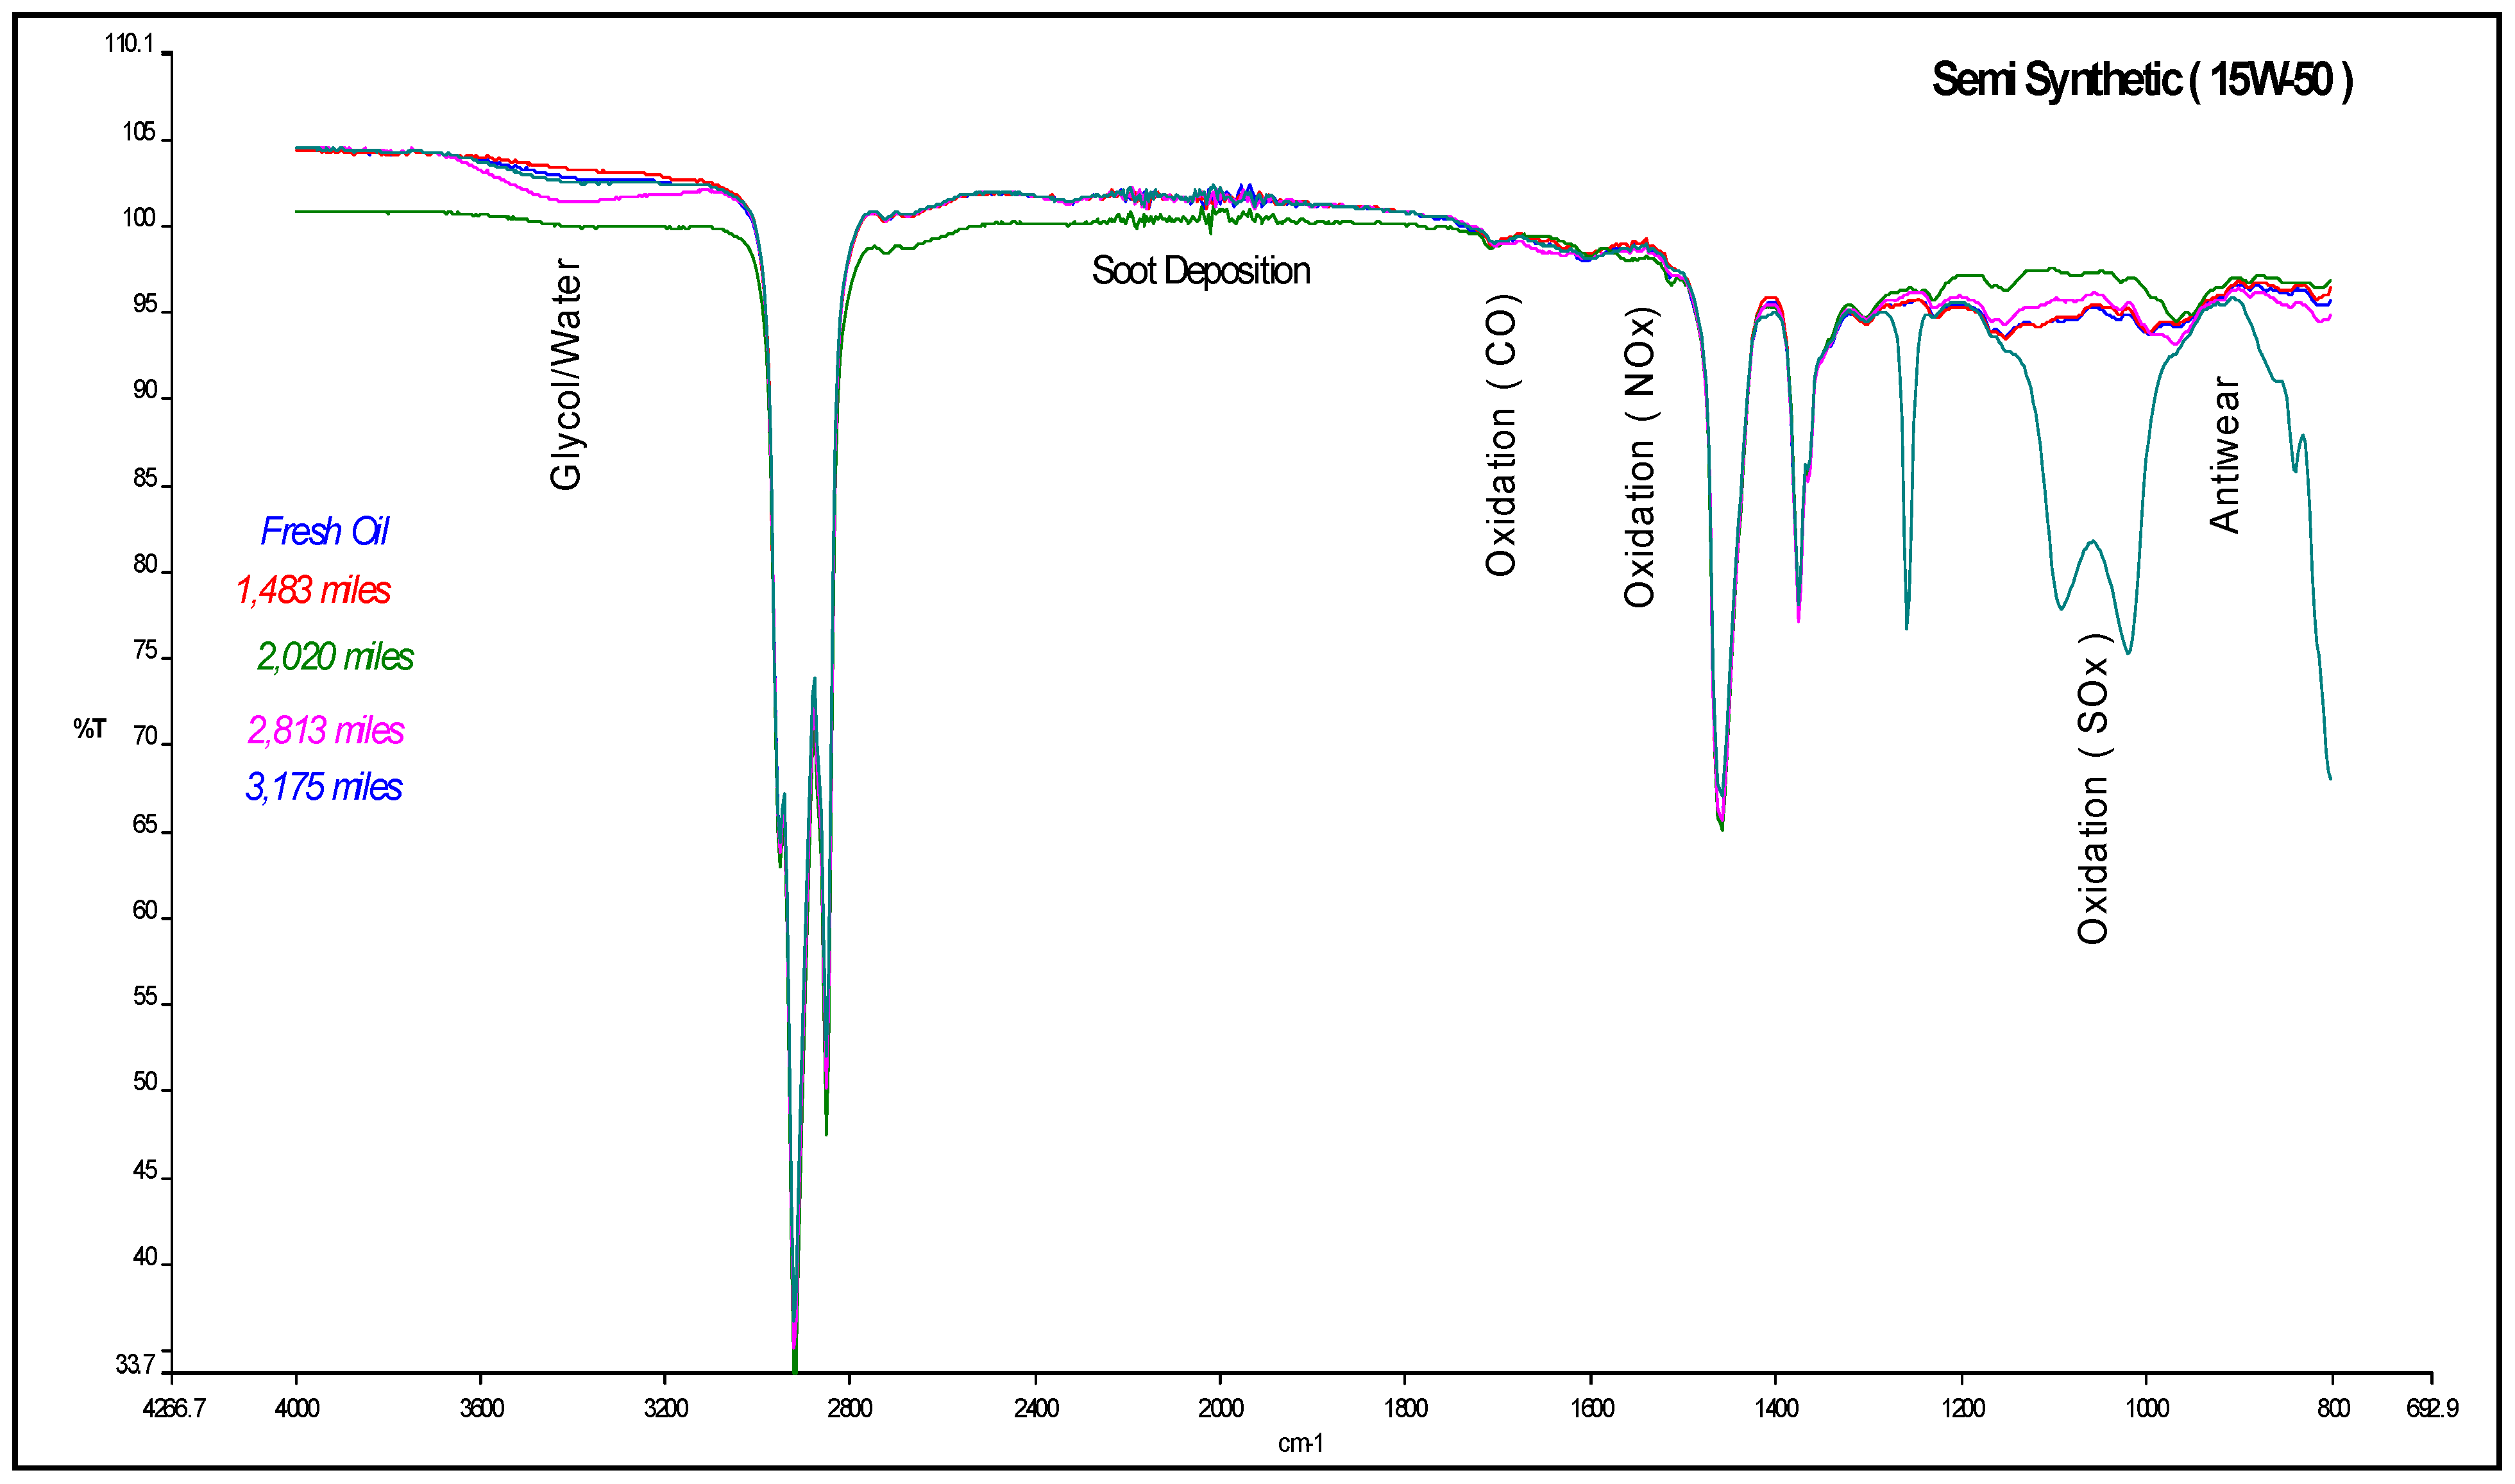
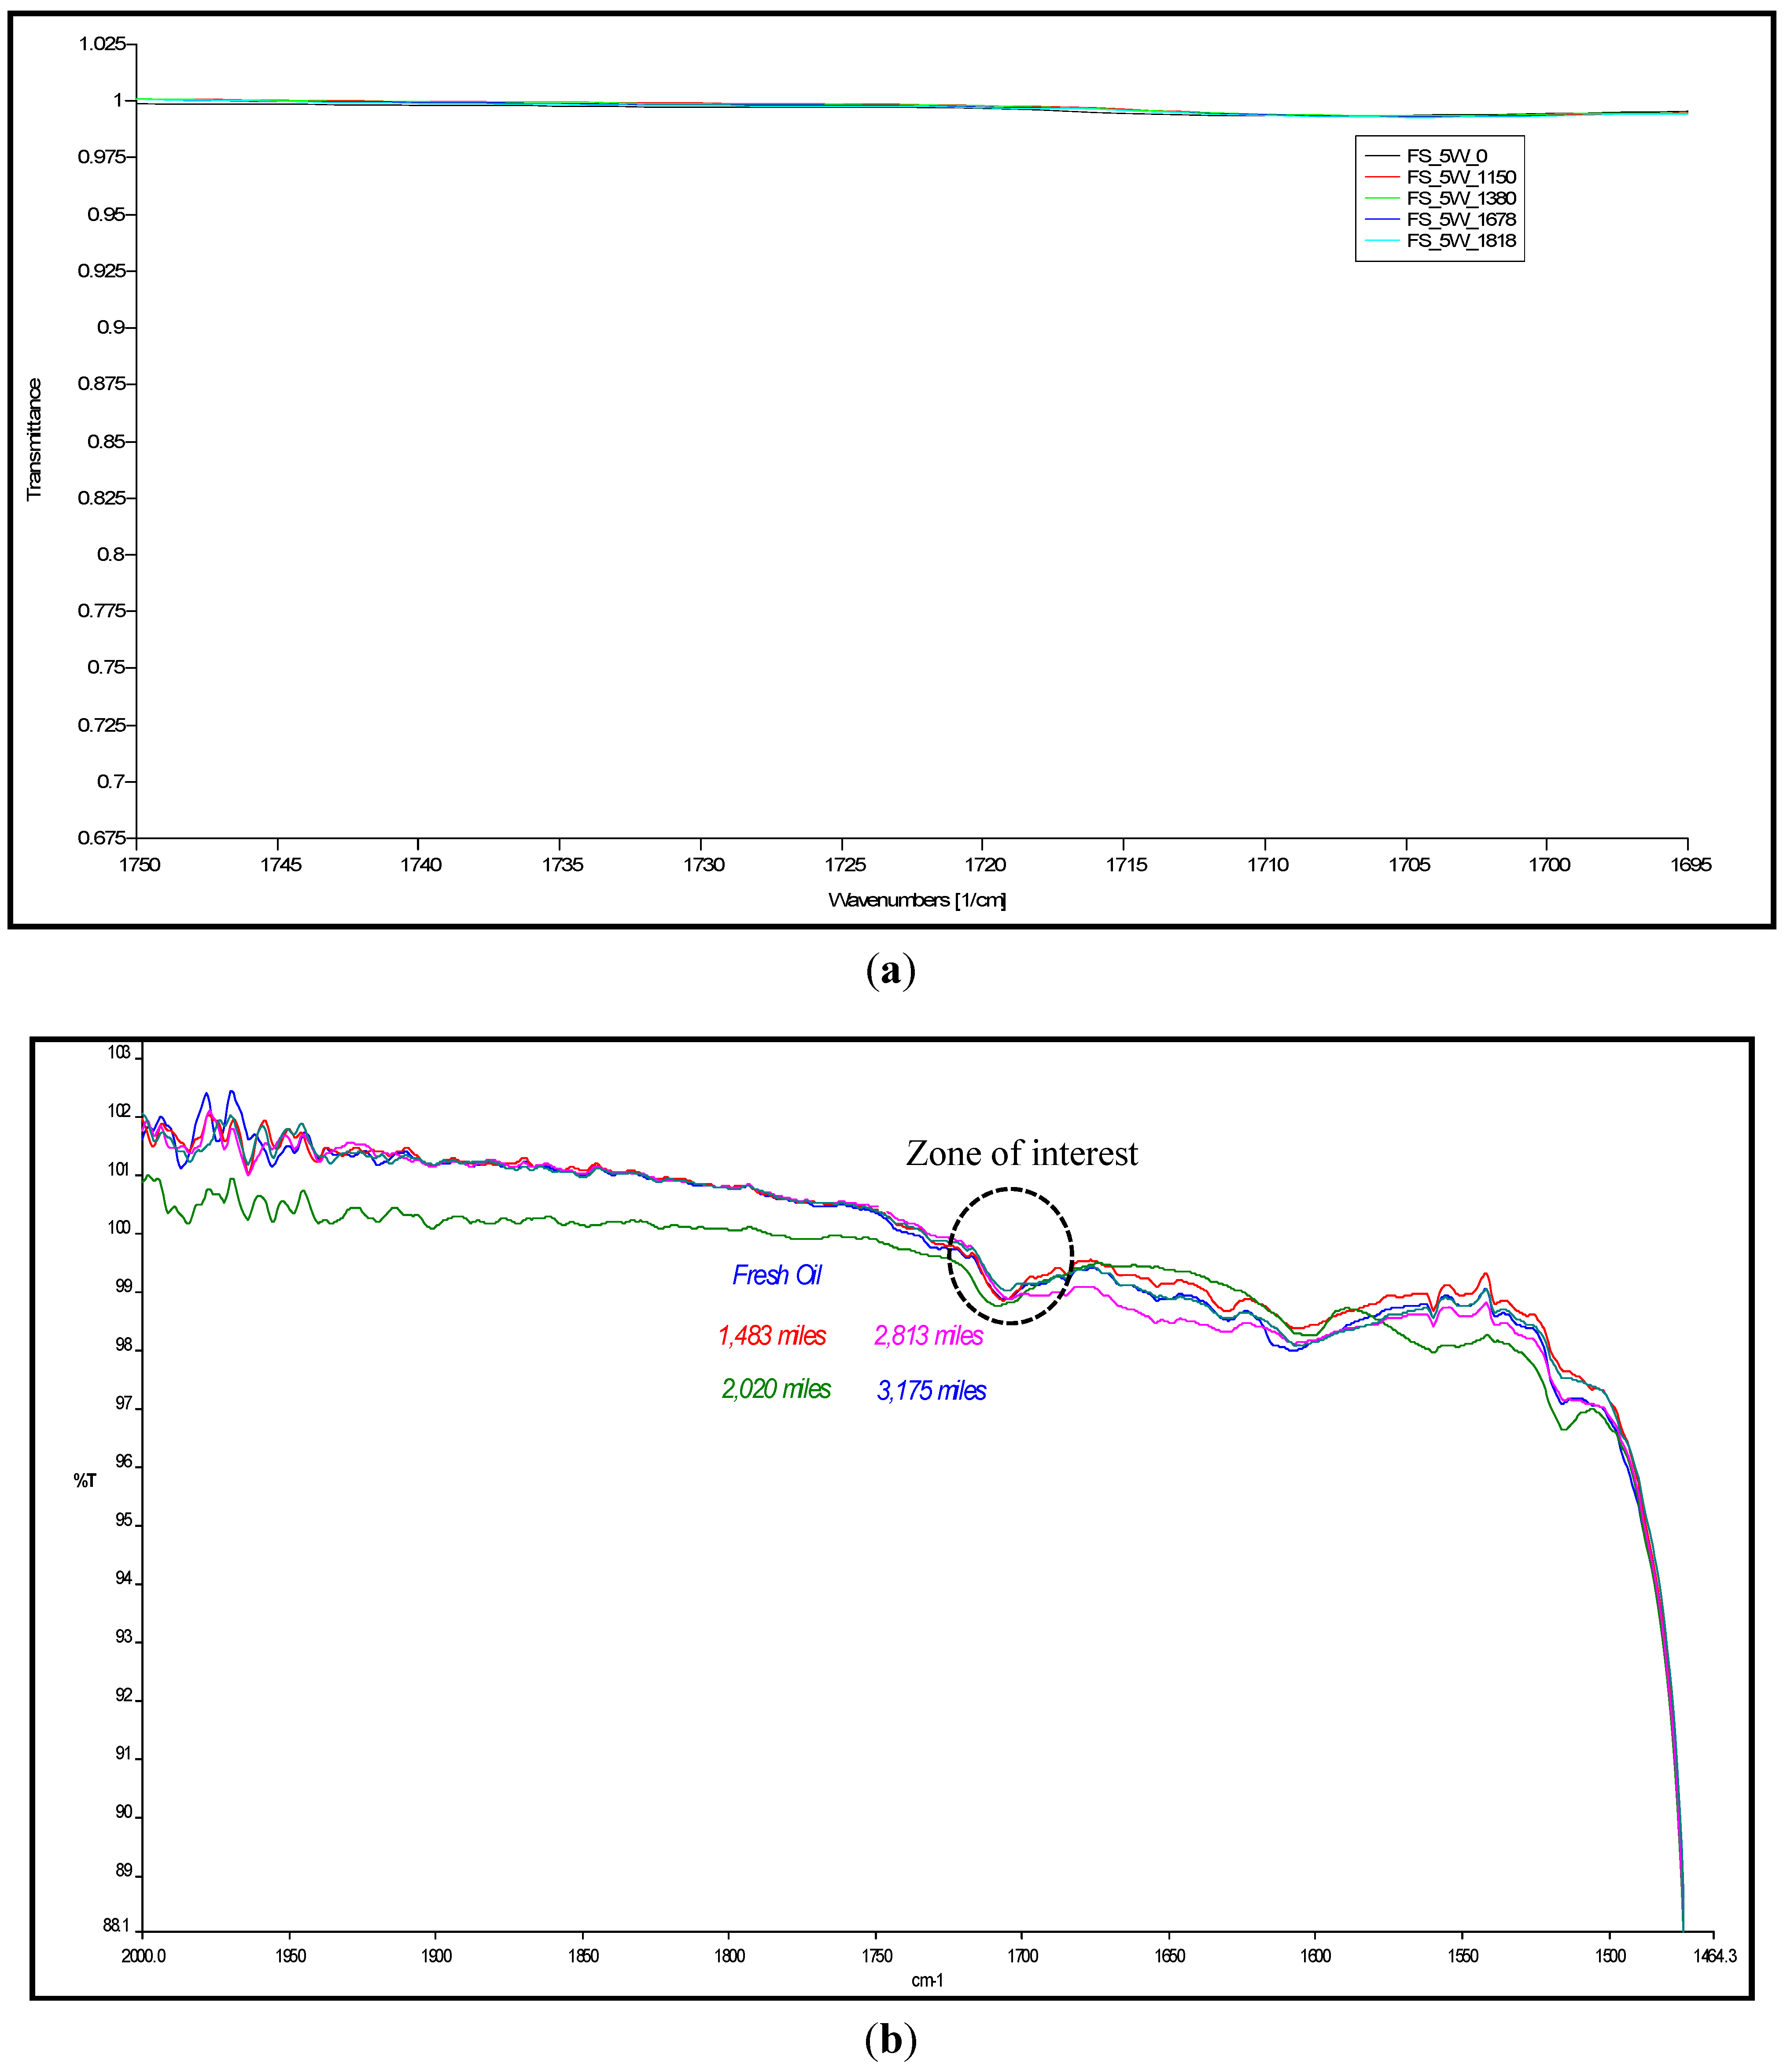
4.1. Carbonyl Oxidation or Carbonylation

| Mileage (in km) | Transmittance (in %) | ξox, (in molfresh lubricant/molDA) | rox, (in ×10−5 molfresh lubricant/molDA·km) |
|---|---|---|---|
| FS_5W | |||
| 0 | 99.48 | 1.0000 | 0.0000 |
| 1851 | 99.46 | 0.0201 | 1.0861 |
| 2221 | 99.43 | 0.0503 | 2.263 |
| 2700 | 99.39 | 0.0905 | 3.3508 |
| 2926 | 99.37 | 0.1106 | 3.7790 |
| SS_15W | |||
| 0 | 98.96 | 1.0000 | 0.0000 |
| 2387 | 98.95 | 0.0101 | 0.4233 |
| 3251 | 98.91 | 0.0505 | 1.5542 |
| 4522 | 98.94 | 0.0202 | 0.4470 |
| 5111 | 99.02 | −0.0606 | −1.1863 |

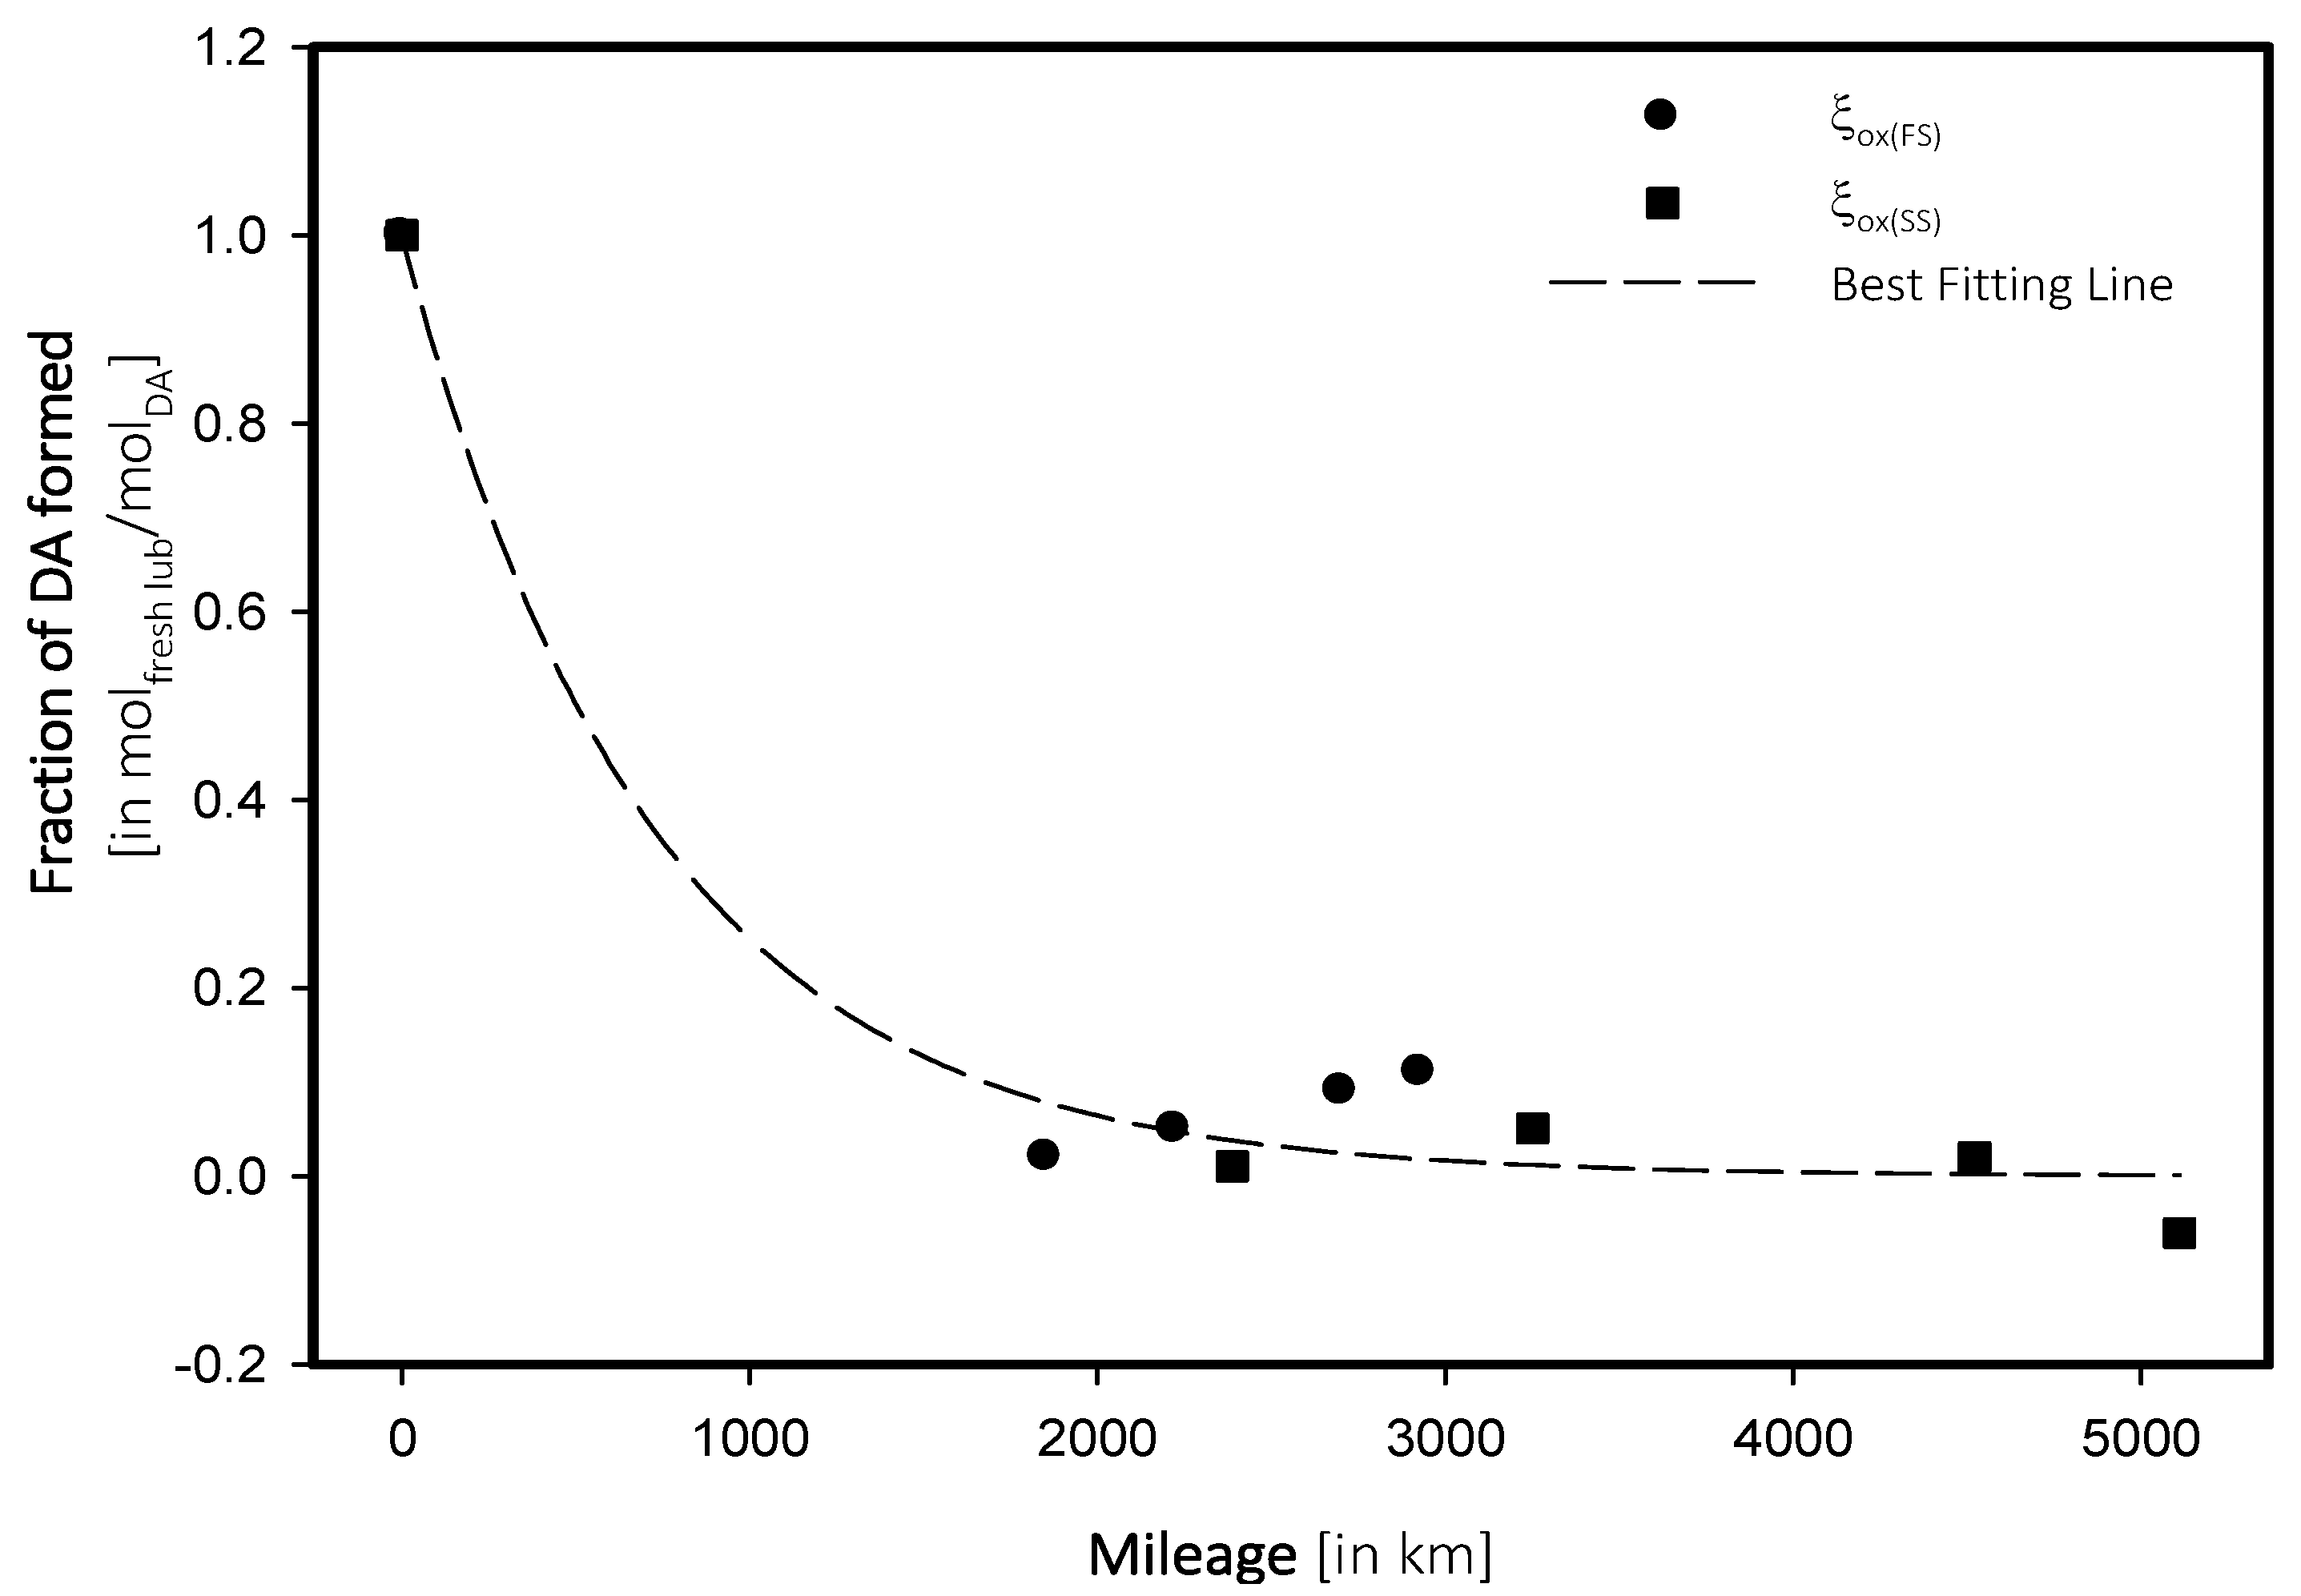
- a and b are constants to be determined, in molfresh lubricant/molDA and 1/km respectively.
- x the distance covered by the engine, in km.
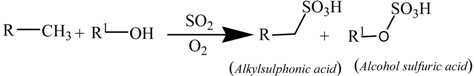
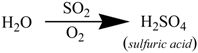
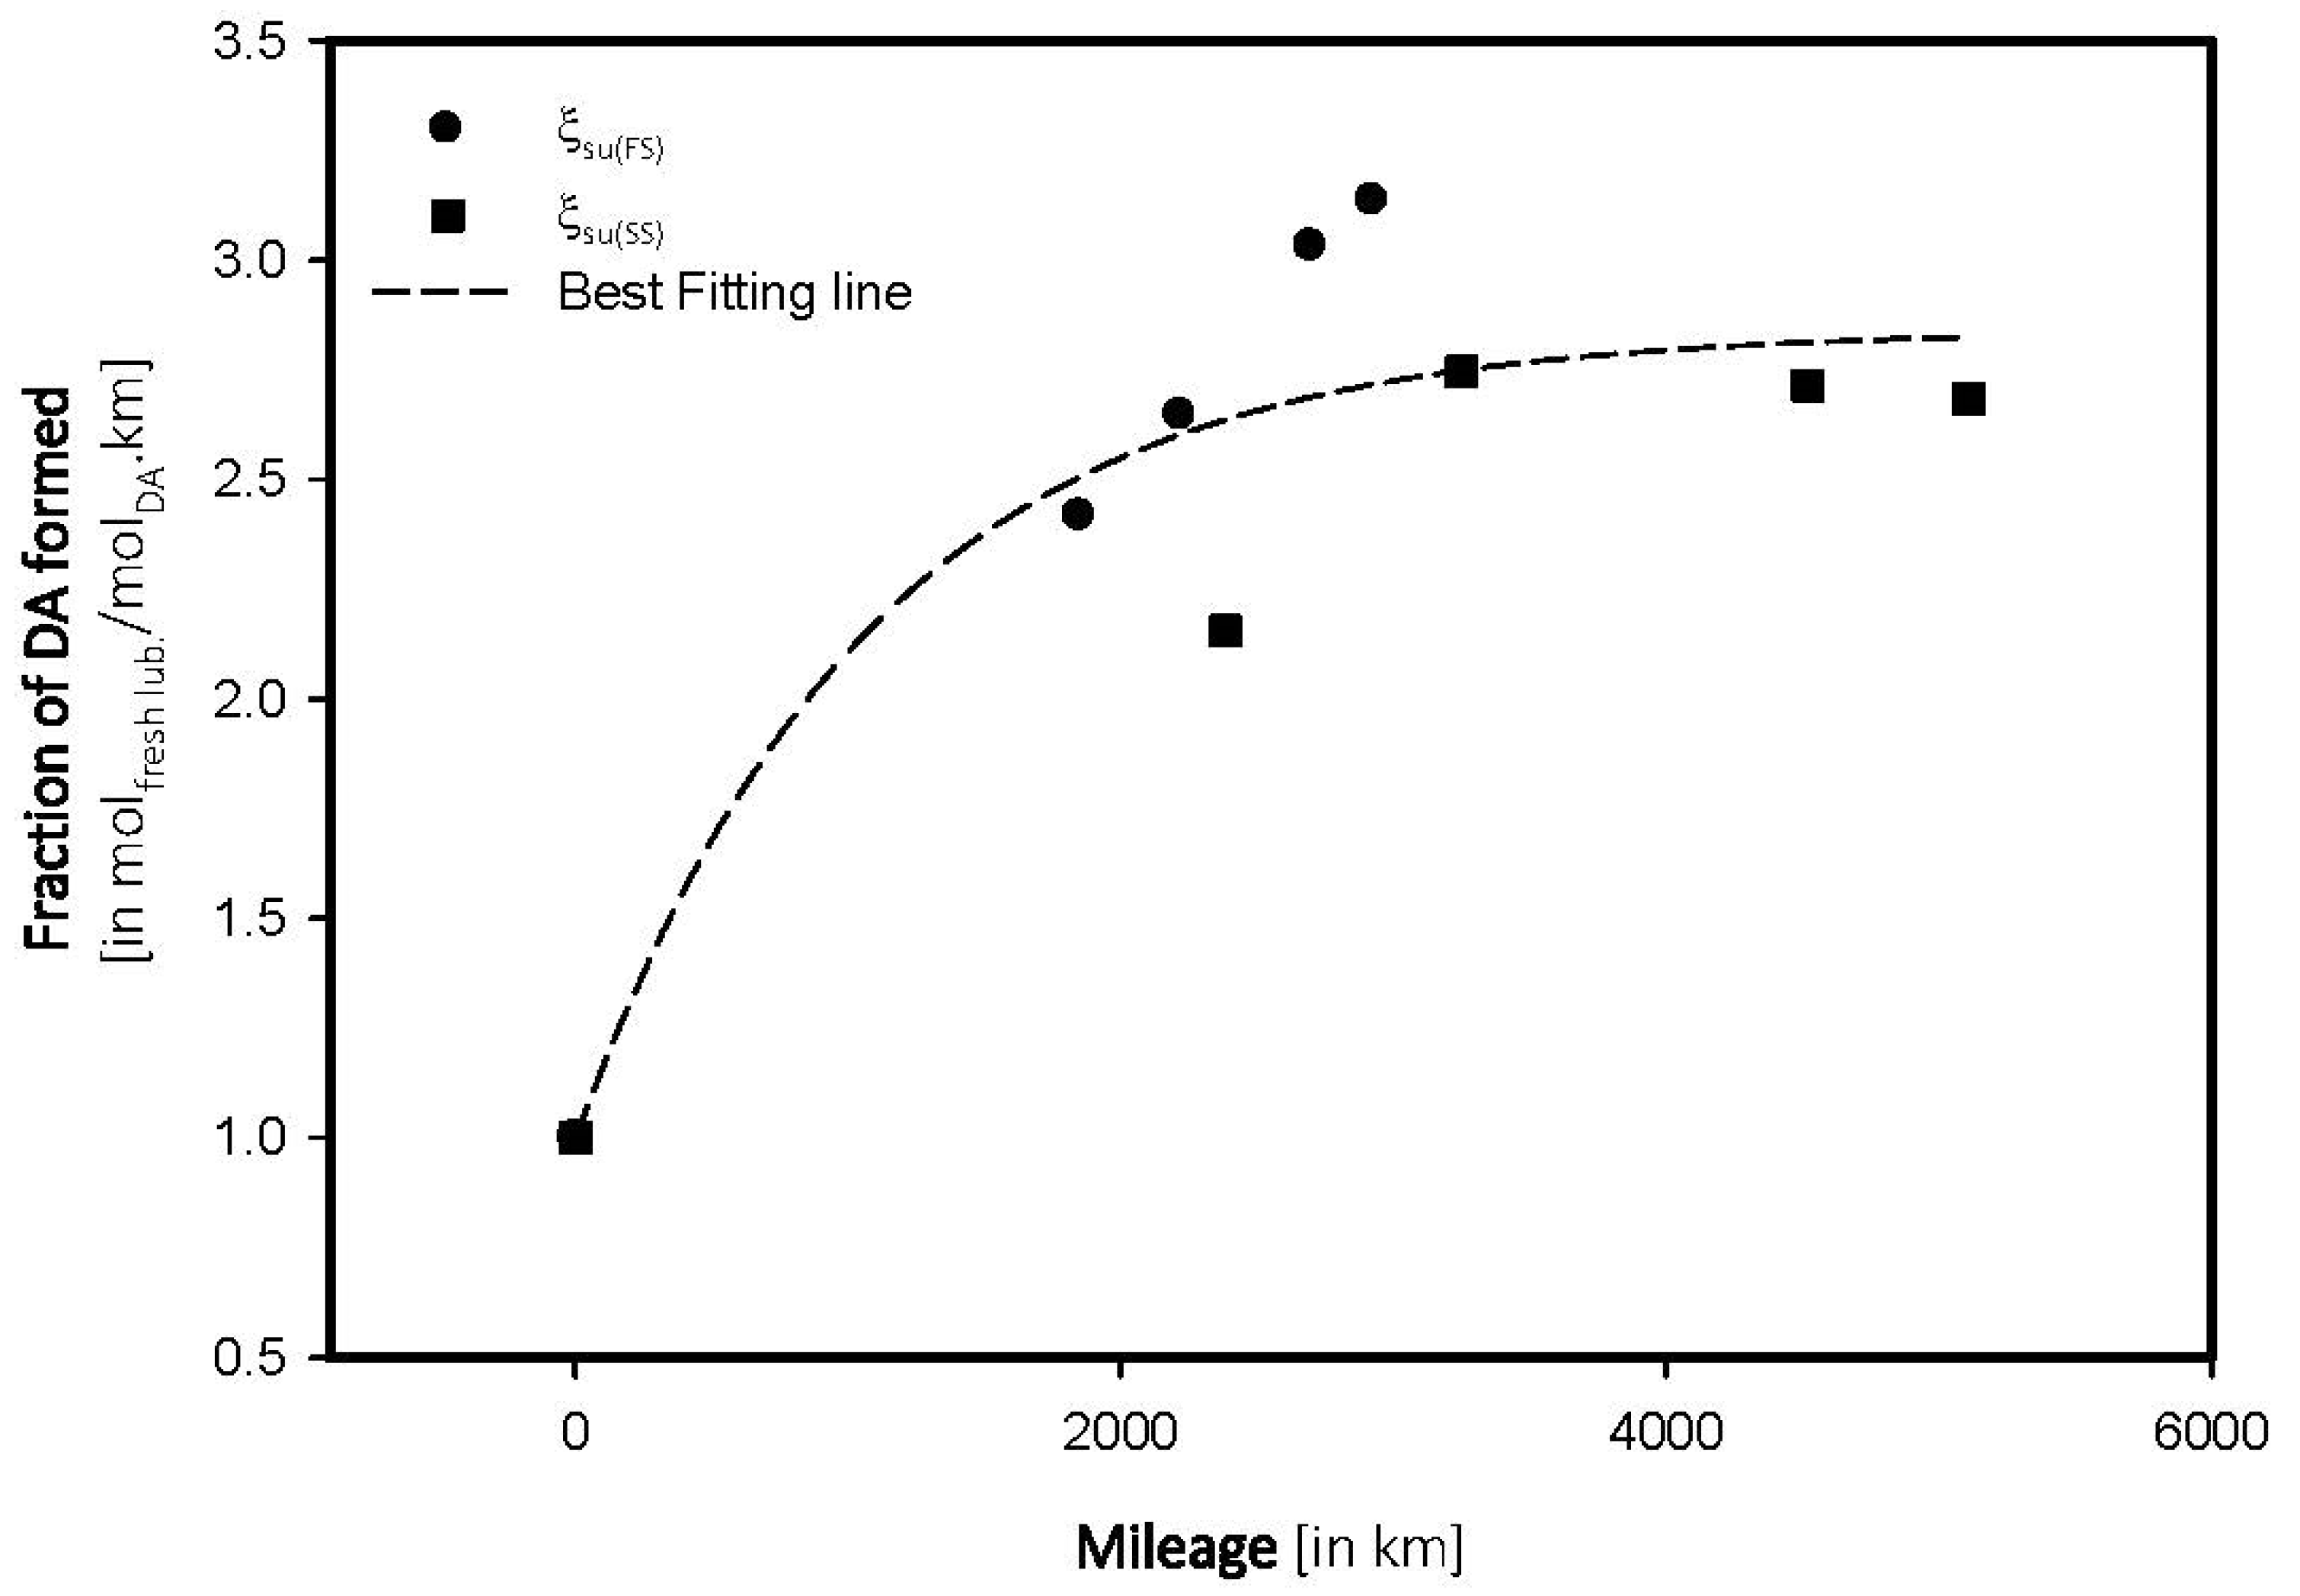
4.2. Sulfate Oxidation: Sulfation and Sulfonation
| Mileage (in kms) | Transmittance (in %) | ξox, (in molfresh lubricant/molDA) | rox, (in ×10−4 molfresh lubricant/molDA·km) |
|---|---|---|---|
| FS_5W | |||
| 0 | 96.04 | 1.0000 | 0.0000 |
| 1851 | 93.72 | 2.4157 | 0.1305 |
| 2221 | 93.50 | 2.6447 | 0.1191 |
| 2700 | 93.13 | 3.0300 | 0.1122 |
| 2926 | 93.03 | 3.1341 | 0.1071 |
| SS_15W | |||
| 0 | 96.52 | 1.0000 | 0.0000 |
| 2387 | 94.44 | 2.1550 | 9.0280 |
| 3251 | 93.87 | 2.7456 | 8.4452 |
| 4522 | 93.90 | 2.7145 | 6.0028 |
| 5111 | 93.93 | 2.6834 | 5.2502 |
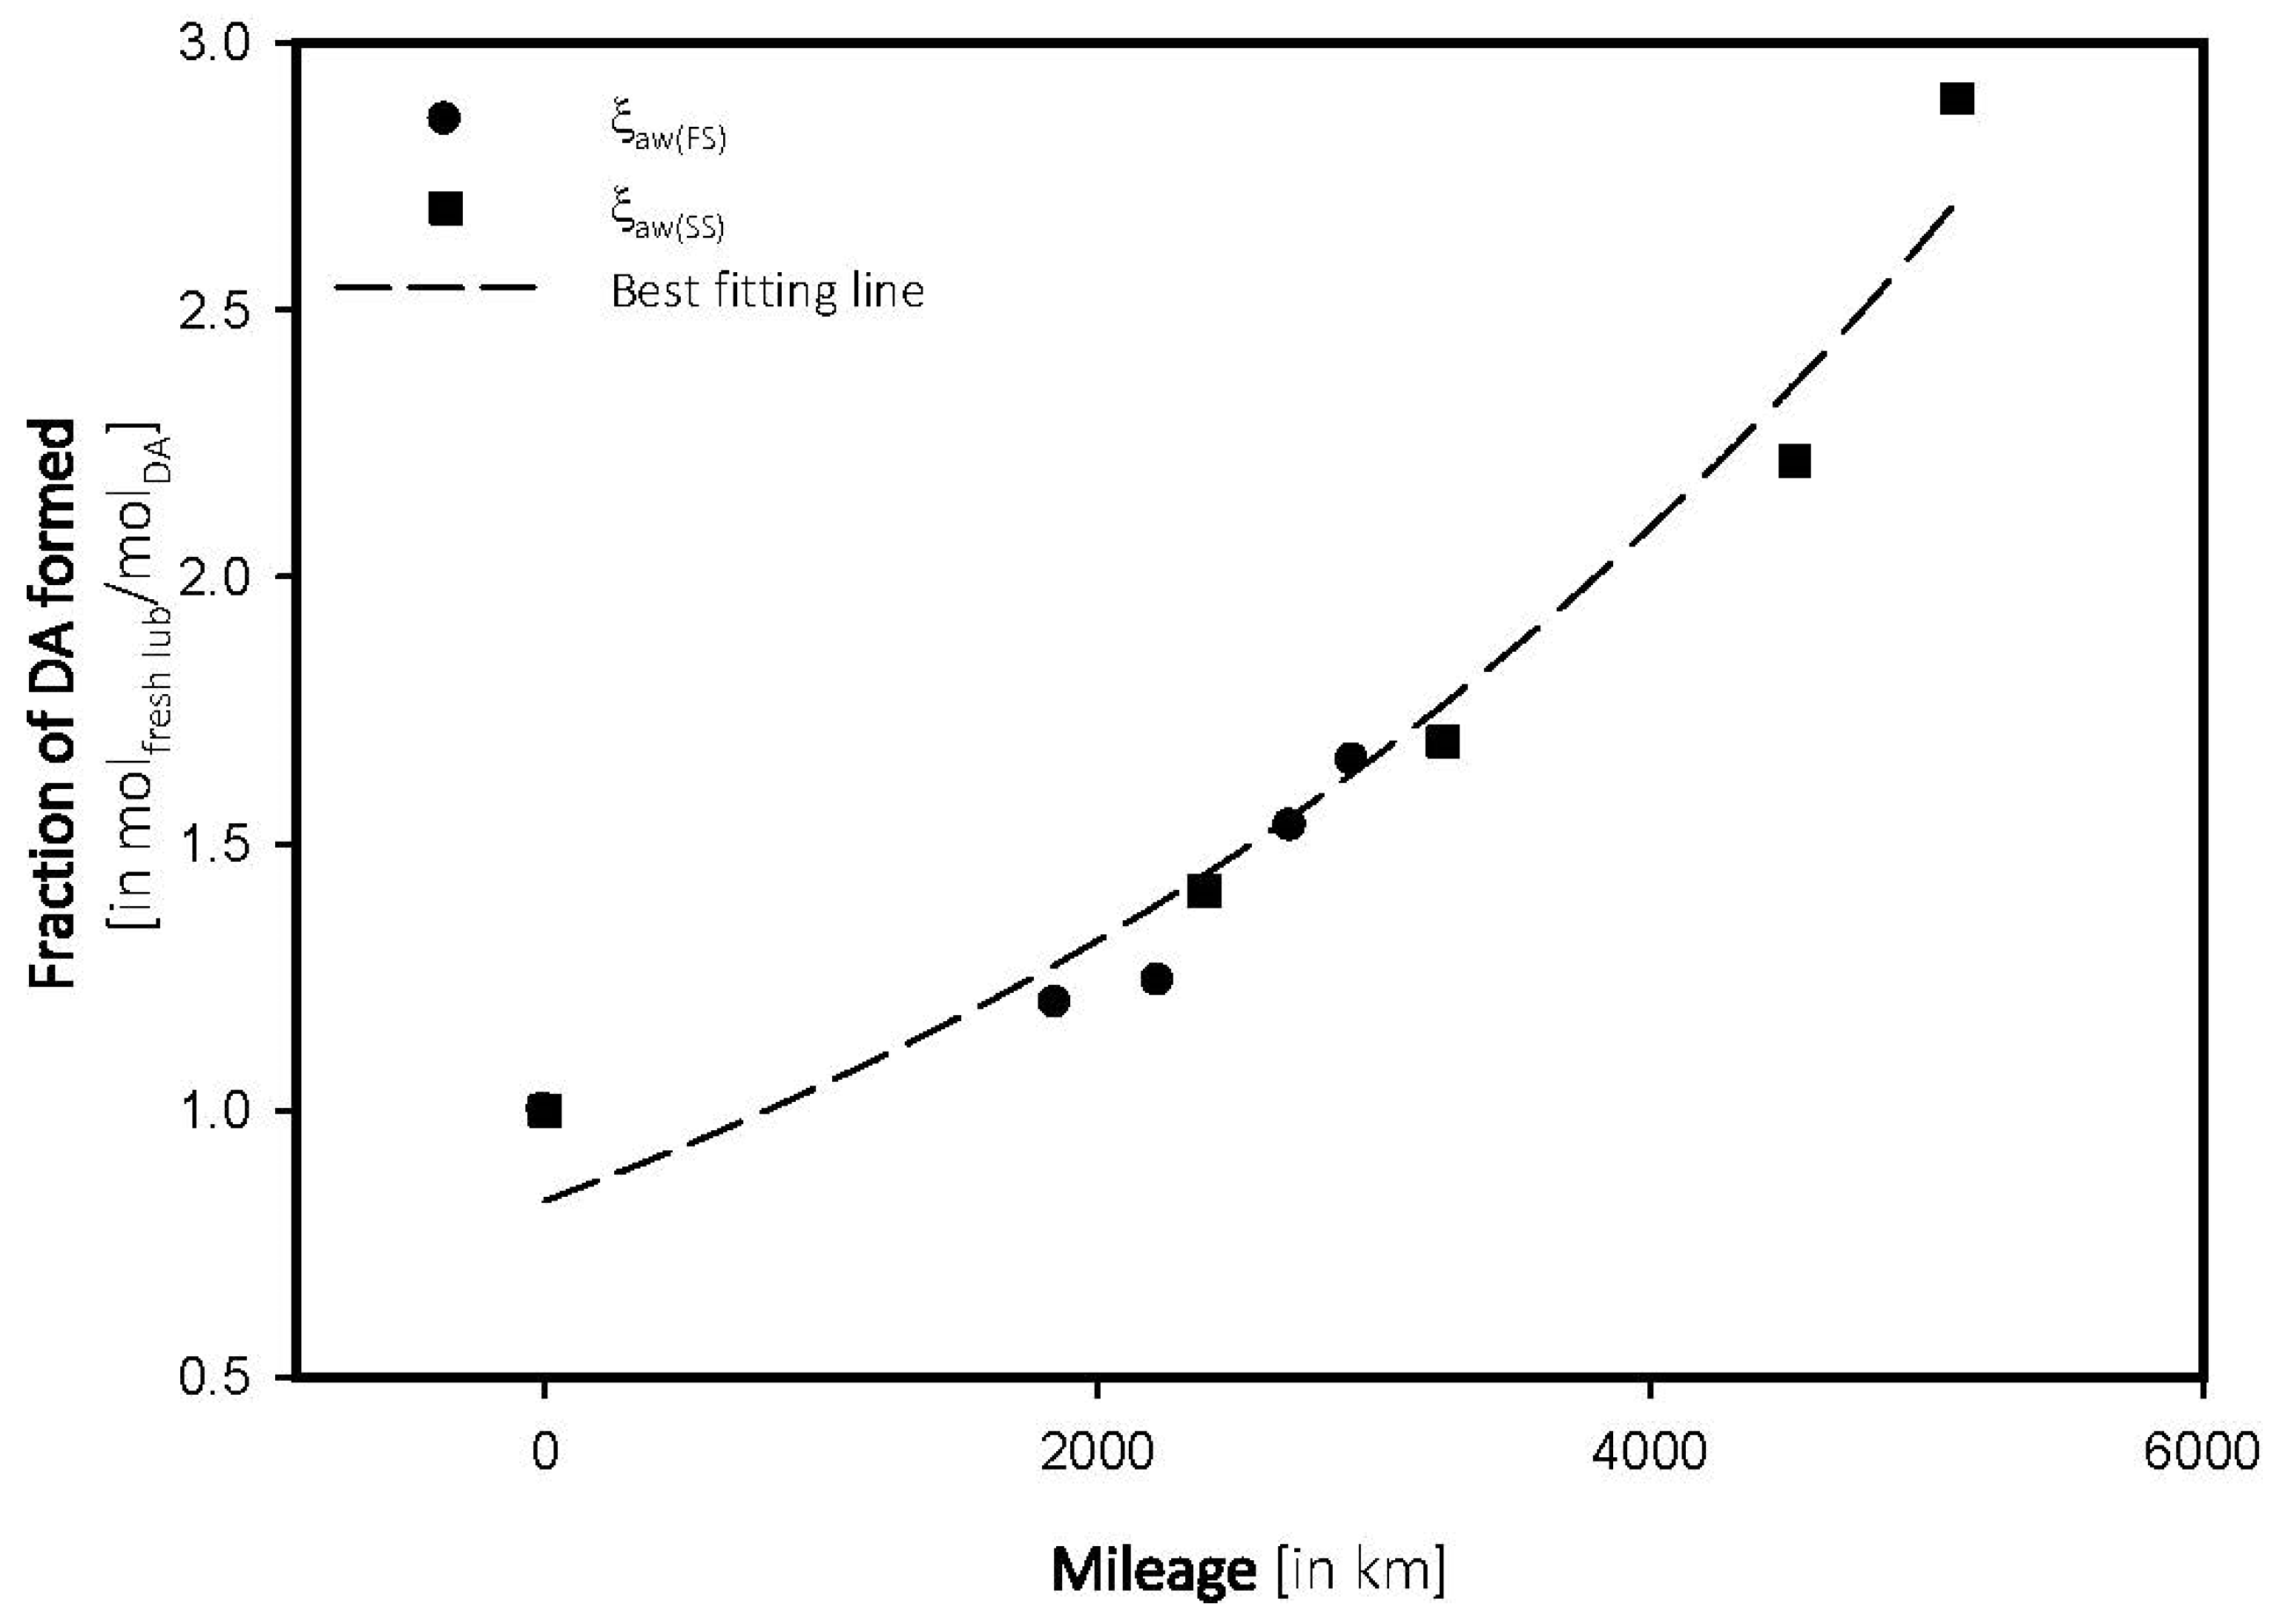
4.3. Antiwear Depletion
| Mileage (in km) | Transmittance (in %) | ξox, (in molfresh lubricant/molDA) | rox, (in ×10−4 molfresh lubricant/molDA·km) |
|---|---|---|---|
| FS_5W | |||
| 0 | 96.68 | 1.0000 | 0.0000 |
| 1851 | 95.52 | 1.1998 | 6.4821 |
| 2221 | 95.48 | 1.2412 | 5.5885 |
| 2700 | 95.20 | 1.5308 | 5.6696 |
| 2926 | 95.08 | 1.6549 | 5.6558 |
| SS_15W | |||
| 0 | 97.02 | 1.0000 | 0.0000 |
| 2387 | 95.65 | 1.4121 | 5.9158 |
| 3251 | 95.38 | 1.6904 | 5.1996 |
| 4522 | 94.87 | 2.2160 | 4.9005 |
| 5111 | 94.21 | 2.8963 | 5.1996 |
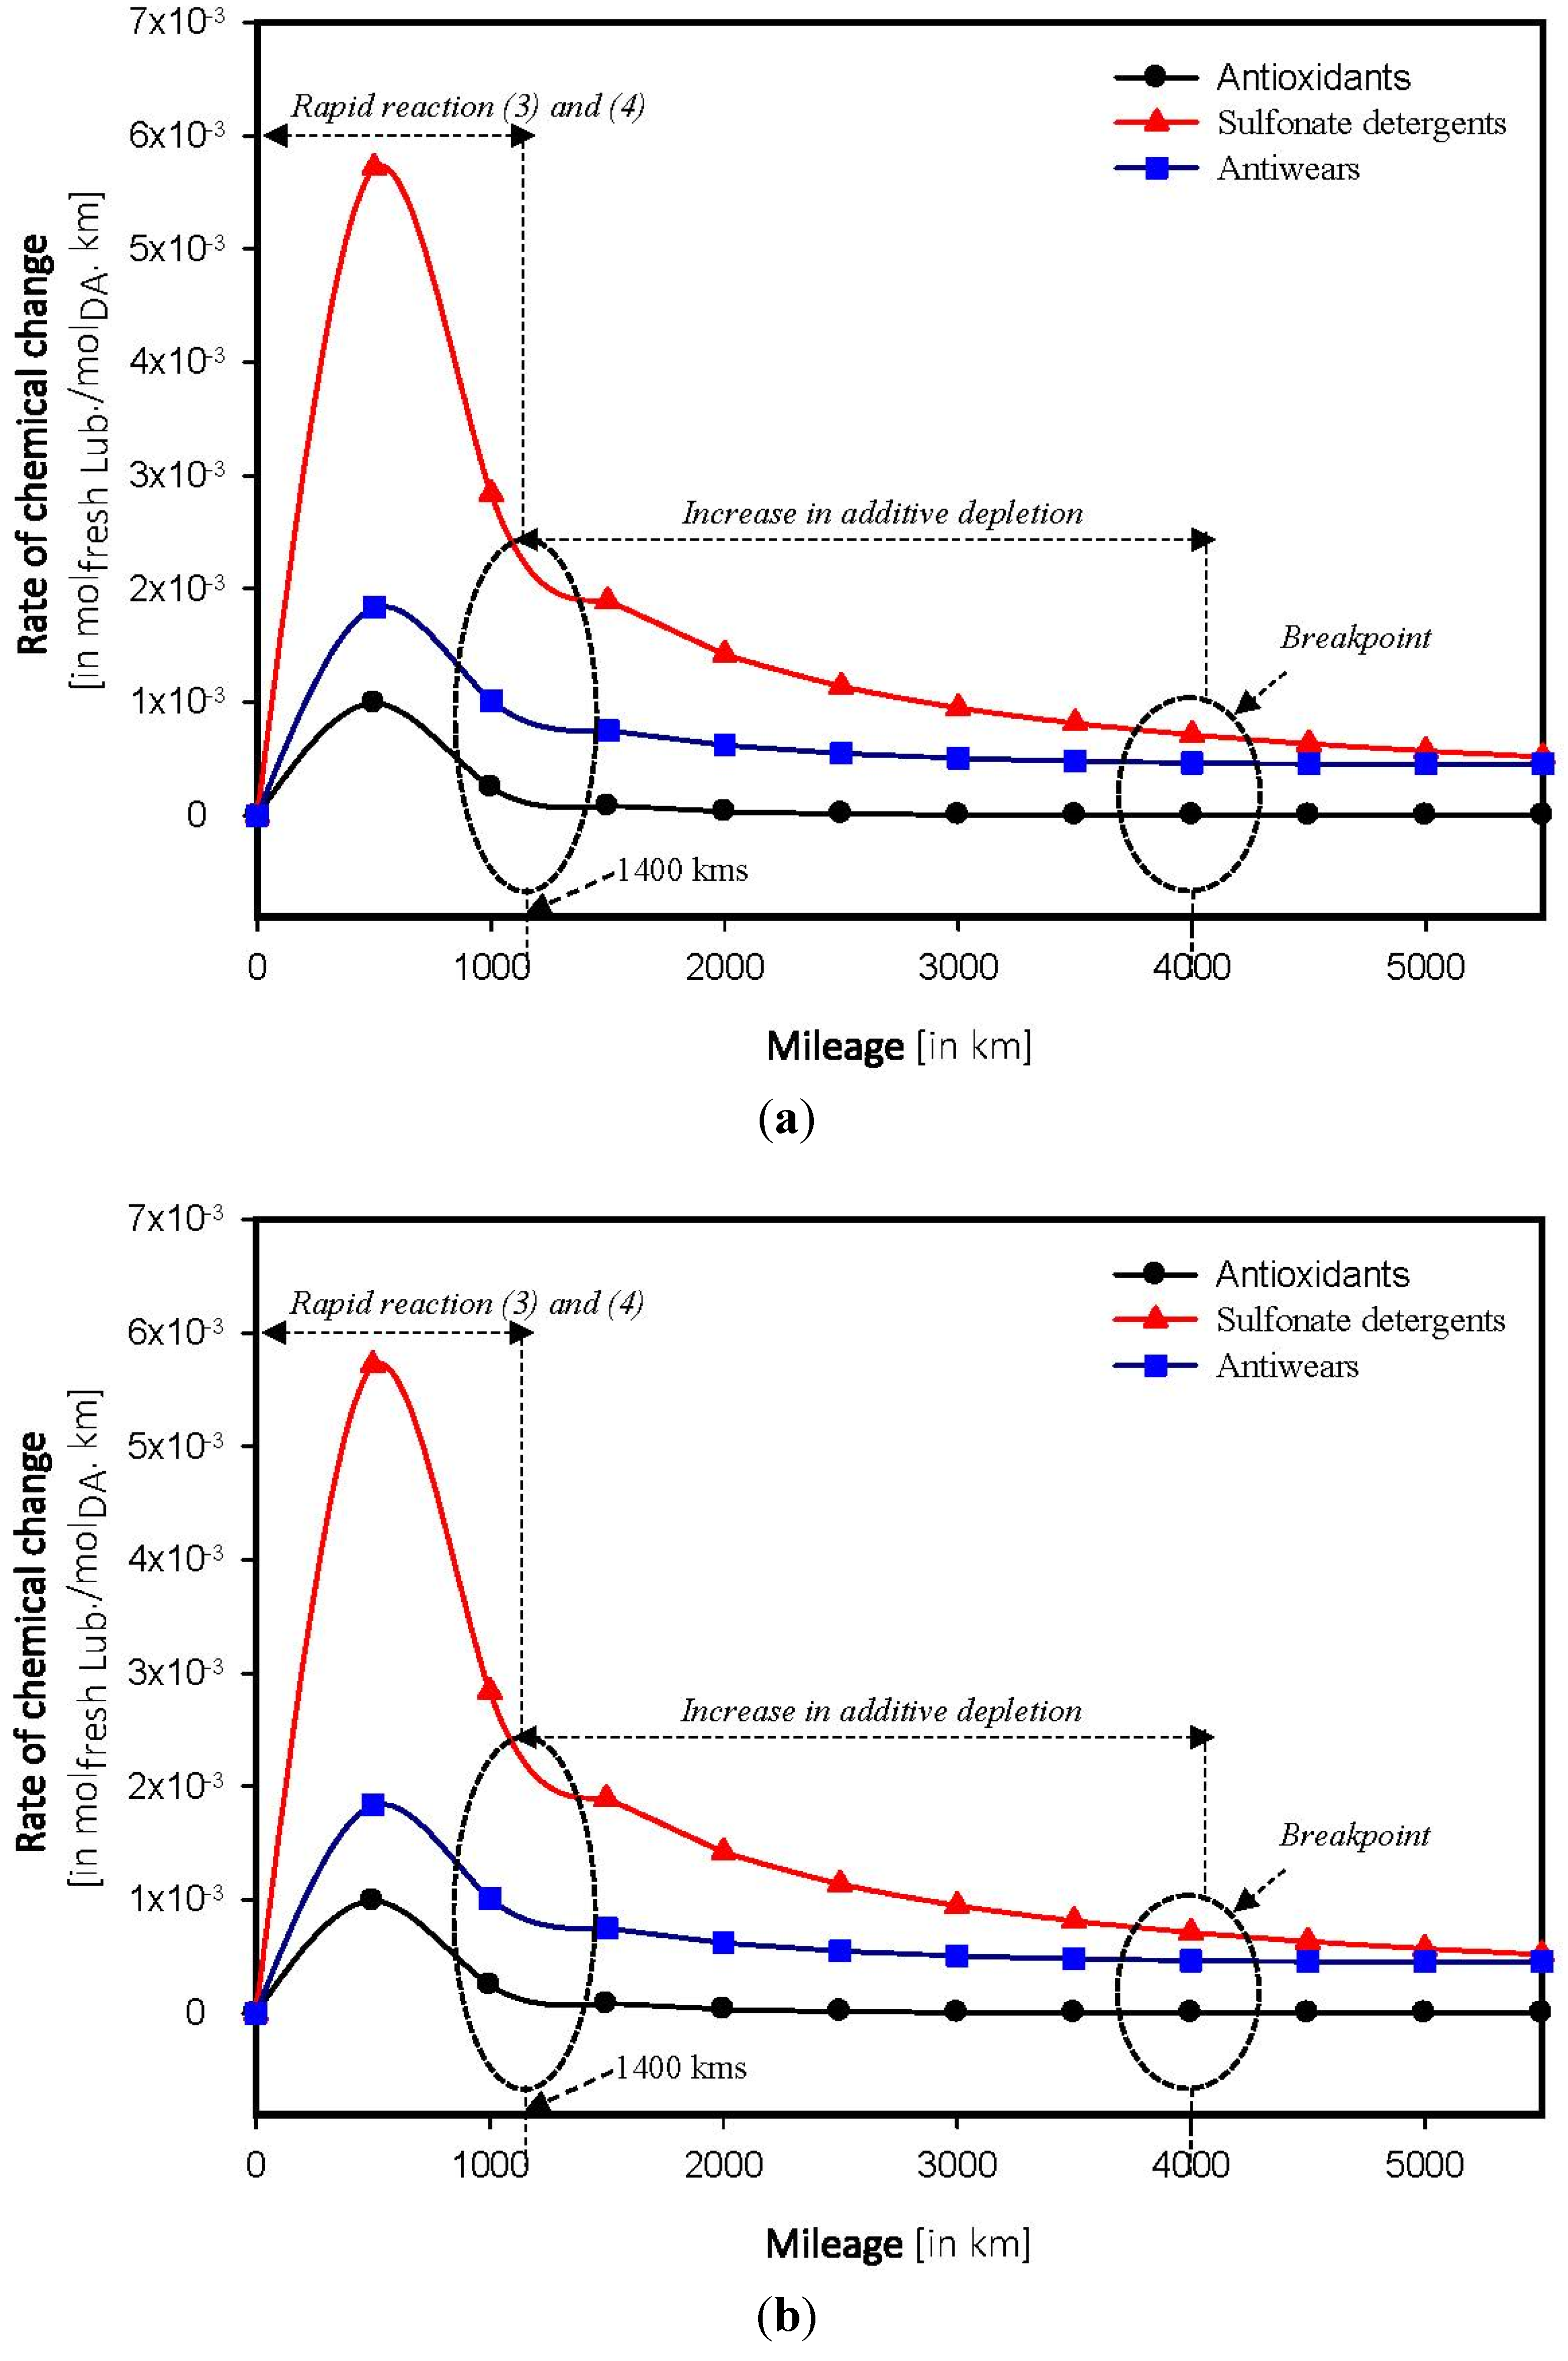
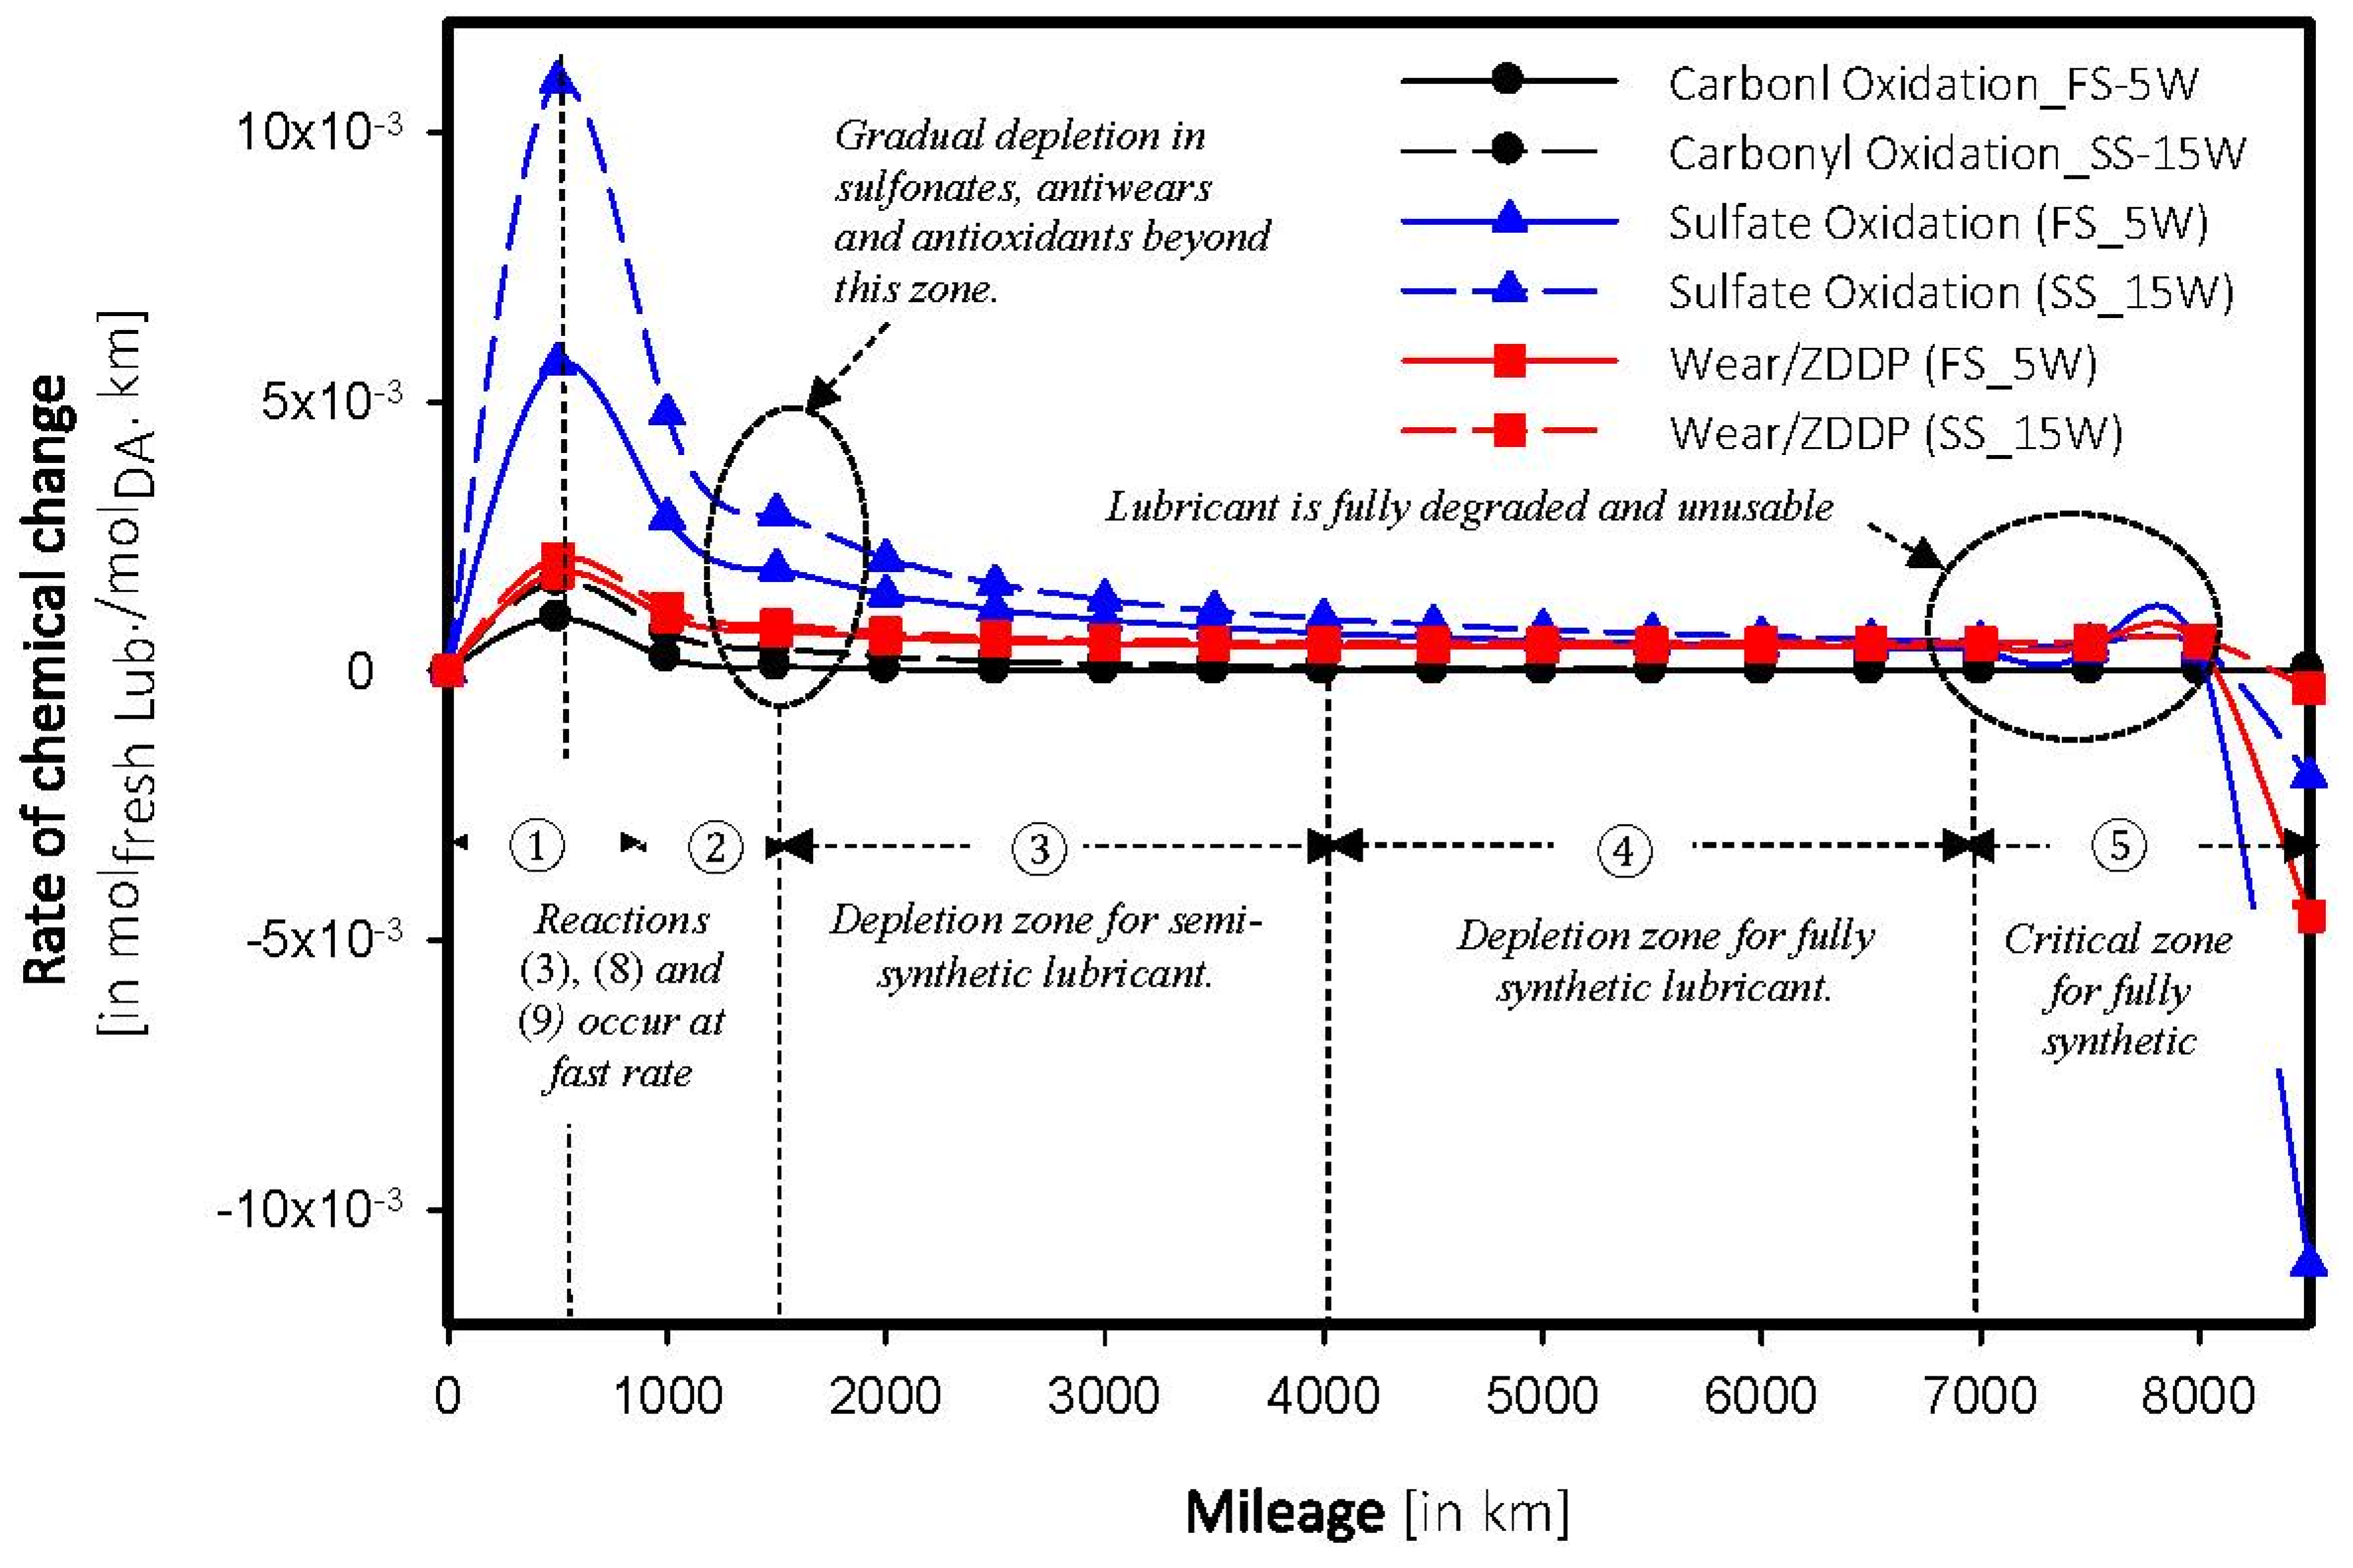
4.4. Determination of Breakpoint
4.5. Forecasting of Depletion in Additives


5. Conclusions
- Depletion in additives within a car engine follows an exponential regression rather than polynomial.
- Chemical breakpoint—distance above which the lubricant starts to degrade, depends on the composition of the base stock. The breakpoint was found to be two times higher in a fully synthetic model than a semi synthetic model.
- Sulfate oxidation and wear poisoning were found to be the primary sources for lubricating oils.
Acknowledgments
Conflicts of Interest
References
- Mang, T.; Dresel, W. Lubricants and Lubrication, 2nd ed.; WILEY-VCH Verlag GmbH & Co.: Weinheim, Germany, 2007; pp. 2–7. [Google Scholar]
- U.S. Army Corps of Engineers. Engineering and Design Lubricants and Hydraulic Fluids; EM 1110-2-1424; Department of the Army: Washington, DC, USA, 1999; pp. 1–10. [Google Scholar]
- Mann, D. Chemical Breakdown and Deterioration of Motor Oil during Use. In A Comprehensive Technical Handbook on Motor Oil, Lubrication and Filtration, Motor Oils and Engine Lubrication ed.; Motor Oil Engineers, L.L.C: USA, 2008; pp. 5–7. [Google Scholar]
- Hsu, S.M.; Zhang, J.; Jin, Z. The nature and origin of tribochemistry. Tribol. Lett. 2002, 13, 131–139. [Google Scholar]
- Stavinoha, L.L.; Wright, B.R. Spectrometric analysis of used oil. SAE Tech. Pap. 1969. [Google Scholar] [CrossRef]
- Garry, M.C.; Bowman, J. FT-IR Analysis of Used Lubricating Oils—General Considerations; 50731; Thermo Fisher Scientific: Madison, WI, USA, 2007. [Google Scholar]
- Gómez-Fernandez, J.C.; Villalaín, J. The use of FT-IR for quantitative studies of the apparent pKa of lipid carboxyl groups and the dehydration degree of the phosphate group of phospholipids. Chem. Phys. Lipids 1998, 96, 41–52. [Google Scholar] [CrossRef] [PubMed]
- Borin, A.; Poppi, R.J. Application of mid infrared spectroscopy and iPLS for the quantification of contaminants in lubricating oil. Vib. Spectrosc. 2005, 37, 27–32. [Google Scholar] [CrossRef]
- Van de Voort, F.R.; Sedman, J.; Yaylayan, V.; Saint Laurent, C. Determination of Acid Number and Base Number in Lubricants by Fourier Transform Infrared Spectroscopy. Appl. Spectrosc. 2003, 57, 1425–1431. [Google Scholar]
- Van de Voort, F.R.; Sedman, J.; Cocciardi, R.A.; Puncuk, D. FTIR Condition Monitoring of In-Service Lubricants: Ongoing Developments and Future Perspective. Tribol. Trans. 2006, 49, 410–418. [Google Scholar] [CrossRef]
- Kuhnen, S.; Ogliari, J.B.; Dias, P.F.; Boffo, E.F.; Correia, I.; Ferreira, A.G.; Delgadillo, I.; Maraschin, M. ATR-FTIR spectroscopy and chemometric analysis applied to discrimination of landrace maize flours produced in southern Brazil. Int. J. Food Sci. Technol. 2010, 45, 1673–1681. [Google Scholar] [CrossRef]
- Calvo, N.L.; Maggio, R.M.; Kaufman, T.S. A dynamic thermal ATR-FTIR/chemometric approach to the analysis of polymorphic interconversions. Cimetidine as a model drug. J. Pharm. Biomed. Anal. 2014, 92, 90–97. [Google Scholar] [CrossRef] [PubMed]
- Basu, A.; Berndorfer, A.; Buelna, C.; Campbell, J.; Ismail, K.; Lin, Y.; Rodriguez, L.; Wang, S.S. Smart Sensing of Oil Degradation and Oil Level Measurements in Gasoline Engines. In Proceedings of the SAE 2000 World Congress, Detroit, MI, USA, 6–9 March 2000; pp. 1–3.
- Jakoby, B.; Vellekoop, M.J. Physical Sensors for Water-in-Oil Emulsions. Sens. Actuators A 2004, 110, 28–31. [Google Scholar] [CrossRef]
- Irshad, M.; Iqbal, N.; Mujahid, A.; Afzal, A.; Hussain, T.; Sharif, A.; Ahmad, E.; Athar, M.M. Molecularly Imprinted Nanomaterials for Sensor Applications. Nanomaterials 2013, 3, 615–637. [Google Scholar] [CrossRef]
- Mujahida, A.; Afzal, A.; Glanzing, G.; Leidl, A.; Lieberzeit, P.A.; Dickert, F.L. Imprinted sol-gel materials for monitoring degradation products in automotive oils by shear transverse wave. Anal. Chim. Acta 2010, 675, 53–57. [Google Scholar] [CrossRef] [PubMed]
- Anderson, R.J.; Bendell, D.J.; Groundwater, P.W. Ultraviolet-Visible (UV-Vis) Spectroscopy. In Organic Spectroscopic Analysis; Royal Society Chemistry: Cambridge, UK, 2004; pp. 8–10. [Google Scholar]
- Bhushan, B.; Lowry, J.A. Friction and wear studies of various head materials and magnetic tapes in a linear mode accelerated test using a new nano-scratch wear measurement technique. Wear 1995, 190, 1–3. [Google Scholar] [CrossRef]
- Patnaik, P. Handbook of Inorganic Book Chemistry; Mc Graw Hill: New York, NY, USA, 2002; pp. 225–227. [Google Scholar]
- Masoudian, S.; Yahyaei, H. Oxidation of alcohols with hydrogen peroxide catalyzed by supported Fe (III) porphyrins. Indian J. Chem. 2011, 50A, 1002–1005. [Google Scholar]
- Foster, N.C. Sulphonation and Sulphation Processes; Chemithon: Seattle, WA, USA, 1997; pp. 1–3. [Google Scholar]
- Mc Kenzie, T. Atomic Absorption Spectrophotometry for the Analysis of Wear Metals in Oil Samples. Varian Techtron 1981, AA-10, 2–4. [Google Scholar]
© 2014 by the authors; licensee MDPI, Basel, Switzerland. This article is an open access article distributed under the terms and conditions of the Creative Commons Attribution license (http://creativecommons.org/licenses/by/4.0/).
Share and Cite
Nguele, R.; Al-Salim, H.S.; Mohammad, K. Modeling and Forecasting of Depletion of Additives in Car Engine Oils Using Attenuated Total Reflectance Fast Transform Infrared Spectroscopy. Lubricants 2014, 2, 206-222. https://doi.org/10.3390/lubricants2040206
Nguele R, Al-Salim HS, Mohammad K. Modeling and Forecasting of Depletion of Additives in Car Engine Oils Using Attenuated Total Reflectance Fast Transform Infrared Spectroscopy. Lubricants. 2014; 2(4):206-222. https://doi.org/10.3390/lubricants2040206
Chicago/Turabian StyleNguele, Ronald, Hikmat Said Al-Salim, and Khalid Mohammad. 2014. "Modeling and Forecasting of Depletion of Additives in Car Engine Oils Using Attenuated Total Reflectance Fast Transform Infrared Spectroscopy" Lubricants 2, no. 4: 206-222. https://doi.org/10.3390/lubricants2040206