The Extraordinary Linear Polarisation Structure of the Southern Centaurus A Lobe Revealed by ASKAP

 , , , , , , , , and
Abstract
:1. Introduction
2. Observations
2.1. The ASKAP Radio Telescope
2.2. These Observations
Beam-Forming and Positioning on the Sky
3. Data Processing and Imaging
3.1. ASKAPsoft Processing
- averaged to 1 MHz spectral resolution (from the native 18 kHz resolution);
- re-flagged;
- self-calibrated using field point sources in total intensity (phase only, 2 rounds);
- imaged in 1 MHz channels through the band to generate spectral cubes in Stokes I, Q, U, and V;
- smoothed to a common frequency-independent resolution, and
- linearly mosaicked
3.2. Polarisation Calibration
4. Preliminary Analysis and Results
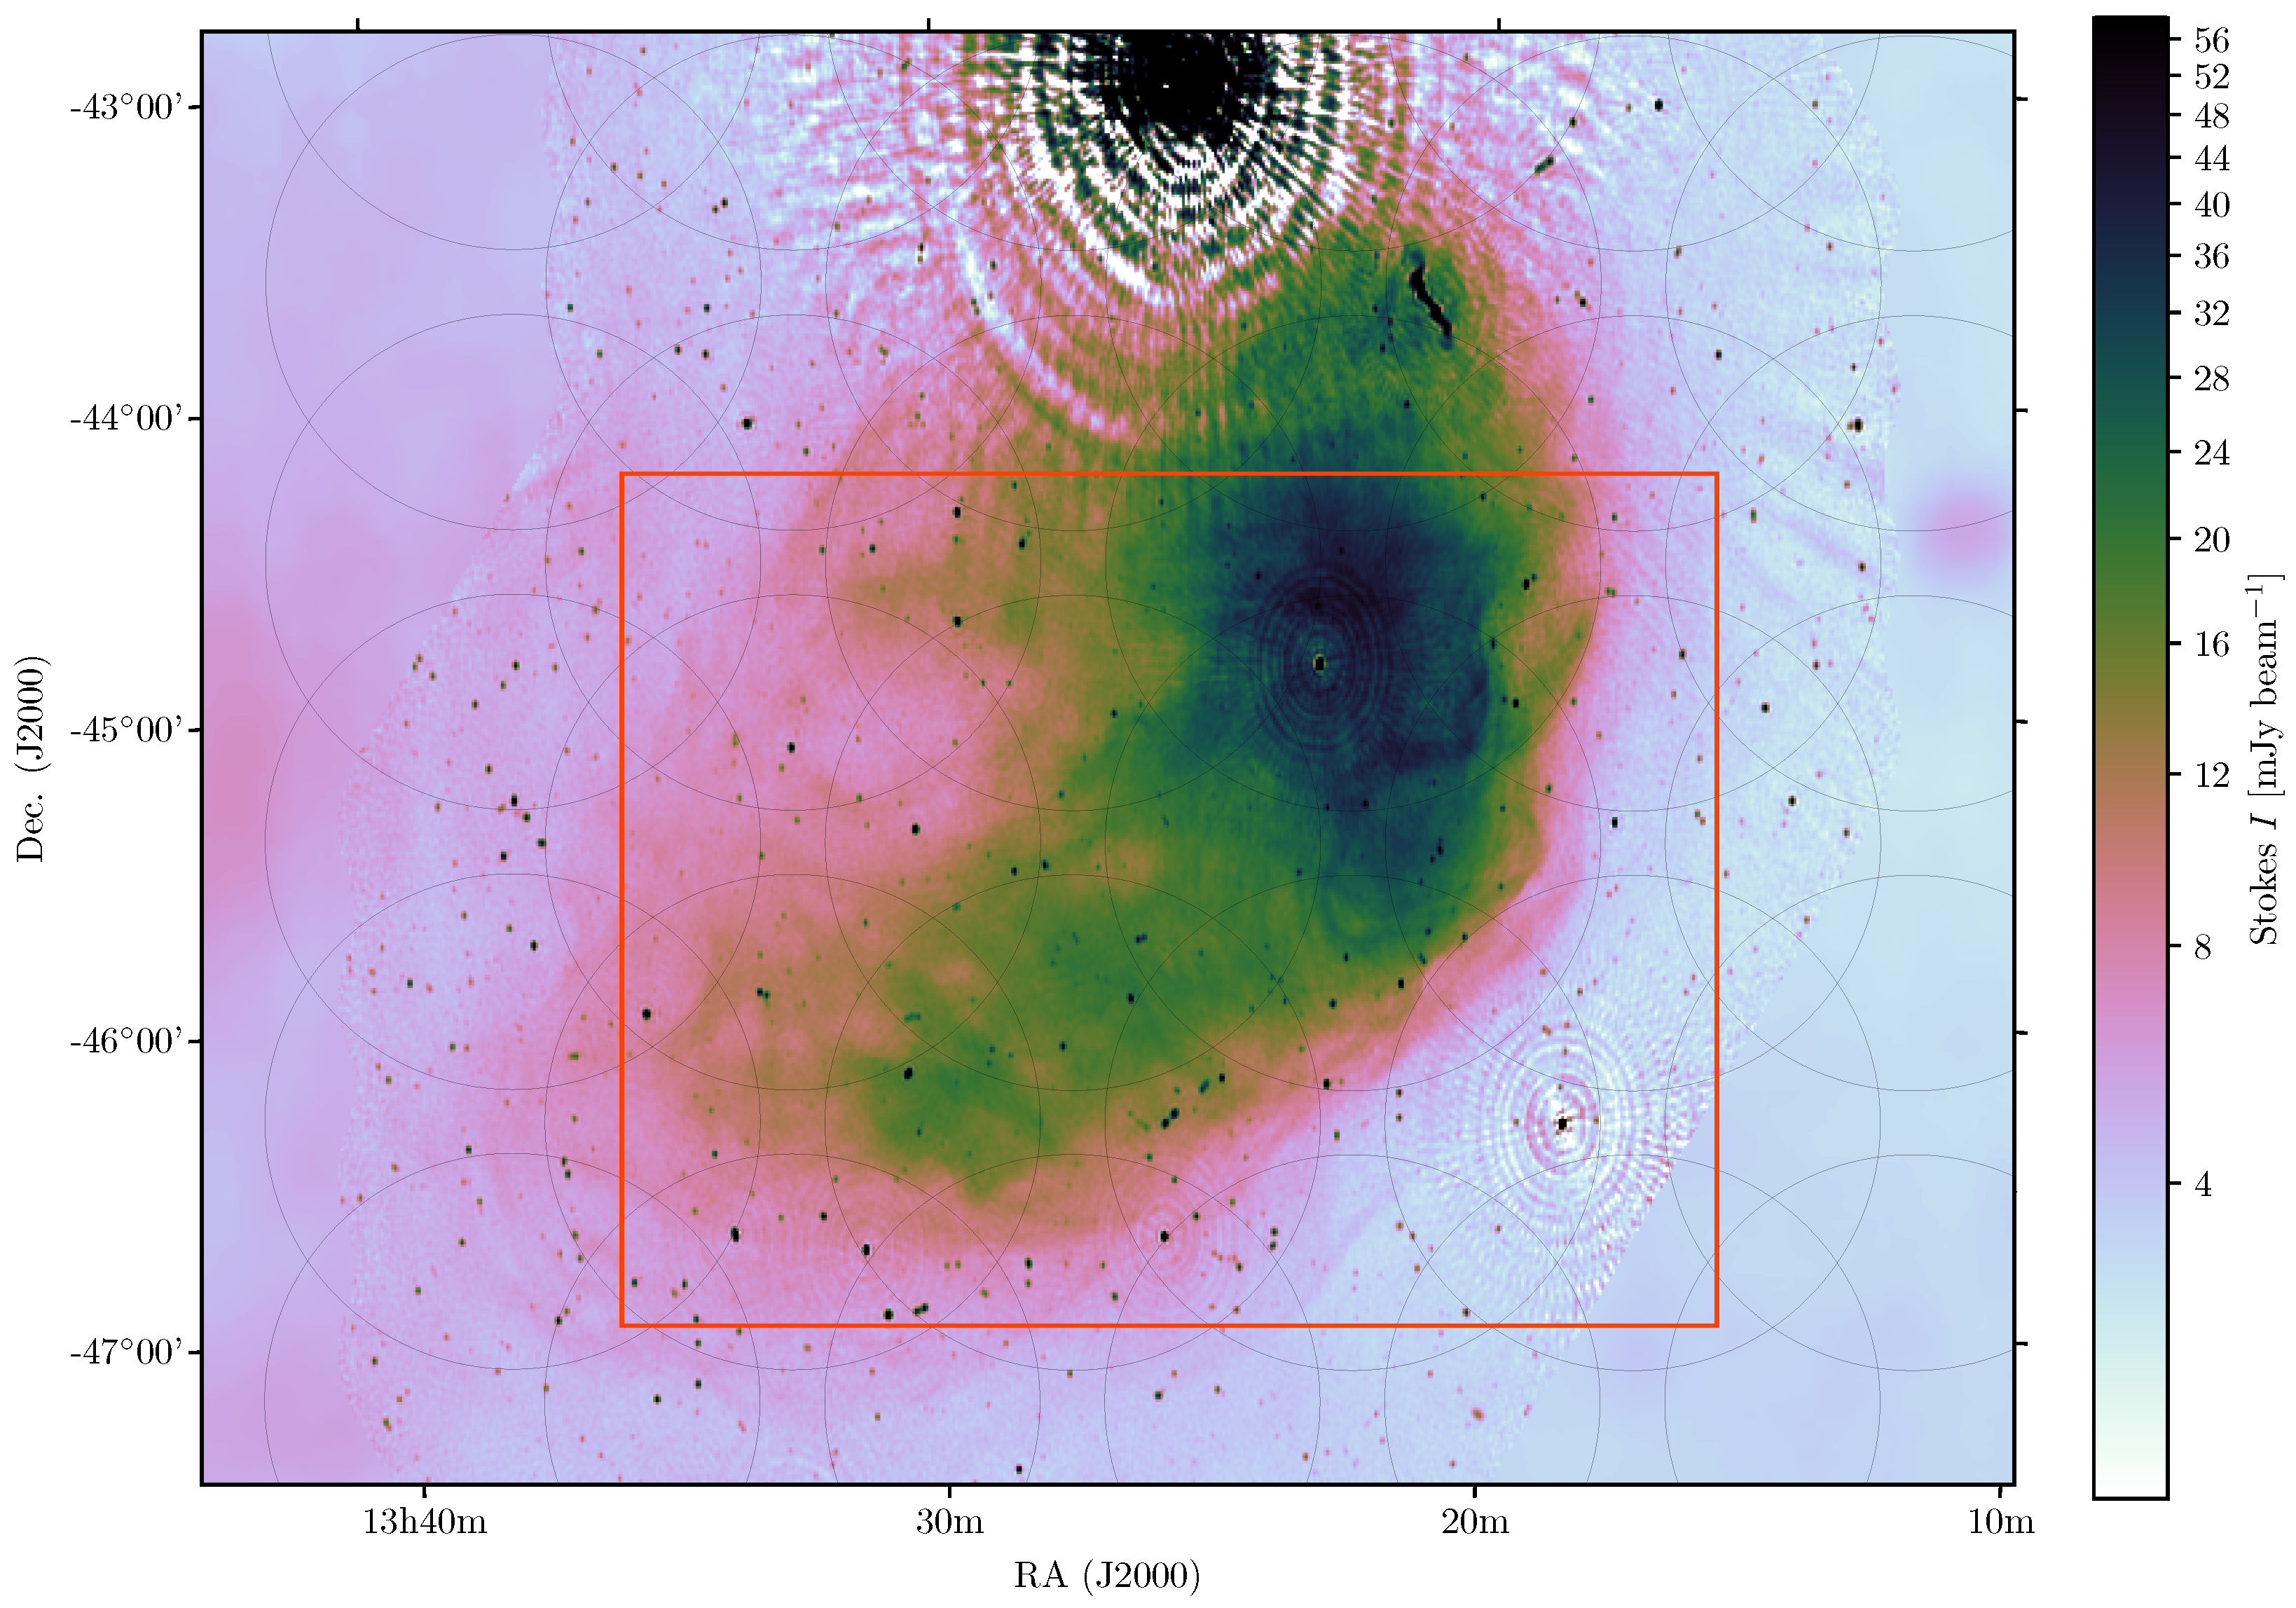
4.1. Linearly Polarised Intensity
4.1.1. Description
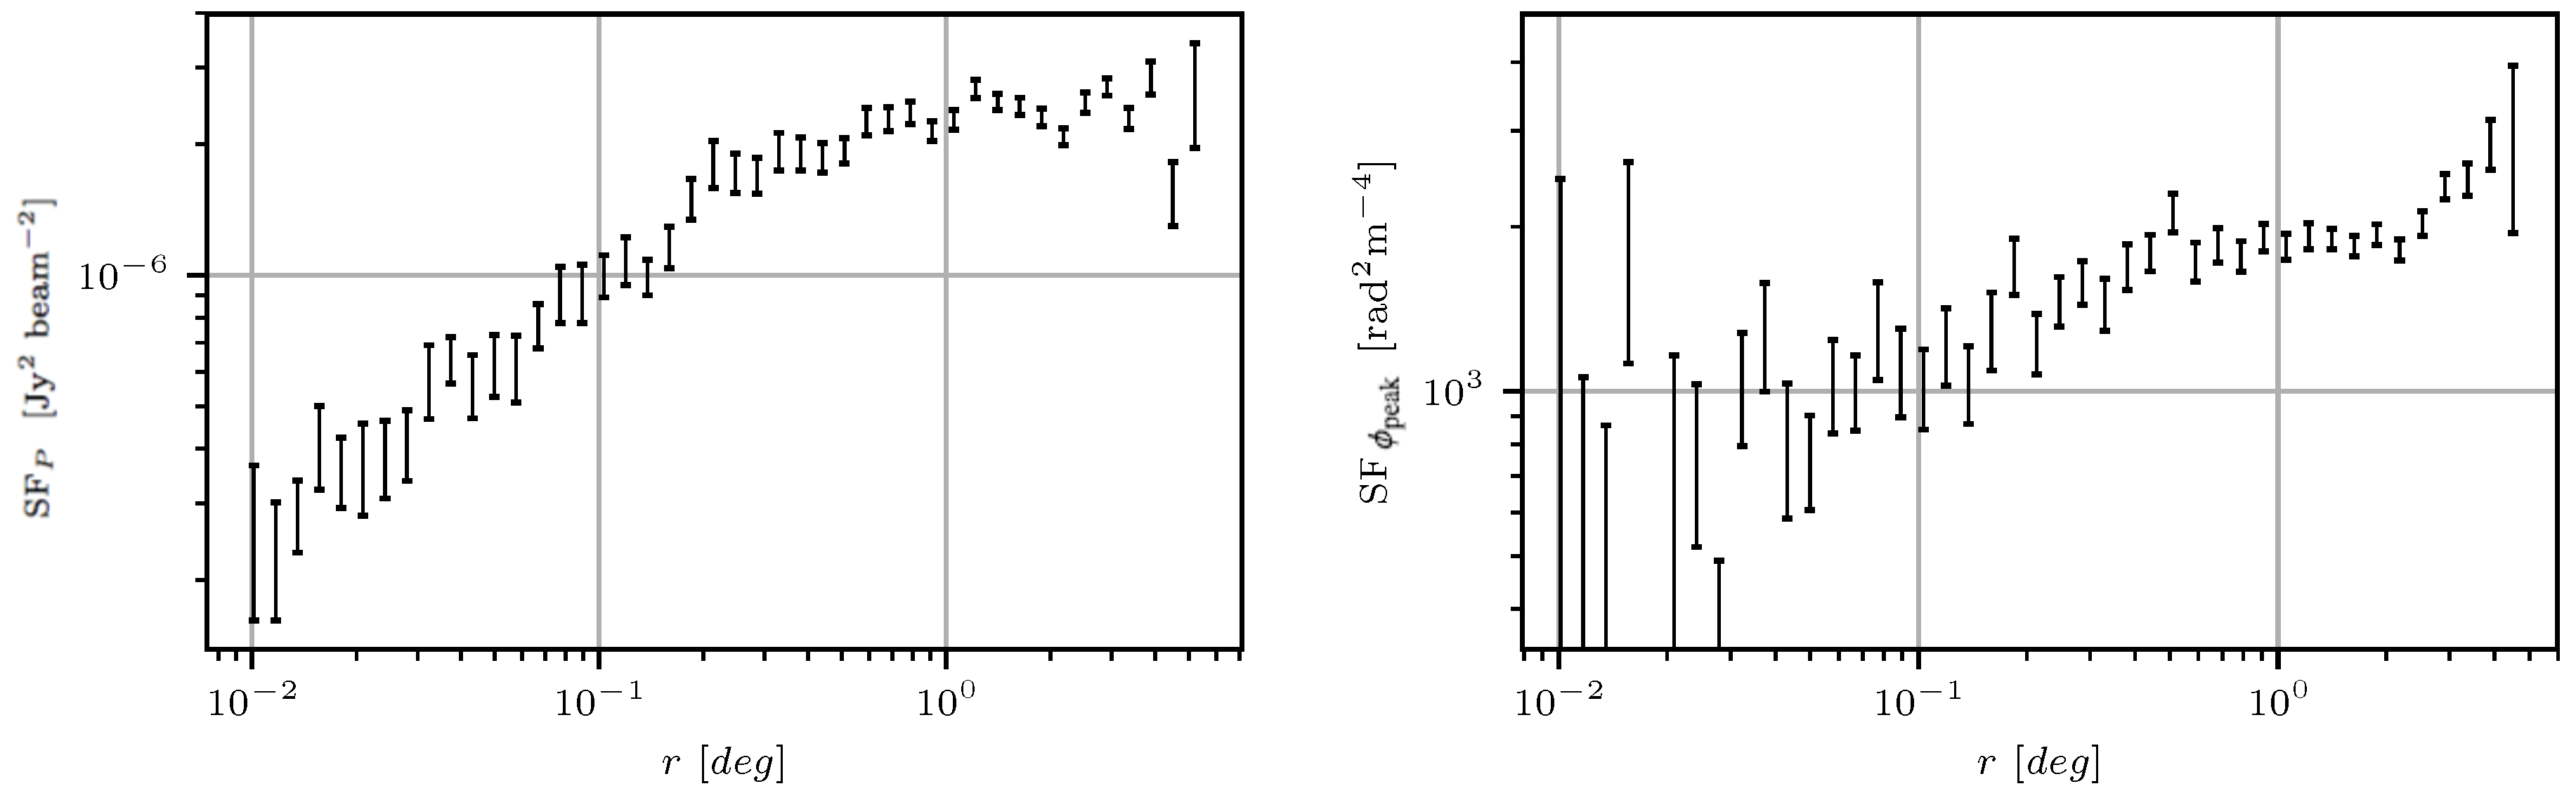
4.1.2. Structure Function
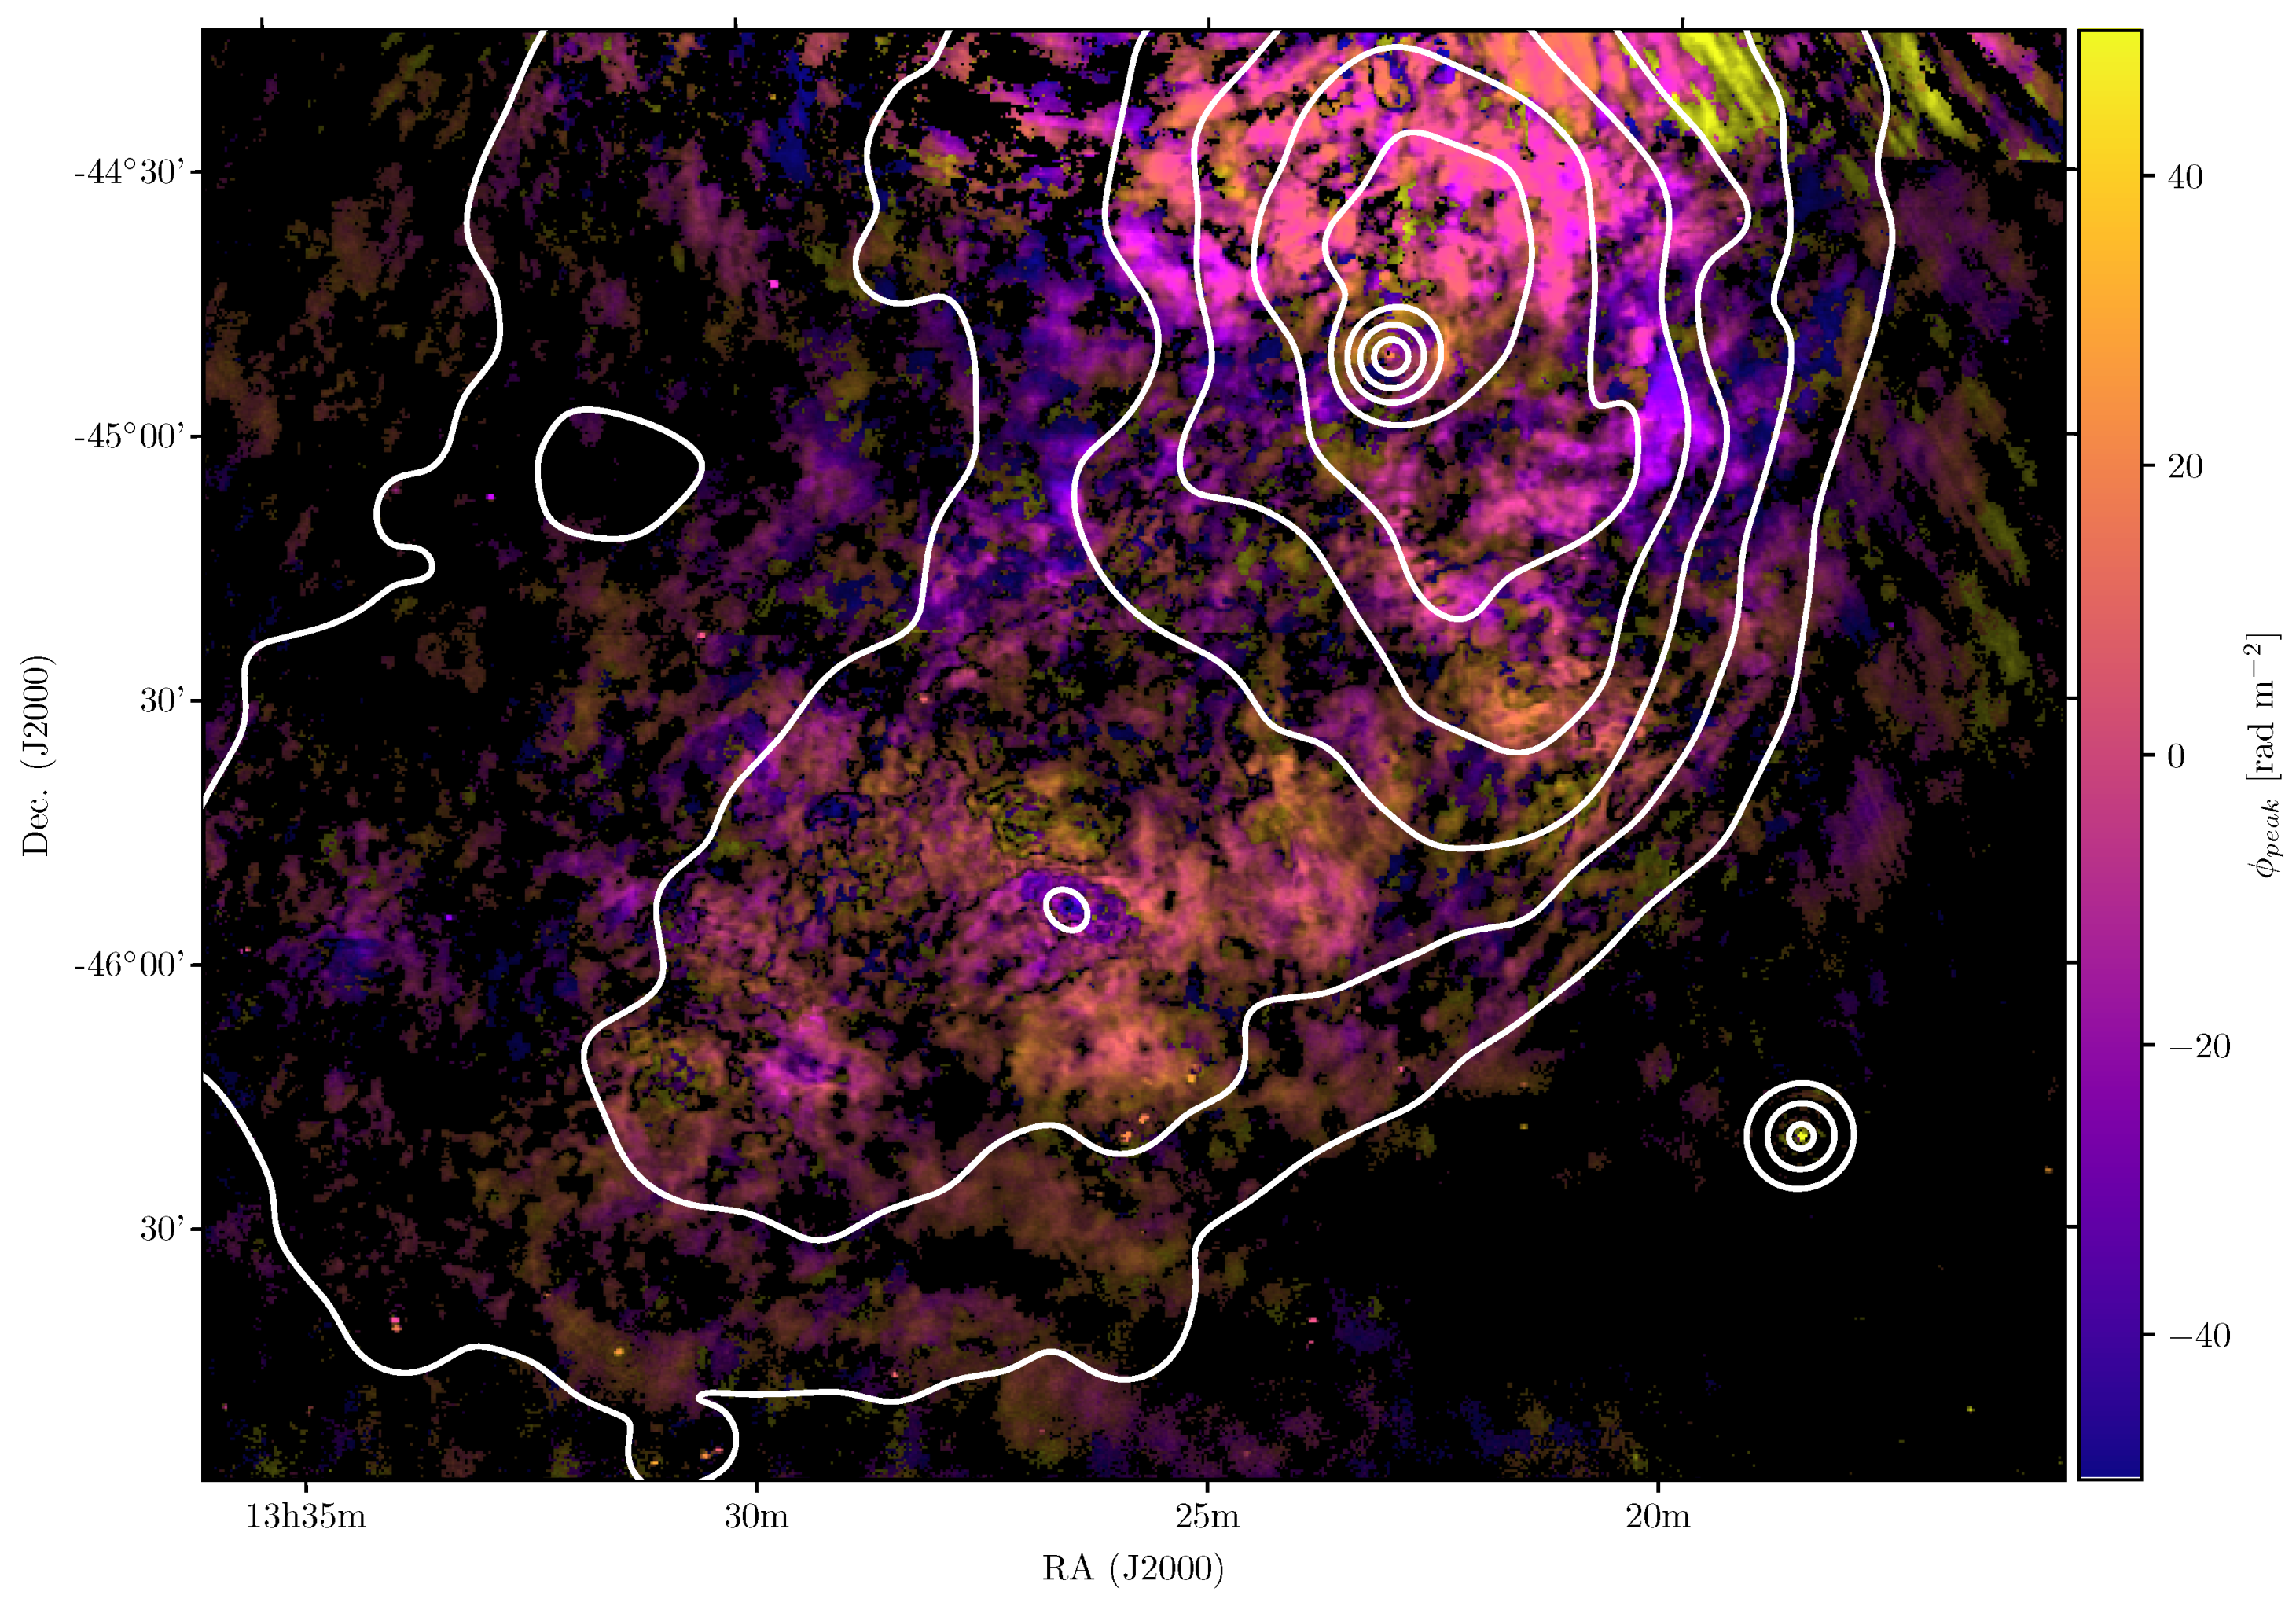
4.2. Faraday Depth
5. Discussion and Ongoing Work
Author Contributions
Funding
Acknowledgments
Conflicts of Interest
References
- Mauch, T.; Sadler, E.M. Radio sources in the 6dFGS: Local luminosity functions at 1.4 GHz for star-forming galaxies and radio-loud AGN. Mon. Not. R. Astron. Soc. 2007, 375, 931–950. [Google Scholar] [CrossRef]
- Junkes, N.; Haynes, R.F.; Harnett, J.I.; Jauncey, D.L. Radio polarization surveys of Centaurus A (NGC 5128). I—The complete radio source at 6.3 CM. Astron. Astrophys. 1993, 269, 29–38. [Google Scholar]
- Israel, F.P. Centaurus A—NGC 5128. Astron. Astrophys. Rev. 1998, 8, 237–278. [Google Scholar] [CrossRef]
- Morganti, R.; Killeen, N.E.B.; Ekers, R.D.; Oosterloo, T.A. Centaurus A: Multiple outbursts or bursting bubble? Mon. Not. R. Astron. Soc. 1999, 307, 750–760. [Google Scholar] [CrossRef]
- Ojha, R.; Kadler, M.; Böck, M.; Booth, R.; Dutka, M.S.; Edwards, P.G.; Fey, A.L.; Fuhrmann, L.; Gaume, R.A.; Hase, H.; et al. TANAMI: Tracking active galactic nuclei with austral milliarcsecond interferometry. I. First-epoch 8.4 GHz images. Astron. Astrophys. 2010, 519, 45–70. [Google Scholar] [CrossRef]
- Feain, I.J.; Cornwell, T.J.; Ekers, R.D.; Calabretta, M.R.; Norris, R.P.; Johnston-Hollitt, M.; Ott, J.; Lindley, E.; Gaensler, B.M.; Murphy, T.; et al. The Radio Continuum Structure of Centaurus A at 1.4 GHz. Astrophys. J. 2011, 740, 17–27. [Google Scholar] [CrossRef]
- Müller, C.; Kadler, M.; Ojha, R.; Perucho, M.; Großberger, C.; Ros, E.; Wilms, J.; Blanchard, J.; Böck, M.; Carpenter, B.; et al. TANAMI monitoring of Centaurus A: The complex dynamics in the inner parsec of an extragalactic jet. Astron. Astrophys. 2014, 569, 115–131. [Google Scholar] [CrossRef]
- McKinley, B.; Tingay, S.J.; Carretti, E.; Ellis, S.; Bland-Hawthorn, J.; Morganti, R.; Line, J.; McDonald, M.; Veilleux, S.; Wahl Olsen, R.; et al. The jet/wind outflow in Centaurus A: A local laboratory for AGN feedback. Mon. Not. R. Astron. Soc. 2018, 474, 4056–4072. [Google Scholar] [CrossRef]
- Morganti, R. The Many Faces of the Gas in Centaurus A (NGC 5128). Publ. Astron. Soc. Aust. 2010, 27, 463–474. [Google Scholar] [CrossRef] [Green Version]
- Tingay, S.J.; Lenc, E. Parsec-Scale Shocks in the Kiloparsec-Scale Jet of Centaurus A. Astron. J. 2009, 138, 808–812. [Google Scholar] [CrossRef]
- Neff, S.G.; Eilek, J.A.; Owen, F.N. The Complex North Transition Region of Centaurus A: A Galactic Wind. Astrophys. J. 2015, 802, 88–106. [Google Scholar] [CrossRef]
- Wykes, S.; Hardcastle, M.J.; Croston, J.H. Centaurus A: Constraints on the nature of the giant lobe filaments from XMM-Newton observations. Mon. Not. R. Astron. Soc. 2015, 454, 3277–3282. [Google Scholar] [CrossRef]
- Wykes, S.; Intema, H.T.; Hardcastle, M.J.; Achterberg, A.; Jones, T.W.; Jerjen, H.; Orrú, E.; Lazarian, A.; Shimwell, T.W.; Wise, M.W.; et al. Filaments in the southern giant lobe of Centaurus A: Constraints on nature and origin from modelling and GMRT observations. Mon. Not. R. Astron. Soc. 2014, 442, 2867–2882. [Google Scholar] [CrossRef]
- Croston, J.H.; Kraft, R.P.; Hardcastle, M.J.; Birkinshaw, M.; Worrall, D.M.; Nulsen, P.E.J.; Penna, R.F.; Sivakoff, G.R.; Jordán, A.; Brassington, N.J.; et al. High-energy particle acceleration at the radio-lobe shock of Centaurus A. Mon. Not. R. Astron. Soc. 2009, 395, 1999–2012. [Google Scholar] [CrossRef] [Green Version]
- Crockett, R.M.; Shabala, S.S.; Kaviraj, S.; Antonuccio-Delogu, V.; Silk, J.; Mutchler, M.; O’Connell, R.W.; Rejkuba, M.; Whitmore, B.C.; Windhorst, R.A. Triggered star formation in the inner filament of Centaurus A. Mon. Not. R. Astron. Soc. 2012, 421, 1603–1623. [Google Scholar] [CrossRef] [Green Version]
- Wykes, S.; Hardcastle, M.J.; Karakas, A.I.; Vink, J.S. Internal entrainment and the origin of jet-related broad-band emission in Centaurus A. Mon. Not. R. Astron. Soc. 2015, 447, 1001–1013. [Google Scholar] [CrossRef]
- O’Sullivan, S.P.; Feain, I.J.; McClure-Griffiths, N.M.; Ekers, R.D.; Carretti, E.; Robishaw, T.; Mao, S.A.; Gaensler, B.M.; Bland-Hawthorn, J.; Stawarz, Ł. Thermal Plasma in the Giant Lobes of the Radio Galaxy Centaurus A. Astrophys. J. 2013, 764, 162–172. [Google Scholar] [CrossRef]
- Feain, I.J.; Ekers, R.D.; Murphy, T.; Gaensler, B.M.; Macquart, J.P.; Norris, R.P.; Cornwell, T.J.; Johnston-Hollitt, M.; Ott, J.; Middelberg, E. Faraday Rotation Structure on Kiloparsec Scales in the Radio Lobes of Centaurus A. Astrophys. J. 2009, 707, 114–125. [Google Scholar] [CrossRef]
- Harris, G.L.H.; Rejkuba, M.; Harris, W.E. The Distance to NGC 5128 (Centaurus A). Publ. Astron. Soc. Aust. 2010, 27, 457–462. [Google Scholar] [CrossRef] [Green Version]
- Burn, B.J. On the depolarization of discrete radio sources by Faraday dispersion. Mon. Not. R. Astron. Soc. 1966, 133, 67–83. [Google Scholar] [CrossRef]
- Brentjens, M.A.; de Bruyn, A.G. Faraday rotation measure synthesis. Astron. Astrophys. 2005, 441, 1217–1228. [Google Scholar] [CrossRef] [Green Version]
- Heald, G.; Braun, R.; Edmonds, R. The Westerbork SINGS survey. II Polarization, Faraday rotation, and magnetic fields. Astron. Astrophys. 2009, 503, 409–435. [Google Scholar] [CrossRef]
- DeBoer, D.R.; Gough, R.G.; Bunton, J.D.; Cornwell, T.J.; Beresford, R.J.; Johnston, S.; Feain, I.J.; Schinckel, A.E.; Jackson, C.A.; Kesteven, M.J.; et al. Australian SKA Pathfinder: A High-Dynamic Range Wide-Field of View Survey Telescope. IEEE Proc. 2009, 97, 1507–1521. [Google Scholar] [CrossRef]
- Johnston, S.; Bailes, M.; Bartel, N.; Baugh, C.; Bietenholz, M.; Blake, C.; Braun, R.; Brown, J.; Chatterjee, S.; Darling, J.; et al. Science with the Australian Square Kilometre Array Pathfinder. Publ. Astron. Soc. Aust. 2007, 24, 174–188. [Google Scholar] [CrossRef] [Green Version]
- Schinckel, A.E.T.; Bock, D.C.J. The Australian SKA Pathfinder: Project update and initial operations. In Ground-Based and Airborne Telescopes VI; SPIE: Bellingham, WA, USA, 2016; Volume 9906, p. 99062A. [Google Scholar]
- Hay, S.G.; O’Sullivan, J.D. Analysis of common-mode effects in a dual-polarized planar connected-array antenna. Radio Sci. 2008, 43, RS6S04. [Google Scholar] [CrossRef]
- Hampson, G.; Macleod, A.; Beresford, R.; Brothers, M.; Brown, A.; Bunton, J.; Cantrall, C.; Chekkala, R.; Cheng, W.; Forsyth, R.; et al. ASKAP PAF ADE ? Advancing an L-band PAF design towards SKA. In Proceedings of the 2012 International Conference on Electromagnetics in Advanced Applications, Cape Town, South Africa, 2–7 September 2012; pp. 807–809. [Google Scholar] [CrossRef]
- Norris, R.P.; Hopkins, A.M.; Afonso, J.; Brown, S.; Condon, J.J.; Dunne, L.; Feain, I.; Hollow, R.; Jarvis, M.; Johnston-Hollitt, M.; et al. EMU: Evolutionary Map of the Universe. Publ. Astron. Soc. Aust. 2011, 28, 215–248. [Google Scholar] [CrossRef] [Green Version]
- Koribalski, B.S. Overview on Spectral Line Source Finding and Visualisation. Publ. Astron. Soc. Aust. 2012, 29, 359–370. [Google Scholar] [CrossRef] [Green Version]
- Sault, R.J. ACES Memo 7: Widefield Polarimetric Considerations for ASKAP; Technical Report; CSIRO: Epping, NSW, Australia, 2015. [Google Scholar]
- Willis, A.G. ASKAP POSSUM Report 19: Simulating the Primary Beam Response of the ASKAP Telescope over 500MHz Bandwidth; Technical Report; CSIRO: Epping, NSW, Australia, 2011. [Google Scholar]
- McConnell, D.; Allison, J.R.; Bannister, K.; Bell, M.E.; Bignall, H.E.; Chippendale, A.P.; Edwards, P.G.; Harvey-Smith, L.; Hegarty, S.; Heywood, I.; et al. The Australian Square Kilometre Array Pathfinder: Performance of the Boolardy Engineering Test Array. Publ. Astron. Soc. Aust. 2016, 33, e042. [Google Scholar] [CrossRef]
- Forsyth, R.; Jackson, C.; Kesteven, M.; Yi, F.Z.; Zan, M.L.; Zhen, G.F.; Min, X.S. The three axis antennas for the Australian Square Kilometre Array Pathfinder radio telescope (ASKAP). In Proceedings of the 11th Australian Symposium on Antennas, Sydney NSW, Australia, 12–14 February 2009. [Google Scholar]
- Heywood, I.; Hotan, A.; McConnell, D. The ASKAP Roll Axis: Preliminary Study of Its Benefits to Calibration and Imaging; ACES Memo 003; CSIRO: Epping, NSW, Australia, 2014. [Google Scholar]
- Green, D.A. A colour scheme for the display of astronomical intensity images. Bull. Astron. Soc. India 2011, 39, 289–295. [Google Scholar]
- Cornwell, T.J.; Voronkov, M.A.; Humphreys, B. Wide field imaging for the square kilometre array. In Image Reconstruction from Incomplete Data VII; SPIE: Bellingham, WA, USA, 2012; Volume 8500, p. 85000L. [Google Scholar]
- Weiler, K.W. The Synthesis Radio Telescope at Westerbork. Methods of Polarization Measurement. Astron. Astrophys. 1973, 26, 403–407. [Google Scholar]
- Schnitzeler, D.; Banfield, J.; Emonts, B.; Hales, C.; Lenc, E.; Norris, R.; McClure-Griffiths, N.; McConnell, D.; O’Sullivan, S.; Stevens, J. Australia Telescope Technical Memo # AT/39.9/129; Technical Report; CSIRO: Epping, NSW, Australia, 2011. [Google Scholar]
- Haverkorn, M.; Gaensler, B.M.; Brown, J.C.; Bizunok, N.S.; McClure-Griffiths, N.M.; Dickey, J.M.; Green, A.J. Enhanced Small-Scale Faraday Rotation in the Galactic Spiral Arms. Astrophys. J. 2006, 637, L33–L35. [Google Scholar] [CrossRef] [Green Version]
- Haverkorn, M.; Gaensler, B.M.; McClure-Griffiths, N.M.; Dickey, J.M.; Green, A.J. Magnetic Fields and Ionized Gas in the Inner Galaxy: An Outer Scale for Turbulence and the Possible Role of H II Regions. Astrophys. J. 2004, 609, 776–784. [Google Scholar] [CrossRef]
- Leahy, J.P. Small-scale variations in the Galactic Faraday rotation. Mon. Not. R. Astron. Soc. 1987, 226, 433–446. [Google Scholar] [CrossRef] [Green Version]
- Anderson, C.S.; Gaensler, B.M.; Feain, I.J.; Franzen, T.M.O. Broadband Radio Polarimetry and Faraday Rotation of 563 Extragalactic Radio Sources. Astrophys. J. 2015, 815, 49. [Google Scholar] [CrossRef]
- Anderson, C.S.; Gaensler, B.M.; Heald, G.H.; O’Sullivan, S.P.; Kaczmarek, J.F.; Feain, I.J. Broadband Radio Polarimetry of Fornax A. I. Depolarized Patches Generated by Advected Thermal Material from NGC 1316. Astrophys. J. 2018, 855, 41. [Google Scholar] [CrossRef] [Green Version]
- Gaensler, B.M.; Haverkorn, M.; Burkhart, B.; Newton-McGee, K.J.; Ekers, R.D.; Lazarian, A.; McClure-Griffiths, N.M.; Robishaw, T.; Dickey, J.M.; et al. Low-Mach-number turbulence in interstellar gas revealed by radio polarization gradients. Nature 2011, 478, 214–217. [Google Scholar] [CrossRef] [PubMed] [Green Version]
- Herron, C.A.; Gaensler, B.M.; Lewis, G.F.; McClure-Griffiths, N.M. Advanced Diagnostics for the Study of Linearly Polarized Emission. I. Derivation. Astrophys. J. 2018, 853, 9. [Google Scholar] [CrossRef] [Green Version]
- Sun, X.H.; Gaensler, B.M.; Carretti, E.; Purcell, C.R.; Staveley-Smith, L.; Bernardi, G.; Haverkorn, M. Absolutely calibrated radio polarimetry of the inner Galaxy at 2.3 and 4.8 GHz. Mon. Not. R. Astron. Soc. 2014, 437, 2936–2947. [Google Scholar] [CrossRef]
- Herron, C.A.; Burkhart, B.; Gaensler, B.M.; Lewis, G.F.; McClure-Griffiths, N.M.; Bernardi, G.; Carretti, E.; Haverkorn, M.; Kesteven, M.; Poppi, S.; et al. Advanced Diagnostics for the Study of Linearly Polarized Emission. II. Application to Diffuse Interstellar Radio Synchrotron Emission. Astrophys. J. 2018, 855, 29. [Google Scholar] [CrossRef] [Green Version]
- Manchester, R.N. The Parkes Ultra-Wideband Receiver. In Proceedings of the IAU General Assembly, Meeting, Honolulu, HI, USA, 14 August 2015. [Google Scholar]
- Wayth, R.B.; Tingay, S.J.; Trott, C.M.; Emrich, D.; Johnston-Hollitt, M.; McKinley, B.; Gaensler, B.M.; Beardsley, A.P.; Booler, T.; Crosse, B.; et al. The Phase II Murchison Widefield Array: Design Overview. arXiv, 2018; arXiv:1809.06466. [Google Scholar] [CrossRef]
- O’Sullivan, S.P.; Brown, S.; Robishaw, T.; Schnitzeler, D.H.F.M.; McClure-Griffiths, N.M.; Feain, I.J.; Taylor, A.R.; Gaensler, B.M.; Landecker, T.L.; Harvey-Smith, L.; et al. Complex Faraday depth structure of active galactic nuclei as revealed by broad-band radio polarimetry. Mon. Not. R. Astron. Soc. 2012, 421, 3300–3315. [Google Scholar] [CrossRef] [Green Version]
- Anderson, C.S.; Gaensler, B.M.; Feain, I.J. A Study of Broadband Faraday Rotation and Polarization Behavior over 1.3–10 GHz in 36 Discrete Radio Sources. Astrophys. J. 2016, 825, 59. [Google Scholar] [CrossRef]
- Lenc, E.; Anderson, C.S.; Barry, N.; Bowman, J.D.; Cairns, I.H.; Farnes, J.S.; Gaensler, B.M.; Heald, G.; Johnston-Hollitt, M.; Kaplan, D.L.; et al. The Challenges of Low-Frequency Radio Polarimetry: Lessons from the Murchison Widefield Array. Publ. Astron. Soc. Aust. 2017, 34, e040. [Google Scholar] [CrossRef]
- O’Sullivan, S.P.; Purcell, C.R.; Anderson, C.S.; Farnes, J.S.; Sun, X.H.; Gaensler, B.M. Broad-band, radio spectro-polarimetric study of 100 radiative-mode and jet-mode AGN. Mon. Not. R. Astron. Soc. 2017, 469, 4034–4062. [Google Scholar] [CrossRef]
- O’Sullivan, S.P.; Lenc, E.; Anderson, C.S.; Gaensler, B.M.; Murphy, T. Faraday rotation at low frequencies: Magnetoionic material of the large FRII radio galaxy PKS J0636-2036. Mon. Not. R. Astron. Soc. 2018, 475, 4263–4277. [Google Scholar] [CrossRef]
- Riseley, C.J.; Lenc, E.; Van Eck, C.L.; Heald, G.; Gaensler, B.M.; Anderson, C.S.; Hancock, P.J.; Hurley-Walker, N.; Sridhar, S.S.; White, S.V. The POlarised GLEAM Survey (POGS) I: First Results from a Low-Frequency Radio Linear Polarisation Survey of the Southern Sky. arXiv, 2018; arXiv:1809.09327. [Google Scholar]
- Gaensler, B.; Agudo, I.; Akahori, T.; Banfield, J.; Beck, R.; Carretti, E.; Farnes, J.; Haverkorn, M.; Heald, G.; Jones, D.; et al. Broadband Polarimetry with the Square Kilometre Array: A Unique Astrophysical Probe. In Advancing Astrophysics with the Square Kilometre Array (AASKA14); Dolman Scott: Thatcham, UK, 2015; p. 103. [Google Scholar]
| 1. |


| Target | Cen. A southern lobe |
| Field centre (J2000) | , |
| Date | 26 January 2018 |
| Scheduling block ID | 5036 |
| No. telescope pointings | 1 |
| Full-band sensitivity (measured, robust ) | 85 Jy beam |
| Recorded polarisations | XX, XY, YX, YY |
| Number of antennas | 16 |
| Antenna diameter | 12 m |
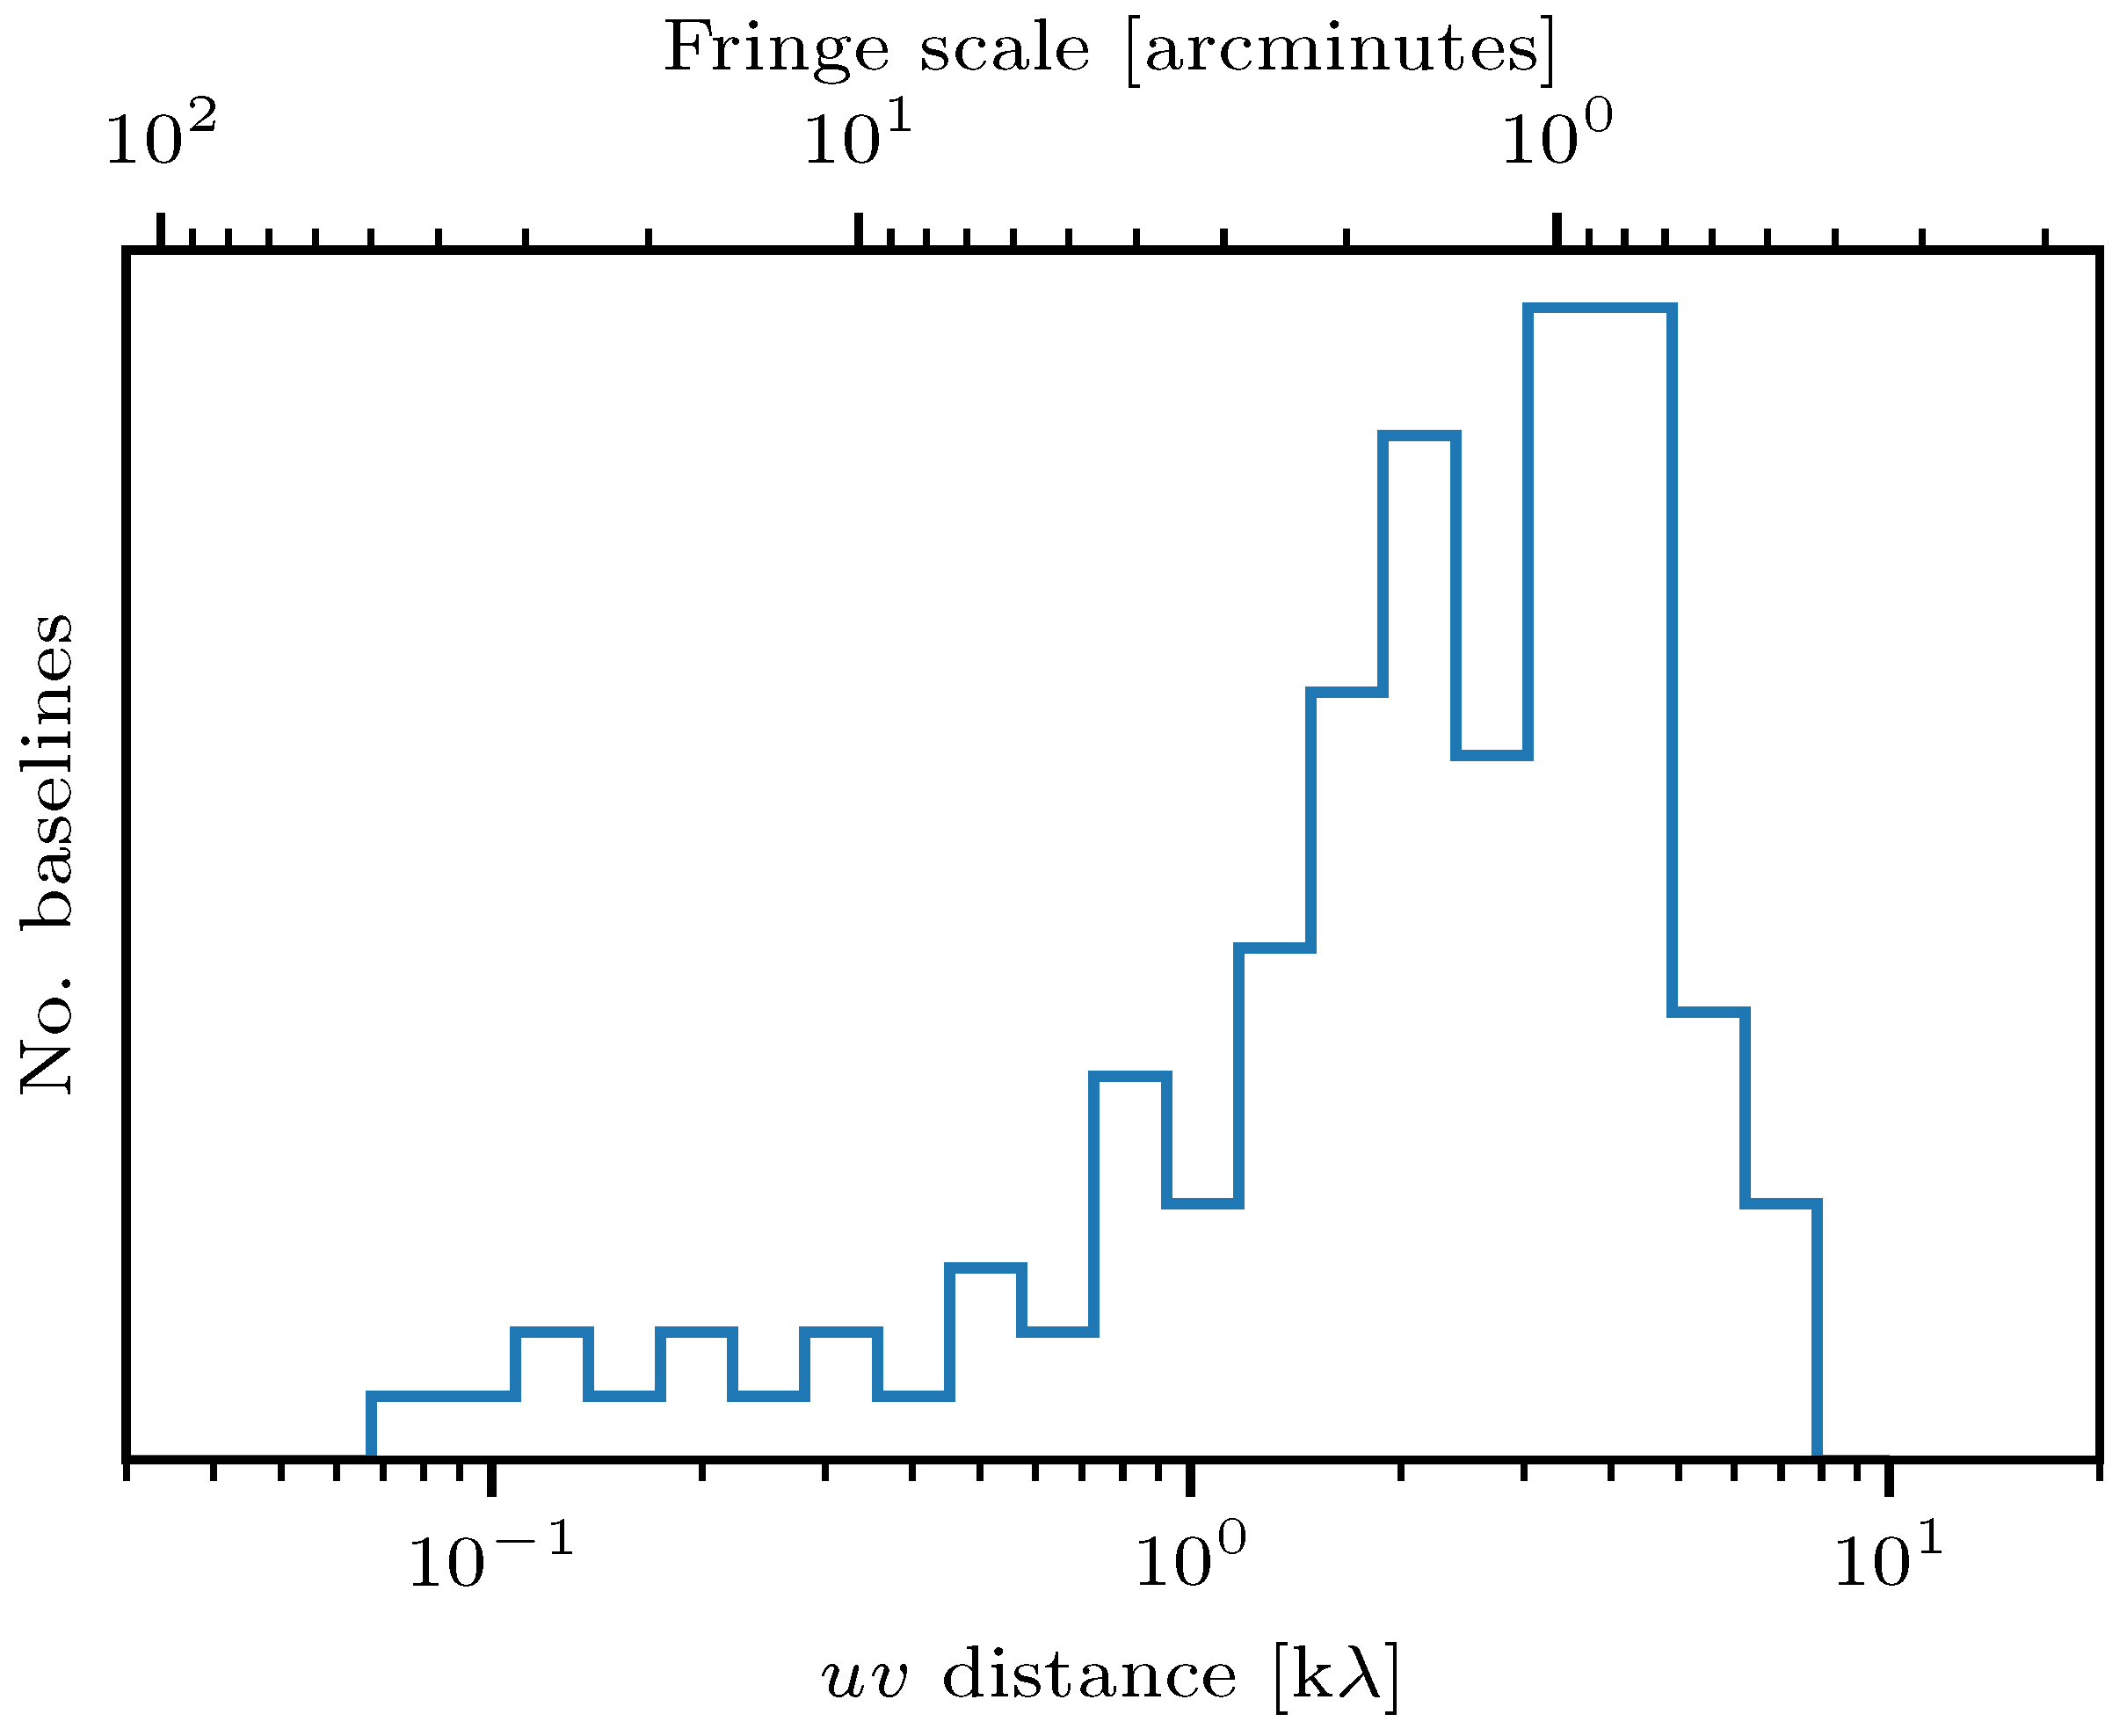
| Longest baseline | 2303 m |
| Shortest baseline | 22.4 m |
| Angular resolution | 26 arcsec arcsec |
| Max. recoverable scale | 30 arcmin |
| Number of beams | 36 paired X and Y pol. |
| FWHM of formed beams at 900 MHz | 1.59 deg |
| Total sky coverage | ∼35 deg |
| Frequency range | 793–1033 MHz |
| Frequency resolution | 1 MHz |
| range | 0.084–0.143 m |
| Resolution in space | 59 rad m |
| Largest recoverable scale (at 50% sensitivity) | 37 rad m |
| Max. recoverable || | 7300 rad m |
© 2018 by the authors. Licensee MDPI, Basel, Switzerland. This article is an open access article distributed under the terms and conditions of the Creative Commons Attribution (CC BY) license (http://creativecommons.org/licenses/by/4.0/).
Share and Cite
Anderson, C.S.; Heald, G.; O’Sullivan, S.P.; Bunton, J.D.; Carretti, E.; Chippendale, A.P.; Collier, J.D.; Farnes, J.S.; Gaensler, B.M.; Harvey-Smith, L.; et al. The Extraordinary Linear Polarisation Structure of the Southern Centaurus A Lobe Revealed by ASKAP. Galaxies 2018, 6, 127. https://doi.org/10.3390/galaxies6040127
Anderson CS, Heald G, O’Sullivan SP, Bunton JD, Carretti E, Chippendale AP, Collier JD, Farnes JS, Gaensler BM, Harvey-Smith L, et al. The Extraordinary Linear Polarisation Structure of the Southern Centaurus A Lobe Revealed by ASKAP. Galaxies. 2018; 6(4):127. https://doi.org/10.3390/galaxies6040127
Chicago/Turabian StyleAnderson, Craig S., George Heald, Shane P. O’Sullivan, John D. Bunton, Ettore Carretti, Aaron P. Chippendale, Jordan D. Collier, Jamie S. Farnes, Bryan M. Gaensler, Lisa Harvey-Smith, and et al. 2018. "The Extraordinary Linear Polarisation Structure of the Southern Centaurus A Lobe Revealed by ASKAP" Galaxies 6, no. 4: 127. https://doi.org/10.3390/galaxies6040127